Article

Relationships in Diversity, Vegetation Indexes and Water Area in Terminal Lake of the Tarim River, Northwest China

1
State Key Laboratory of Desert and Oasis Ecology, Xinjiang Institute of Ecology and Geography, Chinese Academy of Sciences (CAS), Urumqi 830011, China
2
State Key Laboratory of Simulation and Regulation of Water Cycle in River Basin, Department of Water Resources, China Institute of Water Resources and Hydropower Research, Beijing 100038, China
3
Construction Management Bureau of Land Development and Consolidation, Xinjiang Uygur Autonomous Region, Urumqi 832000, China
*
Author to whom correspondence should be addressed.
Ecologies 2021, 2(4), 332-344; https://doi.org/10.3390/ecologies2040019
Submission received: 12 May 2021 / Revised: 24 September 2021 / Accepted: 24 September 2021 / Published: 30 September 2021

Abstract

:
To examine the variation in water and vegetation coverage areas, the groundwater level and plant diversity in the terminal lake of the Tarim River, northwest China, both the monitoring data of a field survey consisting of surface samples and remote sensing data for 20 years (2000–2019) were analyzed by using field survey and indoor remote sensing methods. The results showed that (1): from 2000 to 2019, water and vegetation areas increased significantly, especially the trend of vegetation areas becoming more significant, with an average annual increase of 13.9 km2/a; (2): the plant diversity increased first and then decreased; the species richness and Pielou index in the study area were 9.0 and 0.80 in 2005, but only 2.00 and 0.08 in 2000, respectively; species composition tends to be simplified; (3): with the increase in the lake area, the groundwater level showed an up-lifted trend; the correlation between the two was significant, but there was a lag in the response of the groundwater level.

1. Introduction

Human disturbance, caused by population growth, development of the social economy and the highly intensive use of resources, is becoming a global problem that directly or indirectly leads to the degradation of ecosystems and ecological environments [1,2,3]. The most noted effects are the decreases in the primary and secondary productivity of ecosystems, the reduction or loss of biodiversity, the invasion of exotic species, lake area reduction and increasing climate disasters [4,5]. The degradation of the ecological environment has seriously threatened the sustainable development of human beings [6,7,8].
The changes in the lake area and water level of the terminal lake of an inland river in arid regions reflect the change in water quantity in the basin, which is a direct reflection of the impact of global climate change and human activities on water resources in the region [9,10,11]; the variation in the surface area and water level objectively reflect the hydrological process integrity and water balance process of the inland river basin in an arid area, and the major source is river runoff, not precipitation, especially in arid areas [12]. Influenced by the global trend, governments are aware of the seriousness of ecological degradation, and many ecological restoration programs are carrying out ecological restoration [13,14,15,16]. An ecological water conveyance project (EWCP) has been implemented by the Chinese government, which invested 10.7 billion RMB to the renovation of the lower reaches of the Tarim River basin in 2000 because of increasingly serious ecological degradation in the lower reaches of the Tarim River. In 2003, the river finally arrived at the terminal lake, Taitema Lake, the hydrological process integrity of Tarim River was restored and a certain water surface was formed.
Chen et al. [17] analyzed the environment around Taitema Lake from 1973 to 2006 and found that Taitema Lake had dried up since 1972, and the interannual and intra-annual changes in water levels were considerable before and after the ecological water conveyance. Abdumijiti [18] and Zhang et al. [19] using remote sensing data from 1973 to 2004, analyzed the variations in the surrounding environments of Taitema Lake and pointed out that the water coverage area of Taitema Lake reached 300 km2 in 2004, but the coastal zone of the lake has still been in a state of biodiversity loss and extreme desertification. Wang et al. [20] and Huo et al. [21] discussed the changes in the water area of Taitema Lake and its influence on the surrounding animals and environment in 2020 and found that, compared with the situation seen in the past, the ecological environment of Taitema Lake has become better in 2020. For example, the intensity of wind sand has become lesser and the vegetation coverage and number of animals have increased. However, no research has been carried out on the reasons and internal mechanisms of the changes in lake area, groundwater level and surface vegetation. This study, therefore, was conducted to partly fill in this information gap.
Before 2000, Taitema Lake had been dried up for nearly 30 years since 1972 [22,23], as the tail of the Tarim River, Taitema Lake, is the “touchstone” for the “comprehensive improvement” of the Tarim River. So far, the EWCP has been carried out for more than 20 years, and the largest area of Taitema Lake reached 511 km2 in 2017, 611 km2 in 2018 and 540 km2 in 2019, exceeding the largest area of 340 km2 from 1959 to 2011 [24] and becoming the second largest lake in southern Xinjiang, China. TV and Internet news reports about the lake’s expansion suggest that local people and officials are happy about it. In the years of 2017 and 2018, the water conservancy department of the Chinese government put forward an urgent question to us: “How large should the suitable water area of the terminal lake be maintained? Is it absolutely certain that the bigger the better?” To meet the objectives and clarify a hypothesis, i.e., larger lake areas result in larger values of diversity and species richness, this paper analyzed the vegetation evolution and the response characteristics of the groundwater level, discussed the internal mechanisms of surface vegetation change and the suitable scale of the lake in hopes of providing technical and theoretical support for the related research in other arid regions.

2. Materials and Methods

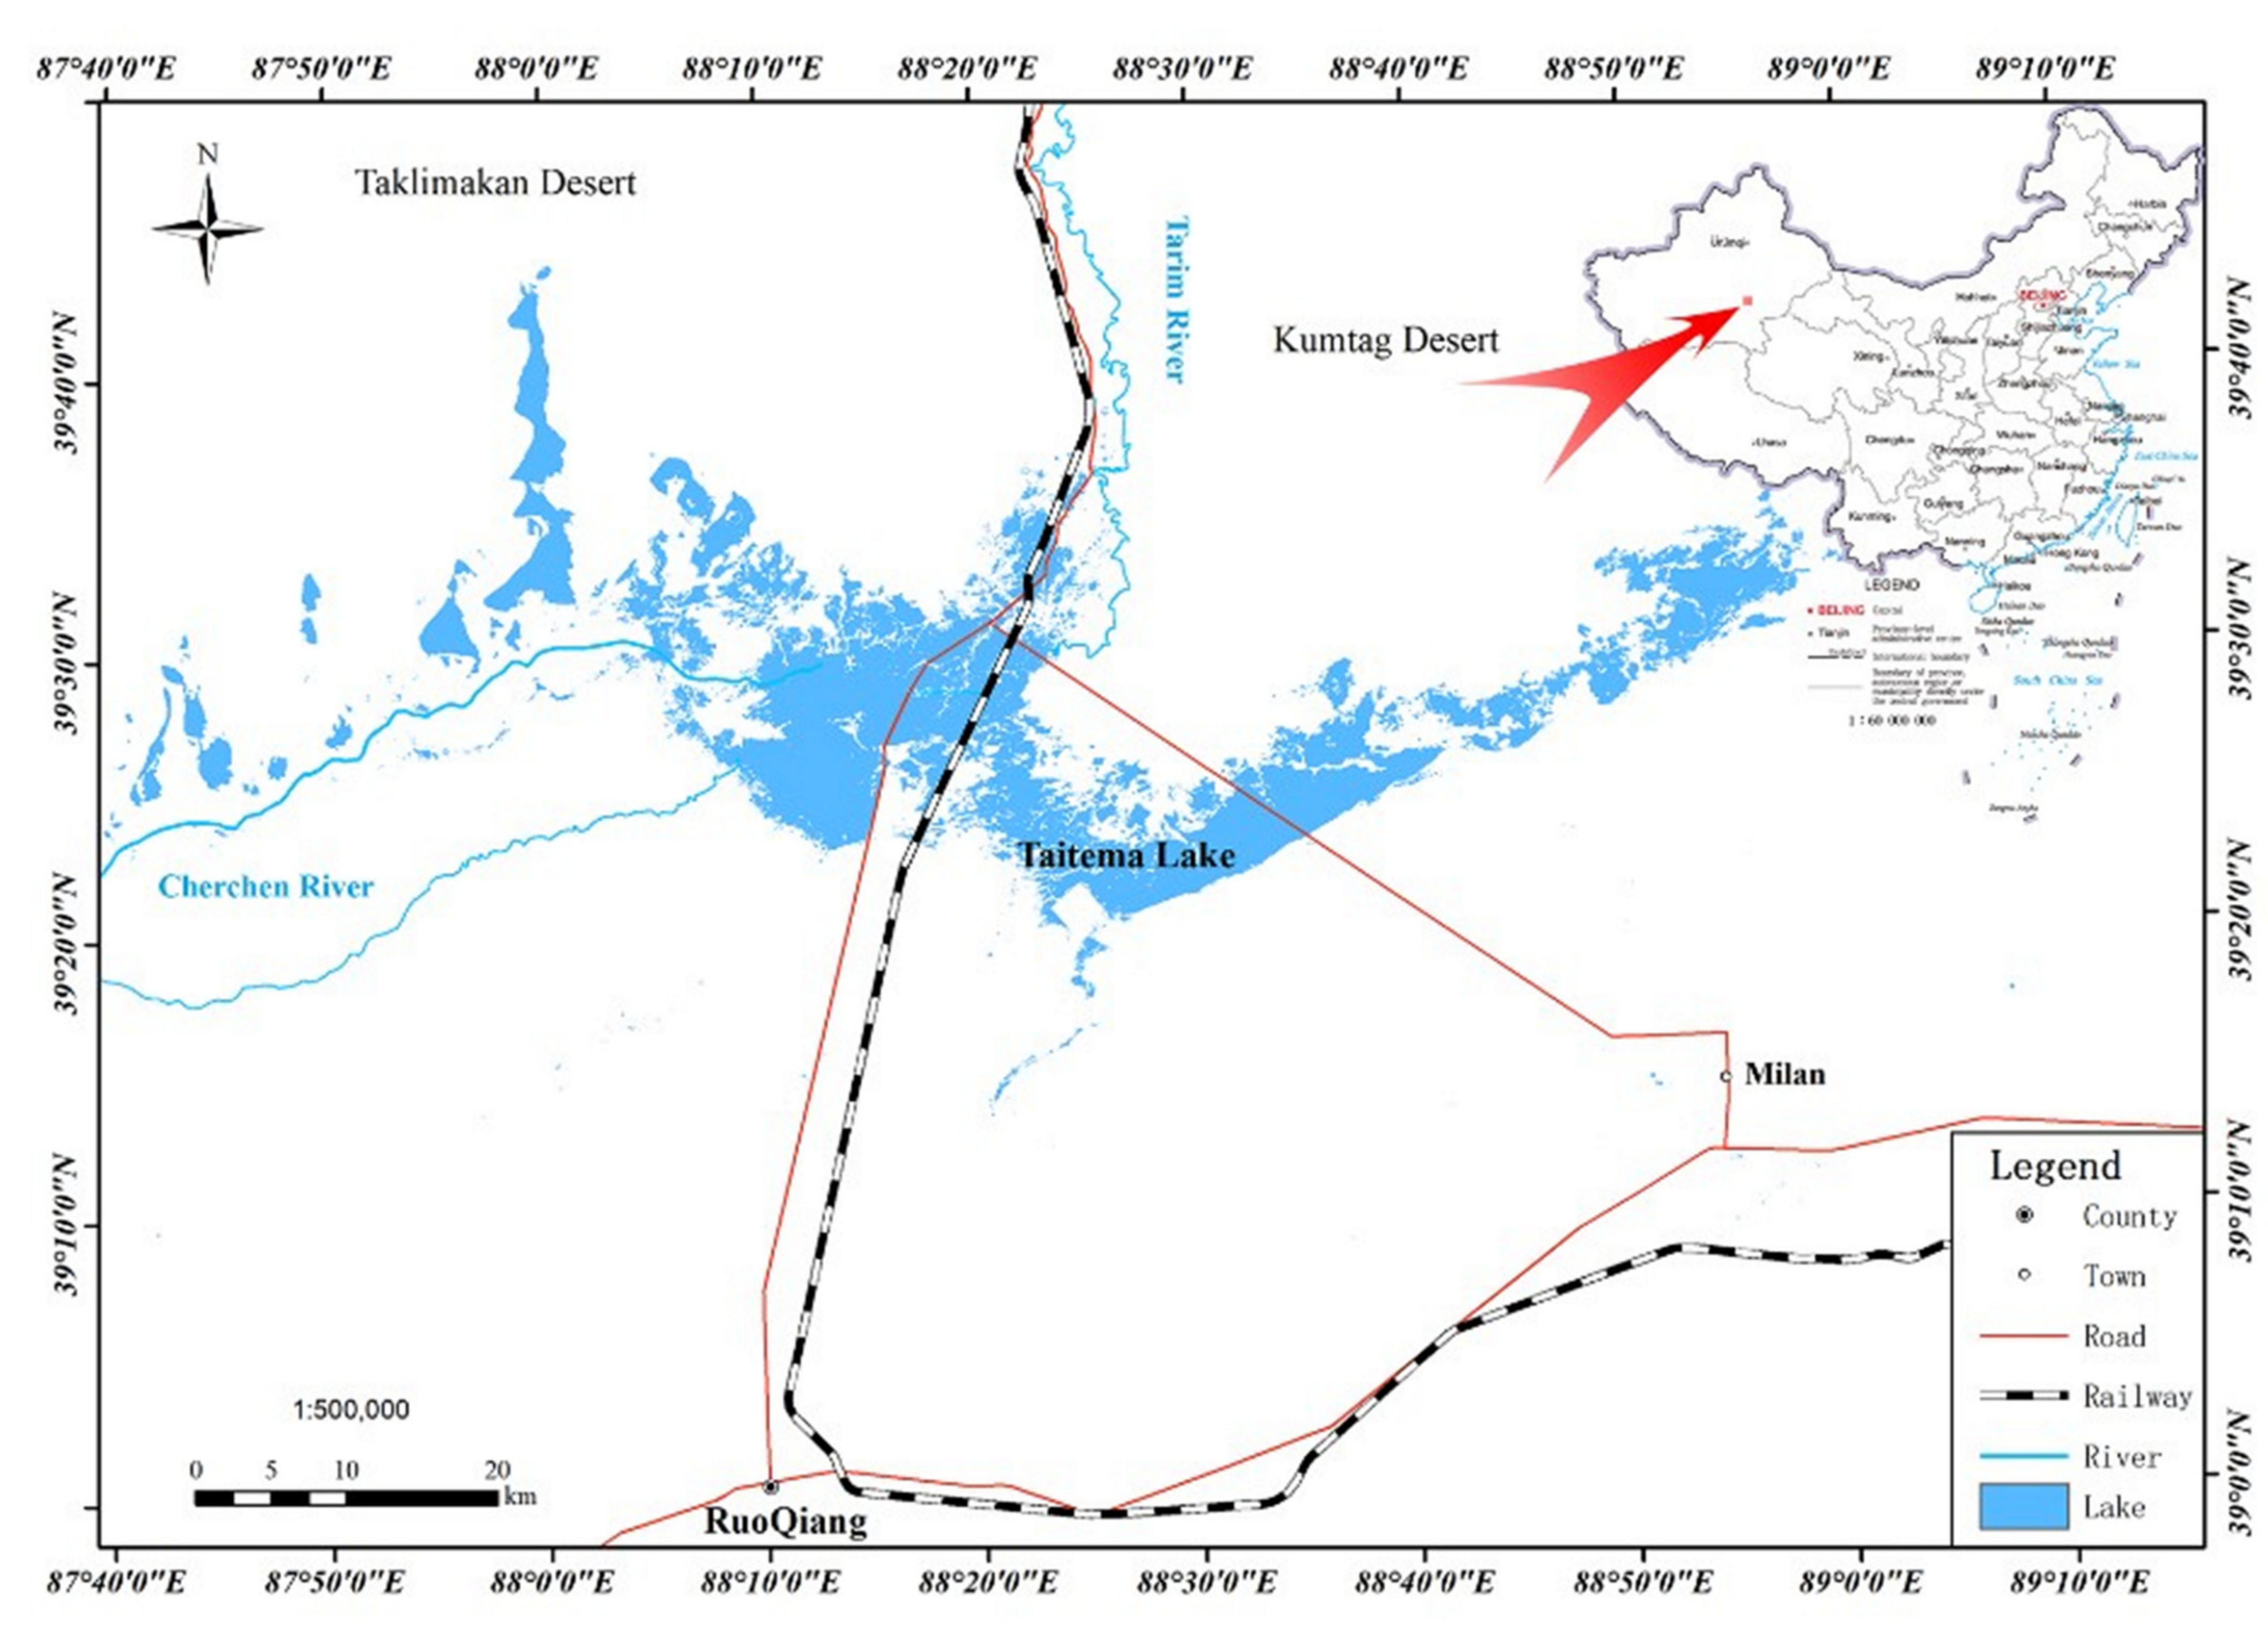
2.1. Overview of the Research Area

Taitema Lake is a low-water alluvial plain in the central part of Ruoqiang County in Xinjiang, China. The location of the study area is shown in Figure 1. It was at the confluence of the Tarim River and Che’erchen River.
The study area belongs to the continental desert arid climate in the warm temperate zone, with annual precipitation of 28.5 mm and annual potential evaporation of 2920.2 mm. The main natural vegetation is sparse desert arid halophytic vegetation.
After zero-flow of the Tarim River in 1972, the lake has been dried up for more than twenty years [24], causing serious desertification on the west coast of the lake. The sediment of the lake is mainly fine sand. Under the effect of strong wind erosion from northeast direction, it is easy to cause sandstorms on the spot [25]; the ecological environment of Taitema Lake is fragile; sparse vegetation around the lake is not able to prevent wind and fixing sand. When it formed an area of about 300 km2 in 2004, it was in a state of biodiversity loss and extreme desertification in the coastal area of the lake [18]. Due to the flat terrain of the Taitema Lake region, the average water depth of the lake is about 0.5 m.

2.2. Sample Plot Distribution and Vegetation Investigation

2.2.1. Sample Plot Distribution

Through years of field investigation, primary monitoring data of Taitema Lake from 2000 to 2020 were collected. In the present study, over-flow plots and non-overflow plots (i.e., control plots) were set up in each sampling zone and field investigations and data collection were carried out to investigate vegetation change under flooding and non-flooding conditions. Considering the accessibility of the sampling plots, the layout of the sampling plots, which is illustrated in Table 1, was influenced by the road network in the area and accessibility of various sections.
Among the 39 fixed monitored plots, 21 were in overflow zones and 18 samples were in non-overflow zones. The overflow area was generally located near the shoreline of the lake, over which the lake overflows several times or once every few years. However, since 2009, as many as eight plots have been flooded for prolonged periods and were no longer used as fixed monitoring plots. Therefore, only 31 sampling plots remained by 2019.
The non-overflow area was located at the end of the sampling transects and was relatively far from the shoreline. The non-overflowing zones were 1–5 km away from the shoreline. Although the region is not affected by surface water, the groundwater level in the region is greatly affected by Taitema Lake. Sometimes, in a year with abundant water, the groundwater level in the region rises, so the area is referred to as groundwater level rise area [26].

2.2.2. Vegetation Sampling

In each sampling plot of 50 × 50 m2 that was set up permanently, total vegetation cover, species and the vegetation cover by individual species were investigated. In addition, three small quadrats measuring 1 × 1 m2 were set up permanently in each of the 50 × 50 m2 plots using the diagonal method. In addition, another three plots of 50 × 50 m2 in 50 × 50 m2 plots were randomly selected in order to increase the repetition; in each quadrat, plant species composition and abundance, vegetation coverage, plant height and diameter of the base were measured. The data on vegetation height and coverage have been published in the paper of 2019. Therefore, relevant data on vegetation height, coverage and plant base diameter are not presented in this paper.

2.3. Measurement of Vegetation Area in Taitema Lake Zone

MODIS vegetation index products include NDVI and EVI. MODIS vegetation indices, produced at 16-day intervals and at multiple spatial resolutions, provide consistent spatial and temporal comparisons of vegetation canopy greenness, a composite property of leaf area, chlorophyll and canopy structure [26]. Two vegetation indices are derived from atmospherically corrected reflectance in the red, near-infrared and blue wavebands: the normalized difference vegetation index (NDVI), which provides records for historical and climate applications; and the enhanced vegetation index (EVI), which minimizes canopy-soil variations and improves sensitivity over dense vegetation conditions. The two products more effectively characterize the global range of vegetation states and processes.
The vegetation indices are retrieved from daily, atmosphere-corrected, bidirectional surface reflectance. The VIs use a MODIS-specific compositing method based on product quality assurance metrics to remove low-quality pixels. From the remaining good-quality VI values, a constrained view angle approach then selects a pixel to represent the compositing period (from the two highest NDVI values, it selects the pixel that is closest-to-nadir). Because the MODIS sensors aboard Terra and Aqua satellites are identical, the VI algorithm generates each 16-day composite eight days apart (phased products) to permit a higher temporal resolution product by combining both data records [27].
There are 44 MODIS products, which can be divided into four special data products of atmosphere, land, ice and snow and ocean. MOD13Q1 is a land-specific product, and its full name is MODIS/Terra Vegetation Indices 16-Day L3 Global 250 m SIN Grid, which is short for MOD13Q1. Based on the MODIS-EVI data of Taitema Lake area from 2000 to 2019, the temporal and spatial variation characteristics of the coverage area of Taitema Lake area are clarified to evaluate the effect of ecological water delivery on vegetation restoration. First of all, with the help of ENVI 5.0 software platform, the spatial distribution range of vegetation cover is defined year by year, and then the spatial distribution data of vegetation in Taitema Lake are extracted using ArcGIS 10.8 spatial analysis function. The vegetation index data used for vegetation cover extraction in the present study were Enhanced Vegetation Index (EVI) data of the MOD13Q1 product with a spatial resolution of 250 m and a January 2001 to December 2019 time series.
Pre-processing the EVI data of the remote sensing data occurred via processes such as format conversion, Mosaic, projection, projection transformation and extraction of the study area. To minimize noise, the data images were processed further using Savitzky–Golay filtering and maximum value composite synthesis processing of remote sensing data.
There are 23 EVI data in a year (one every 16 days). The maximum synthesis method [28] is used to extract the maximum EVI data of the observation pixels from the 23 images to generate new EVI data. So, the obtained data represent the EVI data under the annual optimal vegetation growth conditions. So, the annual EVI data representing the optimal vegetation growth conditions were obtained.
The pixel dichotomy model is an effective method for vegetation cover inversion. The formula is as follows:
F c = EVI EVI s o i l EVI EVI v e g
where Fc is the vegetation cover, which is represented by two decimal numbers in the present study. EVIsoil is the EVI value of pure bare soil pixels in the study area, and EVIveg is the EVI value of pure vegetation pixels. In the present study, the EVI values at 5% and 95% of the histogram of EVI images in the study area were considered to represent EVIsoil values and EVIveg values, respectively.

2.4. Interannual and Intra-Annual Data of Lake Area

2.4.1. Interannual Maximum Lake Area Date

In this paper, the maximum lake area data of each year from 1998 to 2014 were derived from the study of Abdumijiti [18] and the study of Chen (2016), and the image with the largest area of surface water in a year was selected. The area data after 2014 were obtained by ourselves through downloading images and extracting data. The area extraction method was the same as that of Abdumijiti [18] and Chen [17].

2.4.2. Intra-Annual Measurement of Lake Area

Data of intra-annual area in 1973, 1989, 2001, 2002, 2008, 2011, 2012 and 2017 were measured by ourselves through downloading images and extracting data. The area extraction method was the same as that of Abdumijiti [18] and Chen [17].

2.4.3. Groundwater Level Date

This paper used the groundwater level of the nearest monitoring section of Kaogan (E88.42330°, N39.606721), about 20 km from the center of the lake. Generally, the annual ecological water transportation ends in November, so the groundwater level data in November were selected. Groundwater level data are provided by the Tarim River Basin Authority.

2.5. Statistical Analysis

We account for the number of species, calculated the species frequency and the Pielou evenness index in each quadrant.
The trend changes for the plant diversity index, vegetation area and lake area were analyzed using the Mann-Kendall monotony trend test. In the test process, when the statistic (i.e., Zc) is positive, it reflects an upward trend; whereas, when Zc is negative, it reflects a downward trend. If the checking standards are salient (|Zc| ≥ |Z0.05| = 1.96 at the 95% level; |Zc| ≥ |Z0.01| = 2.58 at the 99% level), then the trend is credible; otherwise, it is not.
Species richness (R):
R = S
Pielou evenness index (Ep):
Pi is the relative importance of species i (calculated using frequency). S is the total number of species in the quadrat.
E p = i = 1 S ( P i ln P i ) / L n S
Relative importance of a species is calculated as follows:
P i = W i / W
Wi is the individual number of species i; W is the sum of all individuals from different species in the quadrat.

3. Results

3.1. Lake Area and Water Volume Composed by Tarim River and Che’erchen River

From 2000 to 2017, the discharge of Daxihaizi and the runoff of Che’erchen River (Qiemo hydrologic station) showed a general consistent trend. From 2000 to 2009, the inflow of the two rivers was relatively abundant in 2003 or so, and 2007–2009 was the dry period of both Tarim River and Che‘erchen River. During the period of 2000 to 2009, 2003 was the year with the largest water area of Taitema Lake. During the period of 2010 to 2017, except for the dry year of 2014, the amount of water from other years was relatively large, and Taitema Lake also showed an area of larger than 180 km2 during this period (Figure 2). The lake area increased significantly (Zc is 3.43, |Zc| > |Z0.01| = 2.58), which shows that the lake area is very sensitive to variations in water amount.

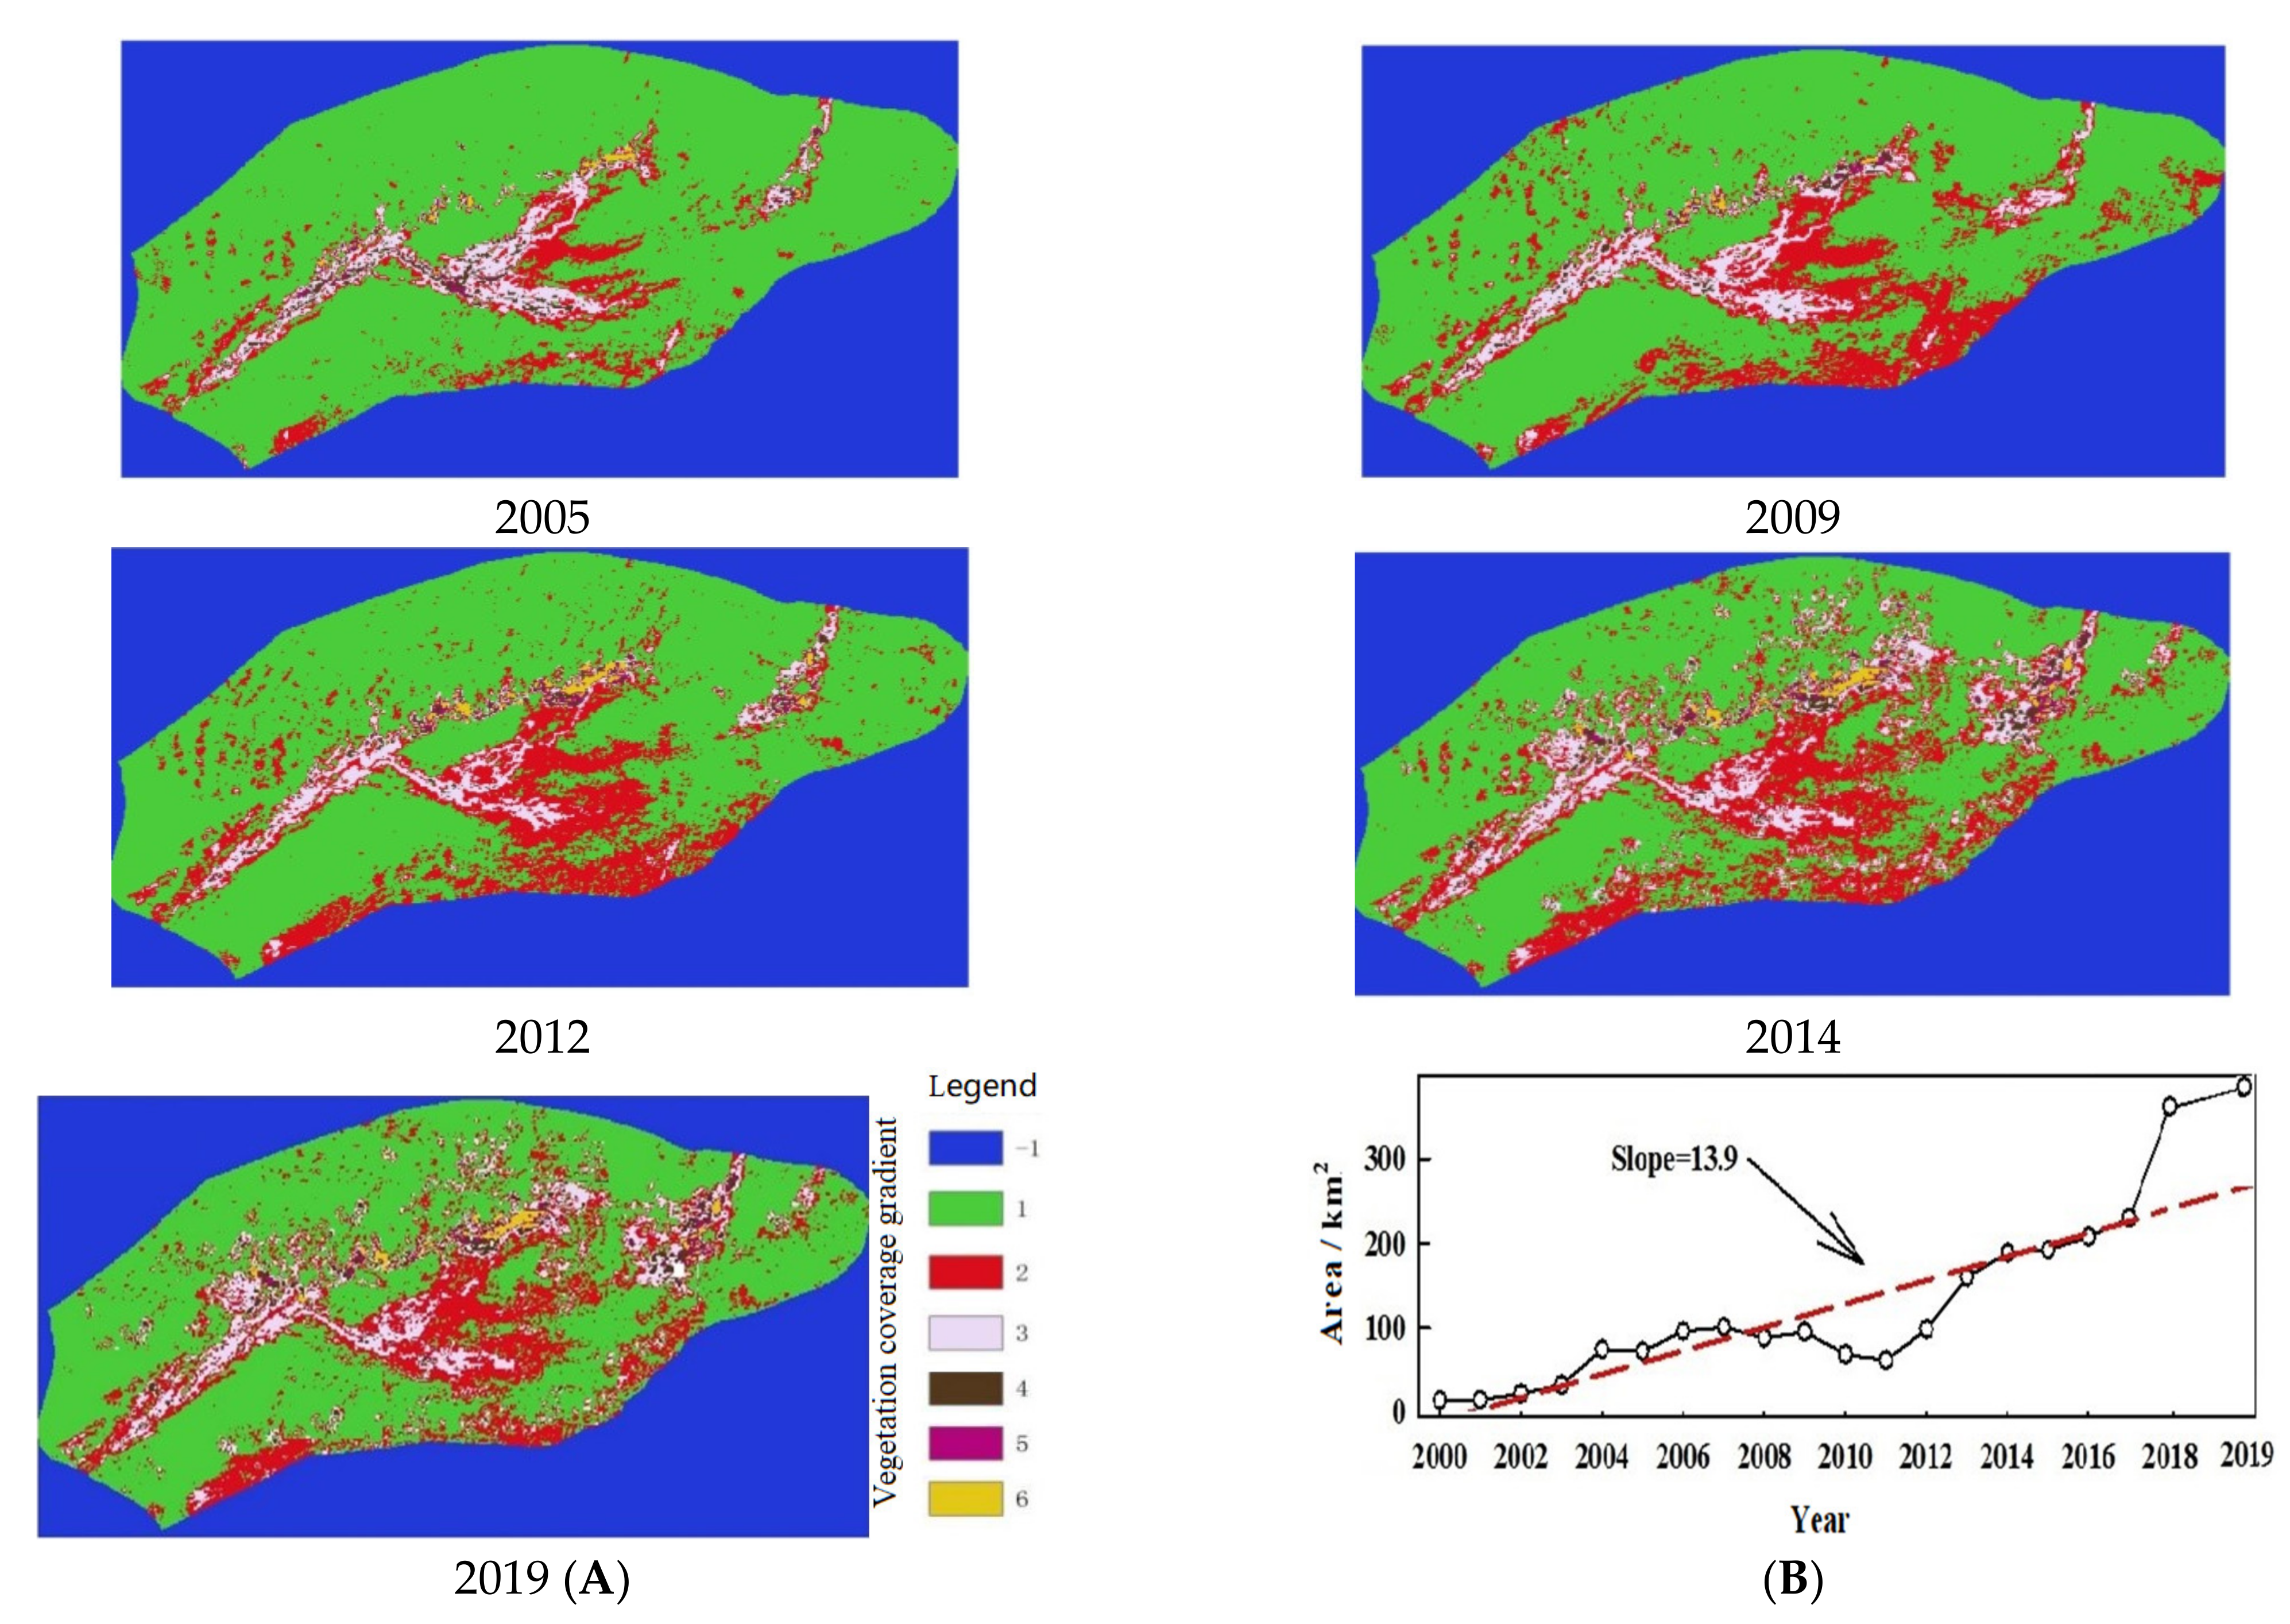
3.2. Variation in Vegetation Coverage

Figure 3 showed the temporal and spatial distribution of vegetation in the Taitema Lake area. In the early period (2000–2002), the vegetation coverage of Taitema Lake seldom changed. According to Figure 3, the restoration of existing vegetation cover in the lake area was mostly generated in the first 10 years. Before 2014, the area of increased vegetation coverage was mainly distributed in the south of the lake, but, after 2014, the area of increased vegetation coverage gradually expanded in the north of the lake area.
The vegetation coverage area of the Taitema Lake area from 2000 to 2019 showed an increasing trend (Figure 3) (Zc is 4.32, |Zc| > |Z0.01| = 2.58), with an average annual increase of 13.9 km2/a, which shows that the vegetation area is very sensitive to variations in the water area, indicating that the vegetation growth was restored after the implementation of the EWCP. The vegetation area in this region increased significantly from 2000 to 2006. However, affected by the decrease in ecological water delivery volume from 2007 to 2009, the vegetation area in 2008 and 2010 decreased significantly. From 2010 to 2013, the ecological water delivery volume increased significantly, and the growth trend of the vegetation area in this part increased, while the lake area was disturbed by flooding and the vegetation area appeared to decrease. In 2014, the ecological water delivery volume decreased significantly. Between 2012 and 2019, the water discharge of Daxihaizi Reservoir was stable and achieved the expected goal of an annual discharge volume of 3.5 × 10⁸ m3 [28,29]. During this period, the vegetation area of the Taitema Lake area increased very significantly.
The plant diversity of the terminal lake during the whole ecological water transfer period was obtained (Figure 4). There were very few species in 2000 because it had been dried up for a long time before 2000 and later increased significantly. The species number reached 12 in 2005, reached the peak, and, with the change in time and the continuous improvement in the water conditions, plants were gradually replaced with salt-tolerant species (such as Salicornia europaea and Scirpus strobilinus) and tended to simplify in recent years (Table 2).
The vegetation diversity indexes (species richness and Pielou index) of the study area were only 2.00 and 0.08, respectively, in 2000. They later increased significantly from 2000 to 2005, and, in 2005, reached 9.01 and 0.80, respectively (Figure 4). However, in the later stage, with the continuous ecological water conveyance, the species richness and Pielou index gradually decreased. Through the Mann–Kendall trend test, the two indexes showed a very significant downward trend in the period of 2005 to 2020. Their statistical Z values were −3.05 and −4.10, respectively, and their absolute values were more than 2.58, indicating that the species composition tended to simplify gradually with the water transport.
From Figure 4, we can also see that the plant diversity index showed a lower level from 2008 to 2010. The main reason is that 2008 and 2009 were dry years, the ecological water did not reach Taitema Lake and the plant diversity also changed with the surrounding water conditions.

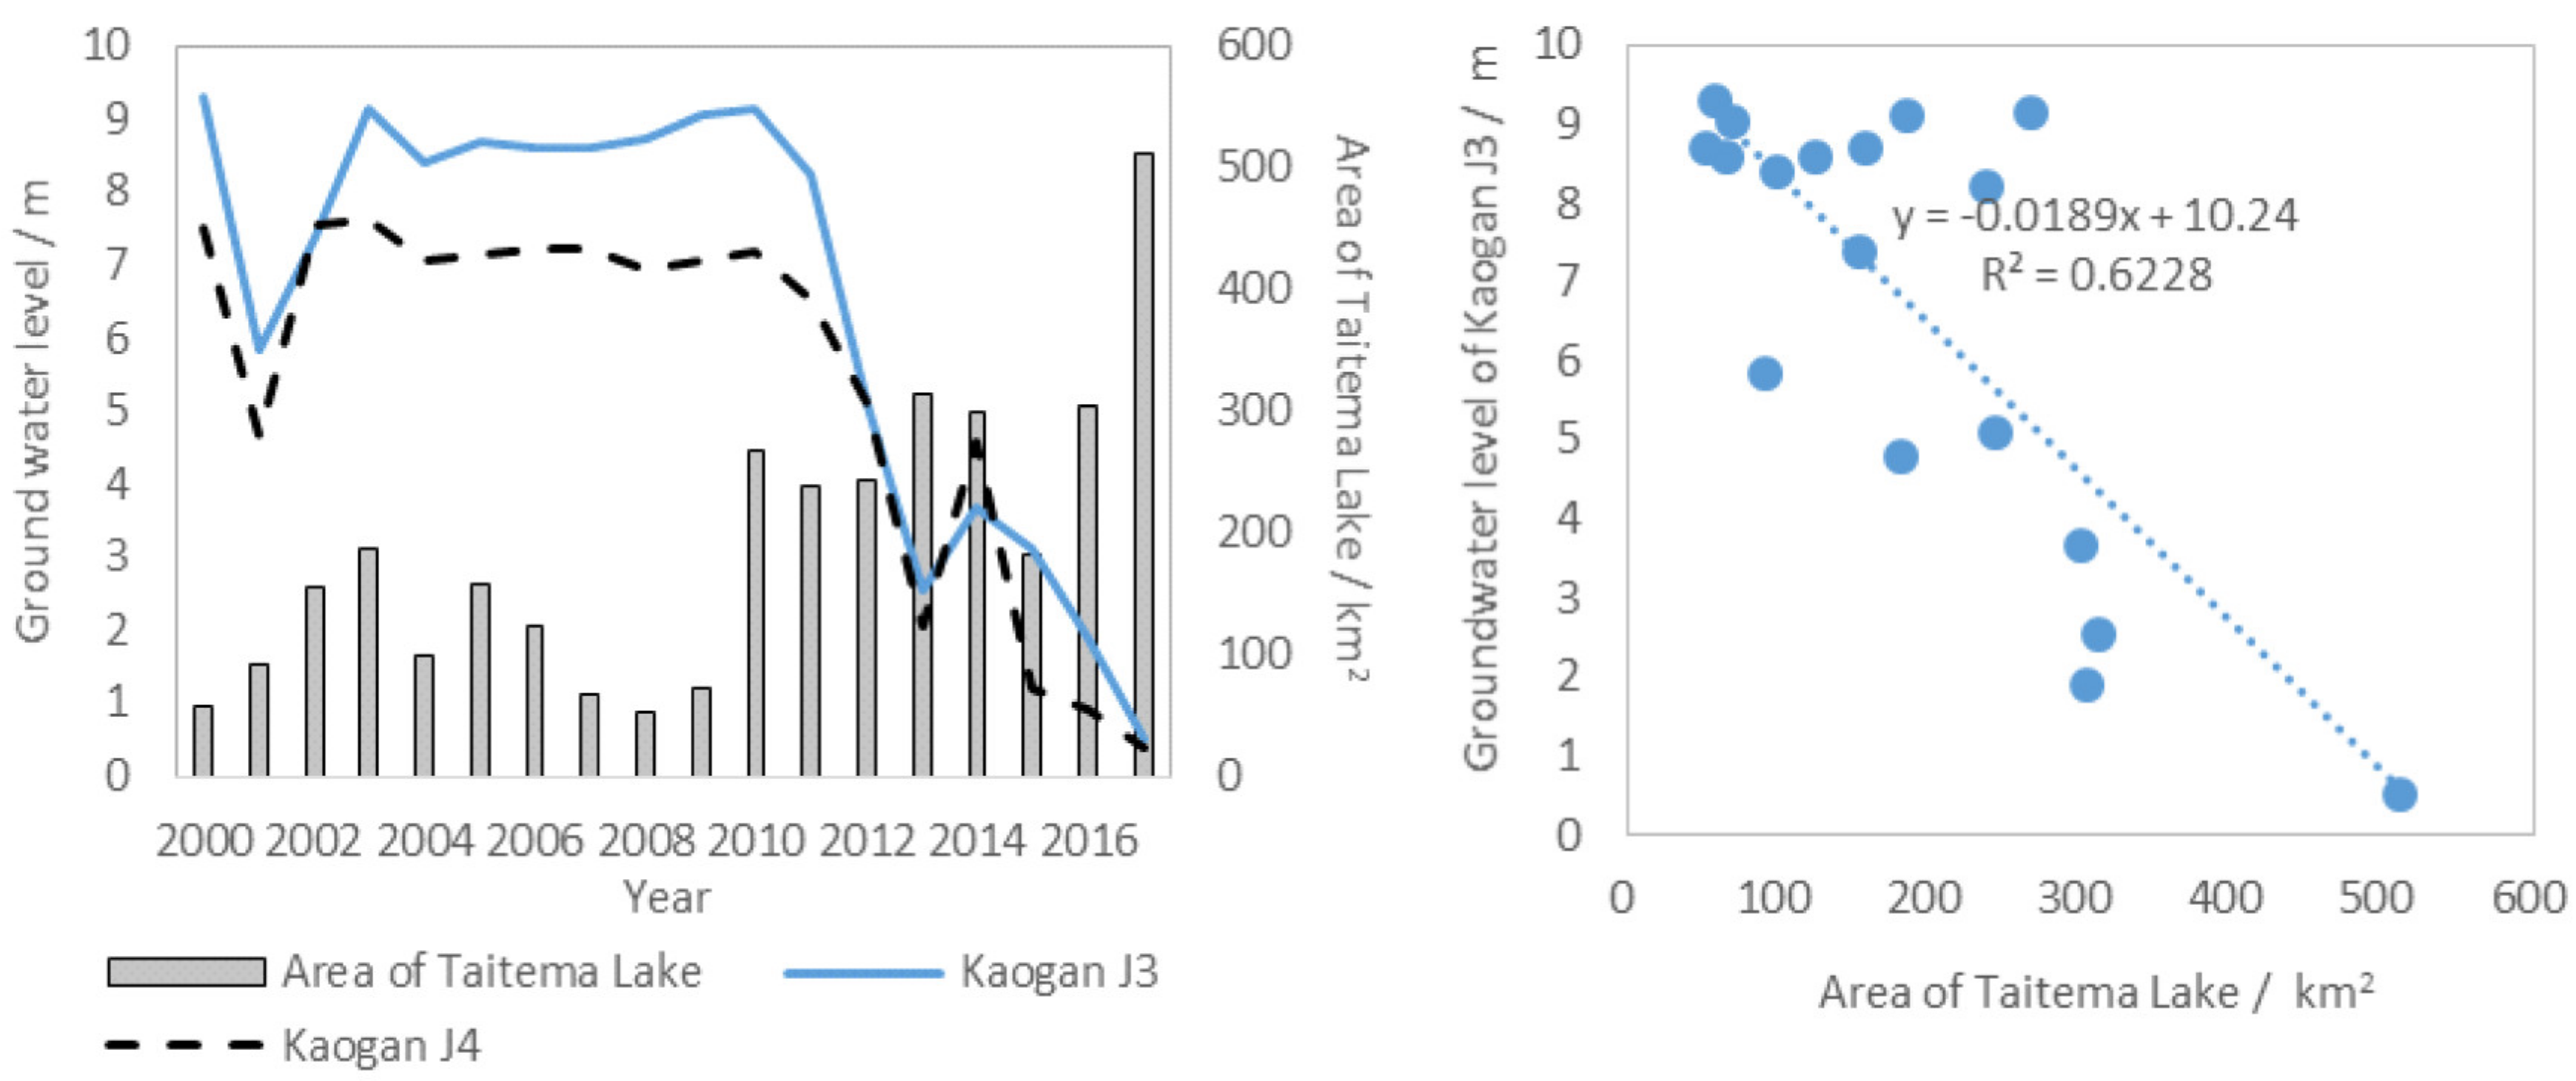
3.3. Response Characteristics of Groundwater Level in Lakeside Line

Figure 5 showed the average groundwater levels of the two wells of 6.39 m and 5.32 m in Kaogan from 2000 to 2017, which were, respectively, 45.53% and 40.91% lower than those in 2000, indicating that the groundwater level around Taitema Lake was rising.
With the increase in the lake area, the surrounding groundwater level also rose, but there was a lag phenomenon in the early stage: during the period of 2000 to 2010, there was little change in groundwater level, and it gradually increased as time went on by the end of 2010.
Through the Pearson correlation coefficient calculation, the results show that there is a significant negative correlation between the area of Taitema Lake and the groundwater level of Kaogan J3, and the correlation coefficient is −0.7892.

3.4. Intra-Annual Variation in Lake Area

Figure 6 showed the intra-annual variation in the water area of the terminal lake. From Figure 6, we can see that the lake area changes significantly within a year. Whether it was in the 1970s, 1980s, 1990s, 2000s or the 2010s, for many years, the lake area showed a downward trend before October. The most obvious downward trends were in 2012 and 2017; the former decreased from 507 km2 to 111 km2, while the latter decreased from 332 km2 to 90 km2.
As we can see from Figure 6, the lake area decreased greatly in the early and middle of the year. In addition, the lake area picked up at the end of the year. Although the area of Taitema Lake declined very fast within one year, water could enter the lake at the end of the year after 2000, forming a trend of the lake area increasing again at the end of the year.

4. Discussion

4.1. Change in Hydrological Elements

The largest water area of the terminal lake of Tarim River appeared in recent years, mainly due to the following reasons: first, the development of the EWCP in the lower reaches of Tarim River; second, the abundant water conditions of the Che’erchen River in recent years; third, the most stringent water resources management system had been implemented by the river management department.
With the increase in the lake area, the surrounding groundwater level also rose, but there was a certain lag, so the groundwater level could not be restored immediately.
The total water volume of Tarim River is about 45.5 × 10⁸ m3 (monitored by Alar hydrographic station), and it is a fixed value. According to the principle of water balance, if more water is allocated to the upstream, the downstream water quantity will decrease; if more water is allocated to the downstream, the upstream water will be reduced. In the Tarim River basin, where the contradiction of water resources itself is prominent, the additional use of water resources in the upper reaches causes a lack of water in the lower reaches. Considering the rapid decline in the lake area due to it being just a very flat desert lake in the Taklimakan Desert [23] and the maintenance of the area requiring a large amount of water to supply continuously, it is considered that the terminal lake should not be further expanded, and the size of Taitema Lake should be smaller than 500–600 km2 at present.

4.2. Response of Vegetation to the Enlarged Water Area

Mainly due to the long period of river cut-off (nearly 30 years), the sharp decrease in the vegetation quantity and the expansion of the sand area under conditions of sandstorm climate, the vegetation coverage of Taitema Lake seldom changed during the early period (2000–2003). After the EWCP had been implemented 20 years, it was found that, with the increase in water inflow, the vegetation area was expanding, with an average annual increase of 13.9 km2/a.
Taitema Lake has been dried up for a long time. Before 2000, there were very few species, and obvious changes were observed in the surface vegetation after ecological water transfer [25]. Within the early stage of the EWCP (before 2006), annual and perennial herbs germinated gradually, and the plant diversity increased significantly, mainly because of the germination of the soil seeds of the local bank [30]. Many studies show that, after vegetation is disturbed, the species diversity increases first, and, as the disturbance continues, the plant diversity decreases [12,24,26,27,28,29,30,31,32,33,34]. The results of this paper showed the same conclusion: under the artificial water delivery disturbance, the species composition and species diversity decreased significantly in the later stage of 2005–2020. Through the Mann-Kendall trend test, the species richness and Pielou evenness index showed a very significant downward trend, so species composition tended to simplify gradually in the later stage.

5. Conclusions

The intra-annual variations in the lake areas were considerable before and after the ecological water conveyance. With the initiation of the EWCP in 2000, the area of Taitema Lake has been increasing annually.
The correlation between the area of Taitema Lake and the discharge of Daxihaizi and the runoff of Che’erchen River is significant, which showed that the larger the amount of the two rivers, the larger the lake surface of Taitema Lake would be.
With the initiation of the ecological water conveyance project in 2000, the growth of the surrounding vegetation has improved: with the increase in water entering the lake and the rise in groundwater level, the water area and vegetation coverage area were expanding, with an average annual increase of 13.9 km2/a.
The species richness and Pielou evenness index in the study area were 9.0 and 0.80 in 2005 but only 2.00 and 0.08 in 2000. The species richness and Pielou evenness index showed a very significant downward trend in the period of 2005 to 2020. Their statistical Z values were −3.05 and −4.10, respectively; the species composition tended to simplify gradually in the late stage.

Author Contributions

Conceptualization and methodology, H.X. and T.L.; writing—original draft preparation, X.Z.; supervision and data analysis, A.A. and W.Z.; project administration and funding, H.X.; data processing, Y.Y. All authors have read and agreed to the published version of the manuscript.

Funding

Project of Construction Management Bureau of Land Development and Consolidation in the Xinjiang Uygur Autonomous Region—A Special Research on Ecological Problems and Ecological Restoration in Tarim River Basin, Xinjiang (JTZB (2021-034 (03)); West Light Foundation of the Chinese Academy of Sciences (Y734341).

Institutional Review Board Statement

Not applicable.

Informed Consent Statement

Not applicable.

Data Availability Statement

Not applicable.

Conflicts of Interest

The authors declare no conflict of interest.

References

  1. Turner, K.G.; Anderson, S.; Gonzales-Chang, M.; Costanza, R.; Wratten, S. A review of methods, data, and models to assess changes in the value of ecosystem services from land degradation and restoration. Ecol. Model. 2015, 319, 190–207. [Google Scholar] [CrossRef]
  2. Andres, R.J.; Boden, T.A.; Higdon, D.M. Gridded uncertainty in fossil fuel carbon dioxide emission maps, a CDIAC example. Atmos. Chem. Phys. 2016, 16, 14979–14995. [Google Scholar] [CrossRef] [Green Version]
  3. Belmer, N.; Tippler, C.; Wright, I.A. Aquatic ecosystem degradation of high conservation value upland swamps, blue mountains australia. Water Air Soil Pollut. 2018, 229, 98. [Google Scholar] [CrossRef]
  4. Bestelmeyer, B.T.; Okin, G.S.; Duniway, M.C. Desertification, land use, and the transformation of global drylands. Front. Ecol. Environ. 2016, 13, 28–35. [Google Scholar] [CrossRef] [Green Version]
  5. Xu, Q.; Ye, M.; Xu, H.L.; Wang, X.Y.; Zhao, X.F. Effects of ecological water conveyance on the composition, diversity and stability of plant community in the lower reaches of Tarim River. Chin. J. Ecol. 2018, 37, 57–64. [Google Scholar]
  6. Wang, Z.; Deng, X.; Song, W.; Li, Z.; Chen, J. What is the main cause of grassland degradation? A case study of grassland ecosystem service in the middle-south Inner Mongolia. Catena 2017, 150, 100–107. [Google Scholar] [CrossRef]
  7. Gao, Q.; Guo, Y.; Xu, H.; Ganjurjav, H.; Yue, L.; Wan, Y.; Qin, X.; Xin, M.; Liu, S. Climate change and its impacts on vegetation distribution and net primary productivity of the alpine ecosystem in the qinghai-tibetan plateau. Sci. Total Environ. 2016, 554–555, 34–41. [Google Scholar] [CrossRef]
  8. Chaudhary, A.; Pfister, S.; Hellweg, S. Spatially Explicit Analysis of Biodiversity Loss Due to Global Agriculture, Pasture and Forest Land Use from a Producer and Consumer Perspective. Environ. Sci. Technol. 2016, 50, 3928–3936. [Google Scholar] [CrossRef]
  9. Wu, Z.W.; Chun, X.; Liang, W.J.; Liu, J.Y. Review of lake evolution in arid and semi-arid area. Wetl. Sci. Manag. 2017, 13, 55–60. [Google Scholar]
  10. Hui, D. Study on Ecological Reconstruction of Terminal Lakes of Arid Inland Rivers: A Comparison of Regional Practice; Lanzhou University: Lanzhou, China, 2016; pp. 1–20. [Google Scholar]
  11. Xiao, C.S.; Cheng, X.H.; Ding, A.J. Study process of climate change, environment evolution and its driving mechanism in the last two centuries in the Alxa Desert. J. Desert Res. 2017, 37, 1102–1110. [Google Scholar]
  12. Xu, H.L.; Zhang, P.; Zhao, X.F.; Lin, H.B. Effect of river-flooding on soil salinity in lower reaches of Tarim River. Bull. Soil Water Conserv. 2016, 36, 1–6. [Google Scholar]
  13. Mcdonald, T.; Jonson, J.; Dixon, K.W. National standards for the practice of ecological restoration in Australia. Restor. Ecol. 2016, 24, 705. [Google Scholar] [CrossRef] [Green Version]
  14. Li, S. Vegetation changes in recent large-scale ecological restoration projects and subsequent impact on water resources in china’s loess plateau. Sci. Total Environ. 2016, 569, 1032–1039. [Google Scholar] [CrossRef]
  15. Manjaribe, C.; Frasier, C.L.; Rakouth, B.; Louis, E.E. Ecological restoration and reforestation of fragmented forests in Kianjavato, Madagascar. J. Ecol. 2013, 2013, 726275. [Google Scholar] [CrossRef]
  16. Brancalion, P.H.S.; Cardozo, I.V.; Camatta, A.; Aronson, J.; Rodrigues, R.R. Cultural ecosystem services and popular perceptions of the benefits of an ecological restoration project in the Brazilian Atlantic forest. Restor. Ecol. 2014, 22, 65–71. [Google Scholar] [CrossRef]
  17. Abudumijiti, A.B.L.K.M. The Temporal and Spatial Evolution of the Lake Pattern in the Lower Tarim River; Xinjiang Normal University: Xinjiang, China, 2015. [Google Scholar]
  18. Zhang, P.F.; Guli, J.P.; Bao, A.M.; Meng, F.H.; Guo, H.; Luo, M.; Huang, X.R. Ecological effects evaluation for short term planning of the Tarim River. Arid Land Geogr. 2017, 40, 156–164. [Google Scholar]
  19. Deng, M.J.; Zhou, H.Y.; Xu, H.L. Research on the ecological operation in the lower reaches of Tarim River based on water conveyance. Sci. Sin. 2016, 46, 864–876. [Google Scholar]
  20. Wang, H.L.; Tursun, K.S.M. Exploration and analysis of ecological environment change of Taitema lake before and after ecological water transfer. Ecol. Sci. 2020, 39, 93–100. [Google Scholar]
  21. Huo, T.C.; Wei, Y.; Ma, X.F. A study of the variation and driving factors of the water area of the terminal lake of inland river: A case study of Taitema Lake region. Remote Sens. Land Resour. 2020, 32, 149–156. [Google Scholar]
  22. Fan, Z.L.; Xu, H.L.; Fu, J.Y.; Ailixier, K.E.B.; Abudumijiti, A.B.L.K.M. Study on protection of wet land of Taitema lake. Quat. Sci. 2013, 33, 594–602. [Google Scholar]
  23. Xu, H.L.; Ye, M.; Song, Y.D. The dynamic variation of water resources and its tendency in the Tarim river basin. J. Geogr. Sci. 2005, 15, 467–474. [Google Scholar] [CrossRef]
  24. Bazzaz, F.A. Plant species diversity in old-field successional ecosystems in southern Illinois. Ecology 1975, 56, 485–488. [Google Scholar] [CrossRef]
  25. Xu, H.L.; Ye, M.; Song, Y.D. Relationship between climate changes and annual runoff of headstreams of Tarim River. Sci. Geogr. Sin. 2007, 27, 219–224. [Google Scholar]
  26. Xu, W.; Ma, Z.Y.; Jin, X.; He, J.S. Biodiversity and ecosystem multi functionality: Advances and perspectives. Biodivers. Sci. 2016, 24, 55–71. [Google Scholar] [CrossRef]
  27. Fan, Z.L.; Xu, H.L.; Zhang, P.; Zhao, X.F.; Abudu, M.J.T.; Fu, J.Y. The Qarqan River in Xinjiang and its water resources utilization. Arid Zone Res. 2014, 31, 20–26. [Google Scholar]
  28. Holben, B.N. Characterization of maximum value composites from temporal AVHRR data. Remote Sens. 1986, 7, 1417–1434. [Google Scholar] [CrossRef]
  29. Alexandridis, T.K.; Ovakoglou, G.; Clevers, J.G. Relationship between MODIS EVI and LAI across time and space. Geocarto Int. 2020, 35, 1385–1399. [Google Scholar] [CrossRef]
  30. Tomoaki, M.; Charlotte, Z.S.; Hiroki, Y. Validation and analysis of Terra and Aqua MODIS, and SNPP VIIRS vegetation indices under zero vegetation conditions: A case study using Railroad Valley Playa. Remote Sens. Environ. 2021, 257, 112344. [Google Scholar] [CrossRef]
  31. Sedighifar, Z.; Motlagh, M.G.; Halimi, M. Investigating spatiotemporal relationship between EVI of the MODIS and climate variables in northern Iran. Int. J. Environ. Sci. Technol. 2020, 17, 733–744. [Google Scholar] [CrossRef]
  32. Zhang, H.; Xue, L.Q.; Wei, G.H. Assessing Vegetation Dynamics and Landscape Ecological Risk on the Mainstream of Tarim River, China. Water 2020, 12, 2156. [Google Scholar] [CrossRef]
  33. Chen, G.L. Analysis of the relationship between the lake surface area of Taitema Lake and the main recharge water source. Water Conserv. Sci. Technol. Econ. 2016, 22, 41–44. [Google Scholar]
  34. Chen, Y.N.; Zhang, X.L.; Zhu, X.M. Analysis of the effect of ecological water in the lower reaches of Tarim River in Xinjiang. Sci. China Ser. D Earth Sci. 2004, 34, 475–482. [Google Scholar]
Figure 1. Schematic diagram of the location of Taitema Lake.
Ecologies 02 00019 g001
Figure 2. Variation in the water volume of the two rivers and the area of Taitema Lake.
Ecologies 02 00019 g002
Figure 3. Vegetation coverage (A) and vegetation area (B) of the terminal of the Tarim River. −1: The area outside of the terminal lake. 1: Sandy land (vegetation coverage <10%). 2: low coverage (10–20% vegetation coverage). 3: medium and low coverage (vegetation coverage is 20–40%). 4: Medium coverage (vegetation coverage is 40–60%). 5: medium and high coverage (vegetation coverage is 60–80%). 6: High coverage (vegetation coverage >80%).
Ecologies 02 00019 g003
Figure 4. Species richness (A) and Pielou evenness index (B) of flooding area and groundwater elevated area of the terminal lake of Tarim River.
Ecologies 02 00019 g004
Figure 5. Burial depth of groundwater of Kaogan section from 2000 to 2017 in the terminal lake of Tarim River.
Ecologies 02 00019 g005
Figure 6. Intra-annual variation in water area of the terminal lake in the 1970s, 1980s, 2000s and 2010s.
Ecologies 02 00019 g006aEcologies 02 00019 g006b
Table 1. Geographical location of the monitoring plots.
PlotSize of PlotLongitudeLatitudeAltitude (m)
overflow areaPlot 150 × 50 m2E88°32′42.0″N37°34′7.9″798.2
Plot 250 × 50 m2E88°22′23.9″N39°32′16.5″793.4
Plot 350 × 50 m2E88°21′22.8″N39°31′30.3″793.3
Plot 450 × 50 m2E88°17′03.0″N39°28′55.8″796
Plot 550 × 50 m2E88°15′43.4″N39°26′33.6″799.5
Plot 650 × 50 m2E88°11′53.5″N39°14′6.3″801
Plot 750 × 50 m2E88°23′23.7″N39°29′40.2″802
Plot 850 × 50 m2E88°22′51.5″N39°29′56.7″791
Plot 950 × 50 m2E88°22′23.1″N39°30′17″786
Plot 1050 × 50 m2E88°22′15.9″N39°30′14.7″794
Plot 1150 × 50 m2E88°22′06.8″N39°30′19.7″ 794
Plot 1250 × 50 m2E88°21′56.3″N39°30′15.9″ 794
Plot 1350 × 50 m2E88°23′41.3″ N39°29′41.1″791
Plot 1450 × 50 m2E88°23′53.5″N39°29′34.7″794
Plot 1550 × 50 m2E88°24′12.7″N39°29′24.6″795
Plot 1650 × 50 m2E88°21′30.2″N39°30′15.8″806.4
Plot 1750 × 50 m2E88°20′45.5″N39°30′9.6″806.5
Plot 1850 × 50 m2E88°21′46.0″N39°30′14.4″807.5
Plot 1950 × 50 m2E88°16′28.1″N39°26′37.7″795.3
Plot 2050 × 50 m2E88°16′13.5″N39°26′36.3″798.5
Plot 2150 × 50 m2E88°21′23.0″N39°31′18.6″808.9
non-overflow areaPlot 150 × 50 m2E88°20′41.0″N39°30′59.0″807.5
Plot 250 × 50 m2E88°20′45.9″N39°30′54.0″807.9
Plot 350 × 50 m2E88°20′56.3″N39°30′51.4″807.8
Plot 450 × 50 m2E88°21′56.8″N39°30′12.2″807.7
Plot 550 × 50 m2E88°23′28.6″N39°29′41.2″808
Plot 650 × 50 m2E88°23′43.4″N39°29′50.6″807.9
Plot 750 × 50 m2E88°23′39.8″N39°30′7.9″807.5
Plot 850 × 50 m2E88°23′25.8″N39°29′40.9″807.9
Plot 950 × 50 m2E88°23′15.7″N39°29′24.3″806.5
Plot 1050 × 50 m2E88°23′27.6″N39°29′26.5″807.1
Plot 1150 × 50 m2E88°25′20.6″N39°36′23.8″812.7
Plot 1250 × 50 m2E88°25′20.6″N39°36′24.1″811.8
Plot 1350 × 50 m2E88°9′22.7″N39°26′36.9″810.6
Plot 1450 × 50 m2E88°11′13.9″N39°17′20.4″812.1
Plot 1550 × 50 m2E88°12′25.9″N39°16′50.5″810.8
Plot 1650 × 50 m2E88°12′10.4″N39°15′45.3″812.1
Plot 1750 × 50 m2E88°14′8.1″N39°18′46.0″810.4
Plot 1850 × 50 m2E88°15′22.3″N39°19′28.2″809.5
Table 2. List of species present in quadrats for each year (2000, 2005–2020).
Species20
Year 00050607080910121314151617181920
1Tamarix sp.
2Halostachys caspica
3Halocnemum strobilaceum
4Phragmites australis
5Karelinia caspia
6Lycium ruthenicum
7Alhagi sparsifolia
8Hexinia polydichotoma
9Glycyrrhiza inflata
10Halogeton glomeratus
11Poacynum hendersonii
12Salsola pellucida
13Salicornia europaea
14Scirpus strobilinus
15Cynodon dactylon
16Crypsis schoenoides
17Inula salsoloides
18Kalidium foliatum
19Aeluropus pungens
Publisher’s Note: MDPI stays neutral with regard to jurisdictional claims in published maps and institutional affiliations.

