Review

Biophysical Modeling of Cardiac Cells: From Ion Channels to Tissue

by
Sergio Alonso
1,2,*,
Enrique Alvarez-Lacalle
1,2,
Jean Bragard
3,4 and
Blas Echebarria
1,2
1
Department of Physics, Universitat Politècnica de Catalunya—BarcelonaTech (UPC), 08034 Barcelona, Spain
2
Institute for Research and Innovation in Health (IRIS), Universitat Politècnica de Catalunya—BarcelonaTech (UPC), 08028 Barcelona, Spain
3
Department of Physics and Applied Mathematics, University of Navarra, 31008 Pamplona, Spain
4
Institute of Data Science and Artificial Intelligence (DATAI), University of Navarra, 31009 Pamplona, Spain
*
Author to whom correspondence should be addressed.
Biophysica 2025, 5(1), 5; https://doi.org/10.3390/biophysica5010005
Submission received: 20 December 2024 / Revised: 3 February 2025 / Accepted: 7 February 2025 / Published: 14 February 2025
(This article belongs to the Special Issue State-of-the-Art Biophysics in Spain 2.0)

Abstract

:
Cardiovascular diseases have become the leading cause of death in developed countries. Among these, some are related to disruptions in the electrical synchronization of cardiac tissue leading to arrhythmias such as atrial flutter, ventricular tachycardia, or ventricular fibrillation. Their origin is diverse and involves several spatial and temporal scales, ranging from nanoscale ion channel dysfunctions to tissue-level fibrosis and ischemia. Mathematical models play a crucial role in elucidating the mechanisms underlying cardiac arrhythmias by simulating the electrical and physiological properties of cardiac tissue across different spatial scales. These models investigate the effects of genetic mutations, pathological conditions, and anti-arrhythmic interventions on heart dynamics. Despite their varying levels of complexity, they have proven to be important in understanding the triggers of arrhythmia, optimizing defibrillation protocols, and exploring the nonlinear dynamics of cardiac electrophysiology. In this work, we present diverse modeling approaches to the electrophysiology of cardiac cells and share examples from our own research where these approaches have significantly contributed to understanding cardiac arrhythmias. Although computational modeling of the electrical properties of cardiac tissue faces challenges in integrating data across multiple spatial and temporal scales, it remains an indispensable tool for advancing knowledge in cardiac biophysics and improving therapeutic strategies.

1. Introduction

Worldwide, most causes of death have undergone a continuous reduction. The improvement in medical treatments and care has been the main reason for the decrease in mortality in developed countries, where there is a broad shift from infectious, maternal, and neonatal causes toward non-infectious diseases [1]. The improvement in medicine is multifactorial, and some key factors are associated with vaccines, antibiotics, or neonatal care, which have significantly reduced the death toll related to epidemics and infectious diseases [2]. All such measures have been effective tools to control very diverse diseases. This has left cardiovascular diseases as the leading cause of death in developed countries [2,3,4].
Cardiovascular diseases are associated with the malfunction of the heart, which can rapidly impede blood supply. The heart functions as a mechanical pump, with the atria first pumping blood into the ventricles, which then pump blood out of the heart. This mechanical activity is precisely regulated by an electrical signal known as the action potential, which travels from cell to cell and synchronizes the contraction of heart tissue [5]. Disruption in the synchronization of these electrical impulses, which control blood pumping, can lead to various arrhythmia, including atrial flutter, atrial fibrillation, ventricular fibrillation, and ventricular tachycardia [6].
The reasons for the desynchronization of the heart’s contraction are multiple and can appear at very different spatial scales. The origin can be at the nanoscale due to the genetic modification of a particular ion channel, resulting in an alteration of the dynamics of the electrical signal. It can also be at the microscale due to a dysregulation in the dynamics of intracellular calcium, which is a second messenger that regulates cell contraction. Or it can be, for instance, related to the microscopic accumulation of fibrotic tissue, or to instabilities in wave propagation through the tissue, which are phenomena that occur at the centimeter scale.
Clinical findings have suggested that often the trigger for such arrhythmia is a localized excitation, which can lead to premature ventricular complexes, or ectopic beats, that are co-located within the infarct and ischemic regions of the heart [7,8] and can appear due to the interaction of anomalous calcium cycling and sodium currents [9,10,11].
Mathematical models can help to understand and characterize the processes that lead to the desynchronization of cardiac tissue. The intensive computational analysis of such models has become a relevant tool to study cardiac arrhythmia. For example, mathematical modeling has shown that fibrotic tissue can lead to the appearance of ectopic beats [12,13], that ischemia favors the development of lethal cardiac arrhythmia [14], and that malfunctions in calcium cycling can trigger action potentials at the single-cell levels, both as early afterdepolarizations (EADs) and as delayed afterdepolarizations (DADs) [15,16]. Calcium plays also a key role in persistent atrial fibrillation [17,18,19].
Mathematical models of cardiac tissue describe the electrophysiological properties of cardiac cells and, in particular, the dynamics of the action potential [20]. There are very different levels of complexity in the description depending on the electrophysiological model [21]. While some models consider all types of currents present in cardiac cells, others, simpler, account only for the main features of the action potential. Despite the diversity in complexity, all models have to be numerically integrated and, thus, computational modeling of the heart function becomes an essential tool to understand the properties of cardiac tissue. The versatility of the models describing cardiac tissue and the similarities among the resulting dynamics have attracted, among others, the attention of biophysicists [22,23] because of the nonlinear aspects [24] of the heart dynamics.
There are mathematical models of cardiac activity at very different scales because, while some of them cover the detailed dynamics of particular ion channels, other models describe the details of the anisotropy of the fibers and the particular morphology of the ventricles and atria. While single-cell models employ data from voltage clamp experiments [25,26], computational cardiac models of the heart combine current electrophysiological models with images of the heart’s electrical conduction obtained by different techniques [27]. Genetic variants and mutations can produce cardiopathies that affect the whole organ, demanding a multiscale approach [28,29]. Such different spatial and temporal scales are difficult to combine into a single model, and this quest represents still a huge challenge nowadays [30]. Therefore, the usual strategy is to use different types of models for the different spatial scales under consideration. There have been several efforts to unify different scales into large complex multiscale models [31,32] using multiphysics approaches [33,34].
The elementary unit of cardiac tissue is the cardiac cell. Cardiac cells, or myocytes, have a length of 80–100 μ m and a diameter of 10–20 μ m. Each of these cells is separated from the neighboring extracellular space by a phospholipid bilayer membrane. From an electrical standpoint, the cell membrane can be considered as a capacitor that stores electric charge. Then, the total electrical current through the cell membrane has to be equal to the change in the charge of the membrane:
C m d V d t = I i o n ,
where V = V i V e is the electrical membrane potential, and C m is the capacitance of the membrane which has a typical value of 1   μ F/cm2. The total ion current I i o n is the sum of that flowing through several specific ion channels and pumps (see Figure 1):
I i o n = I N a + I C a + I K + I N A C A + ,
where different ion currents control the dynamics of the membrane potential [35]. By convention, the electric current is deemed positive when it is directed outward of the cell.
Figure 2 depicts the time evolution of the action potential, illustrating its various phases. Phase 0 is characterized by a sharp increase in membrane potential during depolarization. This is caused by the rapid influx of sodium ions, and due to the increase of the permeability of the sodium ion channels, the potential tends to the sodium Nernst potential ( V r E N a = + 50 mV). In Phase 1, there is a swift decrease in membrane potential due to the inactivation of sodium channels and the appearance of a fast outward potassium current. This potassium outward current is balanced by inward calcium (Ca2+) currents, creating the plateau characteristic of Phase 2 due to the large Nernst potential of Ca2+, E C a = + 134 mV. In Phase 3, calcium currents cease, and the membrane potential gradually returns to its resting state due to a slow outward potassium current. At rest, known as Phase 4, inwardly rectifying potassium channels are active and allow a small steady efflux of K+ ions. Simultaneously, the Na+/K+ pump and the sodium-calcium exchanger transport Na+, Ca2+, and K+ ions. The three fluxes maintain constant the negative resting potential and return the system back to homeostatic balance. The cell is then said to have repolarized, and it maintains its out of equilibrium steady state.
The action potential produces myocyte contraction because it triggers a transient increase of intracellular Ca2+ concentration [Ca]i. The increase in [Ca]i enables the cellular contraction machinery to work via crossbridge cycling tropomyosin that slides over actin filaments and shortens the myocyte length. This induces a longitudinal mechanical stress in the myocyte.
Myocytes are interconnected and organized into cardiac fibers. Electrical coupling is facilitated by gap junctions, which are primarily located at the longitudinal ends of myocytes. Along the fibers, the propagation of the action potential is faster. This enables the action potential to propagate through the tissue, producing an excitation wave with a propagation speed that varies depending on the type of cardiac tissue. To model the propagation of the action potential, the cable equation in one dimension is typically used [36,37]:
V t = 1 C m I i o n + D 2 V x 2 ,
where the diffusion parameter D 0.001 cm2 ms 1 is related to the cardiac tissue conductivity ( σ [2–6] mS/cm) and the surface area to volume ratio of the myocyte ( ψ 0.2 μ m 1 ) as D = σ / ( C m ψ ) [38]. Equation (3) can represent a good summary of this review. The current I i o n depends on the different ion channels present in the cell and the complex intracellular organization, whose details are discussed, respectively, in Section 2 (see Figure 3A) and Section 3 (see Figure 3B). The temporal variation of the local action potential is described by the single-cell models discussed in Section 4 (see Figure 3C). The conductivity σ or diffusion D parameters highly depend on the connection between two cells, and it is determined by the gap junctions studied in Section 5 (see Figure 3D). And, finally, the spatial variation of the potential is determined by the tissue model employed, which is described in Section 6 (see Figure 3E) and corresponds to the extension to two and three dimensions of Equation (3).

2. Description of Ion Channels

Ion channels are proteins that allow the transport of ions across the cell membrane. They can be in an open, closed, or inactivated state with a probability of transition that may depend on voltage, ligand concentration, or stretch. The conductivity of the channel depends on the fraction of open channels. Thus, the current through N channels of a given type can be written as I ( V , t ) = N P O ( V , t ) i ( V ) with P O ( V , t ) representing the fraction of open channels and i ( V ) the current through a single open channel. This description is valid as long as the gating is not too fast or the potential difference across the membrane is not too large [39].
For a simple channel with open and closed states (see Figure 4A), the fraction of open channels follows the equation
d P o d t = P o P o τ ,
with P o = k + / ( k + k ) corresponding to the steady-state fraction and the time constant τ = 1 / ( k + + k ) . In equilibrium, k / k + = e Δ G / R T with Δ G representing the free energy change between the two configurations of the channel. Considering that Δ G depends linearly on the transmembrane potential V, then
P o = 1 1 + e α ( V V 1 / 2 ) .
The fraction of open channels, P o , changes over time, and the kinetics can be assimilated to the effects of a gate that either opens or closes with an increase in transmembrane potential V. This is the standard Hodgkin–Huxley formulation of gates [40]. Often, channels are described with a more complex set of states whose dynamics, in some cases, but not always, can be transformed into a formulation in terms of gates of the form described above [41]. A formulation in terms of states is also useful when considering stochastic dynamics for the opening and closing of the channels, since the rates can be transformed into probabilities of transition in a given time, resulting in a Markov chain. The stochastic dynamics can then be solved by several methods [42,43,44], including Monte Carlo simulations, or the Gillespie method [45]. A more detailed description of the dynamics of the ion channel gating and/or the ions going through it can be obtained using a Langevin formulation of the motion of the ions [46,47] or models of Brownian (BD) or Molecular Dynamics (MD) [48]. However, although these simulations can provide very important information on phenomena at the single-channel scale, they are too computationally expensive for incorporation into a full model of the cell.

2.1. Sodium Channels

Sodium channels form a large family of voltage-gated channels composed of alpha and beta subunits. The alpha subunits constitute the core of the channel, including the membrane-spanning pore that allows the transport of sodium ions, and they are responsible for the gating and ion selection functions of the channel. The beta are accessory subunits that modulate the function of the channel. The main alpha subunit present in cardiac cells is Nav1.5, which is encoded in the gene SCN5A.
The usual characterization of the sodium current, following the work by Hodgkin and Huxley [40], considers three gates: fast activation and inactivation gates, m and h, and a slow inactivation gate, j, that was introduced in later models [49,50]. The current is
I N a = g ˜ N a m 3 h j ( V E N a ) .
More detailed Markov formulations for this channel have been developed [51] (see Figure 4B) and applied to the study of several dysfunctions [52], as will be discussed in Section 4.1.1.
Figure 4. Different types of Markov models of ion channels. (A) Two-state ion channel. (B) Markov model of the Na+ channel with different conformations, from [51]. (C) Markov model of the L-type calcium channel (LCC) with different configurations and with the pathways of calcium-dependent inhibition (CDI) in red and voltage-dependent inhibition (VDI) in black from [53].
Biophysica 05 00005 g004

2.2. Potassium Channels

Potassium channels constitute an extensive family of channels that are present in virtually all organisms. They conduct K + ions down the electrochemical gradient and set the resting potential of the cell. Among the voltage-activated potassium channels, there are those responsible for the transient outward (fast and slow) potassium currents, I t o , f a s t and I t o , s l o w , which are responsible for the characteristic notch in Phase 1 of the action potential, especially visible in ventricular cells. Other potassium currents are the slowly and rapidly activating delayed rectifier currents, I K s and I K r , responsible for the repolarization of the cell, or the inwardly rectifying potassium channels, responsible for the current I K 1 , that passes current more easily into the cell (in the inward direction) than out of the cell. There are also calcium-activated potassium channels. In the heart, the most common are the small conductance calcium-activated potassium channels (SK), which are responsible for the current I S K . They are more prominent in the atria, and there is discussion on their pro-arrhythmic or anti-arrhythmic role [54].

2.3. Calcium Channels

There are several channels responsible for the flux of Ca2+ into the cell. The most prevalent calcium channel in cardiac myocytes is Cav1.2, which is a voltage-gated L-type calcium channel (LCC). They are responsible for the L-type Ca2+ current that introduces Ca2+ into the cell, triggering contraction and preventing rapid repolarization (especially in ventricular cells), giving rise to the dome of the action potential. A standard formulation of the current is
I C a L = g C a L d f f C a ( V V C a ) ,
where d and f are voltage activating and inactivating gates, respectively, and f C a is a Ca2+-dependent gate that accounts for the inactivation of the current with Ca2+. More complex Markov models of the channel have been formulated [53,55] (see Figure 4C) that cannot be reduced to a gate formulation. Even so, Markov models can be used to produce the same results as those obtained in models that use typical Hodgkin and Huxley gate dynamics [56]. Markov models of the LCC are also better suited to study subcellular phenomena, as will be explained in the next section.

2.4. Pumps and Exchangers

After the cell has repolarized, some pumps and exchangers return the ion concentrations to their original values. Among these, one can count the sodium-potassium pump current I N a K , the sarcolemmal Ca2+ pump current I p C a , or the sodium-calcium exchanger NCX, which is a membrane protein that removes calcium from cells. NCX uses the energy stored in the electrochemical gradient of Na+ by allowing Na+ to flow down its gradient across the plasma membrane in exchange for the counter-transport of Ca2+. A single calcium ion is exported for the import of three sodium ions, although the sense of ion flow can revert depending on transmembrane potential. The first formulation of NCX was proposed by Mullins [57], and it has been adapted and improved thereafter. More complex Markov models of the NCX [58] have also been derived.

3. Models of Intracellular Ca2+ Dynamics

From changes in membrane potential, triggered initially by sodium, as explained in the previous section, intracellular calcium signaling takes over as the key element to understand contraction in the heart [59,60]. The depolarization of the membrane potential opens up the L-type calcium channels (LCC), which let Ca2+ into the cell, triggering the release of more Ca2+ from the sarcoplasmic reticulum (SR), see Figure 5, in a process known as calcium-induced-calcium release (CICR) [61,62]. During diastole, the free cytosolic Ca2+ concentration stays around 100 nM, while the free SR Ca2+ content is around 1 mM. The opening of the LCC triggers a large release of Ca2+ from the SR. Ca2+ in the cytosol rises to 600–1000 nM and, in the process, binds to troponin C, which then neutralizes the effect of troponin I in the actin–myosin coupling [61]. This allows for the generation of active forces in the cell and, consequently, the muscle [63]. Then, Ca2+ is reuptaken by SERCA, and a small fraction is eliminated by NCX. In homeostatic balance, the inward calcium flux that enters via LCC channels is compensated by the extrusion via the NCX [64]. Equally important is the calcium balance due to the SERCA pump [65] which, using energy, pumps the calcium released by the cardiac ryanodine receptors (RyR2) back from the cytosol into the SR against the calcium gradient.
The release of calcium from the SR is regulated by clusters of Ryanodine Receptors (RyR2); see Figure 5. Organized in nanodomains placed in the membrane of the SR with a broad distribution of cluster sizes [66,67,68,69], each RyR2 has open, close and inactivated states whose transitions are tightly regulated mainly via Calsequestrin (CASQ2) and Calmodulin (CaM) [70,71,72]. The RyR2 clusters are located next to the LCC with a small dyadic volume in between [73,74,75,76]. The LCC channels are present in the invaginations of the membrane known as t-tubules, present in ventricular and, with lower density, in atrial cells [77,78]. The interaction between RyR2 nanodomains and their relation with LCC is the core of the function and possible dysfunction of intracellular Ca2+ signaling [61].
The fundamental unit of Ca2+ release is the Ca2+ spark, which is a small Ca2+ release from the SR into the cytosol via the RyR2. Under external stimulation, spark recruitment leads to a global Ca2+ transient. However, given the low number of RyR2 that are present in the nanodomain structures, RyR2 clusters can also open stochastically. These small sparks can lead to the opening of neighboring units generating larger sparks or localized releases and even Ca2+ waves. Calcium sparks can be behind a Ca2+ leak from the SR, which eventually depletes the calcium cell. Other local mechanisms can increase total calcium levels, such as stochastic openings of the LCC, or gains in CICR [79]. All these phenomena require a detailed subcellular description of intracellular Ca2+. For that, two main approaches have been taken [15]. In one, a discretization of the order of 1 μ m is considered, which corresponds roughly to the distance between z-planes in the sarcomere. Then, each discretized volume, or calcium release unit (CaRU), is divided into compartments. In another approach, the discretization is of the order of 50–100 nm. In this case, the relevance of Ca2+ compartments is not so evident, and some models just consider the dynamics of intracellular and SR Ca2+.

3.1. Models at the Submicron Scale

We begin with the group of models that describe the cell at the 50 or 100 nm scale [80,81,82,83]. At this scale, each discretization volume, or voxel, can be divided into the fraction occupied by the cytosol and the one occupied by the SR. Proteins involved in Ca2+ regulation (RyR2, SERCA, NCX, LCC) are then included in these voxels. Different structural approaches are possible regarding the fraction of volume occupied by the SR. A uniform approach, where SR is present in every voxel, is a highly plausible assumption given the complex internal structure and shape of the SR in cells. However, other approaches might leave some empty space where the mitochondria or sarcomere space, or other organelles, would be included.
The structure of such models is related to the location of the L-type calcium channels, the RyR2 clusters, and the NCX exchanger. These nanometer structures are distributed in the cell with a very specific pattern. LCC and the NCX exchanger are present in the t-tubules that are roughly 1.5–2 microns apart, forming the z-planes of the cell [68]. Therefore, most voxels are empty of NCX, LCC or RyR2, and only a subset of voxels include these proteins. The Z-plane, where LCC groups of 4–10 channels are included in a single voxel, can be roughly 200 nm wide, but they can penetrate all the way to the interior of the cell. In the Z-plane, LCC can be between 100 and 600 micron apart in a typical structure.
L-type calcium channels are co-located with RyR clusters. While the number of LCC in one voxel is around 5, the typical number of RyR in a cluster can be anywhere between 10 and 100 with a wide distribution (median typically around 40). This selection of voxel together with the possible distribution of the number of channels in each cluster provides the basic structure of the cell. A full picture of the cell must also include some RyR2 clusters which are not in the Z-planes and are not associated with LCC. There is a small fraction of RyR2 located close to the sarcomere, away from the Z-planes and the invagination of the membrane, without association with the LCC.
The basic structure of these models is a cycling dynamics with two compartments:
d c i d t = J L C C + J r e l J S E R C A J N C X J B u f f e r s + D i c i ,
d c S R d t = v i v S R ( J S E R C A J r e l ) J B u f f e r s + D S R c S R ,
where c i and c S R are the free cytosolic and SR calcium concentrations, respectively. The evolution of cytosolic calcium is determined by the SERCA pump and buffers in the cytosol, like CaM, SR binding sites, and troponin C (TnC), among others. Buffering dynamics has the following structure
d c b B U F F d t = J B u f f = k o n c i ( B b c b B U F F ) k o f f c b B U F F ,
but different quantities of buffers B b are introduced in different models.
NCX formulations are standard once the exchanger is considered to work at a steady state [84]. More differences appear regarding the voltage and calcium dependence of the entrance of calcium via L-type calcium channels J L C C and the type of regulation associated with the opening of the RyR2. In all cases, a fully detailed model must be stochastic given that the number of channels in each voxel is low.

3.2. Models at the Micron Scale

Other models take the Calcium Release Units (CaRUs) as the fundamental subcellular spatial description [65,85,86,87,88]; see Figure 5. When the details of small sparks and large sparks are not relevant, but a proper description of coordinated and uncoordinated behavior is the goal (normal beating, appearance of waves, alternans or EADs and DADs), this description is often more efficient.
Rectangular in nature, each voxel encompasses the distance between Z planes and then an average distance between RyR2 clusters within the Z plane (X-Y). This distance depends on the animal species. It can be anywhere between 300 up to 800 nm. In each voxel, five different compartments can be defined with the corresponding local calcium concentrations (see Figure 5). First, there is the dyadic volume close to the RyR2 cluster, which is considered to be unique in each CaRU, with its local concentration c d . L-type calcium channels are also located in this compartment and release calcium into it. Then, there is the volume close to the t-tubules, with a differentiated type of buffers and presence of the NCX, called subsarcolemma, with Ca2+ concentration c s . From the subsarcolemma, Ca2+ diffuses to the cytosolic volume associated with the CaRU, where most of the buffers are located, together with the SERCA pump. The corresponding Ca2+ concentration is c c . The two missing compartments are the sarcoplasmic volume, with concentration c S R , into which SERCA pumps Ca2+, and the local junctional SR, which represents the region in the SR close to each one of the RyR clusters with c j S R . The basic calcium cycling in each CaRU is the following
d c d d t = J r e l + J L C C J d s d i f f ,
d c s d t = ν d s J d s d i f f J N C X J s c d i f f + D l o c c s ,
d c c d t = ν c s J s c d i f f J S E R C A J B u f f e r s c + D i c c c ,
d c S R d t = ν c S R J S E R C A J S R j S R d i f + D S R c S R ,
d c j S R d t = J S E R C A + J S R j S R d i f + ν j s r d J r e l J B u f f e r s S R ,
where we have included diffusion between compartments J d s d i f f , J s c d i f f , and J S R j S R d i f as well as diffusion between the cytosol and the SR of neighboring units and the corresponding volume factors ν d s , ν c S R , ν c s and ν j s r d . We include also here diffusion between subsarcolemma spaces. This diffusion is, in theory, possible between neighboring CaRUs within the X-Y plane, but it is not at all clear that it exists in the longitudinal direction across Z-planes. Including this diffusion across planes is more often than not a trick that allows calcium waves across the cell more robustly, as there are no connections between all Z-planes in all CaRUs. The tubular structure in this case is key. There are certainly some longitudinal tubules across the cell. Diffusion across subsarcolemma should be associated with the presence of longitudinal t-tubules.
A key element of these models is the RyR2 behavior fixed by J R e l , which in most models reads
J R e l = g r · O R y R ( c S R c i ) ,
where the flux through the RyR2s is just proportional to the difference between calcium concentration in the cytosol and the SR provided the receptor is open. The number of states of the RyR2 and the transition rates between them is a core part of any subcellular model. RyR2 opens due to increases in cytosolic Ca2+ necessarily in a stochastic manner given the low number of receptors in each RyR2 cluster. Although the number of internal states of a RyR2 can be high, effective models with just four or three states are normally used: inactivated, close and open.
The binding sites of Ca2+ on the side of the RyR2 that faces the cytosol are universal in all models, although the cooperativity of these binding sites is not standard. Another common feature is the regulation of the opening rate by luminal calcium. The cooperativity of this binding and levels in the reduction of the opening rates vary. Finally, a new regulation by CaM has been pretty well established in animal models in recent years. Experiments in mice [71] have indicated that the RyR2 is indeed strongly affected by the presence of CaM. When cytosolic calcium increases and binds to calmodulin, this complex inactivates the RyR2.

3.3. Scaling-Up Subcellular Models

Subcellular models have been systematically used for most purposes, since they are computationally treatable to study full cells during thousands of beats. This way, they can reach steady-state conditions in sodium and potassium concentrations, which is needed to study the behavior of the cell. These models cannot, however, be used to develop full models of the heart. Even simulations of cell tissue present difficult computational costs. A typical tissue simulation of 100 × 100 × 10 cells, each discretized in ∼104–105 CaRUs, is non-feasible except at a supercomputer. A full heart model using a distributed Ca2+ model of each cell is out of the scope computationally.
For full tissue models, one needs to use cell models that consider average Ca2+ concentrations. A very common approach for decades has been to use the five-compartment model described in the previous section but considering that they represent an average of the concentrations in each one of the CaRU.
This means that most currents have to be re-normalized or re-scaled from previous models. Subcellular models cannot be transformed lightly into single whole-cell models [56]. For instance, in any subcellular model, given the low number of LCCs in each voxel or CaRU, the transitions between configurational states of the LCC must be considered as a stochastic process. It is important, however, that this flux fits the experimental results at a large number of channels. The typical whole cell current associated with the LCC can be measured as a function of membrane potential, and the same curves must be obtained from the dependences introduced in the transition rates.

4. Cardiac Cell Models

Since the pioneering work by Hodgkin and Huxley [40], most electrophysiological models of the action potential have been based on a similar description. The first cardiac model was due to Noble in 1962, for Purkinje fibers [89]. Later on, Beeler and Reuter [49], in 1977, presented a model for ventricular cells. Then, specific ventricular models for different animal species were developed, as for guinea pig [50,90], dog [91], rabbit [92], mouse [93], and human [94,95,96]. Similarly, models for other parts of the heart, such as the atria [97,98] or the sinoatrial node [99], are available.
All these models include detailed descriptions of the currents that give rise to the action potential (see Figure 6), including, in some cases, a Markov formulation of the ion channel dynamics [96]. They include a large number of variables, from 10–15 to more than 50 in the more detailed models. It is important to stress that classical models of cardiomyocytes are common-pool models; that is, they present deterministic dynamics for average concentrations of intracellular ions. They cannot adequately describe some phenomena, such as the possible appearance of Ca2+ waves or the occurrences of EADs and DADs resulting from stochastic events of spontaneous Ca2+ release; see Section 3. For that, models that couple a standard description of the transmembrane potential and currents (except typically LCC, as explained before) and subcellular detailed models of Ca2+ dynamics have been developed. These have been useful to study, for instance, the occurrences of DADs [100] or mechanisms of spontaneous Ca2+ release-mediated arrhythmias [101]. However, these models are hardly scalable for tissue simulations. For that, other approaches have been developed that reduce computational cost but maintain the inherent stochasticity of the Ca2+. For instance, introducing the probabilistic distribution of spontaneus Ca2+ release events [102,103] in classic five-compartment calcium cycling models has been one very interesting path to make the jump from subcellular to whole heart. Another approach that decreases computational cost has been to consider a probability density approach for modeling the local control of CICR [104].
Although electrophysiological detailed models provide a very precise description of the electrophysiology of the system and allow a quantitative comparison with experiments, they can be computationally demanding, especially for tissue simulations. Often, to study properties of wave propagation, or instabilities that encompass different currents, such as alternans, simplified models of the action potential have been studied. One can distinguish between two kinds of simplified models. On the one hand, there are physiological models, such as the three-variable Fenton–Karma model [105] and modifications of it [106,107], that group the different currents into inward and outward and provide phenomenological expressions for these global currents. They reproduce the typical form of the action potential and general properties of the action potential as its restitution properties. Still more simplified models [108,109,110], with just two variables, but still a reasonable form of the action potential have been useful to study properties of reentrant waves in tissue as spiral or scroll wave instabilities.

4.1. Action Potential Dysfunctions

In addition to possible problems in action potential wave propagation, which will be discussed in Section 6, sometimes, abnormal rhythms or behavior is due to some problems in the generation or dynamics of the action potential, giving rise to channelopathies, alternans, or early or delayed afterdepolarizations (EADS and DADs), which provide a proarrhythmic substrate.

4.1.1. Channelopathies

Abnormal functioning of different ion channels can cause disease, often leading to arrhythmias. Among the most common syndromes associated with channelopathies are the long QT syndrome (LTQS), the short QT syndrome (SQTS), and the Brugada syndrome.
The long QT syndrome is a condition that affects the repolarization of the heart, resulting in an elongation of the QT segment of the electrocardiogram (ECG). This is linked, at the cellular level, to a large action potential duration (APD). Clinically, it has been shown to give rise to arrhythmias. There are several variants of the syndrome, which are related to different channelopathies. LQT type 1 (LQT1), for instance, is related to variants in the gene KCNQ1 that decrease I K s , slowing the repolarization of the action potential. LQT2 is caused by variants in the KCNH2 gene that encodes the potassium channel that carries the rapid inward rectifier current I K r . This current contributes to the terminal repolarisation phase of the cardiac action potential and, thus, to the length of the QT interval. One variant of this syndrome, LQT3, is known to be related to variants in the SCN5A gene that delay the inactivation of the sodium current, leading to a small sustained ‘late’ sodium current, preventing repolarization [52]. A Markov formulation of the Na+ channel was considered, for example, to account for mutations responsible for the long QT syndrome [51]; see Figure 4.
The reverse of LQTS is short QT syndrome (SQTS), which is characterized by a shortening in the duration of the QT interval in the ECG. It is caused by mutations in genes encoding ion channels that shorten the cardiac action potential and results in an increased risk of developing abnormal heart rhythms. This is a very unusual condition that has been associated with variants of genes encoding the currents I K s , I K 1 , I K r , and I C a L .
Brugada syndrome (BrS) is another genetic disease that produces well-recognized changes in the electrocardiogram, which are characterized by an elevation of the ST-segment terminating in a negative T wave in the right precordial leads. Since its discovery in 1992, Brugada syndrome has been linked to many different mutations, including genes affecting the Na+ and Ca2+ channels [111]. The most common cases of Brugada syndrome are those related to mutations in the SCN5A gene [112]. These mutations have been shown to result in loss of function of the sodium channel, giving rise to either reduced Na+ channel conductance or a change in the voltage dependence and dynamics of I N a activation, inactivation, or reactivation [113]. Then, a reduced sodium current reduces the peak voltage in Phase 1 of the action potential, see Figure 2, such that the slow activated potassium current entering in Phase 2 is able to repolarize the cell, lacking then the typical dome of the AP and resulting in a very short AP. Other variants exist that are related to modifications of other genes encoding other proteins that constitute the sodium channel, or in genes affecting other currents, such as I C a L , I t o , or I K i r . In all cases, the resulting AP morphology can give rise to a strong proarrhythmic substrate that most probably appears when the action potential dome is lost at some epicardial sites but not at others, thus resulting in the dispersion of repolarization within the epicardium.

4.1.2. EADs and DADs
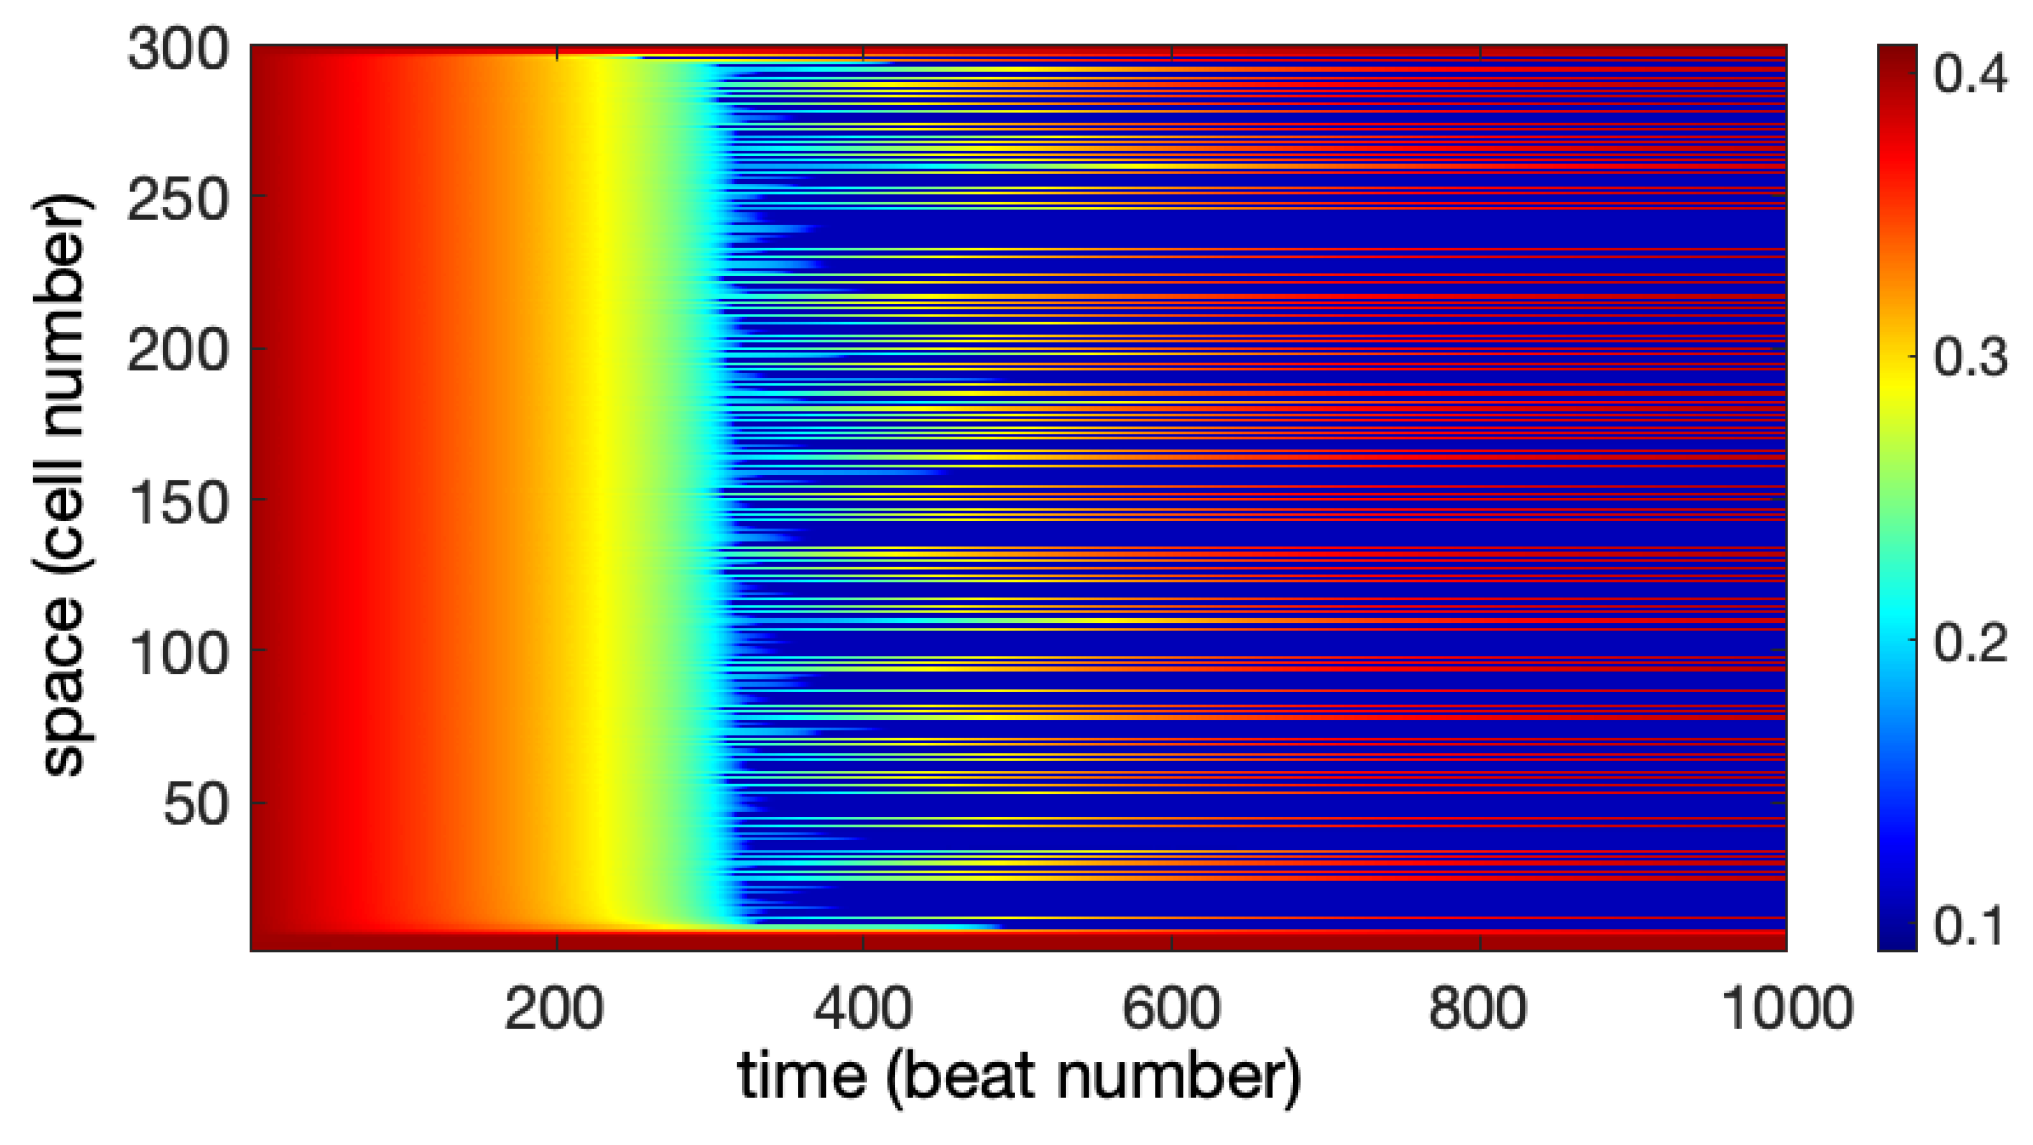
Afterdepolarizations are abnormal depolarizations of the cell that occur before the following stimulus arrives. Early afterdepolarizations (EADs) occur during Phases 2 or 3 of the action potential, see Figure 2, i.e, before the cell has completely repolarized, while delayed afterdepolarizations (DADs) occur during Phase 4, see Figure 2, after repolarization but before an external stimulus arrives. Both conditions are known to be highly proarrhythmic. DADs are often due to spontaneous Ca2+ releases from the SR. EADs appear when outward currents are reduced and/or inward currents are increased, resulting in the lengthening of action-potential duration (APD). EADs appear as oscillations of the membrane potential. It is not linked to a specific channelopathy, but rather, it results from the interplay of several mechanisms. It has been explained as an instability of the membrane potential due to different bifurcations [114,115,116].
The generation of arrhythmogenic ectopic beats and premature ventricular complexes (PVCs) due to the interaction between anomalous calcium cycling and sodium currents has been well established [9,10,11]. Mathematical modeling has shown that a malfunction in calcium cycling can trigger action potentials at the single-cell levels, both as EADs and DADs [15,16]. The main mechanism is the generation of large spontaneous releases of calcium into the cytosol that activate the NCX exchanger and trigger the depolarization of the cell. These cellular level events have to synchronize to generate an ectopic excitation, since they have to overcome the electrotonic load of neighboring cells [117]. The generation of these ectopic beats is not dangerous in a healthy heart, but it can generate sudden cardiac deaths if there are underlying pathologies such as heart failure (HF). Spontaneous Ca2+ release events and a disruption of Ca2+ homeostasis has also been shown to be related to atrial fibrillation (AF), which is a condition where the atria do not contract properly but fibrillate, preventing the proper pump of blood from atria to ventricle [17,18,19].

4.1.3. Alternans

Clinically, alternans correspond to a beat-to-beat alternation of the T-wave of the ECG, which is well known to be proarrhythmic. At the cellular level, an alternan appears as a beat-to-beat change in the amplitude or duration of the action potential. As with EADs, alternans are not linked to a specific channelopathy but rather a dynamic condition involving several factors [118]. From a dynamic point of view, it has been explained as a period-doubling bifurcation of the underlying, regular rhythm, appearing at fast pacing rates. In some cases, this is due to the restitution properties of the cell, i.e., the dependence of the duration of the action potential on the time elapsed between the end of the previous AP and the beginning of the following one. A steep relation has been shown to give rise to this period, doubling instability [119], although memory [120] or spatial effects [121] can make this relation more complex. Often, however, alternans appear as an instability in intracellular Ca2+ cycling [122], whose dynamics has to be considered in detail. Calcium alternans have been related to refractoriness of release [123,124], due to a slow refill of the SR, or to a slow recovery from inactivation of the RyR2 [71,125,126]. Subcellular effects are also important in the onset of Ca2+ alternans, where there is a beat-to-beat alternation in the Ca2+ release from the SR. The onset of alternans can be understood as a disorder–order transition [127], where locally alternating releases of Ca2+ synchronize to give rise to global alternans. Furthermore, the ensuing alternans can be discordant subcellularly with different parts of the cell alternating in opposite phase [128].

5. Intercellular Coupling

Cardiac connexins are essential proteins involved in the functional architecture of the heart. They are found in intercalated discs of cardiac cells, forming gap junctions that facilitate electrical and biochemical communication between cells, see Figure 7, which is crucial for action potential propagation and synchronized heart contractions; see Section 6.
In cardiac tissue, Connexin 43 (Cx43) is the predominant connexin in ventricular myocytes and plays a critical role in the propagation of electrical impulses. Mutations or dysfunctions in Cx43 are frequently associated with arrhythmias. Other connexins are distributed in specific cardiac regions: Connexin 40 (Cx40), is essential for rapid conduction in the atria, and Connexin 45 (Cx45) is important in specific regions requiring a more gradual and slower signal transmission of the conduction tissue. Disruptions in the expression or function of the connexins have been implicated in various cardiac pathologies, including myocardial infarction, arrhythmia, and heart failure.
In cardiac tissue, adjacent cells are joined through gap junctions, as shown in Figure 7, which allow the transport of ions between cells, resulting in diffusion of the transmembrane potential. A detailed description of electrical wave propagation needs to take into account the gap junction (GJ) dynamics, which have been well characterized experimentally [129,130,131,132,133].

5.1. Experimental Data and Stochastic Model

Two important results come from the biophysical experiments on gap junctions. First, the value of the electrical conductance between two adjacent cardiac myocytes depends highly on the transmembrane voltage V j . Secondly, the conductance is also a dynamical variable and its kinetics depends strongly on the history of the transmembrane voltage V j [130].
In parallel with the development of careful biophysical experiments, several mathematical models have been built to explain the experimental data of the conductance of the GJ. The first mathematical models of voltage-dependent gating in GJs were published in the 1980s by Bennett, Harris, and Spray [134,135,136]. These first models were based on a Boltzmann function that was applied to each polarity of the transjunctional voltage V j to describe the overall steady-state g j V j relationship [134,135,136]. Subsequently, this type of analysis became a standard way to quantify the sensitivity of GJs to the transjunctional voltage V j . A mathematical model to describe the kinetic properties of GJ voltage-dependent gating was also provided in [136]. The changes in g j over time were evaluated using a two-state model (so-called independent gating model) and a three-state model (so-called contingent gating model), which described the opening and closing of GJ channels containing two mirror-symmetrical gates in series. It is important to note that these modeling studies were performed well before the experimental identification of Connexin (Cx) genes and a detailed knowledge of the varied properties of GJ channels at macroscopic and single-channel levels.
Later, biophysical, molecular, and structural studies have revealed a number of properties of GJ channels that are important for the development of computational models. Mostly, GJs are formed by the docking of two hemi-channels that can be composed of a single or mixed combinations of Cxs, and it is the individual hemichannels that gate in response to V j and give rise to the overall behavior of a GJ channel. In this line, four-state models [129,137], a stochastic four-state model [138], a 16-state model [139], and a 36-state model [140] have been tested against experimental data. However, detailed microscopic stochastic models of the GJs conductance are computationally expensive, and it is often more convenient to use a simplified two-state system when dealing with large cardiac tissue.

5.2. Dynamical Model

The spread of excitation in networks of electrically coupled cells, either in cardiac or neuronal cells, can be studied by two-state models. Particularly, the inclusion of GJ dynamics was investigated by Hand and Griffith [141] combining a multiscale approach with microstructural details and macroscopic features of the tissue. Similarly, Costa et al. [142] developed a semi-continuous model to describe the propagation of electrical signals within cardiac tissue, incorporating GJ dynamics. Another modeling perspective considers the heart as a network of different cell types that are electrically coupled through gap junction conductance [143].
Due to the inclusion of GJ dynamics, for example in a monodomain model of cardiac tissue, see Section 6, the conductivity of the cable equations, see Equation (3), becomes a function of both space and time,
σ ( x , t ) = σ ¯ g x ( t ) ,
where σ ¯ is the fixed nominal value for the intercellular conductivity parameter.
In a one-dimensional chain of cells, when discretizing space to solve the cable equation shown in Equation (3), the index k refers to the cell number k in the fiber. The gap junction between cell k and cell k + 1 is also assigned the space index k, following our convention. The set of differential equations governing GJ dynamics is written as [130,144]
d g k d t = g k , s s ( V k ) g k τ g ( V k ) ,
where the time scale is given by τ g = A τ exp [ B τ | V k | ] , and V k = u i k + 1 u i k is the difference in the intracellular electrical potential between the two adjacent cells. The local steady state value in Equation (18) depends on the local instantaneous V k following the two-state Boltzmann type of equation:
g k , s s = g k , m a x g k , m i n 1 + exp [ A ( V k V 1 / 2 ) ] + g k , m i n .
The dependence of g k , s s as a function of the transjunctional potential V k is displayed in Figure 8. Note that the asymmetry of the connexin composition affects directly the asymmetry of the steady-state function of the gap junction g k , s s .
We should mention two important caveats of this simple model. First, there is the implicit assumption that the myocytes are isopotential, and therefore, the voltage drop is concentrated in the GJ, and second, there is the use of a monodomain approximation that could not independently compute the transjunctional voltage from the membrane potential.
Recent experiments have shown that the functional dependence of g k , s s on V k could be affected [133,145] by several factors. This is important to consider in the present model: for example, after an increase in temperature, it has been observed that the value of A in Equation (19) increases, V 1 / 2 decreases, and gating kinetics accelerate (cf. τ g decreases) [133]. In another study, a variation in the dependence of the conductance with the intercellular potential has been observed in connexin 45 variants, in which two amino-terminal ends have been altered [145].
All these effects can be easily included in the present model. Indeed, assuming an effective free energy difference between the open and close states that depends linearly on the transjunctional potential,
Δ G = Δ G 0 + α V k .
where the parameter α takes into account the dependence of the probability transition with respect to the transjunctional electrical potential. One can relate the parameter α in Equation (20) with the parameters A and V 1 / 2 in Equation (19). The larger α is, the narrower and steeper is the curve in Figure 8. For this reason, we have denoted α as the factor of shrinking in several computational studies that we have performed on the GJ dynamics [146,147]. The important point here is that either physiological or genetic conditions could affect the GJ dynamics through the modification of the parameters in Equation (19).

5.3. Modeling Studies of GJ Dynamics in Cardiac Tissue

Other studies consider a diminished Cx43 connexin expression, as well as altered connexin conductance dynamics, i.e., modified maximum and minimum conductances g m a x and g m i n , half-inactivation voltage V 1 / 2 and decay kinetics [148]. These modifications can appear due to mutations or to different connexin configurations. Following this consideration, the GJ dynamics were compared when encapsulated in a monodomain or bidomain tissue formulation [149]. Under very strong alterations of the gap junction parameters, the cardiac tissue can experience an irreversible remodeling [146,147]. To this day, quantitative comparisons of the numerical predictions and the experimental results are still lacking.
The most striking feature revealed by the previous studies is the emergence of conductance multistability induced by the shrinking factor (Figure 9). After typically a few hundred excitations, a spatial conductance heterogeneity emerges. The spatial distribution of conductance is highly irregular but shows a significant number of alternating high and low values of the conductance [147].
A computational model that included the gap junction voltage and time-dependent dynamics in a strand of cardiac tissue has been also considered [150]. Such simulations showed that in normal conditions, i.e., when the cells are well coupled, little change occurs in the gap junction resistance during propagation. For poor coupling, the gap junction resistance increases transiently and significantly during propagation. This transient change in resistance resulted in increased transjunctional conduction delays, changes in action potential upstroke, and a block of conduction at a lower junction resting resistance relative to a static gap junction model. In this case, one can see the important phenomenon of plasticity and remodeling taking place as demonstrated through the use of numerical simulations.
Novel computational models combine voltage-gating GJ channels with a model of membrane excitability to simulate a spread of electrical pulses in a two-dimensional cardiac tissue [151]. The simulation data showed that the inclusion of voltage gating can cause the drift and subsequent termination of spiral waves of excitation. As a result, the development of fibrillation-like processes was significantly reduced in the simulations, demonstrating the protective role of voltage-gated gap junctions in preventing arrhythmia. Further studies that incorporate the heterogeneities plus the GJ dynamics are needed to increase further the realism of the computational models.

6. Biophysics of Cardiac Tissue

Cardiac tissue is formed by a network of cardiac myocytes connected by gap junctions. Scattered among the myocytes are fibroblasts, which are, paradoxically, the most common cell type in the heart. Both types of cells coexist in the cardiac muscle. However, while the function of the fibroblast is related with the support and gives structural framework to the tissue, the myocytes, connected by GJs, see Section 5, are responsible for the propagation of the action potential along the cardiac muscle.
There are different levels of description of cardiac tissue that differ in the types of applications of the mathematical model. For the characterization of small-scale details, where local anomalies are relevant, models of individual cells (heterogeneous and discrete) are necessary to describe the different inhomogeneities: for example, the disconnection of the network of myocytes by the presence of fibroblasts, which can be increased by dysfunctions like diffuse fibrosis. However, for the description of the tissue at larger scales, arriving to the whole organ level, continuous models (monodomain or bidomain), which average the small scales inhomogeneities, are usually employed.
The effect of fibroblasts in the propagation of action potential through the cardiac myocytes is still controversial. It is known that fibroblasts can connect one-dimensional chains of myocytes and permit wave propagation [152], since, although they are unexcitable cells, they are electrically coupled to the myocytes. However, they can affect the excitability and conduction of the myocyte tissue [153] and the mechano-electric coupling of the tissue [154] as experiments with cell cultures [155,156,157] and whole heart [158] have evidenced. For the mathematical description of such interactions, two main approaches have been extensively employed. First, fibroblasts were considered passive and modeled as an ohmic resistance connected to the myocyte [159]. Second, fibroblasts are considered active because of the presence of membrane ion channels affecting membrane potential and therefore their interaction with the myocytes [154,160,161].

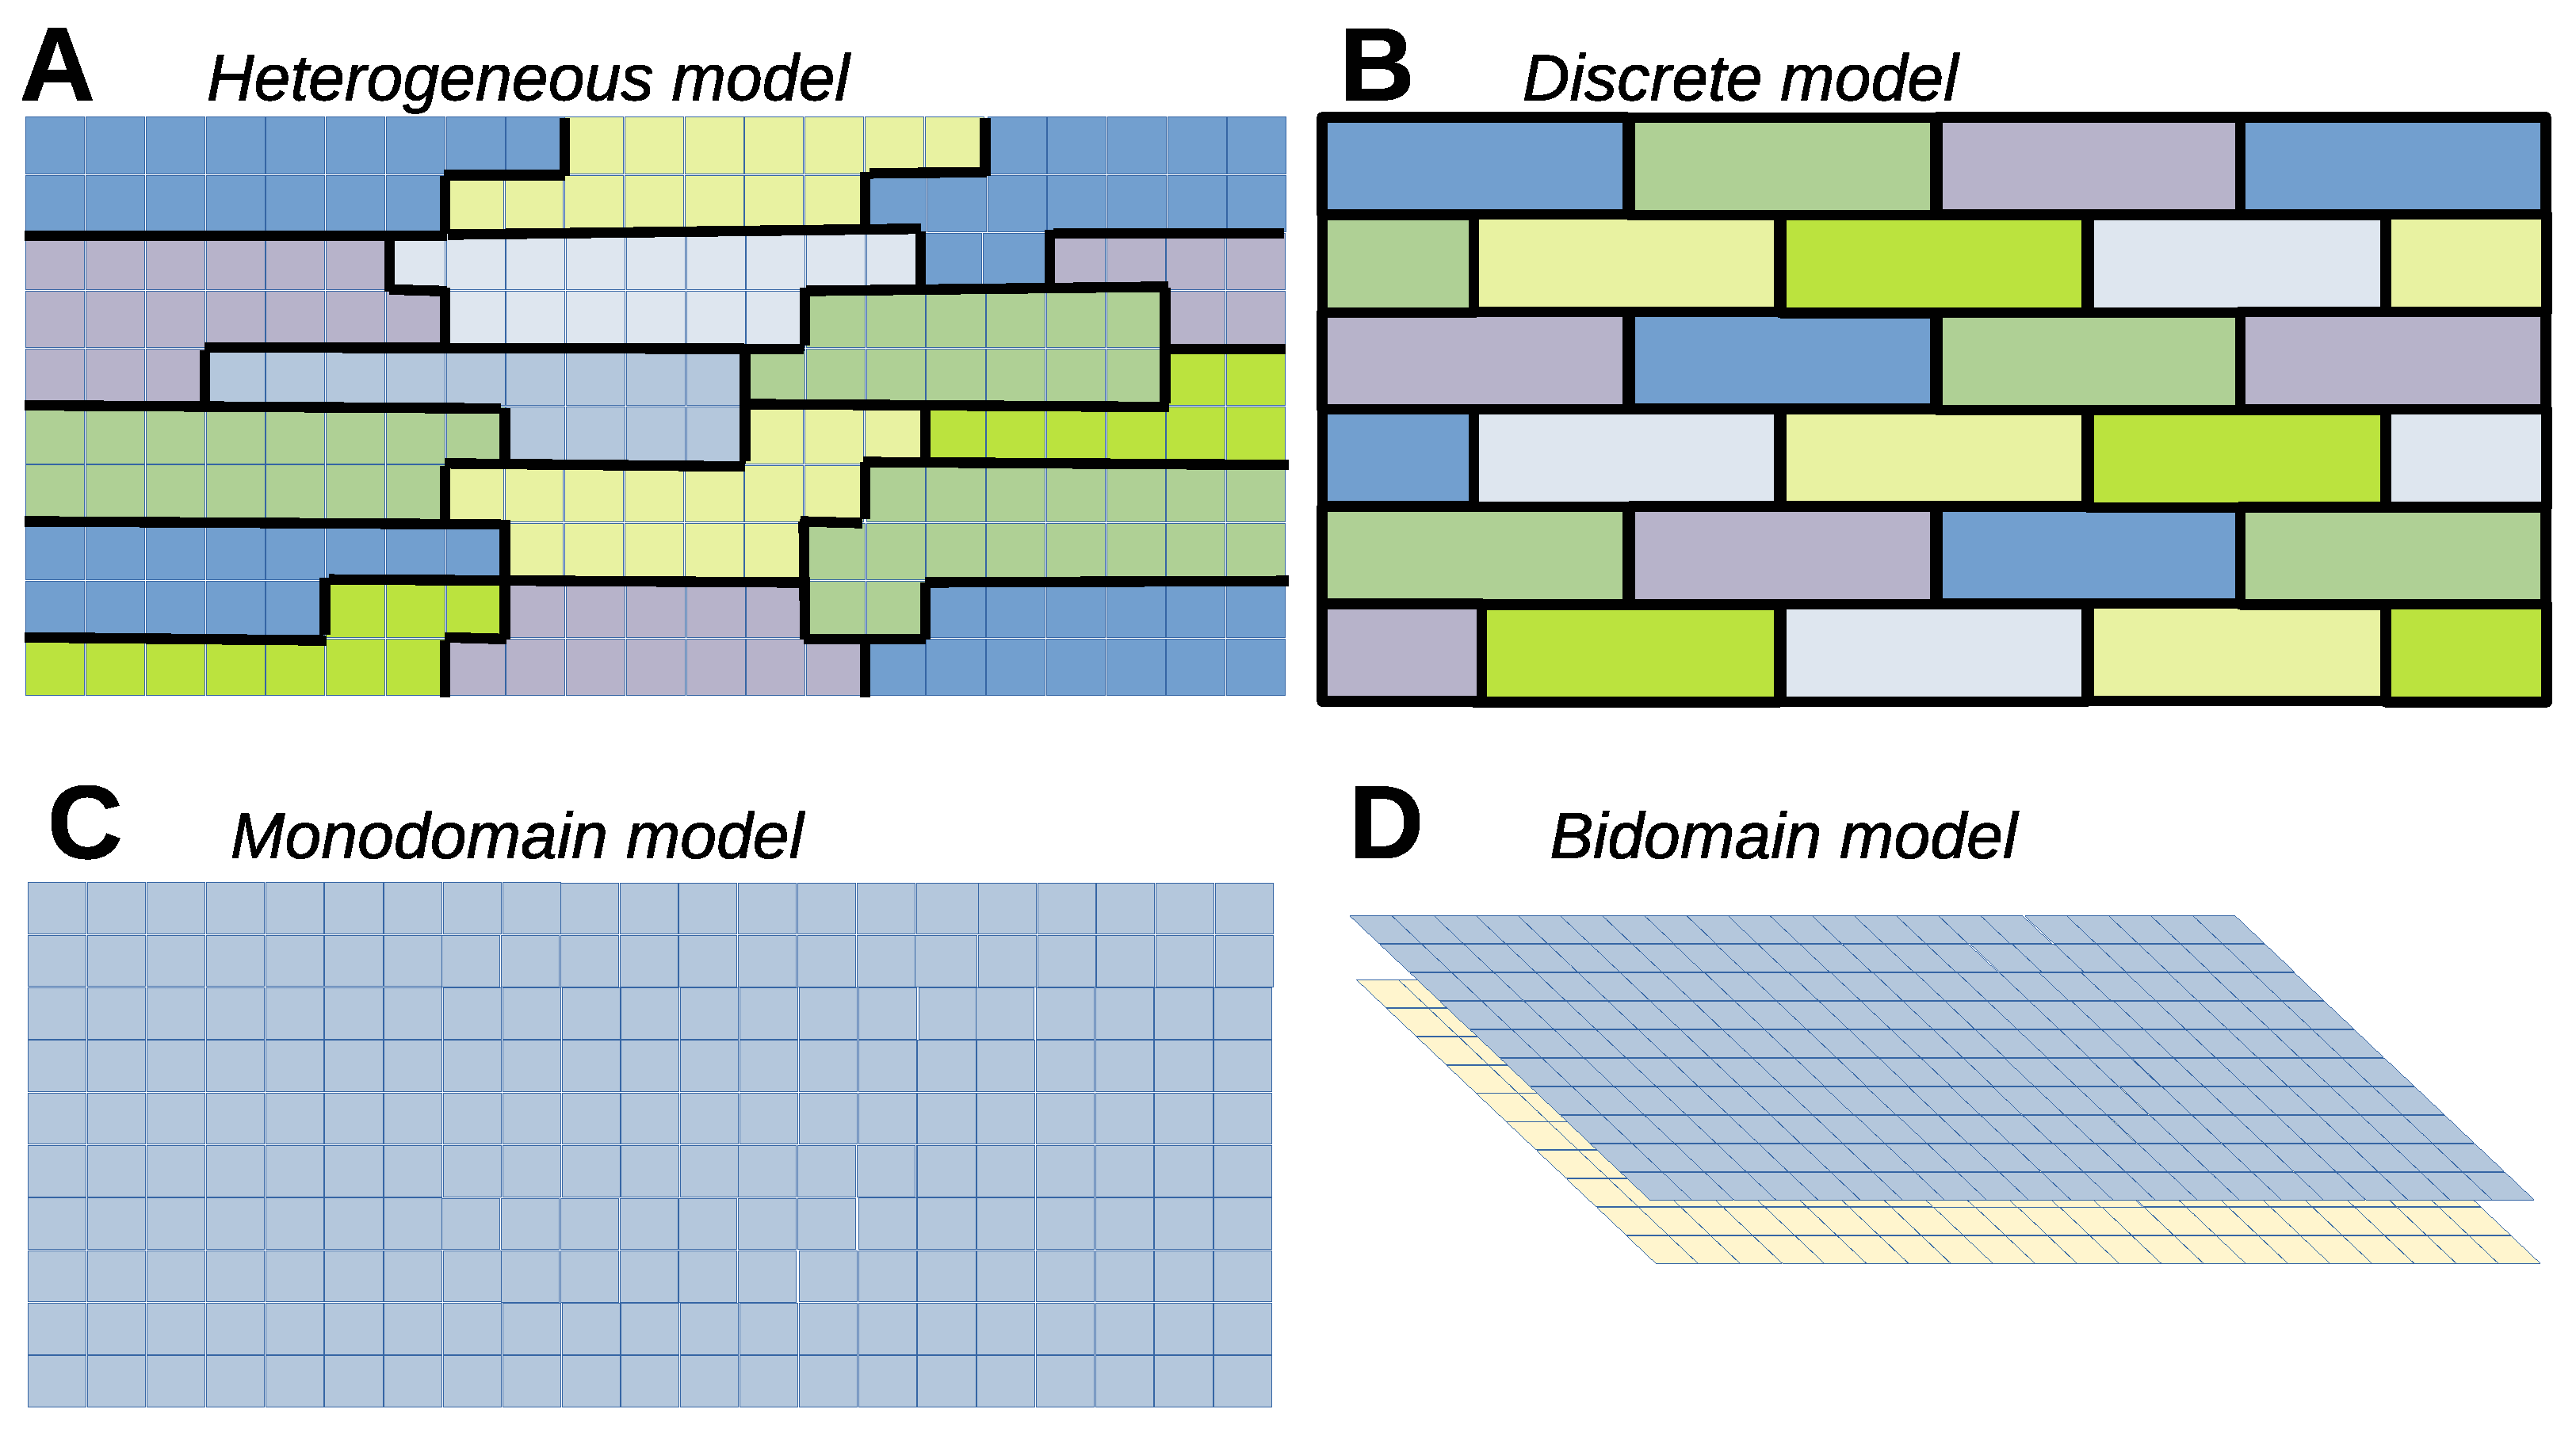
6.1. Heterogeneous Model

The most detailed models of cardiac tissue consider certain levels of detail in the description of the intracellular dynamics together with the corresponding model for the gap junctions, see Section 5, which connect the diverse cells; see Figure 10A.
The local detailed electrophysiological dynamics, see Section 4, is modeled inside the intracellular space of individual cells. A fine discretization is needed. Each element is much smaller than the characteristic size of the cells, which is typically between 5 and 10 microns. The shape of the cells can be heterogenous as in Figure 10A, or regular, formed by rectangular cells without big noticeable changes on the propagation properties [162]. Inside the cells, fast diffusion of the transmembrane potential is coupled with the detailed electrophysiological model [163]. On the other hand, there are neighboring elements that belong to different cells and therefore are not connected by diffusion but by gap junctions; see Section 5. The types and conductivities of the gap junctions may depend on whether they are located in the longitudinal or the transversal direction of the tissue [164,165].
These types of models are easy to modify to include defects and regions where the wave of action potential cannot enter due, for example, to inhomogeneous distributions of connexins [166]. Such inhomogeneities can give rise to conduction blocks [166] and, under certain conditions, the breakup of the action potential wave and the generation of cardiac reentries [167].

6.2. Heterogeneous Cell Model, Continuous Extracellular Potential

Apart from the difference of potential considered above, it is also relevant to consider the extracellular and the intracellular potential. For this reason, we can consider the extracellular (E) space, the cell membrane (M), and the intracellular (I) space, as separate geometrical domains [168]. As an example, we consider a chain of connected myocytes. We assume that the complete computational domain consists of intracellular spaces Ω k , with k = 1, …, N, where k and N are, respectively, an individual cell and the total number of cells. Two consecutive cells k and k + 1 are connected by gap junctions g k , see Equation (18) in the previous section, and surrounded by a connected extracellular space Ω e [169]. If σ i and σ e are the conductivities in the intracellular domains Ω k and the domain Ω e , we can consider [169]
· σ i u i k = 0 ,
· σ e u e = 0 .
The membrane is defined to be the intersection between the intracellular and the extracellular domains, where there are ion currents
C m V k t = I m k I i o n k ,
where V k is the membrane potential of cell k. Finally, the current along the gap junctions corresponds to the dynamics of the difference of potential g k between two consecutive cells k and k + 1 , equivalent to Equation (18), and follows
C k g k t = I k I g a p ,
such equations with the corresponding boundary conditions can be integrated using the different possible methods [168].

6.3. Discrete Model

We have already shown the process from the intracellular models, described in Section 3, into a single electrophysiological model, see Section 4. If we consider a fast diffusion process inside the cell, we can consider globally the action potential of the cell and with the gap junctions with the other cells; see Section 5. Such connections represent a network of myocytes which can be affected by heterogeneities or even interrupted by the presence of fibroblasts [170,171,172]:
C m V k t = I i o n + j g k j ( V k V j ) ,
where V k is the action potential of the corresponding k myocyte, while I i o n corresponds to the ion current and completely depends on the electrophysiological model. There are multiple types of models depending on the type of cell, the part of the heart, and the animal species. The connectivity matrix given by g k j couples each cell k to the neighboring cells j. The particular values of this matrix define the structure of the network of connections of the tissue. It can be hexagonal, see Figure 10B, or square, depending on whether a cell is connected to four or six neighboring cells [170,173]. The extracellular potential can be also included in the exterior of the cells and combine this discrete configuration in terms of a Kirchhoff network of cells with the extracellular potential [174].
The discrete models can explicitly consider also two different types of cells, for example, cardiac myocytes and fibroblasts with very different electrophysiological properties [175]. However, big differences are not obtained in comparison with the previous models where fibroblasts are incorporated in the reduction in the coupling between myocytes [170]. In this last case, a propagating wave can cross a circular region with a low fraction of disconnected cells; see Figure 11A. However, it cannot enter into this region if the fraction is too large; see Figure 11C. For intermediate values of the fraction of disconnections close to the percolation threshold of the discrete networks representing the tissue [170], the wave enters and breaks inside, giving rise to the re-entry once the original wave has propagated; see Figure 11B.
Such dynamics mimics the generation of ectopic beats in the cardiac tissue because in the heterogeneous network, source–sink mismatches produce unidirectional propagation block [166] and have an important role in the generation of the zigzag reentries [162]. Similar results have been observed for different descriptions. The network can be also disordered and heterogeneous following some particular rule [171,176,177] in two dimensions, or we can also generalize into a three-dimensional heterogenous cubic network of cells [178,179]. More complex geometries, taking into account the shape of the heart and thickness of the cardiac walls, can also be considered [12].

6.4. Continuous Monodomain Model

The cable equation, together with the highly nonlinear dynamics of the action potential, describes the electrical excitation that propagates through the heart. Although cardiac tissue is three-dimensional, many properties of propagation can be studied in lower dimensions. For example, the characterization of the conduction velocity depending on different electrophysiological properties or the dispersion relation during periodic pacing can be analyzed in one-dimensional systems, and the characteristic frequency of rotors can be obtained in two-dimensional domains.
The continuous limit of the propagation of the transmembrane potential, see Figure 10C, is described by the following equation:
C m V t = I i o n + · ( σ V ) ,
where the typical value of the membrane capacitance is C m 1 μ F/cm2. The conductivity σ 4 mS/cm is derived from the resistivity between cells and is related to the diffusion through the cell capacitance and surface-to-volume ratio [24,38].
This type of description is not suitable to study the effects of myocyte heterogeneity in wave propagation, especially at the 100 micron scale. It is more adequate for larger-sized regions where continuous gradients on the different parameters can be introduced. It can also be used to study wave instabilities in homogenized tissue. For example, under a convenient perturbation, a wave of action potential propagates through the tissue as a traveling wave, as depicted in Figure 12A.
The monodomain model has been extensively employed in the numerical study of two-dimensional spiral waves and three-dimensional scroll waves. In particular, it is adequate to characterize the dynamics of wave propagation and the posterior break up of the wave into spiral waves, which is typically associated with tachycardia regimes; see Figure 12B. The monodomain model has been also employed for the characterization of the properties of motion of the different spiral waves [180] and in particular the possible further break up into multiple spiral waves, which is a state typically related to fibrillation [180,181]; see Figure 12C. Among the different mechanisms of formation of spiral waves, one of the most studied is due to the alternance of long and short waves due to the interaction between two subsequent waves [182]. Such alternans produce the break up of the waves and the generation of multiple waves [121]. Another prominent example has been Brugada syndrome, where heterogeneity in repolarization leads to Phase 2 re-entry [113]: a condition in which the appearance of regions where the AP has not lost the dome re-excite regions that have lost the dome [183], resulting in the formation of rotors [184,185]. Ventricle walls are thick and, therefore, the waves of action potential, instead of moving like spirals, move forming scroll waves. In contrast to two-dimensional spirals, three-dimensional scroll waves can be unstable due to negative filament tension [186,187] or due to spring instability [188].
Large-scale heterogeneities can be included in the continuous description, and it is known that the heterogeneities act as wave sources when the tissue is exposed to the electric field during defibrillation processes. It permits the systematic study of different protocols of low-energy defibrilation due to repetitive low-energy pulses in comparison with the typical unique strong pulse employed during ventricular defibrillation [189,190]. The studies of different amplitudes and frequencies can be important to maximize the effectiveness of the defibrillation and the reduction of the tissue damage [191].

6.5. Bidomain Model

The bidomain model is based on the cable equation [192]. Cardiac tissue is divided into two different regions that are interconnected, the intra- and extracellular regions; see Figure 10D. The transmembrane potential is considered to vary along the tissue and, due to these variations, intra- and extracellular axial currents per unit length appear due to different properties of the conductivities σ i and σ e of the internal and the external region, respectively:
ψ ( C m V t + I i o n ) = · ( σ i V ) + · ( σ i V e ) ,
· ( ( σ i + σ e ) V e ) = · ( σ i V ) ,
where ψ is the ratio of surface to cell volume. In case the anisotropy ratios are the same in the intracellular and extracellular media, the above description can be reduced to the monodomain equation for the transmembrane potential; see Equation (26).
The bidomain model is more computationally demanding than solving the monodomain model. Fortunately, it can be often reduced to the monodomain approach because the differences in wave propagation between both approaches is small [193]. Differences between the bidomain approach and discrete models with a continuous extracellular potential are also small under physiological conditions [194,195]. Nevertheless, under reduced conduction velocities, differences may become noticeable.
On the other hand, it is largely assumed that the full bidomain approach is necessary to properly model defibrillation [14], since the bidomain model treats cardiac tissue as two overlapping domains, and defibrillation pulses affect both domains differently with their interactions determining the effectiveness of defibrillation. It can be used to study the characterization of the types of defibrillation shock protocols and determine, for example, the different response of the tissue to different levels of the monophasic and biphasic shock protocols [196].

6.6. Tridomain Model

The bidomain model considers separately the myocytes and the extracellular space. Such description can be extended by the consideration of the space occupied by fibroblasts. Such combinations of the three spaces and their electrophysiological properties are the basis of the tridomain models [197]:
ψ ( C m V t + I i o n ) I m f i = · ( σ i V ) + · ( σ i V e ) ,
ψ f i ( C f V f i t + I f i ) + I m f i = · ( σ f i V f i ) + · ( σ f i V e ) ,
· ( ( σ i + σ f i + σ e ) V e ) = · ( σ i V ) · ( σ f i V f i ) ,
where ψ f i is the ratio of surface to fibroblast volume, C f is the membrane capacitance of the fibroblast, I f i is the active ion current in the fibroblast, and I m f i corresponds to the coupling between the two types of cells. Such types of models can be implemented to study the effects of fibrotic patches on the strength of virtual electrodes generated during defibrillation [198].
Similarly to the reduction from the bidomain to the monodomain model under some conditions without a substantial loss of accuracy in numerical integration of the action potential wave, there is the possibility of a similar reduction from the tridomain model to a simple monodomain model accounting for the coupling between fibroblast and myocytes [199]:
ψ ( C m V t + I i o n ) I m f i = · ( σ i V ) ,
ψ f i ( C f V f i t + I f i ) + I m f i = · ( σ f i V f i ) ,
which strongly reduces the computational complexity for the integration of the electrophysiological equations, because it corresponds to a system of two coupled monodomain models.

6.7. Anisotropy of Cardiac Tissue

A defining characteristic of cardiac myocytes is their elongated shape, which promotes their alignment within the tissue. The fibers within each cell are oriented parallel to the long axis and contract in this direction. Gap junctions, responsible for cell-to-cell electrical communication, predominantly accumulate at the ends of the elongated cells.
In cardiac tissue, this asymmetric distribution of gap junctions facilitates faster propagation of the action potential along the myocyte axis compared to the perpendicular direction. More advanced models also account for the laminar organization of cells within the tissue, introducing an additional layer of anisotropy to wave velocity [200].
The effect of anisotropy on wave propagation in cardiac tissue can be modeled by modifying the diffusion coefficient in the cable equation. In the monodomain approach, the diffusion tensor is typically defined by two conductivity coefficients: one for the direction of fast propagation and another for the two perpendicular directions.
However, the anisotropy ratios of the intracellular and extracellular spaces differ, complicating the direct reduction of the bidomain model to a monodomain description. While the longitudinal conductivities in the extracellular and intracellular spaces are similar, the intracellular transverse conductivity is one to two orders of magnitude smaller than its extracellular counterpart [201].
In the ventricles, the tissue exhibits additional complexity. While atrial tissue is relatively thin [202], the ventricular wall is thick, and the direction of anisotropy changes throughout the wall. This results in rotational anisotropy, where the fiber orientation rotates progressively from the endocardium to the epicardium [105], creating a continuous variation in fiber alignment across the ventricular wall [203]. The fiber orientation has an important influence on the biomechanics of the heart [204].

7. Discussion

This work highlights the intricate interplay between biophysical processes, computational modeling, and their application to understanding cardiac electrophysiology. By examining the role of ion channels, intracellular calcium dynamics, and tissue heterogeneities, we have gained insights into the mechanisms underlying action potential propagation and dysfunction in the heart. The study underscores the importance of detailed spatial and temporal modeling to capture the multiscale nature of cardiac function, from the molecular scale of ion channels to the macroscopic behavior of the heart as a whole. In particular, here, we have considered diverse aspects on cardiac modeling.
For example, action potential, which eventually produces the contraction of our heart once per second, is controlled by the ion currents along the different types of ion channels. Although there are multiple types of ion channels, in Section 2, we summarize the most characteristic dynamics of the main channels for sodium, potassium and calcium, which are the main ingredients of the electrophysiology of the myocyte.
In comparison to action potential in neurons, the shape of the cardiac action potential is determined by intracellular Ca2+. The detailed description of the processes involves the consideration of small spatial scales and a detailed spatial description of the interior of the cardiac cell. The elements of such a process have been discussed in Section 3.
Section 4 shows that biophysical detailed models of the whole cell provide a very useful description of the electrophysiology of the system and allow a quantitative comparison with experiments. They permit the detailed numerical study of action potential dysfunctions.
We have shown in Section 5 that the simple approximation of constant diffusion is not completely valid when dealing with tissue with low conductance and high levels of heterogeneities. Therefore, it is essential to include more realistic descriptions of the dynamics of the gap junctions. This can be accomplished at the mesoscopic level by introducing a kinetic equation for the gap junctions between two adjacent myocytes.
In Section 6, we have shown that there are different descriptions of the cardiac tissue, each of them more adequate for specific problems in electrophysiology. While for the effects of heterogeneous tissue and the presence of fibrosis discrete versions are advisable, continuous descriptions are more efficient for the study of re-entries and to model defibrillation.
The heart represents a complex multiphysics system [205], requiring the interplay of electrical wave propagation, muscle contraction mechanics, and fluid dynamics within the cardiac chambers to fully explain its function as an electromechanical pump. It is also a multiscale problem [29], where dysfunction at small spatial and temporal scales—such as an ion channel malfunction—can significantly impact the behavior of the entire organ. Comprehensive computational modeling offers the potential to bridge these scales, enabling the study of genetic mutations or drug effects, which operate at microscopic levels, and their influence on the macroscopic performance of the heart [206].
One of the main applications of such biophysical models of the cardiac tissue is in pharmacology for the assessment of the effects of different types of drugs in the dynamics of the action potential. For example, there is the assessment of drug cardiotoxicity through the definition of arrhythmic risk biomarkers [207], where small changes in the ion channels dynamics can scale to complex dynamics in the cardiac tissue. We can quantify the effect of drugs in the electrocardiograms [208].
Other important applications of the biophysical models are related to full cardiovascular modeling. The detailed description of the atria with the corresponding fiber orientations [202] and detailed models of the ventricles with the adequate fiber directions in the walls [209] demand a complex computational analysis and the building of whole heart simulations of the propagation of the action potential. This is a challenge in biomedical engineering, which has to go along with the development of the biophysical models at the different scales discussed here. Furthermore, there are efforts to couple the blood dynamics inside the chambers of the heart with the electrophysiology of the cardiac tissue [210] and in particular, the fiber orientation with the flow tracts [211].
Patient-oriented medicine for customization of the medical care to individual patients [212] is one of the main topics of interest in the biomedical community. In the case of cardiac diseases, personalized medicine aims to use patient-specific computational models of the biomechanics [213,214] and/or electrophysiology after infarcts [12,215] to generate a cardiovascular digital twin of a particular heart. This model can also be scaled and used in personalized health [216]. This approach combines the computer-enhanced induction using statistical models with the deduction of mechanisms from computational modeling with the goal of integrating multiscale knowledge [217]. On one side, the statistical models allow the extraction and optimal combination of individualized biomarkers with mathematical rules [218]. On the other side, the mechanistic models employ the details of physiology and the use of the fundamental laws of physics and biochemistry [217].
In summary, the heart’s function as a complex electromechanical pump is governed by intricate interactions across multiple physical and spatial scales, ranging from ion channel dynamics to whole-organ behavior. Advances in biophysical modeling and computational tools have enabled a deeper understanding of cardiac electrophysiology, highlighting the significance of incorporating detailed descriptions of tissue heterogeneities, fiber orientations, and gap junction dynamics. Moving forward, the integration of personalized computational models and the development of digital cardiovascular twins represent promising frontiers for patient-specific medicine, offering the potential to bridge experimental and clinical insights with tailored therapeutic interventions.

Author Contributions

Conceptualization, S.A., E.A.-L., J.B. and B.E.; writing—original draft preparation, S.A., E.A.-L., J.B. and B.E.; writing—review and editing, S.A., E.A.-L., J.B. and B.E.; visualization, S.A., E.A.-L., J.B. and B.E.; supervision, S.A., E.A.-L., J.B. and B.E.; funding acquisition, S.A., E.A.-L., J.B. and B.E. All authors have read and agreed to the published version of the manuscript.

Funding

The authors acknowledge support from grants PID-2022-139215NB-I00, PID2023-152610OB-C22, and RED2022-134490-T funded by Ministerio de Ciencia, Innovación y Universidades (MICIU/AEI/10.13039/501100011033) and by ‘ERDF: A way of making Europe’, by the European Union, and grant 2021 SGR 00582 funded by Agència de Gestió d’Ajuts Universitaris i de Recerca (AGAUR).

Data Availability Statement

No raw data set was used in this manuscript.

Conflicts of Interest

Authors declare no conflicts of interest.

References

  1. Lozano, R.; Naghavi, M.; Foreman, K.; Lim, S.; Shibuya, K.; Aboyans, V.; Abraham, J.; Adair, T.; Aggarwal, R.; Ahn, S.Y.; et al. Global and regional mortality from 235 causes of death for 20 age groups in 1990 and 2010: A systematic analysis for the Global Burden of Disease Study 2010. Lancet 2012, 380, 2095–2128. [Google Scholar] [CrossRef] [PubMed]
  2. Mathers, C.D.; Boerma, T.; Ma Fat, D. Global and regional causes of death. Br. Med. Bull. 2009, 92, 7–32. [Google Scholar] [CrossRef]
  3. Mendis, S.; Puska, P.; Norrving, B.E.; World Health Organization. Global Atlas on Cardiovascular Disease Prevention and Control; World Health Organization: Geneva, Switzerland, 2011. [Google Scholar]
  4. Timmis, A.; Aboyans, V.; Vardas, P.; Townsend, N.; Torbica, A.; Kavousi, M.; Boriani, G.; Huculeci, R.; Kazakiewicz, D.; Scherr, D.; et al. European society of cardiology: The 2023 atlas of cardiovascular disease statistics. Eur. Heart J. 2024, 45, 4019–4062. [Google Scholar] [CrossRef] [PubMed]
  5. Malmivuo, J.; Plonsey, R. Bioelectromagnetism: Principles and Applications of Bioelectric and Biomagnetic Fields; Oxford University Press: Oxford, MA, USA, 1995. [Google Scholar]
  6. Zipes, D.P.; Jalife, J.; Stevenson, W.G. Cardiac Electrophysiology: From Cell to Bedside E-Book; Elsevier Health Sciences: Amsterdam, The Netherlands, 2017. [Google Scholar]
  7. Bigger, J.T., Jr.; Dresdale, R.J.; Heissenbuttel, R.H.; Weld, F.M.; Wit, A.L. Ventricular arrhythmias in ischemic heart disease: Mechanism, prevalence, significance, and management. Prog. Cardiovasc. Dis. 1977, 19, 255–300. [Google Scholar] [CrossRef] [PubMed]
  8. Arutunyan, A.; Swift, L.M.; Sarvazyan, N. Initiation and propagation of ectopic waves: Insights from an in vitro model of ischemia-reperfusion injury. Am. J. Physiol.-Heart Circ. Physiol. 2002, 283, H741–H749. [Google Scholar] [CrossRef] [PubMed]
  9. Clusin, W.T. Calcium and cardiac arrhythmias: DADs, EADs, and alternans. Crit. Rev. Clin. Lab. Sci. 2003, 40, 337–375. [Google Scholar] [CrossRef] [PubMed]
  10. Wehrens, X.H.; Lehnart, S.E.; Marks, A.R. Intracellular calcium release and cardiac disease. Annu. Rev. Physiol. 2005, 67, 69–98. [Google Scholar] [CrossRef] [PubMed]
  11. Xie, Y.; Liao, Z.; Grandi, E.; Shiferaw, Y.; Bers, D.M. Slow [Na] i changes and positive feedback between membrane potential and [Ca] i underlie intermittent early afterdepolarizations and arrhythmias. Circ. Arrhythmia Electrophysiol. 2015, 8, 1472–1480. [Google Scholar] [CrossRef]
  12. Oliveira, R.S.; Alonso, S.; Campos, F.O.; Rocha, B.M.; Fernandes, J.F.; Kuehne, T.; Dos Santos, R.W. Ectopic beats arise from micro-reentries near infarct regions in simulations of a patient-specific heart model. Sci. Rep. 2018, 8, 16392. [Google Scholar] [CrossRef]
  13. Arevalo, H.; Plank, G.; Helm, P.; Halperin, H.; Trayanova, N. Tachycardia in post-infarction hearts: Insights from 3D image-based ventricular models. PLoS ONE 2013, 8, e68872. [Google Scholar] [CrossRef]
  14. Trayanova, N. Defibrillation of the heart: Insights into mechanisms from modelling studies. Exp. Physiol. 2006, 91, 323–337. [Google Scholar] [CrossRef] [PubMed]
  15. Colman, M.A.; Alvarez-Lacalle, E.; Echebarria, B.; Sato, D.; Sutanto, H.; Heijman, J. Multi-scale computational modeling of spatial calcium handling from nanodomain to whole-heart: Overview and perspectives. Front. Physiol. 2022, 13, 836622. [Google Scholar] [CrossRef]
  16. Chen, W.; Wasserstrom, J.A.; Shiferaw, Y. Role of coupled gating between cardiac ryanodine receptors in the genesis of triggered arrhythmias. Am. J. Physiol.-Heart Circ. Physiol. 2009, 297, H171–H180. [Google Scholar] [CrossRef]
  17. Heijman, J.; Voigt, N.; Nattel, S.; Dobrev, D. Calcium handling and atrial fibrillation. Wien. Med. Wochenschr. 2012, 162, 287–291. [Google Scholar] [CrossRef] [PubMed]
  18. Hove-Madsen, L.; Llach, A.; Bayes-Genís, A.; Roura, S.; Font, E.R.; Arís, A.; Cinca, J. Atrial fibrillation is associated with increased spontaneous calcium release from the sarcoplasmic reticulum in human atrial myocytes. Circulation 2004, 110, 1358–1363. [Google Scholar] [CrossRef] [PubMed]
  19. Shiferaw, Y.; Aistrup, G.L.; Louch, W.E.; Wasserstrom, J. Remodeling promotes proarrhythmic disruption of calcium homeostasis in failing atrial myocytes. Biophys. J. 2020, 118, 476–491. [Google Scholar] [CrossRef] [PubMed]
  20. Niederer, S.A.; Lumens, J.; Trayanova, N.A. Computational models in cardiology. Nat. Rev. Cardiol. 2019, 16, 100–111. [Google Scholar] [CrossRef] [PubMed]
  21. Clayton, R.; Bernus, O.; Cherry, E.; Dierckx, H.; Fenton, F.H.; Mirabella, L.; Panfilov, A.V.; Sachse, F.B.; Seemann, G.; Zhang, H. Models of cardiac tissue electrophysiology: Progress, challenges and open questions. Prog. Biophys. Mol. Biol. 2011, 104, 22–48. [Google Scholar] [CrossRef]
  22. Rappel, W.J. The physics of heart rhythm disorders. Phys. Rep. 2022, 978, 1–45. [Google Scholar] [CrossRef] [PubMed]
  23. Karma, A. Physics of cardiac arrhythmogenesis. Annu. Rev. Condens. Matter Phys. 2013, 4, 313–337. [Google Scholar] [CrossRef]
  24. Alonso, S.; Bär, M.; Echebarria, B. Nonlinear physics of electrical wave propagation in the heart: A review. Rep. Prog. Phys. 2016, 79, 096601. [Google Scholar] [CrossRef] [PubMed]
  25. Beeler, G., Jr.; Reuter, H. Voltage clamp experiments on ventricular myocardial fibres. J. Physiol. 1970, 207, 165–190. [Google Scholar] [CrossRef] [PubMed]
  26. Deck, K.; Kern, R.; Trautwein, W. Voltage clamp technique in mammalian cardiac fibres. Pflüger’s Archiv für die gesamte Physiologie des Menschen und der Tiere 1964, 280, 50–62. [Google Scholar] [CrossRef]
  27. Bragard, J.R.; Camara, O.; Echebarria, B.; Giorda, L.G.; Pueyo, E.; Saiz, J.; Sebastian, R.; Soudah, E.; Vazquez, M. Cardiac computational modelling. Rev. Espa Nola De Cardiol. (Engl. Ed.) 2021, 74, 65–71. [Google Scholar] [CrossRef]
  28. Noble, D. Modeling the heart–from genes to cells to the whole organ. Science 2002, 295, 1678–1682. [Google Scholar] [CrossRef] [PubMed]
  29. Trayanova, N.A.; Rice, J.J. Cardiac electromechanical models: From cell to organ. Front. Physiol. 2011, 2, 43. [Google Scholar] [CrossRef] [PubMed]
  30. Qu, Z.; Garfinkel, A.; Weiss, J.N.; Nivala, M. Multi-scale modeling in biology: How to bridge the gaps between scales? Prog. Biophys. Mol. Biol. 2011, 107, 21–31. [Google Scholar] [CrossRef]
  31. Kekenes-Huskey, P.M.; Liao, T.; Gillette, A.K.; Hake, J.E.; Zhang, Y.; Michailova, A.P.; McCulloch, A.D.; McCammon, J.A. Molecular and subcellular-scale modeling of nucleotide diffusion in the cardiac myofilament lattice. Biophys. J. 2013, 105, 2130–2140. [Google Scholar] [CrossRef] [PubMed]
  32. McCulloch, A.D. Systems biophysics: Multiscale biophysical modeling of organ systems. Biophys. J. 2016, 110, 1023–1027. [Google Scholar] [CrossRef]
  33. Quarteroni, A.; Lassila, T.; Rossi, S.; Ruiz-Baier, R. Integrated heart—Coupling multiscale and multiphysics models for the simulation of the cardiac function. Comput. Methods Appl. Mech. Eng. 2017, 314, 345–407. [Google Scholar] [CrossRef]
  34. Chabiniok, R.; Wang, V.Y.; Hadjicharalambous, M.; Asner, L.; Lee, J.; Sermesant, M.; Kuhl, E.; Young, A.A.; Moireau, P.; Nash, M.P.; et al. Multiphysics and multiscale modelling, data–model fusion and integration of organ physiology in the clinic: Ventricular cardiac mechanics. Interface Focus 2016, 6, 20150083. [Google Scholar] [CrossRef]
  35. Keynes, R.D.; Aidley, D.J.; Huang, C.L.H. Nerve and Muscle; Cambridge University Press: Cambridge, UK, 2001. [Google Scholar]
  36. Keener, J.; Sneyd, J. Mathematical Physiology; Springer: New York, NY, USA, 1998. [Google Scholar]
  37. Sachse, F.B. Computational Cardiology: Modeling of Anatomy, Electrophysiology, and Mechanics; Springer: Berlin/Heidelberg, Germany, 2004. [Google Scholar]
  38. Winfree, A. A spatial scale factor for electrophysiological models of myocardium. Prog. Biophys. Mol. Biol. 1998, 69, 185–203. [Google Scholar] [CrossRef] [PubMed]
  39. Lawley, S.D.; Keener, J.P. Electrodiffusive flux through a stochastically gated ion channel. SIAM J. Appl. Math. 2019, 79, 551–571. [Google Scholar] [CrossRef]
  40. Hodgkin, A.L.; Huxley, A.F. A quantitative description of membrane current and its application to conduction and excitation in nerve. J. Physiol. 1952, 117, 500. [Google Scholar] [CrossRef] [PubMed]
  41. Keener, J.P. Invariant manifold reductions for Markovian ion channel dynamics. J. Math. Biol. 2009, 58, 447–457. [Google Scholar] [CrossRef]
  42. Smith, G.D. Modeling the stochastic gating of ion channels. In Computational Cell Biology; Springer: Berlin/Heidelberg, Germany, 2002; pp. 285–319. [Google Scholar]
  43. Schmandt, N.T.; Galán, R.F. Stochastic-Shielding Approximation of Markov Chains and Its Application to Efficiently Simulate Random Ion-Channel Gating. Phys. Rev. Lett. 2012, 109, 118101. [Google Scholar] [CrossRef] [PubMed]
  44. Anderson, D.F.; Ermentrout, B.; Thomas, P.J. Stochastic representations of ion channel kinetics and exact stochastic simulation of neuronal dynamics. J. Comput. Neurosci. 2015, 38, 67–82. [Google Scholar] [CrossRef] [PubMed]
  45. Gillespie, D.T. Exact stochastic simulation of coupled chemical reactions. J. Phys. Chem. 1977, 81, 2340–2361. [Google Scholar] [CrossRef]
  46. Ramírez-Piscina, L.; Sancho, J.M. Physical properties of voltage gated pores. Eur. Phys. J. B 2018, 91, 1–9. [Google Scholar] [CrossRef]
  47. Ramírez-Piscina, L. Subconductance states in a semimicroscopic model for a tetrameric pore. Phys. Rev. E 2024, 109, 044402. [Google Scholar] [CrossRef] [PubMed]
  48. Maffeo, C.; Bhattacharya, S.; Yoo, J.; Wells, D.; Aksimentiev, A. Modeling and simulation of ion channels. Chem. Rev. 2012, 112, 6250–6284. [Google Scholar] [CrossRef] [PubMed]
  49. Beeler, G.W.; Reuter, H. Reconstruction of the action potential of ventricular myocardial fibres. J. Physiol. 1977, 268, 177–210. [Google Scholar] [CrossRef]
  50. Luo, C.H.; Rudy, Y. A model of the ventricular cardiac action potential. Depolarization, repolarization, and their interaction. Circ. Res. 1991, 68, 1501–1526. [Google Scholar] [CrossRef] [PubMed]
  51. Clancy, C.E.; Rudy, Y. Linking a genetic defect to its cellular phenotype in a cardiac arrhythmia. Nature 1999, 400, 566–569. [Google Scholar] [CrossRef]
  52. Clancy, C.E.; Rudy, Y. Na+ channel mutation that causes both Brugada and long-QT syndrome phenotypes: A simulation study of mechanism. Circulation 2002, 105, 1208–1213. [Google Scholar] [CrossRef] [PubMed]
  53. Mahajan, A.; Shiferaw, Y.; Sato, D.; Baher, A.; Olcese, R.; Xie, L.H.; Yang, M.J.; Chen, P.S.; Restrepo, J.G.; Karma, A.; et al. A rabbit ventricular action potential model replicating cardiac dynamics at rapid heart rates. Biophys. J. 2008, 94, 392–410. [Google Scholar] [CrossRef]
  54. Zhang, X.D.; Lieu, D.K.; Chiamvimonvat, N. Small-conductance Ca2+-activated K+ channels and cardiac arrhythmias. Heart Rhythm 2015, 12, 1845–1851. [Google Scholar] [CrossRef] [PubMed]
  55. Sato, D.; Dixon, R.E.; Santana, L.F.; Navedo, M.F. A model for cooperative gating of L-type Ca2+ channels and its effects on cardiac alternans dynamics. PLoS Comput. Biol. 2018, 14, e1005906. [Google Scholar] [CrossRef]
  56. Novaes, G.M.; Alvarez-Lacalle, E.; Muñoz, S.A.; Dos Santos, R.W. An ensemble of parameters from a robust Markov-based model reproduces L-type calcium currents from different human cardiac myocytes. PLoS ONE 2022, 17, e0266233. [Google Scholar] [CrossRef] [PubMed]
  57. Mullins, L. A mechanism for Na/Ca transport. J. Gen. Physiol. 1977, 70, 681–695. [Google Scholar] [CrossRef]
  58. Chu, L.; Greenstein, J.L.; Winslow, R.L. Modeling Na+-Ca2+ exchange in the heart: Allosteric activation, spatial localization, sparks and excitation-contraction coupling. J. Mol. Cell. Cardiol. 2016, 99, 174–187. [Google Scholar] [CrossRef]
  59. Campbell, A.K. Intracellular Calcium; John Wiley & Sons: Hoboken, NJ, USA, 2014. [Google Scholar]
  60. Hancock, J.T. Cell Signalling; Oxford University Press: Oxford, UK, 2017. [Google Scholar]
  61. Bers, D. Excitation-Contraction Coupling and Cardiac Contractile Force; Springer Science & Business Media: Berlin/Heidelberg, Germany, 2001; Volume 237. [Google Scholar]
  62. Kaestner, L. Calcium Signalling: Approaches and Findings in the Heart and Blood; Springer Science & Business Media: Berlin/Heidelberg, Germany, 2012. [Google Scholar]
  63. Parmacek, M.S.; Solaro, R.J. Biology of the troponin complex in cardiac myocytes. Prog. Cardiovasc. Dis. 2004, 47, 159–176. [Google Scholar] [CrossRef] [PubMed]
  64. Dibb, K.; Graham, H.; Venetucci, L.; Eisner, D.; Trafford, A. Analysis of cellular calcium fluxes in cardiac muscle to understand calcium homeostasis in the heart. Cell Calcium 2007, 42, 503–512. [Google Scholar] [CrossRef]
  65. Conesa, D.; Echebarria, B.; Peñaranda, A.; Cantalapiedra, I.R.; Shiferaw, Y.; Alvarez-Lacalle, E. Two-variable nullcline analysis of ionic general equilibrium predicts calcium homeostasis in ventricular myocytes. PLoS Comput. Biol. 2020, 16, e1007572. [Google Scholar] [CrossRef] [PubMed]
  66. Soeller, C.; Crossman, D.; Gilbert, R.; Cannell, M.B. Analysis of ryanodine receptor clusters in rat and human cardiac myocytes. Proc. Natl. Acad. Sci. USA 2007, 104, 14958–14963. [Google Scholar] [CrossRef]
  67. Hou, Y.; Bai, J.; Shen, X.; de Langen, O.; Li, A.; Lal, S.; Dos Remedios, C.G.; Baddeley, D.; Ruygrok, P.N.; Soeller, C.; et al. Nanoscale organisation of ryanodine receptors and junctophilin-2 in the failing human heart. Front. Physiol. 2021, 12, 724372. [Google Scholar] [CrossRef]
  68. Baddeley, D.; Jayasinghe, I.; Lam, L.; Rossberger, S.; Cannell, M.B.; Soeller, C. Optical single-channel resolution imaging of the ryanodine receptor distribution in rat cardiac myocytes. Proc. Natl. Acad. Sci. USA 2009, 106, 22275–22280. [Google Scholar] [CrossRef]
  69. Sheard, T.M.; Hurley, M.E.; Colyer, J.; White, E.; Norman, R.; Pervolaraki, E.; Narayanasamy, K.K.; Hou, Y.; Kirton, H.M.; Yang, Z.; et al. Three-dimensional and chemical mapping of intracellular signaling nanodomains in health and disease with enhanced expansion microscopy. ACS Nano 2019, 13, 2143–2157. [Google Scholar] [CrossRef]
  70. Chen, H.; Valle, G.; Furlan, S.; Nani, A.; Gyorke, S.; Fill, M.; Volpe, P. Mechanism of calsequestrin regulation of single cardiac ryanodine receptor in normal and pathological conditions. J. Gen. Physiol. 2013, 142, 127–136. [Google Scholar] [CrossRef]
  71. Wei, J.; Yao, J.; Belke, D.; Guo, W.; Zhong, X.; Sun, B.; Wang, R.; Paul Estillore, J.; Vallmitjana, A.; Benitez, R.; et al. Ca2+-CaM dependent inactivation of RyR2 underlies Ca2+ alternans in intact heart. Circ. Res. 2021, 128, e63–e83. [Google Scholar] [CrossRef] [PubMed]
  72. Tang, Y.; Tian, X.; Wang, R.; Fill, M.; Chen, S.W. Abnormal termination of Ca2+ release is a common defect of RyR2 mutations associated with cardiomyopathies. Circ. Res. 2012, 110, 968–977. [Google Scholar] [CrossRef] [PubMed]
  73. Cannell, M.B.; Kong, C.H. Local control in cardiac E–C coupling. J. Mol. Cell. Cardiol. 2012, 52, 298–303. [Google Scholar] [CrossRef] [PubMed]
  74. Van Petegem, F. Ryanodine receptors: Structure and function. J. Biol. Chem. 2012, 287, 31624–31632. [Google Scholar] [CrossRef] [PubMed]
  75. Sheard, T.M.; Hurley, M.E.; Smith, A.J.; Colyer, J.; White, E.; Jayasinghe, I. Three-dimensional visualization of the cardiac ryanodine receptor clusters and the molecular-scale fraying of dyads. Philos. Trans. R. Soc. B 2022, 377, 20210316. [Google Scholar] [CrossRef]
  76. Maleckar, M.M.; Edwards, A.G.; Louch, W.E.; Lines, G.T. Studying dyadic structure–function relationships: A review of current modeling approaches and new insights into Ca2+ (mis) handling. Clin. Med. Insights Cardiol. 2017, 11, 1179546817698602. [Google Scholar] [CrossRef] [PubMed]
  77. Hong, T.; Shaw, R.M. Cardiac T-tubule microanatomy and function. Physiol. Rev. 2017, 97, 227–252. [Google Scholar] [CrossRef] [PubMed]
  78. Richards, M.A.; Clarke, J.D.; Saravanan, P.; Voigt, N.; Dobrev, D.; Eisner, D.A.; Trafford, A.W.; Dibb, K.M. Transverse tubules are a common feature in large mammalian atrial myocytes including human. Am. J. Physiol.-Heart Circ. Physiol. 2011, 301, H1996–H2005. [Google Scholar] [CrossRef] [PubMed]
  79. Benitah, J.P.; Perrier, R.; Mercadier, J.J.; Pereira, L.; Gómez, A.M. RyR2 and calcium release in heart failure. Front. Physiol. 2021, 12, 734210. [Google Scholar] [CrossRef] [PubMed]
  80. Marchena, M.; Echebarria, B. Computational model of calcium signaling in cardiac atrial cells at the submicron scale. Front. Physiol. 2018, 9, 1760. [Google Scholar] [CrossRef]
  81. Marchena, M.; Echebarria, B. Influence of the tubular network on the characteristics of calcium transients in cardiac myocytes. PLoS ONE 2020, 15, e0231056. [Google Scholar] [CrossRef] [PubMed]
  82. Marchena, M.; Echebarria, B.; Shiferaw, Y.; Alvarez-Lacalle, E. Buffering and total calcium levels determine the presence of oscillatory regimes in cardiac cells. PLoS Comput. Biol. 2020, 16, e1007728. [Google Scholar] [CrossRef] [PubMed]
  83. Falcke, M. On the role of stochastic channel behavior in intracellular Ca2+ dynamics. Biophys. J. 2003, 84, 42–56. [Google Scholar] [CrossRef] [PubMed]
  84. Weber, C.R.; Piacentino III, V.; Ginsburg, K.S.; Houser, S.R.; Bers, D.M. Na+-Ca2+ exchange current and submembrane [Ca2+] during the cardiac action potential. Circ. Res. 2002, 90, 182–189. [Google Scholar] [CrossRef]
  85. Chen, W.; Aistrup, G.; Wasserstrom, J.A.; Shiferaw, Y. A mathematical model of spontaneous calcium release in cardiac myocytes. Am. J. Physiol.-Heart Circ. Physiol. 2011, 300, H1794–H1805. [Google Scholar] [CrossRef] [PubMed]
  86. Colman, M.A.; Pinali, C.; Trafford, A.W.; Zhang, H.; Kitmitto, A. A computational model of spatio-temporal cardiac intracellular calcium handling with realistic structure and spatial flux distribution from sarcoplasmic reticulum and t-tubule reconstructions. PLoS Comput. Biol. 2017, 13, e1005714. [Google Scholar] [CrossRef] [PubMed]
  87. Nivala, M.; de Lange, E.; Rovetti, R.; Qu, Z. Computational modeling and numerical methods for spatiotemporal calcium cycling in ventricular myocytes. Front. Physiol. 2012, 3, 114. [Google Scholar] [CrossRef] [PubMed]
  88. Sutanto, H.; Van Sloun, B.; Schönleitner, P.; Van Zandvoort, M.A.; Antoons, G.; Heijman, J. The subcellular distribution of ryanodine receptors and L-type Ca2+ channels modulates Ca2+-transient properties and spontaneous Ca2+-release events in atrial cardiomyocytes. Front. Physiol. 2018, 9, 1108. [Google Scholar] [CrossRef] [PubMed]
  89. Noble, D. A modification of the Hodgkin—Huxley equations applicable to Purkinje fibre action and pacemaker potentials. J. Physiol. 1962, 160, 317. [Google Scholar] [CrossRef] [PubMed]
  90. Luo, C.h.; Rudy, Y. A dynamic model of the cardiac ventricular action potential. I. Simulations of ionic currents and concentration changes. Circ. Res. 1994, 74, 1071–1096. [Google Scholar] [CrossRef] [PubMed]
  91. Winslow, R.L.; Rice, J.; Jafri, S.; Marban, E.; O’Rourke, B. Mechanisms of altered excitation-contraction coupling in canine tachycardia-induced heart failure, II: Model studies. Circ. Res. 1999, 84, 571–586. [Google Scholar] [CrossRef]
  92. Shannon, T.R.; Wang, F.; Puglisi, J.; Weber, C.; Bers, D.M. A mathematical treatment of integrated Ca dynamics within the ventricular myocyte. Biophys. J. 2004, 87, 3351–3371. [Google Scholar] [CrossRef] [PubMed]
  93. Bondarenko, V.E.; Szigeti, G.P.; Bett, G.C.; Kim, S.J.; Rasmusson, R.L. Computer model of action potential of mouse ventricular myocytes. Am. J. Physiol.-Heart Circ. Physiol. 2004, 287, H1378–H1403. [Google Scholar] [CrossRef] [PubMed]
  94. Priebe, L.; Beuckelmann, D.J. Simulation study of cellular electric properties in heart failure. Circ. Res. 1998, 82, 1206–1223. [Google Scholar] [CrossRef]
  95. Ten Tusscher, K.H.; Noble, D.; Noble, P.J.; Panfilov, A.V. A model for human ventricular tissue. Am. J. Physiol.-Heart Circ. Physiol. 2004, 286, H1573–H1589. [Google Scholar] [CrossRef] [PubMed]
  96. Iyer, V.; Mazhari, R.; Winslow, R.L. A computational model of the human left-ventricular epicardial myocyte. Biophys. J. 2004, 87, 1507–1525. [Google Scholar] [CrossRef] [PubMed]
  97. Nygren, A.; Fiset, C.; Firek, L.; Clark, J.W.; Lindblad, D.S.; Clark, R.B.; Giles, W.R. Mathematical model of an adult human atrial cell: The role of K+ currents in repolarization. Circ. Res. 1998, 82, 63–81. [Google Scholar] [CrossRef] [PubMed]
  98. Courtemanche, M.; Ramirez, R.J.; Nattel, S. Ionic mechanisms underlying human atrial action potential properties: Insights from a mathematical model. Am. J. Physiol.-Heart Circ. Physiol. 1998, 275, H301–H321. [Google Scholar] [CrossRef] [PubMed]
  99. Noble, D.; Noble, S. A model of sino-atrial node electrical activity based on a modification of the DiFrancesco-Noble (1984) equations. Proc. R. Soc. Lond. Ser. B Biol. Sci. 1984, 222, 295–304. [Google Scholar]
  100. Walker, M.A.; Gurev, V.; Rice, J.J.; Greenstein, J.L.; Winslow, R.L. Estimating the probabilities of rare arrhythmic events in multiscale computational models of cardiac cells and tissue. PLoS Comput. Biol. 2017, 13, e1005783. [Google Scholar] [CrossRef] [PubMed]
  101. Zhang, X.; Ni, H.; Morotti, S.; Smith, C.E.; Sato, D.; Louch, W.E.; Edwards, A.G.; Grandi, E. Mechanisms of spontaneous Ca2+ release-mediated arrhythmia in a novel 3D human atrial myocyte model: I. Transverse-axial tubule variation. J. Physiol. 2023, 601, 2655–2683. [Google Scholar] [CrossRef] [PubMed]
  102. Liu, M.B.; de Lange, E.; Garfinkel, A.; Weiss, J.N.; Qu, Z. Delayed afterdepolarizations generate both triggers and a vulnerable substrate promoting reentry in cardiac tissue. Heart Rhythm 2015, 12, 2115–2124. [Google Scholar] [CrossRef] [PubMed]
  103. Colman, M.A.; Perez Alday, E.A.; Holden, A.V.; Benson, A.P. Trigger vs. substrate: Multi-dimensional modulation of QT-prolongation associated arrhythmic dynamics by a hERG channel activator. Front. Physiol. 2017, 8, 757. [Google Scholar] [CrossRef]
  104. Williams, G.S.; Huertas, M.A.; Sobie, E.A.; Jafri, M.S.; Smith, G.D. A probability density approach to modeling local control of calcium-induced calcium release in cardiac myocytes. Biophys. J. 2007, 92, 2311–2328. [Google Scholar] [CrossRef]
  105. Fenton, F.; Karma, A. Vortex dynamics in three-dimensional continuous myocardium with fiber rotation: Filament instability and fibrillation. Chaos Interdiscip. J. Nonlinear Sci. 1998, 8, 20–47. [Google Scholar] [CrossRef] [PubMed]
  106. Bueno-Orovio, A.; Cherry, E.M.; Fenton, F.H. Minimal model for human ventricular action potentials in tissue. J. Theor. Biol. 2008, 253, 544–560. [Google Scholar] [CrossRef] [PubMed]
  107. Peñaranda, A.; Cantalapiedra, I.R.; Bragard, J.; Echebarria, B. Cardiac dynamics: A simplified model for action potential propagation. Theor. Biol. Med Model. 2012, 9, 1–18. [Google Scholar] [CrossRef]
  108. Aliev, R.R.; Panfilov, A.V. A simple two-variable model of cardiac excitation. Chaos Solitons Fractals 1996, 7, 293–301. [Google Scholar] [CrossRef]
  109. Karma, A. Spiral breakup in model equations of action potential propagation in cardiac tissue. Phys. Rev. Lett. 1993, 71, 1103. [Google Scholar] [CrossRef]
  110. Mitchell, C.C.; Schaeffer, D.G. A two-current model for the dynamics of cardiac membrane. Bull. Math. Biol. 2003, 65, 767–793. [Google Scholar] [CrossRef] [PubMed]
  111. Chen, Q.; Kirsch, G.E.; Zhang, D.; Brugada, R.; Brugada, J.; Brugada, P.; Potenza, D.; Moya, A.; Borggrefe, M.; Breithardt, G.; et al. Genetic basis and molecular mechanism for idiopathic ventricular fibrillation. Nature 1998, 392, 293–296. [Google Scholar] [CrossRef] [PubMed]
  112. Wilde, A.A.; Antzelevitch, C.; Borggrefe, M.; Brugada, J.; Brugada, R.; Brugada, P.; Corrado, D.; Hauer, R.N.; Kass, R.S.; Nademanee, K.; et al. Proposed diagnostic criteria for the Brugada syndrome: Consensus report. Circulation 2002, 106, 2514–2519. [Google Scholar] [CrossRef] [PubMed]
  113. Antzelevitch, C. Role of spatial dispersion of repolarization in inherited and acquired sudden cardiac death syndromes. Am. J. Physiol.-Heart Circ. Physiol. 2007, 293, H2024–H2038. [Google Scholar] [CrossRef]
  114. Tran, D.X.; Sato, D.; Yochelis, A.; Weiss, J.N.; Garfinkel, A.; Qu, Z. Bifurcation and chaos in a model of cardiac early afterdepolarizations. Phys. Rev. Lett. 2009, 102, 258103. [Google Scholar] [CrossRef] [PubMed]
  115. Barrio, R.; Martínez, M.Á.; Serrano, S.; Pueyo, E. Dynamical mechanism for generation of arrhythmogenic early afterdepolarizations in cardiac myocytes: Insights from in silico electrophysiological models. Phys. Rev. E 2022, 106, 024402. [Google Scholar] [CrossRef] [PubMed]
  116. Barrio, R.; Martínez, M.; Pueyo, E.; Serrano, S. Dynamical analysis of early afterdepolarization patterns in a biophysically detailed cardiac model. Chaos Interdiscip. J. Nonlinear Sci. 2021, 31, 073137. [Google Scholar] [CrossRef]
  117. Campos, F.O.; Shiferaw, Y.; Prassl, A.J.; Boyle, P.M.; Vigmond, E.J.; Plank, G. Stochastic spontaneous calcium release events trigger premature ventricular complexes by overcoming electrotonic load. Cardiovasc. Res. 2015, 107, 175–183. [Google Scholar] [CrossRef] [PubMed]
  118. Weiss, J.N.; Karma, A.; Shiferaw, Y.; Chen, P.S.; Garfinkel, A.; Qu, Z. From pulsus to pulseless: The saga of cardiac alternans. Circ. Res. 2006, 98, 1244–1253. [Google Scholar] [CrossRef] [PubMed]
  119. Nolasco, J.; Dahlen, R.W. A graphic method for the study of alternation in cardiac action potentials. J. Appl. Physiol. 1968, 25, 191–196. [Google Scholar] [CrossRef] [PubMed]
  120. Fox, J.J.; Bodenschatz, E.; Gilmour, R.F., Jr. Period-doubling instability and memory in cardiac tissue. Phys. Rev. Lett. 2002, 89, 138101. [Google Scholar] [CrossRef] [PubMed]
  121. Echebarria, B.; Karma, A. Instability and spatiotemporal dynamics of alternans in paced cardiac tissue. Phys. Rev. Lett. 2002, 88, 208101. [Google Scholar] [CrossRef]
  122. Shiferaw, Y.; Watanabe, M.; Garfinkel, A.; Weiss, J.; Karma, A. Model of intracellular calcium cycling in ventricular myocytes. Biophys. J. 2003, 85, 3666–3686. [Google Scholar] [CrossRef] [PubMed]
  123. Alvarez-Lacalle, E.; Cantalapiedra, I.R.; Penaranda, A.; Cinca, J.; Hove-Madsen, L.; Echebarria, B. Dependency of calcium alternans on ryanodine receptor refractoriness. PLoS ONE 2013, 8, e55042. [Google Scholar] [CrossRef]
  124. Picht, E.; DeSantiago, J.; Blatter, L.A.; Bers, D.M. Cardiac alternans do not rely on diastolic sarcoplasmic reticulum calcium content fluctuations. Circ. Res. 2006, 99, 740–748. [Google Scholar] [CrossRef]
  125. Lugo, C.A.; Cantalapiedra, I.R.; Peñaranda, A.; Hove-Madsen, L.; Echebarria, B. Are SR Ca content fluctuations or SR refractoriness the key to atrial cardiac alternans?: Insights from a human atrial model. Am. J. Physiol.-Heart Circ. Physiol. 2014, 306, H1540–H1552. [Google Scholar] [CrossRef] [PubMed]
  126. Cantalapiedra, I.R.; Alvarez-Lacalle, E.; Peñaranda, A.; Echebarria, B. Minimal model for calcium alternans due to SR release refractoriness. Chaos Interdiscip. J. Nonlinear Sci. 2017, 27, 093928. [Google Scholar] [CrossRef]
  127. Alvarez-Lacalle, E.; Echebarria, B.; Spalding, J.; Shiferaw, Y. Calcium alternans is due to an order-disorder phase transition in cardiac cells. Phys. Rev. Lett. 2015, 114, 108101. [Google Scholar] [CrossRef] [PubMed]
  128. Shiferaw, Y.; Karma, A. Turing instability mediated by voltage and calcium diffusion in paced cardiac cells. Proc. Natl. Acad. Sci. USA 2006, 103, 5670–5675. [Google Scholar] [CrossRef] [PubMed]
  129. Vogel, R.; Weingart, R. Mathematical model of vertebrate gap junctions derived from electrical measurements on homotypic and heterotypic channels. J. Physiol. 1998, 510, 177189. [Google Scholar] [CrossRef] [PubMed]
  130. Desplantez, T.; Halliday, D.; Dupont, E.; Weingart, R. Cardiac connexins Cx43 and Cx45: Formation of diverse gap junction channels with diverse electrical properties. Pflugers Arch. 2004, 448, 363–375. [Google Scholar] [CrossRef]
  131. Desplantez, T.; Dupont, E.; Severs, N.; Weingart, R. Gap junction channels and cardiac impulse propagation. J. Memb. Biol. 2007, 218, 13–28. [Google Scholar] [CrossRef]
  132. Willy, G.Y.; Yue, B.; Aoyama, H.; Kim, N.K.; Cameron, J.A.; Chen, H.; Bai, D. Junctional delay, frequency, and direction-dependent uncoupling of human heterotypic Cx45/Cx43 gap junction channels. J. Mol. Cell. Cardiol. 2017, 111, 17–26. [Google Scholar]
  133. Santos-Miranda, A.; Noureldin, M.; Bai, D. Effects of temperature on transjunctional voltage-dependent gating kinetics in Cx45 and Cx40 gap junction channels. J. Mol. Cell. Cardiol. 2019, 127, 185–193. [Google Scholar] [CrossRef]
  134. Spray, D.; Harris, A.; Bennett, M. Equilibrium properties of a voltage-dependent junctional conductance. J. Gen. Physiol. 1981, 77, 77–93. [Google Scholar] [CrossRef] [PubMed]
  135. Spray, D.; Harris, A.; Bennett, M. Gap junctional conductance is a simple and sensitive function of intracellular pH. Science 1981, 211, 712–715. [Google Scholar] [CrossRef] [PubMed]
  136. Harris, A.; Spray, D.; Bennett, M. Kinetic properties of a voltage-dependent junctional conductance. J. Gen. Physiol. 1981, 77, 95–117. [Google Scholar] [CrossRef]
  137. Chen-Izu, Y.; Moreno, A.; Spangler, R. Opposing gates model for voltage gating of gap junction channels. Am. J. Physiol. Cell Physiol. 2001, 281, C1604–C1613. [Google Scholar] [CrossRef]
  138. Paulauskas, N.; Pranevicius, M.; Bukauskas, F. A stochastic four-state model of contingent gating of gap junction channels containing two fast gates sensitive to transjunctional voltage. Biophys. J. 2009, 96, 3936–3948. [Google Scholar] [CrossRef] [PubMed]
  139. Paulauskas, N.; Pranevicius, M.; Bukauskas, F. Stochastic 16-state model of voltage gating of gap-junction channels enclosing fast and slow gate. Biophys. J. 2012, 102, 2471–2480. [Google Scholar] [CrossRef]
  140. Snipas, M.; Kraujalis, T.; Paulauskas, N.; Maciunas, K.; Bukauskas, F.F. Stochastic Model of Gap Junctions Exhibiting Rectification and Multiple Closed States of Slow Gates. Biophys. J. 2016, 110, 1322–1333. [Google Scholar] [CrossRef]
  141. Hand, P.E.; Griffith, B.E. Adaptive multiscale model for simulating cardiac conduction. Proc. Natl. Acad. Sci. USA 2010, 107, 14603–14608. [Google Scholar] [CrossRef] [PubMed]
  142. Costa, C.M.; Silva, P.A.A.; dos Santos, R.W. Mind the Gap: A Semicontinuum Model for Discrete Electrical Propagation in Cardiac Tissue. IEEE Trans. Biomed. Eng. 2016, 63, 765–774. [Google Scholar] [PubMed]
  143. Qu, Z. Network dynamics in cardiac electrophysiology. In Systems Biology of Metabolic and Signaling Networks; Springer: Berlin/Heidelberg, Germany, 2014; pp. 243–260. [Google Scholar]
  144. Lin, X.; Crye, M.; Veenstra, R.D. Regulation of connexin43 gap junctional conductance by ventricular action potentials. Circ. Res. 2003, 93, e63–e73. [Google Scholar] [CrossRef]
  145. Santos-Miranda, A.; Chen, H.; Chen, R.C.; Odoko-Ishimoto, M.; Aoyama, H.; Bai, D. The amino terminal domain plays an important role in transjunctional voltage-dependent gating kinetics of Cx45 gap junctions. J. Mol. Cell. Cardiol. 2020, 143, 71–84. [Google Scholar] [CrossRef] [PubMed]
  146. Hawks, C.; Elorza, J.; Wittt, A.; Laroze, D.; Cantalapiedra, I.R.; Penaranda, A.; Echebarria, B.; Bragard, J. Gap Junction Dynamics Induces Localized Conductance Bistability in Cardiac Tissue. Int. J. Bifurc. Chaos 2019, 29, 1930021. [Google Scholar] [CrossRef]
  147. Bragard, J.; Witt, A.; Hawks, C.; Elorza, J.; Cantalapiedra, I.R.; Penaranda, A.; Echebarria, B. Conductance heterogeneities induced by multistability in the dynamics of coupled gap junctions. Chaos Interdiscip. J. Nonlinear Sci. 2021, 31, 073144. [Google Scholar] [CrossRef] [PubMed]
  148. Cantalapiedra, I.R.; Penaranda, A.; Echebarria, B. Propagation malfunctions due to gap junction dysregulation. In Proceedings of the Computing in Cardiology 2014, Cambridge, MA, USA, 7–10 September 2014; pp. 1045–1048. [Google Scholar]
  149. Hawks, C.; Elorza, J.; Echebarria, B.; Cantalapiedra, I.R.; Peñaranda, A.; Bragard, J. Influence of gap junction dynamics on the stability of reentrant waves in cardiac tissue. In Proceedings of the 2015 Computing in Cardiology Conference (CinC), Nice, France, 6–9 September 2015; pp. 437–440. [Google Scholar]
  150. Henriquez, A.; Vogel, R.; Muller-Borer, B.; Henriquez, C.; Weingart, R.; Cascio, W. Influence of dynamic gap junction resistance on impulse propagation in ventricular myocardium: A computer simulation study. Biophys. J. 2001, 81, 2112–2121. [Google Scholar] [CrossRef]
  151. Maciunas, K.; Snipas, M.; Kraujalis, T.; Kraujalienė, L.; Panfilov, A.V. The role of the Cx43/Cx45 gap junction voltage gating on wave propagation and arrhythmogenic activity in cardiac tissue. Sci. Rep. 2023, 13, 14863. [Google Scholar] [CrossRef] [PubMed]
  152. Gaudesius, G.; Miragoli, M.; Thomas, S.P.; Rohr, S. Coupling of cardiac electrical activity over extended distances by fibroblasts of cardiac origin. Circ. Res. 2003, 93, 421–428. [Google Scholar] [CrossRef]
  153. Ongstad, E.; Kohl, P. Fibroblast–myocyte coupling in the heart: Potential relevance for therapeutic interventions. J. Mol. Cell. Cardiol. 2016, 91, 238–246. [Google Scholar] [CrossRef]
  154. Bazhutina, A.; Balakina-Vikulova, N.A.; Kursanov, A.; Solovyova, O.; Panfilov, A.; Katsnelson, L.B. Mathematical modelling of the mechano-electric coupling in the human cardiomyocyte electrically connected with fibroblasts. Prog. Biophys. Mol. Biol. 2021, 159, 46–57. [Google Scholar] [CrossRef]
  155. Chilton, L.; Giles, W.R.; Smith, G.L. Evidence of intercellular coupling between co-cultured adult rabbit ventricular myocytes and myofibroblasts. J. Physiol. 2007, 583, 225–236. [Google Scholar] [CrossRef] [PubMed]
  156. Vasquez, C.; Mohandas, P.; Louie, K.L.; Benamer, N.; Bapat, A.C.; Morley, G.E. Enhanced fibroblast–myocyte interactions in response to cardiac injury. Circ. Res. 2010, 107, 1011–1020. [Google Scholar] [CrossRef]
  157. Li, Y.; Asfour, H.; Bursac, N. Age-dependent functional crosstalk between cardiac fibroblasts and cardiomyocytes in a 3D engineered cardiac tissue. Acta Biomater. 2017, 55, 120–130. [Google Scholar] [CrossRef] [PubMed]
  158. Quinn, T.A.; Camelliti, P.; Rog-Zielinska, E.A.; Siedlecka, U.; Poggioli, T.; O’Toole, E.T.; Knöpfel, T.; Kohl, P. Electrotonic coupling of excitable and nonexcitable cells in the heart revealed by optogenetics. Proc. Natl. Acad. Sci. USA 2016, 113, 14852–14857. [Google Scholar] [CrossRef]
  159. Xie, Y.; Garfinkel, A.; Weiss, J.N.; Qu, Z. Cardiac alternans induced by fibroblast-myocyte coupling: Mechanistic insights from computational models. Am. J. Physiol.-Heart Circ. Physiol. 2009, 297, H775–H784. [Google Scholar] [CrossRef] [PubMed]
  160. Jacquemet, V.; Henriquez, C.S. Modelling cardiac fibroblasts: Interactions with myocytes and their impact on impulse propagation. Europace 2007, 9, vi29–vi37. [Google Scholar] [CrossRef] [PubMed]
  161. Sachse, F.B.; Moreno, A.P.; Abildskov, J. Electrophysiological modeling of fibroblasts and their interaction with myocytes. Ann. Biomed. Eng. 2008, 36, 41–56. [Google Scholar] [CrossRef] [PubMed]
  162. Hubbard, M.L.; Henriquez, C.S. A microstructural model of reentry arising from focal breakthrough at sites of source-load mismatch in a central region of slow conduction. Am. J. Physiol.-Heart Circ. Physiol. 2014, 306, H1341–H1352. [Google Scholar] [CrossRef] [PubMed]
  163. Jacquemet, V.; Henriquez, C.S. Loading effect of fibroblast-myocyte coupling on resting potential, impulse propagation, and repolarization: Insights from a microstructure model. Am. J. Physiol.-Heart Circ. Physiol. 2008, 294, H2040–H2052. [Google Scholar] [CrossRef]
  164. Spach, M.S.; Heidlage, J.F.; Dolber, P.C.; Barr, R.C. Electrophysiological effects of remodeling cardiac gap junctions and cell size: Experimental and model studies of normal cardiac growth. Circ. Res. 2000, 86, 302–311. [Google Scholar] [CrossRef] [PubMed]
  165. Gouvêa de Barros, B.; Sachetto Oliveira, R.; Meira, W., Jr.; Lobosco, M.; Weber dos Santos, R. Simulations of Complex and Microscopic Models of Cardiac Electrophysiology Powered by Multi-GPU Platforms. Comput. Math. Methods Med. 2012, 2012, 824569. [Google Scholar] [CrossRef] [PubMed]
  166. Prudat, Y.; Kucera, J.P. Nonlinear behaviour of conduction and block in cardiac tissue with heterogeneous expression of connexin 43. J. Mol. Cell. Cardiol. 2014, 76, 46–54. [Google Scholar] [CrossRef] [PubMed]
  167. Gouvêa de Barros, B.; Weber dos Santos, R.; Lobosco, M.; Alonso, S. Simulation of ectopic pacemakers in the heart: Multiple ectopic beats generated by reentry inside fibrotic regions. BioMed Res. Int. 2015, 2015, 713058. [Google Scholar] [CrossRef]
  168. Tveito, A.; Jæger, K.H.; Kuchta, M.; Mardal, K.A.; Rognes, M.E. A cell-based framework for numerical modeling of electrical conduction in cardiac tissue. Front. Phys. 2017, 5, 48. [Google Scholar] [CrossRef]
  169. Jæger, K.H.; Edwards, A.G.; Giles, W.R.; Tveito, A. From millimeters to micrometers; re-introducing myocytes in models of cardiac electrophysiology. Front. Physiol. 2021, 12, 763584. [Google Scholar] [CrossRef] [PubMed]
  170. Alonso, S.; Bär, M. Reentry near the percolation threshold in a heterogeneous discrete model for cardiac tissue. Phys. Rev. Lett. 2013, 110, 158101. [Google Scholar] [CrossRef]
  171. Oliveira, R.S.; de Barros, B.G.; Gomes, J.M.; Lobosco, M.; Alonso, S.; Bär, M.; dos Santos, R.W. Reactive interstitial and reparative fibrosis as substrates for cardiac ectopic pacemakers and reentries. In Proceedings of the Bioinformatics and Biomedical Engineering: 4th International Conference, IWBBIO 2016, Granada, Spain, 20–22 April 2016; Proceedings 4. Springer: Berlin/Heidelberg, Germany, 2016; pp. 346–357. [Google Scholar]
  172. Cherry, E.M.; Ehrlich, J.R.; Nattel, S.; Fenton, F.H. Pulmonary vein reentry—Properties and size matter: Insights from a computational analysis. Heart Rhythm 2007, 4, 1553–1562. [Google Scholar] [CrossRef]
  173. Panfilov, A. Spiral breakup in an array of coupled cells: The role of the intercellular conductance. Phys. Rev. Lett. 2002, 88, 118101. [Google Scholar] [CrossRef] [PubMed]
  174. Jæger, K.H.; Tveito, A. Efficient, cell-based simulations of cardiac electrophysiology; The Kirchhoff Network Model (KNM). NPJ Syst. Biol. Appl. 2023, 9, 25. [Google Scholar] [CrossRef]
  175. Mora, M.T.; Gomez, J.F.; Morley, G.; Ferrero, J.M.; Trenor, B. Mechanistic investigation of Ca2+ alternans in human heart failure and its modulation by fibroblasts. PLoS ONE 2019, 14, e0217993. [Google Scholar] [CrossRef] [PubMed]
  176. Ten Tusscher, K.; Panfilov, A. Influence of nonexcitable cells on spiral breakup in two-dimensional and three-dimensional excitable media. Phys. Rev. E 2003, 68, 062902. [Google Scholar] [CrossRef] [PubMed]
  177. Alonso, S.; Bär, M. Reentry produced by small-scale heterogeneities in a discrete model of cardiac tissue. J. Phys. Conf. Ser. 2016, 727, 012002. [Google Scholar] [CrossRef]
  178. Alonso, S.; Dos Santos, R.W.; Bär, M. Reentry and ectopic pacemakers emerge in a three-dimensional model for a slab of cardiac tissue with diffuse microfibrosis near the percolation threshold. PLoS ONE 2016, 11, e0166972. [Google Scholar] [CrossRef] [PubMed]
  179. Sachetto, R.; Alonso, S.; Dos Santos, R.W. Killing many birds with two stones: Hypoxia and fibrosis can generate ectopic beats in a human ventricular model. Front. Physiol. 2018, 9, 764. [Google Scholar] [CrossRef] [PubMed]
  180. Qu, Z.; Xie, F.; Garfinkel, A.; Weiss, J.N. Origins of spiral wave meander and breakup in a two-dimensional cardiac tissue model. Ann. Biomed. Eng. 2000, 28, 755–771. [Google Scholar] [CrossRef]
  181. Panfilov, A.V. Spiral breakup as a model of ventricular fibrillation. Chaos Interdiscip. J. Nonlinear Sci. 1998, 8, 57–64. [Google Scholar] [CrossRef]
  182. Pastore, J.M.; Girouard, S.D.; Laurita, K.R.; Akar, F.G.; Rosenbaum, D.S. Mechanism linking T-wave alternans to the genesis of cardiac fibrillation. Circulation 1999, 99, 1385–1394. [Google Scholar] [CrossRef] [PubMed]
  183. Brahmajothi, M.V.; Campbell, D.L.; Rasmusson, R.L.; Morales, M.J.; Trimmer, J.S.; Nerbonne, J.M.; Strauss, H.C. Distinct transient outward potassium current (Ito) phenotypes and distribution of fast-inactivating potassium channel alpha subunits in ferret left ventricular myocytes. J. Gen. Physiol. 1999, 113, 581–600. [Google Scholar] [CrossRef] [PubMed]
  184. Cantalapiedra, I.R.; Peñaranda, A.; Echebarria, B.; Bragard, J. Phase-2 reentry in cardiac tissue: Role of the slow calcium pulse. Phys. Rev. E—Stat. Nonlinear Soft Matter Phys. 2010, 82, 011907. [Google Scholar] [CrossRef] [PubMed]
  185. Penaranda, A.; Cantalapiedra, I.R.; Echebarria, B. Slow pulse due to calcium current induces phase-2 reentry in heterogeneous tissue. In Proceedings of the 2010 Computing in Cardiology, Belfast, UK, 26–29 September 2010; pp. 661–664. [Google Scholar]
  186. Alonso, S.; Panfilov, A.V. Negative filament tension in the Luo-Rudy model of cardiac tissue. Chaos Interdiscip. J. Nonlinear Sci. 2007, 17, 015102. [Google Scholar] [CrossRef]
  187. Alonso, S.; Bär, M.; Panfilov, A.V. Negative tension of scroll wave filaments and turbulence in three-dimensional excitable media and application in cardiac dynamics. Bull. Math. Biol. 2013, 75, 1351–1376. [Google Scholar] [CrossRef] [PubMed]
  188. Echebarria, B.; Hakim, V.; Henry, H. Nonequilibrium ribbon model of twisted scroll waves. Phys. Rev. Lett. 2006, 96, 098301. [Google Scholar] [CrossRef]
  189. Fenton, F.H.; Luther, S.; Cherry, E.M.; Otani, N.F.; Krinsky, V.; Pumir, A.; Bodenschatz, E.; Gilmour, R.F., Jr. Termination of atrial fibrillation using pulsed low-energy far-field stimulation. Circulation 2009, 120, 467–476. [Google Scholar] [CrossRef] [PubMed]
  190. Luther, S.; Fenton, F.H.; Kornreich, B.G.; Squires, A.; Bittihn, P.; Hornung, D.; Zabel, M.; Flanders, J.; Gladuli, A.; Campoy, L.; et al. Low-energy control of electrical turbulence in the heart. Nature 2011, 475, 235–239. [Google Scholar] [CrossRef] [PubMed]
  191. Buran, P.; Bär, M.; Alonso, S.; Niedermayer, T. Control of electrical turbulence by periodic excitation of cardiac tissue. Chaos Interdiscip. J. Nonlinear Sci. 2017, 27, 113110. [Google Scholar] [CrossRef]
  192. dos Santos, R.W.; Plank, G.; Bauer, S.; Vigmond, E.J. Parallel multigrid preconditioner for the cardiac bidomain model. IEEE Trans. Biomed. Eng. 2004, 51, 1960–1968. [Google Scholar]
  193. Potse, M.; Dubé, B.; Richer, J.; Vinet, A.; Gulrajani, R.M. A comparison of monodomain and bidomain reaction-diffusion models for action potential propagation in the human heart. IEEE Trans. Biomed. Eng. 2006, 53, 2425–2435. [Google Scholar] [CrossRef] [PubMed]
  194. Jæger, K.H.; Tveito, A. Deriving the bidomain model of cardiac electrophysiology from a cell-based model; properties and comparisons. Front. Physiol. 2022, 12, 811029. [Google Scholar] [CrossRef] [PubMed]
  195. Jæger, K.H.; Trotter, J.D.; Cai, X.; Arevalo, H.; Tveito, A. Evaluating computational efforts and physiological resolution of mathematical models of cardiac tissue. Sci. Rep. 2024, 14, 16954. [Google Scholar] [CrossRef] [PubMed]
  196. Bragard, J.; Šimić, A.; Laroze, D.; Elorza, J. Advantage of four-electrode over two-electrode defibrillators. Phys. Rev. E 2015, 92, 062919. [Google Scholar] [CrossRef] [PubMed]
  197. Sachse, F.B.; Moreno, A.; Seemann, G.; Abildskov, J. A model of electrical conduction in cardiac tissue including fibroblasts. Ann. Biomed. Eng. 2009, 37, 874–889. [Google Scholar] [CrossRef] [PubMed]
  198. Bragard, J.; Sankarankutty, A.C.; Sachse, F.B. Extended bidomain modeling of defibrillation: Quantifying virtual electrode strengths in fibrotic myocardium. Front. Physiol. 2019, 10, 337. [Google Scholar] [CrossRef]
  199. Sánchez, J.; Gomez, J.F.; Martinez-Mateu, L.; Romero, L.; Saiz, J.; Trenor, B. Heterogeneous effects of fibroblast-myocyte coupling in different regions of the human atria under conditions of atrial fibrillation. Front. Physiol. 2019, 10, 847. [Google Scholar] [CrossRef]
  200. Caldwell, B.J.; Trew, M.L.; Sands, G.B.; Hooks, D.A.; LeGrice, I.J.; Smaill, B.H. Three distinct directions of intramural activation reveal nonuniform side-to-side electrical coupling of ventricular myocytes. Circ. Arrhythmia Electrophysiol. 2009, 2, 433–440. [Google Scholar] [CrossRef] [PubMed]
  201. Penland, R.C.; Harrild, D.M.; Henriquez, C.S. Modeling impulse propagation and extracellular potential distributions in anisotropic cardiac tissue using a finite volume element discretization. Comput. Vis. Sci. 2002, 4, 215–226. [Google Scholar] [CrossRef]
  202. Tobón, C.; Ruiz-Villa, C.A.; Heidenreich, E.; Romero, L.; Hornero, F.; Saiz, J. A three-dimensional human atrial model with fiber orientation. Electrograms and arrhythmic activation patterns relationship. PLoS ONE 2013, 8, e50883. [Google Scholar] [CrossRef]
  203. Panfilov, A.V.; Keener, J.P. Re-entry in three-dimensional Fitzhugh-Nagumo medium with rotational anisotropy. Phys. D Nonlinear Phenom. 1995, 84, 545–552. [Google Scholar] [CrossRef]
  204. Gil, D.; Aris, R.; Borras, A.; Ramírez, E.; Sebastian, R.; Vazquez, M. Influence of fiber connectivity in simulations of cardiac biomechanics. Int. J. Comput. Assist. Radiol. Surg. 2019, 14, 63–72. [Google Scholar] [CrossRef]
  205. Nordsletten, D.; Niederer, S.; Nash, M.; Hunter, P.; Smith, N. Coupling multi-physics models to cardiac mechanics. Prog. Biophys. Mol. Biol. 2011, 104, 77–88. [Google Scholar] [CrossRef]
  206. Bradley, C.; Bowery, A.; Britten, R.; Budelmann, V.; Camara, O.; Christie, R.; Cookson, A.; Frangi, A.F.; Gamage, T.B.; Heidlauf, T.; et al. OpenCMISS: A multi-physics & multi-scale computational infrastructure for the VPH/Physiome project. Prog. Biophys. Mol. Biol. 2011, 107, 32–47. [Google Scholar]
  207. Corrias, A.; Jie, X.; Romero, L.; Bishop, M.; Bernabeu, M.; Pueyo, E.; Rodriguez, B. Arrhythmic risk biomarkers for the assessment of drug cardiotoxicity: From experiments to computer simulations. Philos. Trans. R. Soc. A Math. Phys. Eng. Sci. 2010, 368, 3001–3025. [Google Scholar] [CrossRef] [PubMed]
  208. Zemzemi, N.; Bernabeu, M.O.; Saiz, J.; Cooper, J.; Pathmanathan, P.; Mirams, G.R.; Pitt-Francis, J.; Rodriguez, B. Computational assessment of drug-induced effects on the electrocardiogram: From ion channel to body surface potentials. Br. J. Pharmacol. 2013, 168, 718–733. [Google Scholar] [CrossRef] [PubMed]
  209. Lafortune, P.; Arís, R.; Vázquez, M.; Houzeaux, G. Coupled electromechanical model of the heart: Parallel finite element formulation. Int. J. Numer. Methods Biomed. Eng. 2012, 28, 72–86. [Google Scholar] [CrossRef] [PubMed]
  210. Santiago, A.; Aguado-Sierra, J.; Zavala-Aké, M.; Doste-Beltran, R.; Gómez, S.; Arís, R.; Cajas, J.C.; Casoni, E.; Vázquez, M. Fully coupled fluid-electro-mechanical model of the human heart for supercomputers. Int. J. Numer. Methods Biomed. Eng. 2018, 34, e3140. [Google Scholar] [CrossRef] [PubMed]
  211. Doste, R.; Soto-Iglesias, D.; Bernardino, G.; Alcaine, A.; Sebastian, R.; Giffard-Roisin, S.; Sermesant, M.; Berruezo, A.; Sanchez-Quintana, D.; Camara, O. A rule-based method to model myocardial fiber orientation in cardiac biventricular geometries with outflow tracts. Int. J. Numer. Methods Biomed. Eng. 2019, 35, e3185. [Google Scholar] [CrossRef] [PubMed]
  212. Smith, N.; de Vecchi, A.; McCormick, M.; Nordsletten, D.; Camara, O.; Frangi, A.F.; Delingette, H.; Sermesant, M.; Relan, J.; Ayache, N.; et al. euHeart: Personalized and integrated cardiac care using patient-specific cardiovascular modelling. Interface Focus 2011, 1, 349–364. [Google Scholar] [CrossRef] [PubMed]
  213. Krishnamurthy, A.; Villongco, C.T.; Chuang, J.; Frank, L.R.; Nigam, V.; Belezzuoli, E.; Stark, P.; Krummen, D.E.; Narayan, S.; Omens, J.H.; et al. Patient-specific models of cardiac biomechanics. J. Comput. Phys. 2013, 244, 4–21. [Google Scholar] [CrossRef] [PubMed]
  214. Taylor, C.A.; Figueroa, C. Patient-specific modeling of cardiovascular mechanics. Annu. Rev. Biomed. Eng. 2009, 11, 109–134. [Google Scholar] [CrossRef] [PubMed]
  215. Lopez-Perez, A.; Sebastian, R.; Izquierdo, M.; Ruiz, R.; Bishop, M.; Ferrero, J.M. Personalized cardiac computational models: From clinical data to simulation of infarct-related ventricular tachycardia. Front. Physiol. 2019, 10, 580. [Google Scholar] [CrossRef]
  216. Niederer, S.A.; Sacks, M.S.; Girolami, M.; Willcox, K. Scaling digital twins from the artisanal to the industrial. Nat. Comput. Sci. 2021, 1, 313–320. [Google Scholar] [CrossRef]
  217. Corral-Acero, J.; Margara, F.; Marciniak, M.; Rodero, C.; Loncaric, F.; Feng, Y.; Gilbert, A.; Fernandes, J.F.; Bukhari, H.A.; Wajdan, A.; et al. The ‘Digital Twin’to enable the vision of precision cardiology. Eur. Heart J. 2020, 41, 4556–4564. [Google Scholar] [CrossRef] [PubMed]
  218. Guidi, G.; Pettenati, M.C.; Miniati, R.; Iadanza, E. Random forest for automatic assessment of heart failure severity in a telemonitoring scenario. In Proceedings of the 2013 35th Annual International Conference of the IEEE Engineering in Medicine and Biology Society (EMBC), Osaka, Japan, 3–7 July 2013; pp. 3230–3233. [Google Scholar]
Figure 1. Equivalent electric circuit model for the cellular membrane. The difference in the transmembrane potential between the extracellular and the intracellular spaces is determined by the ion current through the ion channels, the Nernst potential associated with each ion, and the capacitance of the membrane.
Biophysica 05 00005 g001
Figure 2. Sketch of a typical action potential in a ventricular myocyte. Phases and ion currents responsible for the action potential: sharp increase due to sodium influx (0), rapid decrease due to potassium outflux (1), balance currents and plateau phase (2), end of calcium influx (3) and return to the resting potential (4) where the pumps and the exchangers keep the resting potential fix.
Biophysica 05 00005 g002
Figure 3. Sketch of the different spatial scales discussed along this work. (A) Ion channels dynamics, (B) intracellular organization, (C) whole cell models for the action potential and the average ion channel dynamics, (D) properties of the gap junction connecting neighboring cardiac cells, and (E) cell organization along the cardiac tissue.
Biophysica 05 00005 g003
Figure 5. (A) Schematics of the micron subdivision of the cell in calcium release units (CaRUs). Each CaRU is associated with a RyR2 cluster. (B) Schematics of the different fluxes and concentrations taken into consideration in each CaRU; dyadic, subsarcolemma, cytosolic, network SR, and junctional SR. (C) The distribution of these CaRU in the tubulated structure of ventricles is drawn on the lower right. In a non-tubulated atrial cell, CaRU in the interior of the cell might not have LCC nor NCX available.
Biophysica 05 00005 g005
Figure 6. Schematics of a whole-cell model where all ionic concentrations are taken as averages, but calcium has five different compartments in the cell. Sodium and potassium concentration and fluxes from different ionic channels are represented. The calcium ionic concentration is different in the cytosol, in the nSR, in the junction SR and close to the membrane or close to the volume between RyR2 and LCC. In these models, however, there is no spatial information in the ionic concentration other than for calcium, which has a different average concentration in each compartment. Inside the NSR (network SR), for example, the calcium concentration is taken as the average in all the SR.
Biophysica 05 00005 g006
Figure 7. Schematic view of the structure and functionality of a gap junction (GJ) connecting electrically two cardiac myocytes. The thickness of the bi-lipidic layer is of the order of a few nanometers. The ions can flow in both directions through the GJ.
Biophysica 05 00005 g007
Figure 8. Steady-state values of the normalized gap junction g i , s s as a function of the transjunctional voltage V i for the different connexin types (homotypic and heterotypic). The horizontal line (green) represents the case where the conductance is assumed to be constant.
Biophysica 05 00005 g008
Figure 9. Space–time plot showing the conductance g of the symmetrical GJ Cx 43 _ 43 taken at stroboscopic time intervals ( T = 480 ms). The initial condition is uniformly set to g i n i = 0.4 for all the GJ. The color code represents the local values of the conductance (a.u.) ranging from 0.1 to 0.4. The shrinking factor is set to F S = 2 .
Biophysica 05 00005 g009
Figure 10. Modeling approaches to cardiac tissue: (A) heterogeneous model where discretization is smaller than single cells and discrete gap junctions are considered for cell-to-cell coupling. (B) Discrete model where the cardiac cell is approximated as a single element which is electrically connected to the rest of the cells in the tissue. (C) Monodomain model where the transmembrane voltage is considered in a continuous model; therefore, the the numerical discretization of space is typically larger than the cell size. (D) Bidomain model where intracellular (blue) and extracellular (yellow) potentials are explicitly considered as two interconnected continuous models.
Biophysica 05 00005 g010
Figure 11. Two-dimensional snapshots at six different times, corresponding to simulations of the action potential propagation through the tissue and entering in a region with small (A) close to percolation (B) and large (C) fraction of heterogeneities.
Biophysica 05 00005 g011
Figure 12. Two-dimensional snapshots at six different times, corresponding to simulations of the regular action potential propagation through the tissue (A), a spiral wave corresponding to a periodic rapid re-entrant wave related with tachycardia (B), and spiral breakup corresponding to irregular dynamics related to fibrillation (C).
Biophysica 05 00005 g012
Disclaimer/Publisher’s Note: The statements, opinions and data contained in all publications are solely those of the individual author(s) and contributor(s) and not of MDPI and/or the editor(s). MDPI and/or the editor(s) disclaim responsibility for any injury to people or property resulting from any ideas, methods, instructions or products referred to in the content.

