Article

Supercriticality, Glassy Dynamics, and the New Insight into Melting/Freezing Discontinuous Transition in Linseed Oil

by
Aleksandra Drozd-Rzoska
,
Sylwester J. Rzoska
* and
Joanna Łoś
Institute of High Pressure Physics, Polish Academy of Sciences, ul. Sokołowska 29/37, 01-142 Warsaw, Poland
*
Author to whom correspondence should be addressed.
Biophysica 2024, 4(1), 34-57; https://doi.org/10.3390/biophysica4010003
Submission received: 14 November 2023 / Revised: 8 January 2024 / Accepted: 14 January 2024 / Published: 23 January 2024

Abstract

:
The long-range supercritical changes of dielectric constant, resembling ones observed in the isotropic liquid phase of liquid crystalline compounds, are evidenced for linseed oil—although in the given case, the phenomenon is associated with the liquid–solid melting/freezing discontinuous phase transitions. This ‘supercriticality’ can be an additional factor supporting the unique pro-health properties of linseed oil. Broadband dielectric spectroscopy studies also revealed the ‘glassy’ changes of relaxation times, well portrayed by the ‘activated and critical’ equation recently introduced. In the solid phase, the premelting effect characteristic for the canonic melting/freezing discontinuous transition, i.e., without any pretransitional effect in the liquid phase, has been detected. It is interpreted within the grain model, and its parameterization is possible using the Lipovsky model and the ‘reversed’ Mossotti catastrophe concept. For the premelting effect in the solid state, the singular ‘critical’ temperature correlates with the bulk discontinuous melting and freezing temperatures. Consequently, the report shows that linseed oil, despite its ‘natural and complex’ origins, can be considered a unique model system for two fundamental problems: (i) pretransitional (supercritical) effects in the liquid state associated with a weakly discontinuous phase transition, and (ii) the premelting behavior in the solid side of the discontinuous melting/freezing discontinuous transition.

1. Introduction

The extraordinary pro-health properties of flax seeds and linseed oil have been known since ancient times. Hippocrates, the ‘father’ of medicine (~400 BCE), recommended them as a significant food remedy [1]. Near 800 CE, King and Emperor Charles the Great (Charlemagne) indicated them to be essential for a healthy life in a special emperor’s mandate [2]. In modern times, Mahatma Gandhi recommended linseed oil a pro-health remedy and food addition [3]. These opinions are shared by doctors and nutritionists also nowadays [4,5]. Generally, the pro-health properties of linseed oil are explained by specific features of their components [4,5,6,7,8,9,10,11,12,13,14,15,16,17,18,19,20,21,22,23]. This report shows that yet another factor, omitted so far, can be significant: supercriticality [24,25,26,27,28].
It is well proven that linseed oil is an amazing pro-health food additive and a skin conditioner for natural cosmetics [11,16,21]. It can help wound healing and shows anti-inflammatory and regenerative properties [5,8,12,19,22]. It supports cardiovascular health by acting towards maintaining the required cholesterol level [7,13,17]. There are suggestions for its stimulation impact on the immune system [9,23]. The positive influence of linseed oil is broadly recognized in the fight against obesity, arthritis, and hypertension [9,13]. Focusing on cosmetics-related issues, it can strengthen skin, support redness reductions, repair skin damage (including flaky epidermis), heal skin burns and frostbite, and create smooth and soft skin [5,9,17,18,19,22]. Linseed is also indicated as a prophylactic anti-cancer agent for breast, colon, and prostate problems [4,17,19,23].
The bio-activity, excellent component proportions, and their synergic interactions are used to explain linseed oil’s extraordinary properties [4,5,6,7,8,9,10,11,12,13,14,15,16,17,18,19,20,21,22,23]. The oil comprises polyunsaturated fatty acids (PUFA), phytoestrogenic lignans (secoisolariciresinol diglucoside, SDG), and an array of antioxidants such as phenolic acids and flavonoids. The beneficial PUFA of flax lipids are α-linolenic acid (ALA, 30–70% of the total fatty acid content), linoleic (20% of the total fatty acid content), and oleic acid (30% of the complete fatty acid content) [6,13,20].
Supercriticality means the presence of exceptional properties in the broad surrounding of the critical point, i.e., a continuous phase transition [28,29,30,31]. These properties result from the appearance and dominance of multi-molecular fluctuations associated with approaching the new phase. Their lifetime τ f l . and size (correlation length: ξ ) show the singular, critical behavior [29]:
ξ T = ξ 0 T T C ν ,
τ f l . T = τ f l . 0 T T C z ν ,
where T C is the critical temperature, ν denotes the critical exponent for the correlation length, and z is the so-called dynamic exponent; z = 2 for the conserved and z = 3 for the non-conserved order parameter.
The ‘critical quasi-phase‘ emerging near the critical point has led to innovative supercritical technologies, strongly developing due to their ‘green’ features [24,25,26,27,28]. They are related to the possibility of the selective extraction of components or selective chemical reactions, whose strength can be tuned by the distance from T C . Supercriticality is indicated as a promising technology for innovative processing or microbiological preservation of food or pharmaceuticals [24,26]. Supercriticality can also promote the adhesion of some dissolved agents to the surface of solid microelements, leading to their encapsulation [24,27].
For supercritical technologies, two model relations are essential. The first one is the Kirkwood equation linking chemical reaction rate k and solubility s to the dielectric constant ε [24,28,32]:
k , s = p e x p A Δ P R T 1 ε 1 ,
where Δ P is the difference in polarity between the reactant and product, p is the prefactor related to the given property, and ‘A’ denotes the system-dependent constant.
The second one is the Noyes–Whitney dependence [24,28,32,33]:
d m d t = S D d C S C B ,
where m is the mass of the dissolved material, t is the processing time, S is the surface area of the solute particle, D is the diffusion coefficient, d is the thickness of the concentration gradient layer, and C S and C B are dissolving particle surface and bulk concentrations (mol/L).
In Ref. [28], the authors (SJR, ADR) converted the latter to the form containing the DC electric conductivity σ , a parameter relatively simple for experimental tests:
d m d t = k B n q 3 S d T σ T C S C B = K T σ T C S C B ,
where n is the number of electric carriers/charges ( q ), K = c o n s t , k B is the Boltzmann constant, and K is the system-dependent constant.
The above brief explanation indicates that supercriticality can be an important factor supporting, if not shaping, the unique properties of linseed oil. However, to the best of the authors’ knowledge, neither communications nor suggestions regarding the appearance of the supercriticality in linseed oil or other vegetable oil have appeared.
Broadband dielectric spectroscopy (BDS) constitutes one of the basic experimental methods in studies of pretransitional properties in liquid dielectric systems [34,35]. They are detected in the BDS spectrum via messages related to the arrangement of permanent dipole moments and the dynamics of related processes.
There are numerous reports on dielectric studies in linseed and other vegetable oils. These tests focus mainly on assessing the quality of such oils by comparing dielectric constant values or, more generally, the real part of dielectric permittivity. The results of such studies are only presented visually, with 5–10 K scanning steps, and within a limited temperature range [36,37,38,39,40,41,42,43,44,45,46,47,48,49,50,51,52,53,54,55]. The authors have not found any trial for functionally portraying dielectric constant temperature changes. Only recently dielectric constant changes have been reported in the liquid and solid phases [55]. Presented there dielectric constant changes can be related to a possible hallmark of a pretransitional effect. However, they were not discussed in such a direction [55]. Regarding dynamic dielectric properties, such as DC electric conductivity or the primary relaxation time, the Debye- or Eyring-type [33] temperature evolutions were suggested, although the mentioned limited temperature range can bias the validity of such conclusions [36,41,45,49,50,54,55].
This work presents high-resolution studies in linseed oil over a wide temperature range (~200 K). This enabled the innovative distortion-sensitive and derivative-based analysis developed by the authors [35,56,57,58,59,60]. The scan covered the static and dynamic domains of the complex dielectric permittivity and the hardly tested-but significant for applications–low frequency region, located below the static domain [34,60,61].
The report shows that such a ‘natural and complex’ system as linseed oil exhibits previously unknown model features regarding some fundamental and still puzzling phenomena, namely (i) in the liquid state pretransitional (s upercritical) effects associated with a weakly discontinuous phase transition [29], and (ii) the premelting behavior in the solid side of the discontinuous melting/freezing transition [62].
The obtained temperature characterizations indicate a possible important role of the supercritical effect, driven by multimolecular critical fluctuations, on the unique properties of linseed oil.

2. Materials and Methods

Broadband dielectric spectroscopy (BDS) [34] measurements were performed using the Novocontrol Alpha-A impedance analyzer supplemented with a Novocontrol Quattro temperature control unit. The complex dielectric permittivity ε * = ε i ε scans were carried out in the frequency range of 1   H z < f < 10   M H z with 5–6-digit resolution at ~230 tested temperatures, for a temperature range ca. 200 K. The real component of the dielectric permittivity was determined as ε f = C f / C 0 , where C is the capacitance for the measurement capacitor filled with the tested sample and C 0 is for the empty capacitor. The imaginary part was calculated using the basic relation: ε f = 1 / 2 π f R f C 0 , where R f is for the frequency-related resistivity [34]. The accuracy of the temperature stabilization was ± 0.1   K in the basic mode, and could be improved to even ± 0.02   K . The measurement system removed all parasitic electric capacitances and was supported by the software controlling the measurement process and delivering data in the required representation, including the complex dielectric permittivity, conductivity, and modulus.
Figure A1 in Appendix A shows the obtained dielectric permittivity spectra, indicating characteristic regions manifested in frequency scans. For the static domain (in liquids, usually 1   k H z < f < 1   M H z ), the frequency shift does not lead to a significant change in ε f [34]. Above the static domain, there is the relaxation domain, related to the reorientation of permanent dipole moments. Its hallmark is the primary relaxation ε f loss curve, whose peak (maximum) estimates the primary relaxation time for basic orientational processes: τ = 1 / 2 π f p e a k = 1 / ω p e a k [34]. It can be estimated using the derivative of experimental data via the condition d l o g 10 ε f = f m a x / d l o g 10 f = 0 [35]. It is notable that for each tested temperature even 12–15 decades in frequency could be scanned, using the impedance analyzer used in tests.
A strong rise in dielectric permittivity occurs for low frequencies, below the static domain. It can be used for determining the DC electric conductivity: σ f = ω ε 0 ε f = 2 π f ε 0 ε f [34]. Consequently, the appearance of the horizontal, frequency-independent behavior in l o g 10 σ f vs. l o g 10 f in the low-frequency (LF) domain determines and is the proof of the existence of DC electric conductivity σ f = σ in a given system [33]. Such behavior is presented in Figure A2 and Figure A3 in Appendix A for the tested linseed oil. Distortions from DC electric conductivity-related behavior can be linked, for instance, to the polarization of electrodes via the Maxwell–Wegner effect [34], directly coupled to the macro-translation of ‘free’ ionic species/contaminations. The DC electric conductivity is coupled to the primary relaxation time via the Debye–Stokes–Einstein (DSE) law σ T τ T = c o n s t . For complex systems with some ‘local structure’, the fractional (fDSE) law appears: σ T τ T S = c o n s t , where S 1 denotes the fractional (decoupling) exponent [63].
The strong rise of the real part of the dielectric permittivity ε f in the LF domain is often explained heuristically as the impact of non-defined residual ionic contaminations [33]. In the authors’ opinion, the phenomenon can also be explained by the translational motions of basic molecules, which supports the coupling between translational and orientational motion given in the DSE and fDSE laws [60,63]. The impedance analyzer system’s unique monitoring possibilities and the experiment’s design enabled the derivative-based and distortion-sensitive analysis of data [35,56,57,58,59,60].
BDS studies were carried out using a flat-parallel capacitor with gold-covered plates made from Invar (diameter 2 r = 20 mm; distance between plates d = 0.4 mm). The basic voltage applied in BDS measurements was U = 1 V. The setup (Quattro Novocontrol unit) enabled temperature control of T = ± 0.02 K. Regarding the dielectric constant, values of ε f = ε for frequencies in the middle of the static domain for subsequent temperatures were taken into account, in practice shifting from ~10 kHz to ~1 kHz when cooling from 353 K to 123 K (see Appendix A). This allowed for avoidance of the biasing impacts of the low-frequency (LF) effects and high-frequency (HF) relaxation processes located below and above the static domain.
Preliminary DSC scan tests of the linseed oil between ~220 K and 450 K were carried out using the homemade apparatus, using m ~ 1 g of the sample and copper–constantan thermocouples for monitoring. The results are presented in Figure 1, overlapping those reported earlier [64,65,66,67]. This also includes DSC results at higher temperatures of T > 450 K, based on Ref. [65], to complete the picture. This domain is beyond the topic of the report. For the given report, the most important factor is the strong manifestation of the melting/freezing temperature.
Regarding the tested material, golden flax seeds were used from the blue-flowered flax species Linum usitatissimum, widely cultivated in Poland. The linseed oil was obtained via cold pressing of seeds in the laboratory. Seeds were purchased from Herbapol S.A., Lublin, Poland, the leading Polish company specializing in high-quality pro-health seeds and herb products. Triple filtering of the oils using coffee filters was carried out.

3. Comments on Critical Phenomena, Supercriticality, and Melting/Freezing Discontinuous Transition

Critical Phenomena Physics [29,30,31] represents one of the grand universalistic successes of 20th-century science. It explained and described common patterns appearing when approaching the critical temperature ( T C , continuous phase transition) in systems qualitatively different at the microscopic level. It covers the surroundings of the Curie temperature in magnetic or ferroelectric systems [68], liquid crystals (LCs) [29,56,57,58,59,60], the gas–liquid (G-L) critical point [25], mixtures of limited miscibility [30] and even relaxor ceramics [69] with ‘diffused’ paraelectric–ferroelectric transition, as shown very recently. In each case, the same general pattern for pretransitional effects of different physical magnitudes L T T C has been observed:
L T = l 0 T T C λ + ,
where l 0 is the prefactor and λ is the critical exponent.
Critical exponents are universal, i.e., they do not depend on the microscopic properties of a given system but on such general properties as the space and order parameter dimensionalities d , n . Moreover, only two critical exponents are independent because they are linked via a set of so-called scaling equations [29]. The mentioned universal behavior is associated with the dominance of multi-element/multi-molecular fluctuations, in which size and life grow infinitely for T T C (see Equations (1a) and (1b)) [29]. The name ‘supercritical’ is used for the domain above T C , or also above the critical pressure P C , if it is necessary for the given system [29,30]. The supercritical domain is dominated by precritical fluctuations with the symmetry of the next, more ordered phase. Pretransitional/supercritical effects are used by supercritical technologies, as discussed in the Introduction. The possibility of tuning selective solubility or chemical reaction rate by decades, simply by the distance from the critical point, is worth stressing [28,30]. So far, this technology has been explored using the supercritical domain of the gas–liquid critical point. As the ‘critical matrix’, CO2 is most often used. It is supplemented by small amount of additional components to support reaching the desired technological target [24,26,27].
For the efficiency of supercritical technologies, the precritical anomaly of the dielectric constant and the density of the supercritical domain are important [24,26,27]. For the latter it is important that is notably larger than generally expected for the gas phase [25,28]. Consequently, one might assume that ‘using’ the supercritical region directly in a liquid phase could be optimal. However, only a single liquid–gas critical point is allowed for one-component systems, according to the Gibbs–Kohnstamm phase rule [30]. Nevertheless, in the last decades, evidence for the second liquid–liquid critical point in some liquids has appeared. Unfortunately, the related pretransitional effects are weak, and the phenomenon still constitutes a cognitive puzzle [70,71].
Notwithstanding, there is a unique case of so-called weakly discontinuous phase transitions between two fluid phases, namely isotropic liquid and nematic or smectic liquid crystalline (LC) mesophases [29,56,57,58,59,60,61]. In the given case, melting/freezing from the isotropic liquid to an LC mesophase is limited to single elements of symmetry. The characteristic feature of such systems are strong and long-range pretransitional effects, also for the temperature or pressure dependence of dielectric constant [56,57,58,59,60,61], for which the hidden in the LC mesophase extrapolated continuous phase transition T *   is the reference. Recalling Equation (5), it means the substitution of T C with T * , where T * = T I N Δ T * , and T I N is the isotropic–nematic ‘melting’ temperature, Δ T * = 1 2   K is the metric of the transition discontinuity [29,56,57,58,59,60,61]. Unfortunately, LC compounds are expensive and can be problematic for the environmental issues. Hence, they cannot be used for supercritical technologies.
One should stress that the weakly discontinuous phase transitions constitute an exceptional case of discontinuous phase transition, with unique characterization of melting/freezing related to single elements of symmetry and long range, critical-type, pretransitional effects. They are considered within the Critical Phenomena Physics [29].
The canonic melting/freezing transition is strongly discontinuous transition, and very common in nature. Nowithstanding, it still constitutes a grand cognitive challenge despite over a century of studies [62]. In the given case, the l i q u i d c r y s t a l l i n e   s o l i d phase transition is not preceded by a pretransitional effect, and the basic characterization of the phenomenon is mainly the sudden jump of physical properties [62]. For some systems, weak and range-limited premelting effects in the solid state are observed upon heating from the solid phase [62,72] and refs. therein. Only recently, the authors of this report [72] noted the giant and critical-like premelting effect in solid nitrobenzene for dielectric permittivity in the static and the LF domains. The critical-like parameterization was associated with the singular ‘critical’ temperature T m * almost coinciding with the temperature T m , i.e., the bulk discontinuous phase transition melting temperature. The usage of dielectric scans was essential for obtaining such evidence [72].

4. Results and Discussion

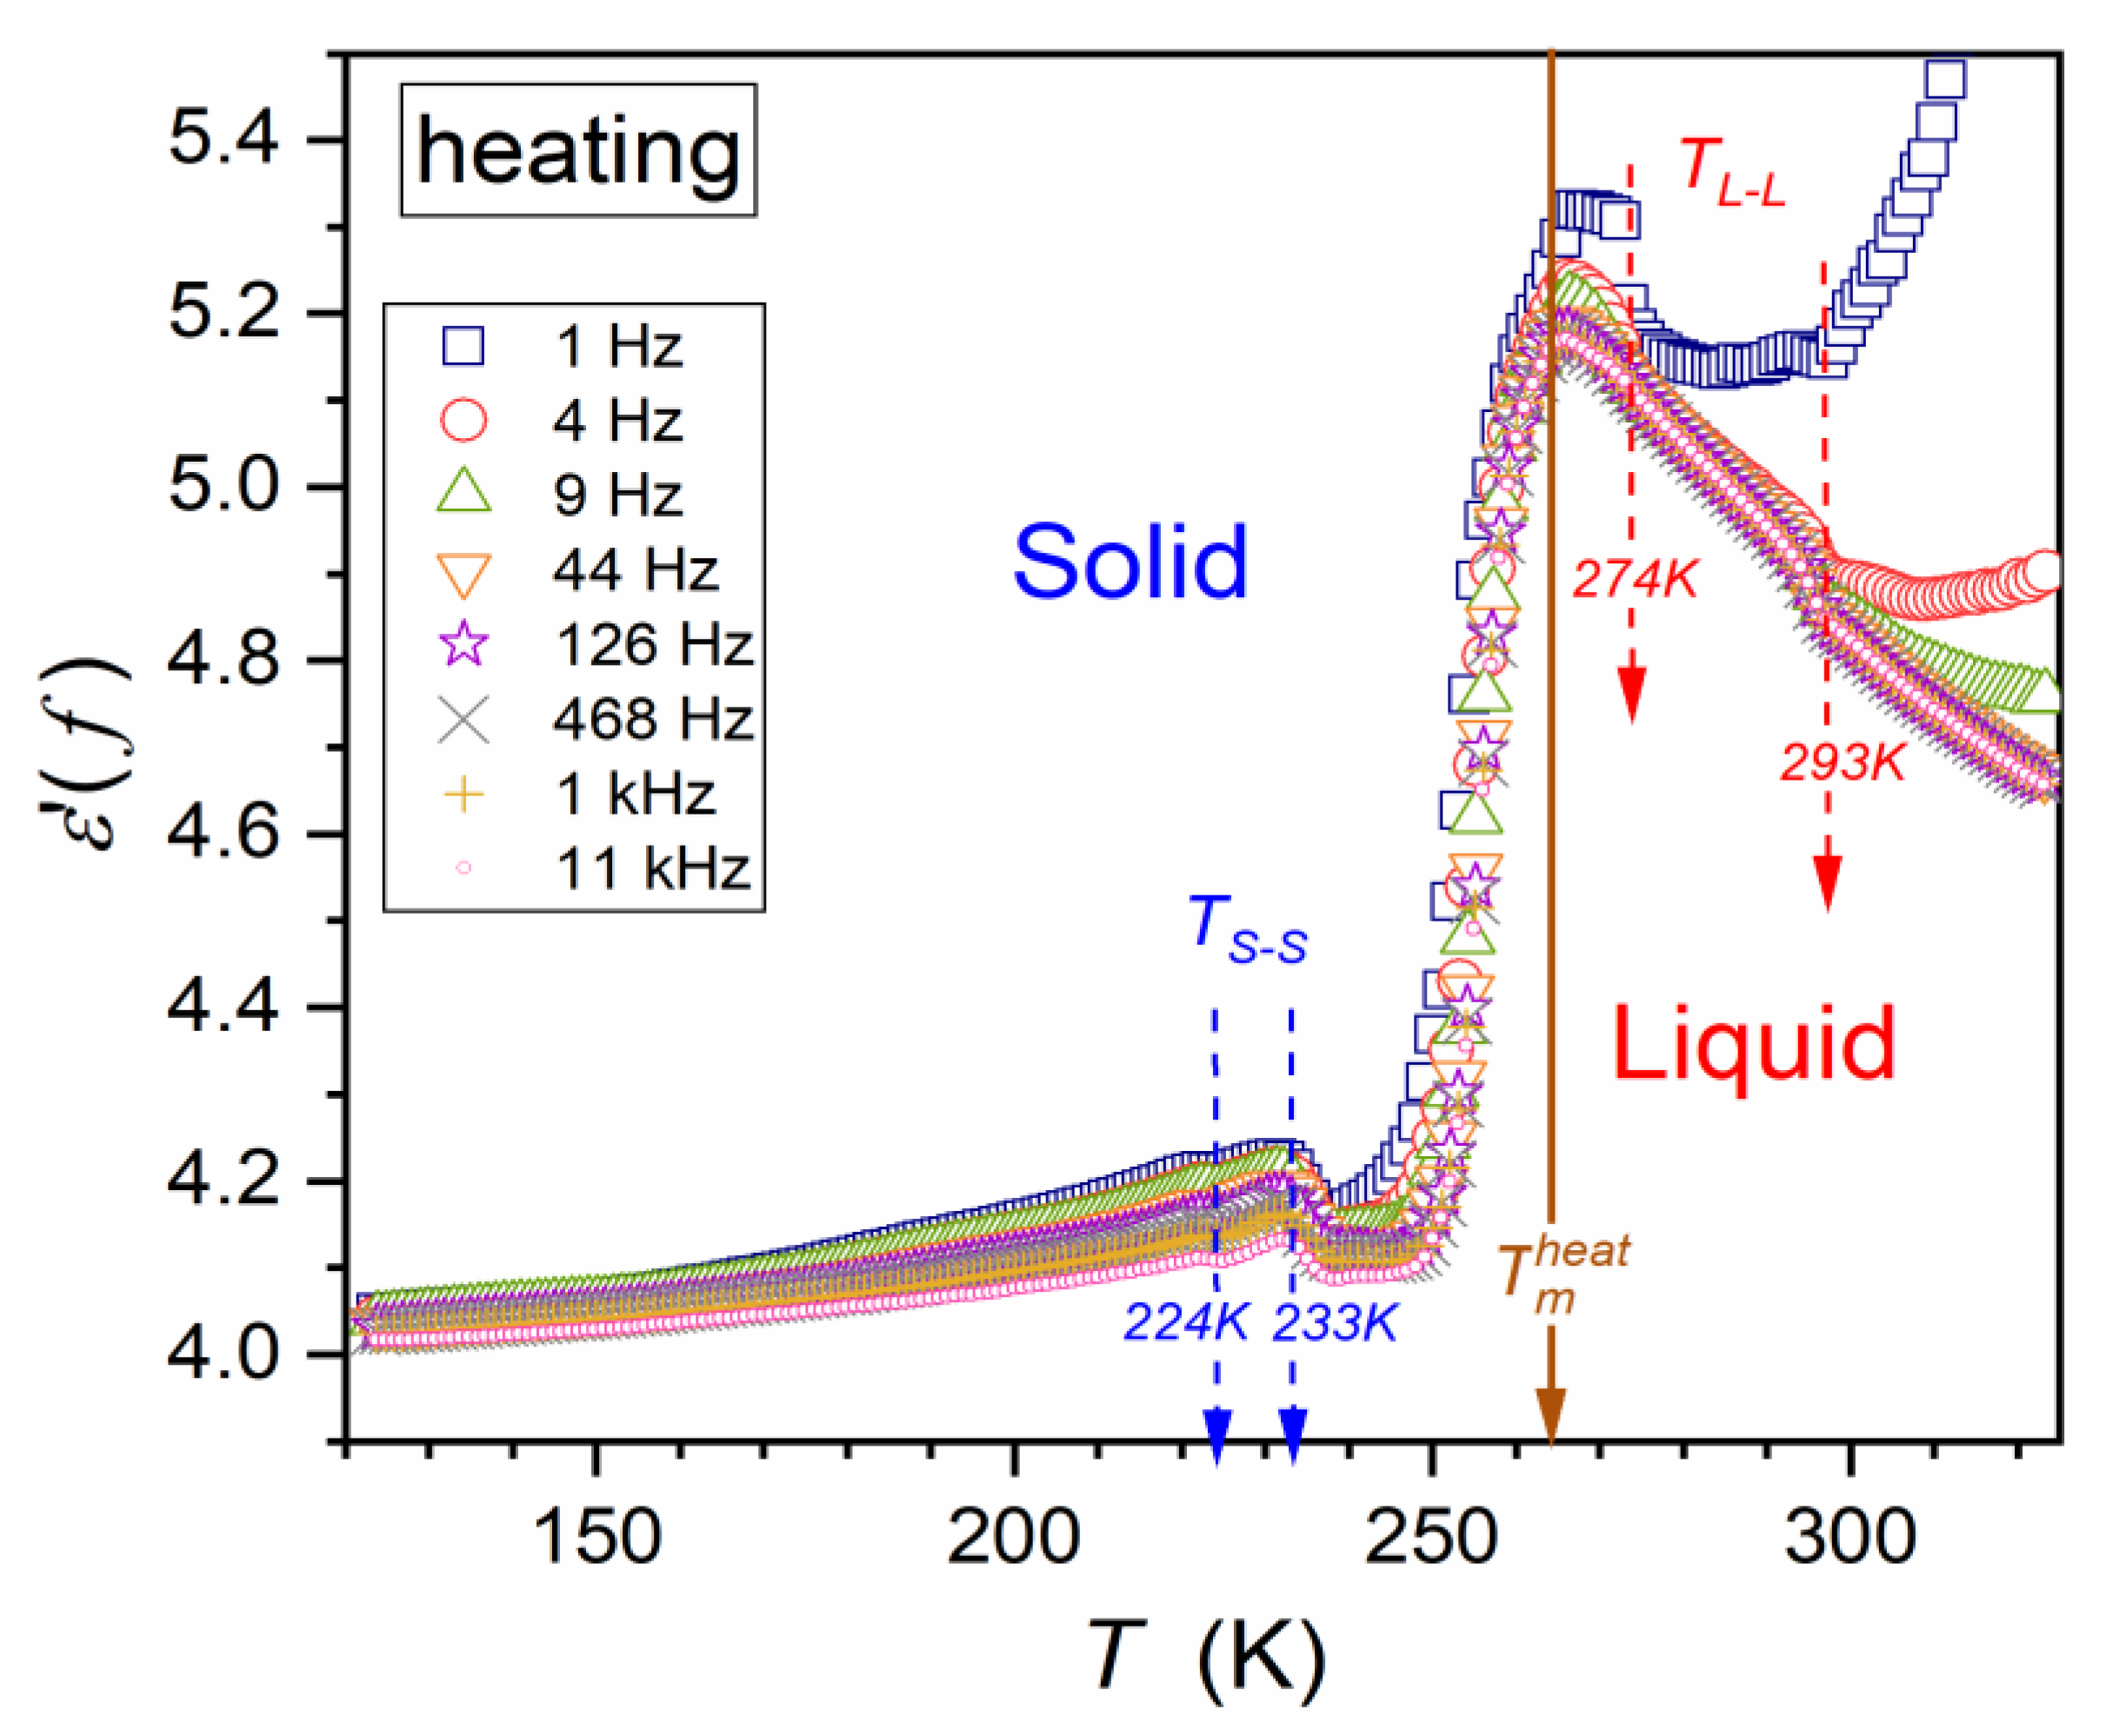
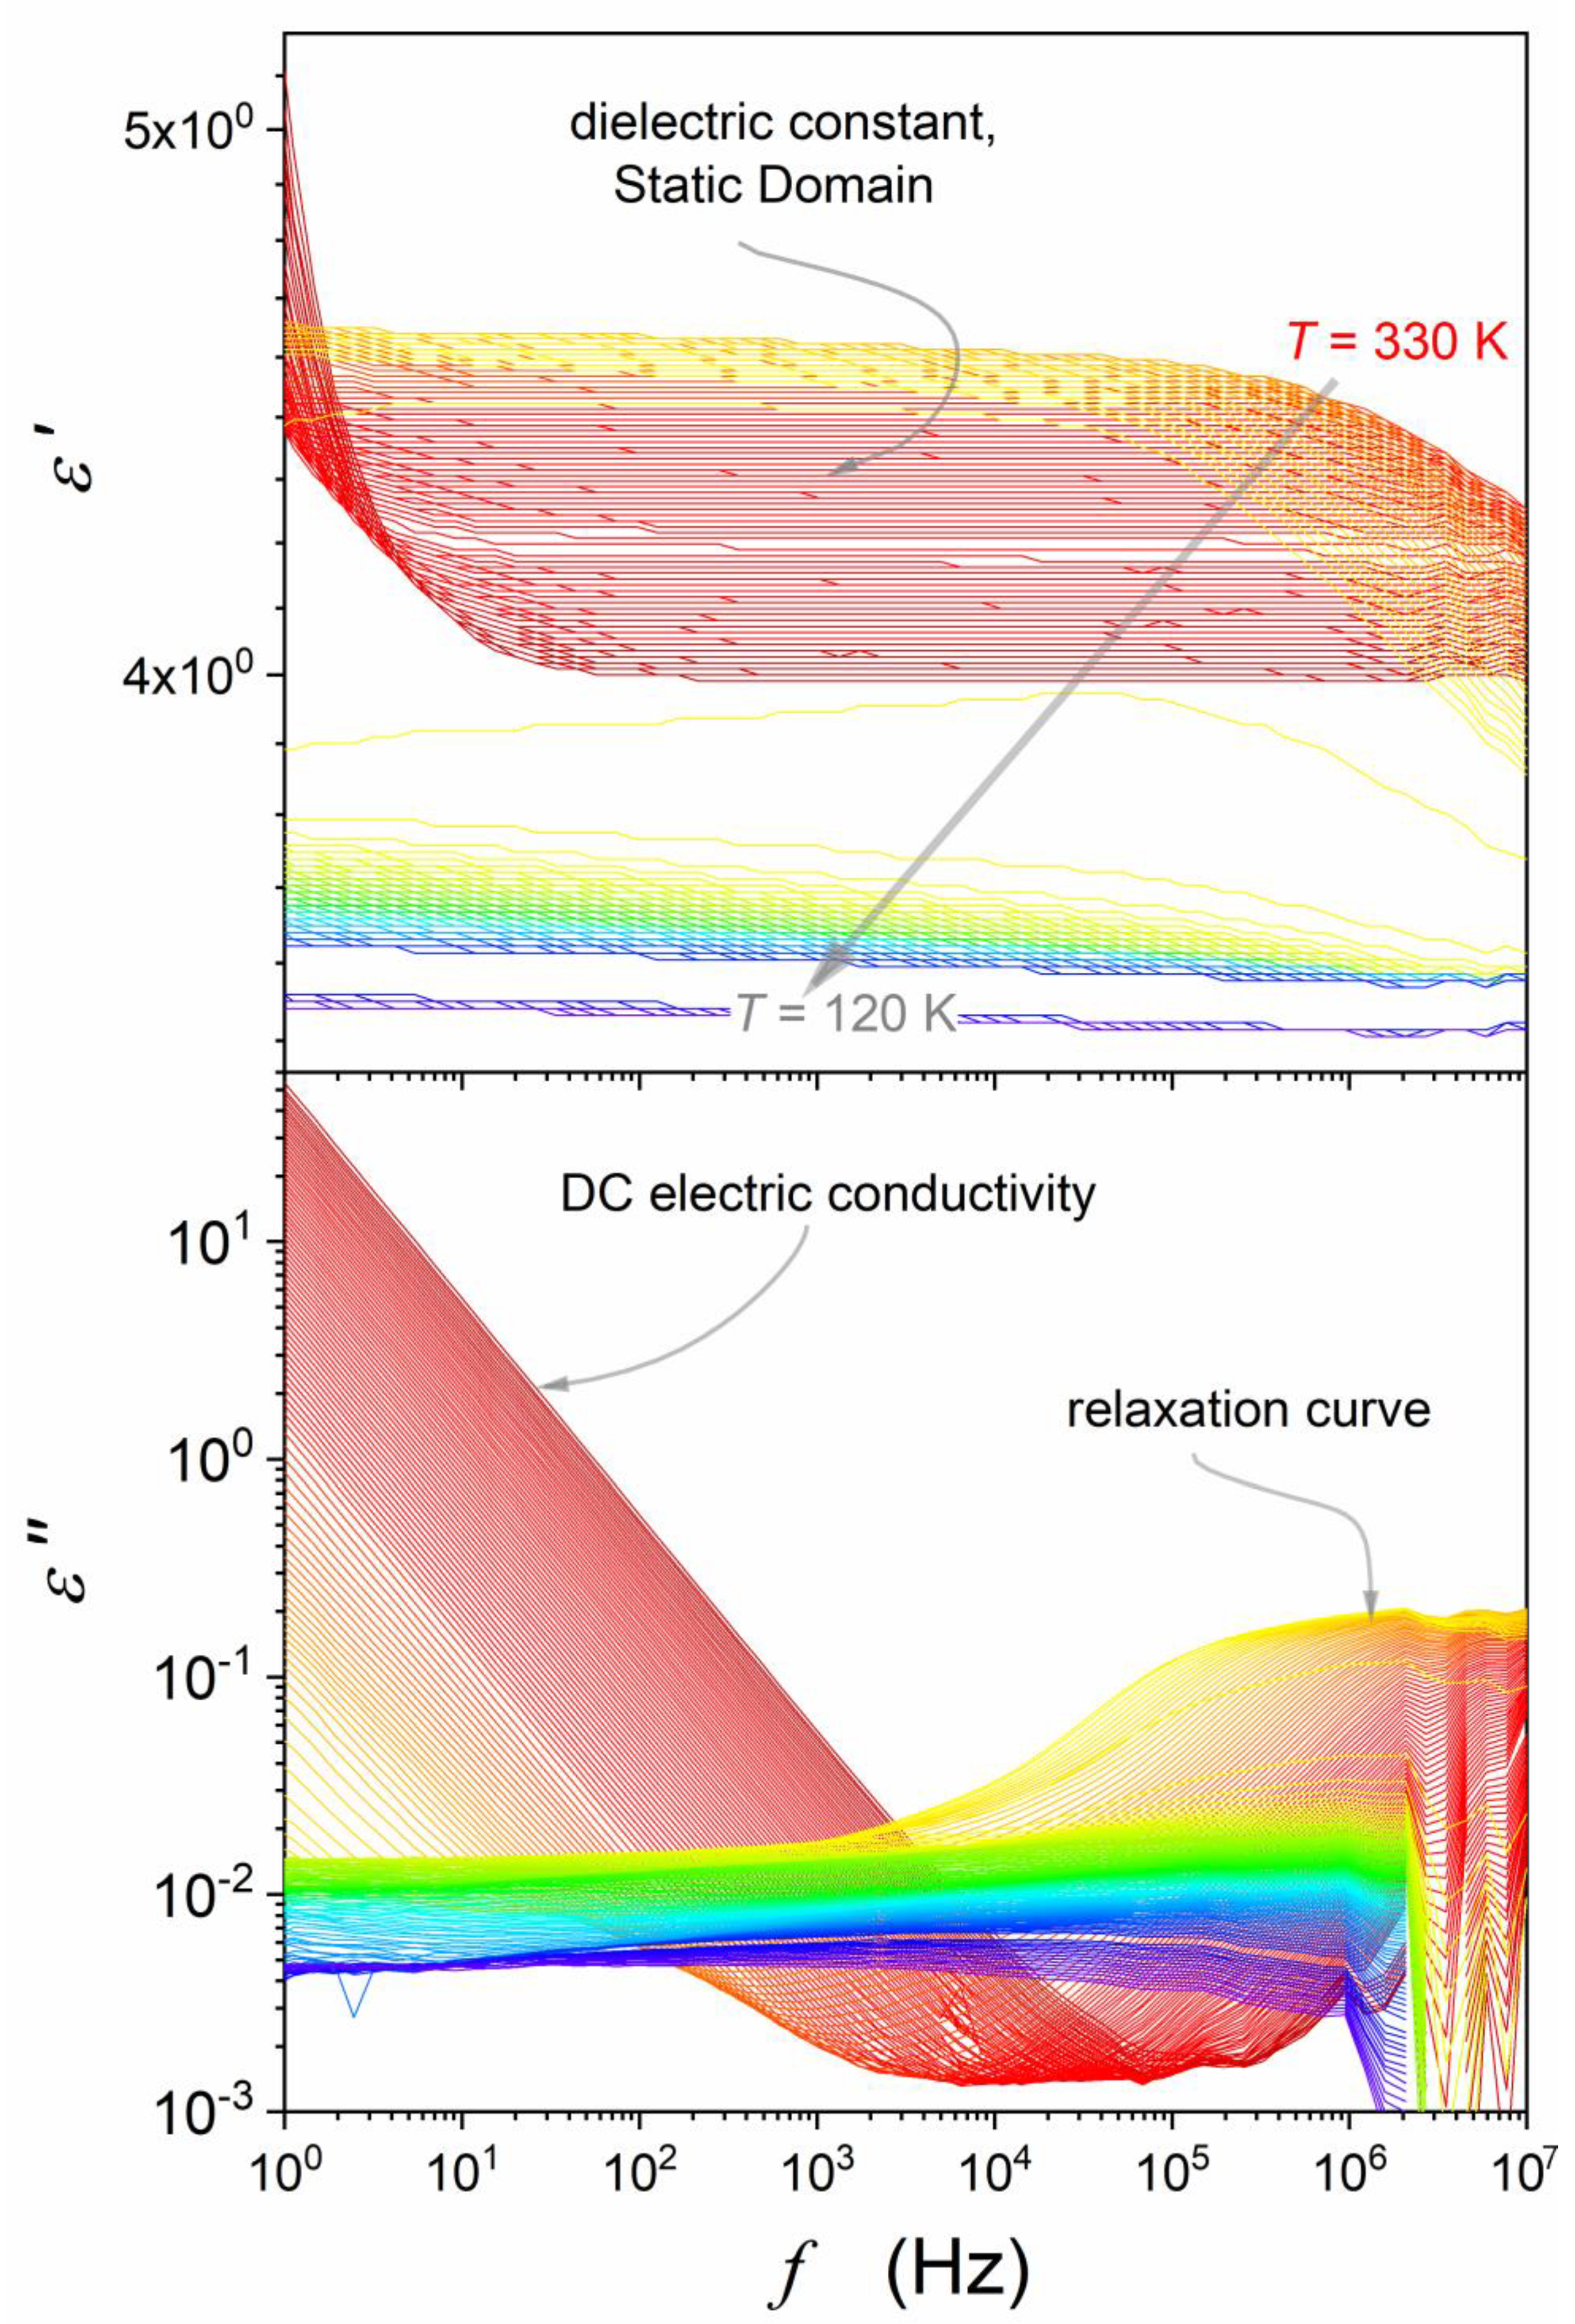
4.1. The Static Domain: Supercriticality and the Solid State Premelting and Post-Freezing Effect

There is broad evidence of dielectric studies [36,37,38,39,40,41,42,43,44,45,46,47,48,49,50,51,52,53,54,55] in edible vegetable oils, including linseed oil. They mainly focused on heuristic assessments of material quality and were carried out in limited frequency and temperature ranges. There is neither evidence nor suggestions for pretransitional or supercritical phenomena in such systems, including linseed oil. Only a hallmark can be noted in graphical presentations of results in Ref. [55].
Figure 2 presents evidence for strong and long-range supercritical changes in the dielectric constant for liquid linseed oil during cooling. Generally, the s o l i d l i q u i d phase transition reached on cooling from the liquid phase is named the freezing temperature T f , and its value depends on the cooling rate. It links T f to supercooling. The ‘constant’ material characterization is the melting temperature T m > T f reached on heating from the solid phase, i.e., for s o l i d l i q u i d transition. However, for linseed oil, the same value of T f was reached for any applied cooling rate. It facilitated reliable isothermal frequency-related BDS scans. It also indicates that for linseed oil, one can consider two material characteristics (melting temperatures) associated with s o l i d l i q u i d phase transition: T m c o o l = T f and T m h e a t = T m for s o l i d l i q u i d scans. Notably, a similar behavior was observed, for instance, in liquid crystalline isopentylcyanobiphenyl (5*CB) [73,74].
The key feature of the pretransitional/supercritical anomaly of the dielectric constant is the crossover d ε / d T > 0 d ε T c r o s s / d T = 0 d ε / d T < 0 during cooling, as visible in Figure 2 and Figure 3.
The evolution of the dielectric constant resembles the supercritical anomaly in the isotropic liquid (I) phase of rod-like liquid crystalline (LC) compounds on approaching LC mesophases (M), such as the Nematic (N), Chiral Nematic (N*), Smectic A (SmA), and Smectic E (SmE) mesophases [56,57,58,59,60,61]:
ε T = ε * + a T T * + A T T * ϕ ,
where T > T * = T I M Δ T * , T * denotes the extrapolated temperature of a hypothetical continuous phase transition between the isotropic liquid (I) and an LC mesophase (M) and Δ T *   is the metric of the phase transition discontinuity, which can range from Δ T * = 1 2   K for the I–N transition [29,56,57,58,59,60,61] to Δ T * ~ 30   K for I–SmE transition [58]. The exponent ϕ = 1 α , where α describes the pretransitional anomaly of the heat capacity. In the given case, α = 1 / 2 and is related to the mean-field or mean-field tricritical phase transitions [29,56].
This report shows the strong pretransitional/supercritical effects in liquid linseed oil for dielectric constant and ε T changes in the low-frequency domain. They can be well portrayed by relations used for the weakly discontinuous phase transition in LC materials [56,57,58,59,60,61]. The first ever evidence for the l i q u i d s o l i d phase transition has been obtained in linseed oil and presented in Figure 1 and Figure 2.
However, in the solid phase of linseed oil, premelting/prefreezing effects resembling ones reported for the canonic discontinuous phase transition in nitrobenzene [72] have been observed. See Figure 2, Figure 3 and Figure 4 for the evidence of such behavior in linseed oil.
In LC materials, Equation (6) is associated with the prenematic arrangement of permanent dipole moments within pretransitional fluctuations, appearing due to the weakly discontinuous character of the phase transition. For rod-like molecules with a permanent dipole moment approximately parallel to the long molecular axis, prenematic arrangement leads to the statistical antiparallel ordering of dipole moments. Consequently, their impact on the value of the dielectric constant within fluctuations is canceled. The following relation between the dielectric constant within fluctuation and the isotropic liquid surrounding takes place: ε f l u c t . ε s u r r o u n d i n g . The critical rise in the correlation length of fluctuations leads to the rise of their volume:
V f l . ξ T 3 T T * 3 ν = T T * 3 / 2 ,
where ν = 1 / 2 (mean-field value).
On approaching isotropic liquid–LC mesophase T I M discontinuous phase transition, and hence also   T * , the volume occupied by fluctuations increases, finally leading to its prevalence and the behavior described by d ε / d T < 0 . The temperature of the isotropic liquid–LC mesophase discontinuous transition can be recognized as the symmetry-limited melting temperature, i.e., T I M = T m [56,57,58,59,60,61].
Equation (6), with the same critical exponent α = 1 / 2 , fairly describes the pretransitional (supercritical) behavior of the dielectric constant in linseed oil up to 80 K above the liquid–solid transition, shown in Figure 2. The weakly discontinuous phase transition can be associated with the singular temperature, linked to a hypothetical continuous phase transition: T * = T m c o o l Δ T * . It is worth stressing that a minimal value of the discontinuity metric in linseed oil: Δ T * 0.6 .
The portrayal of experimental data presented via Equation (6) was supported by derivative-based analysis, for which the following description of the supercritical (in the liquid phase) anomaly can be expected [57,58,59,60]:
d ε T d T = a + 1 α A T T * α .
Such analysis reduces the number of fitting parameters. It is also a distortion-sensitive test, leading to a strong manifestation of pretransitional effects, as shown in Figure 3. The curves describing the supercritical effects in Figure 2 and Figure 3 are based on simultaneous data analysis using Equations (6) and (8). The values of parameters characterizing the supercritical behavior in the liquid phase, obtained via the analysis linking Equations (6) and (8), are given in Table 1.
On heating from the solid phase a weak manifestation of ε T premelting changes are visible in Figure 2. However for the derivative analysis presented in Figure 3, the evidence of the premelting effect is decisive, which enables a reliable parameterization. Notable in linseed oil the liquid phase is available for T > T m = T m h e a t , located well above the crossover temperature T c r o s s . A similar behavior was obtained for dielectric constant in liquid crystalline 5*CB [73,74].
Generally, no pretransitional effects are expected in the solid phase for melting or freezing discontinuous phase transitions [62]. Notwithstanding, weak and range-limited premelting effects (i.e., during heating from the solid phase) are often observed [62,72] and refs. therein. They can be as follows [62,75,76,77,78,79,80,81,82,83,84,85,86,87,88,89,90]: (i) premelting effects are ‘weak’ and range-limited, (ii) they are detected only for some systems, (iii) they are detected for selected physical properties, (iv) there are no reports on their parameterization, except the very recent ref. [72], and (v) no solid-state pretransitional effects for freezing, i.e. on cooling from the liquid phase, are observed.
Despite the apparent limitations and problems, premelting effects are commonly considered the gateway for explaining the nature of melting/freezing discontinuous phase transitions [62,72,75,76,77,78,79,80,81,82,83,84,85,86,87,88,89,90]. This cognitive situation is qualitatively different from continuous phase transitions: understanding their origins is one of the greatest universalistic successes of 20th-century physics, as concluded in Critical Phenomena Physics [33]. Equations (1), (5) and (6) are based on this concept. Essential for success were the long-range and well-characterized pretransitional effects [29].
For melting/freezing discontinuous transitions, such pretransitional effects are (almost) absent, except for the puzzling premelting effects in the solid state [62,75,76,77,78,79,80,81,82,83,84,85,86,87,88,89,90]. In linseed oil, both premelting and post-freezing effects exist, and the latter are even stronger and longer ranged. This is evident in Figure 2 for the derivative transformation of experimental data. The following relation well portrays the premelting and post-freezing effects in the solid phase of linseed oil:
χ T = ε T 1 = a + b T + χ 0 T m , f * T 1   for   T < T m , f ,
where χ denotes the dielectric susceptibility directly coupled to the electric polarization, χ 0 is the prefactor and χ 0 = c o n s t , and T m , f * is the ‘critical-like’ temperature almost coinciding with T m or T f , the background related coefficients a ,   b = c o n s t .
The derivative of Equation (9) yields:
d ε T d T χ 0 T m , f * T 2 .
The simultaneous analysis of experimental data, presented in Figure 2 and Figure 3 led tp parameters collected in Table 2 and presented graphically in the mentioned Figures.
Very recently, the behavior described by Equations (9) and (10) was also reportedfor the premelting effect in nitrobenzene, by the authors (ADR, SJR) [72]. The grain model, introduced for the premelting effect in the solid phase [76,77,78,79,80,81], was recalled to explain the results in ref. [72]. The model links the premelting effect to grains appearing in the solid state on heating towards T m . Their appearance is linked to rising vibrations and defects within crystalline materials, leading to fragmentation and melting. Quasi-liquid nano-layers cover solid/crystalline grains. Lipovsky [91,92,93] developed the model focused on liquid nano-layers and showed their critical-like properties with the ‘critical’ temperature T m * almost coinciding with T m . He derived a set of critical-like relations describing the pretransitional evolution within liquid nano-layers. The order parameter-related susceptibility was expressed as follows [91,92,93]:
χ T T = χ 0 T m * T γ   for   T < T m * ,
where the exponent is γ = γ = 1 if the mean-field approximation obeys in the given system and T m * is the ‘critical’ temperature associated with the premelting effect and the quasi-liquid between crystalline grains.
Unfortunately, the liquid nano-layers occupy a ‘very tiny’ volume of the material in a premelting domain compared to dominated solid grains. This yields the essential experimental problem for the detection focused on liquid nano-layers. However, it was found in Ref. [72] that the BDS response from the liquid dielectric is qualitatively more significant than that from the solid/crystalline state. It enables the ‘extraction’ of the contribution from liquid nano-layers for a solid sample in the premelting region.
Following the reasoning presented in ref. [72], in the premelting region nano-constraints can create a quasi-negative pressure, i.e., stretching (‘rarefication’), weakening the dipole–dipole short-range interactions for dipolar liquid. It may yield conditions appropriate for describing dielectric properties via the Clausius–Mossotti local field [94,95] conditions. Generally, this model is limited to non-dipole liquids or hypothetical dielectric systems with (almost) non-interacting permanent dipole moments [96,97,98,99,100,101]. For such a case, the so-called Mossotti Catastrophe occurs, related to the following equation [96,97,98]:
χ T = ε T 1 = M T T C   for   T > T C ,
where χ stands for dielectric susceptibility, directly reflecting polarization changes, T C is the critical temperature, and M is a constant amplitude.
This paradox cannot occur in ‘normal’ liquid dielectrics [96,97,98,99,100]. However, conditions for its occurrence may appear in the premelting domain, as indicated above [72]. Notably, the Clausius–Mossotti local field is obeyed in ferroelectric systems, and in this case, Equation (12) is known as the Curie–Weiss equation [98,102,103,104,105]. As recently shown [69], the validation of the Clausius–Mossotti local field is associated with the inherent uniaxiality of basic ferroelectric systems. Under such conditions, χ T is the susceptibility coupled to the order parameter (polarizability) [69], and Equation (12) correlates with Lipovsky’s equation (Equation (11)).
For linseed oil in the solid phase, one can expect both factors, namely (i) weakening of dipole–dipole interactions due to nano-constraints and (ii) uniaxiality, which can indicate the mean-field pretransitional effect (see Equation (6)).
It is notable that in linseed oil a unique post-freezing effect exists. In the authors’ opinion, it can be associated with the (very) weakly discontinuous character of the liquid–solid phase transition. For such a transition, one can expect pretransitional fluctuations on both sides of the phase transition. However, in the solid phase, they are dumped by the solidification. Notwithstanding, one can expect that on cooling below T f = T m c o o l , the solidification/crystallization is influenced by fluctuations that have to exist due to the weakly discontinuous nature of the transition. It can support the formation of grains covered by liquid nano-layers also during cooling from the liquid phase.

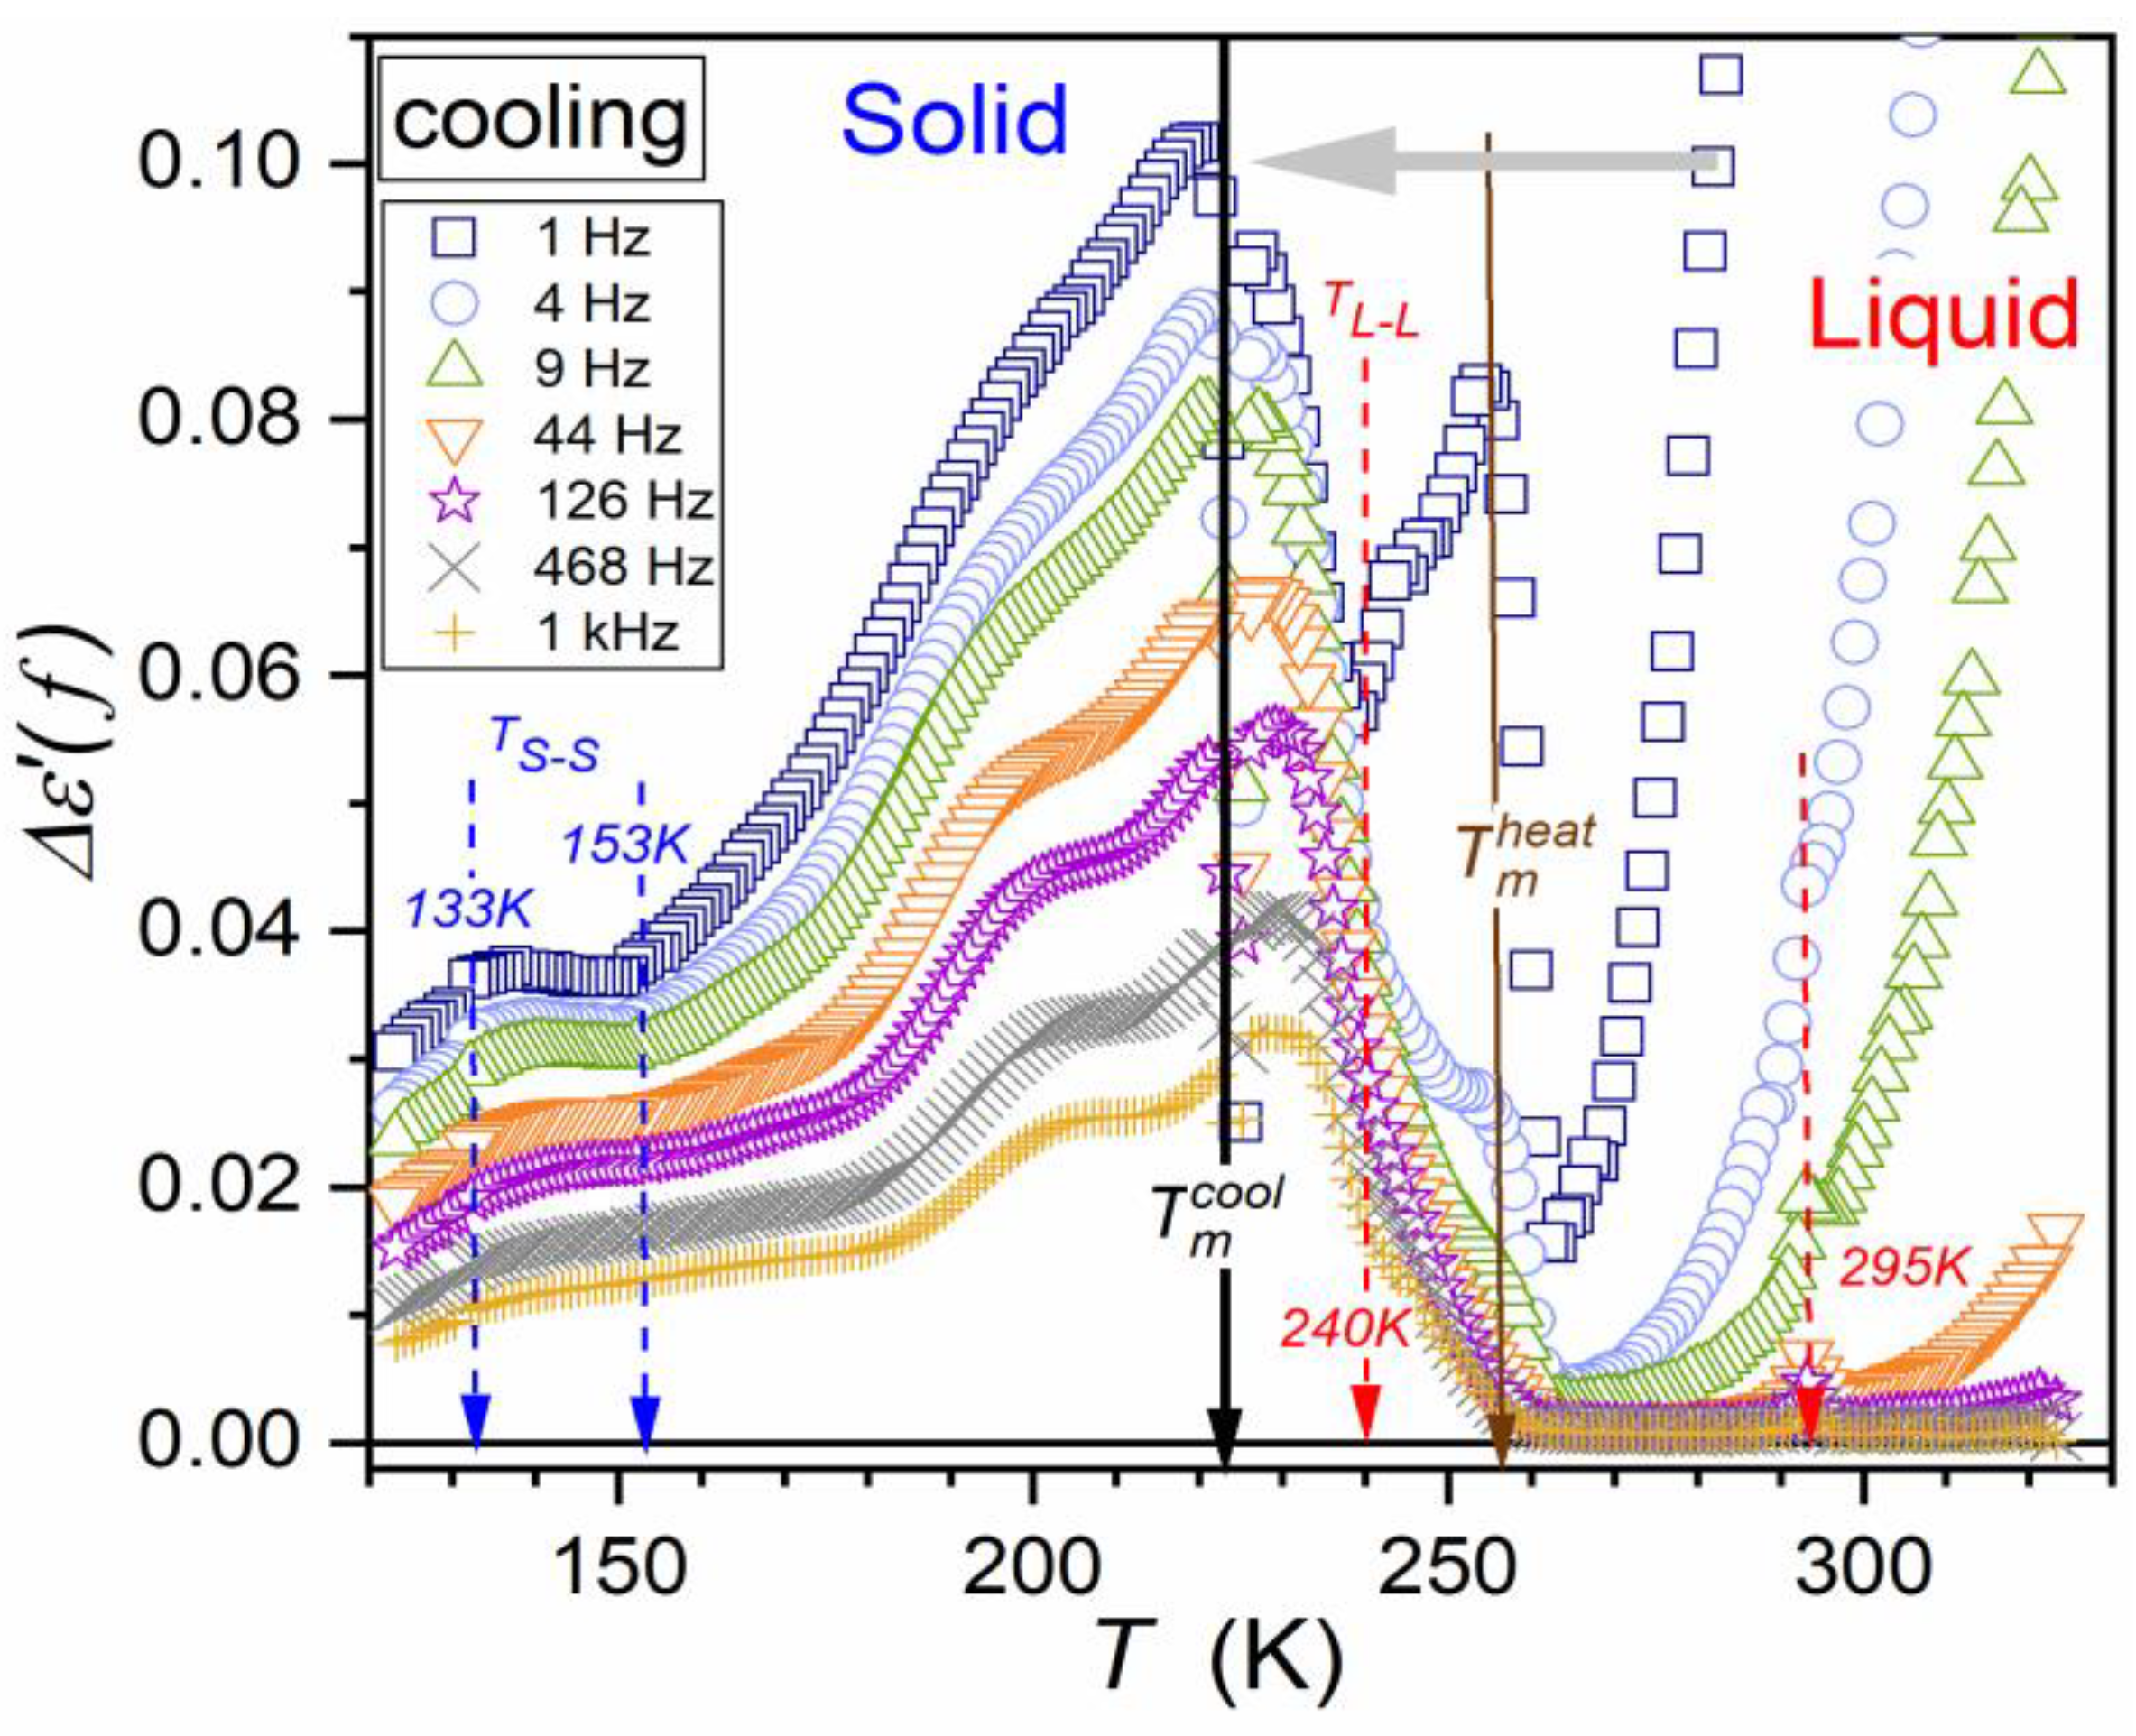
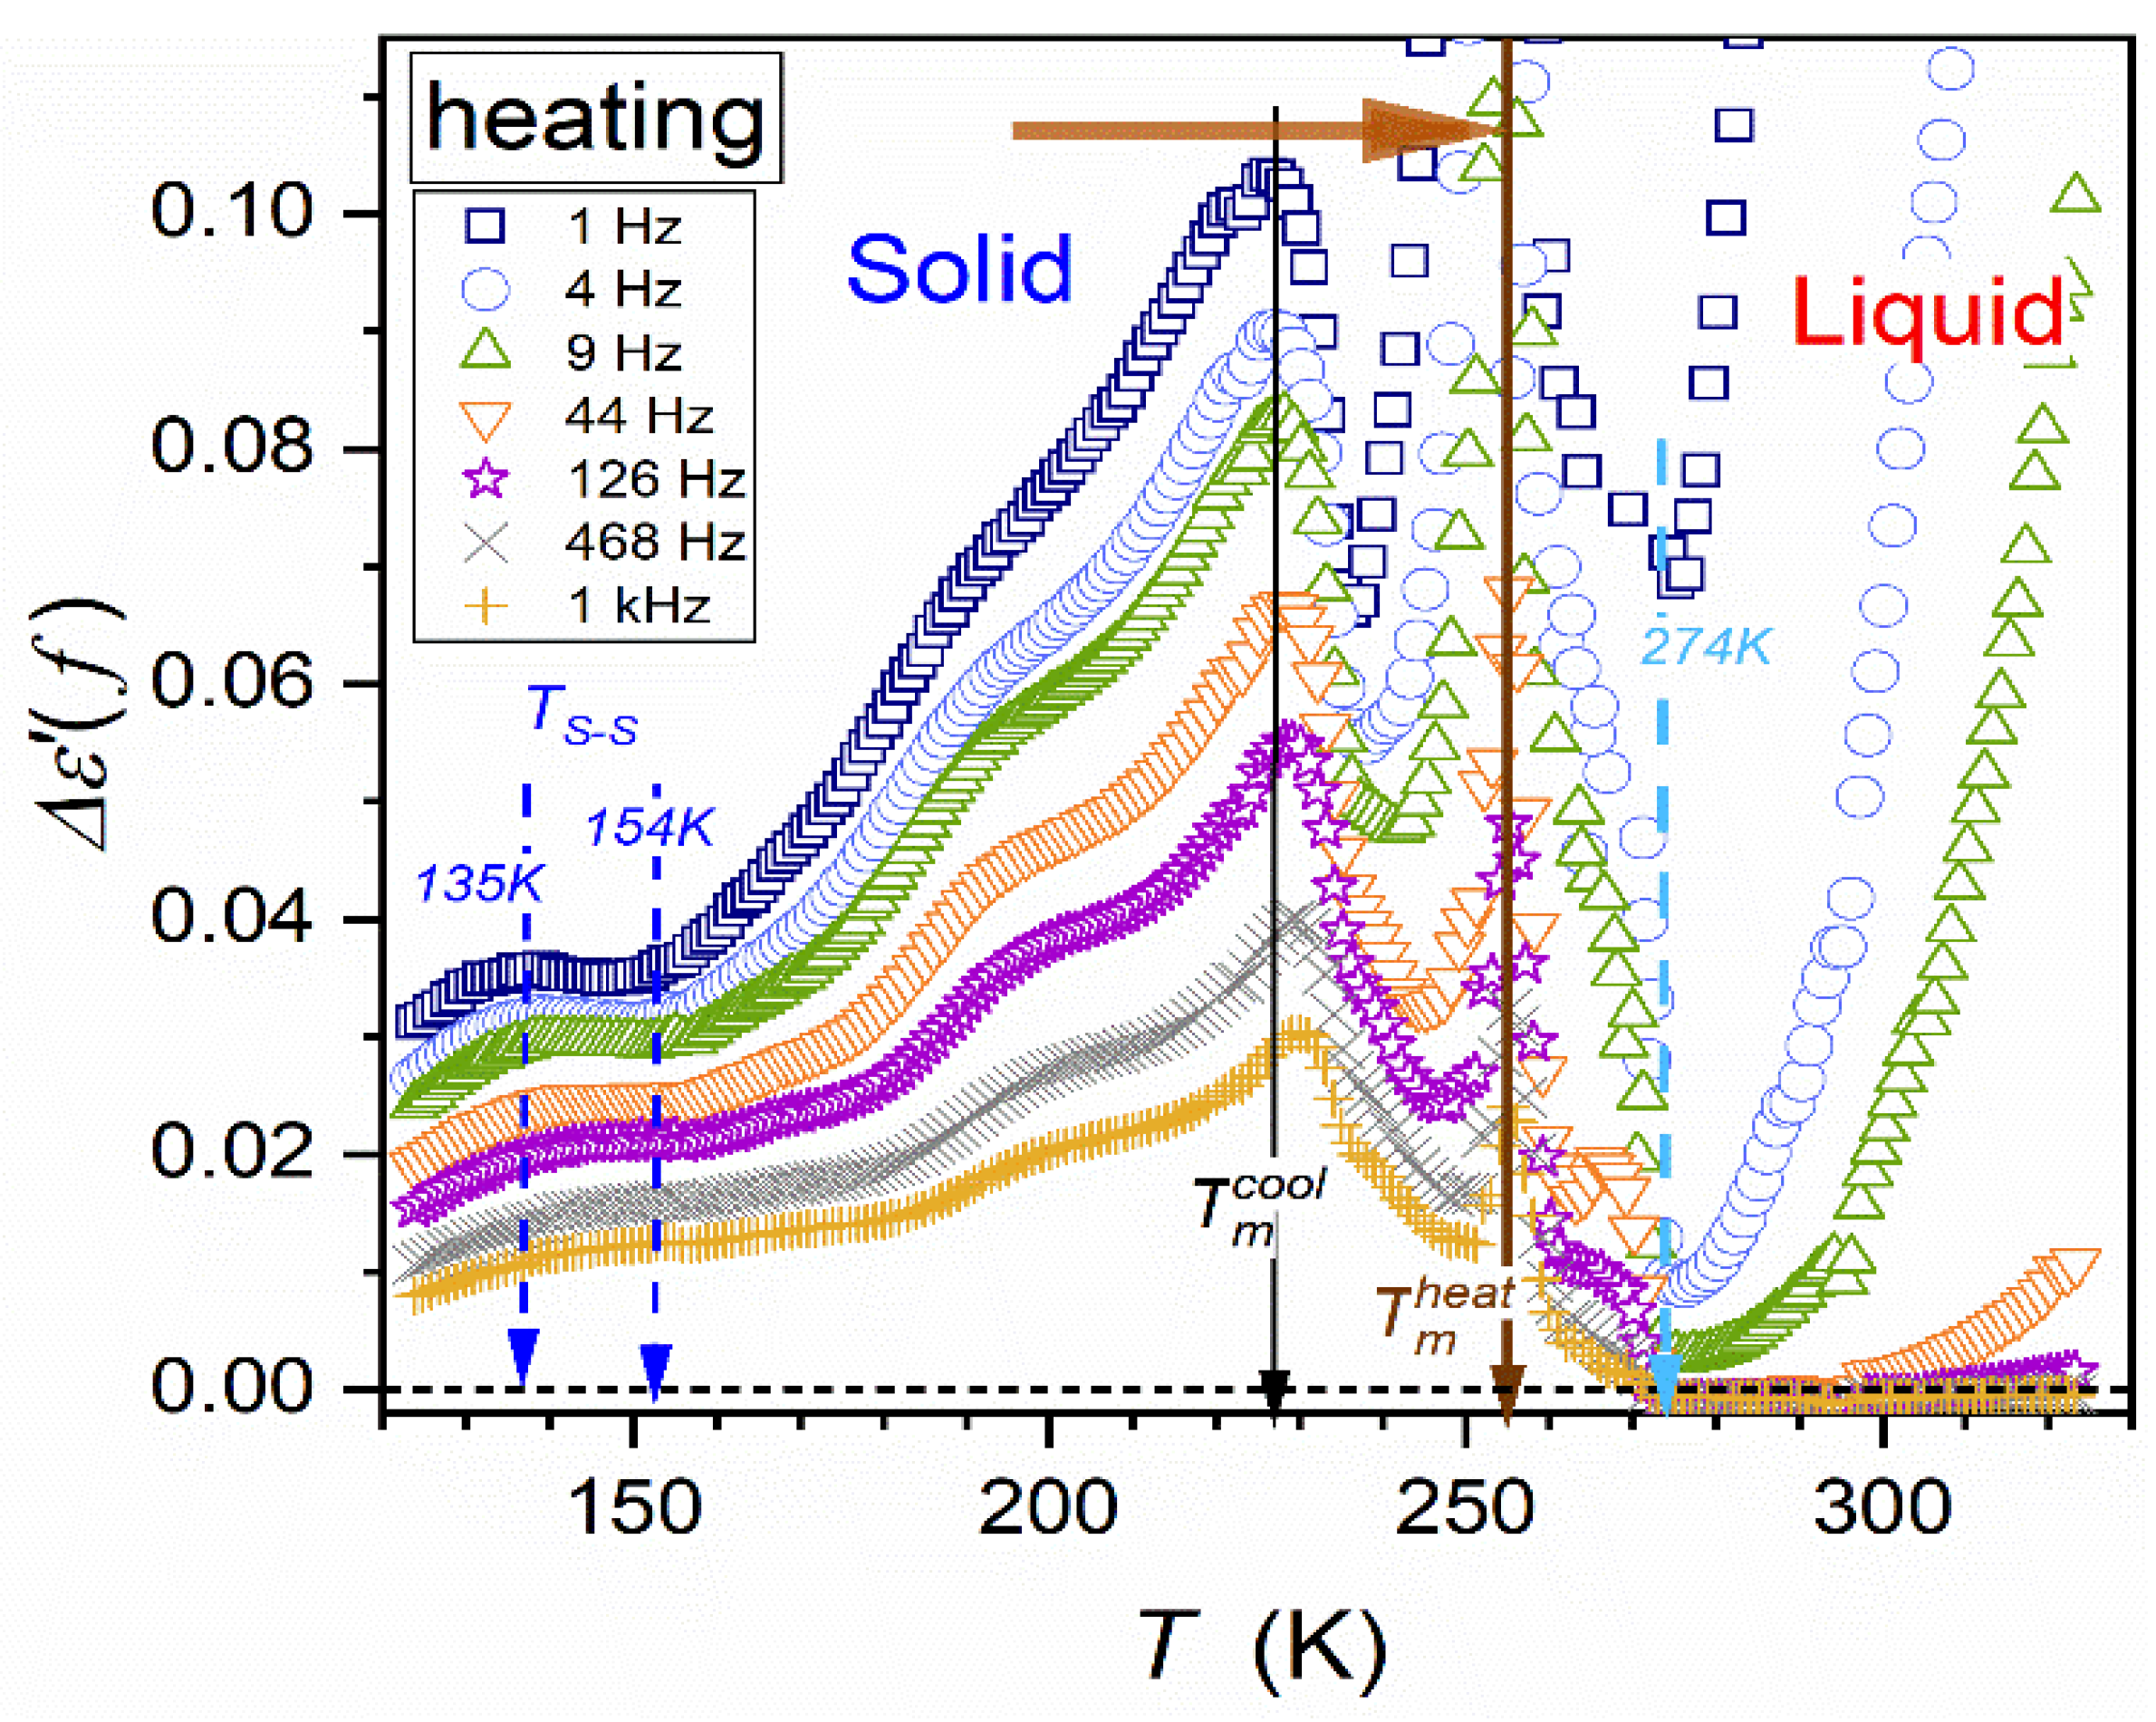
4.2. The Low-Frequency Domain: Supercriticality and Premelting/Post-Freezing Effects

The value of the dielectric permittivity strongly increases when lowering frequency below the static domain. For ε f , T , it can be discussed via the electric conductivity (see Appendix A).
The problem ε f , T changes in the LF domain remains puzzling, and it is most often only heuristically discussed [60] and refs. therein. Figure 4 and Figure 5 show ε f , T   changes in the surrounding of the liquid–solid transition down to frequencies as low as f = 1   H z . In the liquid phase, evolutions of ε T follow the pattern described by Equation (6), associated with the crossover d ε T / d T > 0     d ε T / d T < 0 . The range of such behavior decreases alongside lowering of the measured frequency. This can be associated with the loss of the ability to register the presence of supercritical fluctuations, the increase in the system significant time scale described, and the rise in the observation time scale in the LF domain. The latter is proportional to the inverse of the measurement frequency.
An dominated factor appearing on lowering the measurement frequency is the increase in translational processes impacts, which are negligible in the static frequency domain. This factor ‘extracted’ by considering the following magnitude [60,61]:
Δ ε f = c o n s t , T = ε f = c o n s t , T ε f = 10   k H z , T ,
where ε f = 10   k H z = ε is the reference dielectric constant with the negligible impact of translation-related contributions.
Such results for cooling and heating are presented in Figure 6 and Figure 7, respectively.
This contribution (Equation (13)) shows the pretransitional changes of translational processes when approaching freezing or melting temperatures. It also shows strong hallmark-changes when passing T m c o o l = ( T f ) on heating in the solid phase, despite the fact that no solid–liquid transition takes place at T m c o o l for such scanned path. A similar phenomenon is visible when passing   T m h e a t for liquid-phase cooling, in the way towards T m c o o l .

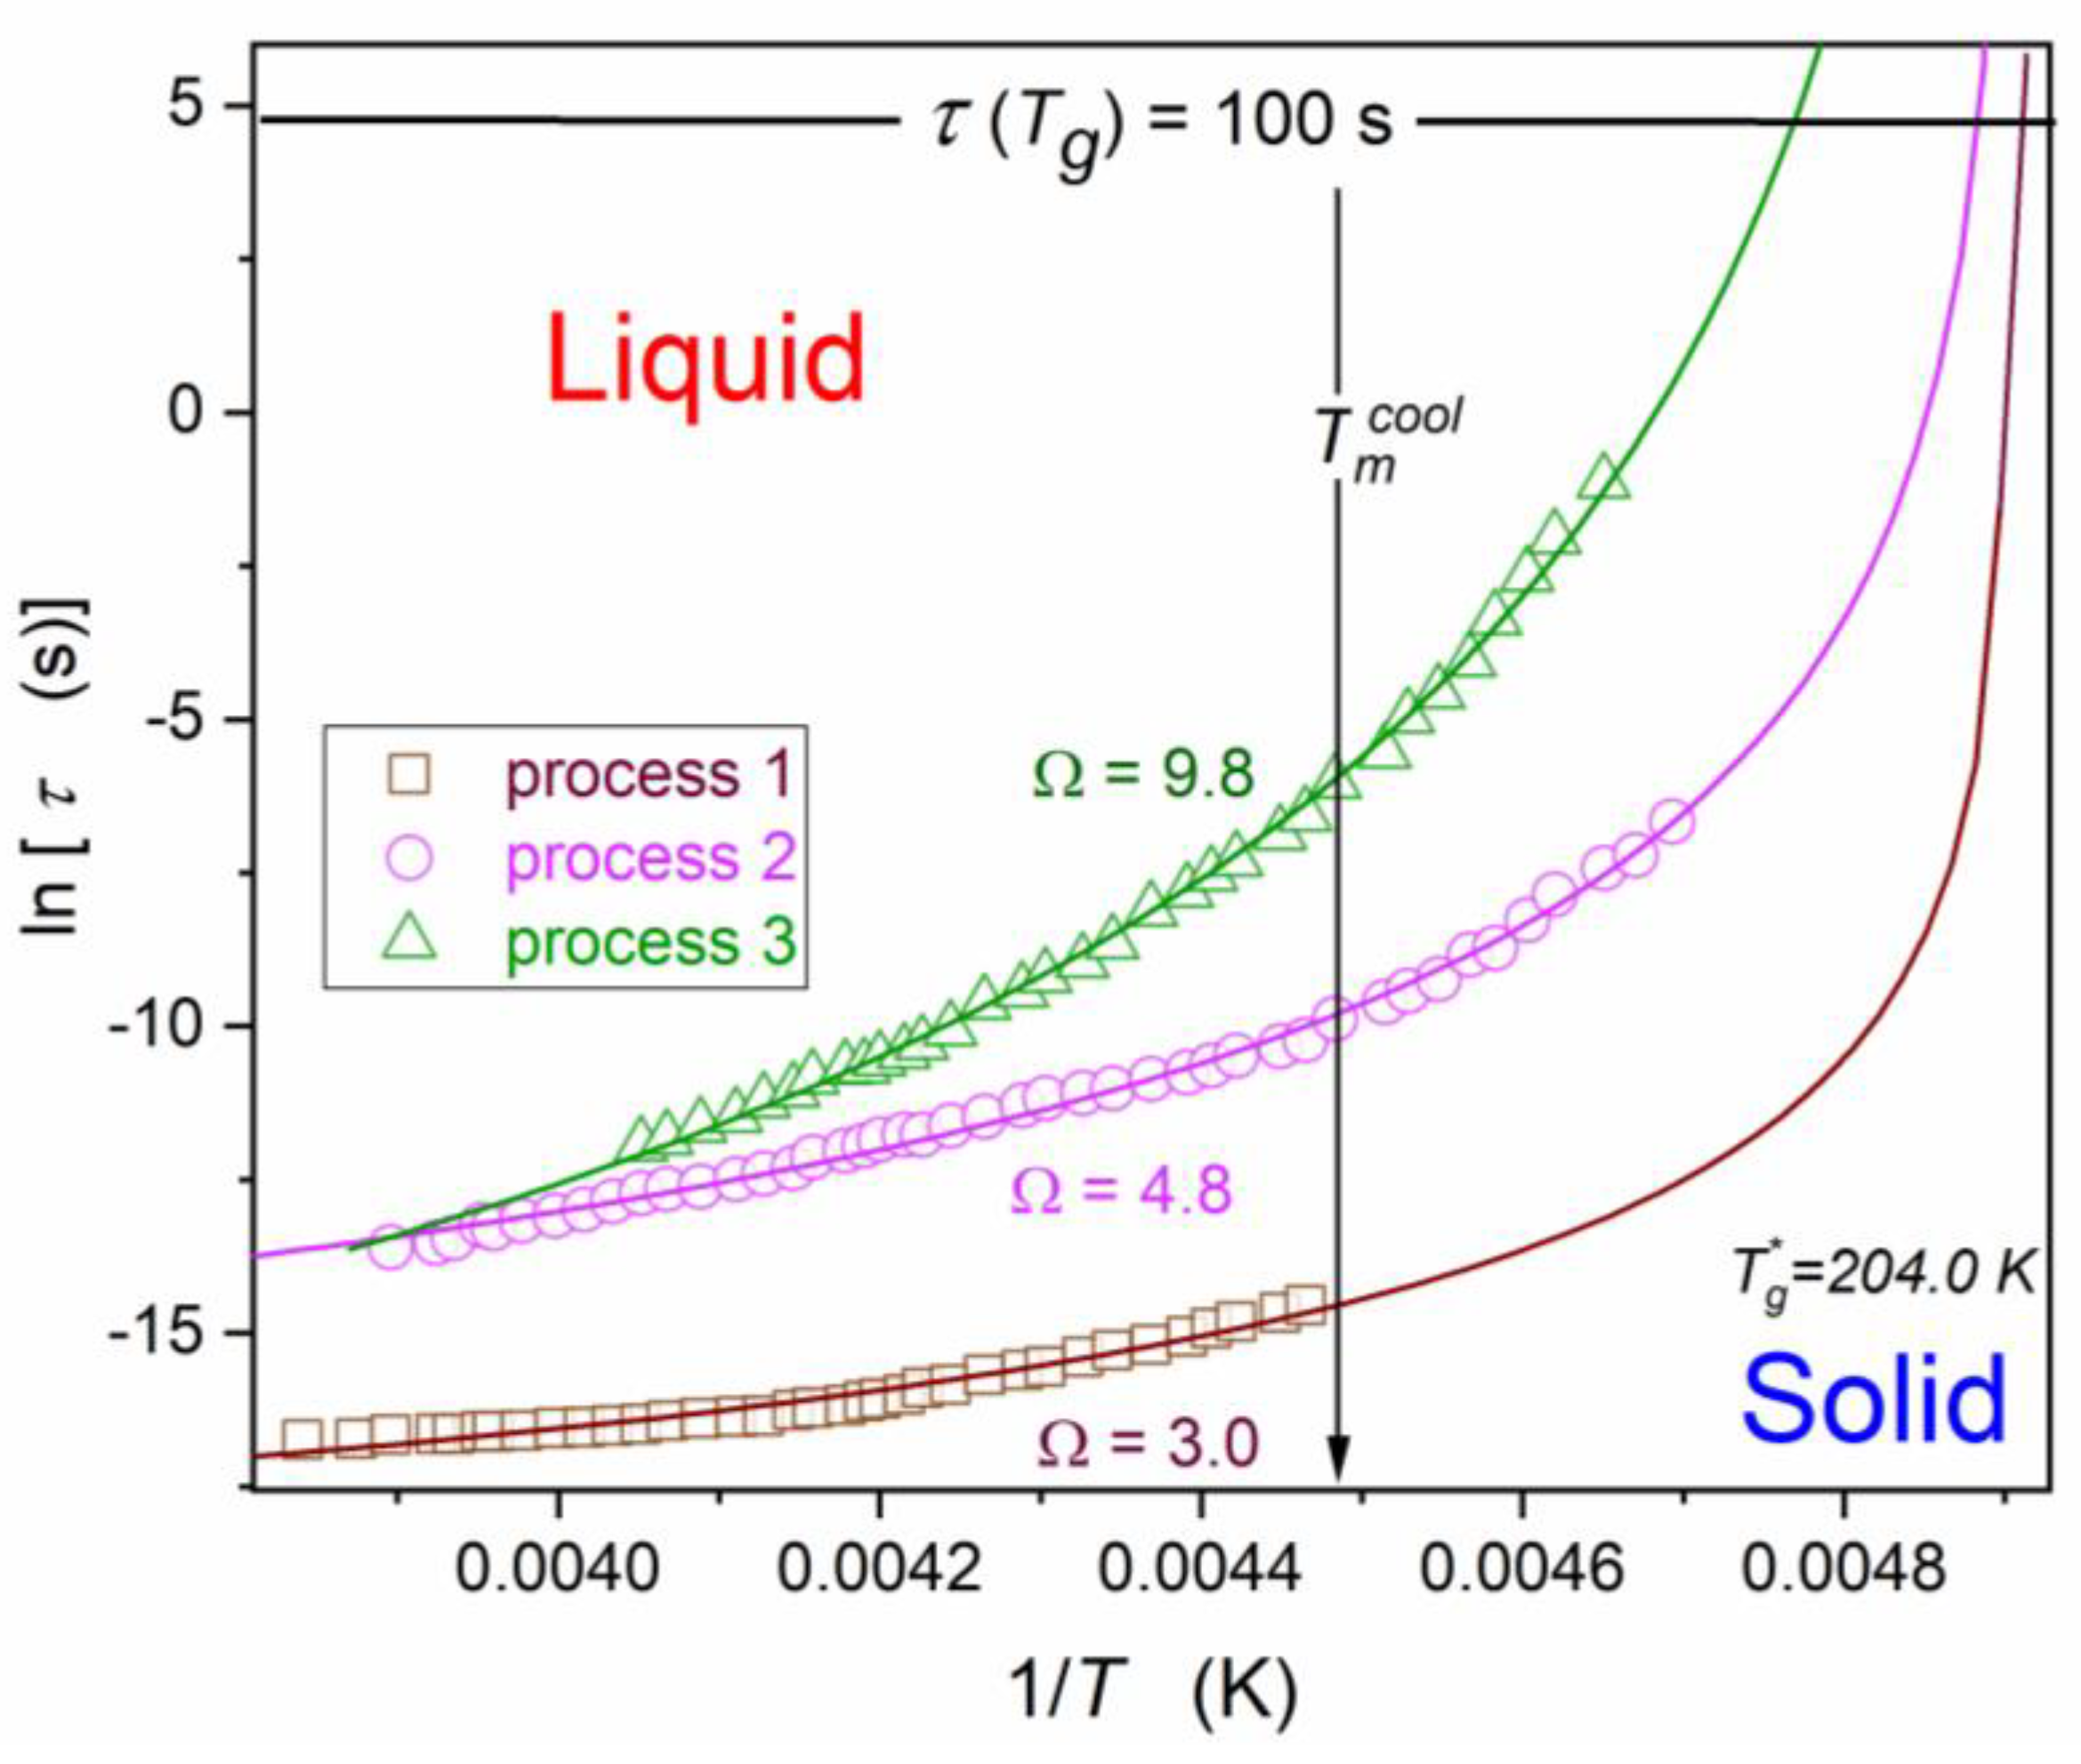
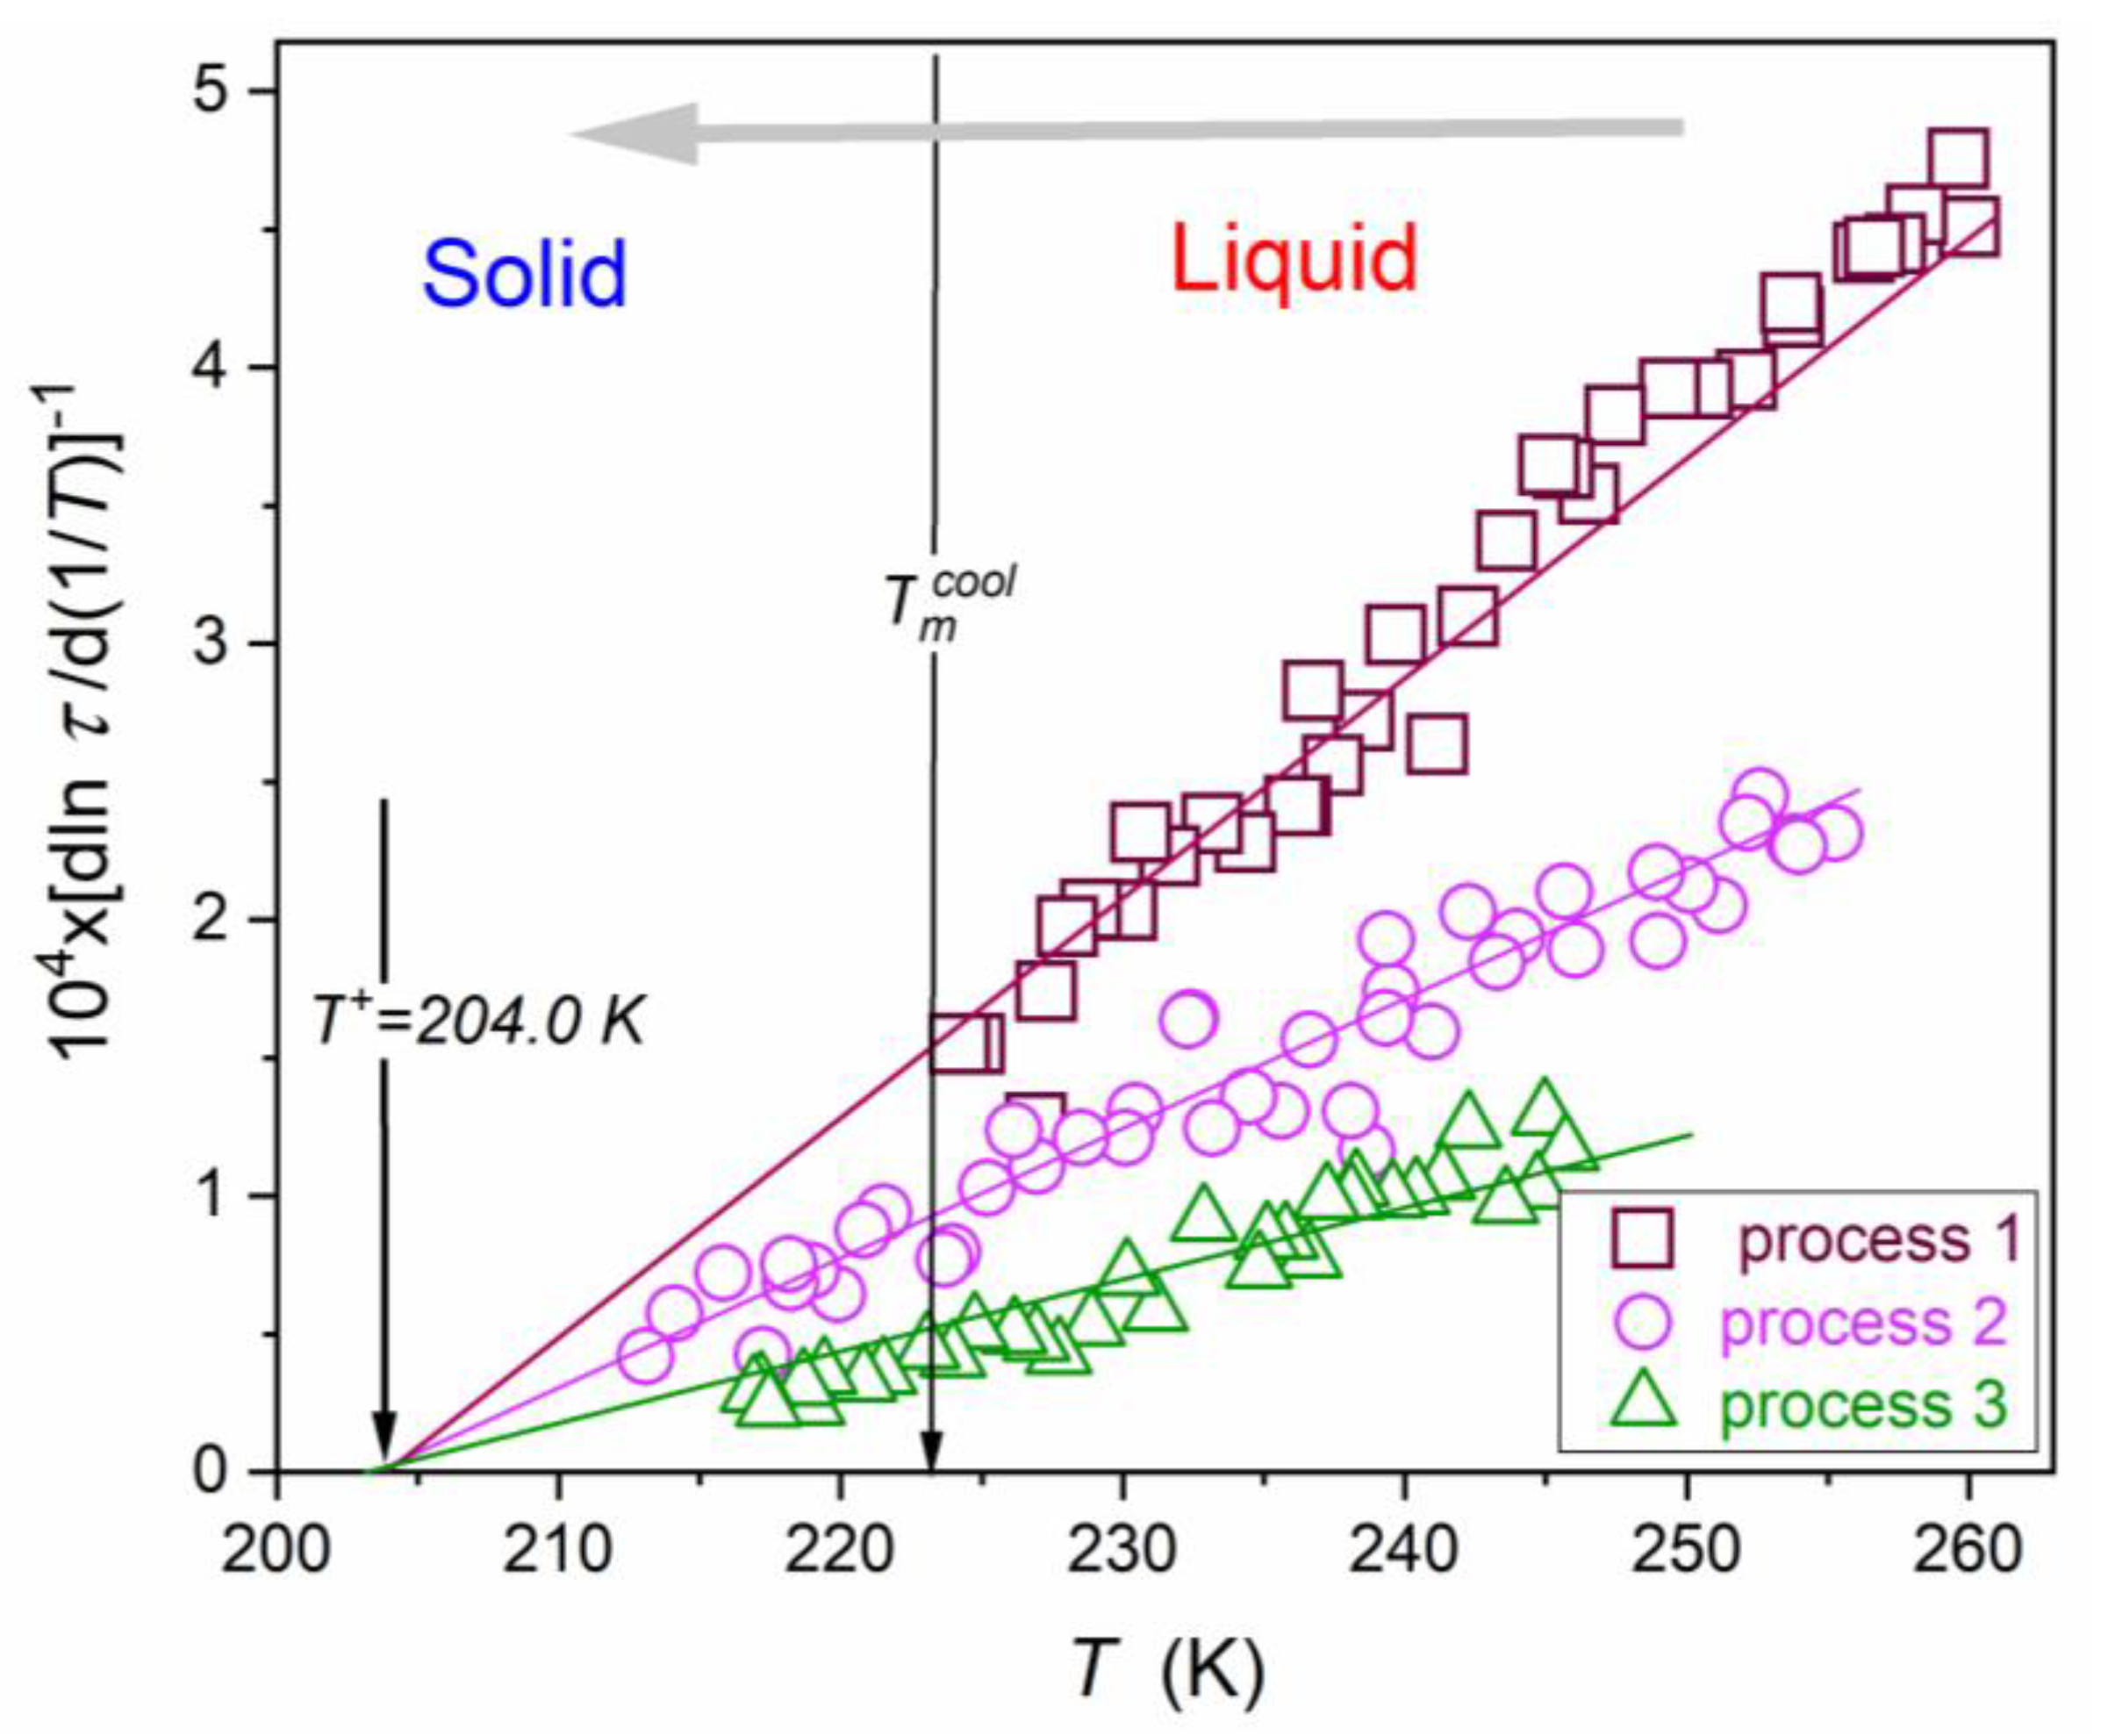
4.3. Unique Glassy Dynamics

The real and imaginary parts of dielectric permittivity contain messages regarding the dynamics of processes. However, the analysis exploring ε f is more convenient in practice [34] (see also Appendix A), at least in the last few decades when the modern generation of impedance analyzers have been available. The analysis of loss curves for subsequent temperatures enables the determination of primary relaxation times. For linseed oil, three relaxation processes have been detected, and these results are presented in Figure 8, using the Arrhenius scale, being the standard for showing such data [34]. Such evolutions are most often portrayed/analyzed using the Vogel–Fulcher–Tamman (VFT) super-Arrhenius equation [34,35]. However, in Ref. [35] it was shown that it is mainly an effective parameterization. It is particularly true for systems with elements of local uniaxial symmetry, and this seems to be the case of linseed oil. In fact, on the significant role of the local uniaxiality in linseed oil also indicates the pretransitional behavior of dielectric constant discussed above. In Refs. [35,106], a new route for super-Arrhenius changes of relaxation times was developed. It minimized the application of the nonlinear fitting and testing the possibility of using the selected scaling relation [35,106]. First, experimental data are transformed to the form related to the apparent activation enthalpy H a T , or equivalently the so-called apparent fragility (steepness index) m T [35,106]:
m T = T g l n 10 H a T = c H a T = H T T + 1 / m T , 1 / H a T a T b ,
where H a T = d l n τ T / d 1 / T = d τ T / τ T / d 1 / T ; originally [35] T > T g and the latter stands for the glass temperatures related to the relaxation time τ T g = 100 s, the amplitude H = c o n s t , coefficients a , b , c = c o n s t ; the singular temperature can be determined as 1 / m T + , 1 / H a T + = 0 .
Equation (14) was first noted for the supercooled, previtreous state of glass-forming liquids testing the evolution of the apparent fragility defined as m T = d l o g 10 τ T / d T g / T , where T g is glass transition temperature defined as τ T g = 100 s [34,106]. The universality of Equation (14) has been proven for 18 various systems so far [35,106]. It is notable that the apparent fragility is directly proportional to the apparent enthalpy (see Equation (14)); hence, its validity can be expected for any system with the super-Arrhenius (i.e., with the temperature-dependent activation energy) system [35]. Figure 8 shows the mentioned universal behavior for three (primary) relaxation processes detected in linseed oil, with the same ‘critical’ singular temperature T + 204   K . Linking the empirical finding of Equation (14) and definitions of the apparent enthalpy or the apparent fragility mentioned above, the following relation was derived by one of the authors (ADR) [106]:
τ T = C Ω T T + T Ω e x p T T + T Ω = C Ω t 1 exp t Ω l n T = l n C Ω Ω l n t + Ω t ,
where t = T T + / T = 1 T + / T , and T + stands for the ‘dynamic’ singular temperature, located below a hypothetical, hidden, glass transition.
The above relation contains only three adjustable parameters, i.e., the same ‘minimal’ number as the popular VFT equation [34]. However, the reliable value of the singular temperature T + can be estimated from the preliminary apparent activation enthalpy or apparent fragility analysis (see Figure 9). As shown in Ref. [106], the exponent Ω and the prefactor   C Ω   also can be estimated from such a plot, reducing the final fitting of τ T experimental data solely to subtle adjustments. The unique form of Equation (15) is worth indicating: it contains the critical-like and the ‘activated’ (i.e., exponential-type) terms. The solid curves in Figure 8 show the portrayal via Equation (15), with parameters collected in Table 3 and partially recalled in Figure 9. Generally, values of the exponent are located in the range 4 < Ω < 28 , where the lower limit is typical for systems with the dominant local uniaxial symmetry [106]. The results provided in Table 3 show that for dynamic properties such as relaxation time, the behavior indicating the significant impact of the local uniaxiality exists in linseed oil.
Notably, two of three detected relaxation times can penetrate the solid phase, where they gradually diminish. A question arises if this correlates with the decay of the post-freezing effect in the solid phase, discussed above.
Figure 10 shows the temperature evolution of the DC electric conductivity, which explicitly follows the basic Arrhenius behavior, namely [36]
σ 1 T = σ 1 e x p E σ R T ,
with the same constant activation energy E σ during cooling and heating.
The non-Arrhenius changes in relaxation time and the Arrhenius temperature changes in DC conductivity indicate the translational–orientational decoupling of these properties, as expressed via the fractional DSE law [63].
The loss factor enables insight into dynamics via the energy dissipation associated with the relaxation process, namely [97,98,99,107,108,109,110,111,112]
D = t a n δ = i l o s s i l o s s + I = ω ε + σ ω ε = 1 Q ,
where I is the total current through the sample, i l o s s is related to its loss, and the quality factor Q is the ratio of the initial energy stored to the energy lost in one cycle for the given frequency f .
Consequently,
ε * = ε i ε = ε 1 i × t a n δ .
This magnitude enables estimation of the power loss P , which can be converted to heat [97,98,99,107,108,109,110,111,112]:
P = Q t a n δ = ω C V 2 t a n δ = ε 0 ε E 2 ,
where ω = 2 π f .
Results related to temperature changes in the energy loss factor for two frequencies related to the near-static and LF domains during cooling and heating are shown in Figure 11. On cooling from the liquid phase, the melting temperature is passed, since T f < T m . However, for D = t a n δ , a very strong hallmark of passing T m appears that associated with its minimum. On heating from the solid phase, one passes T f in the solid phase on the way towards T m and the liquid phase. In this case, a strong hallmark of passing T f appears, which is associated with the maximum of D = t a n δ . This phenomenon is frequency-dependent, as visible in Figure 11. It is notable that such a phenomenon, which has not been reported so far, is absent for the dielectric constant and primary relaxation times scans, as shown above.

5. Conclusions

The initial motivation for carrying out the research presented in this work was to determine the precise and, so far, missing characterization of the dielectric properties of linseed oil in a broad temperature range. However, studies revealed very strong and long-range supercritical changes in the dielectric constant, resembling those observed in the isotropic liquid phase of rod-like liquid-crystalline compounds. Its influence reaches even room temperature and can be significantly greater and reach even higher temperatures thanks to admixtures that can significantly change the phase transition temperature. This is also one of the ways, apart from changing the temperature, to control the level of the discovered supercriticality in linseed oil. In current applications based on the vicinity of the liquid–gas critical point (mainly in CO2), the area associated with this phenomenon is the basis of supercritical technologies briefly characterized in the Introduction. The unusual features related to the supercritical region and its occurrence in linseed oil raise the question of whether the unique health-promoting properties of linseed oil are related only to its components, as previously believed, and not to the influence of supercriticality.
This factor confirms the openness of innovative ‘materials engineering’ to enhance and perhaps even induce targeted effects from the health-promoting effects of linseed oil. In the case of the latter, it may be important, for example, to precisely determine the characteristics of the supercritical evolution of the dielectric constant (Equation (6)), which can be combined with the Kirkwood relation (Equation (2)). It is also possible to complete the extended Noyes–Whitney relation (Equation (4)) by determining the evolution of DC electric conductivity (Equation (16)). The possibilities mentioned here related to finding and characterizing supercritical changes in the dielectric constant in linseed oil may also have broader significance in other industrial applications of linseed oil [110,111,112,113,114,115,116,117], such as an ‘ecological’ transformer oil [110,111,112], for instance. They can use linseed oil as a qualitatively new and ecological supercritical carrier agent in innovative supercritical extraction or processing technologies. For these applications, it may be important that the supercritical changes in the dielectric constant in linseed oil are qualitatively more significant than in the supercritical CO2 gas phase. Moreover, processing occurs in the liquid phase of eco-friendly natural material.
The uniqueness of the supercritical effect in linseed oil mentioned here lies in its connection with the liquid–solid discontinuous transition, which is a significant novelty. In general, melting/freezing discontinuous transition is a common and extremely important phenomenon in nature and technological applications. However, unlike continuous phase transitions, it has remained a great cognitive challenge for over 100 years. Long-range pretransitional effects and their effective parameterization became the inspiration and validation for Critical Phenomena Physics, one of the largest universal successes of t 20th century physics offering the parameterization of for long-range phase transition effects, being the hallmark feature of continuous/critical phase transitions. The problem with melting/freezing discontinuous transition is the practical lack of such pretransitional effects. Only weak premelting effects on heating from the solid state are detected. However, their parameterization seemed to be impossible.
Nevertheless, the premelting effect has become the main inspiration for theoretical models. A special role is played by the model of crystalline grains covered with nano-layers of a quasi-liquid, which leads to final fragmentation and melting. However, the lack of check-in relations for experimental validation has become a fundamental problem for the development of theoretical models. The exception was the Lipovsky model mentioned above. However, his predictions were for nano-layers of liquid, which were only a tiny part of melting solids, so validating the model seemed difficult, if at all possible.
This report shows that linseed oil has a premelting effect for the dielectric constant and a more significant post-freezing effect during cooling. Its parameterization is consistent with the Lipovsky model, as shown by the discussion indicating the appearance of quasi-negative pressure in nano-layers between solid grains and the Mossotti Catastrophe-type behavior. According to the authors, the unique appearance of the post-freezing effect in linseed oil may be related to the slightly discontinuous nature of the phase transition, for which ‘critical’ fluctuations should be expected to appear on both sides of the phase transition. Below T f , it can lead to ‘granulated solidification’, with liquid nano-layers surrounding solid-state granules. Interestingly, there are hallmarks of melting on the way towards T f for the liquid phase, as well as in the solid phase for the freezing temperature on the way towards T m . These effects are especially visible for D = t a n δ , a quantity directly related to possible energy processes in linseed oil. The results show a surprising relationship for   T f with the maximum of D and T m with the minimum of D, with a significant frequency dependence. These changes are visible far from the mentioned characteristic temperatures. This report shows three primary relaxation processes in the liquid phase, two of them were capable of limited penetration into the solid phase. The apparent activation enthalpy associated with these relaxation times, essentially a measure of the relative changes in the relaxation time in subsequent temperature intervals, shows universal changes related to the same quasi-critical singular temperature T C 204   K . The facts cited in this summary indicate the importance of linseed oil as a model system of fundamental importance. It was also important to conduct research using BDS because, with this method, the response from the liquid dielectric may be qualitatively more significant than that from the solid. For premelting and post-freezing effects in the solid state, this eliminates the problem of the tiny volume occupied by liquid nano-layers between solid-state grains.

Author Contributions

A.D.-R. proposed the concept, participated in the analysis and paper writing, and supplemented figures through data analysis; S.J.R. proposed the concept and participated in the analysis and paper writing; and J.Ł. carried out BDS studies and prepared figures. All authors have read and agreed to the published version of the manuscript.

Funding

This research was funded by the National Center for Science (NCN, Poland), grant number NCN OPUS 2022/45/B/ST5/04005, headed by S. J. Rzoska.

Data Availability Statement

All data are available directly from the authors following reasonable request. They are also deposited in the public open access database supporting data storage for research carried out at the Institute of High Pressure Physics of the Polish Academy of Sciences.

Conflicts of Interest

The authors declare no conflicts of interest.

Appendix A

Below are the results of the complex dielectric permittivity measurements during cooling in linseed oil that are presented (Figure A1) to illustrate experimental data. Basic features of the spectrum are also indicated. Figure A2 and Figure A3 present the same data in electric conductivity presentations to show the appearance of DC electric conductivity (horizontal lines) and distortions from such behavior.
Note that the figures also indicate characteristic features of BDS spectra, both for the complex dielectric permittivity and the electric conductivity representations. For the definition of these properties and inter-relations, see the Section 2.
For presented results, features of the impedance analyzer used in the experiment and the ‘design’ of the experiment, described in the Section 2, are important.
Figure A1. The real and imaginary components of the dielectric permittivity presented for the tested range of temperatures in linseed oil. The temperature shift is indicated by changing colors (from red (323 K) through yellow and green to deep blue (123 K)). Basic features of the spectrum are indicated by curved arrows. The straight arrow indicates the direction of temperature changes–cooling.
Biophysica 04 00003 g0a1
Figure A2. The real part of the complex electric conductivity obtained from ε f experimental data collected in Figure A1. The horizontal behavior determines DC electric conductivity. The violation of such behavior is visible near melting and freezing temperatures. Results were collected during heating from the solid phase. The vertical grey arrow indicates changing temperature. The temperature shift is indicated by changing colors (from red (323 K) through yellow and green to deep blue (123 K)).
Biophysica 04 00003 g0a2
Figure A3. The real part of the complex electric conductivity obtained from ε f experimental data collected in Figure A1 (see Section 1). The horizontal behavior determines DC electric conductivity. The violation of such behavior is visible near melting and freezing temperatures. The results were collected during cooling from the liquid phase. The straight, gray arrow indicates direction of temperature change. The temperature shift is indicated by changing colors (from red (323 K) through yellow and green to deep blue (123 K)).
Biophysica 04 00003 g0a3

References

  1. Flashar, H. Meister der Heilkunst. Leben und Werk; Beck: Berlin, Germany, 2016; ISBN 3406697461. [Google Scholar]
  2. Chamberlin, E.R. The Emperor Charlemagne; Sapere Books: Ilkley, UK, 2020; ISBN 1913518817. [Google Scholar]
  3. Fisher, L. The Life of Mahatma Gandhi; Vintage Publishing: New York, NY, USA, 2015; ISBN 1784700401. [Google Scholar]
  4. Johnston, I.M.; Johnston, J.R. Flaxseed (Linseed) Oil and the Power of Omega 3; Keats Pub. Inc.: New York, NY, USA, 1995. [Google Scholar]
  5. Neukam, K.; De Spirt, S.; Stahl, W.; Bejot, M.; Maurette, J.-M.; Tronnier, H.; Heinrich, U. Supplementation of flaxseed oil diminishes skin sensitivity and improves skin barrier function and condition. Ski. Pharmacol. Physiol. 2011, 24, 67–74. [Google Scholar] [CrossRef]
  6. Piłat, B.; Zadernowski, R. Physicochemical characteristics of linseed oil and flour. Pol. J. Nat. Sci. 2010, 25, 106–113. [Google Scholar] [CrossRef]
  7. Patterson, H.B.W. Hydrogenetion of Fats and Oils; Springer: Berlin, Germany, 2011. [Google Scholar]
  8. de Souza, E.; Franco, C.M.; de Aquino, F.; Lys de Medeiros, P.; Evencio, L.B.; da Silva Goes, A.J.; de Souza Maia, M.B. Effect of a semisolid formulation of Linum usitatissimum L. (linseed) oil on the repair of skin wounds. Evid.-Based Complement. Altern. Med. 2012, 2012, 270752. [Google Scholar]
  9. Tripathi, V.; Abidi, A.B.; Marker, S.; Bilal, S. Linseed and linseed oil: Health benefits—A review. Int. J. Pharm. Bio. Sci. 2013, 3, 434–442. [Google Scholar]
  10. Bartkowski, L. Linseed—A natural source of health and beauty. Chemik 2013, 67, 186–191. [Google Scholar]
  11. Goyal, A.; Sharma, V.; Upadhyay, N.; Gill, S.; Sihag, M. Flax and flaxseed oil: An ancient medicine & modern functional food. J. Food Sci. Technol. 2014, 51, 1633–1653. [Google Scholar]
  12. Szymczyk, B.; Szczurek, W. Effect of dietary pomegranate seed oil and linseed oil on broiler chickens performance and meat fatty acid profile. J. Anim. Feed Sci. 2016, 25, 37–44. [Google Scholar] [CrossRef]
  13. Duran, D. The pharmacological evaluation of flax seed oil. J. Curr. Med. Res. Opin. 2020, 3, 2589. [Google Scholar] [CrossRef]
  14. Kiryluk, A.; Kostecka, J. Pro-environmental and health-promoting grounds for restitution of flax (Linum usitatissimum L.) cultivation. J. Ecol. Eng. 2020, 21, 99–107. [Google Scholar] [CrossRef] [PubMed]
  15. Patel, G.; Naik, R.K.; Patel, K.K. Studies on Some Physical and Engineering Properties of Linseed. Biol. Forum-Int. J. 2021, 13, 303–308. [Google Scholar]
  16. Tang, Z.-X.; Ying, R.-F.; Lv, B.-F.; Yang, L.-H.; Xu, Z.; Yan, L.-Q.; Bu, J.-Z.; Wei, Y.-S. Flaxseed oil: Extraction, health benefits and products. Qual. Assur. Saf. Crops Foods 2021, 13, 1–19. [Google Scholar] [CrossRef]
  17. Li, X.; Chen, Q.; Li, Q.; Li, J.; Cui, K.; Zhang, Y.; Kong, A.; Zhang, Y.; Wan, M.; Mai, K.; et al. Effects of high levels of dietary linseed oil on the growth performance, antioxidant capacity, hepatic lipid metabolism, and expression of inflammatory genes in large yellow croaker (Larimichthys crocea). Front. Physiol. 2021, 12, 631850. [Google Scholar] [CrossRef]
  18. Lewandowska, H.; Eljaszewicz, A.; Poplawska, I.; Tynecka, M.; Walewska, A.; Grubczak, K.; Holl, J.; Hady, H.R.; Czaban, S.L.; Reszec, J.; et al. Optimization of novel human acellular dermal dressing sterilization for routine use in clinical practice. Int. J. Mol. Sci. 2021, 22, 8467. [Google Scholar] [CrossRef] [PubMed]
  19. Skórkowska-Telichowska, K.; Mierziak-Darecka, J.; Wrobel-Kwiatkowska, M.; Gebarowski, T.; Szopa, J.; Zuk, M. Wound coverage by the linen dressing accelerates ulcer healing. Postep. Derm. Alergol 2021, 38, 827–841. [Google Scholar]
  20. Friend, J.N. The Chemistry of Linseed Oil; Legare Press: London, UK, 2022; ISBN 978-016378017. [Google Scholar]
  21. Langyan, S.; Yadava, P.; Khan, F.N.; Sharma, S.; Singh, R.; Bana, R.S.; Singh, N.; Kaur, V.; Kalia, S.; Kumar, A. Trends and advances in pre- and post- harvest processing of linseed oil for quality food and health products. Crit. Rev. Food Sci. Nutr. 2023; epub ahead of print. [Google Scholar]
  22. There, U.; Gour, N.; Shrikant, S.; Choudhary, V.; Kandasamy, R. Development of skincare formulations using flaxseed oil and mucilade. J. Pharmacogn. Phytochem. 2023, 12, 33–39. [Google Scholar] [CrossRef]
  23. Al-Madhagy, S.; Ashmawy, N.S.; Mamdouh, A.; Eldahshan, O.A.; Farag, M.A. A comprehensive review of the health benefits of flaxseed oil in relation to its chemical composition and comparison with other omega-3-rich oils. Eur. J. Med. Res. 2023, 28, 240. [Google Scholar] [CrossRef] [PubMed]
  24. Arai, Y.; Sako, T.; Takebayashi, Y. Supercritical Fluids: Molecular Interactions, Physical Properties and New Applications; Springer: Berlin, Germany, 2002. [Google Scholar]
  25. Drozd-Rzoska, A.; Rzoska, S.J. The super- and sub-critical effects for dielectric constant in diethyl ether. J. Chem. Phys. 2016, 144, 224506. [Google Scholar] [CrossRef] [PubMed]
  26. Marszałek, K.; Doesburg, P.; Starzonek, S.; Szczepańska, J.; Woźniak, Ł.; Lorenzo, J.M.; Skąpska, S.; Rzoska, S.J.; Barba, F.J. Comparative effect of supercritical carbon dioxide and high pressure processing on structural changes and activity loss of oxidoreductive enzymes. J. CO2 Util. 2019, 29, 46–56. [Google Scholar] [CrossRef]
  27. Hong Geow, C.; Ching, M.; Tan, S.; Yeap, P.; Chin, N.L. A review on extraction techniques and its future applications in industry. Europ. J. Lipid Sci. Technol. 2021, 123, 2000302. [Google Scholar] [CrossRef]
  28. Rzoska, S.J.; Drozd-Rzoska, A. Criticality-related fundamental bases for new generations of gas-liquid, liquid-liquid, and liquid (LE) extraction technologies. Eur. Phys. J. E 2022, 45, 67. [Google Scholar] [CrossRef]
  29. Anisimov, M.A. Critical Phenomena in Liquids and Liquid Crystals; Gordon and Breach: Reading, UK, 1992. [Google Scholar]
  30. Drozd-Rzoska, A.; Rzoska, S.J.; Kalabiński, J. Impact of pressure on low molecular weight near-critical mixtures of limited miscibility. ACS Omega 2020, 5, 20141–20152. [Google Scholar] [CrossRef] [PubMed]
  31. Proctor, J.E. The Liquid and Supercritical Fluid. States of Matter; CRC Press: Boca Raton, FL, USA, 2020; ISBN 9781138589735. [Google Scholar]
  32. Talevi, A.; Ruiz, M.E. Drug Dissolution: Fundamental Theoretic Models. In The ADME Encyclopedia; Talevi, A., Ed.; Springer: Berlin, Germany, 2022. [Google Scholar]
  33. Dokoumetzidis, A.; Macheras, P. A century of dissolution research: From Noyes and Withney to the biopharmaceutics classification system. Int. J. Pharm. 2006, 321, 1–11. [Google Scholar] [CrossRef] [PubMed]
  34. Kremer, F.; Schönhals, A. Broadband Dielectric Spectroscopy; Springer: Berlin, Germany, 2002. [Google Scholar]
  35. Drozd-Rzoska, A.; Rzoska, S.J.; Starzonek, S. New scaling paradigm for dynamics in glass-forming systems. Prog. Mater. Sci. 2023, 134, 101074. [Google Scholar] [CrossRef]
  36. Agrawal, S.; Bhatnagar, D. Dielectric studies of binary mixtures of edible unsaturated oils. Indian J. Pure Appl. Phys. 2005, 43, 624–629. [Google Scholar]
  37. Mathew, T.; Vyas, A.D.; Tripathi, D. Dielectric properties of some edible and medicinal oils at microwave frequency. Can. J. Pure Appl. Sci. 2009, 3, 953–957. [Google Scholar]
  38. Palummo, L.; ·Bearzotti, A. Analysis of the electrical of linseed oil films exposed humidity. Appl. Phys. A 2009, 97, 835–839. [Google Scholar] [CrossRef]
  39. Shah, H.; Tahir, Q.A. Dielectric properties of vegetable oils. J. Sci. Res. 2011, 3, 48–492. [Google Scholar] [CrossRef]
  40. Pecovska-Gjorgjevich, M.; Andonovski, A.; Velevska, J. Dielectric constant and induced dipole moment of edible oils subjected to conventional heating. Maced. J. Chem. Chem. Eng. 2012, 31, 285–294. [Google Scholar] [CrossRef]
  41. Spohner, M.; Frk, M.; Liedermann, K. Study of electrical and rheological properties of natural and other oils. In Proceedings of the 2012 IEEE International Symposium on Electrical Insulation, San Juan, PR, USA, 10–13 June 2012; pp. 30–33. [Google Scholar]
  42. Chetty, L.; Serukenya, W.I.; Ijumba, N.M. Vegetable oil based liquid nanocomposite dielectric. S. Afr. J. Sci. 2013, 109, 6. [Google Scholar] [CrossRef]
  43. Khandelwal, V.; Sahoo, S.K.; Kumar, A.; Manik, G. Electrically conductive green composites based on epoxidized linseed oil and polyaniline: An insight into electrical, thermal and mechanical properties. Compos. Part B Eng. 2018, 136, 149–157. [Google Scholar] [CrossRef]
  44. Xu, B.; Wei, B.; Ren, X.; Liu, Y.; Jiang, H.; Zhou, C.; Ma, H.; Chalamaiah, M.; Liang, Q.; Wang, Z. Dielectric pretreatment of rapeseed 1: Influence on the drying characteristics of the seeds and physico-chemical properties of cold-pressed oil. Food Bioprocess Technol. 2018, 11, 1236–1247. [Google Scholar] [CrossRef]
  45. Kumar, A.V.P.; Goel, A.; Kumar, R.; Ojha, A.K.; John, J.K.; Joy, J. Dielectric characterization of common edible oils in the higher microwave frequencies using cavity perturbation. J. Microw. Power Electromagn. Energy 2019, 53, 48–56. [Google Scholar]
  46. Woo, Y.S.; Kim, M.-J.; Lee, J.H. Prediction of oxidative stability in bulk oils using dielectric constant changes. Food Chem. 2019, 279, 216–222. [Google Scholar] [CrossRef] [PubMed]
  47. Zhang, L.; Chen, J.; Jing, B.; Dong, Y.; Yu, X. New method for the discrimination of adulterated flaxseed oil using dielectric spectroscopy. Food Anal. Methods 2019, 12, 2623–2629. [Google Scholar] [CrossRef]
  48. Blyagaz, A.I. Improvement of quality control methods for linseed oils. Novye Technol. (MAJKOP) 2019, 1, 11–18. [Google Scholar]
  49. Teseme, W.B.; Weldeselassie, H.W. Review on the study of dielectric properties of food materials. Am. J. Eng. Technol. Manag. 2020, 5, 76–83. [Google Scholar] [CrossRef]
  50. Valantina, S. R Measurement of dielectric constant: A recent trend in quality analysis of vegetable oil—A review. Trends Food Sci. Technol. 2021, 113, 1–11. [Google Scholar] [CrossRef]
  51. Doganer, M.; Dincer, S.; Dincer, M.S.; Duzkaya, H.; Tezcan, S.S. Statistical investigation of AC dielectric strength of flaxseed oil. In Proceedings of the 2022 IEEE 21st International Conference on Dielectric Liquids (ICDL), Sevilla, Spain, 29 May–2 June 2022; pp. 1–4. [Google Scholar]
  52. Radojčić, D.; Hong, J.; Petrović, Z.S. From natural oils to epoxy resins: A new paradigm in renewable performance materials. J. Polym. Environ. 2022, 30, 765–775. [Google Scholar] [CrossRef]
  53. Sudhakar, A.; Chakraborty, S.K.; Mahanti, N.K. Varghese, Advanced techniques in edible oil authentication: A systematic review and critical analysis. Crit. Rev. Food Sci. Nutr. C 2023, 63, 873–901. [Google Scholar] [CrossRef]
  54. Sabnis, S.M.; Rander, D.N.; Kanse, K.S.; Joshi, Y.S.; Kumbharkhane, A.C. Spectroscopic measurement and dielectric relaxation study of vegetable oils. Inf. Process. Agric. 2023; in press proof. [Google Scholar] [CrossRef]
  55. Agaev, S.G.; Baida, A.A.; Georgiev, O.V.; Maiorova, O.O.; Mozyrev, A.G. Dielectric spectroscopy of vegetable oils. Russ. J. Appl. Chem. 2020, 93, 748–756. [Google Scholar] [CrossRef]
  56. Drozd-Rzoska, A.; Rzoska, S.J.; Zioło, J. Critical behaviour of dielectric permittivity in the isotropic phase of nematogens. Phys. Rev. E 1996, 54, 6452–6456. [Google Scholar] [CrossRef] [PubMed]
  57. Drozd-Rzoska, A.; Rzoska, S.J.; Zioło, J. The quasi-critical behavior of dielectric permittivity in the isotropic phase of smectogenic n-cyanobiphenyls. Phys. Rev. E 2000, 61, 5349–5354. [Google Scholar] [CrossRef] [PubMed]
  58. Drozd-Rzoska, A.; Rzoska, S.J.; Czupryński, K. Phase transitions from the isotropic liquid to liquid crystalline mesophases studied by “linear” and “nonlinear” static dielectric permittivity. Phys. Rev. E 2000, 61, 5355–5360. [Google Scholar] [CrossRef] [PubMed]
  59. Drozd-Rzoska, A.; Rzoska, S.J.; Pawlus, S.; Zioło, J. Complex dynamics of supercooling n-butylcyanobiphenyl (4CB). Phys. Rev. E 2005, 72, 031501. [Google Scholar] [CrossRef] [PubMed]
  60. Łoś, J.; Drozd-Rzoska, A.; Rzoska, S.J. Critical-like behavior of low-frequency dielectric properties in compressed liquid crystalline octyloxycyanobiphenyl (8OCB) and its nanocolloid with paraelectric BaTiO3. J. Mol. Liq. 2023, 377, 121555. [Google Scholar] [CrossRef]
  61. Drozd Rzoska, A.; Rzoska, S.J.; Zioło, J.; Jadżyn, J. Quasi-ciritical behavior of the low-frequency dielectric permittivity in the isotropic phase of n-pentylcyanobiphenyl. Phys. Rev. E 2001, 63, 052701–052704. [Google Scholar] [CrossRef]
  62. Mei, Q.S.; Lu, K. Melting and superheating of crystalline solids: From bulk to nanocrystals. Prog. Mater. Sci. 2007, 52, 1175–1262. [Google Scholar] [CrossRef]
  63. Starzonek, S.; Rzoska, S.J.; Drozd-Rzoska, A.; Pawlus, S.; Biała, E.; Martinez-Garcia, J.C.; Kistersky, L. Fractional Debye-Stokes-Einstein behaviour in an ultraviscous nanocolloid glycerol and silver nanoparticles. Soft Matter 2011, 11, 5554–5562. [Google Scholar] [CrossRef]
  64. Kaisersberger, E. DSC investigations of the thermal characterization of edible fats and oils. Thermochim. Acta 1989, 151, 83–90. [Google Scholar] [CrossRef]
  65. Wang, C.; Erhan, S. Studies of thermal polymerization of vegetable oils with a differential scanning calorimeter. J. Am. Oil Chem. Soc. 1999, 76, 1211–1216. [Google Scholar] [CrossRef]
  66. Zhang, Z.-S.; Li, D.; Zhang, L.-X.; Liu, Y.-L.; Wang, X. Heating effect on the DSC melting curve of flaxseed oil. J. Therm. Anal. Calorim. 2014, 115, 2129–2135. [Google Scholar] [CrossRef]
  67. Tomaszewska-Gras, J.; Islam, M.; Grzeca, L.; Kaczmarek, A.; Fornal, E. Comprehensive thermal characteristics of different cultivars of flaxseed oil (Linum usittatissimum L.). Molecules 2021, 26, 1958. [Google Scholar] [CrossRef] [PubMed]
  68. Murray, C. Ferroelectric Materials: Science and Technology; States Academic Press: Cambridge, UK, 2022; ISBN 978-1639891986. [Google Scholar]
  69. Rzoska, S.J.; Drozd-Rzoska, A.; Bulejak, W.; Łoś, J.; Starzonek, S.; Szafran, M.; Gao, F. Critical insight into pretransitional behavior and dielectric tunability of relaxor ceramics. Materials 2023, 16, 7634. [Google Scholar] [CrossRef] [PubMed]
  70. Mierzwa, M.; Paluch, M.; Rzoska, S.J.; Zioło, J. The liquid-glass and liquid-liquid transitions of TPP at elevated pressure. J. Phys. Chem. B 2008, 112, 10383. [Google Scholar] [CrossRef] [PubMed]
  71. Tanaka, H. Liquid-liquid transition and polyamorphism. J. Chem. Phys. 2020, 153, 130901. [Google Scholar] [CrossRef] [PubMed]
  72. Kalabiński, J.; Drozd-Rzoska, A.; Rzoska, S.J. Giant premelting effects for solid-liquid discontinuous transition in nitrobenzene under compression. Crystals 2023, 13, 247. [Google Scholar] [CrossRef]
  73. Rzoska, S.J.; Paluch, M.; Pawlus, S.; Drozd-Rzoska, A.; Jadzyn, J.; Czupryński, K.; Dąbrowski, R. Complex dielectric relaxation in supercooling and superpressing liquid-crystalline chiral isopentycyanobiphenyl. Phys. Rev. E 2003, 68, 031705. [Google Scholar] [CrossRef]
  74. Massalska-Arodz, M.; Williams, G.I.; Smith, K.C.; Conolly, G.; Aldridge, R.A. Dabrowski. Molecular dynamics and crystallization behaviour of isopentyl cyanobiphenyl as studied by dielectric relaxation spectroscopy. J. Chem. Soc. Faraday Trans. 1998, 94, 387–394. [Google Scholar] [CrossRef]
  75. Kryuchkov, N.P.; Dmitryuk, N.A.; Li, W.; Ovcharov, P.V.; Han, Y.; Sapelkin, A.V.; Yurchenko, S.O. Mean-field model of melting in superheated crystals based on a single experimentally measurable order parameter. Sci. Rep. 2021, 11, 17963. [Google Scholar] [CrossRef]
  76. Riegler, H.; Köhler, R. How pre-melting on surrounding interfaces broadens solid–liquid phase transitions. Nat. Phys. 2007, 3, 890–894. [Google Scholar] [CrossRef]
  77. Mishin, Y.; Boettinger, W.; Warren, J.; McFadden, G. Thermodynamics of grain boundary premelting in alloys. I. Phase-field modeling. Acta Mater. 2009, 57, 3771–3785. [Google Scholar] [CrossRef]
  78. Yang, Y.; Asta, M.; Laird, B.B. Solid-liquid interfacial premelting. Phys. Rev. Lett. 2013, 110, 096102. [Google Scholar] [CrossRef] [PubMed]
  79. Spatschek, R.P.; Adland, A.; Karma, A.S. Structural short-range forces between solid-melt interfaces. Phys. Rev. B 2013, 87, 024109. [Google Scholar] [CrossRef]
  80. Samanta, A.; Tuckerman, M.E.; Yu, T.-Q.; Ee, W. Microscopic mechanisms of equilibrium melting of a solid. Science 2014, 346, 729–732. [Google Scholar] [CrossRef] [PubMed]
  81. Rad, M.T.; Boussinot, G.; Apel, M. Dynamics of grain boundary premelting. Sci. Rep. 2020, 10, 21074. [Google Scholar]
  82. Pocheć, M.; Niu, H.; Ren, L.; Bai, S.; Orzechowski, K. Premelting phenomena in n-alcohols from nonanol to dodecanol. J. Phys. Chem. C 2020, 124, 21013–21017. [Google Scholar] [CrossRef]
  83. Tian, X.-L.; Zhao, Y.-H.; Peng, D.-W.; Guo, Q.-W.; Guo, Z.; Hou, H. Phase-field crystal simulation of evolution of liquid pools in grain boundary pre-melting regions. Trans. Nonferrous Met. Soc. China 2021, 31, 1175–1188. [Google Scholar] [CrossRef]
  84. Azad, M.; Groulx, D.; Donaldson, A. Melting of phase change materials in horizontal annuli. J. Energy Storage 2021, 42, 103096. [Google Scholar] [CrossRef]
  85. Pocheć, M.; Orzechowski, K.; Rutkowski, K. Indicators of premelting in 1-decanol and 1-nonanol studied by FTIR spectroscopy. Surf. Interfaces 2022, 28, 101676. [Google Scholar] [CrossRef]
  86. Pocheć, M.; Krupka, K.M.; Panek, J.J.; Orzechowski, K.; Jezierska, A. Inside out Approach to Rotator State in Hydrogen-Bonded System-Experimental and Theoretical Cross-Examination in n-Octanol. Int. J. Mol. Sci. 2022, 23, 2138. [Google Scholar] [CrossRef]
  87. Vachier, J.; Wettlaufer, J.S. Biolocomotion and premelting in ice. Front. Phys. 2022, 10, 904836. [Google Scholar] [CrossRef]
  88. Vachier, J.; Wettlaufer, J.S. Premelting controlled active matter in ice. Phys. Rev. E 2022, 105, 024601. [Google Scholar] [CrossRef] [PubMed]
  89. Zhang, Q.I.; Li, W.; Qiao, K. Surface premelting and melting of colloidal glasses. Sci. Adv. 2023, 9, eadf1101. [Google Scholar] [CrossRef] [PubMed]
  90. Cui, S.; Chen, H. Transition dynamics and metastable states during premelting and freezing of ice surfaces. Phys. Rev. B 2023, 108, 045413. [Google Scholar] [CrossRef]
  91. Lipowsky, R. Critical surface phenomena at first-order bulk transitions. Phys. Rev. Lett. 1982, 49, 1575–1578. [Google Scholar] [CrossRef]
  92. Lipowsky, R. Melting at grain boundaries and surfaces. Phys. Rev. Lett. 1986, 57, 2876. [Google Scholar] [CrossRef] [PubMed]
  93. Lipovsky, T. Surface critical phenomena at first-order phase transition. Ferroelectrics 1987, 73, 69–81. [Google Scholar] [CrossRef]
  94. Mossotti, O.F. Discussione analitica sull’influenza che l’azione di un mezzo dielettrico ha sulla distribuzione dell’elettricità alla superficie di più corpi elettrici disseminati. Mem. Mat. Fis. Soc. Ital. Sci. Resid. Modena 1850, 24, 49–74. [Google Scholar]
  95. Clausius, R. Die Mechanische Behandlung der Electricität; Vieweg + Teubner Verlag: Wiesbaden, Germany, 1878. [Google Scholar]
  96. Böttcher, C.J.F. Theory of Electric Polarization; Elsevier: Amsterdam, The Netherlands, 1973. [Google Scholar]
  97. Chełkowski, A. Dielectric Physics; PWN-Elsevier: Warsaw, Poland, 1990. [Google Scholar]
  98. von Hippel, A. Dielectrics and Waves; Artech House: New York, NY, USA, 1954. [Google Scholar]
  99. Raju, G.G. Dielectric in Electric Field; CRC Press: Boca Raton, FL, USA, 2018. [Google Scholar]
  100. Talebian, E.; Talebian, M. A general review on the derivation of Clausius–Mossotti relation. Optik 2013, 124, 2324–2326. [Google Scholar] [CrossRef]
  101. Eremin, L.E.; Neschimenko, V.V.; Shcherbam, D.S.; Fomin, D.V. System modification of the equation Lorenz–Lorentz–Clausius Mossotti. Optic 2021, 231, 166327. [Google Scholar] [CrossRef]
  102. Chen, X.; Nijhuis, C.A. The Unusual Dielectric Response of Large Area Molecular Tunnel Junctions Probed with Impedance Spectroscopy. Adv. Electron. Mat. 2021, 8, 2100495. [Google Scholar] [CrossRef]
  103. Trainer, M. Ferroelectrics and the Curie–Weiss law. Eur. J. Phys. 2000, 21, 459–464. [Google Scholar] [CrossRef]
  104. Hoffmann, M.; Ravindran, P.V.; Kha, A.I. Why Do Ferroelectrics exhibit negative capacitance? Materials 2019, 12, 3743. [Google Scholar] [CrossRef]
  105. Mugiraneza, S.; Hallas, A.M. Tutorial: A beginner’s guide to interpreting magnetic susceptibility data with the Curie-Weiss law. Commun. Phys. 2022, 5, 95. [Google Scholar] [CrossRef]
  106. Drozd-Rzoska, A. Universal behavior of the apparent fragility in ultraslow glass forming systems. Sci. Rep. 2019, 9, 6816. [Google Scholar] [CrossRef] [PubMed]
  107. Hill, R. Characterisation of dielectric loss in solids and liquids. Nature 1978, 275, 96–99. [Google Scholar] [CrossRef]
  108. Kim, T.; Yong, H.; Kim, B.; Kim, D.; Choi, D.; Park, Y.T.; Lee, S. Energy-loss return gate via liquid dielectric polarization. Nat. Commun. 2018, 9, 1437. [Google Scholar] [CrossRef] [PubMed]
  109. Morsalin, S.; Phung, T.B.; Danikas, M.; Mawad, D. Diagnostic challenges in dielectric loss assessment and interpretation: A review. IET Sci. Meas. Technol. 2019, 13, 767–782. [Google Scholar] [CrossRef]
  110. Huang, Z.; Wang, F.; Wang, Q.; Yao, W.; Sun, K.; Zhang, R.; Zahao, J.; Lou, Z.; Li, J. Significantly enhanced electrical performances of eco-friendly dielectric liquids for harsh conditions with fullerene. Nanomaterials 2019, 9, 989. [Google Scholar] [CrossRef]
  111. Nadolny, Z. Determination of dielectric losses in a power transformer. Energies 2022, 15, 993. [Google Scholar] [CrossRef]
  112. Havran, P.; Cimbala, R.; Kurimský, J.; Dolník, B.; Kolcunová, I.; Medved, D.; Király, J.; Kohanmm, V.; Šárpataky, L. Dielectric properties of electrical insulating liquids for high voltage electric devices in a time-varying electric field. Energies 2022, 15, 391. [Google Scholar] [CrossRef]
  113. Omonov, T.S.; Patel, V.R.; Curtis, J.M. Biobased thermosets from epoxidized linseed oil and its methyl esters. ACS Appl. Polym. Mater. 2022, 4, 6531–6542. [Google Scholar] [CrossRef]
  114. Ruwoldt, J.; Toven, K. Alternative wood treatment with blends of linseed oil, alcohols and pyrolysis oil. J. Bioresour. Bioprod. 2022, 7, 278–287. [Google Scholar] [CrossRef]
  115. Bonaduce, I.; Carlyle, L.; Colombini, M.P.; Duce, C.; Ferrari, C.; Ribechini, E.; Selleri, P.; Tiné, M.R. New insights into the ageing of linseed oil paint binder: A qualitative and quantitative analytical study. PLoS ONE 2012, 7, e49333. [Google Scholar] [CrossRef]
  116. Gorrée, M.; Guinée, J.B.; Huppes, G.; van Oers, L. Environmental life cycle assessment of linoleum. Int. J. Life Cycle Assess. 2002, 7, 158–166. [Google Scholar] [CrossRef]
  117. Martin, D.; Saha, T.; Mcpherson, L. Condition monitoring of vegetable oil insulation in in-service power transformers: Some data spanning 10 years. IEEE Electr. Insul. Mag. 2017, 33, 44–51. [Google Scholar] [CrossRef]
Figure 1. Differential Scanning Calorimetry (DSC) scan related to heat capacity in linseed oil (solid, purple line). Characteristic features significant for applications are indicated with arrows–the melting temperature, Diels-Adler reaction temperature and polymerization temperature.
Biophysica 04 00003 g001
Figure 2. Temperature changes in the dielectric constant on cooling and heating in linseed oil. Note the explicit manifestations of pretransitional effects on both sides of the freezing and melting temperatures. The results are for cooling (blue, open circles) and heating (orange, semi-filled circles) cycles. The portrayal of pretransitional effects is related to Equations (6) and (9) in the liquid and solid phases, respectively. Solid vertical arrows indicate freezing and melting temperatures, respectively. The orange star indicates the extrapolated point of the continuous phase transition from the liquid to solid phase. The dashed vertical arrow indicates changes in the form of the temperature evolutions, which can eventually be associated with liquid–liquid or solid–solid transitions. The detected solid–solid (S-S) and liquid–liquid (L-L) transitions are also indicated.
Biophysica 04 00003 g002
Figure 3. Temperature evolution of the derivative of the dielectric constant detected during cooling in linseed oil. Curves portraying the pretransitional behavior are related to Equation (8) (liquid phase, supercritical domain) and Equation (10) (solid phase). Values of the parameters are given in Table 1 and Table 2. Note the extraordinary manifestation of the solid–solid (S-S) and liquid–liquid (L-L) transition sequences.
Biophysica 04 00003 g003
Figure 4. Temperature changes in the real part of the dielectric permittivity in linseed oil during cooling from the liquid phase for the set of frequencies from the static domain to the low-frequency (LF) domain. Arrows indicate phase transitions.
Biophysica 04 00003 g004
Figure 5. Temperature changes in the real part of the dielectric permittivity in linseed oil during heating from the solid phase for the set of frequencies from the static domain to the low-frequency (LF) domain. Arrows indicate directly manifesting phase transitions.
Biophysica 04 00003 g005
Figure 6. Linseed oil: temperature changes in the low-frequency contribution of the real part of the dielectric permittivity Δ ε f = ε f ε 10   k H z , as obtained by subtracting the reference static value for f = 10 kHZ. Arrows indicate visible phase transitions.
Biophysica 04 00003 g006
Figure 7. Linseed oil: temperature changes in the low-frequency contribution of the real part of the dielectric permittivity Δ ε f = ε f ε 10   k H z , as obtained by subtracting the reference static value for f = 10 kHZ. Results for heating from the solid state are shown. Apart from the ‘real’ melting temperature from the solid to the liquid state (black arrow), the location of the melting (freezing) temperature obtained during cooling is indicated (light gray arrow). Arrows indicate visible phase transitions.
Biophysica 04 00003 g007
Figure 8. Temperature changes in basic relaxation processes detected for the primary loss curve for the tested linseed oil. The portrayed curves are related to ADR Equation (15) [106], with parameters given in Table 3 and supported by the derivative analysis presented in Figure 9.
Biophysica 04 00003 g008
Figure 9. Temperature evolutions in the apparent activation enthalpy H a T reciprocals for primary relaxation processes detected in linseed oil. Solid lines are related to the universal behavior given by Equation (14). The gray arrow at the top of the figure indicates the direction of temperature change–cooling.
Biophysica 04 00003 g009
Figure 10. Temperature evolution of the reciprocal of DC electric conductivity in linseed oil during cooling (in blue) and heating (in pink). The straight line is related to the basic Arrhenius behavior. On passing T 275 K, the crossover to the SA-type behavior appears.
Biophysica 04 00003 g010
Figure 11. Temperature evolution of the loss factor D = t a n δ in linseed oil during cooling from the liquid phase and during heating from the solid phase. Note the explicit manifestations of T m c o o l (i.e., T f ) and T m h e a t (i.e., T m ), even if for the given path it is only passed without a phase transition. The gray arrow at the top of the figure and the orange one at the bottom indicate the direction of temperature change–cooling and heating respectively.
Biophysica 04 00003 g011
Table 1. Values of parameters describing pretransitional changes in the dielectric constant (Figure 2 and Equation (6)) and its derivative (Figure 3 and Equation (8)) for liquid linseed oil.
Parameter ε * a A ϕ T * T m c o o l Δ T *
Value4.310−16.41250.50224224.60.6
Table 2. Values of parameters related to the post-freezing effect in the solid state, described by Equations (9) and (10), with the discontinuity metric T * * = T * * T m c o o l .
Parametera (K−1)
b
M (K−1)
ϕ
T** (K)
T m c o o l   ( K )
Δ T * *   ( K )
Value9.3 × 10−43.830.1591.0224.75224.60.15
Table 3. Values of parameters in ADR Equation (15) describing the basic evolution of relaxation times in linseed oil, as shown graphically in Figure 8.
Parameter l n C Ω Ω T g * (K) T g (K) Δ T g * (K)
Process 1−31.19.85204.0204.50.5
Process 2−22.04.8204.02062
Process 3−22.23.0204.02106
Disclaimer/Publisher’s Note: The statements, opinions and data contained in all publications are solely those of the individual author(s) and contributor(s) and not of MDPI and/or the editor(s). MDPI and/or the editor(s) disclaim responsibility for any injury to people or property resulting from any ideas, methods, instructions or products referred to in the content.

