Article

The Modification of Polyvinyl Alcohol for Ice Nucleation Based upon the Structures of Antifreeze Glycoproteins Found in Antarctic Fish

by
Monika Bleszynski
Department of Mechanical & Materials Engineering, Ritchie School of Engineering and Computer Science, University of Denver, Denver, CO 80208, USA
Biophysica 2022, 2(4), 417-427; https://doi.org/10.3390/biophysica2040037
Submission received: 14 September 2022 / Revised: 31 October 2022 / Accepted: 31 October 2022 / Published: 3 November 2022
(This article belongs to the Collection Feature Papers in Biophysics)

Abstract

:
Various alternative compounds have been investigated to prevent icing, one of which includes poly(vinyl) alcohol (PVA), which has shown promising anti-freeze effects. However, determining the optimal structures and formulations of PVA for anti-icing applications has remained a challenge. Building upon our previous work, which used molecular dynamics simulations to assess the effects of hydroxyl group separation distance on ice nucleation, in this work, PVA was modified based upon the structures of antifreeze glycoproteins (AFGPs) found in Antarctic fish, and examined as a potential antifreeze compound. Four different PVA samples with different degrees of hydrolysis were fabricated and subsequently examined for their effects on ice crystallization. The results showed that the modified PVA samples with degrees of hydrolysis of 76% and 66% had an effect on ice crystallization, delaying ice crystallization by an average of approximately 20 min, and even preventing ice crystallization altogether in a small portion of the sample. Meanwhile, other samples with degrees of hydrolysis of 100% and 34% either showed no effect on ice crystallization, shortened the ice crystallization time, and appeared to promote ice nucleation.

1. Introduction

Many compounds have been considered for de-icing applications, especially those that are environmentally friendly and offer multiple application methods. In recent years, various antifreeze compounds have been examined that mimic the natural antifreeze compounds found in animals, plants, and insects, as these compounds can prevent the progression of ice crystallization [1,2,3,4]. These compounds are known as ice-binding proteins (IBPs), signifying that they can bind to ice crystals and inhibit or delay the onset of ice crystallization [5,6]. Antarctic notothenioids (Boreogadus saida), also known as Antarctic toothfish, are cold-water fish that live predominantly in water ranging from 0 °C to −4 °C [7,8,9]. These animals contain compounds known as antifreeze glycoproteins (AFGPs), which are unique proteins that can bind to ice crystals, preventing the formation of ice in their veins and allowing them to survive in sub-freezing waters [7,8,9,10,11,12].
Studies have shown that the main mechanism of AFGPs involves binding to different ice faces, preventing the formation of larger ice crystals [12,13,14,15], and researchers have sought to further elucidate their ice-inhibiting mechanism in order to better understand these anti-freeze proteins, as well as to potentially replicate their mechanism in synthetic compounds. However, their exact mechanism remains unclear. Studies have indicated that the peptide or saccharide structures may be responsible for the ice-inhibiting and anti-freeze properties of AFGPs; though there are conflicting hypotheses in the literature. Some reports have suggested that the hydrophobic peptide backbone [8,10,12,13,16] plays a major role in the ice-inhibiting properties, while others have indicated that threonyl residue in the tripeptide unit acts as the main component with ice-inhibiting effects. Meanwhile, other studies have indicated that the hydrophilic saccharide groups contribute to the majority of the water interactions and subsequently ice-nucleation inhibition characteristics [5]. Subsequently, the exact ice-binding mechanisms of AFGPs have not been entirely determined.
Notably, however, studies in the literature have found a geometrical match between PVA and ice, specifically between the oxygen atoms from hydroxyl groups in the PVA polymer and the ice lattice, forming hydrogen bonds that may lock with the ice structure, under the assumption that the O…O distance is not greater than 3.5 Å, with an O-H-O bond angle greater than 145° [17]. Thus, the hydroxyl groups appear to play a critical role, with a radial distribution function between the Oice–Oice of 2.75 Å at the first primary peak, and with a secondary peak at 4.5 Å [17].
Studies have identified polyvinyl alcohol (PVA) as a polymer capable of inhibiting ice nucleation in solution [18,19,20], though similar to AFGPs, there have been some inconsistencies in the literature regarding the effect of PVA on ice crystallization. Some studies have reported that PVA can inhibit ice crystallization, while others have shown that PVA can promote ice nucleation. Lattice matching between anti-freeze compounds and ice is one area that researchers have focused on to elucidate the ice crystallization effect of PVA. Notably, Mochizuki et al. found that by destabilizing the liquid phase, PVA could promote homogeneous ice crystallization. Another study found that the ice crystallization of partially hydrolyzed PVA was due to the Gibbs–Thomson effect [21]. As a result, the effect of hydrolyzed PVA needs to be investigated on ice crystallization, as the differences in crystallization can be correlated to the substitution of the hydroxyl groups along the polymer backbone. Furthermore, the substitution of the hydroxyl groups along the polymer backbone may have a significant effect on the ice crystallization and lattice matching ability of the polymer.
In previous work, we numerically showed that the hydroxyl groups and their distances in anti-freeze compounds may be partially responsible for the anti-freeze properties of AFGPs [22,23]. The molecular dynamics simulation results indicated that modified (PVA) compounds with a hydroxyl distance mimicking the hydroxyl distances found in Antarctic notothenioids could affect the ice nucleation behavior of water [23]. Specifically, hydroxyl groups with a radial distribution between 2.858 Å and 7.117 Å were positively associated with ice nucleation delay and inhibition, while smaller or larger distances were found to either have no effect or promote ice nucleation, to some extent [23]. Thus, in the simulated PVA compounds, ice nucleation inhibition occurred in compounds with a hydroxyl distance between 2.858 Å and 7.117 Å, which was very close to the measured hydroxyl distances of AFGP-8 in Antarctic notothenioids of ~3.455 Å to ~5.518 Å, as well as the hydroxyl distances of common anti-freeze compounds such as ethylene glycol and propylene glycol, of 3.832 Å and 2.911 Å, respectively, when measured from O···O. Therefore, to experimentally verify these molecular dynamics observations, in this work, PVA compounds were fabricated with hydroxyl distances between 2.858 Å and 7.117 Å, mimicking the hydroxyl distances assessed in our previous molecular dynamics study, as well as the hydroxyl distances found in the AFGPs of Antarctic notothenioids. Subsequently, the effectiveness of these modified PVA compounds on their ability to inhibit ice nucleation was assessed. Polymer fabrication was conducted through partial hydrolysis using poly(vinyl acetate-co-vinyl alcohol), where the hydroxyl groups on the polymer chain achieved the required hydroxyl distance of 2.858–7.117 Å. Following synthesis, four PVA samples were obtained with various degrees of hydrolysis, and the various samples were assessed for their effect on ice crystallization.

2. Materials and Methods

2.1. Polyvinyl Alcohol

PVA has a simple structure that allows it to be modified according to molecular weight or degree of hydrolysis, making it a suitable polymer for modification. Most importantly; however, PVA contains a carbon backbone structures with hydroxyl groups (OH), which have been found to play a role in ice inhibition [19,20]. Modification of PVA for ice inhibition or delay may offer particular benefits for applications such as cryopreservation, to reduce ice damage to cells or organs during storage or transport [24,25]. In addition, PVA could be used to prevent ice damage to crops, or even applied to roadways or surfaces to prevent ice build-up [26]. Therefore, by changing the number and distance between the hydroxyl groups, PVA can be modified to mimic the structures of Antarctic Notothenioid AFGPs, as a means of assessing the effect of hydroxyl group distance.
PVA fabrication typically involves the hydrolysis of polyvinyl acetate, allowing the polymer to be either fully or partially hydrolyzed. Fully hydrolyzed PVA will exhibit strong inter-molecular hydrogen bond interactions as a result of the OH groups, which will be located in close proximity. However, partially hydrolyzed PVA will allow for the hydroxyl groups to be spaced some distance apart, due to the intermediate placement of COCH3 groups, allowing for a hydroxyl spacing of interest of 2.858–7.117 Å to be created.

2.1.1. Synthesis of Poly(vinyl acetate)

To better understand if the hydroxyl group distance of a modified polymer would have an effect on ice crystallization and nucleation of water, in this work, PVA was prepared first through the hydrolysis of poly(vinyl acetate) (PVAc). This was because the statistical distance between the hydroxyl groups along the polymer backbone could be controlled by the degree of hydrolysis of PVAc. Partial hydrolysis allowed for the formation of poly(vinyl acetate-co-vinyl alcohol), with two side groups on the polymer chain composed of hydroxyls, to subsequently achieve the required hydroxyl distance of 2.858–7.117 Å, resulting in the appropriate spacing of the hydroxyl groups for ice binding.
Attempts were made in this work to create the PVA directly; however, this was difficult to achieve. Therefore, the modified PVA was prepared through the hydrolysis of PVAc, where PVAc was first prepared and synthesized by free radical polymerization of the vinyl acetate monomer in solution. The PVAc polymer was analyzed by size exclusion chromatography (SEC) in tetrahydrofuran (THF), using light scattering (LS) to determine the molecular weight (MW) and degree of polymerization (number of repeat units) of the polymer.
The polymerization of PVAc was conducted in chloroform, which resulted in better control of the MW compared to other approaches, and batch production of the polymer could be achieved. A sufficiently low MW was sought, to allow for reconstitution and subsequent experimentation. Therefore, tuning of the solid content and initiator concentration allowed for a sufficiently low degree of polymerization, resulting in a material with the molecular weight characteristics presented in Table 1, which were determined by SEC. The nuclear magnetic resonance (NMR) spectrum of PVAc following synthesis is shown in Figure 1. All synthesis work was conducted by Chempilots (Farum, Denmark).

2.1.2. Synthesis of Poly(vinyl) Alcohol

Following the successful synthesis of PVAc, the batch was split into four equal portions, where each portion was subjected to hydrolysis under varying conditions to obtain medium, low, and high degrees of hydrolysis. The first batch of PVAc was subjected to hydrolysis under a stoichiometric amount of sodium hydroxide (NaOH) in methanol, to obtain a hydrolysis degree of 50% Analysis of the H-NMR peak intensities showed that the product was fully hydrolyzed (degree of hydrolysis of 100%).
Afterward, to change the hydrolysis degree, the solvent was changed to acetone to prevent possible catalytic activity in methanol, resulting in an excessively high degree of hydrolysis. The following batch carried out in acetone targeted a degree of hydrolysis of 50% and NMR analysis determined a degree of hydrolysis of 34%, resulting in controlled hydrolysis.
Two additional batches were created, where stoichiometry was altered, resulting in products with degrees of hydrolysis of 76% and 66%, as shown in Table 2, indicating the different PVA products produced with degree of hydrolysis values within the statistical distribution of the standard vinyl alcohol groups.

2.2. Ice Inhibition Experiments

To determine the de-icing effects of the modified PVA polymer, icing experiments were conducted using varying concentrations of the PVA samples. Each PVA sample (1–4) was dissolved in water at 10%, 20%, and 50% by mass, for a total of 12 samples, to determine the effect of mass content on ice crystallization. The process for the experiments was as follows. The crystallized PVA was dissolved in laboratory reagent grade distilled water (Research Products International, Mount Prospect, IL, USA) in the test tubes, and was poured directly into the test tubes to reduce the likelihood of particular contamination, at the given mass content ratios and stirred in glass test tubes until dissolved (distilled water was used in all experiments). The capped test tubes containing the PVA samples and pure distilled water were placed in a freezer at −8 °C and visually assessed every 2 min for changes in crystallization, until the onset time of ice crystallization, which was recorded and compared to distilled water without any PVA, which was used as the control. The samples were then allowed to freeze completely, and the complete crystallization times were recorded to determine the ice inhibition effects of the four PVA samples. The experimental were performed in triplicate with the average times taken, and the standard deviation was calculated.

3. Results and Discussion

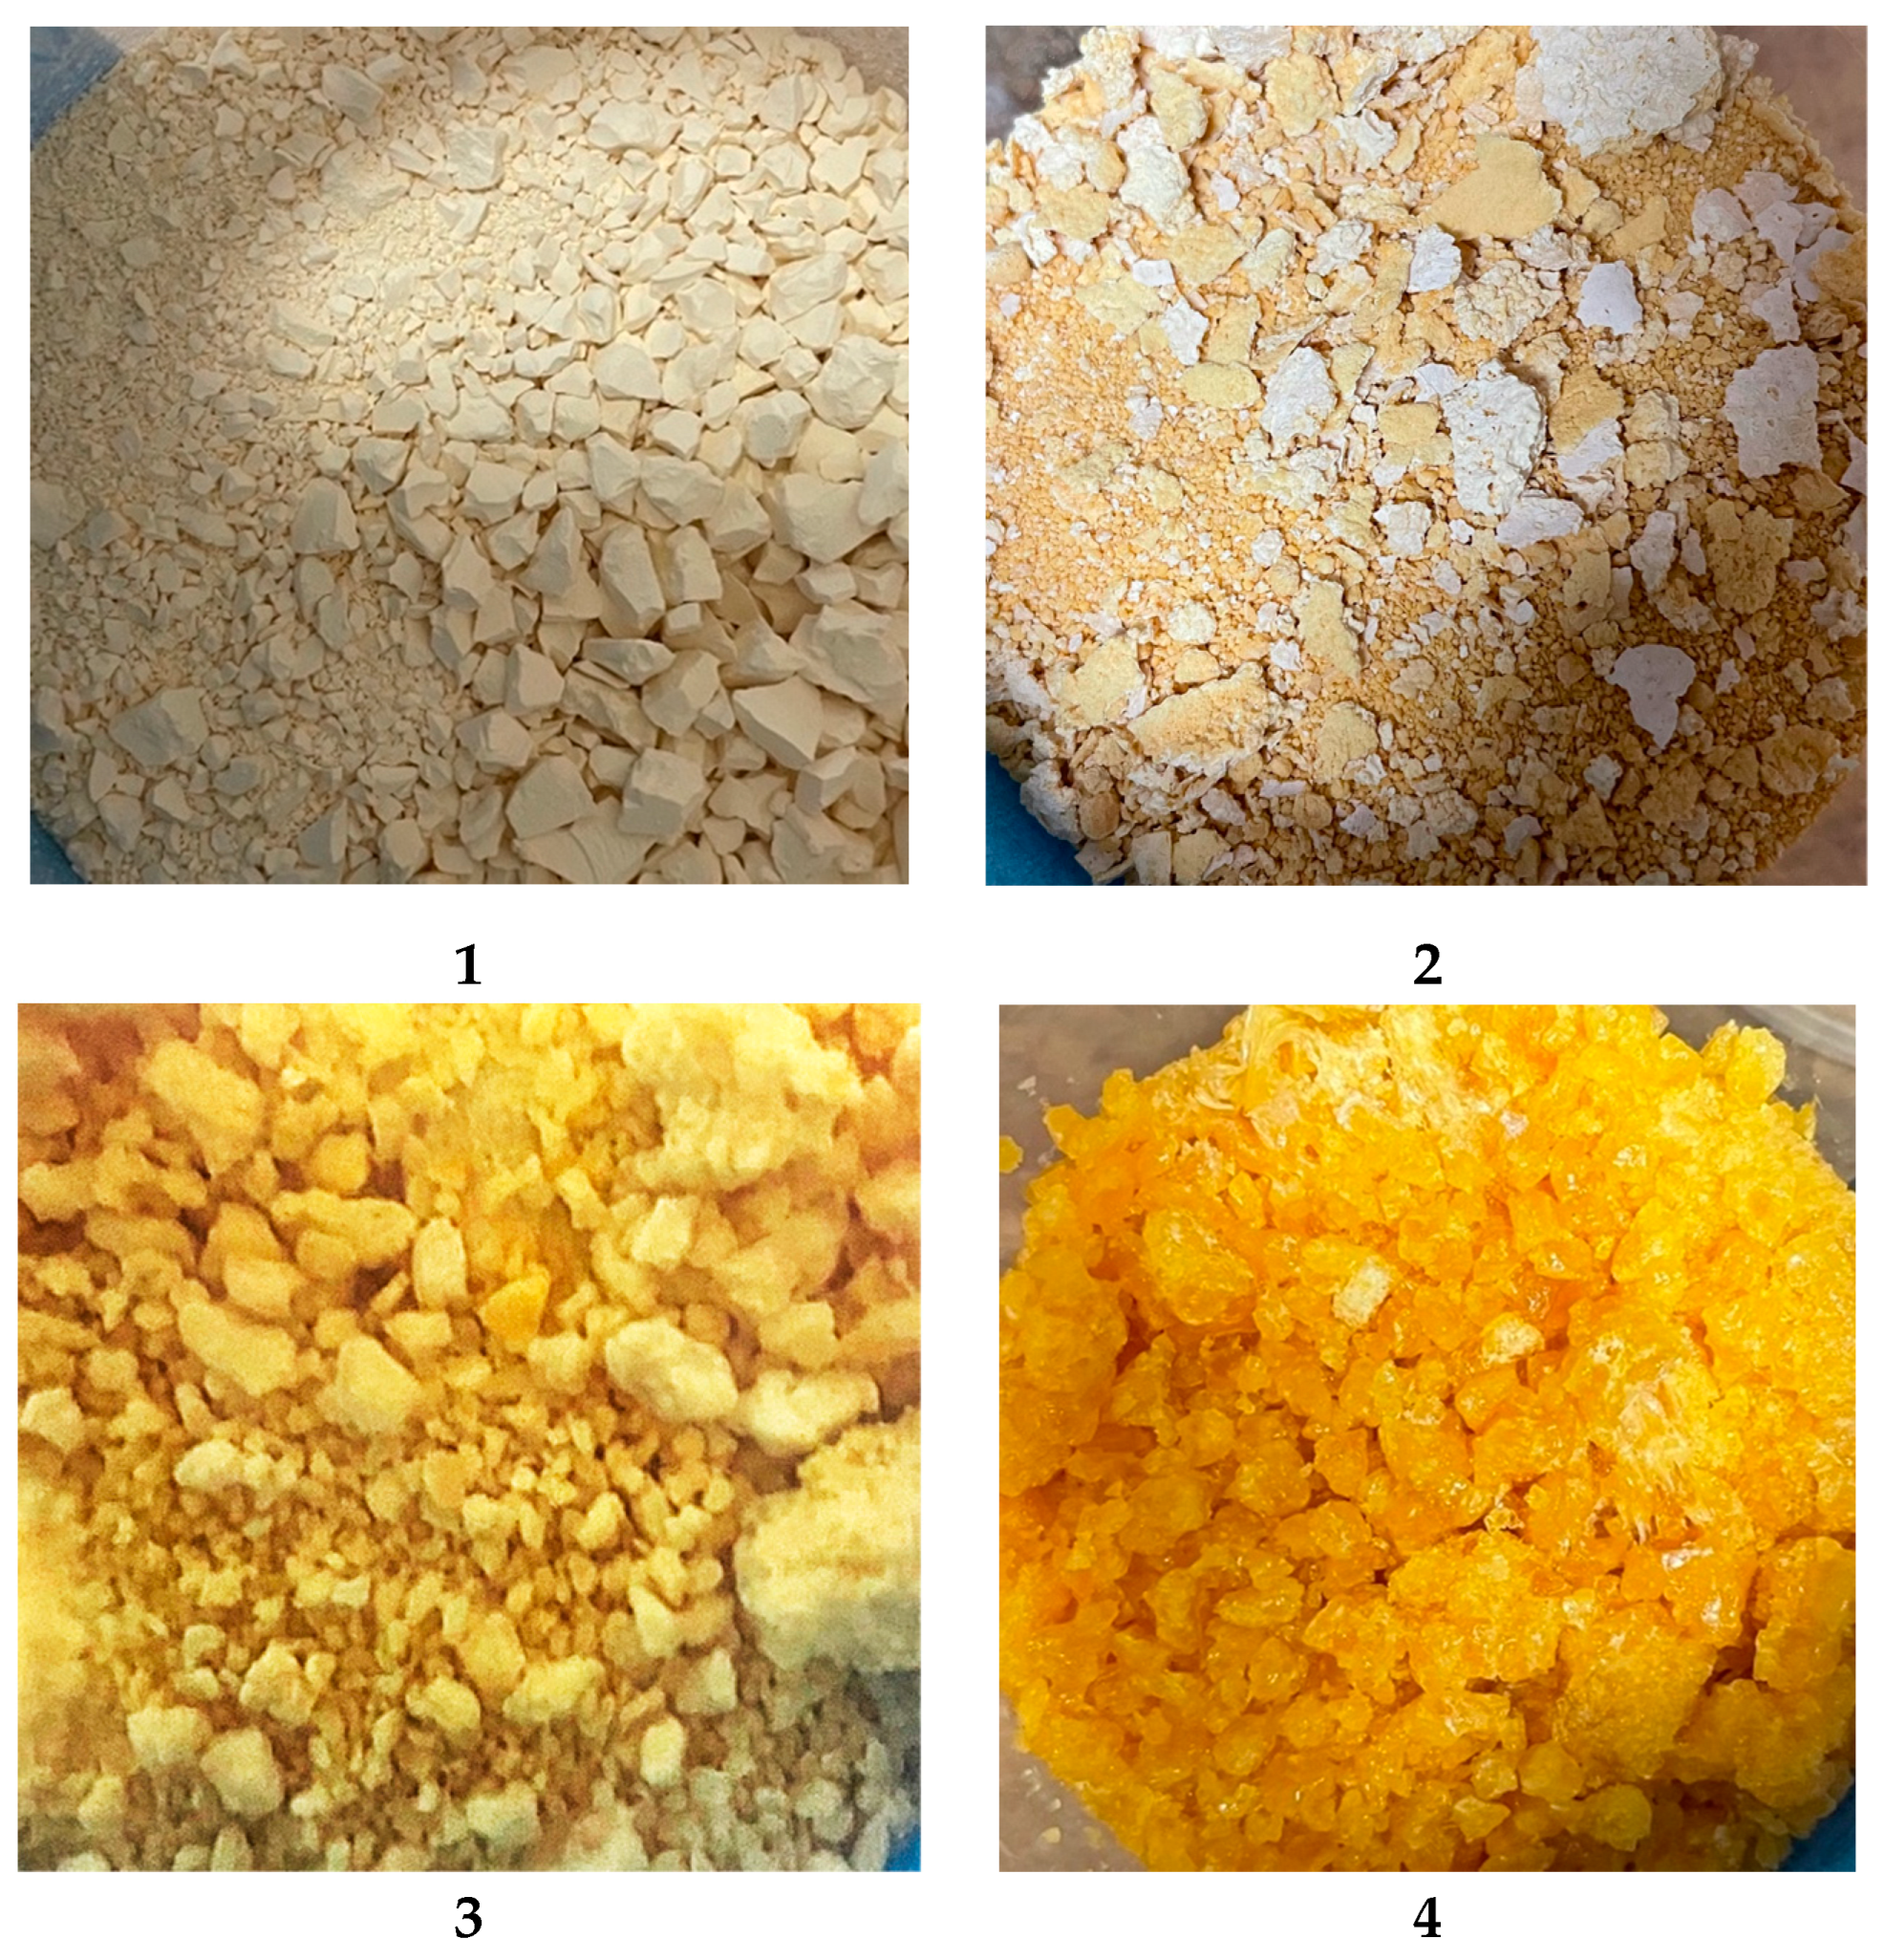
The four PVA samples are presented in Figure 2, showing their different consistencies and textures. PVA 1 had a chalk-like consistency, PVA samples 2–3 were powder-like, and PVA 4 had gummy consistency that agglomerated and made it difficult to separate. Following the polymerization process, the obtained PVA samples were slightly discolored, with a slight yellow hue. Additional SEC and NMR analysis was conducted to determine the cause of this discoloration; however, subsequent assessment did not show the presence of impurities or defects. A portion of PVA 1 was dialyzed (DMSO, 1 kDa MWCO) to remove any potential small impurities. However, even after purification by dialysis, the polymer sample was still yellow, and this discoloration was determined to be an inherent property of the low MW polymer synthesized in chloroform.
Due to the various consistencies of the PVA samples, ranging from powder-like to gummy-like, there were significant differences among the four polymer samples in terms of dissolution in water in the de-icing experiments. We found that PVA samples 1–3 dissolved in water, though some precipitation still occurred; however, PVA 4, which had a gummy-like consistency, was extremely difficult to dissolve in water. Therefore, PVA 4 was shaken for more time than the other samples, to allow for dissolution. Nevertheless, small particles of PVA material remained, even after extended shaking.
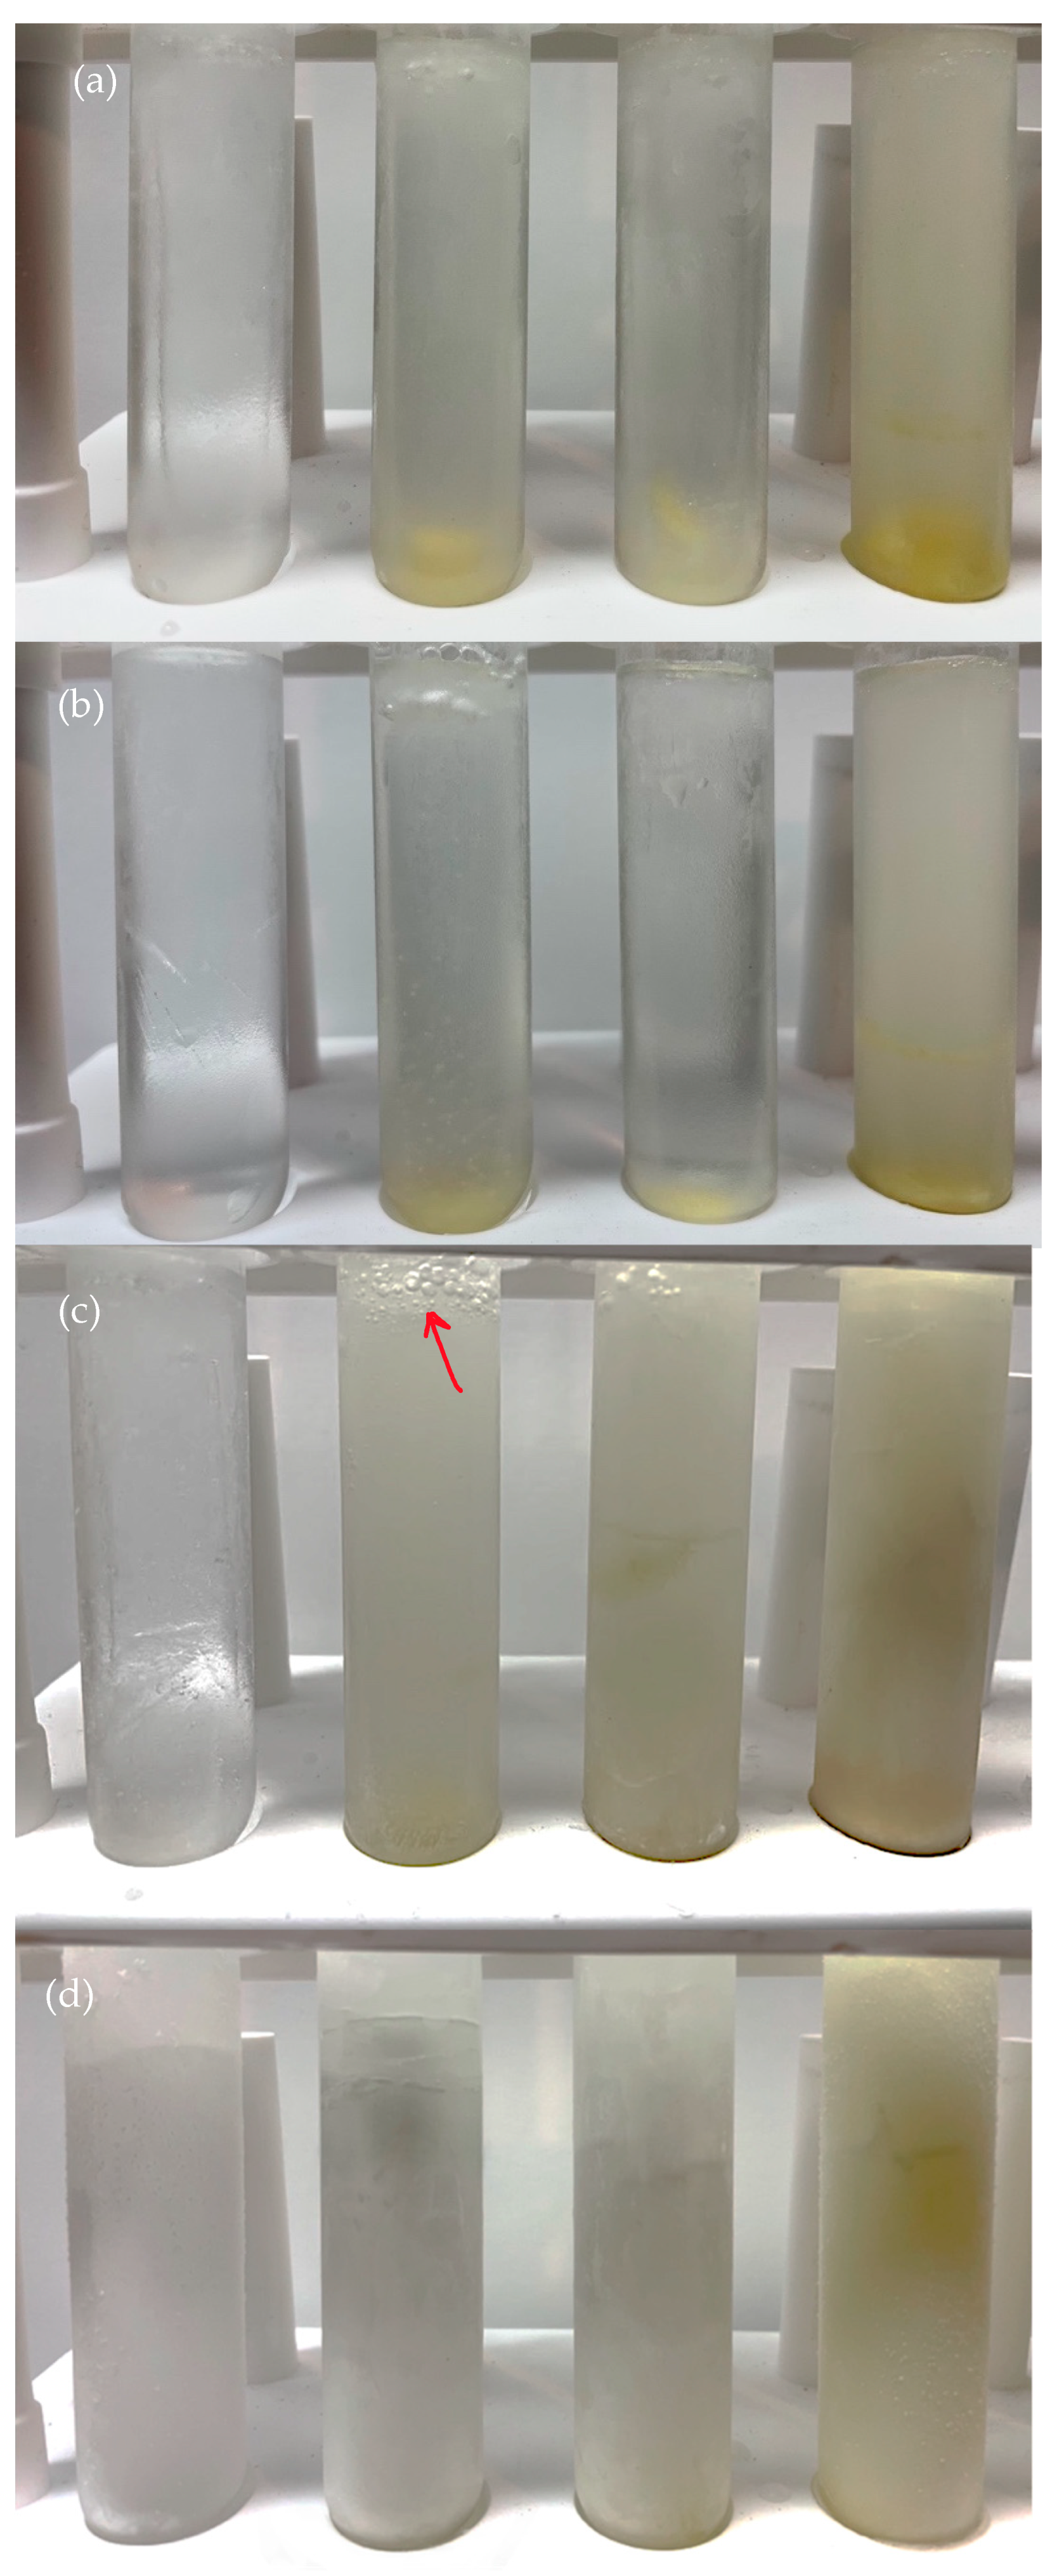
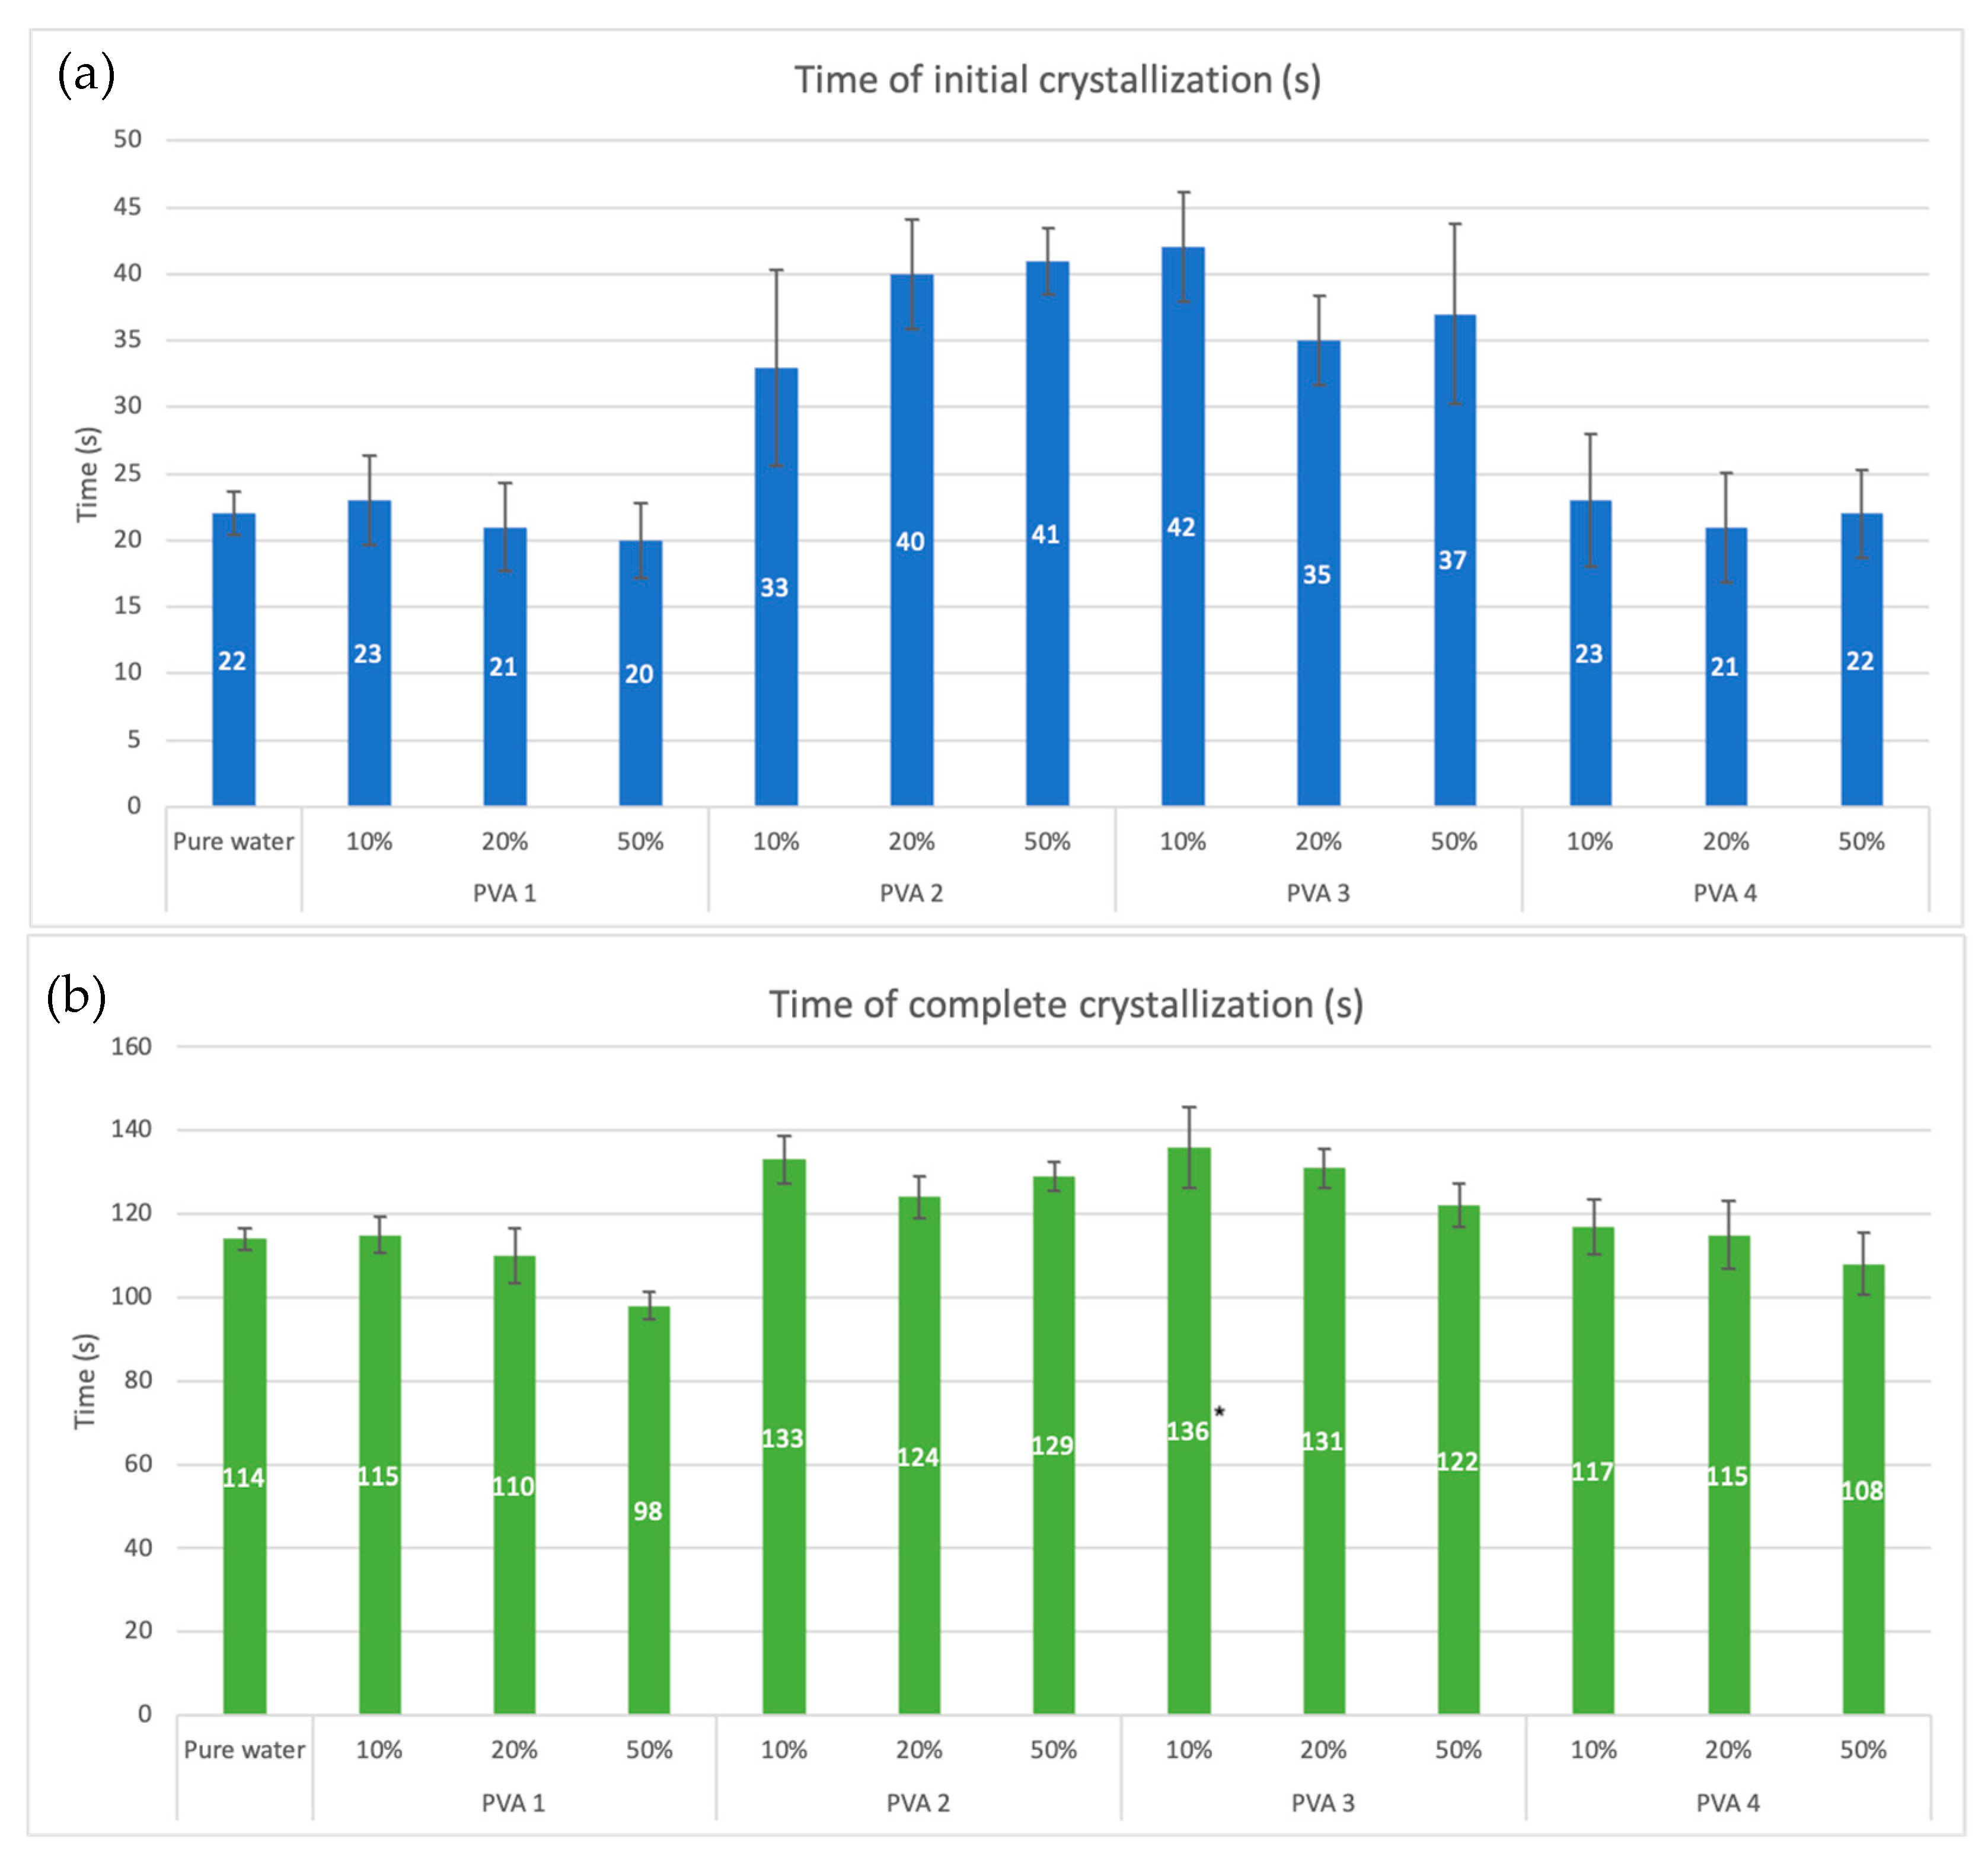
We observed different ice-crystallization behavior among the PVA samples in the icing experiments. Photographs of all PVA samples upon complete crystallization are shown in Figure 3, and the charts in Figure 4a,b present the crystallization times with standard deviation. In the experiments, the distilled water without PVA required approximately 114 min to undergo complete crystallization, and approximately 22 min to initiate crystallization. PVA 1, which had a degree of hydrolysis of 100%, showed differences in freezing times compared to pure water without PVA, and the PVA 1 samples underwent complete crystallization between 98–115 min, with the 50% PVA 1 sample exhibiting the shortest complete crystallization time of 98 min, which was 16 faster than pure water. PVA 2, with a degree of hydrolysis of 76%, had an overall longer average ice crystallization delay, between 124–133 min, and PVA 2 with 10% PVA content had the longest complete crystallization time of 133 min, among the PVA 2 samples. The initial crystallization times of the PVA 2 samples were also longer than the PVA 1 samples and pure water without PVA, with initial crystallization times ranging from 33 to 41 min, compared to 22 min for pure water. However, the longest initial and complete crystallization times were observed for the 10% PVA 3 sample, with times of 42 and 136 min, respectively, and this sample also showed the largest variations in crystallization times. Interestingly, this sample contained a small portion at the very top of the test tube that remained liquid, as shown by the red arrow in Figure 3c, though the remainder of the sample in the test tube was completely frozen. The PVA 3 sample also had the largest standard deviation for the time of complete crystallization among the PVA samples (±9.62 for 10% PVA 3), possibly as a result of the inhibition effect of the PVA on ice crystallization. Though it should be noted, for PVA 3 with 10% PVA content, an exact time of complete crystallization was difficult to measure due to the 3 mm portion at the top of the sample that remained liquid, and the values were taken when the remaining sample was visibly solid. Therefore, this may have affected the observation of ice crystallization time, and the PVA compound, as well as the remaining portion that remained liquid, may have affected the overall ice nucleation and crystallization behavior of the remaining liquid.
PVA 4, did not show any delay in ice nucleation, with similar initial and complete crystallization times as pure water, with the exception of PVA 4 with 50% content, which had a shorter complete crystallization time. The PVA 4 samples also showed large variations in standard deviation. This possibly occurred because PVA had difficulty dissolving in the distilled water, and any particles that did not fully dissolve may have acted as random nucleation points for ice, resulting in inconsistencies in ice nucleation time and crystallization behavior.
We also observed that certain samples showed early onset of ice crystallization. Notably, PVA 1 with 10% and 50% content, and PVA 4 with 50% content exhibited shorter complete crystallization times compared to pure water, indicating possible nucleation promotion behavior. Differences were observed among the PVA samples according to mass content, though the results were not as significant as initially expected. Specifically, more mass content of PVA appeared to promote ice crystallization in PVA samples 1 and 4, with the 50% by mass samples exhibiting crystallization times that were significantly shorter than the times observed for 10% and 20% mass content. This appeared to confirm the theory that the very high and low degrees of hydrolysis in PVA samples 1 and 4 promoted ice crystallization, rather than inhibit it, with more PVA mass content promoting the effect. However, the same pattern was not observed for ice crystallization delay or inhibition among the PVA 2 and PVA 3 samples. Rather, the lowest polymer mass content of 10% delayed complete ice crystallization the longest, as opposed to 50% mass content.
Overall, the PVA 2 and PVA 3 samples showed delayed ice crystallization at both the initial and complete crystallization times. These partially hydrolyzed samples with degrees of hydrolysis of 76% and 66%, respectively, provided delayed ice formation, with an average complete crystallization delay of 19 min for PVA 2 with 10% mass content, compared to pure water, indicating that the hydrolysis degree had a significant impact on icing behavior. Specifically, PVA 3 with 10% content managed to entirely prevent icing in a portion of the test tube in each iteration of the experiment (as shown in Figure 3c). This small portion, consisting of approximately 3 mm of the top portion of the test tube remained liquid even after the remainder of the sample was completely frozen when additionally left to freeze overnight, indicating that this material had a partial de-icing effect. However, the exact reason for the difference in ice crystallization behavior could not be determined in this work, though it is possible that the slight difference in temperature between the top and bottom of the test tube, which was difficult to measure with current equipment, affected the ice crystallization behavior of the PVA 3 sample, allowing it to remain partially liquid in the top portion, though the neighboring pure water and the remaining PVA samples were completely frozen. Furthermore, the addition of PVA influenced the viscosity depending on the loading content of PVA in the experiments. Previous studies have noted a change in the viscosity of water, which will increase significantly upon cooling, and then decrease after crystallization [27]. In addition, the linear rate of water crystallization was shown to increase in hydrocolloid suspensions at −3 °C, indicating an effect on ice crystallization in general [28]. Therefore, it is possible that the change in viscosity among the different PVA solutions had an effect on ice crystallization. Specifically, the crystallization behavior of PVA 3 with 10% content may have been affected by the change in viscosity of the PVA + water mixture due to resistance between molecular associations between the water molecules and PVA, as indicated by its delayed ice crystallization time. However, considering the PVA mixtures with additional PVA loading content, an optimal viscosity may be needed to achieve ice crystallization inhibition or delay.
According to the results from our previous numerical work, it is possible that the Oice⋯Oice distance of ice and O⋯O in the 100% hydrolyzed PVA samples acted as ideal scaffold structures for locking the water molecules in place, allowing them to preferentially stabilize in crystalline form; thus, promoting ice nucleation and crystallization [29]. By contrast, the divergent distances in the samples with degrees of hydrolysis of 76% and 66% may have helped to destabilize the liquid phase, where the hydroxyl groups locked Oice⋯Oice at a distance that induced net strain on the PVA polymer, resulting in an energy barrier that delayed and possibly inhibited further crystallization [29,30,31,32,33]. This energy barrier had to be overcome to allow for crystallization to occur, and possible differences in temperature may have been sufficient to prevent complete crystallization, as observed in the PVA 3 sample [29,30,31,32,33]. These results partially confirmed the numerical simulation results obtained in our previous work, showing that modified PVA could delay and inhibit ice crystallization, when the hydroxyl groups had a distance between 2.858 Å and 7.117 Å, as constructed in this work. Therefore, these results appeared to confirm the hydroxyl distance effect on ice crystallization, though the effect of hydrolysis degree will have to be further investigated to determine the disparities in initial ice crystallization times, and the times between initial and complete crystallization, among the PVA samples. However, this study had certain limitations, such as utilizing a large liquid sample size and conducting manual observations of the samples and temperature in the freezer, and this process may have affected the nucleation process through minute shaking and caused inhomogeneous nucleation events. Therefore, further work will need to be done to more precisely investigate the crystallization behavior of the PVA material and to better assess certain factors, such as how the freezing temperature may affect the behavior and influence of PVA on ice crystallization, especially at different concentrations.

4. Conclusions

In this work, we assessed the effect of hydroxyl group modification of PVA polymer samples, to determine the effect of hydroxyl group distance on ice crystallization behaviors. Based upon our previous molecular dynamics work, a hydroxyl group distance between 2.858 Å and 7.117 Å was sought, and 4 PVA samples were synthesizes with different degrees of hydrolysis. We found that modified PVA samples 2 and 3, with a degree of hydrolysis of 76% and 66%, showed an effect on ice crystallization, delaying ice crystallization by an average of 15 min. Notably, PVA 3 at 10% content in water also showed anti-freeze behavior, preventing complete crystallization in a small portion of the sample, even when frozen overnight. However, the samples with degrees of hydrolysis of 100% and 34% showed no effect on ice crystallization, or decreased the ice crystallization time, resulting in an ice nucleation promotion effect.

Funding

This research was funded by The Colorado Office of Economic Development and International Trade, Grant Award #37977.

Data Availability Statement

The authors confirm that the data supporting the findings of this study are available within the article.

Conflicts of Interest

The authors declare no conflict of interest.

References

  1. Wisniewski, M.; Willick, I.R.; Duman, J.G.; Livingston, D.; Newton, S.S. Plant antifreeze proteins. In Antifreeze Proteins; Springer: Cham, Switzerland, 2020; Volume 1, pp. 189–226. [Google Scholar]
  2. Nagel, L.; Plattner, C.; Budke, C.; Majer, Z.; Devries, A.L.; Berkemeier, T.; Koop, T.; Sewald, N. Synthesis and characterization of natural and modified antifreeze glycopeptides: Glycosylated foldamers. Amino Acids 2011, 41, 719–732. [Google Scholar] [CrossRef] [PubMed]
  3. Bagwell, S.N.; Ricker, J.V. Antifreeze proteins: Effective adaptations of organisms for low temperature survival. Bios 2019, 90, 158–170. [Google Scholar] [CrossRef]
  4. Duman, J.G.; Samuel, S. Newton. Insect Antifreeze Proteins. In Antifreeze Proteins; Springer: Cham, Switzerland, 2020; Volume 1, pp. 131–187. [Google Scholar]
  5. Voets, I.I. From ice-binding proteins to bio-inspired antifreeze materials. Soft Matter 2017, 13, 4808–4823. [Google Scholar] [CrossRef] [PubMed] [Green Version]
  6. Wierzbicki, A.; Taylor, M.S.; Knight, C.A.; Madura, J.D.; Harrington, J.P.; Sikes, C.S. Analysis of shorthorn sculpin antifreeze protein stereospecific binding to (2–10) faces of ice. Biophys. J. 1996, 71, 8–18. [Google Scholar] [CrossRef] [Green Version]
  7. Devries, A.L. Glycoproteins as Biological Antifreeze Agents in Antarctic Fishes. Science 1971, 172, 1152–1155. [Google Scholar] [CrossRef]
  8. Knight, C.; Driggers, E.; Devries, A. Adsorption to ice of fish antifreeze glycopeptides 7 and 8. Biophys. J. 1993, 64, 252–259. [Google Scholar] [CrossRef] [Green Version]
  9. Harding, M.M.; Anderberg, P.I.; Haymet, A.D.J. ’Antifreeze’ glycoproteins from polar fish. JBIC J. Biol. Inorg. Chem. 2003, 270, 1381–1392. [Google Scholar] [CrossRef]
  10. Geoghegan, K.; Osuga, D.; Ahmed, A.; Yeh, Y.; Feeney, R. Antifreeze glycoproteins from Polar fish. Structural requirements for function of glycopeptide 8. J. Biol. Chem. 1980, 255, 663–667. [Google Scholar] [CrossRef]
  11. Liu, S.; Ben, R.N. C-linked galactosyl serine AFGP analogues as potent recrystallization inhibitors. Org. Lett. 2005, 7, 2385–2388. [Google Scholar] [CrossRef]
  12. Urbańczyk, M.; Góra, J.; Latajka, R.; Sewald, N. Antifreeze glycopeptides: From structure and activity studies to current approaches in chemical synthesis. Amino Acids 2016, 49, 209–222. [Google Scholar] [CrossRef]
  13. Meister, K.; Devries, A.L.; Bakker, H.J.; Drori, R. Antifreeze Glycoproteins Bind Irreversibly to Ice. J. Am. Chem. Soc. 2018, 140, 9365–9368. [Google Scholar] [CrossRef] [PubMed]
  14. Mochizuki, K.; Molinero, V. Antifreeze Glycoproteins Bind Reversibly to Ice via Hydrophobic Groups. J. Am. Chem. Soc. 2018, 140, 4803–4811. [Google Scholar] [CrossRef] [PubMed]
  15. Meister, K.; Moll, C.J.; Chakraborty, S.; Jana, B.; Devries, A.L.; Ramløv, H.; Bakker, H.J. Molecular structure of a hyperactive antifreeze protein adsorbed to ice. J. Chem. Phys. 2019, 150, 131101. [Google Scholar] [CrossRef] [PubMed]
  16. Surís-Valls, R.; Voets, I.K. Peptidic antifreeze materials: Prospects and challenges. Int. J. Mol. Sci. 2019, 20, 5149. [Google Scholar] [CrossRef] [PubMed] [Green Version]
  17. Weng, L.; Stott, S.L.; Toner, M. Molecular dynamics at the interface between ice and poly (vinyl alcohol) and ice recrystallization inhibition. Langmuir 2017, 34, 5116–5123. [Google Scholar] [CrossRef] [PubMed]
  18. Tessier, S.N.; Haque, O.; Pendexter, C.A.; Cronin, S.E.; Weng, L.; Yeh, H.; Markmann, J.F.; Taylor, M.J.; Fahy, G.M.; Toner, M.; et al. The role of antifreeze glycopeptides (AFGP) and polyvinyl alcohol/polyglycerol (X/Z-1000) cocktails as ice modulators during partial freezing of rat livers. bioRxiv 2021, in press. [Google Scholar]
  19. Sheng, W.; Li, X.; Pei, Y.; Wang, R.; Zhang, X.; Pang, S. Mechanism of ice nucleation inhibition of PVA and PVP in aqueous glycerin solution. Thermochim. Acta 2020, 689, 178617. [Google Scholar] [CrossRef]
  20. Liu, X.; Pan, Y.; Liu, F.; He, Y.; Zhu, Q.; Liu, Z.; Zhan, X.; Tan, S. A review of the material characteristics, antifreeze mechanisms, and applications of cryoprotectants (CPAs). J. Nanomater. 2021, 2021, 9990709. [Google Scholar] [CrossRef]
  21. Fitzner, M.; Philipp, P.; Michaelides, A. Predicting heterogeneous ice nucleation with a data-driven approach. Nat. Commun. 2020, 11, 4777. [Google Scholar] [CrossRef]
  22. Bleszynski, M.; Reil, M.; Kumosa, M. Hydroxyl Group Separation Distances in Anti-Freeze Compounds and Their Effects on Ice Nucleation. Int. J. Mol. Sci. 2020, 21, 8488. [Google Scholar] [CrossRef]
  23. Bleszynski, M.; Reil, M. Computational Assessment of Modified Antifreeze Glycoproteins on Ice Nucleation. Biophysica 2021, 1, 168–178. [Google Scholar] [CrossRef]
  24. Chang, T.; Gang, Z. Ice inhibition for cryopreservation: Materials, strategies, and challenges. Adv. Sci. 2021, 8, 2002425. [Google Scholar] [CrossRef] [PubMed]
  25. Deller, R.C.; Pessin, J.E.; Vatish, M.; Mitchell, D.A.; Gibson, M.I. Enhanced non-vitreous cryopreservation of immortalized and primary cells by ice-growth inhibiting polymers. Biomater. Sci. 2016, 4, 1079–1084. [Google Scholar] [CrossRef] [PubMed] [Green Version]
  26. Sabando, C.; Ide, W.; Rodríguez-Llamazares, S.; Bastías, R.M.; Valenzuela, M.; Rojas, C.; Castaño, J.; Pettinelli, N.; Bouza, R.; Müller, N. Preparation of Poly (vinyl Alcohol) Microparticles for Freeze Protection of Sensitive Fruit Crops. Polymers 2022, 14, 2452. [Google Scholar] [CrossRef] [PubMed]
  27. Sabando, C.; Ide, W.; Rodríguez-Llamazares, S.; Bastías, R.M.; Valenzuela, M.; Rojas, C.; Castaño, J.; Pettinelli, N.; Bouza, R.; Müller, N. Viscosity of deeply supercooled water and its coupling to molecular diffusion. Proc. Natl. Acad. Sci. USA 2015, 112, 12020–12025. [Google Scholar]
  28. Budiaman, E.R.; Fennema, O. Linear rate of water crystallization as influenced by viscosity of hydrocolloid suspensions. J. Dairy Sci. 1987, 70, 547–554. [Google Scholar] [CrossRef]
  29. Röttger, K.; Endriss, A.; Ihringer, J.; Doyle, S.; Kuhs, W.F. Lattice constants and thermal expansion of H2O and D2O ice Ih between 10 and 265 K. Acta Crystallogr. Sect. B Struct. Sci. 1994, 50, 644–648. [Google Scholar] [CrossRef]
  30. Czechura, P.; Tam, R.Y.; Dimitrijevic, E.; Murphy, A.V.; Ben, R.N. The Importance of Hydration for Inhibiting Ice Recrystallization with C-Linked Antifreeze Glycoproteins. J. Am. Chem. Soc. 2008, 130, 2928–2929. [Google Scholar] [CrossRef]
  31. Nada, H.; Furukawa, Y. Antifreeze proteins: Computer simulation studies on the mechanism of ice growth inhibition. Polym. J. 2012, 44, 690–698. [Google Scholar] [CrossRef] [Green Version]
  32. Reinhardt, A.; Doye, J.P.K. Free energy landscapes for homogeneous nucleation of ice for a monatomic water model. J. Chem. Phys. 2012, 136, 054501. [Google Scholar] [CrossRef] [Green Version]
  33. Budke, C.; Dreyer, A.; Jaeger, J.; Gimpel, K.; Berkemeier, T.; Bonin, A.S.; Nagel, L.; Plattner, C.; Devries, A.L.; Sewald, N.; et al. Quantitative Efficacy Classification of Ice Recrystallization Inhibition Agents. Cryst. Growth Des. 2014, 14, 4285–4294. [Google Scholar] [CrossRef]
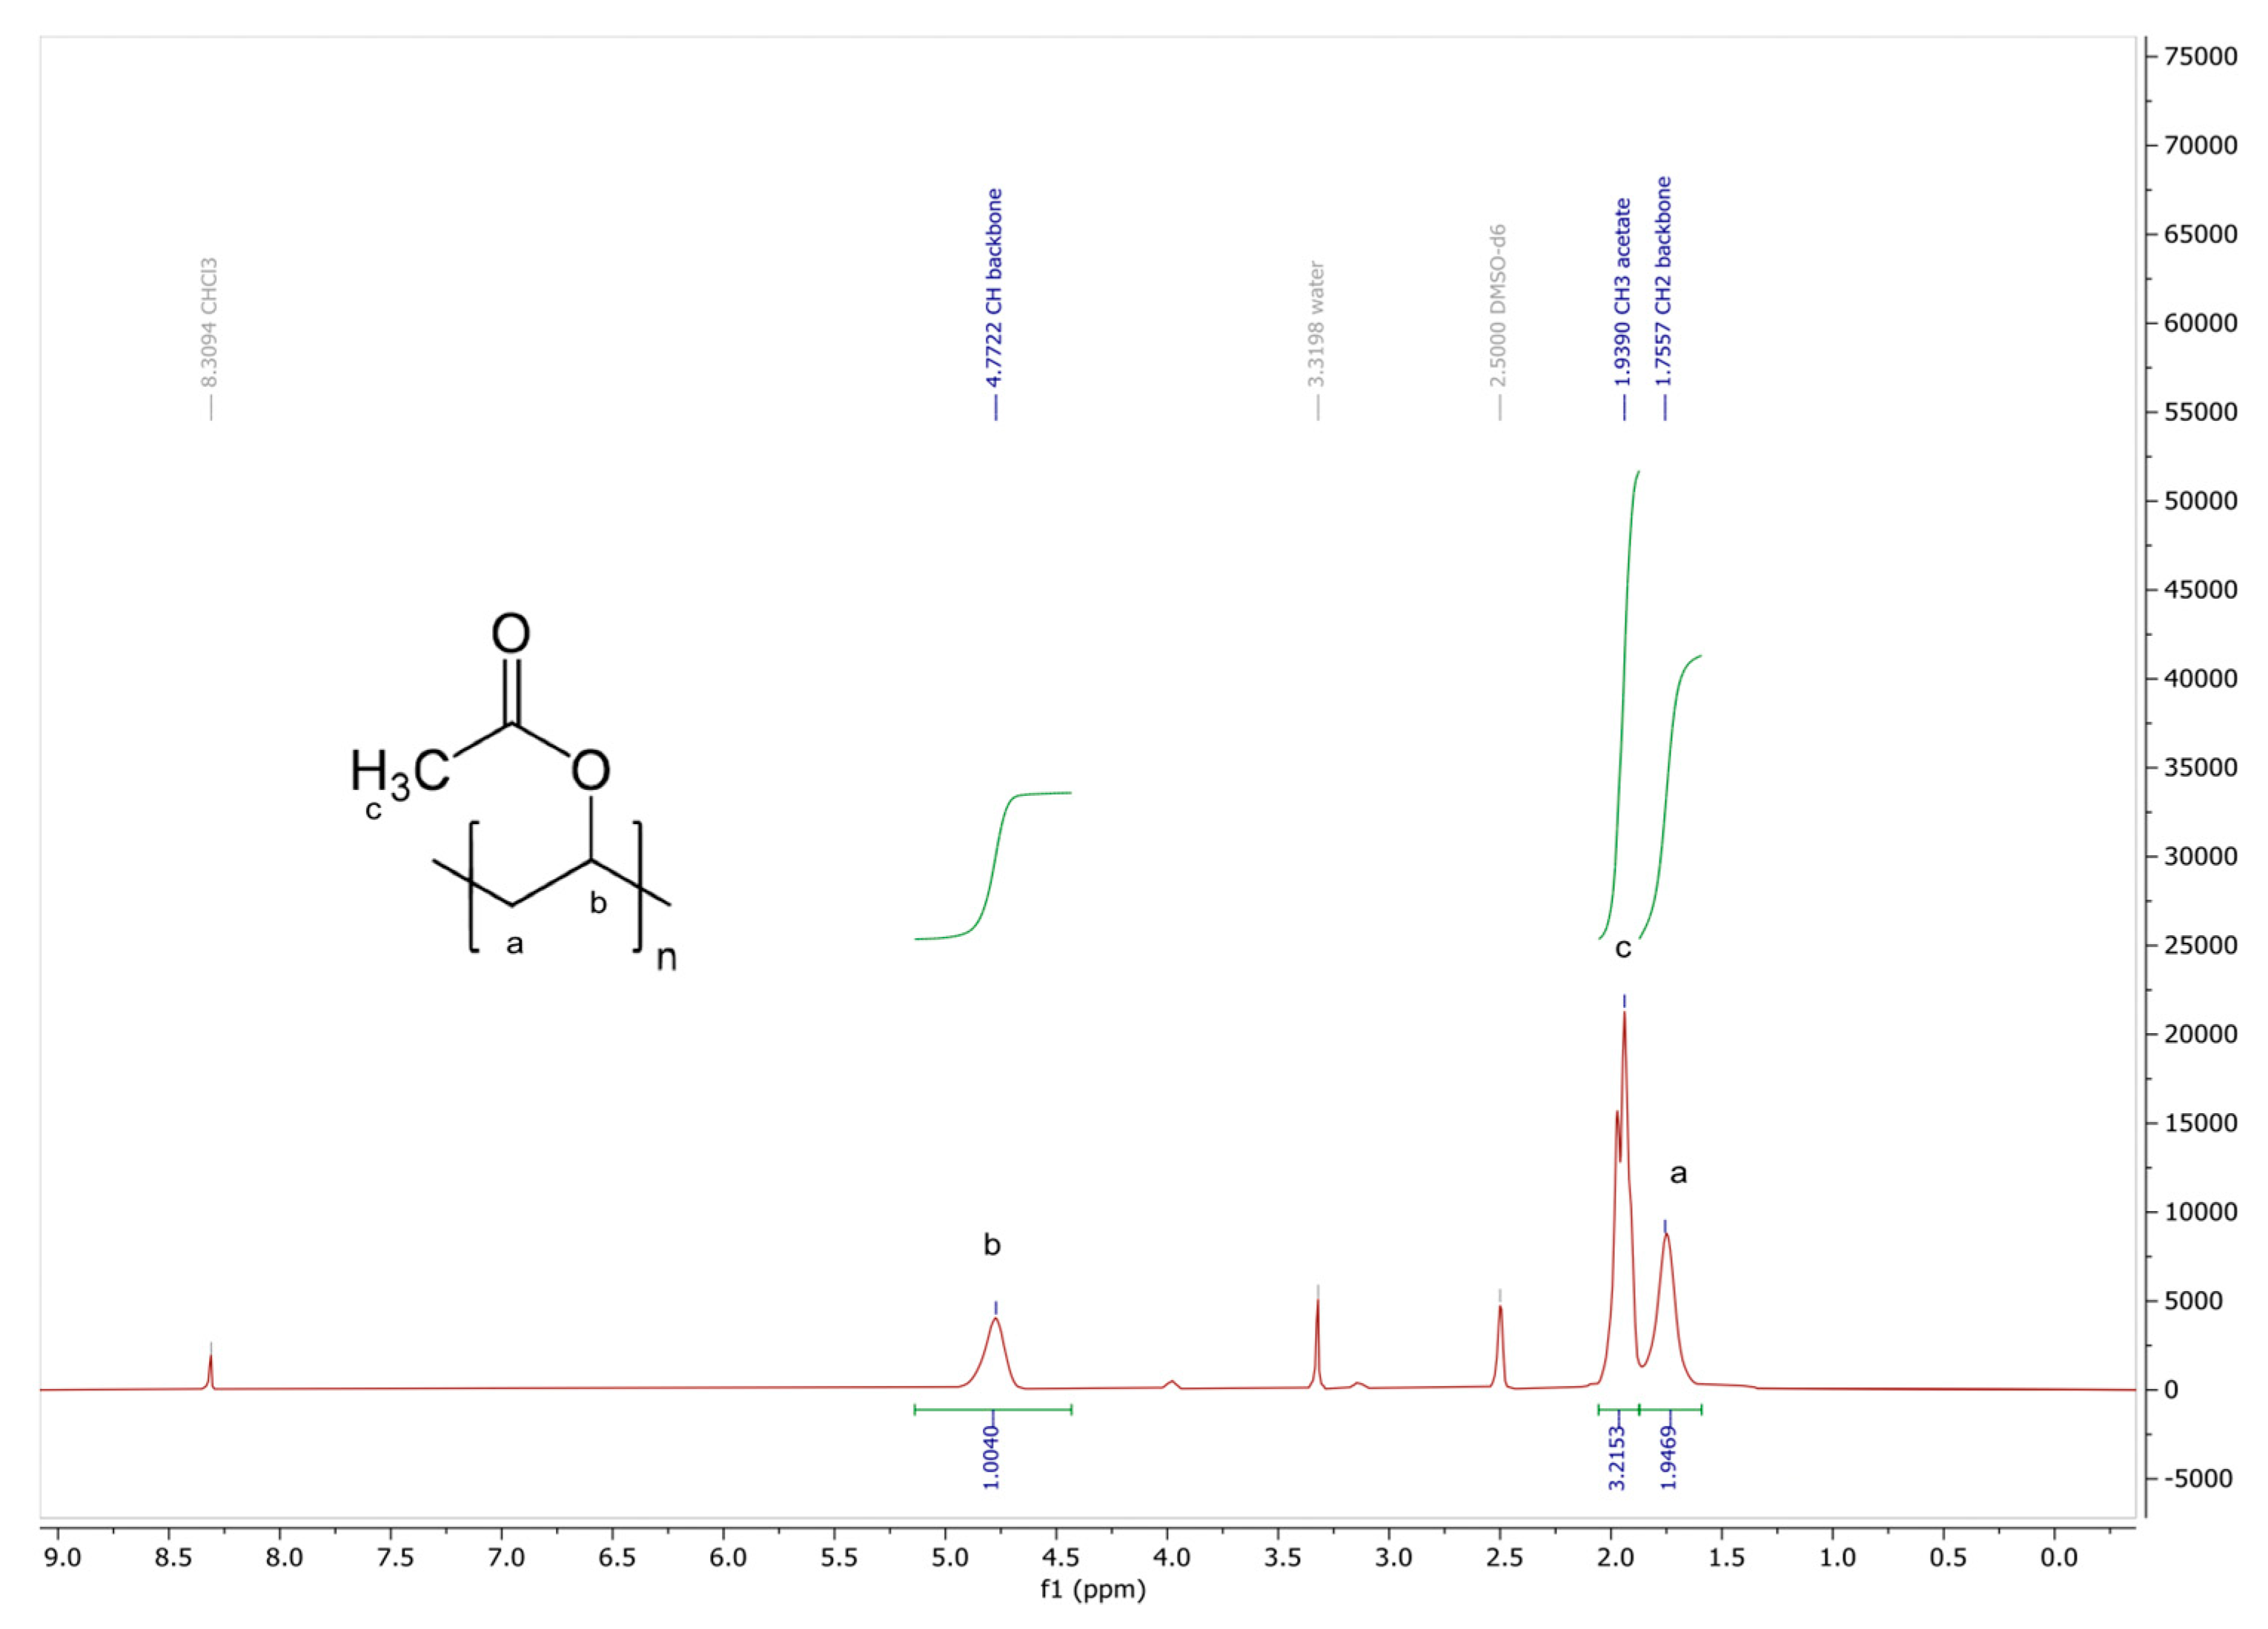
Figure 1. NMR spectrum of the synthesized PVAc.
Biophysica 02 00037 g001
Figure 2. Samples of PVA 1–4 showing the texture and consistency characteristics, as well as coloring.
Biophysica 02 00037 g002
Figure 3. (ad). PVA samples 1–4 after complete crystallization: (a) pure water and PVA 1 with 10%, 20%, and 50% PVA content by mass (left to right), (b) pure water and PVA 2 with 10%, 20%, and 50% PVA content by mass (left to right), (c) pure water and PVA 3 with 10%, 20%, and 50% PVA content by mass (left to right), (d) pure water and PVA 4 with 10%, 20%, and 50% PVA content by mass (left to right).
Biophysica 02 00037 g003
Figure 4. (a,b). Initial (a) and complete (b) crystallization times for pure water and PVA samples 1–4 with 10%, 20%, and 50% mass content. Note: * indicates that approximately 3 mm of the top portion of the samples in the test tube remained liquid even after the remainder of the sample was completely frozen.
Biophysica 02 00037 g004
Table 1. Molecular weight characteristics of PVAc, as analyzed by SEC.
Mw [kDa]Mp [kDa]Mn [kDa]ĐDP (Mw)DP (Mn)
PVAc77.22.82.58133
Table 2. Degree of hydrolysis of PVA for PVA samples 1–4.
PVA SampleDH [%]PVA [%]PVAc [%]Final Amount [g]
1100100067
2767624112
3666634152
4343466160
Publisher’s Note: MDPI stays neutral with regard to jurisdictional claims in published maps and institutional affiliations.