
Genotype-to-Protein Map and Collective Adaptation in a Viral Population
 , , , and
Abstract
1. Introduction
2. Materials and Methods
2.1. Experimental Adaptation of the Q Phage to High Temperatures
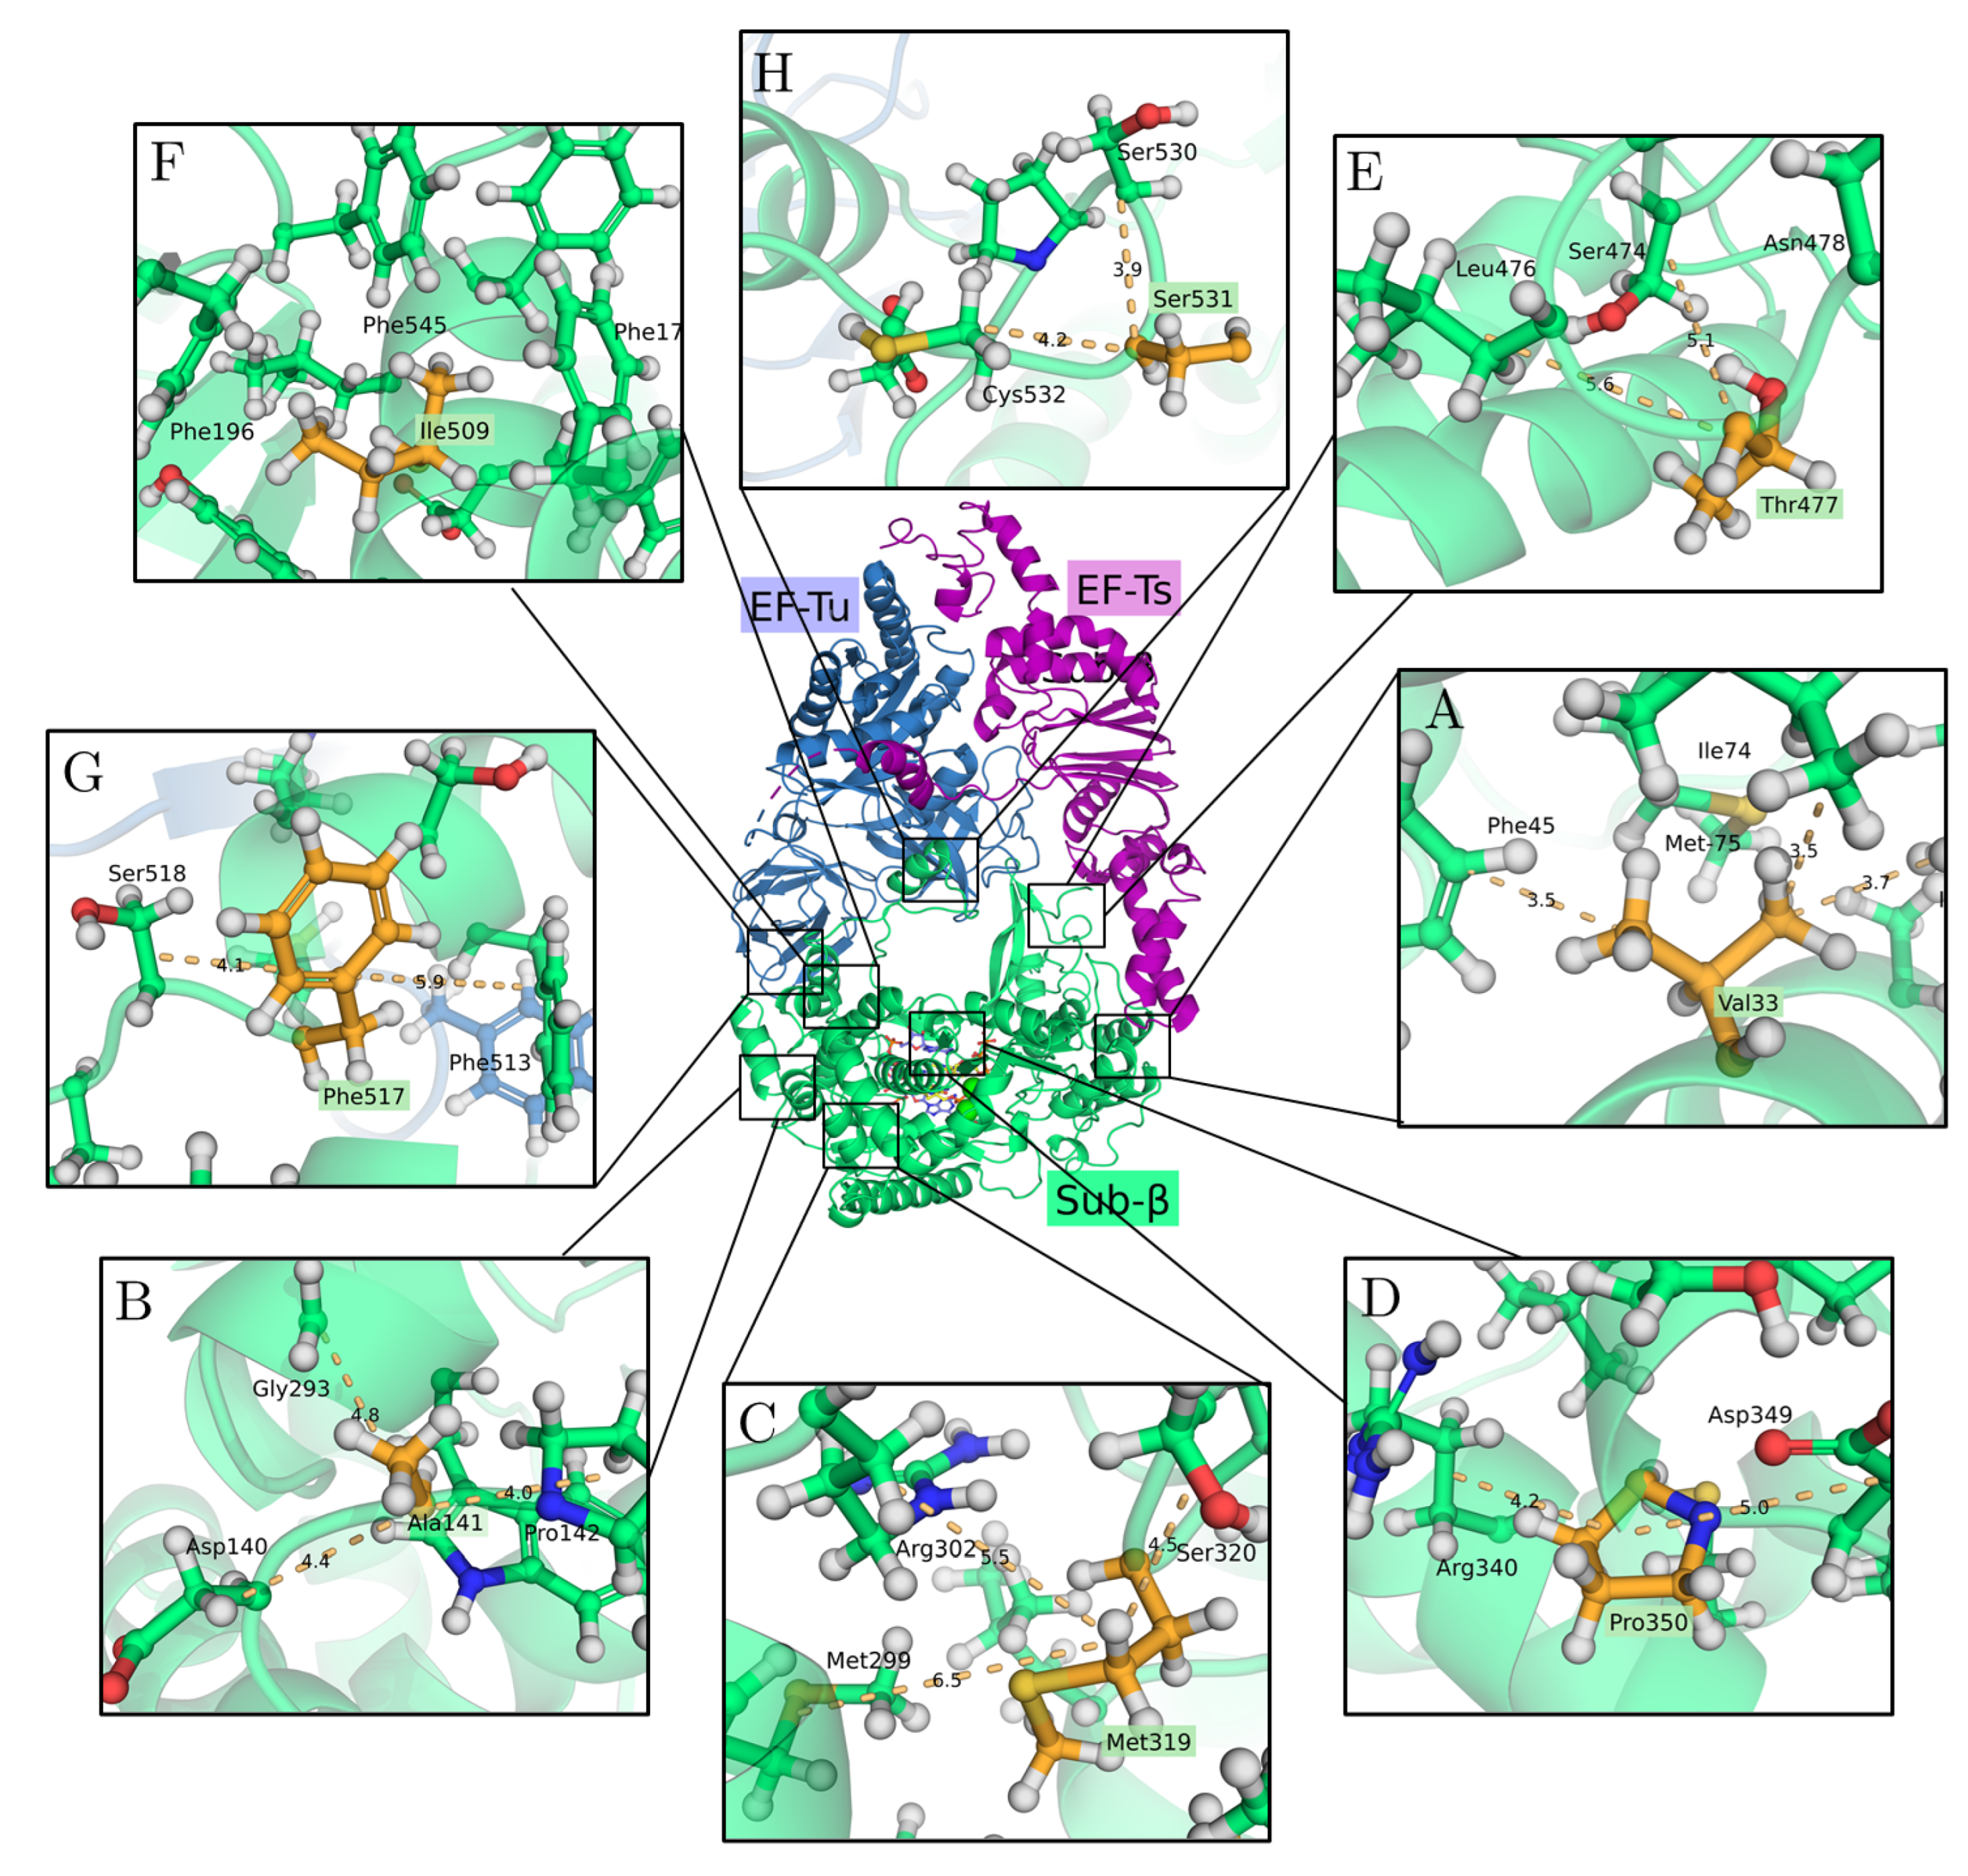
2.2. The 3D Structure of the Q Replicase
2.3. Protein Stability Prediction Methods
2.4. Deep Sequencing Analysis of the C43(P60) and C43(P60) Populations
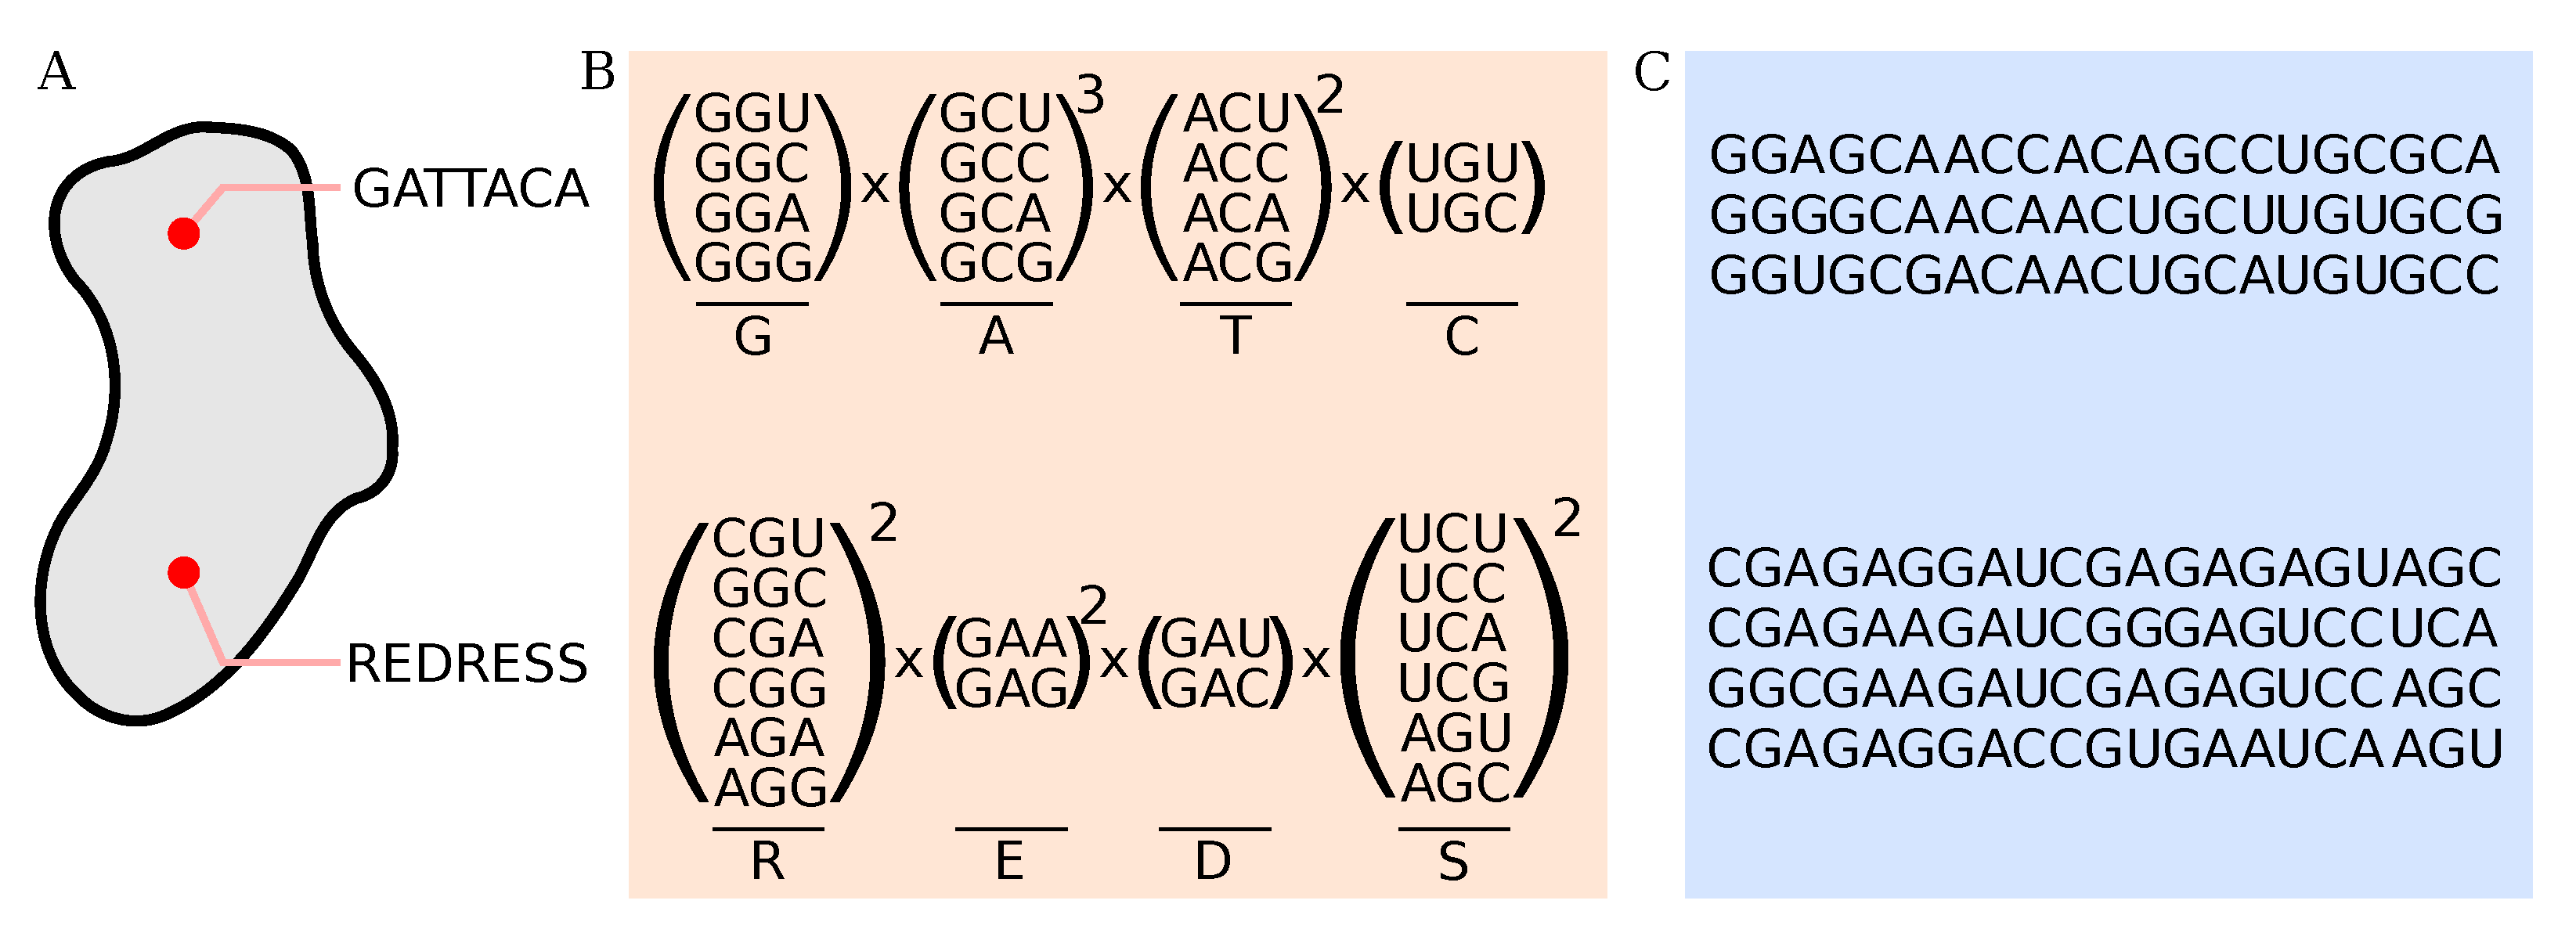
2.5. Processing of Deep-Sequencing Data
3. Results
3.1. Effects of Single Mutations on Protein Stability
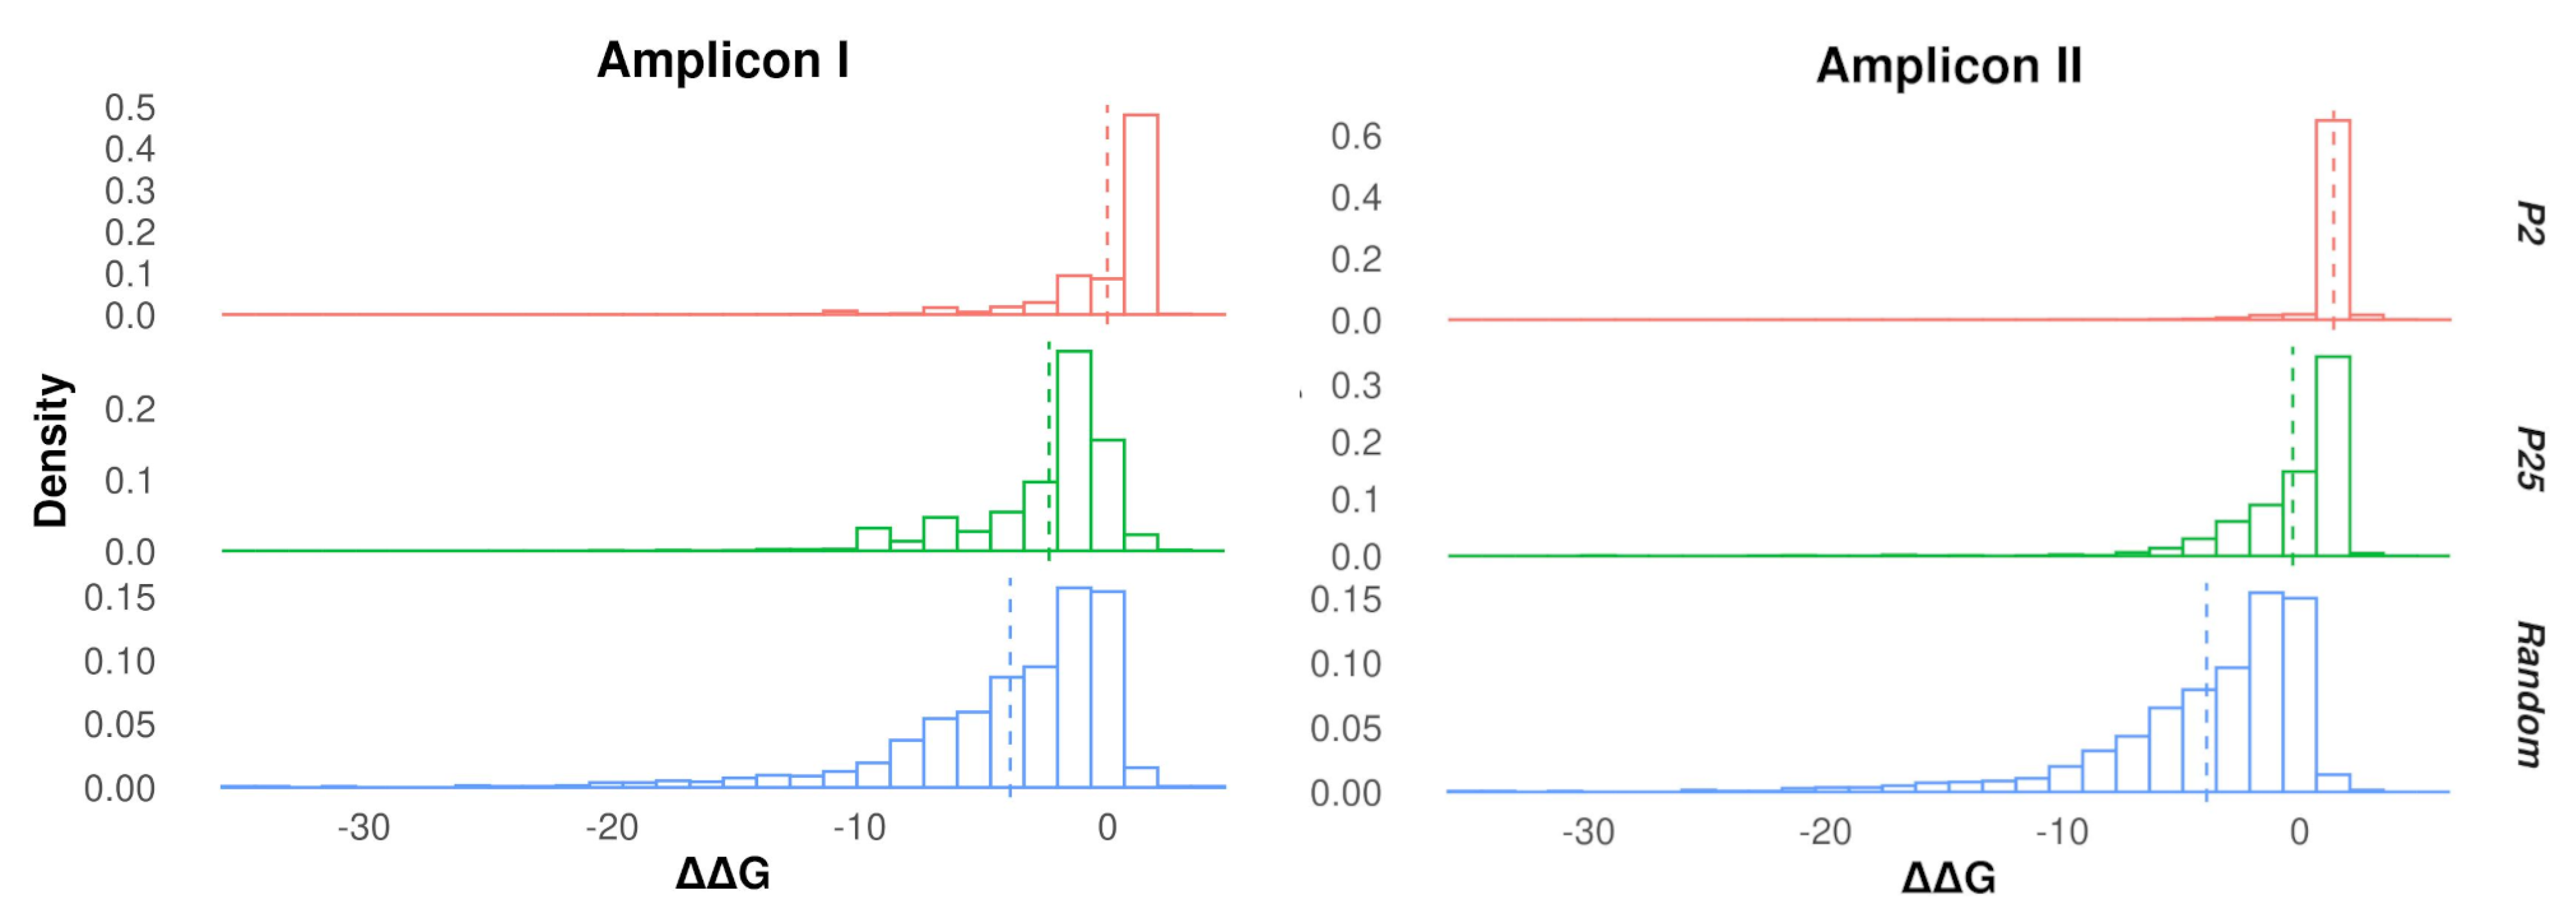
3.2. Protein Stability Changes in Ensembles of Mutants
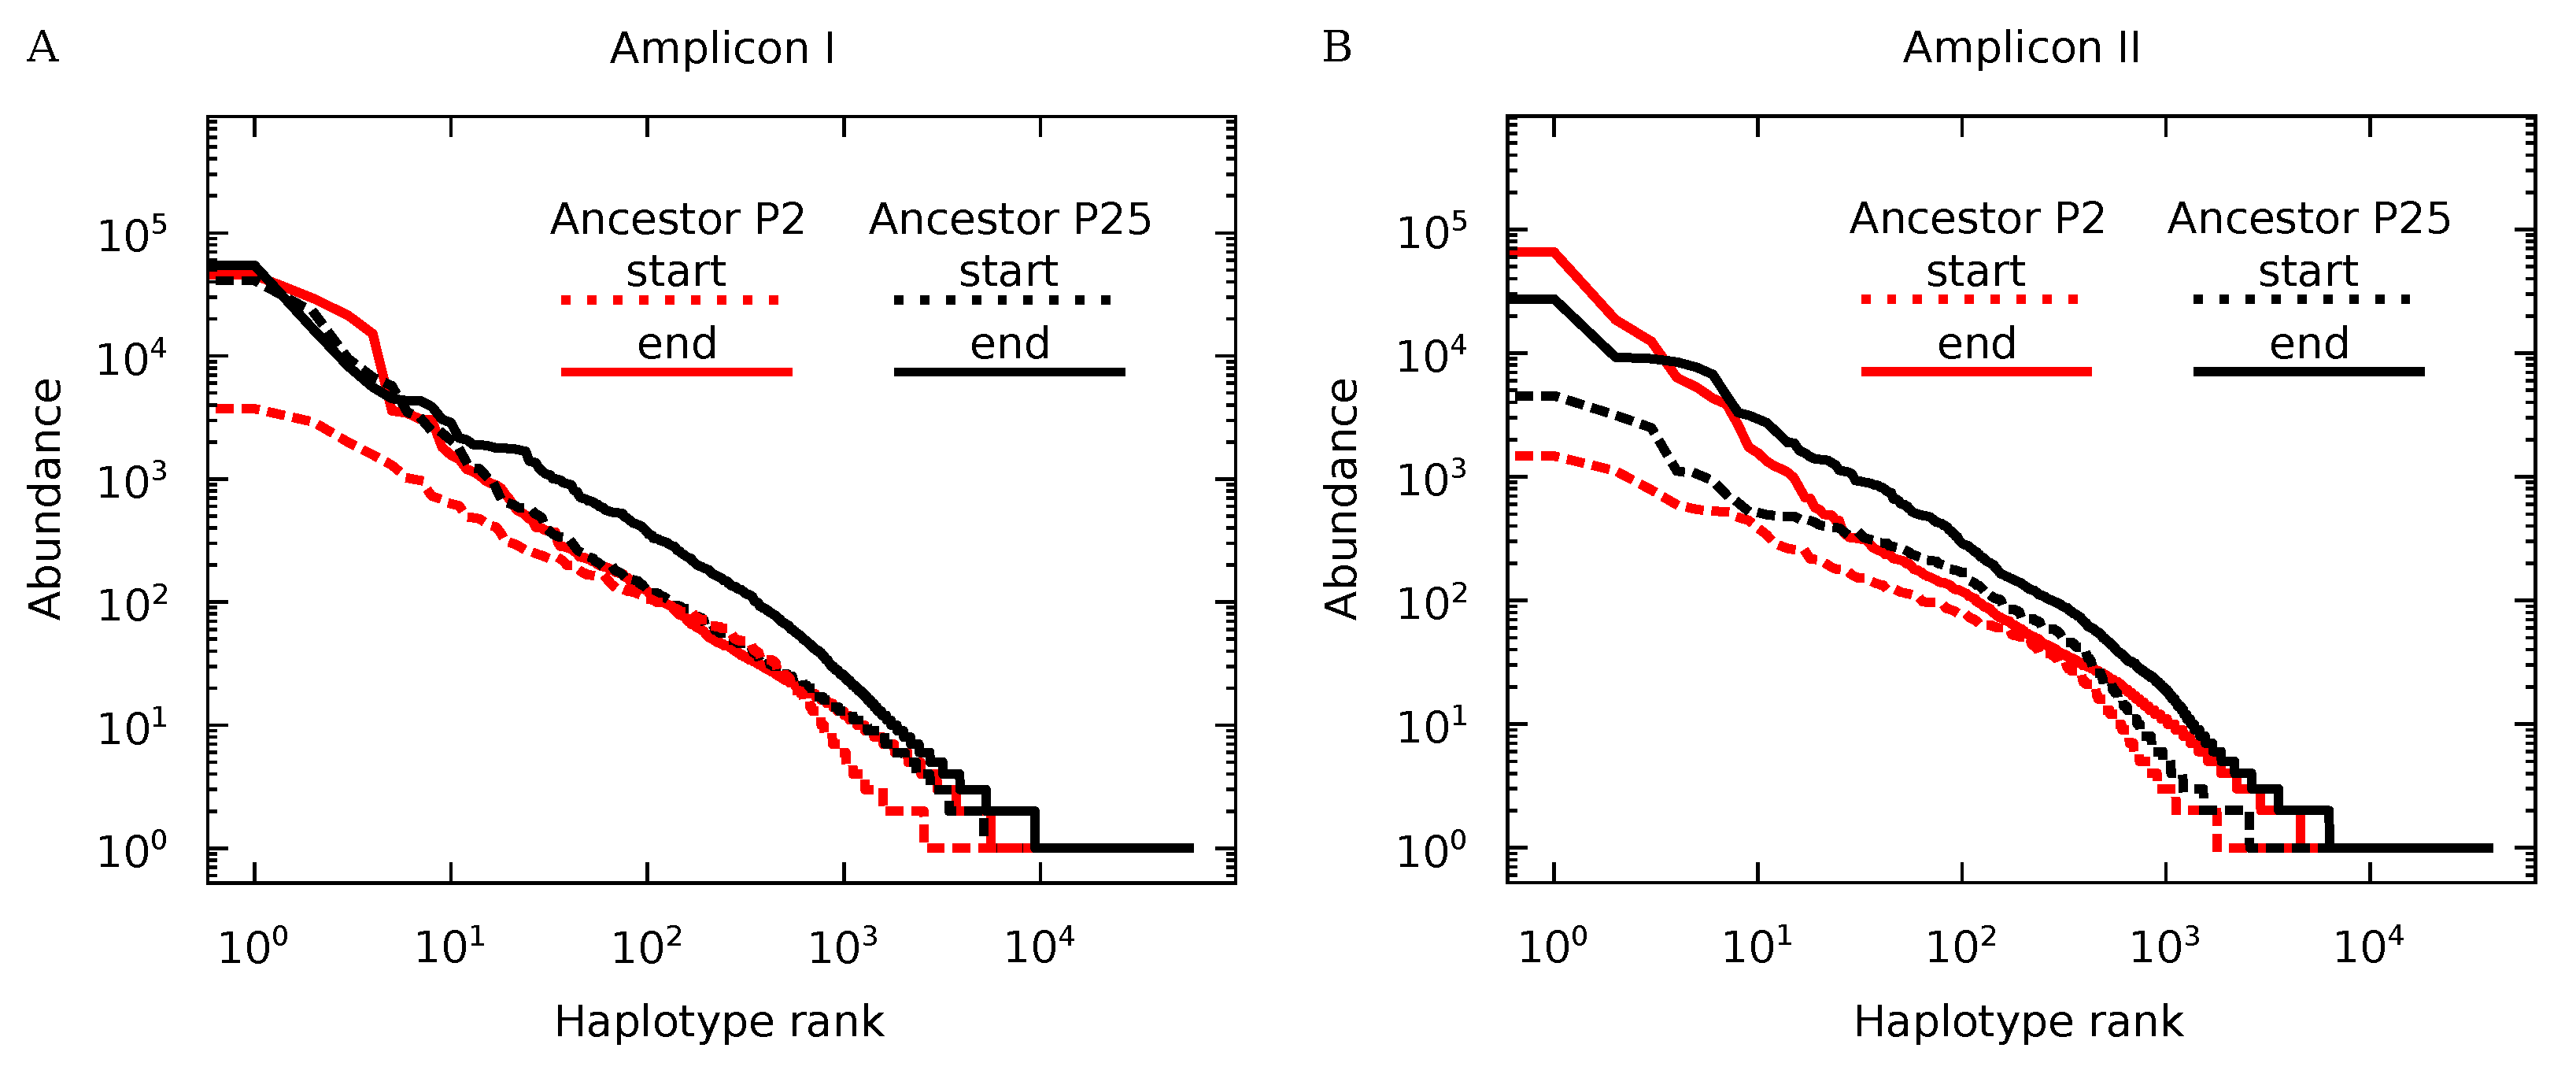
3.3. Genotypic Diversity of Q Populations
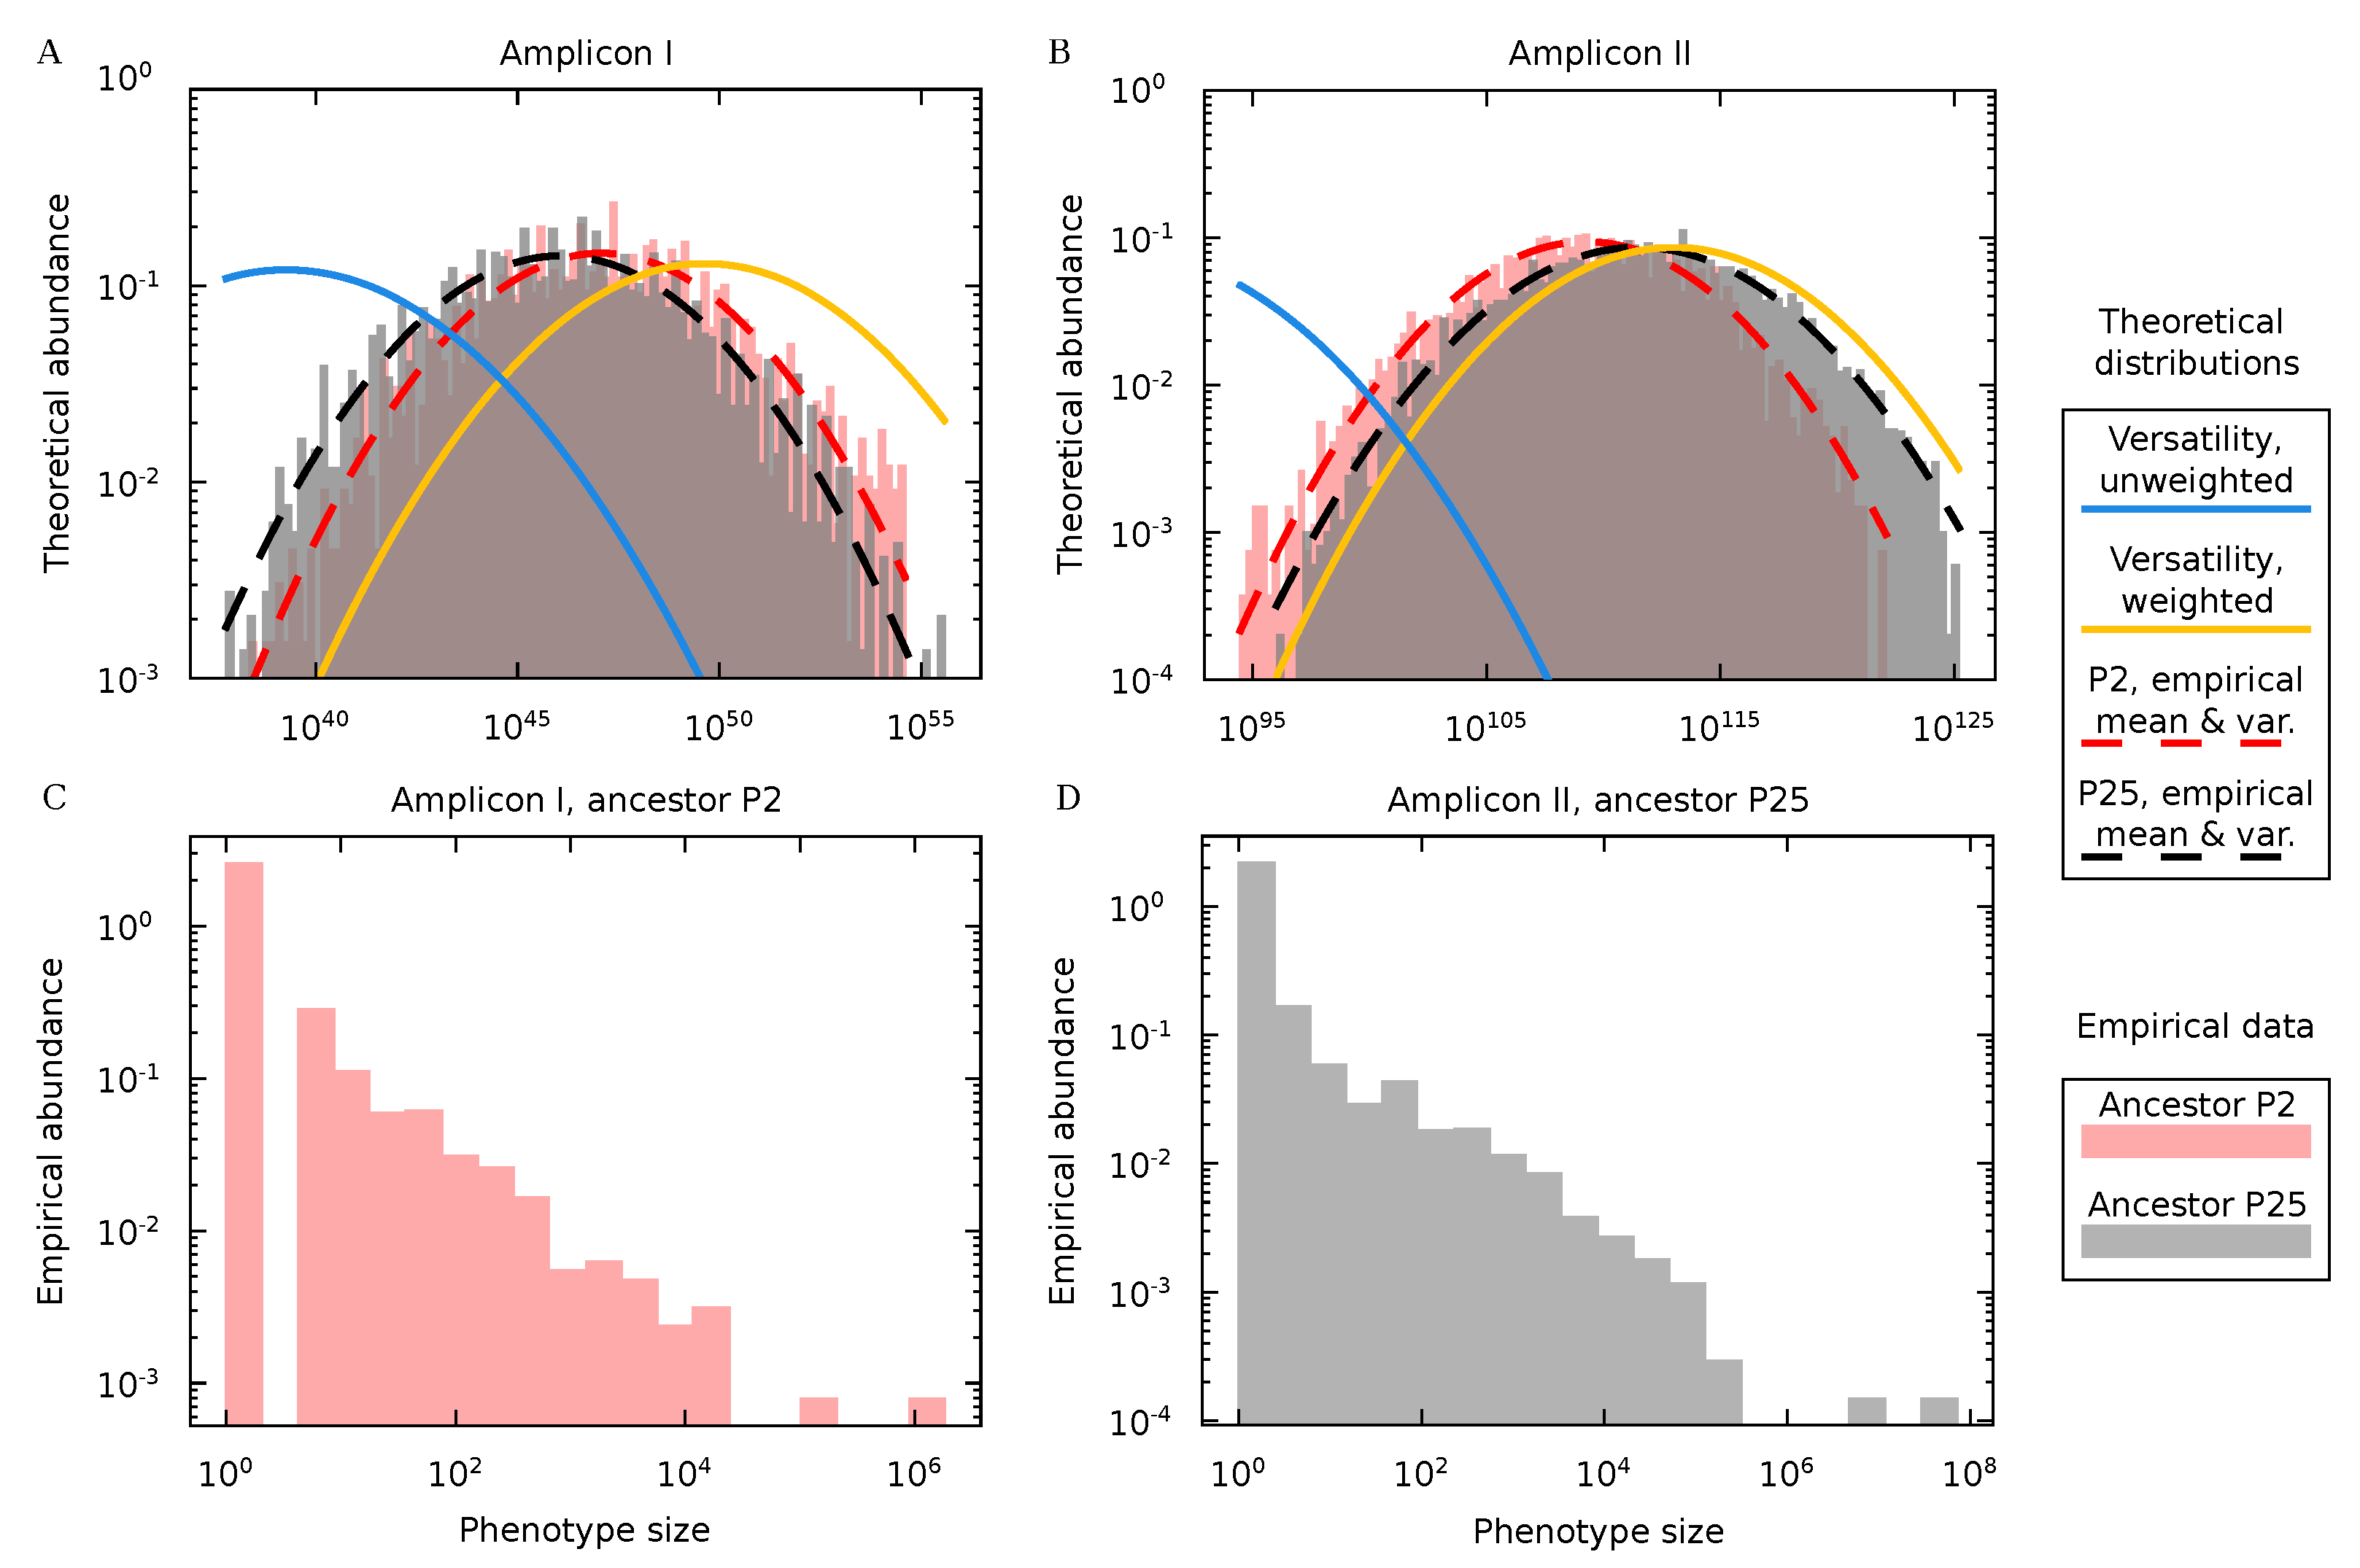
3.4. Protein Diversity in Q Populations
4. Discussion
Author Contributions
Funding
Institutional Review Board Statement
Informed Consent Statement
Data Availability Statement
Conflicts of Interest
Abbreviations
| GP | Genotype-to-phenotype map |
| PDB | Protein Data Bank |
| PSP | Protein structure prediction |
| RdRp | RNA-dependent RNA polymerase |
| RMSD | Root-mean-square deviation |
Appendix A. Mutations in the Qβ Replicase Detected in the Consensus Sequence

| Nucleotide Mutation | Amino Acid Mutation | Evolutionary Line | |
|---|---|---|---|
| C2452U | A33V | C43P2, L1 | |
| U2776C | V141A | C43P2, L1 and L3 | |
| U3311G | I319M | C43P2, L2; C43P25, L1, L2 and L3 | |
| U3402C | S350P | C43P2, L3 | |
| U3784C | I477T | Occasional on adaptation to 43 C | |
| C3879A | L509I | Frequent on adaptation to 43 C | |
| C3903U | L517F | C43P2, L2; C43P25, L2 and L3 | |
| G3945A | G531S | C43P2, L1 and L2; C43P25, L1, L2 and L3 |
References
- Karlin, S. Some Mathematical Models of Population Genetics. Am. Math. Mon. 1972, 79, 699–739. [Google Scholar] [CrossRef]
- Lanchier, N. Wright–Fisher and Moran models. In Stochastic Modeling; Springer International Publishing: Cham, Switzerland, 2017; pp. 203–218. [Google Scholar] [CrossRef]
- Kimura, M. Evolutionary rate at the molecular level. Nature 1968, 217, 624–626. [Google Scholar] [CrossRef] [PubMed]
- Kimura, M. The Neutral Theory of Molecular Evolution; Cambridge University Press: Cambridge, UK, 1984. [Google Scholar]
- Salisbury, F.B. Natural Selection and the Complexity of the Gene. Nature 1969, 224, 342–343. [Google Scholar] [CrossRef] [PubMed]
- Maynard Smith, J. Natural selection and the concept of a protein space. Nature 1970, 225, 563–564. [Google Scholar] [CrossRef]
- Stadler, P.F.; Stadler, B.M.R. Genotype-Phenotype Maps. Biol. Theor. 2006, 1, 268–279. [Google Scholar] [CrossRef]
- Manrubia, S.; Cuesta, J.A.; Aguirre, J.; Ahnert, S.E.; Altenberg, L.; Cano, A.V.; Catalán, P.; Diaz-Uriarte, R.; Elena, S.F.; García-Martín, J.A.; et al. From genotypes to organisms: State-of-the-art and perspectives of a cornerstone in evolutionary dynamics. Phys. Life Rev. 2021, 38, 55–106. [Google Scholar] [CrossRef]
- Wagner, A. The Origins of Evolutionary Innovations; Oxford University Press: Oxford, UK, 2011. [Google Scholar]
- Ahnert, S.E. Structural properties of genotype-phenotype maps. J. R. Soc. Interface 2017, 14, 20170275. [Google Scholar] [CrossRef]
- Garcia-Martin, J.A.; Catalán, P.; Cuesta, J.A.; Manrubia, S. Statistical theory of phenotype abundance distributions: A test through exact enumeration of genotype spaces. Europhys. Lett. 2018, 123, 28001. [Google Scholar]
- Schuster, P.; Fontana, W.; Stadler, P.F.; Hofacker, I.L. From sequences to shapes and back: A case study in RNA secondary structures. Proc. R. Soc. Lond. B 1994, 255, 279–284. [Google Scholar]
- Lipman, D.J.; Wilbur, W.J. Modelling neutral and selective evolution of protein folding. Proc. R. Soc. Lond. B 1991, 245, 7–11. [Google Scholar]
- Jörg, T.; Martin, O.C.; Wagner, A. Neutral network sizes of biological RNA molecules can be computed and are not atypically small. BMC Bioinform. 2008, 9, 464. [Google Scholar] [CrossRef] [PubMed]
- Schaper, S.; Louis, A.A. The arrival of the frequent: How bias in genotype-phenotype maps can steer populations to local optima. PLoS ONE 2014, 9, e86635. [Google Scholar]
- Manrubia, S.; Cuesta, J.A. Distribution of genotype network sizes in sequence-to-structure genotype-phenotype maps. J. R. Soc. Interface 2017, 14, 20160976. [Google Scholar] [CrossRef] [PubMed]
- Greenbury, S.F.; Schaper, S.; Ahnert, S.E.; Louis, A.A. Genetic correlations greatly increase mutational robustness and can both reduce and enhance evolvability. PLoS Comput. Biol. 2016, 12, e1004773. [Google Scholar] [CrossRef] [PubMed]
- Aguirre, J.; Buldú, J.M.; Stich, M.; Manrubia, S.C. Topological structure of the space of phenotypes: The case of RNA neutral networks. PLoS ONE 2011, 6, e26324. [Google Scholar] [CrossRef]
- Yubero, P.; Manrubia, S.; Aguirre, J. The space of genotypes is a network of networks: Implications for evolutionary and extinction dynamics. Sci. Rep. 2017, 7, 13813. [Google Scholar] [CrossRef]
- Grüner, W.; Giegerich, R.; Strothmann, D.; Reidys, C.; Weber, J.; Hofacker, I.L.; Stadler, P.F.; Schuster, P. Analysis of RNA sequence structure maps by exhaustive enumeration II. Structures of neutral networks and shape space covering. Monatsh. Chem. 1996, 127, 375–389. [Google Scholar] [CrossRef]
- Aguilar-Rodríguez, J.; Peel, L.; Stella, M.; Wagner, A.; Payne, J.L. The architecture of an empirical genotype-phenotype map. Evolution 2018, 72, 1242–1260. [Google Scholar] [CrossRef]
- Huynen, M.A.; Stadler, P.F.; Fontana, W. Smoothness within ruggedness: The role of neutrality in adaptation. Proc. Natl. Acad. Sci. USA 1996, 93, 397–401. [Google Scholar] [CrossRef]
- Aguirre, J.; Manrubia, S. Tipping points and early warning signals in the genomic composition of populations induced by environmental changes. Sci. Rep. 2015, 5, 9664. [Google Scholar] [CrossRef]
- Somovilla, P.; Rodríguez-Moreno, A.; Arribas, M.; Manrubia, S.; Lázaro, E. Standing Genetic Diversity and Transmission Bottleneck Size Drive Adaptation in Bacteriophage Qβ. Int. J. Mol. Sci. 2022, 23, 8876. [Google Scholar] [CrossRef] [PubMed]
- Sanjuán, R.; Nebot, M.R.; Chirico, N.; Mansky, L.M.; Belshaw, R. Viral Mutation Rates. J. Virol. 2010, 84, 9733–9748. [Google Scholar] [CrossRef]
- Harvey, W.; Carabelli, A.; Jackson, B.; Gupta, R.; Thomson, E.; Harrison, E.; Ludden, C.; Reeve, R.; Rambaut, A.; Peacock, S.; et al. SARS-CoV-2 variants, spike mutations and immune escape. Nat. Rev. Microbiol. 2021, 19, 409–424. [Google Scholar] [CrossRef]
- Domingo, E.; Sabo, D.; Taniguchi, T.; Weissmann, C. Nucleotide sequence heterogeneity of an RNA phage population. Cell 1978, 13, 735–744. [Google Scholar] [CrossRef]
- Domingo, E. (Ed.) Quasispecies: Concept and Implications for Virology; Springer: Berlin, Germany, 2006. [Google Scholar]
- Inomata, T.; Kimura, H.; Hayasaka, H.; Shiozaki, A.; Fujita, Y.; Kashiwagi, A. Quantitative comparison of the RNA bacteriophage Qβ infection cycle in rich and minimal media. Arch. Virol. 2012, 157, 2163–2169. [Google Scholar] [CrossRef] [PubMed]
- Kashiwagi, A.; Sugawara, R.; Tsushima, F.S.; Kumagai, T.; Yomo, T.; Simon, A. Contribution of Silent Mutations to Thermal Adaptation of RNA Bacteriophage Qβ. J. Virol. 2014, 88, 11459–11468. [Google Scholar] [CrossRef] [PubMed]
- Lázaro, E.; Arribas, M.; Cabanillas, L.; Román, I.; Acosta, E. Evolutionary adaptation of an RNA bacteriophage to the simultaneous increase in the within-host and extracellular temperatures. Sci. Rep. 2018, 8, 8080. [Google Scholar] [CrossRef]
- Somovilla, P.; Manrubia, S.; Lázaro, E. Evolutionary Dynamics in the RNA Bacteriophage Qβ Depends on the Pattern of Change in Selective Pressures. Pathogens 2019, 8, 80. [Google Scholar] [CrossRef]
- Arribas, M.; Aguirre, J.; Manrubia, S.; Lázaro, E. Differences in adaptive dynamics determine the success of virus variants that propagate together. Virus Evol. 2018, 4, vex043. [Google Scholar] [CrossRef]
- Taniguchi, T.; Palmieri, M.; Weissmann, C. QB DNA-containing hybrid plasmids giving rise to QB phage formation in the bacterial host. Nature 1978, 274, 223–228. [Google Scholar] [CrossRef]
- Kidmose, R.T.; Vasiliev, N.N.; Chetverin, A.B.; Andersen, G.R.; Knudsen, C.R. Structure of the Qβ replicase, an RNA-dependent RNA polymerase consisting of viral and host proteins. Proc. Natl. Acad. Sci. USA 2010, 107, 10884–10889. [Google Scholar] [CrossRef] [PubMed]
- Waterhouse, A.; Bertoni, M.; Bienert, S.; Studer, G.; Tauriello, G.; Gumienny, R.; Heer, F.T.; Beer, T.A.D.; Rempfer, C.; Bordoli, L.; et al. SWISS-MODEL: Homology modelling of protein structures and complexes. Nucleic Acids Res. 2018, 46, W296–W303. [Google Scholar] [CrossRef] [PubMed]
- Pettersen, E.F.; Goddard, T.D.; Huang, C.C.; Couch, G.S.; Greenblatt, D.M.; Meng, E.C.; Ferrin, T.E. UCSF Chimera - A visualization system for exploratory research and analysis. J. Comput. Chem. 2004, 25, 1605–1612. [Google Scholar] [CrossRef] [PubMed]
- Takeshita, D.; Tomita, K. Assembly of Qβ viral RNA polymerase with host translational elongation factors EF-Tu and -Ts. Proc. Natl. Acad. Sci. USA 2010, 107, 15733–15738. [Google Scholar] [CrossRef] [PubMed]
- Capriotti, E.; Fariselli, P.; Casadio, R. I-Mutant2.0: Predicting stability changes upon mutation from the protein sequence or structure. Nucleic Acids Res. 2005, 33, W306–W310. [Google Scholar] [CrossRef]
- Cheng, J.; Randall, A.; Baldi, P. Prediction of protein stability changes for single-site mutations using support vector machines. Proteins Struct. Funct. Genet. 2006, 62, 1125–1132. [Google Scholar] [CrossRef]
- Parthiban, V.; Gromiha, M.M.; Schomburg, D. CUPSAT: Prediction of protein stability upon point mutations. Nucleic Acids Res. 2006, 34, W239–W242. [Google Scholar] [CrossRef]
- Chen, C.W.; Lin, J.; Chu, Y.W. iStable: Off-the-shelf predictor integration for predicting protein stability changes. BMC Bioinform. 2013, 14, S5. [Google Scholar] [CrossRef]
- Schymkowitz, J.; Borg, J.; Stricher, F.; Nys, R.; Rousseau, F.; Serrano, L. The FoldX web server: An online force field. Nucleic Acids Res. 2005, 33, W382–W388. [Google Scholar] [CrossRef]
- Golmohammadi, R.; Fridborg, K.; Bundule, M.; Valegård, K.; Liljas, L. The crystal structure of bacteriophage Qβ at 3.5 Åresolution. Structure 1996, 4, 543–554. [Google Scholar] [CrossRef]
- Andrews, S.; Krueger, F.; Segonds-Pichon, A.; Biggins, L.; Krueger, C.; Wingett, S. FastQC; Babraham Institute: Cambridge, UK, 2012. [Google Scholar]
- Ewels, P.; Magnusson, M.; Lundin, S.; Käller, M. MultiQC: Summarize analysis results for multiple tools and samples in a single report. Bioinformatics 2016, 32, 3047–3048. [Google Scholar] [CrossRef]
- Martin, M. Cutadapt removes adapter sequences from high-throughput sequencing reads. EMBnet. J. 2011, 17, 10–12. [Google Scholar] [CrossRef]
- Magoč, T.; Salzberg, S.L. FLASH: Fast length adjustment of short reads to improve genome assemblies. Bioinformatics 2011, 27, 2957–2963. [Google Scholar] [CrossRef] [PubMed]
- Li, H. Aligning sequence reads, clone sequences and assembly contigs with BWA-MEM. arXiv 2013, arXiv:1303.3997. [Google Scholar]
- Li, H.; Handsaker, B.; Wysoker, A.; Fennell, T.; Ruan, J.; Homer, N.; Marth, G.; Abecasis, G.; Durbin, R. The sequence alignment/map format and SAMtools. Bioinformatics 2009, 25, 2078–2079. [Google Scholar] [CrossRef] [PubMed]
- Tange, O. Gnu parallel-the command-line power tool. USENIX Mag. 2011, 36, 42–47. [Google Scholar]
- Arribas, M.; Cabanillas, L.; Kubota, K.; Lázaro, E. Impact of increased mutagenesis on adaptation to high temperature in bacteriophage Qβ. Virology 2016, 497, 163–170. [Google Scholar] [CrossRef]
- Arribas, M.; Lázaro, E. Intra-Population Competition during Adaptation to Increased Temperature in an RNA Bacteriophage. Int. J. Mol. Sci. 2021, 22, 6815. [Google Scholar] [CrossRef]
- Villanueva Marijuán, A. Análisis de las Mutaciones en la Replicasa del Virus Qβ, 2021. TFG Thesis. Available online: https://oa.upm.es/69689/ (accessed on 26 October 2022).
- Potapov, V.; Cohen, M.; Schreiber, G. Assessing computational methods for predicting protein stability upon mutation: Good on average but not in the details. Protein Eng. Des. Sel. 2009, 22, 553–560. [Google Scholar] [CrossRef]
- Louis, A.A. Contingency, convergence and hyper-astronomical numbers in biological evolution. Stud. Hist. Philos. Sci. C 2016, 58, 107–116. [Google Scholar] [CrossRef]
- Arribas, M.; Kubota, K.; Cabanillas, L.; Lázaro, E. Adaptation to Fluctuating Temperatures in an RNA Virus Is Driven by the Most Stringent Selective Pressure. PLoS ONE 2014, 9, e100940. [Google Scholar] [CrossRef] [PubMed]
- Cuesta, J.A.; Manrubia, S. Enumerating secondary structures and structural moieties for circular RNAs. J. Theor. Biol. 2017, 419, 375–382. [Google Scholar] [CrossRef] [PubMed][Green Version]
- Domingo, E.; Soria, M.E.; Gallego, I.; de Ávila, A.I.; García-Crespo, C.; Martínez-González, B.; Gómez, J.; Briones, C.; Gregori, J.; Quer, J.; et al. A new implication of quasispecies dynamics: Broad virus diversification in absence of external perturbations. Infect. Genet. Evol. 2020, 82, 104278. [Google Scholar] [CrossRef]
- Perales, C.; Henry, M.; Domingo, E.; Wain-Hobson, S.; Vartanian, J.P. Lethal Mutagenesis of Foot-and-Mouth Disease Virus Involves Shifts in Sequence Space. J. Virol. 2011, 85, 12227–12240. [Google Scholar] [CrossRef] [PubMed]
- Agudo, R.; Ferrer-Orta, C.; Arias, A.; de la Higuera, I.; Perales, C.; Pérez-Luque, R.; Verdaguer, N.; Domingo, E. A Multi-Step Process of Viral Adaptation to a Mutagenic Nucleoside Analogue by Modulation of Transition Types Leads to Extinction-Escape. PLoS Pathog. 2010, 6, e1001072. [Google Scholar] [CrossRef] [PubMed]
- Cowperthwaite, M.C.; Economo, E.P.; Harcombe, W.R.; Miller, E.L.; Meyers, L.A. The Ascent of the Abundant: How Mutational Networks Constrain Evolution. PLoS Comput. Biol. 2008, 4, e1000110. [Google Scholar] [CrossRef] [PubMed]
- Dingle, K.; Schaper, S.; Louis, A.A. The structure of the genotype-phenotype map strongly constrains the evolution of non-coding RNA. Interface Focus 2015, 5, 20150053. [Google Scholar] [CrossRef]
- Catalán, P.; Manrubia, S.; Cuesta, J.A. Populations of genetic circuits are unable to find the fittest solution in a multilevel genotype-phenotype map. J. R. Soc. Interface 2020, 17, 20190843. [Google Scholar] [CrossRef]
- Dingle, K.; Ghaddar, F.; Šulc, P.; Louis, A.A. Phenotype bias determines how natural RNA structures occupy the morphospace of all possible shapes. Mol. Biol. Evol. 2022, 39, msab280. [Google Scholar] [CrossRef]


| Population | Amplicon | Number of Sequences | Truncated Proteins (in %) | Number of Haplotypes | Proteins |
|---|---|---|---|---|---|
| C43P2(P60) | I | 319,825 | 0.15 | 7721 | 4043 |
| II | 364,907 | 0.5516 | 20,942 | 9743 | |
| C43P25(P60) | I | 806,701 | 0.1631 | 15,851 | 8101 |
| II | 692,048 | 0.4911 | 34,292 | 17,094 |
| Amplicon | Populations | A-Value |
|---|---|---|
| I | C43(P60) vs. random | 0.87 |
| I | C43(P60) vs. random | 0.61 |
| I | C43(P60) vs. C43(P60) | 0.82 |
| II | C43(P60) vs. random | 0.98 |
| II | C43(P60) vs. random | 0.83 |
| II | C43(P60) vs. C43(P60) | 0.93 |
| Nucleotides | Amino Acids | ||||
|---|---|---|---|---|---|
| Population | Amplicon | Frequency | Average | Frequency | Average |
| C43P2(P60) | I | 0.0041 | 6.916 | 0.0062 | 3.68 |
| II | 0.0031 | 5.235 | 0.0032 | 1.89 | |
| C43P25(P60) | I | 0.0022 | 3.701 | 0.0038 | 2.25 |
| II | 0.0022 | 3.769 | 0.0033 | 1.91 | |
| Amino Acid | Abbreviation | One-Letter Abbreviation | i | Versatility, |
|---|---|---|---|---|
| Methionine | Met | M | 1 | 1 |
| Tryptophan | Trp | W | 2 | 1 |
| Asparagine | Asn | N | 3 | 2 |
| Aspartic acid | Asp | D | 4 | 2 |
| Cysteine | Cys | C | 5 | 2 |
| Glutamine | Gln | Q | 6 | 2 |
| Glutamic acid | Glu | E | 7 | 2 |
| Histidine | His | H | 8 | 2 |
| Lysine | Lys | K | 9 | 2 |
| Phenylanlanine | Phe | F | 10 | 2 |
| Tyrosine | Tyr | Y | 11 | 2 |
| Isoleucine | Ile | I | 12 | 3 |
| Alanine | Ala | A | 13 | 4 |
| Glycine | Gly | G | 14 | 4 |
| Proline | Pro | P | 15 | 4 |
| Threonine | Thr | T | 16 | 4 |
| Valine | Val | V | 17 | 4 |
| Arginige | Arg | R | 18 | 6 |
| Leucine | Leu | L | 19 | 6 |
| Serine | Ser | S | 20 | 6 |
Publisher’s Note: MDPI stays neutral with regard to jurisdictional claims in published maps and institutional affiliations. |
© 2022 by the authors. Licensee MDPI, Basel, Switzerland. This article is an open access article distributed under the terms and conditions of the Creative Commons Attribution (CC BY) license (https://creativecommons.org/licenses/by/4.0/).
Share and Cite
Villanueva, A.; Secaira-Morocho, H.; Seoane, L.F.; Lázaro, E.; Manrubia, S. Genotype-to-Protein Map and Collective Adaptation in a Viral Population. Biophysica 2022, 2, 381-399. https://doi.org/10.3390/biophysica2040034
Villanueva A, Secaira-Morocho H, Seoane LF, Lázaro E, Manrubia S. Genotype-to-Protein Map and Collective Adaptation in a Viral Population. Biophysica. 2022; 2(4):381-399. https://doi.org/10.3390/biophysica2040034
Chicago/Turabian StyleVillanueva, Ariadna, Henry Secaira-Morocho, Luis F. Seoane, Ester Lázaro, and Susanna Manrubia. 2022. "Genotype-to-Protein Map and Collective Adaptation in a Viral Population" Biophysica 2, no. 4: 381-399. https://doi.org/10.3390/biophysica2040034
APA StyleVillanueva, A., Secaira-Morocho, H., Seoane, L. F., Lázaro, E., & Manrubia, S. (2022). Genotype-to-Protein Map and Collective Adaptation in a Viral Population. Biophysica, 2(4), 381-399. https://doi.org/10.3390/biophysica2040034