Article

Blast Wave Simulator for Laminated Glass Panels Experimental Evaluation

1
Engineering Management Department, College of Engineering, Prince Sultan University, Riyadh 11586, Saudi Arabia
2
Department of Engineering and Technology, Texas A&M University-Commerce, Commerce, TX 75429, USA
3
Civil Engineering, Southern Illinois University, Edwardsville, IL 62026, USA
4
Civil and Environmental Engineering, University of Missouri, Columbia, MO 65211, USA
5
Advanced Manufacturing Technologies Institute, Energy and Industry Sector, King Abdulaziz City for Science and Technology, Riyadh 11442, Saudi Arabia
*
Author to whom correspondence should be addressed.
CivilEng 2024, 5(3), 576-590; https://doi.org/10.3390/civileng5030031
Submission received: 5 June 2024 / Revised: 3 July 2024 / Accepted: 9 July 2024 / Published: 15 July 2024
(This article belongs to the Collection Recent Advances and Development in Civil Engineering)

Abstract

:
The study of blast loads on structures is important due to the potential of significant consequences in various scenarios. From terrorist attacks to industrial accidents, comprehending how structures respond to blast waves is critical for ensuring public safety and designing resilient structures. Studying these effects typically involves two main methods: free-field tests with live explosives and shock tube tests. Although shock tube testing offers certain advantages, both approaches are costly and demand significant space. This research aims to develop a cost-effective and straightforward technique for generating stress waves that closely replicate the progressive and spatial characteristics of free-field or shock tube blast waves. This method was designed to evaluate the dynamic response of laminated glass panels. The stress wave was generated by impacting a piston on the fluid inside a tube, which was connected to a fluid chamber. This setup produced impulsive loads that were distributed across a laminated glass test panel. Moreover, it was used to simulate the shock near filed explosions for a certain part of a structure. High-speed cameras were utilized to analyze the initial velocity of flying glass fragments. The apparatus successfully produced various blast waves and impulsive profiles for different drop weight heights. The initial velocities of randomly selected flying shards ranged from 3 m/s to 4 m/s.

1. Introduction

Blast loads refer to the sudden release of energy and the resulting shock wave that emanates from explosive events or high-energy sources, such as detonations, industrial accidents, or natural disasters like volcanic eruptions. Understanding blast loads is of paramount importance, as they can have devastating effects on structures, infrastructure, and, most importantly, human lives [1,2]. By comprehensively studying blast loads, engineers and researchers can develop safer building designs, improve protective measures, and enhance our ability to mitigate the destructive consequences of such events. This knowledge not only aids in safeguarding communities and critical assets but also contributes to the development of more resilient and secure environments in an increasingly unpredictable world.
Laminated glass (LG) is a specialized type of safety glass composed of two or more layers of glass bonded together by a layer of polyvinyl butyral (PVB) or other interlayer materials [2,3,4,5,6]. This interlayer holds the glass layers together upon impact, preventing the glass from shattering into dangerous shards [7,8]. LG is crucial for blast resistance in various applications, particularly in structures and vehicles, as it provides a critical layer of protection against the devastating effects of explosive blasts. LG stays intact and absorbs blast energy, greatly reducing the chances of injuries and building damage. Its significance lies in protecting people and property during explosions, making it a crucial factor in improving safety and strength in places that may face such dangers.
There are two main ways to study the effect of a blast on structures: free-field live explosives tests and shock tube tests. The free-field shock wave expands in three-dimensional space; however, it can be approximated as a planar wave for far-field conditions only [7,9]. The shock tube is regularly used to generate shock waves to simulate the blast loading effect of an explosive and to create a planar one-dimensional wave [4]. Thus, shock tubes can only create far-field blast waves, where the shock front can be considered planar. For near-field conditions, there is no way to simulate them without using a real near-field explosion.
A few researchers have investigated stress wave generation by piston impact on the fluid inside a tube. Inaba and Shepherd created a strong pressure wave (shock wave) within steel tubes filled with water [10]. The shock wave and pressure waves were provoked by a steel projectile that impacts a polycarbonate cylinder inside the top of the vertical tube filled with water [11,12,13]. The shock wave propagation through a bubbly liquid filled in a deformable cylindrical tube was studied using the same experimental setup [14]. It was also stated that fluid compressibility was a significant factor in determining the pressure history through the tests [15]. The response of rigid plates to a blast in deep water was investigated [16]. An apparatus was used to generate one-dimensional exponentially decaying blast waves in initially pressurized water, and it was used to measure the response and imparted impulse of both air-backed and water-backed unsupported rigid plates. The response of fluid-filled composite tubes subjected to axial shock wave loading in water was studied experimentally and numerically [17]. Existing experimental techniques can reproduce the dynamic response of structural components at a small laboratory scale; however, none of them allow measuring the dynamic response for scaled structural elements or full-scale specimens, which is fundamental to designing structural components loaded by blast waves. Most of the apparatuses used had liquid-filled tubes with limited inner diameters. Therefore, it was difficult to extend the usage of those apparatuses in testing scaled structural elements or full-scale components. For example, Schiffer and Tagarielli used a transparent shock tube with an inside diameter of d = 27 mm [16].
The overall objective of this research is to develop a technique for generating stress waves that mimic the progressive and spatial characteristics of free-field, especially near-field, blast waves, and to explore the blast wave-test sample interactions in a simulated blast experiment. This includes the development of a device with a steel chamber attached to a steel piston. The volume of the steel chamber could be extended and increased to increase the loading area. This device is neither expensive nor complicated, allowing experimental tests on small-scale LG and aluminum samples at the University of Missouri labs. Moreover, using this apparatus will help to investigate the acceleration of the glass fragments and their sizes using a high-speed camera in the case of LG roofs or inclined faces subjected to blast loads. This experimental study is the first milestone for further avenues of research, including the application of stronger shock wave loading, investigation of various loading conditions (speed and mass), and testing of a wide range of sample sizes and properties.

2. Experimental Apparatus and Test Setup

In this section, the wave generator device and the testing setup will be discussed. The new apparatus consists of a steel piston inside a steel tube with a diameter of 35.8 mm, attached to a steel chamber measuring 152.5 × 152.5 × 76.2 mm, as shown in Figure 1a,b. The dimensions of the steel chamber were chosen to fit the space in the lab beside the drop weight apparatus. The piston and the tube were parts of a hydraulic jack. The piston tube includes a bleed valve to evacuate air bubbles from the water column before each test. At the bottom of the chamber, there is a welded frame and another free frame to support the specimens. The volume of the steel chamber can be extended and increased to enlarge the loading area.
The drop weight machine, shown in Figure 1a,b, was used to apply the dynamic load on the movable piston. This machine was designed to accommodate a wide range of weights and a drop height of up to 2 m. High-accuracy data acquisition and analysis systems for the water hammer experiments were developed using LabVIEW-based software (v.2024). Two high-frequency ICP (Integrated Circuit Piezoelectric) pressure sensors were used to record the pressure-time history, investigating pressures and impulse values based on the drop weight height and weight. A high-speed video camera (Edgertronic high-speed video camera, up to 18,000 fps, and resolutions up to 1280 × 1024) was used to observe the deflection-time measurements for the various tested specimens. It was also used to determine the speeds of the drop weight immediately before impact and the speeds of flying glass splinters and their sizes just after the failure of LG specimens.
Two preliminary tests were performed to understand the pressure development through the device. The first test included only the tube and the piston, while the second test included the tube, the piston, and the fluid chamber.

2.1. Preliminary Tests Using Only Tube and Piston

The objective of the preliminary testing was to understand the pressure development through the device. Two tests were performed: the first included only the tube and the piston, while the second included the tube, the piston, and the fluid chamber. Based on the literature review, a stress wave can be generated using a piston impact on the fluid inside a tube. The main factors controlling the peak pressure developed within the tube are the mass of the steel striker and its velocity inside the piston [16]. This concept was applied in this study using a steel water-filled pipe with a diameter of 36.6 mm and a steel piston (Figure 1c) to generate a stress wave within the pipe. A negative phase pressure cannot be obtained in the water-filled pipe unless cavities or bubbles are generated due to wave interactions in a liquid-filled tube [18]. To study the value of the generated pressure and its impulse, four different heights (H) (152.4, 304.8, 609.6, and 914.4 mm) for the striker and two different weights (W) (2.54 and 7.94 kg) were investigated. The results of this test will be analyzed in detail in the discussion section.

2.2. Tests Using Steel Fluid Chamber and Rigid Plate Sample

To improve upon the tubes previously used in the literature review, a device with a steel chamber attached to a steel piston was designed to simulate stress waves that mimic the progressive and spatial characteristics of blast waves and to explore the interactions between blast waves and test samples. The volume of the steel chamber can be extended and increased to enlarge the loading area. The improved apparatus consists of a steel piston inside a steel tube attached to a steel chamber with dimensions of 152.5 × 152.5 × 76.2 mm. A drop weight machine was used to apply the dynamic load to the movable piston.
A thick steel plate (6.35 mm thick) was attached to the base of the fluid chamber. A pressure sensor was fixed in the middle of the thick steel plate to record the generated pressure-time history inside the steel chamber (Figure 1d). To study the generated pressure inside the steel chamber and its impulse, three different heights (304.8, 609.6, and 914.4 mm) for the striker and two different masses (2.54 and 4.35 kg) were investigated. Each trial was repeated three times. The results of these tests will be analyzed in detail in the discussion section to study the effect of using an attached steel chamber on the generated pressure on the attached samples. It was evident that using the steel chamber would reduce the generated pressure.

3. Tests of Laminated Glass Samples Using the Fluid Chamber

Four samples of laminated glass (LG) with identical dimensions—4.68 mm glass panels (1.58 mm annealed glass, 1.52 mm PVB, and 1.58 mm annealed glass) measuring 178 mm × 178 mm—were tested (Figure 2a). Figure 2 shows the testing process of the LG panels. All panel edges were clamped to a welded rigid frame using 12 mm-wide rubber strips (Figure 2b). The loaded area of the panel was 152.4 mm × 152.4 mm. The deflection of the LG panel was monitored using a high-speed camera. To facilitate monitoring, a 30 mm marked bolt was attached to the LG panel (Figure 2a,b).
A high-frequency pressure sensor was fixed near the bottom of the fluid chamber’s steel wall to record the pressure-time history. A striker with a mass of 7.94 kg was dropped from a height of 1524 mm to investigate the response of the LG panels. Figure 2c–e show the failed LG specimens #1, #2, and #3, respectively. The flying shards can be observed in the witness research in Figure 2f. A photo tracking program was used to follow the marked points to determine the final displacement of the LG panel during the test. The results of these tests will be analyzed in detail in the discussion section to demonstrate the effect of using real LG samples and their breakage on the generated pressure inside the steel chamber.

4. Tests of Flexible Aluminum Plate Using the Fluid Chamber

An aluminum (5052-H32) plate with dimensions of 178 mm × 178 mm was tested. This aluminum sample had the same thickness of 3.17 mm as the LG panes and was tested to study the effect of material properties on the shock wave properties and the response of tested samples, including maximum pressure, time at maximum pressure, maximum impulse, and positive phase duration. All panel edges were clamped to a welded rigid frame. The loaded area of the panel was 152.4 mm × 152.4 mm. The deflection of the aluminum plate was monitored using a high-speed camera. To facilitate this, a 30 mm marked bolt was attached to the aluminum plate (Figure 1e).
A high-frequency ICP pressure sensor was fixed near the bottom of the fluid chamber’s steel wall to record the pressure-time history. A striker with a mass of 7.94 kg was dropped three times from a height of 1524 mm to investigate the response of the aluminum plate compared to the LG panes. The results of this test will be analyzed in detail in the discussion section.

5. Results and Discussion

In this section, the results of tube pressure, chamber pressure, and LG window failure will be discussed in detail. Specific outcomes, such as the pressure, impulse, and displacement histories, will be examined.

5.1. Piston Tube and Fluid Chamber with 6.35 mm Steel Base Plate

Figure 3a shows the pressure-time history and impulse inside the piston for a 6.35 mm steel base plate at the end of the piston with W = 2.54 kg and H = 152.4 mm, while Figure 3b shows the same results with W = 2.54 kg and H = 152.4 mm. The results for the five tests are listed in Table 1.
Figure 3c clearly illustrates the effect of the mass of the striker, showing that the pressure generated by a 7.94 kg mass was 2.7 times the pressure generated by a 2.54 kg mass. The results indicated that the pressure increases when the height, and consequently the striker speed, increases for the same weight. For the case of fluid chamber testing with the 6.35 mm steel plates, the results for the six different sets are summarized in Table 2.
Figure 4a shows the pressure-time history and impulse inside the fluid chamber using a 2.54 kg drop weight at a height of 914 mm. The rise time for the pressure was approximately 10.6 ms, which was higher than the rise time for the pressure in the piston itself, around 0.23 ms (Figure 4a). On the other hand, as depicted in Figure 4b, the impulse inside the fluid chamber was 1.3 times the impulse inside the piston for the same height and mass of the striker. This indicates that although the final pressure decreased and the rise time increased when using a fluid chamber, the impulse transmitted through the fluid remained the same or even higher. Figure 4c illustrates the pressure-time history inside the small water chamber using striker masses of W = 4.35 kg and 2.54 kg at three different heights of H = 304.8 mm, 609.6 mm, and 914.4 mm. The results show that the pressure increases when the height, and consequently the striker speed, increases at the same weight. Additionally, the pressure increases when the mass of the striker increases at the same height.
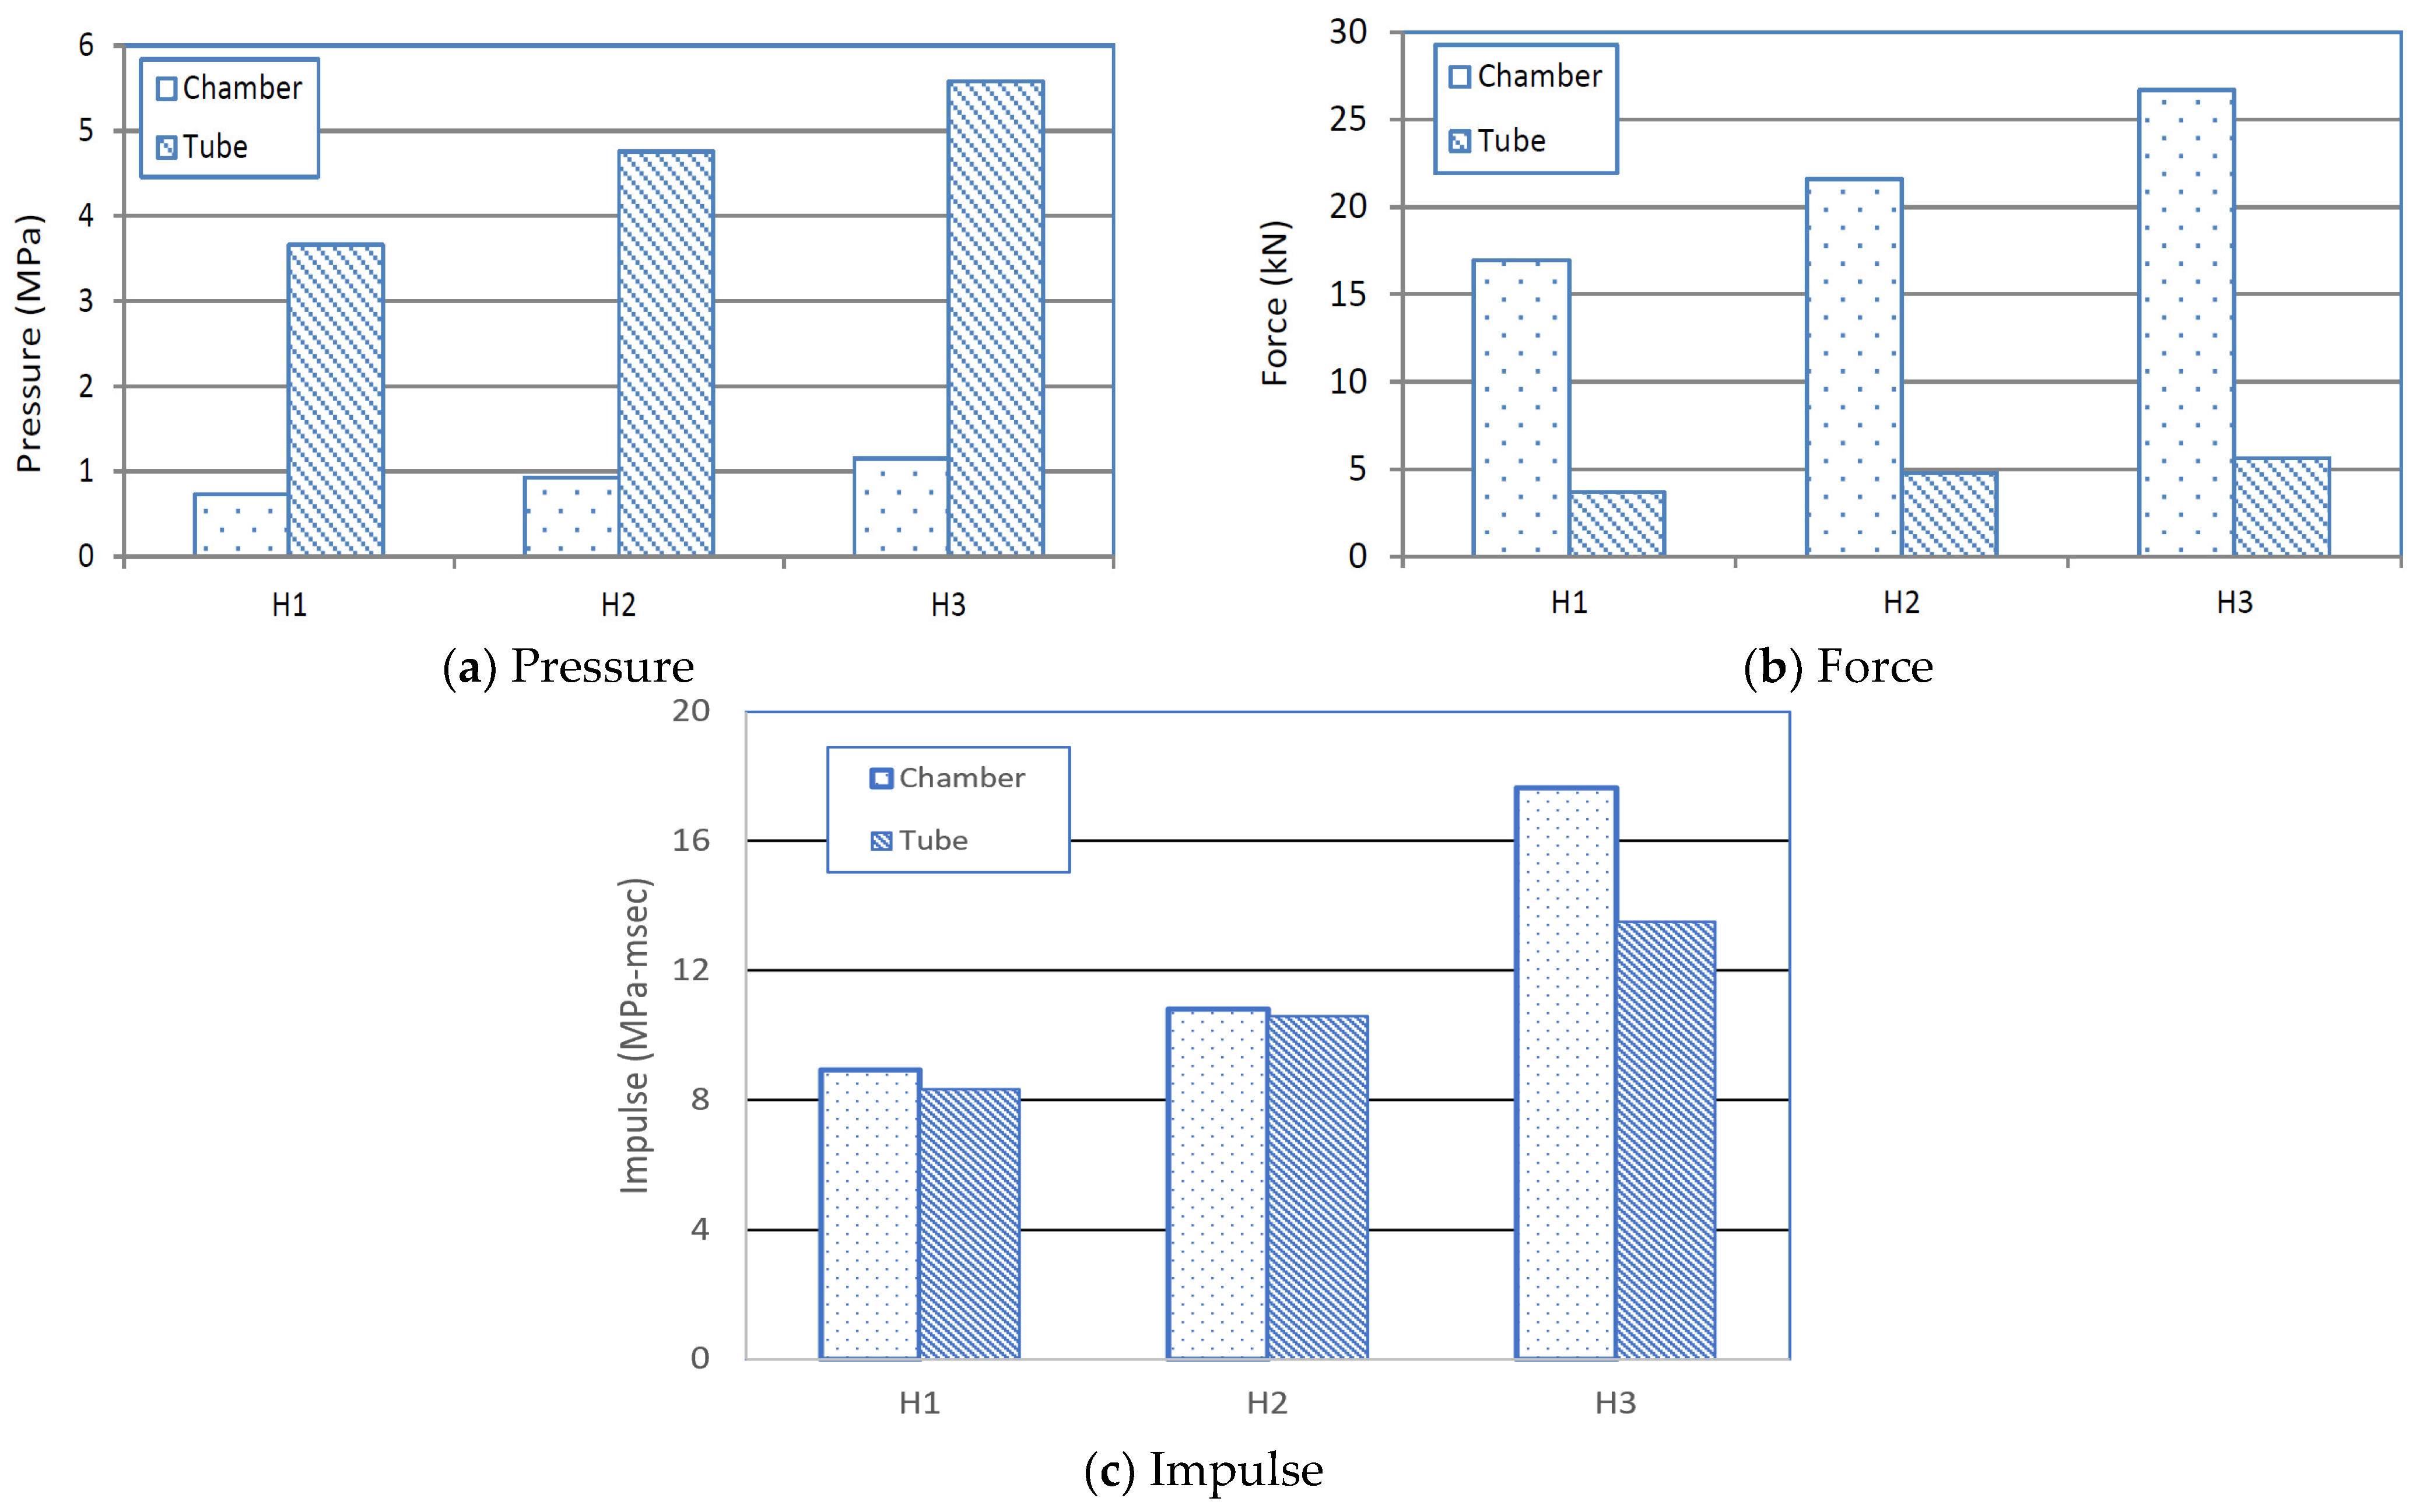
Figure 5a illustrates that the pressure inside the tube was nearly 5 times higher than the pressure inside the fluid chamber at the same height, despite the base plate area of the chamber being 23 times larger than the cross-sectional area of the tube. The total forces computed at the base plate of the chamber were approximately 4.6 times higher than those computed at the bottom of the piston tube at the same height using a 2.54 kg mass for the striker (Figure 5b). There was a discrepancy between the measured pressure and the total computed force in both the fluid chamber and the piston tube, but the recorded impulse in both locations was nearly identical. The difference in recorded impulse between the chamber and the piston tube was only 25%. This indicates that at this limited striker speed, using the fluid chamber can achieve a similar impulse to a real explosion, but it cannot replicate the same pressure-time history as shown in Figure 5c. Furthermore, while it can increase the total force obtained by almost 5 times, it cannot reach the static loading ratio that could be achieved, which is 23 times in this design. Additionally, utilizing this mechanism in static loading can apply highly uniformly distributed loads on the tested samples, based on the piston volume and the final deformation of the tested samples.

5.2. Aluminum Plate Sample

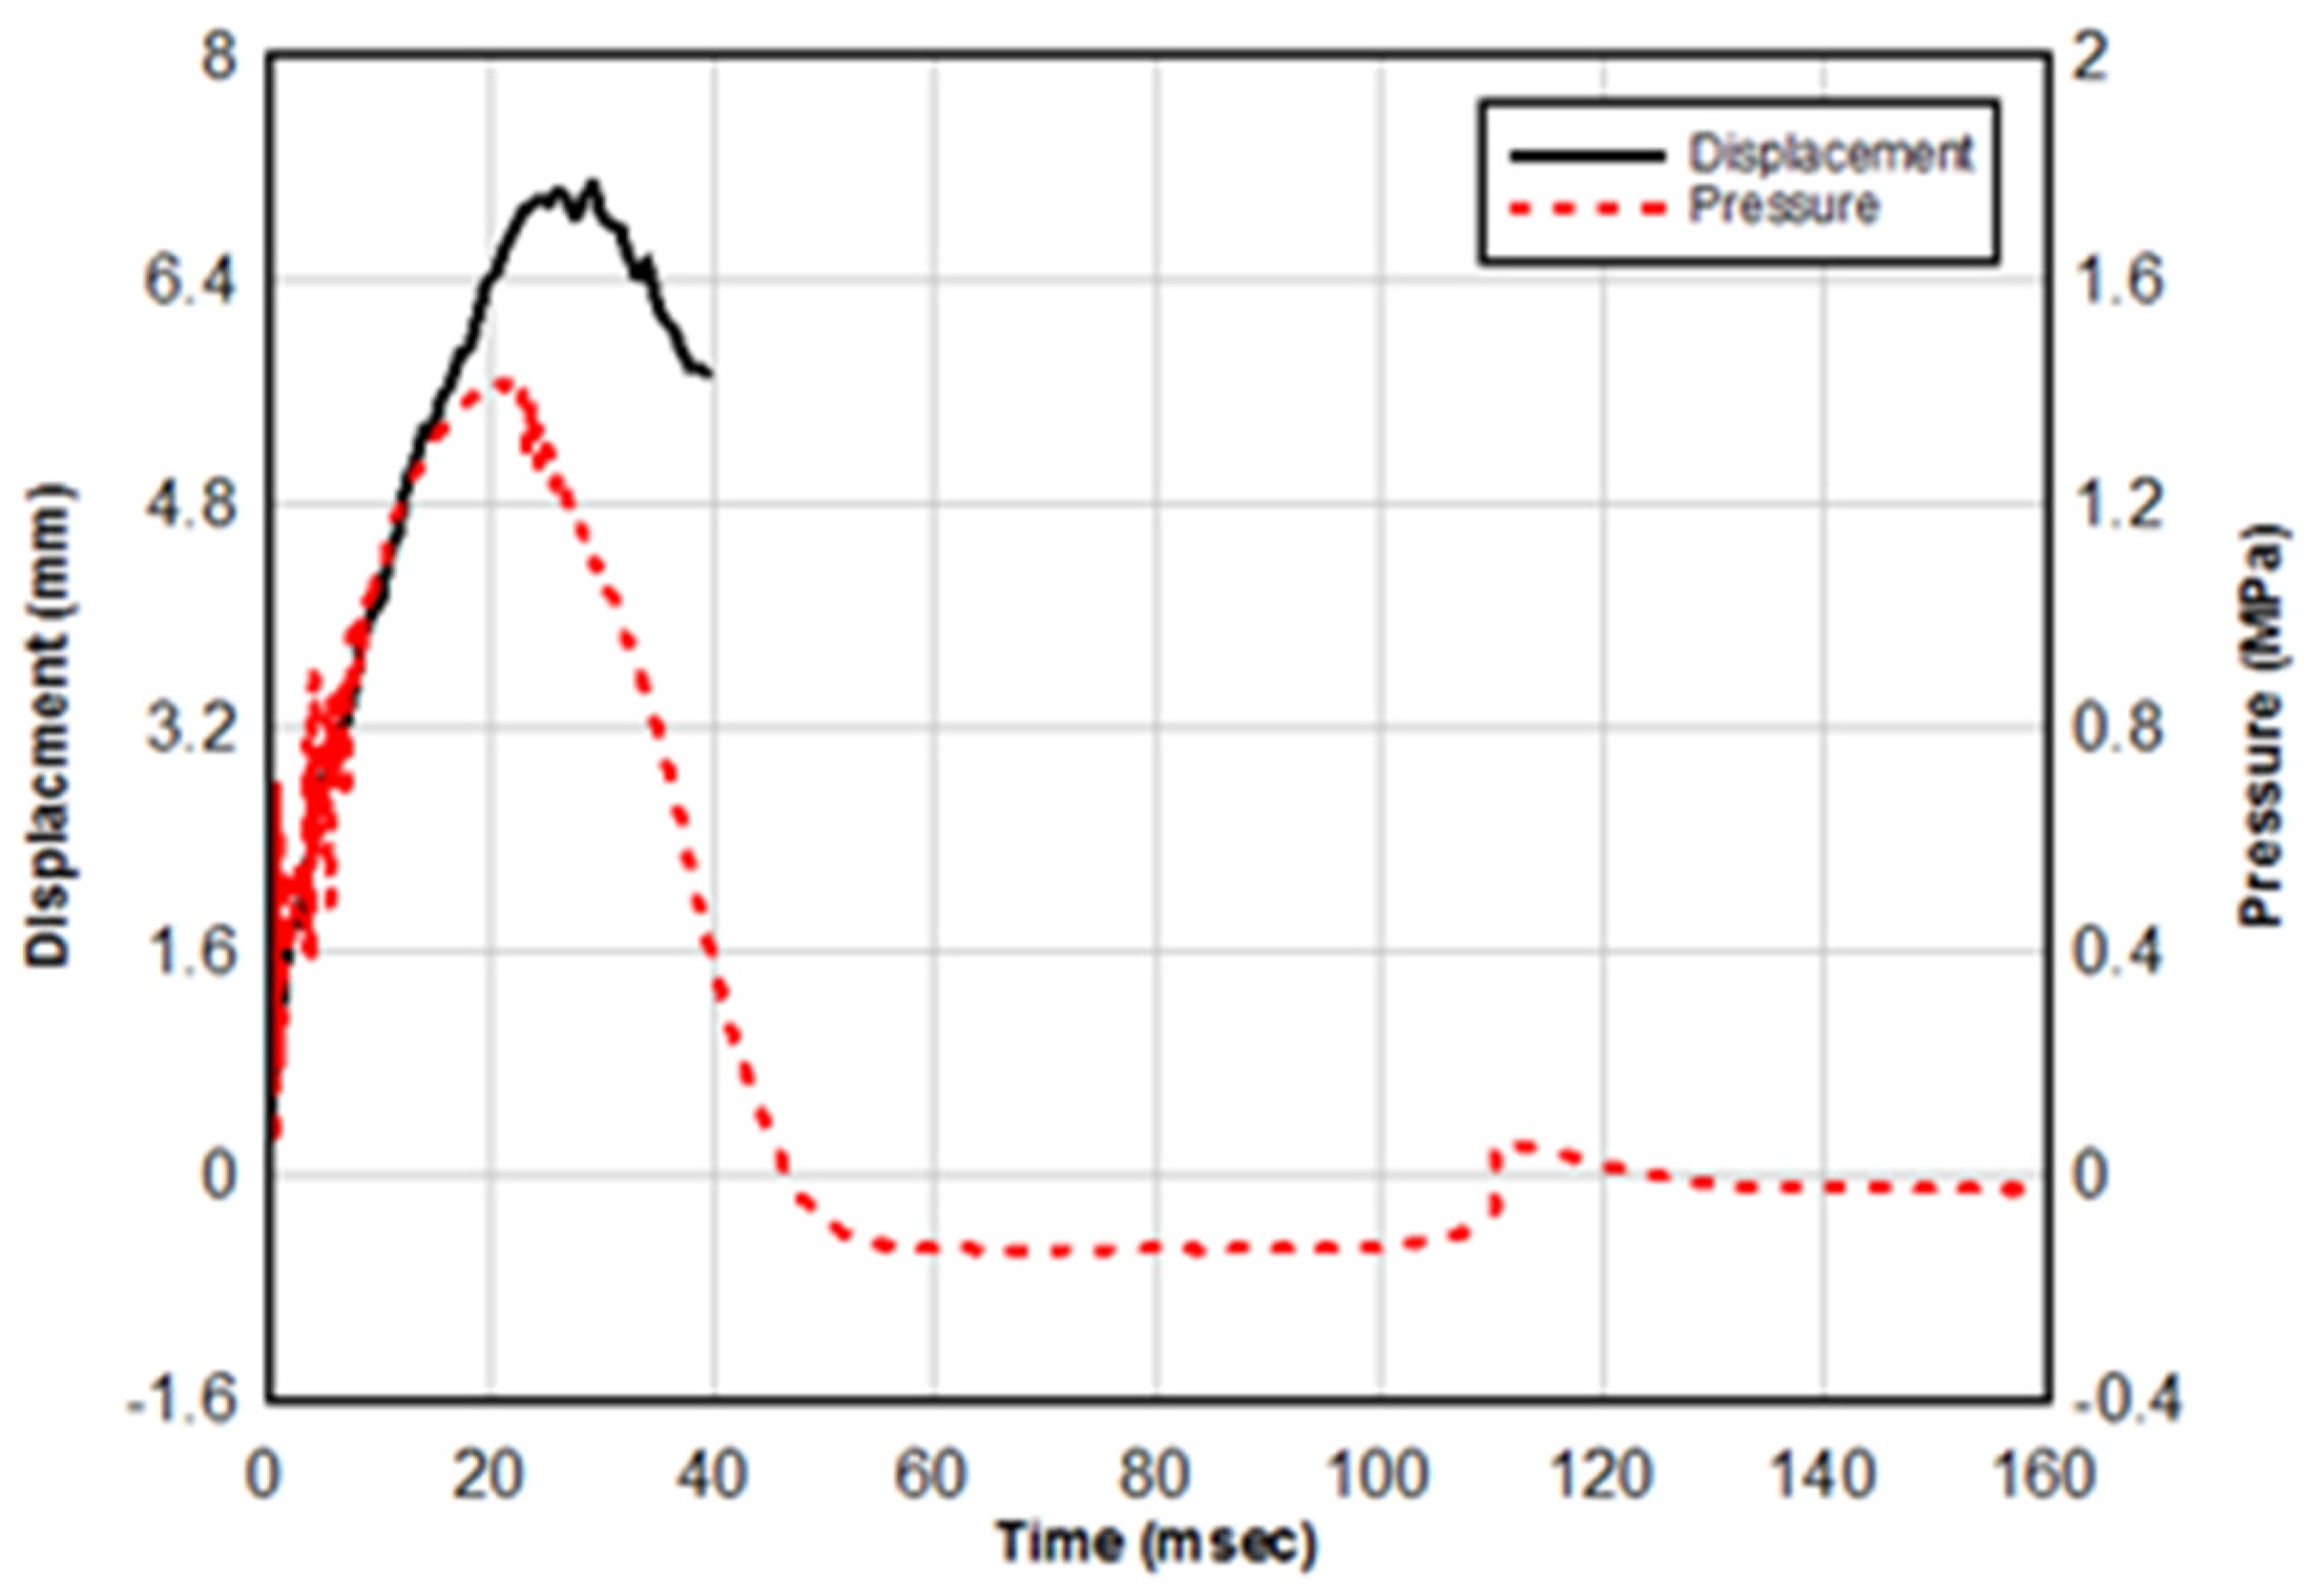
Figure 6 depicts the pressure-time history and displacement-time history of the aluminum plate using a 7.94 kg drop weight at a height of 1524 mm. The rise time for the pressure was approximately 25 ms, which is higher than the rise time for the pressure observed in the piston and rigid plate tests (Figure 3a and Figure 4a). The maximum pressure recorded was lower than that observed in the piston case at the same weight and height, primarily due to the flexibility of the aluminum plate, which reduces the reflected pressure.

5.3. Four Tested LG Samples

Figure 7 illustrates the pressure-time history and displacement-time history for the four LG panels. The results for the three tests are listed in Table 3. Specimen #4 posed difficulties in measuring deflection, as the test primarily aimed to monitor the breakage process of the LG pane. Therefore, sample #4 is not included in Table 3.

5.3.1. Test of LG Panel #1

Figure 7a displays the pressure-time history and displacement-time history for the first LG panel. There were two drops in the displacement-time curve, indicating that the outer annealed glass layer (loaded side) broke at 4.2 ms, followed by the inner annealed glass layer at 9.7 ms. Corresponding to these drops in displacement, there were two drops in the pressure-time curve. The breakage of the glass allowed the panel to absorb the shock wave energy, causing the pressure value to drop instantaneously at 4.2 ms and 9.7 ms. The impulses that caused the first and second layers to break were 0.97 MPa-ms and 1.81 MPa-ms, respectively.

5.3.2. Test of LG Panel #2

For the second LG panel, Figure 7b displays the pressure-time history and displacement-time history. There was only one drop in the displacement-time curve, indicating that both annealed glass layers broke simultaneously at 4.9 ms. Similarly, there was only one drop in the pressure-time curve corresponding to this displacement drop. The impulse that caused the LG panel to break was 1.55 MPa-ms. Comparing the first and second tests, the pane in the first test exhibited a 12.5% increase in deflection and a 19% increase in impulse compared to the second pane.

5.3.3. Test of LG Panel #3

Although all LG panels used for tests #1 through #4 were cut from the same panel, the results of the third test were unpredictable, as the LG glass pane did not break and exhibited higher resistance. The maximum pressure reached in the third test was 0.76 MPa, and the maximum impulse was 12.25 MPa-ms, as shown in Figure 7c. Upon repeating the test using the same height and mass of the striker, the pane eventually broke in this second attempt. The pressure and impulse trends for the broken third sample in the second loading attempt were similar to those of the unbroken sample in the first loading attempt up to the breaking point at 9.1 ms. The maximum impulse for the unbroken sample in the first loading attempt was 12.25 MPa-ms, almost twice the impulse for the broken sample in the second loading attempt. For the second loading attempt of test #3, the impulse up to the breaking point was 2.5 times and 2.9 times the impulse obtained from tests #1 and #2, respectively. Figure 7d shows the pressure-time history and displacement-time history for the second loading attempt of test #3. There was only one drop in the displacement-time curve, indicating that both annealed glass layers broke simultaneously at 9.1 ms. Similarly, there was only one drop in the pressure-time curve at the same time as the drop in the displacement-time curve. The displacement of the pane in test #3 at 9.77 mm was similar to the displacements in tests #1 and #2, which were 10.4 mm and 9.27 mm, respectively.

5.3.4. Test of LG Panel #4

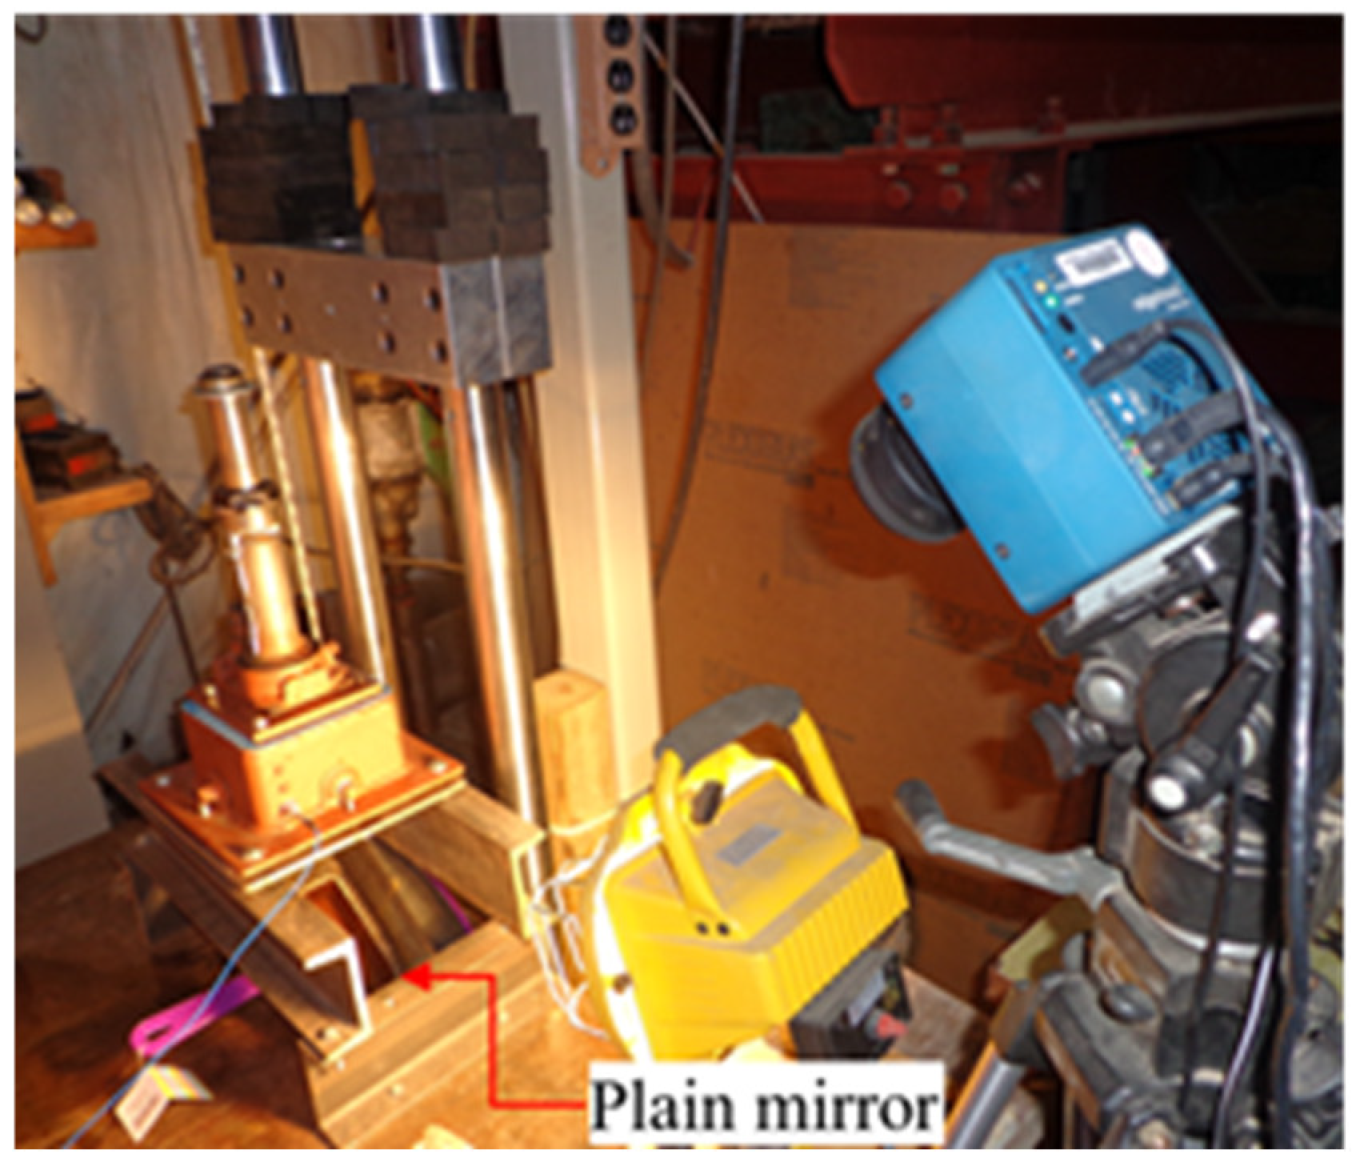
To analyze and monitor the breakage process, placing the high-speed camera under the tested panel to record a video was challenging. A plain mirror was employed underneath the tested panel to facilitate recording the breakage-time history for the pane of test #4, as depicted in Figure 8. The figure presents selected frames from the high-speed video of the testing of LG pane #4, illustrating the response and cracking process at various time steps.
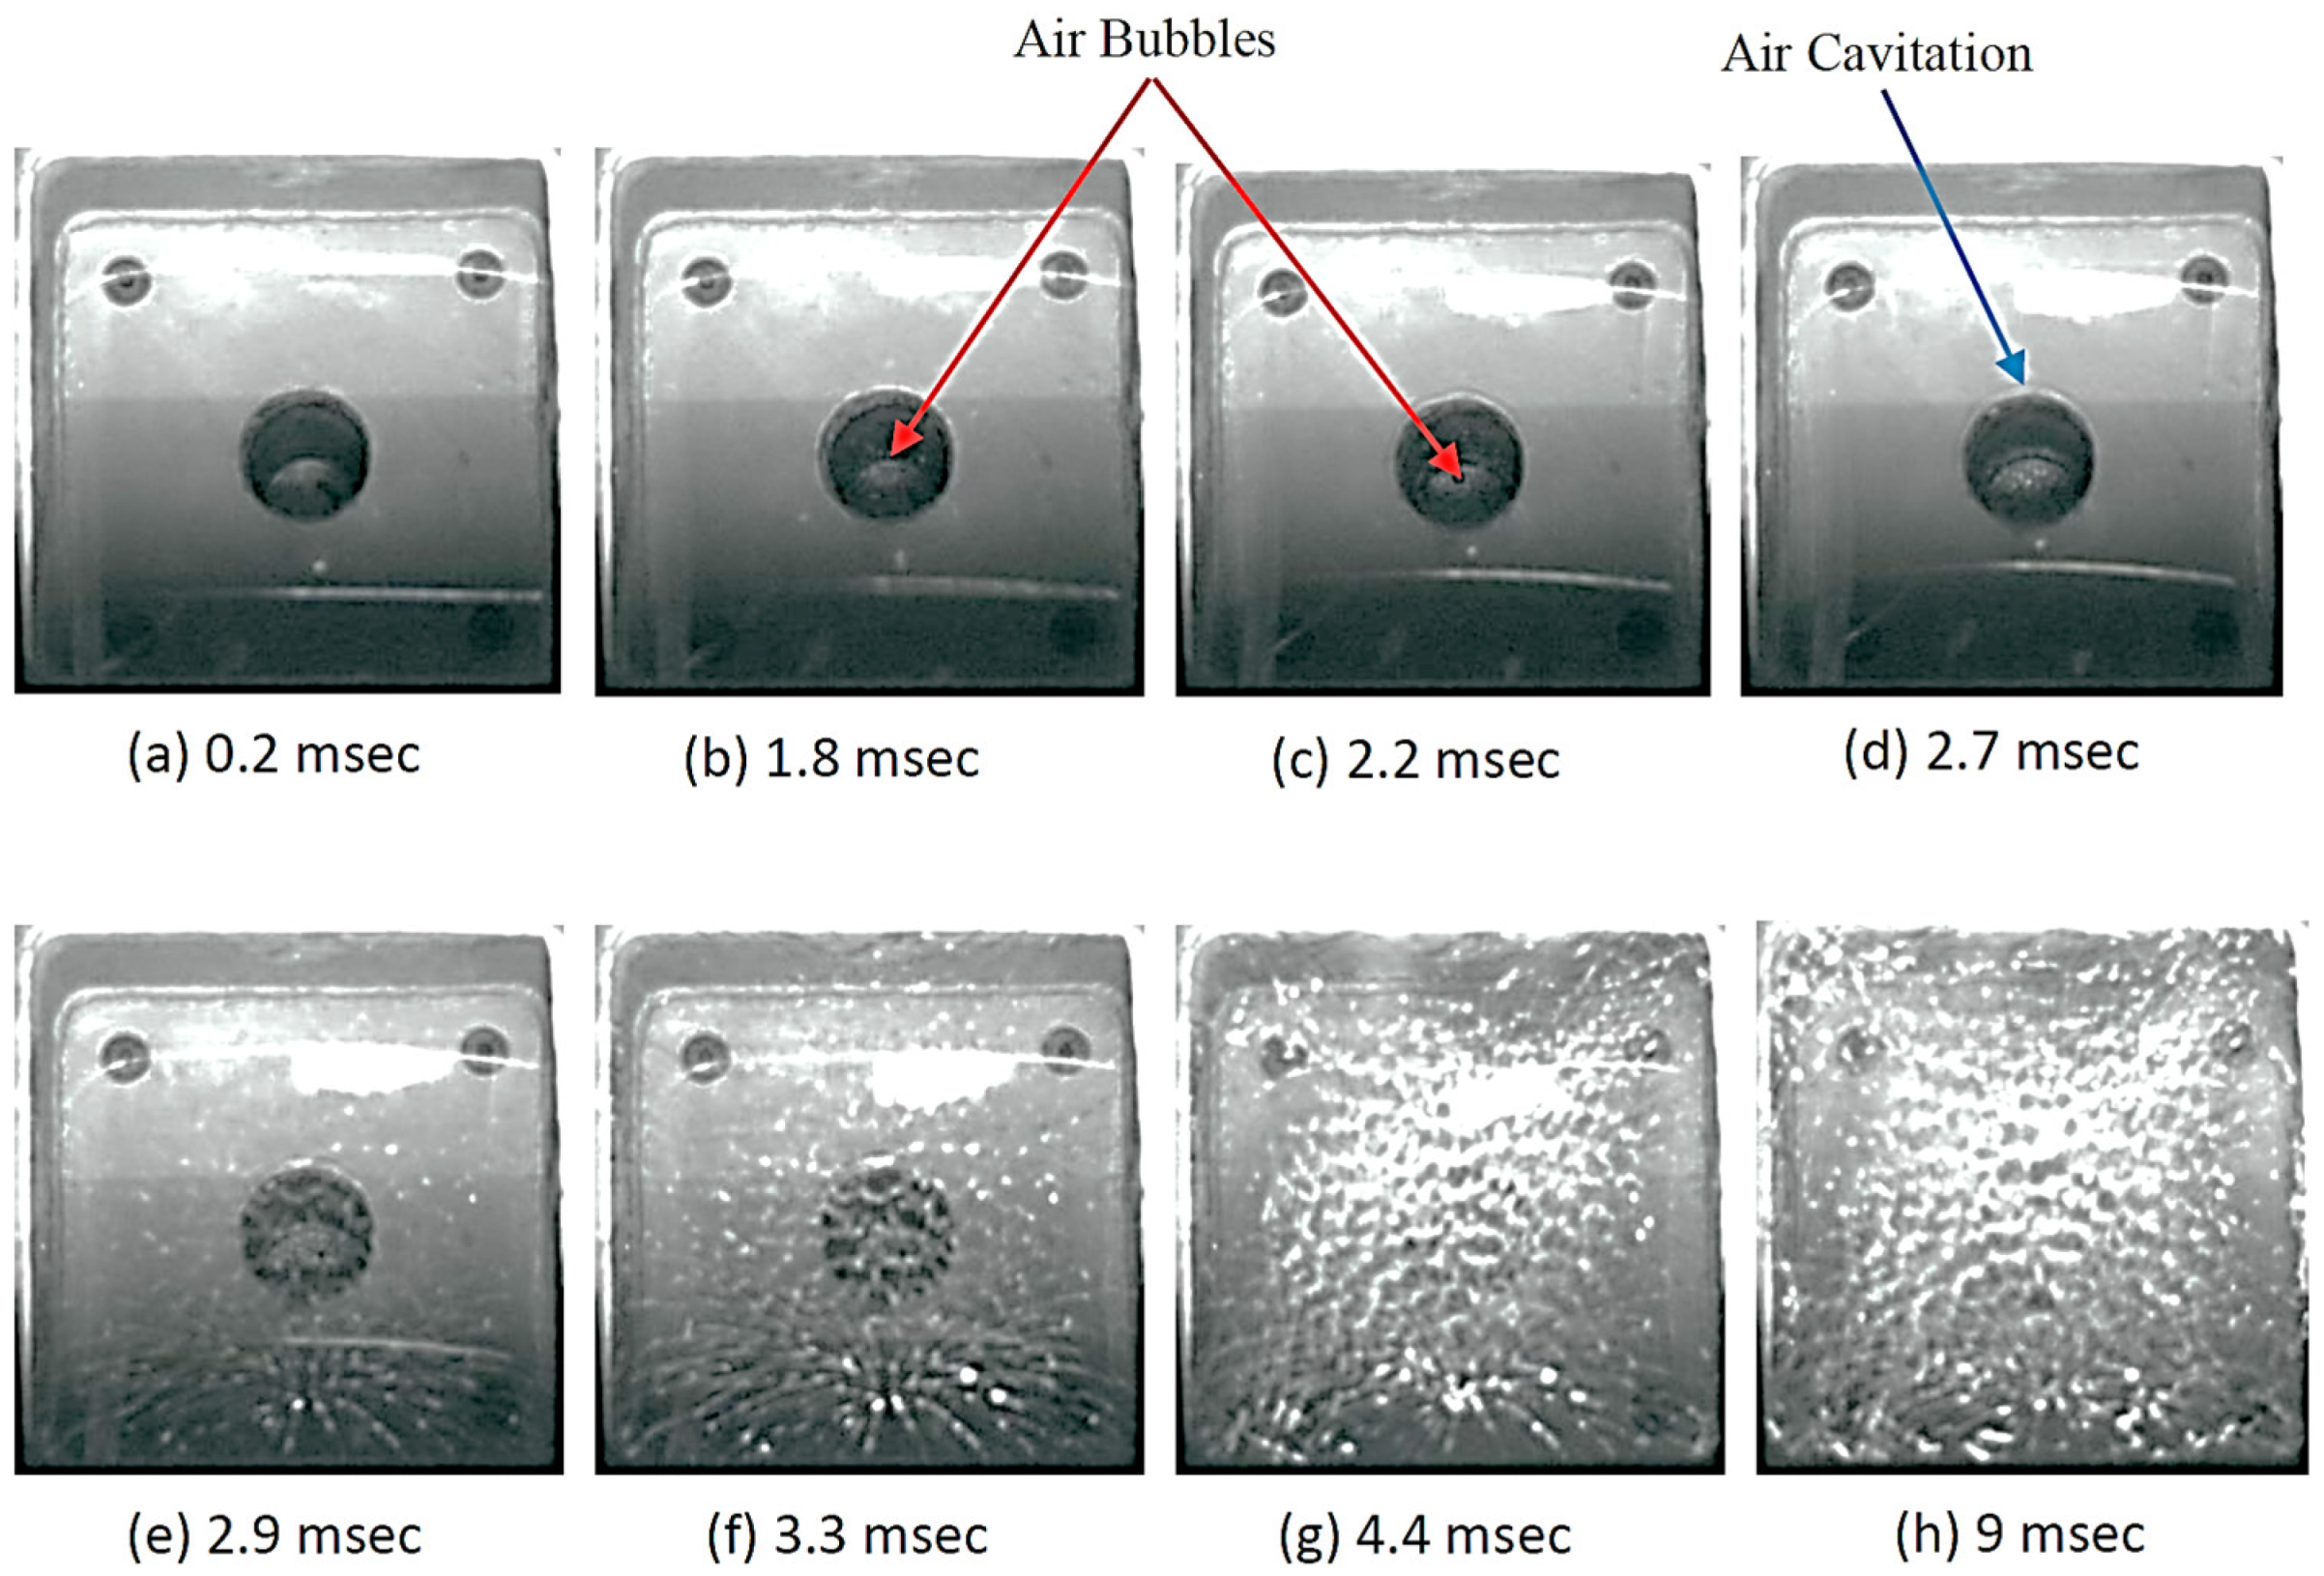
Figure 9a depicts the LG specimen attached to the fluid chamber at 0.2 ms. In Figure 9b, it can be observed that as the specimen began to deflect, bubbles formed in the water near the end of the piston region at 1.8 ms. Defining the exact position of the bubbles was challenging due to the lack of a side-view video recording for the test. Figure 9c illustrates that as the specimen deflected further, the bubbles increased in size, forming a cavitation area at the junction between the piston and the fluid chamber. In Figure 9d, it can be seen that the bubbles started to collapse, and the cavitation area around the piston expanded. Figure 9e shows the first crack that developed in the outer annealed glass layer of the LG pane at 2.9 ms. Figure 9f depicts the propagation of cracks in the outer annealed glass layer of the LG pane. Figure 9g captures the initial failure of the inner annealed glass layer of the LG pane at 4.4 ms, accompanied by a drop in pressure similar to that shown in Figure 7b. Finally, Figure 9h reveals that cracks in the glass plies became denser near the maximum deflection at 9 ms.

5.4. Behavior Comparisons of the Aluminum and LG Samples

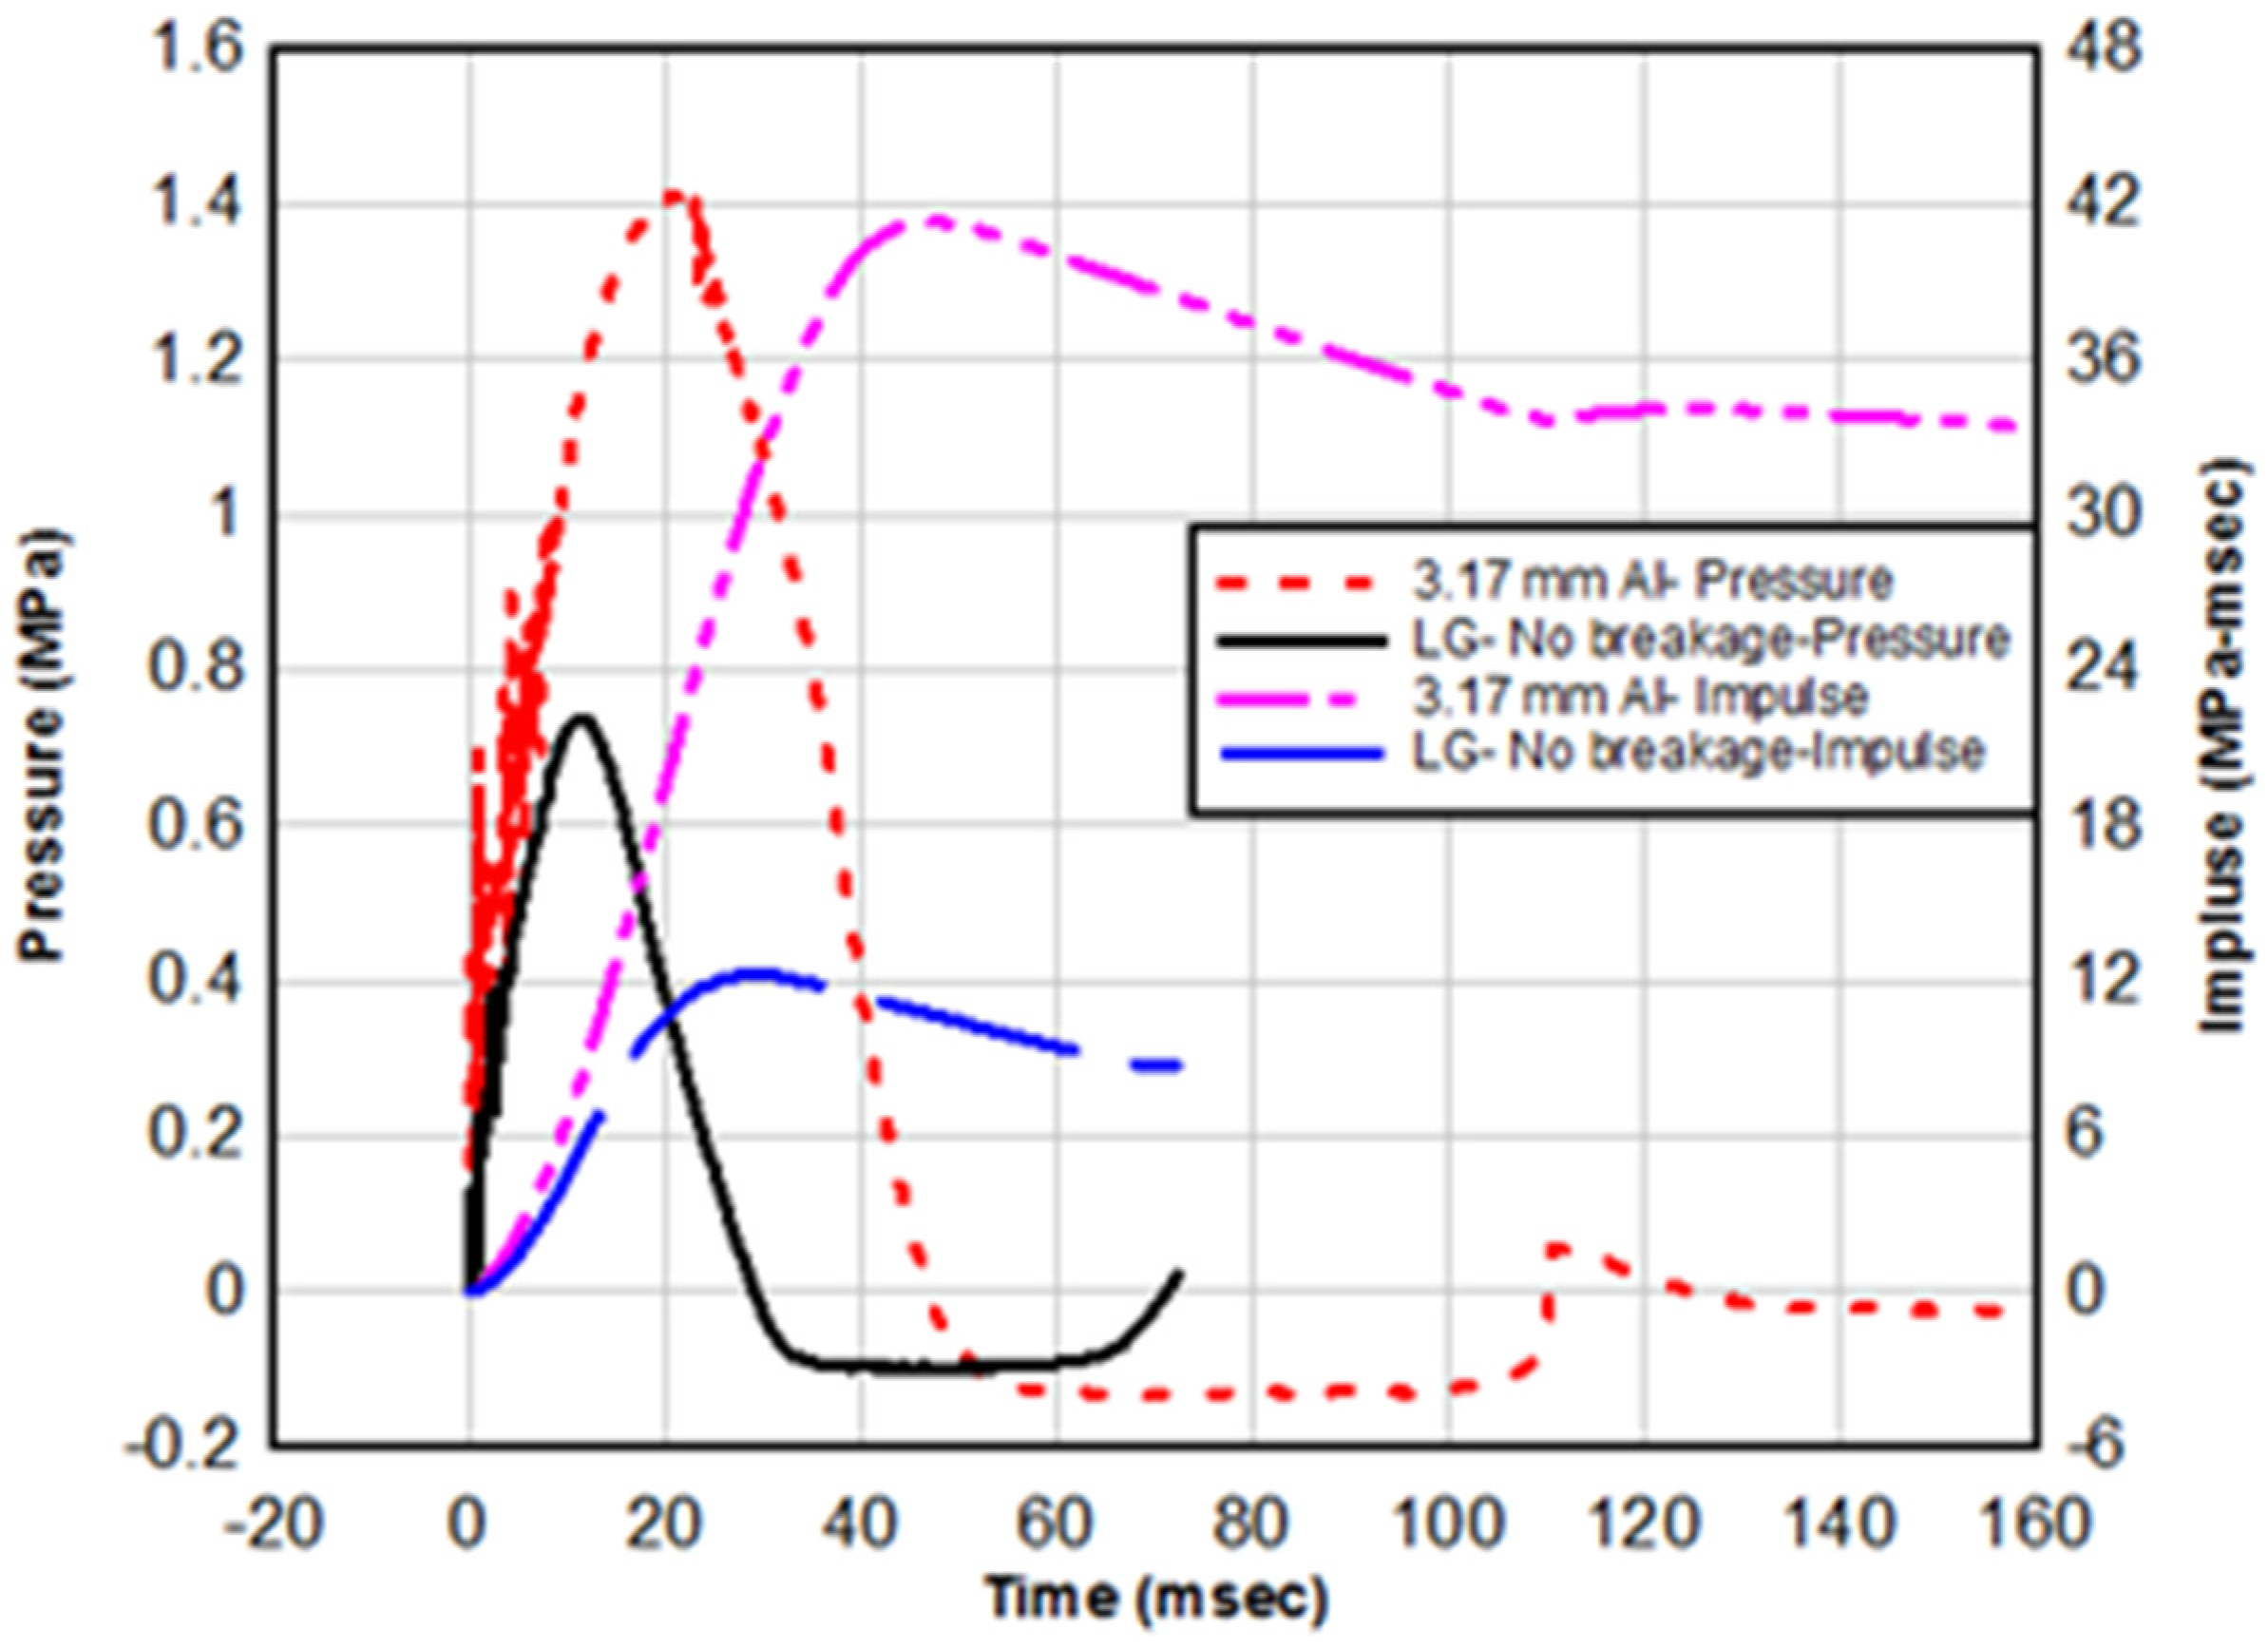
A comparison between the shock wave results and the response of the aluminum sample and the unbroken LG pane #3 is illustrated in Table 4. Figure 10 compares the pressure-time history and impulse between the aluminum plate and the unbroken LG pane #3, both tested with a 7.94 kg weight at 1524 mm height. The shock pressure and the rise time to maximum pressure inside the fluid chamber for the aluminum plate are almost twice that for the unbroken LG pane #3. The induced impulse inside the fluid chamber for the aluminum plate is approximately 3.4 times the induced impulse for the unbroken LG pane #3.
Although aluminum 5052-H32 and annealed glass have almost the same Young’s modulus (70 GPa) and the same thickness (3.17 mm), there was a big difference between the response of the two materials. This difference was due to the short-time shear modulus G0 of PVB which greatly affects the dynamic response of the LG panel in terms of the central deflection and the maximum principal stress [19].
The results of the broken LG panes compared to the unbroken ones indicate that the breakage of the glass can release more than twice the energy, as depicted in Figure 7c. Despite all four LG samples being cut from the same panel, the outcome of the third test was unpredictable because the LG glass pane did not break during the first attempt, demonstrating higher resistance compared to the other panes. Even after breaking, the third sample exhibited continued resistance, with a maximum pressure of 0.76 MPa compared to 0.36 MPa and 0.56 MPa for tests #1 and #2, respectively. The significant variation in results can be attributed to the presence of surface flaws in the glass samples, which affected their behavior.
The breakage of the glass effectively absorbed the generated energy, causing instantaneous drops in pressure values for the three samples. Using a fluid medium offers more advantages than using air, as fluid is incompressible compared to air, which is compressible. Using fluid can conserve a significant portion of the applied energy to produce the impulsive load. Zhang et al. [20,21] employed a different technique to test LG panels, utilizing pendulum impact with an inflated airbag between the testing pane and the impactor to conduct experimental tests on LG panes of various thicknesses. Figure 11 presents a sample of the pressure-time history from [20,21], showing a rise time to peak pressure of approximately 30 ms and peak pressures ranging from 20 to 30 kPa. It was evident that there is a notable difference between the results obtained using the blast simulator developed in this research, which uses a fluid medium, and those obtained by Zhang et al. [20,21], who used an air medium.

5.5. The Speed of the Glass Splinters

The speed of the glass splinters was recorded using the high-speed camera. Initial velocities for randomly selected flying shards were 3.32 m/s for the first test and 4 m/s for the third test. Marchand et al. [22] suggested that skin penetration can occur at energy levels as low as 0.1 J/mm2 or shard velocities of approximately 9 m/s, which corresponds to a flight distance of 3 m (classified as high hazard in current standards). However, this threshold varies significantly depending on the type of glass. They also indicated that eye injuries can occur at energy levels as low as 0.06 J/mm2 or shard velocities of approximately 2 m/s, resulting in a flight distance of 1 m (classified as low hazard in current standards). Therefore, based on current standards [23,24], the velocities observed in the recent research may be classified as medium hazard.

6. Conclusions

In this study, a shock wave simulator was constructed and assessed. Experimental investigations were conducted to explore stress wave generation via a piston impact on fluid inside a tube connected to a fluid chamber, aiming to generate impulsive loads uniformly distributed across test panels. The following conclusions were drawn from the experimental study:
  • The high variation in the results can be attributed to the effect of the presence of flaws at the surface of glass samples.
  • The breakage of the glass allowed the test panes to absorb the generated energy and drop the pressure value instantaneously for the three sample panes tested.
  • It was observed that the initial velocities for randomly selected flying shards were 3 m/s to 4 m/s, and they can be assumed as medium hazards based on the current standard, UFC.
  • The induced impulse inside the fluid chamber for the case of the aluminum plate was almost 3.4 times the induced impulse for the case of an unbroken LG pane.
  • The results of this novel apparatus and research can be used to efficiently design and test a full-scale shock wave simulator for cost-efficient testing of specimens for blast design.
This work could be considered as a first milestone for further avenues of research. More future research work is still needed for further investigations.

Author Contributions

Conceptualization, H.S.; Data curation, A.E.-S.; Formal analysis, A.E.-S.; Investigation, M.T.N. and A.E.-S.; Methodology, M.T.N.; Resources, A.E.-Z., H.S. and A.A.A.; Software, M.T.N., A.E.-Z., A.E.-S. and A.A.A.; Supervision, H.S.; Validation, A.A.A.; Visualization, M.T.N.; Writing—original draft, M.T.N., A.E.-S. and A.A.A.; Writing—review and editing, A.E.-Z. All authors have read and agreed to the published version of the manuscript.

Funding

This research received no external funding.

Data Availability Statement

The data presented in this study are available on request from the corresponding author.

Acknowledgments

The authors would like to thank Prince Sultan University for their support.

Conflicts of Interest

The authors declare no conflicts of interest.

References

  1. Shirbhate, P.A.; Goel, M.D. A Critical Review of Blast Wave Parameters and Approaches for Blast Load Mitigation. Arch. Comput. Methods Eng. 2021, 28, 1713–1730. [Google Scholar] [CrossRef]
  2. Nawar, M.; Salim, H.; Newberry, M.; El-Sisi, A. High strain rate response of laminated glass interlayer materials. Constr. Build. Mater. 2021, 299, 123934. [Google Scholar] [CrossRef]
  3. Martín, M.; Centelles, X.; Solé, A.; Barreneche, C.; Fernández, A.I.; Cabeza, L.F. Polymeric interlayer materials for laminated glass: A review. Constr. Build. Mater. 2020, 230, 116897. [Google Scholar] [CrossRef]
  4. Nawar, M.; Salim, H.; Lusk, B.; Kiger, S. Numerical Simulation and Verification of Curtain Wall Systems under Shock Pressure. Pract. Period. Struct. Des. Constr. 2014, 19, 04014008. [Google Scholar] [CrossRef]
  5. Nawar, M.; Salim, H.; Lusk, B.; Perry, K.; Kiger, S.; Miller, G. Modeling and testing of laminated curtain wall systems under blast loading. In Structures Congress 2013: Bridging Your Passion with Your Profession: Proceedings of the 2013 Structures Congress, Pittsburgh, PA, USA, 2–4 May 2013; American Society of Civil Engineers: Reston, VA, USA, 2013; pp. 170–180. [Google Scholar] [CrossRef]
  6. Lusk, B.; Salim, H.; Perry, K.; Nawar, M.; Wedding, W.C.; Kiger, S.; Ibrahim, A. Modeling and Testing of Laminated Window Systems under Blast Loading. In Proceedings of the Structures Congress 2011, Las Vegas, NV, USA, 14–16 April 2011; pp. 1552–1560. [Google Scholar] [CrossRef]
  7. Hidallana-Gamage, H.D.; Thambiratnam, D.P.; Perera, N.J. Influence of interlayer properties on the blast performance of laminated glass panels. Constr. Build. Mater. 2015, 98, 502–518. [Google Scholar] [CrossRef]
  8. Biolzi, L.; Simoncelli, M. Overall response of 2-ply laminated glass plates under out-of-plane loading. Eng. Struct. 2022, 256, 113967. [Google Scholar] [CrossRef]
  9. Ranocchiai, G.; Andreozzi, L.; Zulli, F.; Fagone, M. Effects of Interlayer Weathering on the Structural Behaviour of Laminated Glass Structures. In Proceedings of the Challenging Glass 5—Conference on Architectural and Structural Applications of GlassBelis, Gent, Belgium, 16–17 June 2016. [Google Scholar]
  10. Inaba, K.; Shepherd, J.E. Flexural waves in fluid-filled tubes subject to axial impact. J. Press. Vessel. Technol. 2010, 132, 021302. [Google Scholar] [CrossRef]
  11. Skews, B.W.; Kosing, O.E.; Hattingh, R.J. Use of a liquid shock tube as a device for the study of material deformation under impulsive loading conditions. Proc. Inst. Mech. Eng. Part C J. Mech. Eng. Sci. 2004, 218, 39–51. [Google Scholar] [CrossRef]
  12. Espinosa, H.D.; Lee, S.; Moldovan, N. A novel fluid structure interaction experiment to investigate deformation of structural elements subjected to impulsive loading. Exp. Mech. 2006, 46, 805–824. [Google Scholar] [CrossRef]
  13. Deshpande, V.S.; Heaver, A.; Fleck, N.A. An underwater shock simulator. Proc. R. Soc. A Math. Phys. Eng. Sci. 2006, 462, 1021–1041. [Google Scholar] [CrossRef]
  14. Ando, K.; Sanada, T.; Inaba, K.; Shepherd, J.E.; Colonius, T.; Brennen, C.E. Shock Theory of a Bubbly Liquid in a Deformable Tube. In Proceedings of the 7th International Conference on Multiphase Flow, Tampa, CA, USA, 30 May–4 June 2010. [Google Scholar]
  15. Chao, T.W.; Shepherd, J.E. Comparison of fracture response of preflawed tubes under internal static and detonation loading. J. Press. Vessel. Technol. 2004, 126, 345–353. [Google Scholar] [CrossRef]
  16. Schiffer, A.; Tagarielli, V.L. The response of rigid plates to blast in deep water: Fluid–structure interaction experiments. Proc. R. Soc. A Math. Phys. Eng. Sci. 2012, 468, 2807–2828. [Google Scholar] [CrossRef]
  17. Perotti, L.; Deiterding, R.; Inaba, K.; Shepherd, J.; Ortiz, M. Elastic response of water-filled fiber composite tubes under shock wave loading. Int. J. Solids Struct. 2013, 50, 473–486. [Google Scholar] [CrossRef]
  18. Shepherd, J.E.; Inaba, K. Shock loading and failure of fluid-filled tubular structures. In Dynamic Failure of Materials and Structures; Springer: Boston, MA, USA, 2010. [Google Scholar] [CrossRef]
  19. Wei, J.; Shetty, M.S.; Dharani, L.R. Stress characteristics of a laminated architectural glazing subjected to blast loading. Comput. Struct. 2006, 84, 699–707. [Google Scholar] [CrossRef]
  20. Zhang, X.; Hao, H.; Wang, Z. Experimental study of laminated glass window responses under impulsive and blast loading. Int. J. Impact Eng. 2015, 78, 1–19. [Google Scholar] [CrossRef]
  21. Zhang, X.; Hao, H. Experimental and numerical study of boundary and anchorage effect on laminated glass windows under blast loading. Eng. Struct. 2015, 90, 96–116. [Google Scholar] [CrossRef]
  22. Marchand, K.A.; Conrath, E.J.; Stevens, D.J.; Meyer, S.B. Blast Induced Glass Hazards: A Comparison of Design Approaches and Recent Research. In WIT Transactions on the Built Environment; WIT Press: Southampton, UK, 2006; Volume 87. [Google Scholar] [CrossRef]
  23. UFC 3-340-02. DoD Structures to Resist the Effects of Accidental Explosions, U.S. Army Corps of Engineers, USA. 5 December 2008. Available online: https://www.wbdg.org/FFC/DOD/UFC/ARCHIVES/ufc_3_340_02.pdf (accessed on 3 June 2024).
  24. DoD. UFC 4-010-01. DoD Minimum Antiterrorism Standards for Buildings. Unified Facilities Criteria, U.S. Army Corps of Engineeers, USA. 12 December 2018. Available online: https://www.wbdg.org/ffc/dod/unified-facilities-criteria-ufc/ufc-4-010-01 (accessed on 3 June 2024).
Figure 1. Drop weight testing setup. (a) Drop weight apparatus; (b) Different components of stress wave generator PCB Piezotronics Pressure sensor; (c) Piston and tube pressure testing; (d) Chamber pressure testing with steel plate; (e) Chamber pressure testing with aluminum plate.
Civileng 05 00031 g001
Figure 2. Testing of LG panels by using the dynamic stress wave generator before and after failure. (a) Sample #1 before the test; (b) Sample #1 attached to the wave generator; (c) Failed sample #1; (d) Failed sample 2; (e) Failed sample 3; (f) Flaying glass shards; (g) Selected frames from the high-speed video (The dotted line is a reference line to show the deflection at the certain selected times).
Civileng 05 00031 g002
Figure 3. Pressure-time history and impulse inside the piston.
Civileng 05 00031 g003
Figure 4. Steel chamber pressure-time history and impulse.
Civileng 05 00031 g004
Figure 5. Chamber and piston results comparison for using W = 4.35 kg at three different heights of H1 = 304.8 mm, H2 = 609.6 mm, and H3 = 914.4 mm.
Civileng 05 00031 g005
Figure 6. Pressure-time history and displacement-time history of aluminum plate 3.17 mm sample using 7.94 kg weight at 1524 mm height.
Civileng 05 00031 g006
Figure 7. Pressure-time history and displacement-time history of LG samples.
Civileng 05 00031 g007
Figure 8. Test setup using a plain mirror to record the glass cracking process.
Civileng 05 00031 g008
Figure 9. Selected frames from high-speed video of testing of an LG Panel (cracking history).
Civileng 05 00031 g009
Figure 10. Comparison between pressure-time and impulse history for 3.17 mm aluminum plate and LG sample # 3 (no breakage pressure) using 7.94 kg weight at 1524 mm height.
Civileng 05 00031 g010
Figure 11. Pressure-time history and displacement-time history of LG Sample [22].
Civileng 05 00031 g011
Table 1. Measured average dynamic loading in tube system.
TestMass
(kg)
Height
(mm)
Pressure
(MPa)
Max. Impulse
(MPa-ms)
Positive Phase Duration (ms)Rising Time (ms)Total Force at Steel Plate (kN)
12.54152.42.636.539.40.62.649
22.54304.83.668.347.30.223.687
32.54609.64.7510.68.90.34.785
42.54914.45.5813.59.30.235.621
57.94152.47.217.6750.37.253
Table 2. Measured average dynamic loading in fluid chamber.
TestMass (kg)Height (mm)Pressure (MPa)Time to Max. Pressure (ms)Max. Impulse
(MPa-ms)
Positive Phase Duration (ms)Total Force at Steel Plate (kN)
W1-H14.35304.80.981318.4730.322.761
W1-H24.35609.61.057.749.8715.124.387
W1-H34.35914.41.3779.517.321.231.982
W2-H12.54304.80.739.58.932416.955
W2-H22.54609.60.937.510.815.821.600
W2-H32.54914.41.1510.6117.6522.6226.710
H1 = 304.8 mm, H2 = 609.6 mm, H3 = 914.4 mm, W1 = 4.35 kg and W2 = 2.54 kg.
Table 3. Experimental data of LG samples.
SampleFrist Breakage DataMeasured Displacement
Max. Pressure (MPa)Time to Max.
Pressure (ms)
Impulse
(MPa-ms)
Max. Displacement (mm)Time for Max. Displ. (ms)
LG10.364.20.9710.440
LG1 *0.29.71.81--
LG20.564.91.559.2733.5
LG30.769.14.519.7723.4
* The second peak for LG1.
Table 4. Comparison between Al 5052-H3 and LG panel (annealed glass).
PropertyAnnealed GlassAL 5052-H32
PropertiesDensity (kg/m3)25002680
Young’s modulus, GPa6970.3
Poisson ratio0.220.33
Elastic limit, MPa-193
Failure strain0.00120.12
Failure stress, MPa84.8228
ResultsMax. Pressure (kPa)0.741.43
Max. Pressure Time (ms)11.822.4
Max. Impluse (MPa-ms)12.2541.3
Positive Phase (ms)29.146.9
Disclaimer/Publisher’s Note: The statements, opinions and data contained in all publications are solely those of the individual author(s) and contributor(s) and not of MDPI and/or the editor(s). MDPI and/or the editor(s) disclaim responsibility for any injury to people or property resulting from any ideas, methods, instructions or products referred to in the content.