Article

Incorporating Pavement Friction Management into Pavement Asset Management Systems: State Department of Transportation Experience

Department of Civil and Architectural Engineering, University of Wyoming, 1000 E University Ave, Laramie, WY 82071, USA
*
Author to whom correspondence should be addressed.
CivilEng 2022, 3(2), 541-561; https://doi.org/10.3390/civileng3020032
Submission received: 17 May 2022 / Revised: 14 June 2022 / Accepted: 15 June 2022 / Published: 18 June 2022
(This article belongs to the Section Urban, Economy, Management and Transportation Engineering)

Abstract

:
Pavement friction is an important topic addressed by transportation agencies to reduce the number of traffic crashes and fatalities caused by poor friction between tires and pavement surface. Pavement friction management (PFM) provides the essential tools and techniques to effectively evaluate pavement friction conditions and provide informed maintenance decisions using surface treatments. State Departments of Transportation (DOTs) utilize various engineering practices to collect and analyze friction-related data, crash data, and traffic data. In addition, state DOTs tend to employ different techniques and policies to manage the pavement friction depending on budget levels, strategic objectives, and climate conditions. Due to these diversified practices in friction management, in this study, we intend to provide a comprehensive review of the state of the practice among state DOTs. Online surveys were analyzed using descriptive and statistical correlation analyses to study the experience of state DOTs with managing pavement friction, considering feedback from 32 state DOTs in the USA. Exploring the methods to manage the pavement friction used by state agencies will help researchers and officials know more about the strategies towards an effective PFM. It also presents opportunities to enhance the approaches of the followed programs and highlight the gaps of the current practices. The results obtained from the survey identify the practical policies and propose future enhancements to maximize the value of pavement assets and promote safety.

1. Introduction

Pavement friction plays a critical role in enhancing the skid resistance of road surfaces so that driving maneuvers can be safely performed in different environmental conditions [1]. For decades, transportation agencies have been studying the main components of pavement friction and associated characteristics to define appropriate maintenance and treatments on roadways. This is because there is a direct interaction between vehicle tires and road surface textures and conditions [2]. Therefore, there is an imperative need to maintain the efficiency of pavement friction in order to enhance road safety by decreasing friction-related crashes [3]. The Federal Highway Administration (FHWA) encourages transportation agencies, including government entities, to incorporate pavement friction management (PFM) systems to address the road network friction demands on the different road classifications [4]. Consequently, state Departments of Transportation (DOTs) utilize various engineering practices to collect and analyze friction-related data, crash data, and traffic data. However, state DOTs tend to employ different techniques and policies to manage the pavement performance and treatments related to pavement friction. Despite the previous efforts in studying pavement friction characteristics, some agencies are not supported with a clear guide and suitable approaches to maintain the pavement friction in cost-effective ways. Some agencies follow a proactive management system to develop multi-year maintenance plans, while other agencies address only locations displaying friction- and safety-related issues. Hence, the maturity levels of friction management vary among states, where some programs are quite basic while others can be quite developed and sophisticated. The current practices of friction management among agencies, especially state DOTs, vary significantly due to different budget levels, strategic objectives, and climate conditions. Some agencies integrate the friction management to the state Pavement Management System (PMS) with preliminary and subjective analyses for decision making. Other programs integrate more advanced analysis and modeling to cope with the wide range of fiction demands on different road classifications and specific geometric conditions. Due to these diversified practices in friction management, with this study, we intend to provide a comprehensive review of the state of the practice among state DOTs. Exploring the methods to manage the pavement friction used by state agencies in the nation will help researchers and officials know more about the strategies towards effective pavement friction management. It also presents opportunities to enhance the approaches of the followed programs and highlight the gaps of the current practices. In addition, studying the current strategies at the nationwide level will reveal the limitations and assess the merits of state policies so that improving the strategies and approaches of pavement friction management is made possible to save costs and resources.
The Wyoming Technology Transfer (WYT2) Center received funding to study the friction demands and associated factors in order to enhance the current policies of friction management for the Wyoming DOT (WYDOT) [5]. One part of this study is to investigate the nationwide practices of PFM and related programs currently employed by state DOTs. The WYT2 center is interested in the experiences managing pavement friction in other states so that beneficial guidelines and recommendations can be developed for not only WYDOT, but the whole nation. To achieve this, an online survey was developed and disseminated to the officials of all state DOTs who are responsible for managing the pavement friction and involved in the decision making on friction-related treatments. The survey comprises questions covering most related practices and techniques in managing the pavement friction. Feedback from 32 state DOTs was received. This paper summarizes the findings of the survey. The paper depicts the current status of PFM and provides constructive discussions on how to address the limitations in order to increase the effectiveness of friction management strategies and promote safety.

2. Study Objectives

In this study, PFM techniques were collected then statistically correlated and analyzed using online survey questionnaires. The objectives are as follows:
  • Discover the state policies and targets in utilizing PFM on the roadways managed by state DOTs.
  • Define the state testing protocols, equipment, and data collection techniques to measure the pavement friction on the state highways.
  • Investigate the strategies established by state DOTs to provide adequate pavement friction levels, especially at locations requiring higher friction demands.
  • Highlight the trends of current pavement friction management practices and activities and define their relevant effectiveness.
  • Provide the best practices of managing and planning the maintenance plans of pavement friction considering the feedback from both state DOT participants and literature.
The ultimate goal of this paper is to:
  • Develop appropriate pavement friction management framework and guidelines for state DOTs.
  • Enhance road safety by developing a detailed process to treat pavement friction.

3. Background

Due to the federal policies embedded in the Moving Ahead for Progress in the 21st Century (MAP-21) Act [6] and the Highway Safety Improvement Program (HSIP) [7], PFM has been increasingly recommended to promote safety by reducing the number of friction-related crashes and enhancing the efficiency of pavements [4]. Consequently, various forms of friction guidance and organizations have been developed to help transportation agencies cover the technical aspects of pavement friction, including the FHWA Technical Advisories on pavement friction management and the AASHTO Guides, Manuals, and Guide Specifications for geometric design [8,9]. In addition, pavement industry groups and international agencies have been involved in developing bulletins, guides, and manuals for friction testing, design, and safety management [10,11,12]. The initial concern of pavement friction and safety performance was raised only on roads during wet weather conditions, but recent studies have found that friction should be addressed to include all pavement surface conditions (e.g., wet and dry surfaces) [13]. Several studies assess the friction demands on roads considering investigatory and intervention levels [1,14]. Other studies link friction demands and road geometric characteristics, and the lowest friction levels were found on high-speed roads, curves, and approaches to intersections [15]. This emphasizes addressing the specific friction demands where vehicles are required to frequently stop and slow down. As a consequence, a continuous pavement friction measurement (CPFM) was evolved to measure pavement friction continuously through tangents, curves, and intersections. The FHWA encourages the use of CPFM to provide a comprehensive pavement friction data [16]. In terms of pavement friction enhancements, several surface treatments were evaluated on the expected performance of skid resistance, including chip seal, fog seal, miscrosurfacing, and ultra-thin bonding wearing course (UBWC), among other treatments [17]. Moreover, higher quality materials were used in the innovative High Friction Surface Treatments (HFST), which demonstrated nationally and internationally significant increases in friction for spot applications [18].
There has been an interest in assessing agency procedures and practices of managing pavement friction. Henry [19] conducted a survey for identifying friction and texture measurements in addition to the requirements among state agencies that responded in 1999. Another study was conducted by Shaffer [10], which was limited by the low degree of participation (i.e., only nine states participated in the interview survey). Although much information and guidance related to pavement friction are available, some studies mention that such recommendations are not integrated into a comprehensive administrative policy and design tool for addressing friction issues [1]. Based on a literature search and brainstorming meetings, Speir [20] indicated that few state DOTs adopted practices of skid accident reduction programs and/or PFM systems. After more than a decade of developing related guidelines and reports, this paper focuses only on the state DOT practices of pavement friction management currently employed nationwide in the USA. The results from the state-of-the-practice review of this paper serve to supplement the existing studies of pavement friction characteristics and treatments to assist transportation agencies in understanding the importance of pavement friction and its highway safety and economic implications.

4. Methodology

4.1. Survey Questionnaire

In order to understand all official practices of pavement friction managements in the USA, the survey questionnaire was designed to address the current situations of the practices for state DOTs. The survey was sent out to 42 state DOTs representatives where it was forwarded to the responsible individuals (e.g., research, materials, management, or design personnel). Some states were excluded due to either the small size of their road networks or the unavailability of appropriate contacts. Feedback from 32 state DOTs was received, with a response rate of 76%. The participating states are highlighted on the map shown in Figure 1, and they represent almost 65% of the total size of the USA [21]. According to the 2019 Highway Statistics [22] and in terms of the size of road networks, the participating state DOTs own more than one million kilometers of public roads, comprising almost 80% of the U.S. public road network. It is worth mentioning the participating states form diverse agencies with anticipated different goals and resources. They are also distributed in different climate zones [23]. Therefore, the results of the survey are expected to provide various practices of PFM and related programs which provide several recommendations. In addition, any trend observations found in the study are not expected to be biased due to the limited responses, the size of the state DOT’s road network, or climate conditions. The survey questionnaire is divided into four sections described below.

4.1.1. General Information

The first section of this survey intends to gather some definition information about the agencies. It also investigates the general policy of skid resistance and pavement friction management in the state. In addition, this section asks questions related to road classification and the main criteria chosen for testing and studying the pavement friction. Furthermore, some questions in this section ask about the types of pavement surfaces used for measurements.

4.1.2. Data Collection

In this section, the survey discusses the methods used to measure the pavement friction and the protocols of data collections in terms of amounts and frequencies. It also discovers the devices used and their characteristics, including efficiency, ownership, and calibration. Moreover, the section solicits discussions of problems, limitations, and other concerns faced by state DOT practitioners during the PFM data collection process.

4.1.3. Analysis and Performance

In this section, friction indices and types of analysis are explored among state DOTs to investigate if there is a specific technique followed for pavement friction performance modeling. In addition, the survey investigates if there are models or equations considered in the state DOT planning program to describe the effect of adding surface treatments on the friction performance overtime. Data about the minimum friction values and friction demand criteria are also collected in this section.

4.1.4. Treatments and Maintenance Planning

In this part of the survey, the practices of decision making and maintenance planning are collected from state DOTs to study if there are standard techniques recommended by state agencies. The types of treatments followed on each pavement type are also investigated in this section. More questions are raised in this section to cover other aspects of maintenance and managing the pavement friction.

4.2. Data Correlation

A correlation analysis is key to explicate the relationships among the survey questions so that deeper interpretations can be attained from the respondent feedback. However, some survey questions are hard to analyze, especially the multiple-response questions, where more than one response is permitted. Open-response questions are excluded from this analysis because they simply provide open discussions, and no statistical analysis can be considered. Some nominal questions in the survey are converted into scaled responses to enhance the statistical analysis. The single-response questions in the survey are filtered to include mainly the important aspects of managing the pavement friction. Table 1 lists the questions under investigation in addition to their defined variables and overall descriptions.
The design of the defined variables is shown in Table 2. The statistical question was raised during the preparation of these data. Some state DOTs tend to show different practices in managing the pavement friction depending on the overall policy of PFM. Therefore, we studied whether the response for Question 2 will affect the distribution of responses on the detailed practices in the other questions. To address this, the correlations are determined between the “PFM application” and the other questions. Considering the type of each variable, the correlation methodology will be different. Since no association between two scaled variables will be studied, the normal Pearson correlation is not used in the correlation analysis of this study. Phi correlation is normally used for two non-parametric variables where both variables are dichotomous. Cramer’s V correlation is applied for nominal variables with more than two categories. For scaled variables, Eta correlation is used to determine the association with the main binary variable for Question 2.

5. Survey Results

The discussions about the results and potential enhancements are introduced according to the main components of the PFM shown in the following sections.

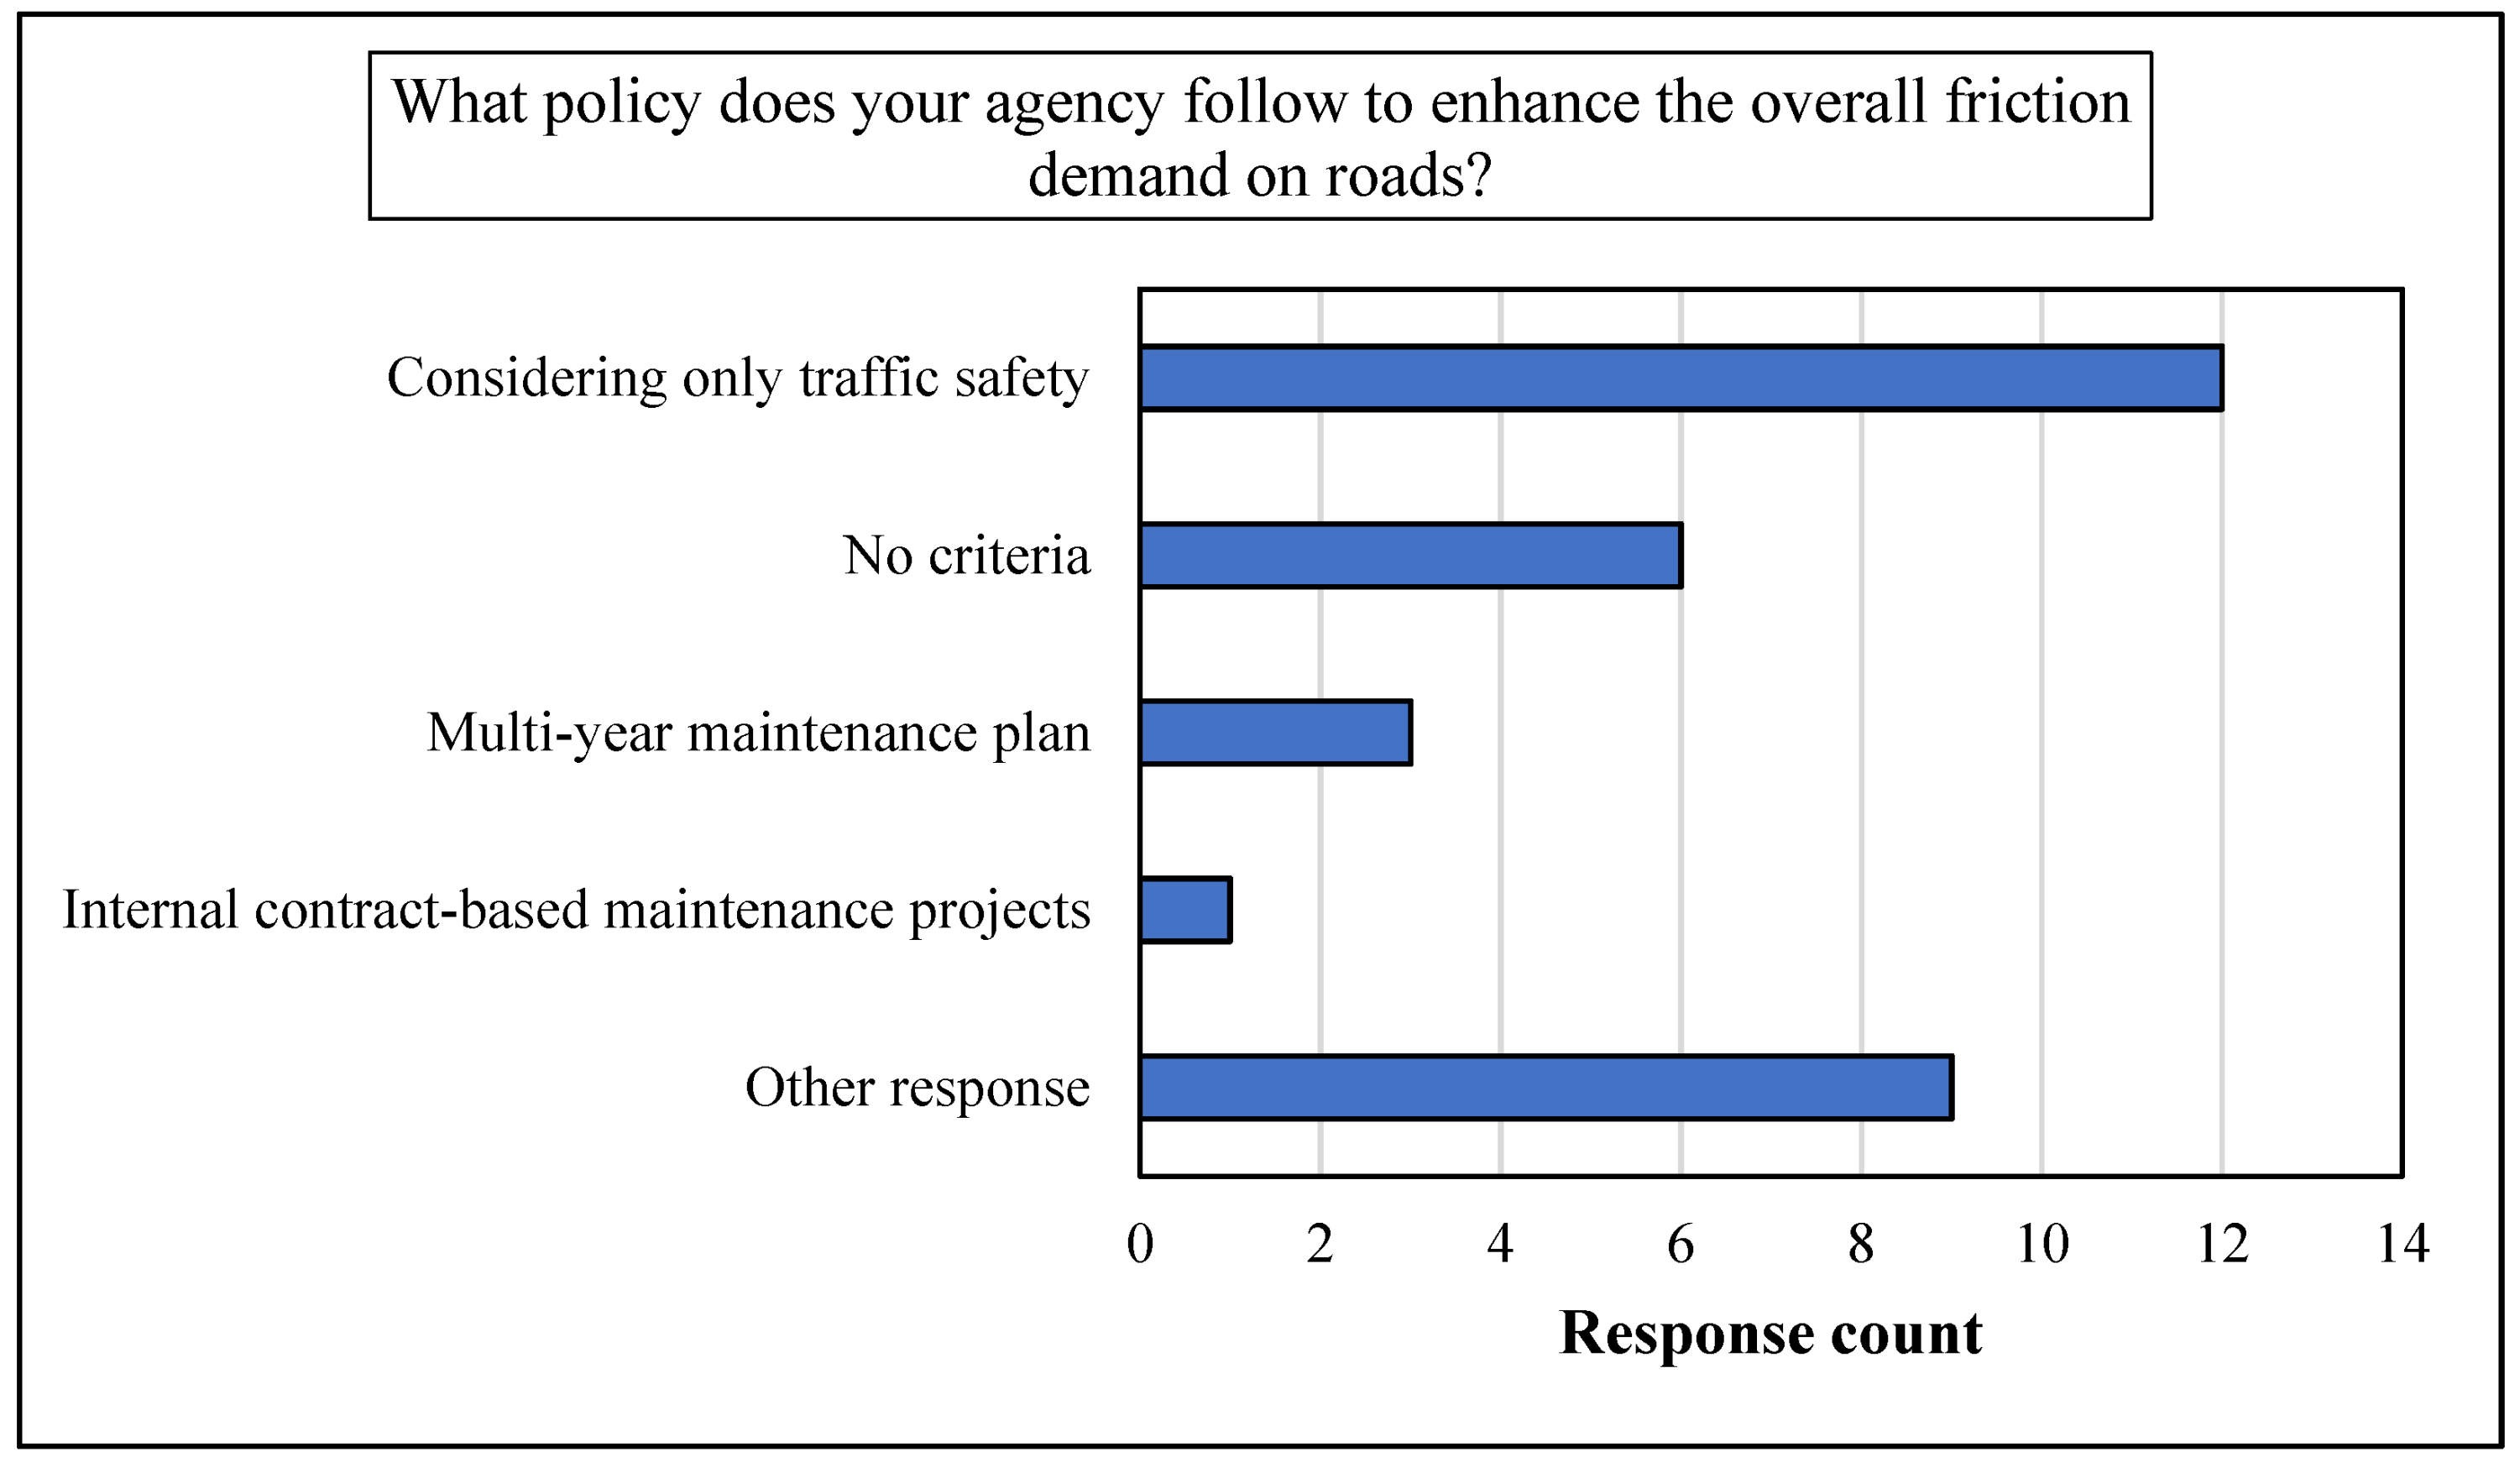
5.1. Policy of Management

First of all, it was crucial to ask the state DOT representatives if the current practices of dealing with pavement friction issues are conducted through a typical PFM and whether it is incorporated into the state PMS program. The results of this inquiry are shown in Table 3. Out of the 32 participating DOTs, only 12 states follow a systematic practice to manage the pavement friction. The majority of DOTs (62%) do not conduct a typical PFM on a regular basis. They mainly address the pavement friction on roads by request when there is a skid resistance safety concern flagged by the safety program, especially for elevated wet weather crashers. Other DOTs, such as Colorado, Nebraska, and North Dakota, neither test nor collect pavement friction. The Ohio DOT is not permitted to apply a proactive friction testing and they only consider triggered requests such as wet crashes, front line workers observance, and law enforcement agency request, among others.
The applied pavement friction testing and managements were surveyed in terms of functional classification. As shown in Figure 2, state DOTs mainly apply relevant friction measurements and programs on both national and non-national highway systems. However, higher practices are noticed on interstate and state highway systems. Other responses are received for only specific roads received safety concerns, as explained previously. Another aspect of the PFM policy concerned whether the pavement friction data are collected statewide or at specific locations only. Out of the 29 responses received, 35% of state DOTs collect the data at specific locations only, while 65% collected the data either at statewide level only or at both statewide and specific locations. It is interesting to see that none of the states responding to the survey collect friction data on county roads.
For the DOTs that collected pavement friction data at specific locations, a follow-up question asked the participants about the criteria of selecting such locations. As shown in Figure 3, there is no doubt that safety concern is the major issue when studying the pavement friction needs of roads. The research needs are also noticed as a contributing factor among state DOTs for collecting the pavement friction data due to the current studies of surface treatments, especially for the sponsored test sections of the HFST treatments, which are mentioned by multiple DOTs. Other responses are mentioned for the selection criteria of testing pavement friction such as district requests, bridge decks, and intersections, among other needs. The last aspect related to the policy of PFM and related programs is the type of pavement surface tested by the state DOTs. Out of the 29 responses, 26 state DOTs consider all types of pavement surfaces for friction study and testing. The California and Montana DOTs consider primarily asphalt pavement for testing friction. The Georgia DOT revealed that they only test pavement friction for HFST studies. They have sponsored several studies to investigate the effectiveness of HFST treatments to reduce potential run-off-road (ROR) crashes at specific locations such as sharp curves [24].

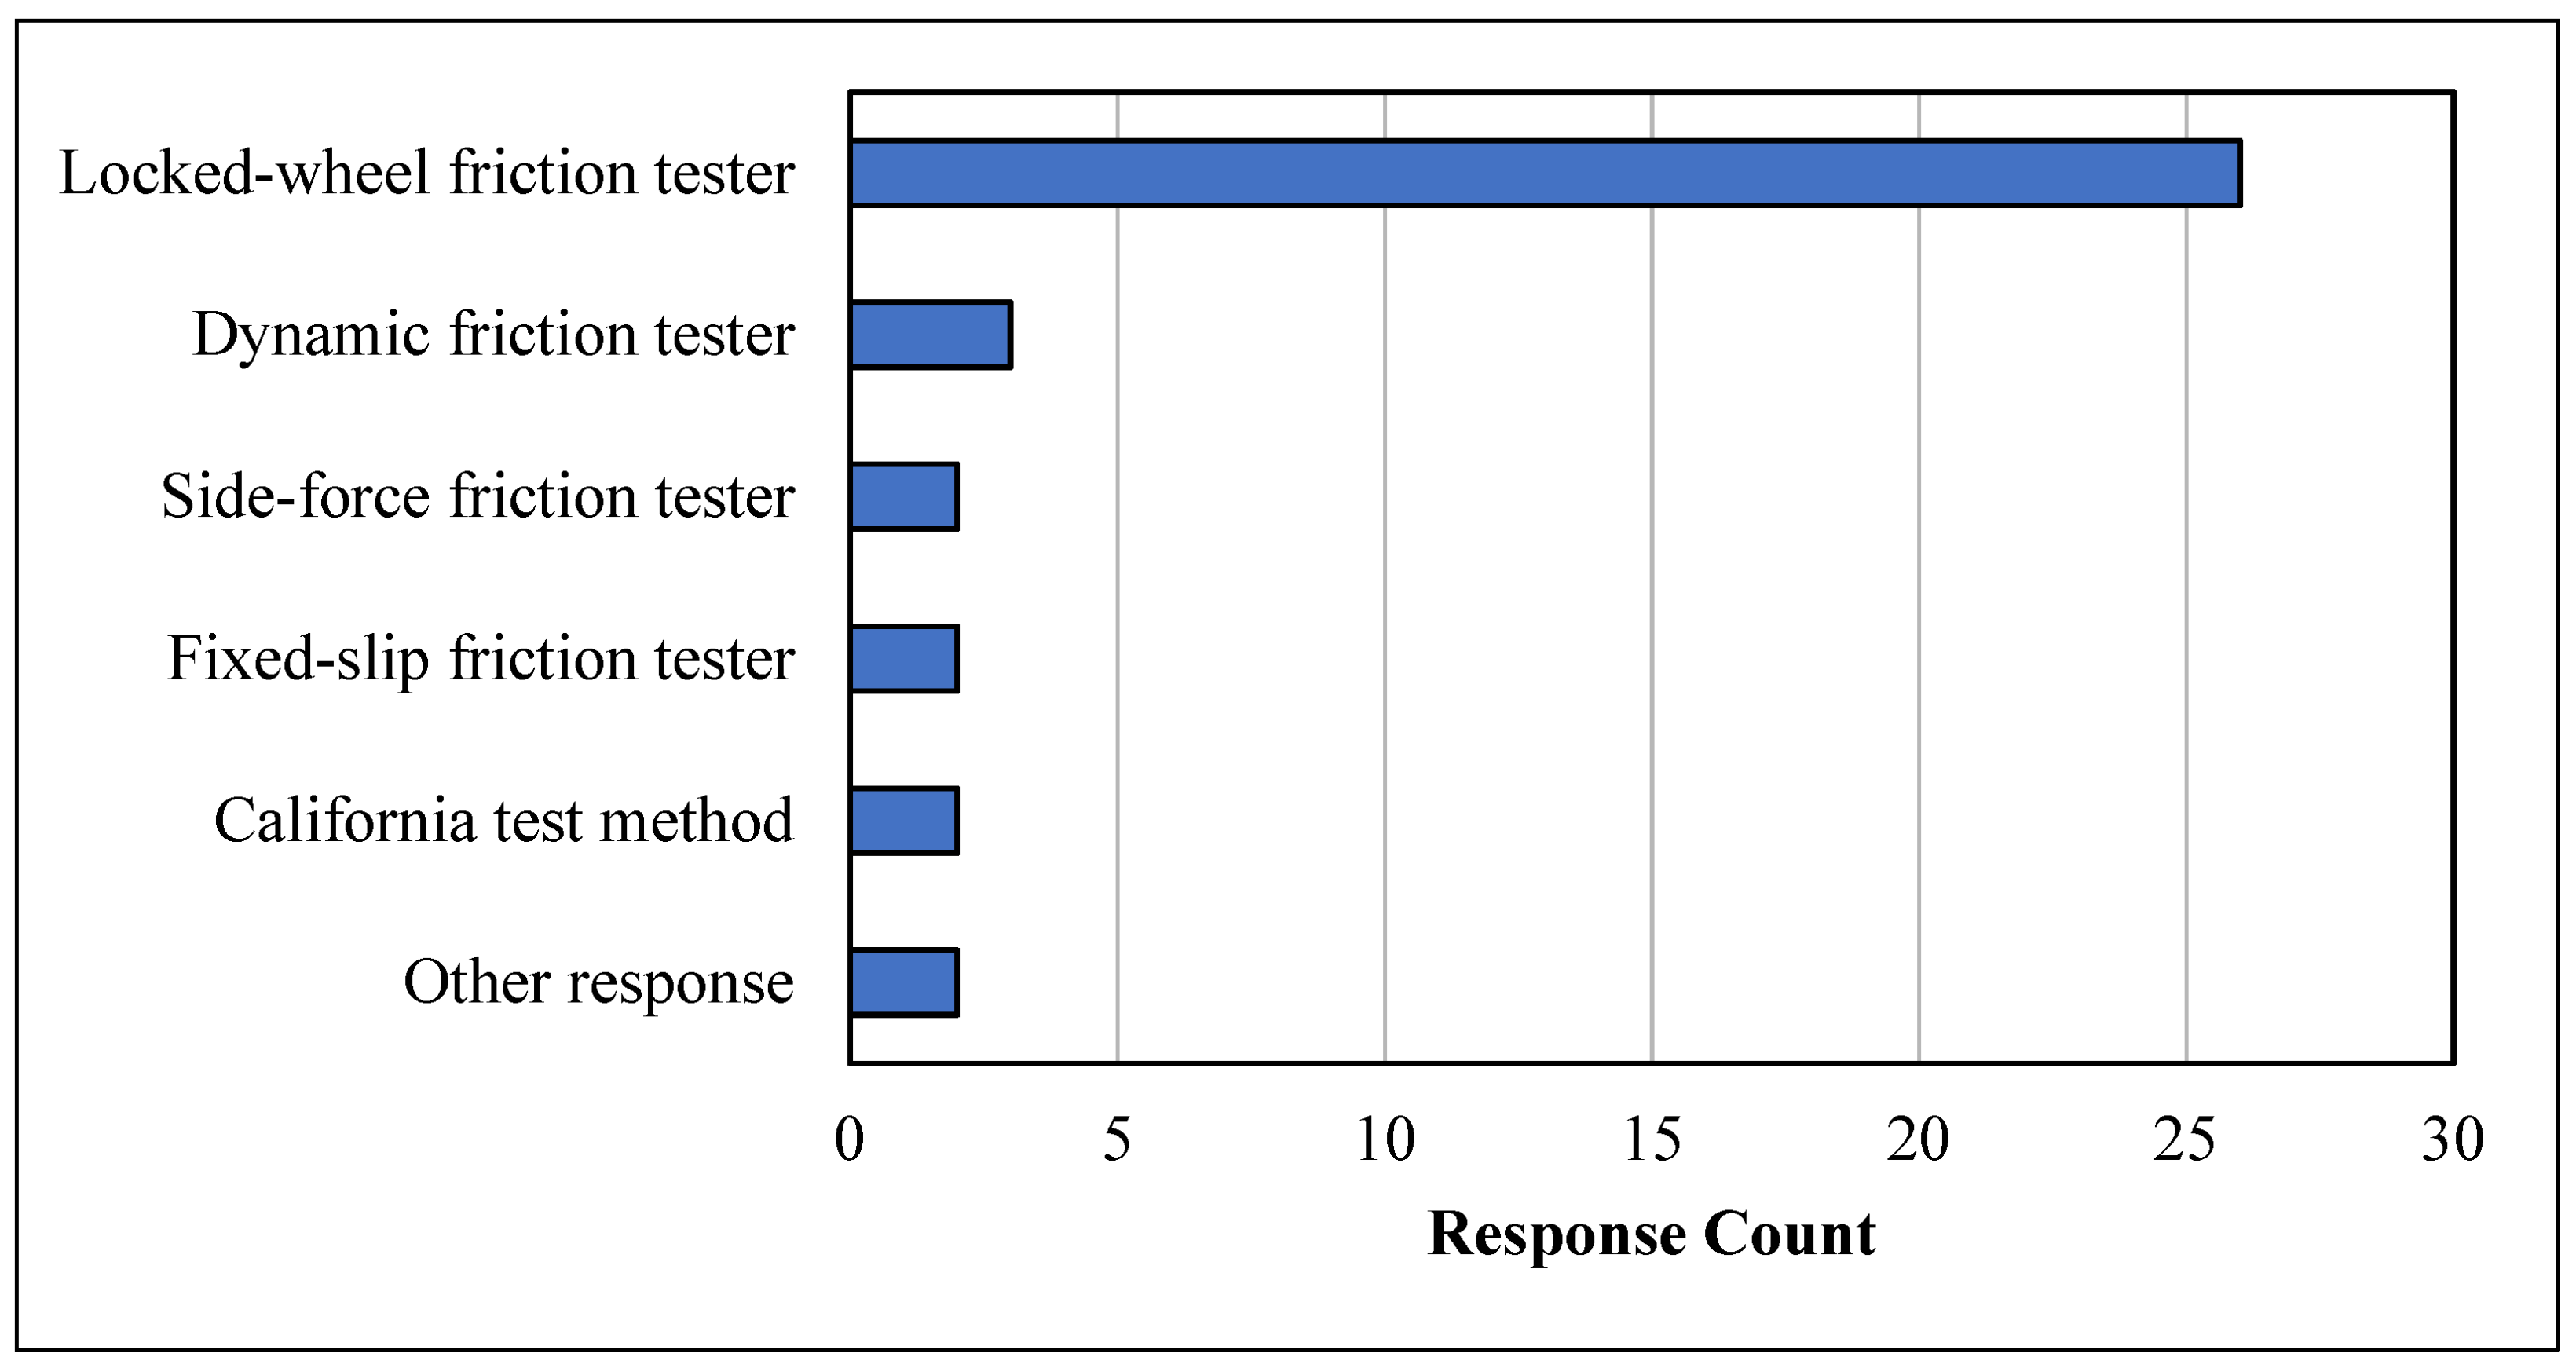
5.2. Friction Testing and Data Collection

Data collection is a key component of an effective asset management system. When it comes to pavement friction, limited standards and testing are available for measuring the skid resistance levels on roadways. The results of the current survey reveal that quite similar practices are followed by state DOTs for pavement friction testing protocol (see Figure 4). With the exemption of Nebraska, North Dakota, and Colorado participants, 26 state DOTs (90%) reported using the locked-wheel friction tester [25]. For decades, locked-wheel testing has been the most acceptable friction testing method because it measures pavement friction response accurately and directly. It also represents one of the high-speed measurements which is practical for a network-level data collection process. The locked-wheel tester can be operated using either smooth or ribbed tires. According to the practice of state DOTs, 16 states use the ribbed tire, 7 states use the smooth tire, and 4 other DOTs use both types. However, the locked-wheel tester provides some limitations, as it applies mainly on straight segments and within a specific sample length and operating speed [16]. The friction measurements from a locked-wheel tester may not be valid on segments with high degrees of curvature. In addition, the locked-wheel methodology is discrete in nature and cannot provide a continuous format in measuring changes in the friction values on the road network. As a consequence, other methodologies, such as continuous pavement friction measurements (CPFM), were established to monitor the changes in friction levels along roads continuously, especially through tangents, curves, and intersections. The CPFM was initiated by road authorities in European countries, as well as New Zealand, and has become a common practice in Australia and some airport authorities in the U.S. to measure friction on runways. That is why some state DOTs started to integrate other methods, including side-force and fixed-slip, to adopt the continuous measurements and overcome the limitations of using traditional locked-wheel friction measurements. However, such developments are noticed to be limited among participating state DOTs (see Figure 4). For example, the North Carolina DOT employed a new tool of testing including measurements with the locked-wheel trailer currently used by NCDOT, a Grip Tester, and a SCRIM (Side-Force Coefficient Routine Investigation Machine [26]. Other responses were received from the Arizona DOT, where they use the Dynatest 6875H Highway Slip Friction Tester (HFT), which can map friction values continuously at very short intervals [27]. In Ohio, visual and tactile subjective evaluations may be applied if the 64.4 kph (40 mph) speed of the locked-wheel tester cannot be operated.
In terms of equipment ownership, 25 state DOTs (79% of participants) use their own friction devices to collect pavement friction data. These 25 DOTs were asked if they calibrate their devices, and their responses were affirmative. Those that do not own the friction testing equipment mainly hire a contractor to perform the friction testing. The data collection frequency was noticed to vary among the states, as shown in Table 4. Collecting the data annually is found to be observed for nine DOTs, while the friction data are collected as requested by six DOTs. Other DOTs collect the data on a frequency range from two years up to six years depending on road classification (i.e., the higher the road class is, the more frequently the friction data are collected). Some DOTs, such as Colorado, obtain friction data only through sponsored researchers, while the California DOT mentioned that the friction data are infrequently collected. With all the previously mentioned practices of data collection, the participants were asked if they maintain a database for pavement friction values, and 11 state DOTs responded “negative”. This is due to either the limited practices of pavement friction management or the reactive approach followed to address locations with higher monitored friction-related crash rates. Another possible interpretation for the lack of such a database is the fear of tort litigation. Pavement friction is a safety concern, and some agencies may not have the capability to update their friction database in a timely manner. At some locations on the road network, pavement friction can change very quickly. With such dated friction databases, these agencies might be claimed liable for friction-related crashes.
The last aspect raised for data collection is testing the pavement friction on specific road characteristics. As previously mentioned, curves, ramps, and intersections display higher friction deterioration rates due to the frequent stopping and slowing down of traveling vehicles as well as the additional forces applied to the vehicle. Hence, the survey asked the participant if they collect friction data on these road facilities, and 19 (60% of participants) state DOTs responded “negative”. Eleven other DOTs mentioned that they collect such data by request when there is a safety concern. The Kentucky DOT integrates a particular mix design to enhance aggregate performance and they may test such mixtures on these specific road elements. The Arizona and Virginia DOTs combine the locked-wheel tester with the side-force equipment to test the pavement friction on rams, curves, etc. The Indiana DOT collects pavement friction data on bridge decks regularly.

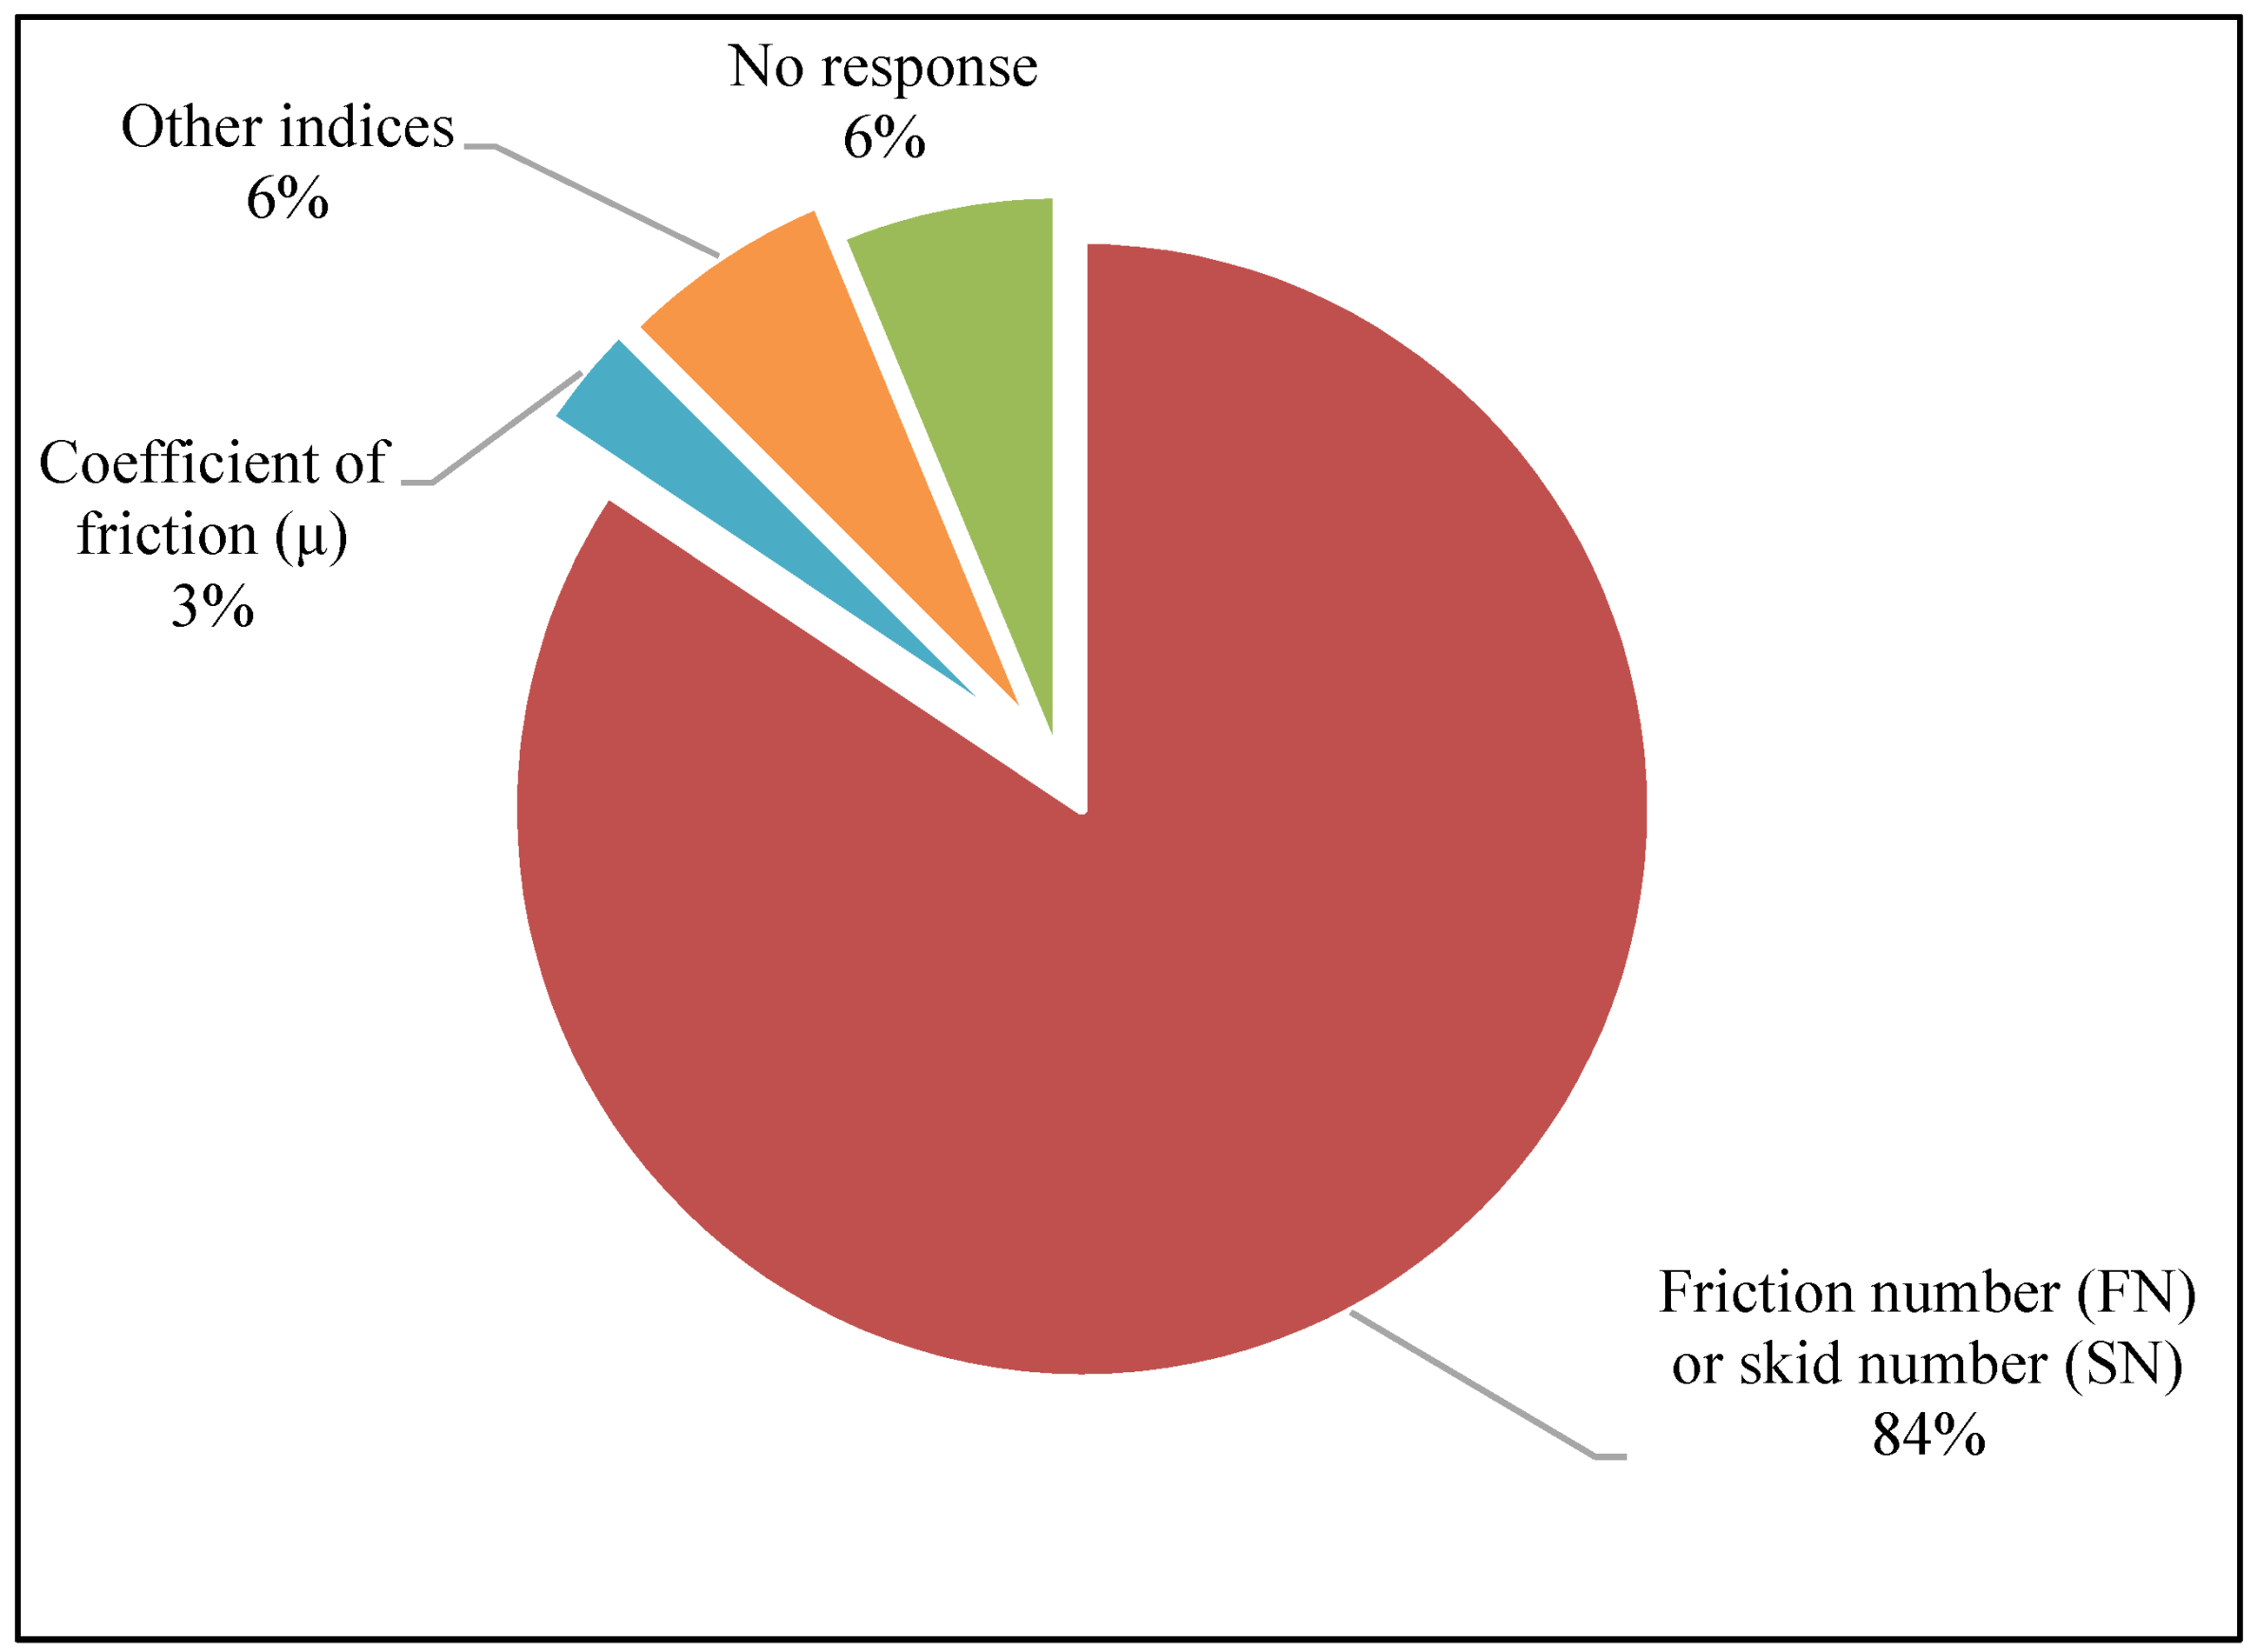
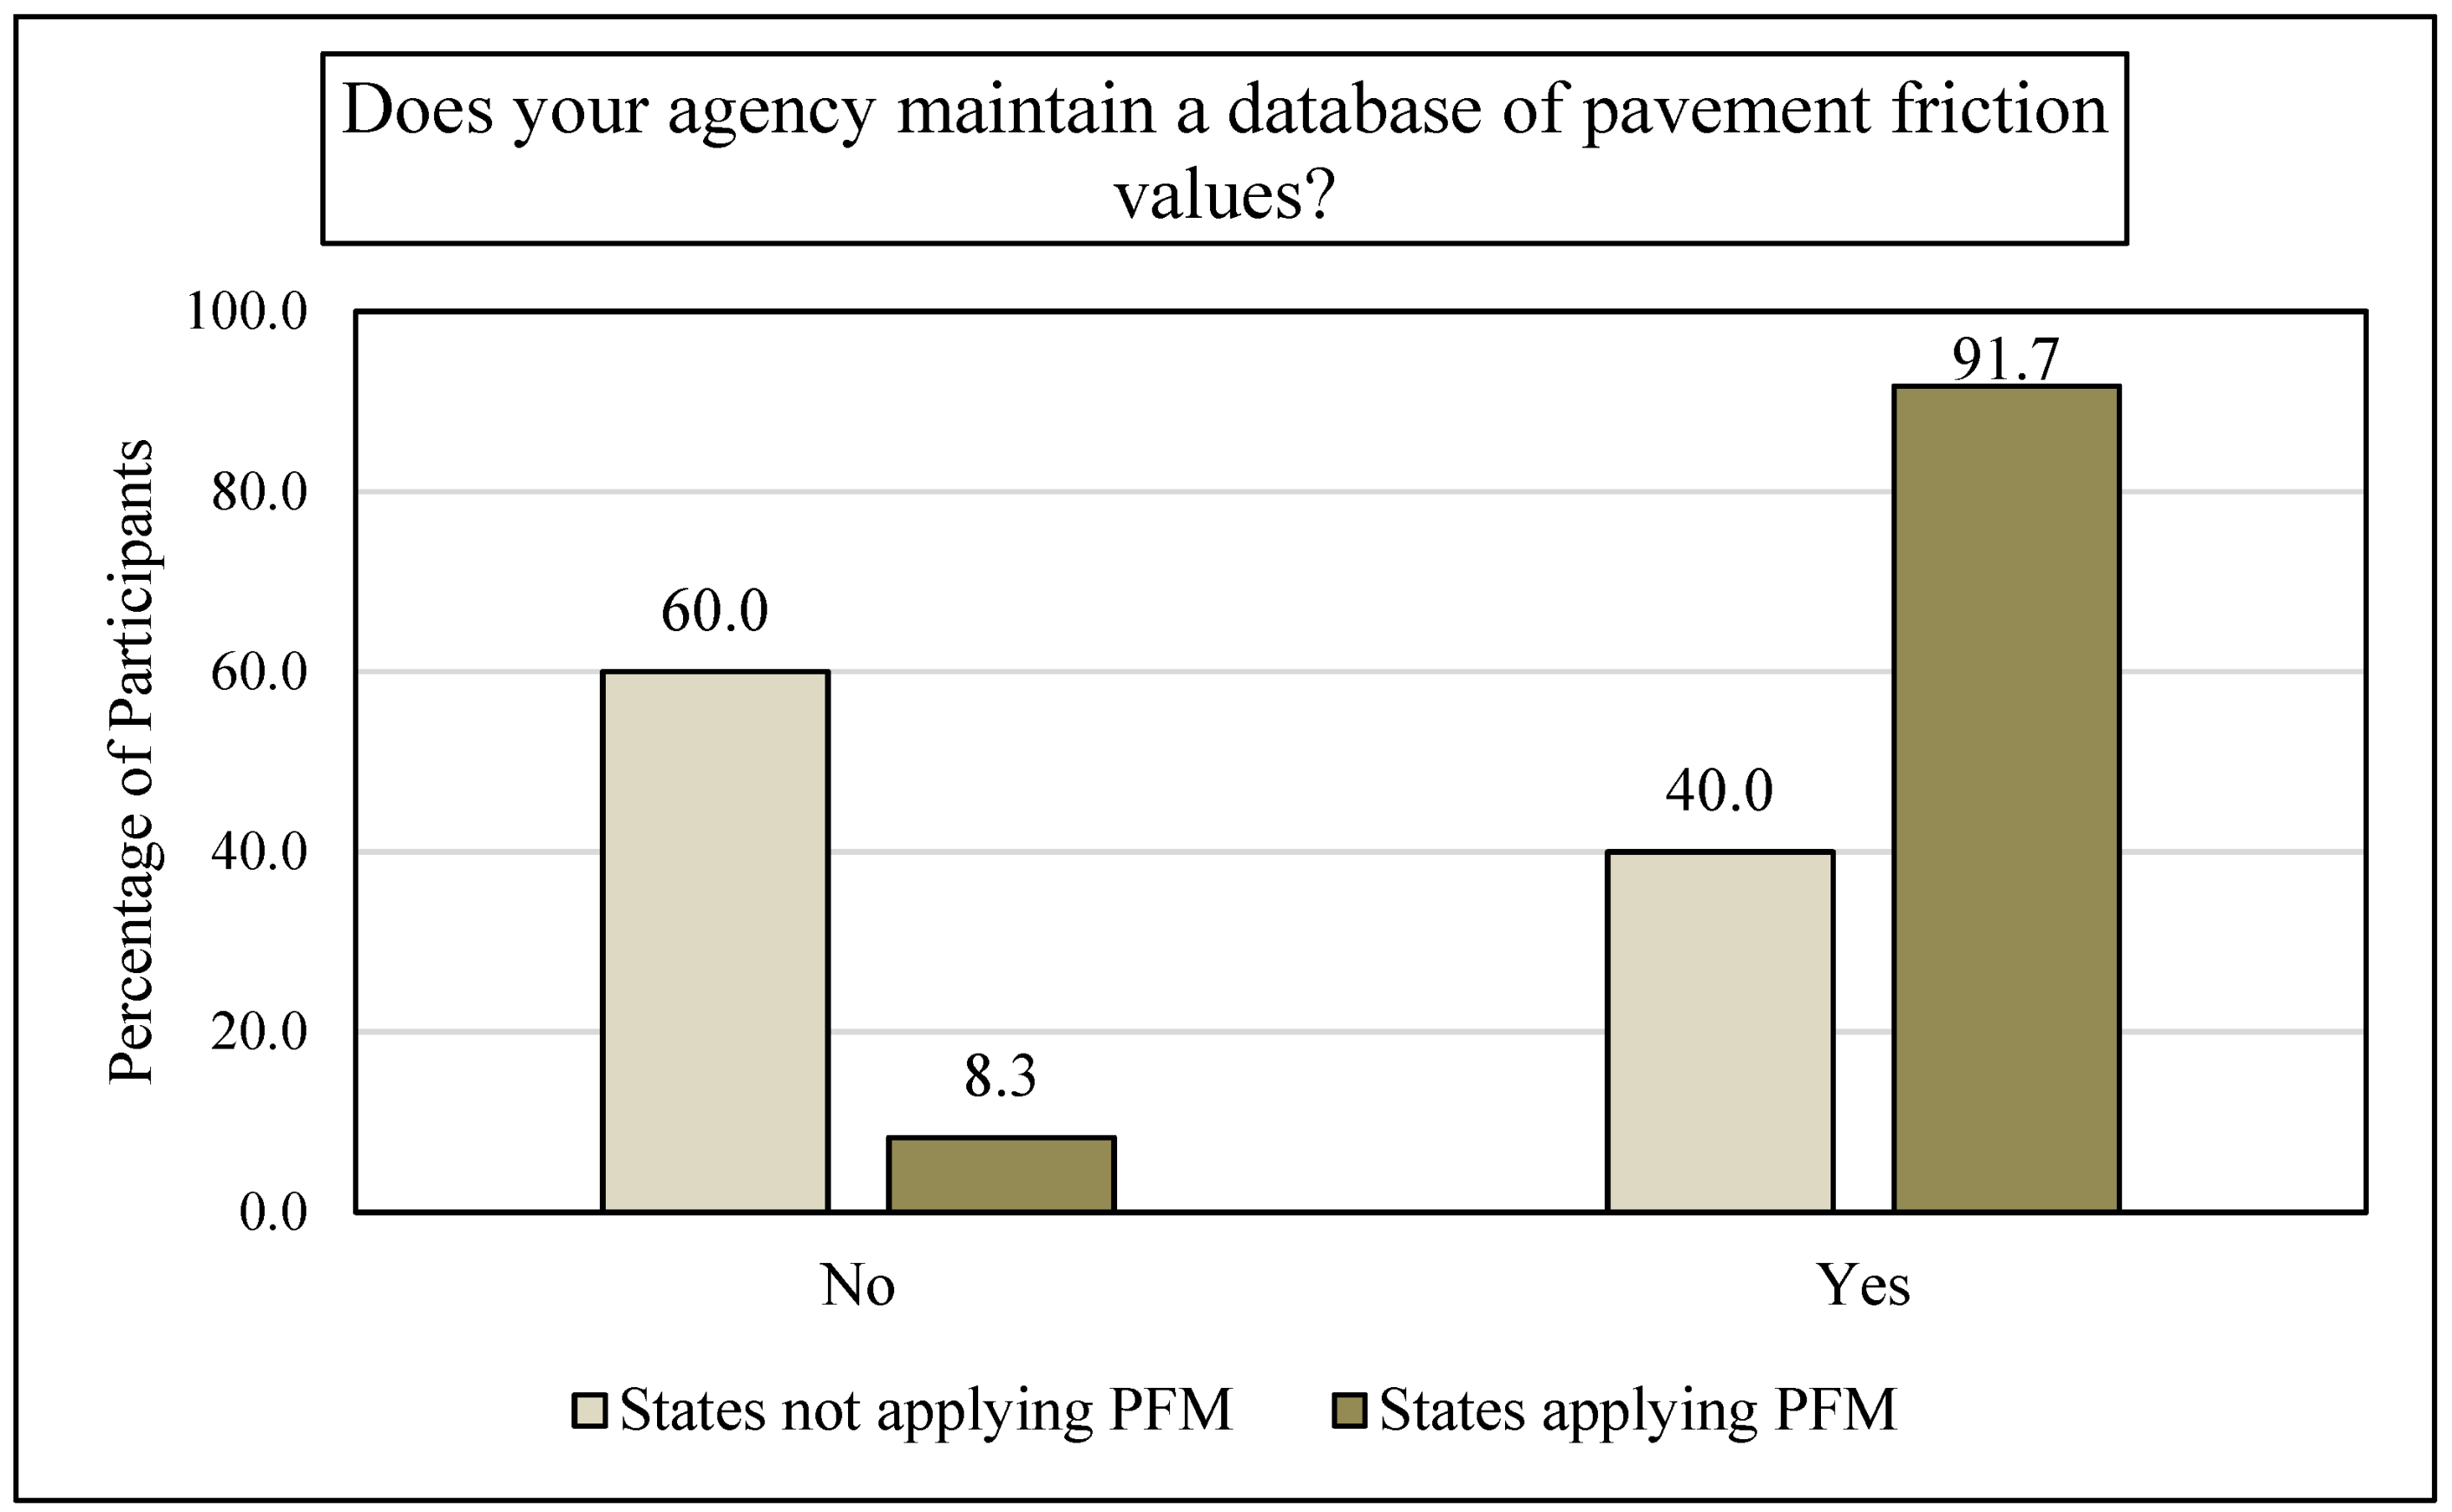
5.3. Performance Measurements

In order to employ a proactive management for pavements, highway agencies must assess actual pavement conditions and forecast the future performance of the pavement asset so that multi-year maintenance plans can be developed. For pavement friction, there are few performance indices that describe the friction level. The friction number (FN), also known as the skid number (SN), is found to be the most applied index by state DOTs for describing the statewide friction performance (see Figure 5). This is due to the use of the locked-wheel tester, which mainly measures the FN value.
In general, friction deterioration occurs under many effects, including environmental effects and traffic applications, years after opening the road to traffic [17]. The survey asked state DOT participants if they developed a performance model describing the deterioration of pavement friction over time. Only two state DOTs provided some statistical equations that can predict friction values. The majority of state agencies do not consider any future predictions of the pavement friction to proactively consider a maintenance plan. This links with the current practices of addressing mainly the road with elevated crash rates and monitored friction-related issues.

5.4. Friction Demands and Categories

Another profound step in managing the pavement friction effectively is to determine the friction requirements for each section of roadway. Friction demand is described as the amount of friction required on the pavement surface to achieve safe driving maneuvers without slipping or sliding. Two friction categories are recommended to examine: the investigatory level and intervention level. The investigatory level is when the skid resistance reaches a low value that must be monitored to assess its effectiveness on crash rates. It is used to plan for some preventive and restorative treatment actions. The intervention level is the lowest acceptable friction value at which an agency must take immediate corrective action. The survey asked the participants if state DOTs consider minimum friction values as thresholds for maintenance. Excluding the “no response” from the South Carolina and Nebraska DOTs, only five state DOTs (16% of participants) consider minimum friction values. Table 5 lists the minimum friction values derived from the locked wheel tester; the intervention level commonly ranges from 40 up to 49 for ribbed tires depending on the testing speed. No state DOTs mentioned investigatory levels considered to address the causes of low friction demands or the plans to overcome the defects. This is again consistent with the reactive approach followed by state DOTs to address only friction-related safety issues. The criteria of the defined intervention levels include pavement conditions, geometric features, functional classification, and speed limits.

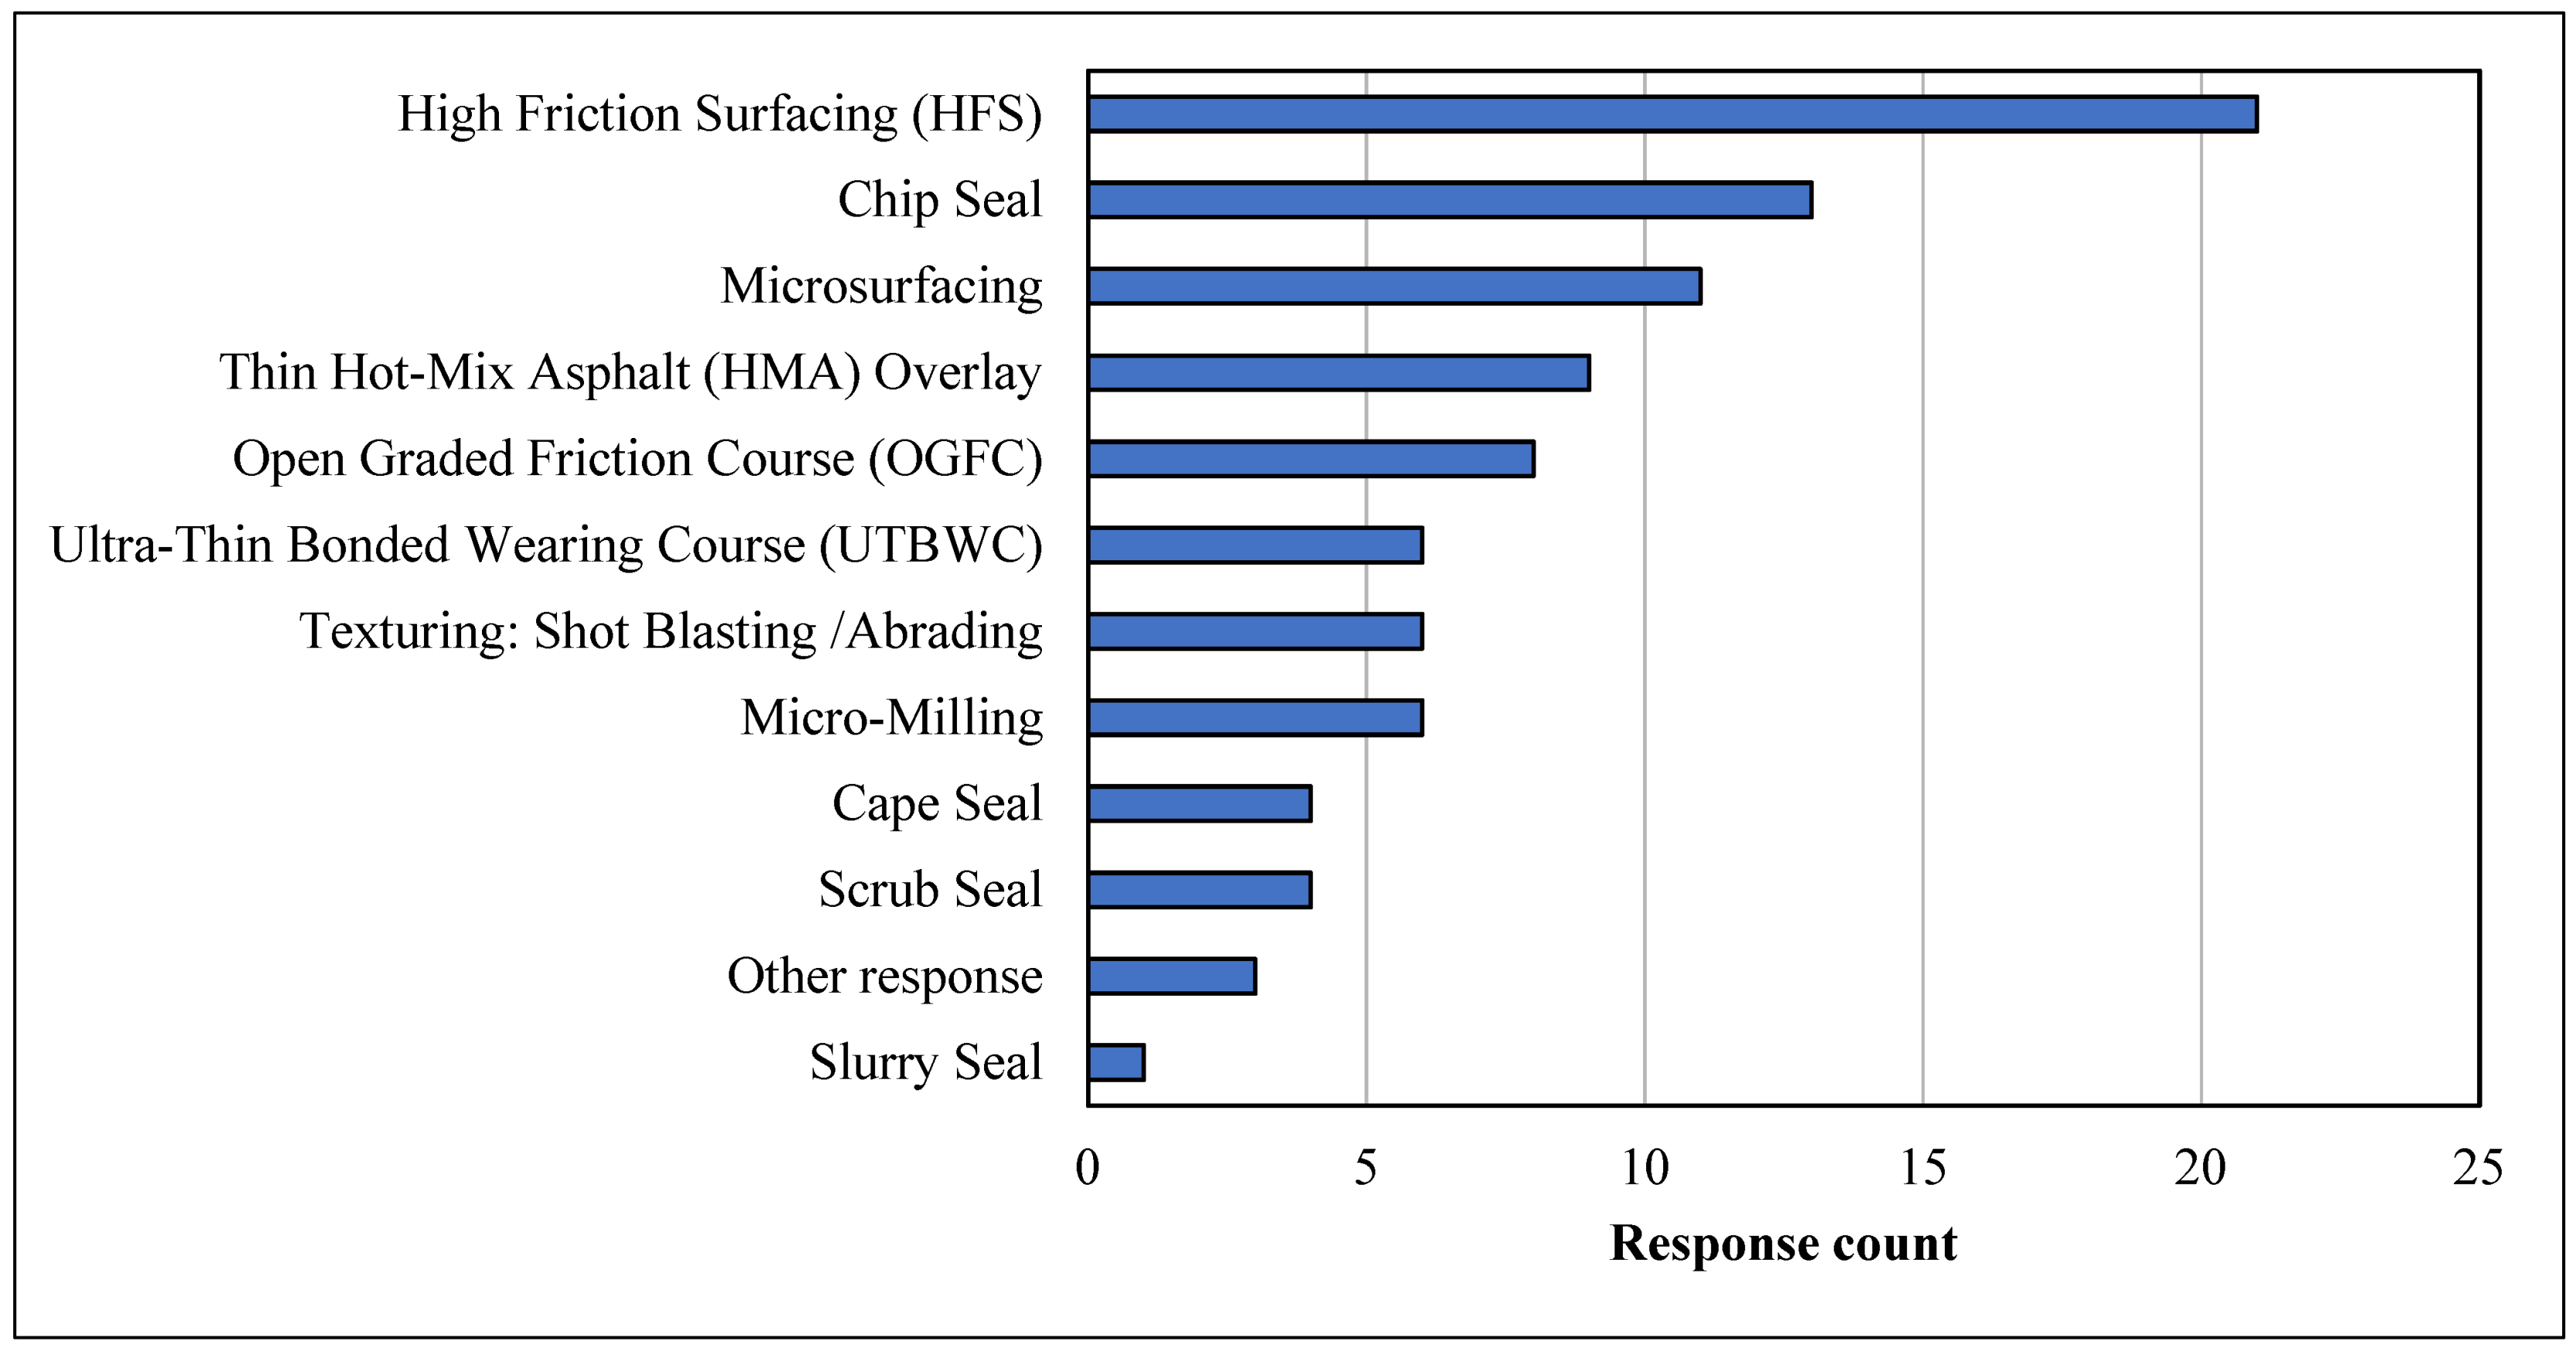
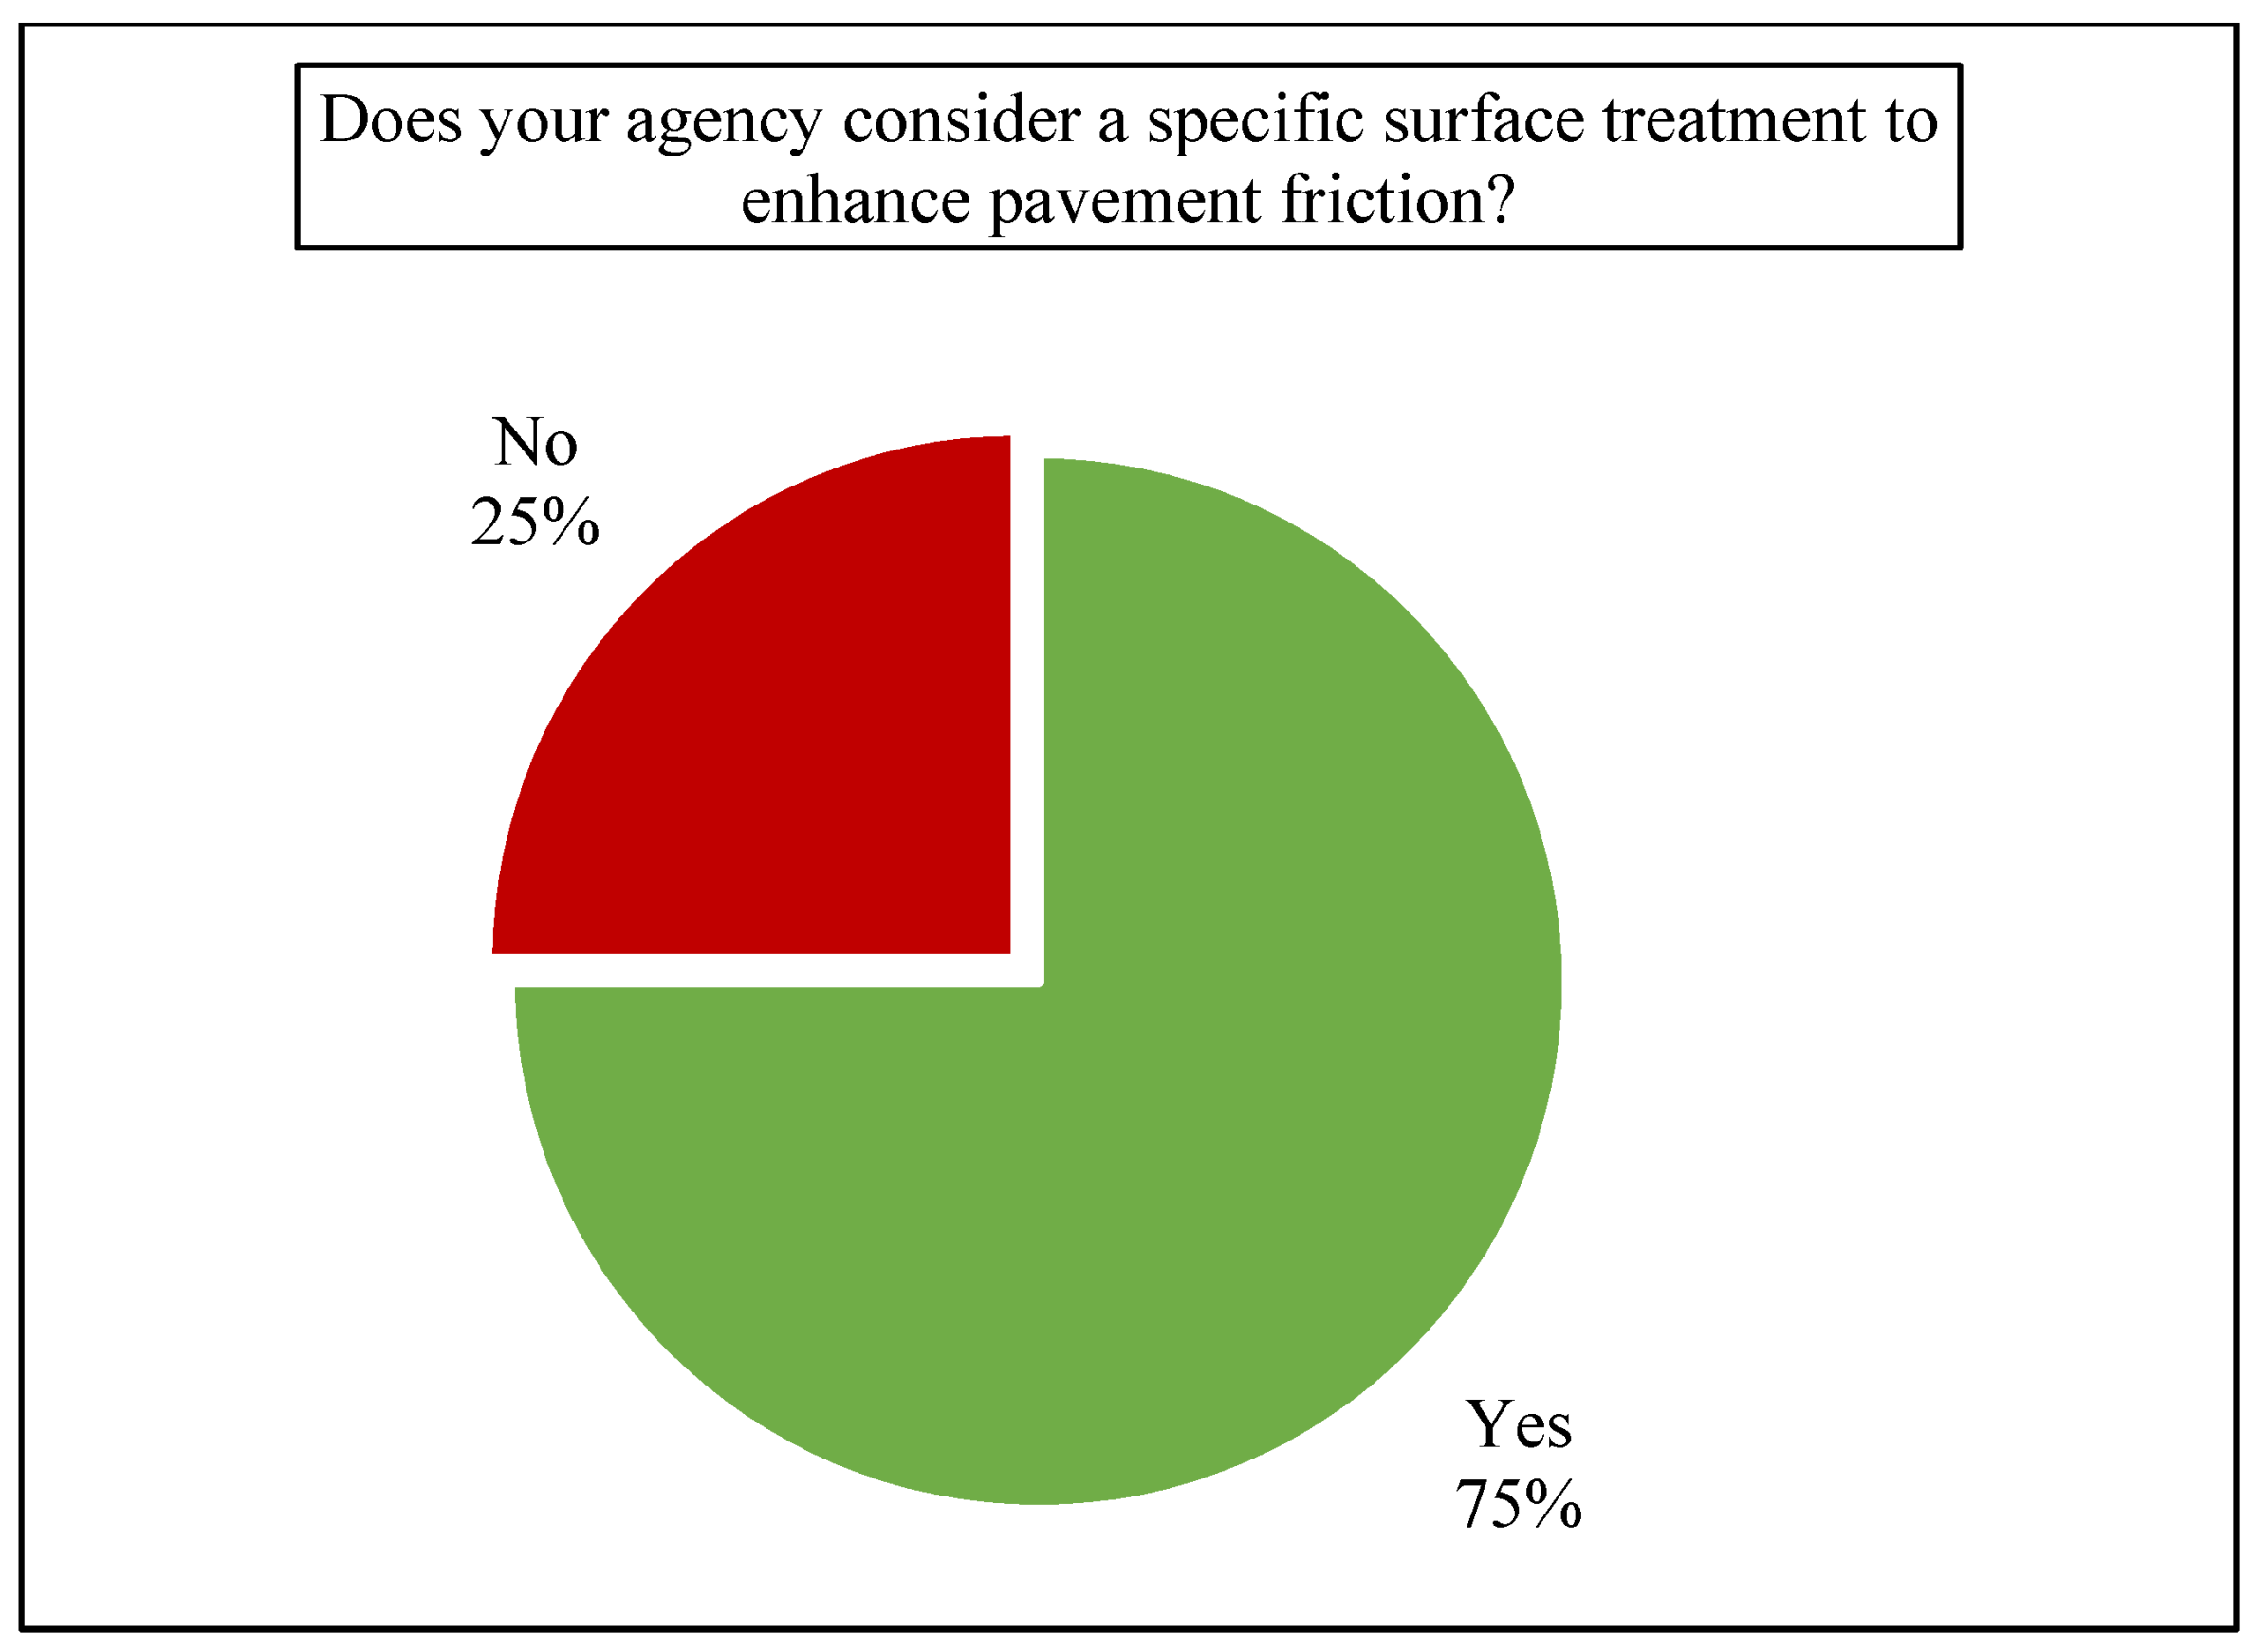
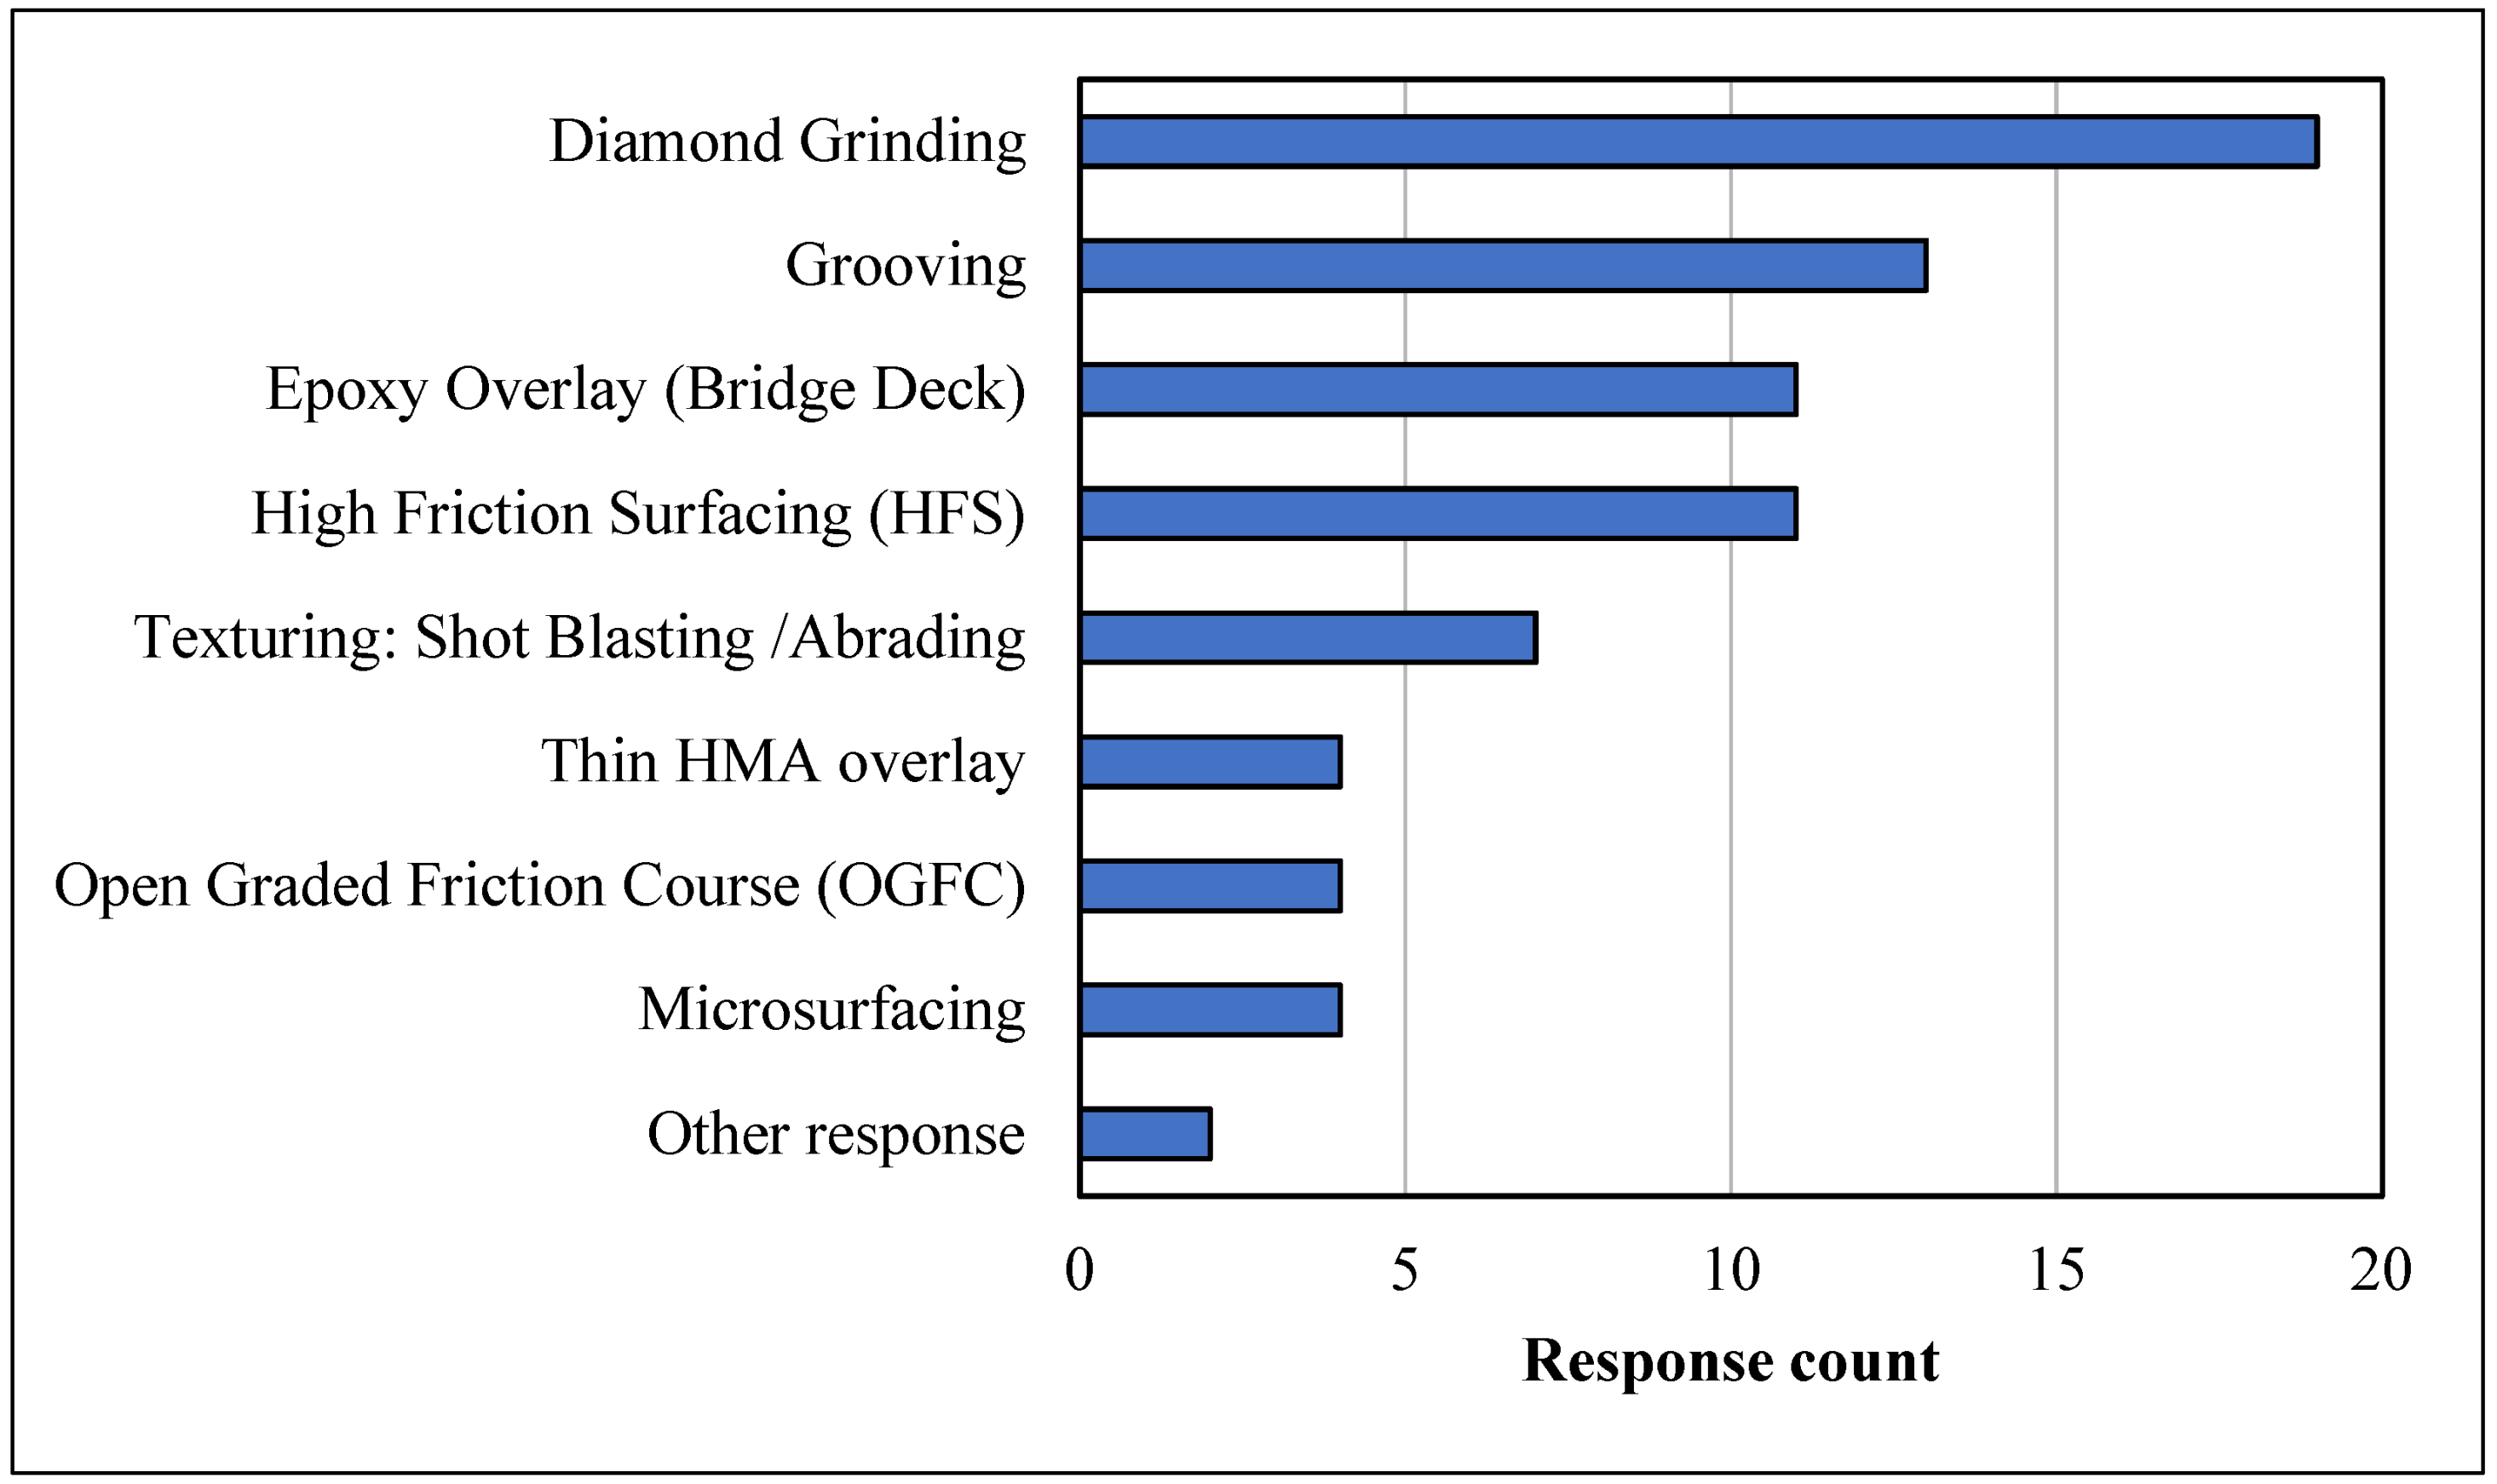
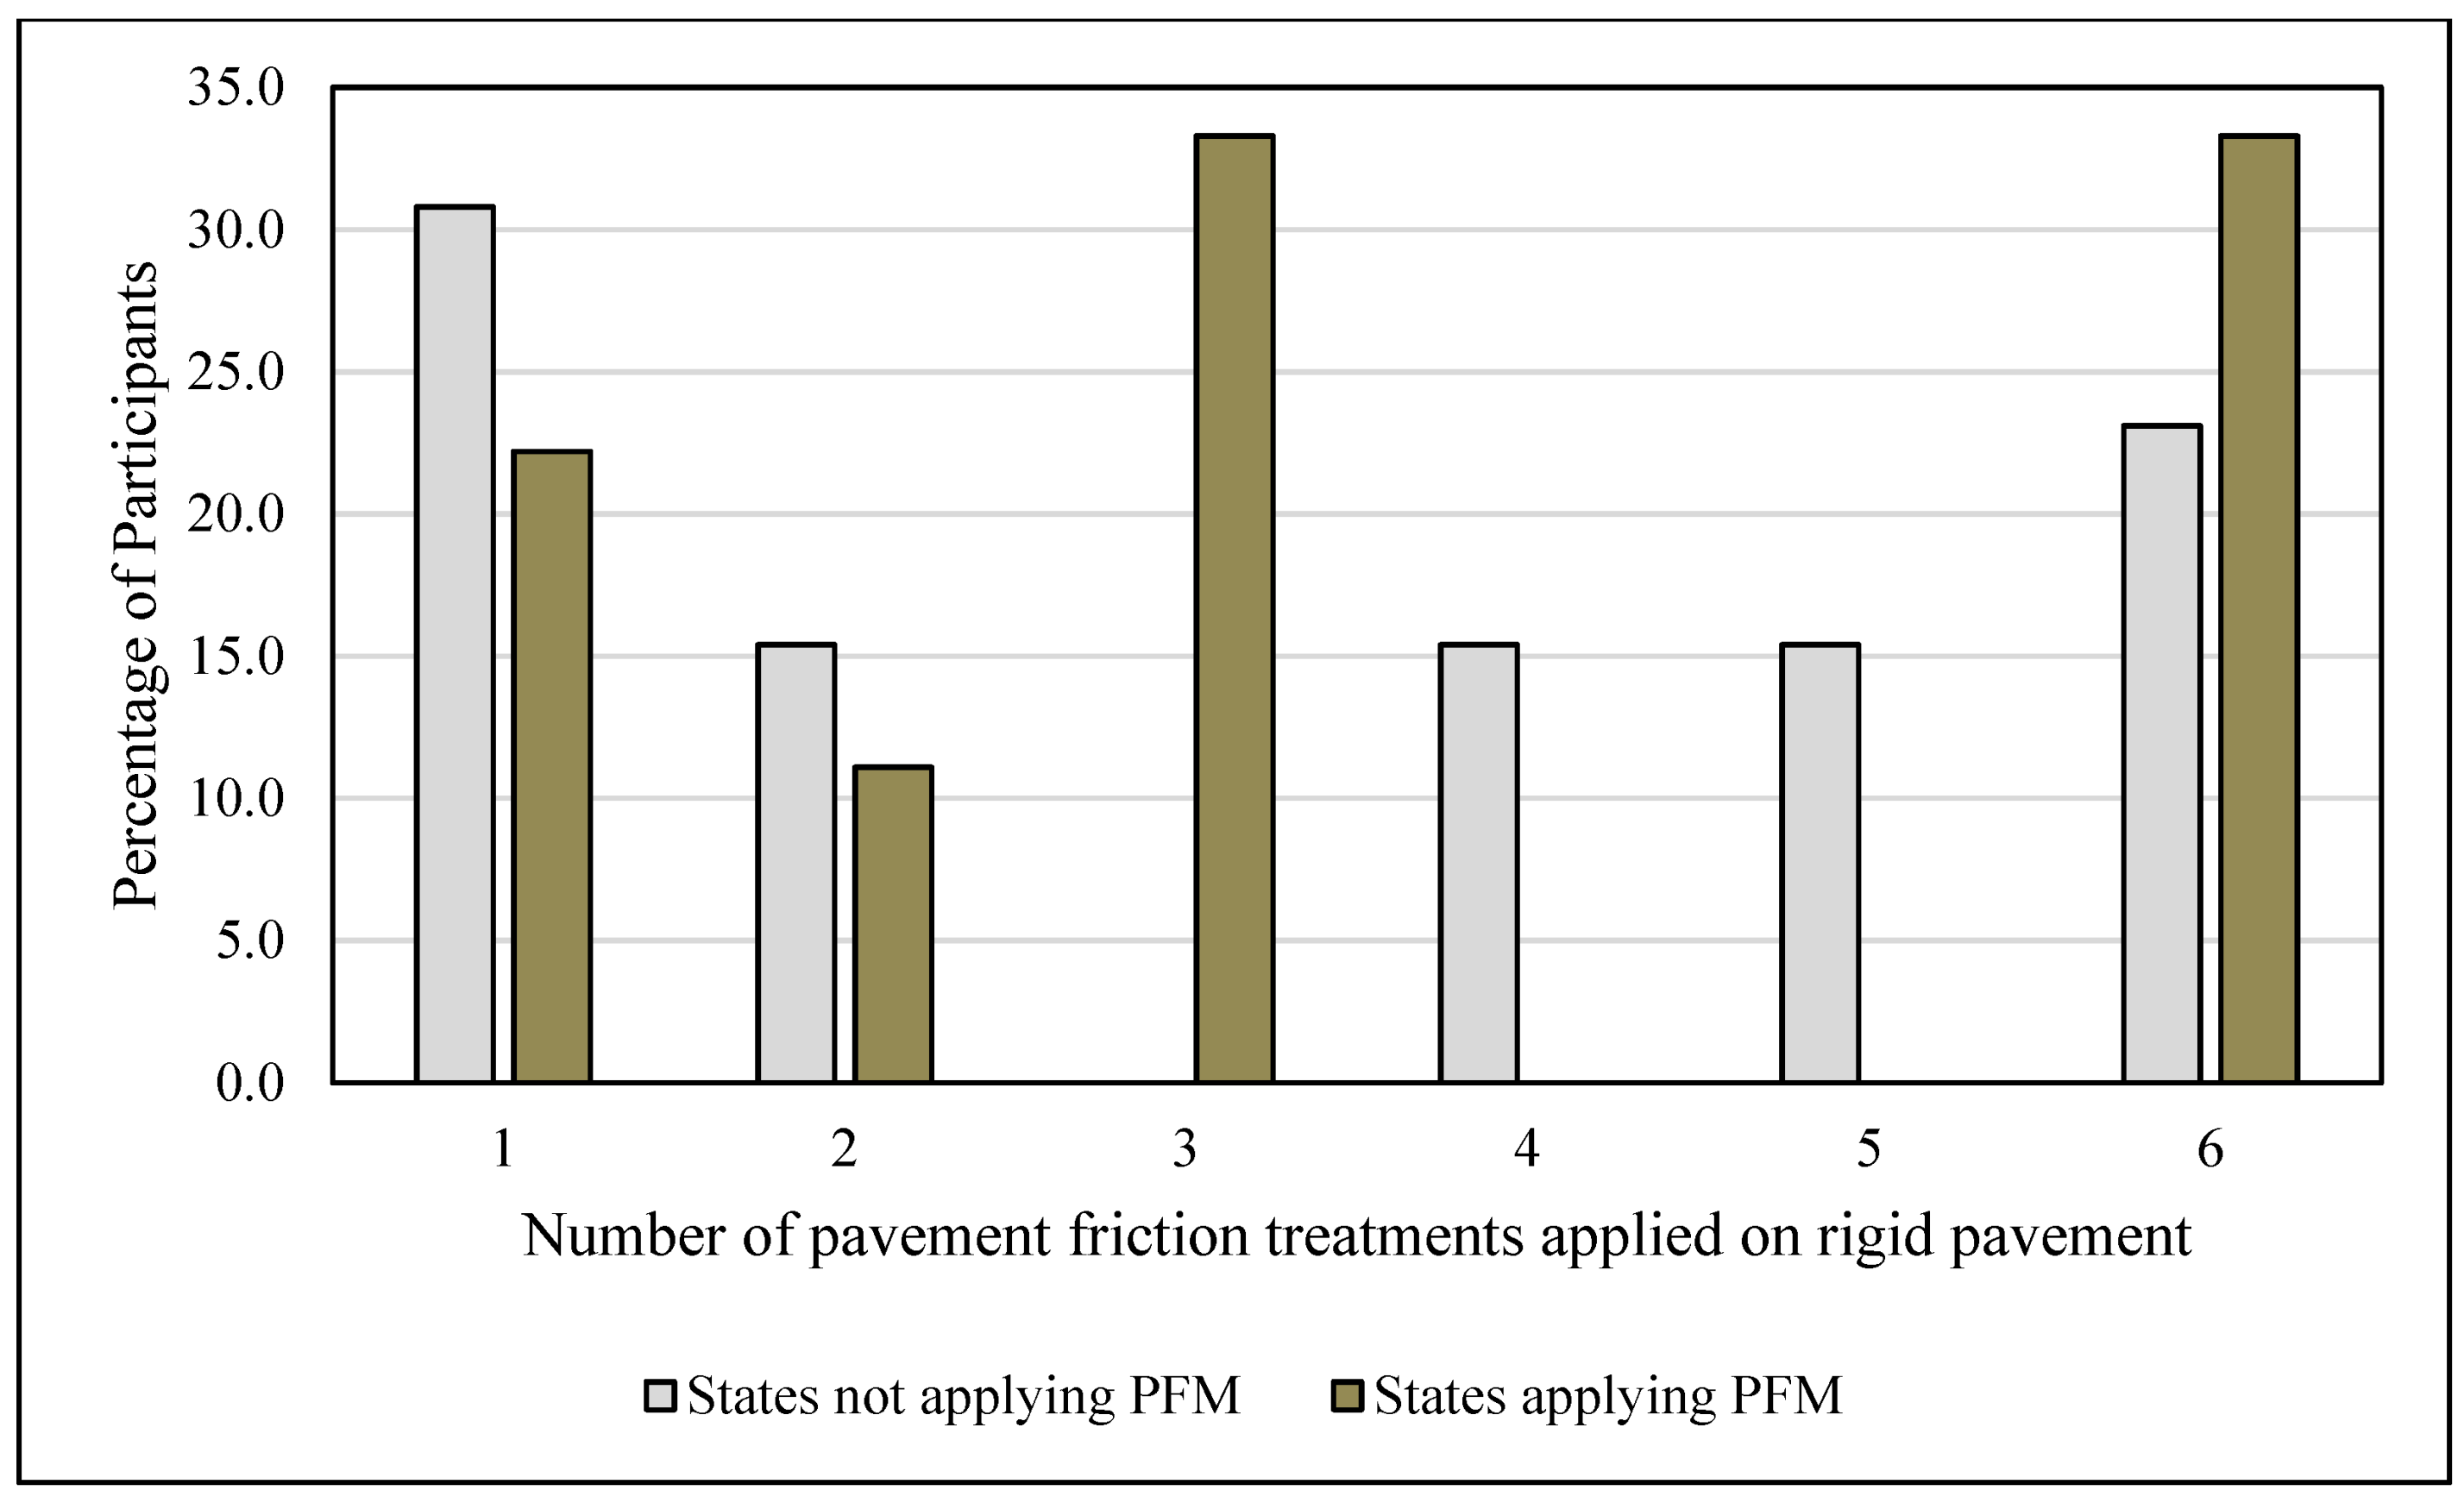
5.5. Treatments and Decision Making

Surface treatments are essential to enhance the surface texture and improve the friction capabilities of pavement. All state highway agencies are required to improve their road safety by using suitable treatments. State DOTs are expected to consider different types of pavement treatments depending on their own practices and experiences. For this topic, the survey asked state DOT participants if they consider specific surface treatments to enhance pavement friction, and the results are shown in Figure 6. Eight state DOTs (25% of participants) do not apply surface treatments specifically to address the pavement friction. However, surface treatments are still applied to maintain the pavement condition as part of the state PMS.
There are special treatments considered for pavement friction depending on the type, asphalt or concrete pavement. In terms of treatments for each type, the survey collected the statewide practice of the participating state DOTs. Figure 7 summarizes the types of surface treatments for flexible asphalt pavement. First, 21 state DOTs adopt HFST as a major treatment, and it is one of the most commonly applied treatments among state DOTs. Most participating state DOTs that apply friction treatment on asphalt do not use a single type. Rather, at least two different types are considered for roads depending on the friction needs and expected performance—in other words, the local experience. The Kansas DOT reported that they have kind of a decentralized practice and they follow a field evaluation process to select the suitable treatment because it is a rare situation having friction-only problems. However, if there is any problem related to friction, they prefer choosing HFST, as well.
For rigid pavement, Figure 8 shows the common treatment types employed by state DOTs. Diversified practices are noticed for maintaining the friction of concrete pavement, but generally, diamond grinding is the most common applied treatment, which was proven to significantly enhance the macrotexture characteristics of pavement [28]. Another observation is that HFS is not very common on rigid pavement compared to its application on asphalt pavement among state DOTs. Only 11 state DOTs reported their use of HFST on rigid pavement. Compared to flexible pavement, almost one half of the state DOTs responded that they apply HFST on rigid pavement. Moreover, similarly to flexible pavement, more than two treatment options are considered on rigid pavement in each state DOT. Other responses were received where the Nevada DOT applies asphalt crumb rubber overlay [29]. The Alabama DOT combines diamond grinding and grooving for friction maintenance on rigid pavements.
When it comes to decision making, several criteria can be considered to select the appropriate treatment and maintenance strategy. It starts with knowing the effectiveness of each treatment in different conditions. This can be achieved by monitoring the historical post-treatment performance of friction based on the friction index. The survey asked participants if they adopt such methodologies to correlate between friction values and coarse aggregate characteristics of surface treatments. The majority of the participating state DOTs (27 responses) did not develop such correlations. The Maryland DOT implied that the consequence of each treatment is defined and integrated in the PMS decision trees. However, they are currently working on developing such correlations. The Kentucky DOT mentioned that aggregates with higher acid insoluble content or higher MgCO3 dolomitic aggregates were proved to provide higher friction. The last question related to decision making was about the main criteria/performance considered to enhance the overall friction demand on the road network. The results of this question are shown in Figure 9. It is still evident that safety is the main motivation to select and address the pavement friction. Only three DOTs (Kentucky, Maryland, and Texas) develop a multi-year maintenance plan for friction. On the other hand, other DOTs do not think that dealing with pavement friction is conducted through pre-defined criteria of asset management. Nevada DOT representatives, for example, believe that it is just internal contract-based maintenance projects. Other responses were received implying that friction does not drive a standard agency policy, nor is it considered on its own. Rather, it is mainly addressed within reactive activities to fix the friction demands.

6. Statistical Analysis

The first results of the statistical analysis show the correlation between the different practices of managing pavement friction and the overall policy of management. The correlation results are shown in Table 6. Positive correlations are found between the PFM application and other practices. The interpretations of these factors imply that state DOTs applying a typical PFM as part of their asset management plan tend to have higher data volume of friction values, including a statewide database and data at specific locations with safety concerns (Crammer’s V = 0.172). On the other hand, states not applying a typical PFM tend to collect friction values at specific locations only as requested. In addition, state DOTs applying PFM are more likely own their data collection devices, including the locked-wheel tester (Phi = 0.254), and they tend to use several types of testing tires (Cramer’s V = 0.378). A minor association is found between collecting friction on specific locations, such as curves, ramps, and intersection, and the overall policy of managing friction (Phi = 0.119). This finding emphasizes that all state DOTs tend to collect pavement friction at these locations for safety concerns regardless of the PFM policy followed.
A strong association is found between the PFM policy and number of test sections required for measuring the pavement friction (Eta = 0.852). State DOTs applying a typical PFM tend to include a higher number of test sections per mile for the benefit of data accuracy. Moreover, state DOTs applying a typical PFM tend to maintain a database for friction measurements for the benefit of decision making (Phi = 0.509). A limited number of state DOTs consider a minimum FN value on roads. However, an association from the overall PFM policy tends to affect the consideration of minimum FN values (Phi = 0.289). No association was found between the overall PFM policy and the decision to treat pavement friction (Phi = 0.0). This implies that all state DOTs consider a surface treatment to enhance the friction performance of pavement at the statewide level or at specific locations as requested. In terms of the number of treatments considered by each state, state DOTs applying a typical PFM tend to include diversified treatments on the surface depending on the pavement type (for flexible: Eta = 0.2; for rigid: Eta = 0.503). Furthermore, there is a higher research interest in which state DOTs applying typical PFM systems tend to sponsor related research projects compared to those that fix the pavement friction as requested (Phi = 0.279).
A decision about the previously described relationship can be made based on a cut-off score equal to 0.50. Hence, three associations can be further investigated, which are the number of test sections per mile, maintaining database, and the number of friction treatments on rigid pavement. The association between the number of test sections per mile and the overall PFM policy is depicted in Figure 10. The DOTs that provided no response due to the limited practices are excluded from the analysis. Tests of normality were conducted on the percentage of responses using the Kolmogorov–Smirnov test. The null hypothesis states that there is no statistically significant difference between the values and the normal distribution. The results show that only the percentage of responses for states applying PFM are significantly different from the normal distribution (K-statistic = 0.345; df = 10; p-value < 0.001). Due to the violation of normality for one group, a non-parametric significance test was implemented using Mann–Whitney Wilcoxon tests. Although the results show an insignificant difference between the mean rank of the two groups of state DOTs (Z = −0.397; p = 0.691), state DOTs applying a typical PFM tend to use two test sections per mile as a standard number of test sections for measuring pavement friction. On the other hand, state DOTs not applying a typical PFM consider a more varied number of test sections depending on their needs. (For state DOTs applying PFM: skewness = 2.426. For state DOTs not applying PFM: skewness = 0.431.)
The association between the overall policy of applying a typical PFM and maintaining a database for friction measurements is shown in Figure 11. It is clear that state DOTs applying a typical PFM tend to maintain a database for the friction measurements and the corresponding geospatial data. This is important for the benefit of managing the maintenance plans and tracking the road network performance. The final association between the PFM policy and the number of treatments on rigid pavement is shown in Figure 12. The results reveal that a higher number of treatments are observed to be implemented by states following a typical PFM. The skewness of the number of treatments for states not applying a typical PFM is −0.44, which implies a fairly symmetrical distribution in the number of treatment applications on rigid pavement.

7. Current Merits, Limitations, and Potential Enhancements

In terms of pavement fiction programs, there is no doubt that all state DOTs are following the HSIP federal policy to improve the safety of their roadway networks through the “data-driven” approach. Based on the survey responses, most state DOTs value the importance of collecting and testing the pavement friction data in addressing friction-related issues. This can be derived from the diverse practices of friction testing, data collection, data collection frequencies, and performance indices. The discussion about the current merits, limitations, and potential enhancements is organized for state DOTs depending on their overall policies and implementation of PFM.

7.1. State DOTs Not Applying Pavement Friction Management

The asset management data do not merely describe the current condition of the assets; rather, they support the suitable means to act proactively to maximize the value of pavement performance. Hence, state DOTs not applying PFM techniques must be aware of the importance of planning the maintenance of surface treatments to enhance the safety performance of friction-related crashes. The lack of knowledge about the future condition of friction does not allow state DOTs not applying PFM to clearly identify the segments requiring early preventive treatments to maximize the benefits on both the economic and safety scales. As a result, a large amount of funds may be wasted on emergency maintenance interventions, which have been proved to be less effective than proactive decisions of preventive and corrective maintenance operations. To adopt the practices of PFM, several guidelines and recommendations can be followed through a typical pavement friction management system developed in this paper to address the friction needs and demands on road networks. The factors explained from the feedback of the current practices should be evaluated by state DOTs not applying PFM to secure plans for the best strategies and optimal timing of interventions relying on reliable pavement friction data, indices, performance models, and effective treatments.

7.2. State DOTs Applying Pavement Friction Management

State DOTs can seek multiple types of adjustments to enhance the current practices of managing pavement friction by state highway agencies based on the feedback received from the survey, as well as the literature search. In terms of pavement performance modeling, the development of more representative models is recommended to predict the future conditions. Such models can be obtained using the historical performance of pavement friction. The performance of skid resistance can also be determined from other correlated performance indices. In some studies, the skid resistance was correlated with the pavement roughness. The measured average SN was seen to be significantly lower on relatively rougher pavement sections [30]. Another study was conducted to show the relationship between the pavement friction trend, in terms of side-force coefficient and traffic levels in Equivalent Single Axle Loads (ESALs) [31]. The results show that pavement friction decreases due to the cumulative traffic while the International Roughness Index (IRI) increases over time. Moreover, multiple proofs confirm that the number of crashes on wet pavement increases as the skid friction values decreases. Thus, developing models with climate categories is essential to calculate the pavement friction and to predict the future performance. In light of this, state DOTs can adopt several modeling techniques developed in studies to predict the friction number from the asphalt materials properties, age, climate, and the traffic conditions [32,33,34].
HFST treatments have proven to be among the best surface treatments for pavement friction. HFST provides a high degree of skid resistance [35]. This treatment is very effective especially on asphalt roads at high risk of crashes. It is important to choose suitable surface treatments depending on several criteria such as the traffic volume, weather, and the cost of these materials. Another study shows a comparison between some surface treatments such as chip seal and slurry seal and some other treatments to evaluate the effectiveness of these treatments and investigate the long-term variation in friction. The statistical results confirm that slurry seal causes a great and significant friction number [36]. Pavement treatment is a proactive step to extend the life and the effectiveness of the pavement without adding any structural support.
With the mentioned practices of selecting treatments, it is evident that simple and subjective processes are currently followed for selecting treatments. It is necessary to apply the right treatment to the right road at the right time to avoid any unnecessary expenses [37]. The effectiveness of decision making can be enhanced through integrating multi-criteria selection analysis, especially with the recent involvement in the artificial intelligence and machine learning approaches in all asset management systems. Such applications have been applied in managing the pavement friction to link the friction with safety and pavement performance [38,39,40]. The last important aspect in decision making is relying on practical friction demand levels to both investigate and respond to the pavement friction needs.
Another major factor that should be included in the state DOT practice is the time and the season of collecting and testing pavement friction. To account for the worst scenarios, state DOT pavement asset management practitioners must be aware of the significant effect of the seasonal changes of pavement skid resistance due to the seasonal changes in temperatures, snowfall, and rain seasons. Although the statewide practice collected in this study does not show an exact time or a preference for collecting the pavement friction data, the literature shows that United Kingdom and the USA usually conduct friction testing on road networks during the summer months [26,41]. This can be effective for skid resistance since the dry pavement surface friction is at its lowest. However, other agencies may consider testing the friction after seasonal raining conditions in the summer, when the skid resistance could be raised to its double value. Such issues must be raised and discussed in detail, taking into consideration the safety implications for traffic crashes while developing an effective PFM. The literature shows that several research studies were conducted to address the effect of seasonal changes in friction and skid resistance on the safety of traffic. In one study, McDonald et al. [41] found a significant relationship between temperature and skid number. Another study was conducted by Amjadi et al. [42], and it was found that the safety performances of single-vehicle run-off-road crashes on flexible pavement are significantly different in warm and cold seasons. Therefore, it may not be enough to conduct and collect the friction testing data during the summer with heavy rain seasons with the best conditions of higher skid resistance. State DOTs and highway agencies should consider the worst conditions of the skid resistance of pavement surfaces.

8. Conclusions and Recommendations

In this work, we investigated the profound principles and methodologies of pavement friction management through the current practices of state DOTs and a literature review. The results received from the survey of practice highlight the practical policies and propose future enhancements to maximize the value of pavement assets and promote safety. The survey results indicate that most state DOTs do have some form of PFM and related programs, ranging from simple and subjective techniques to a very sophisticated system that includes routine testing, multi-year planning, and research related to friction treatments. However, the majority of their policies do not follow a standard management system or define solid maintenance targets and plans. State DOTs test pavement friction mainly using the locked-wheel testing methodology to measure the friction number, found to be the most common equipment employed by state agencies. However, it provides some limitations of measurements on curved segments and in a continuous data collection format. Therefore, some state DOTs started to evolve a continuous pavement friction measurement to continuously collect the network-level friction data, especially at locations requiring higher friction demands such as curves, ramps, intersections, etc. However, the development of continuous friction measurements is adopted by few state DOTs. In addition, the statewide practice of data collection frequency varies from very frequent processes, such as annually, up to six-year cycles depending on road classification. A very high number of state DOTs collect the friction data only by request from either district engineers or from the safety program. However, states applying a typical PFM statistically collect more data at both the statewide levels and at specific locations. They have also correlated practices of maintaining a database of friction measurements.
The safety concern is found to be the most influential factor to investigate the friction demand and needs. That is why most state DOTs rely on reactive maintenance activities with less-standardized PFM proactive policies. Moreover, the feedback received from state DOTs and the literature review support the effectiveness of high friction surface treatments to enhance the overall friction performance. However, they are used more frequently on asphalt pavement. Diamond grinding is the most common treatment strategy on concrete pavement. The findings derived from the study and the limitations of the current practices encourage state DOTs to avoid simple and subjective evaluation of the pavement friction performance and decision making. Rather, state DOTs are advised to consider the several studies and methodologies developed to support an effective PFM. Among these studies, state DOTs can use the developed correlated models of pavement fiction number and influential factors such as pavement roughness, pavement material characteristics, traffic, and environmental conditions. In addition, the pavement friction demand should be addressed proactively using investigatory levels so that preventive maintenance can be defined to avoid higher crash rates on road segments. Practitioners also must be aware of the seasonal change in the skid resistance of pavement friction due to the change in temperature, snowfall, and rainfall. This should help agencies decide on an appropriate time for friction testing and data collection when the friction values of pavement are at their lowest. Moreover, the multi-year maintenance decision making can also be supported using artificial intelligence techniques and optimization analysis to maximize the benefits of managing the pavement friction proactively and avoid extra expenses.

Author Contributions

Conceptualization, A.E. and M.H.; methodology, A.E. and M.H.; resources K.K.; writing—original draft preparation, A.E. and M.H.; writing—review and editing, A.E. and M.H.; supervision, K.K. and M.H.; project administration, K.K.; funding acquisition, K.K. All authors have read and agreed to the published version of the manuscript.

Funding

This research was funded by Wyoming Department of Transportation, grant #RS05221.

Institutional Review Board Statement

Not applicable.

Informed Consent Statement

Not applicable.

Data Availability Statement

Data that supports the findings of this study is available upon reasonable request from the University of Wyoming at https://www.uwyo.edu/wyt2/ (accessed on 15 June 2022).

Acknowledgments

The authors would like to acknowledge that this work is part of project #RS05221 funded by the Wyoming Department of Transportation (WYDOT). All figures, tables, and equations listed in this paper will be included in a WYDOT final report at the conclusion of this study. Copyright © 2022. All rights reserved, the State of Wyoming, Wyoming Department of Transportation, and the University of Wyoming.

Conflicts of Interest

The authors declare no conflict of interest. The funders had no role in the design of the study; in the collection, analyses, or interpretation of data; in the writing of the manuscript, or in the decision to publish the results.

References

  1. Hall, J.W.; Smith, K.L.; Titus-Glover, L.; Wambold, J.C.; Yager, T.J.; Rado, Z. NCHRP Report 801: Guide for Pavement Friction; Transportation Research Board: Washington, DC, USA, 2009. [Google Scholar] [CrossRef] [Green Version]
  2. Ilse, M. Evaluation of tire/surfacing/base contact stresses and texture depth. Int. J. Transp. Sci. Technol. 2015, 4, 107–118. [Google Scholar] [CrossRef] [Green Version]
  3. Najafi, S.; Flintsch, G.W.; Medina, A. Linking roadway crashes and tire–pavement friction: A case study. Int. J. Pavement Eng. 2017, 18, 119–127. [Google Scholar] [CrossRef]
  4. Friction Management. Federal Highway Administration (FHWA). Available online: https://safety.fhwa.dot.gov/roadway_dept/pavement_friction/friction_management/ (accessed on 2 February 2022).
  5. Hafez, M.; Farid, A.; Ksaibati, K. Managing Pavement Friction of Wyoming’s Roads Considering Safety; Wyoming Department of Transportation: Cheyenne, WY, USA, 2020; Available online: https://www.dot.state.wy.us/files/live/sites/wydot/files/shared/Planning/Research/Managing%20Pavement%20Friction%20of%20Wyoming%E2%80%99s%20Roads%20Considering%20Safety.pdf (accessed on 2 May 2022).
  6. MAP-21—Moving Ahead for Progress in the 21st Century Act. Federal Highway Administration (FHWA). Available online: https://www.fhwa.dot.gov/map21/ (accessed on 5 February 2022).
  7. Highway Safety Improvement Program (HSIP). Federal Highway Administration (FHWA). Available online: https://safety.fhwa.dot.gov/hsip/ (accessed on 5 February 2022).
  8. Guide for Pavement Friction; American Association of State Highway and Transportation Officials: Washington, DC, USA, 2008.
  9. Pavement Friction Management. Technical Advisory, Federal Highway Administration (FHWA). Available online: https://www.fhwa.dot.gov/pavement/t504038.cfm (accessed on 1 July 2021).
  10. Shaffer, S.J.; Christiaen, A.C.; Rogers, M.J. Assessment of Friction-Based Pavement Methods and Regulations. Report No. DTFH61-03-X-00030; National Transportation Research Center: Knoxville, TN, USA, 2006. [Google Scholar]
  11. Design Manual for Roads and Bridges (DMRB)—Pavement Inspection and Assessment, CS 228, “Skidding Resistance”. (Highways England). Available online: https://www.standardsforhighways.co.uk/dmrb/ (accessed on 5 February 2022).
  12. Neaylon, K. Guidance for the Development of Policy to Manage Skid Resistance. Report No. AP-R374/11; Austroads: Sydney, Australia, 2011. [Google Scholar]
  13. McCarthy, R.; Flintsch, G.; de León Izeppi, E. Impact of Skid Resistance on Dry and Wet Weather Crashes. J. Transp. Eng. Part B Pavements 2021, 147, 04021029. [Google Scholar] [CrossRef]
  14. McCarthy, R.; Flintsch, G.; Katicha, S.; Izeppi, E.D.L.; Guo, F. Determining investigatory levels of friction with crash modelling. Int. J. Pavement Eng. 2021, 1–8. [Google Scholar] [CrossRef]
  15. de León Izeppi, E.; Flintsch, G.; Katicha, S.; McCarthy, R.; McGhee, K. Locked-Wheel and Sideway-Force CFME Friction Testing Equipment Comparison and Evaluation. Report No. FHWA-RC-19-001; Federal Highway Administration: Washington, DC, USA, 2019. [Google Scholar]
  16. Continuous Pavement Friction Measurement (CPFM). Federal Highway Administration (FHWA). Available online: https://safety.fhwa.dot.gov/roadway_dept/pavement_friction/cpfm/ (accessed on 5 February 2022).
  17. Li, S.; Noureldin, S.; Jiang, Y.; Sun, Y. Evaluation of Pavement Surface Friction Treatments. Report No. FHWA/IN/JTRP-2012/04; Indiana Department of Transportation: Indianapolis, IN, USA, 2011. [Google Scholar]
  18. High Friction Surface Treatments (HFST). Federal Highway Administration (FHWA). Available online: https://safety.fhwa.dot.gov/roadway_dept/pavement_friction/high_friction/ (accessed on 2 February 2022).
  19. Henry, J.J. Evaluation of Pavement Friction Characteristics. Report No. NCHRP-291; Transportation Research Board: Washington, DC, USA; National Academy: Washington, DC, USA, 2000. [Google Scholar]
  20. Speir, R.; Barcena, T.P.R.; Desaraju, P. Development of Friction Improvement Policies and Guidelines for the Maryland State Highway Administration. Report No. MD-07-SP708B4F; Maryland State Highway Administration: Baltimore, MD, USA, 2009. [Google Scholar]
  21. US Census Bureau. United States Summary, 2010: Population and Housing Unit Counts. US Department of Commerce, Economics and Statistics Administration; US Census Bureau: Suitland-Silver Hill, MD, USA, 2012. Available online: https://www.census.gov/prod/cen2010/cph-2-1.pdf (accessed on 10 February 2022).
  22. Highway Statistics 2019—Public Road Length. FHWA Table HM-10. Available online: https://www.fhwa.dot.gov/policyinformation/statistics/2019/hm10.cfm (accessed on 5 February 2022).
  23. Federal Highway Administration (FHWA). Highway Performance Monitoring System, Field Manual; US Department of Transportation: Washington, DC, USA, 2014. [Google Scholar]
  24. Tsai, J.Y.; Wu, Y.; Ai, C.; Pranav, C. Developing Georgia’s High Friction Surface Treatment (HFST) Program-HFST Site Characteristics (HFST-SC) Data Collection and Analysis. Report No. FHWA-GA-18-1504; Georgia Department of Transportation: Forest Park, GA, USA, 2018. [Google Scholar]
  25. ASTM E 274; Standard Test Method for Skid Resistance of Paved Surfaces Using a Full-Scale Tire. Annual Book of ASTM Standards. American Society for Testing and Materials: West Conshohocken, PA, USA, 1998.
  26. Izeppi, E.D.L.; Flintsch, G.; McCarthy, R. Evaluation of Methods for Pavement Surface Friction, Testing on Non-Tangent Roadways and Segments. Report No. FHWA/NC/2017-02; North Carolina Department of Transportation: Raleigh, NC, USA, 2017. [Google Scholar]
  27. FHWA Offers Highway Friction Tester Demonstrations; Publication Number: FHWA-HRT-14-012; Federal Highway Administration, US Department of Transportation: Washington, DC, USA, 2014. Available online: https://www.fhwa.dot.gov/publications/focus/14apr/14apr05.cfm (accessed on 10 February 2022).
  28. Correa, A.L.; Wong, B. Concrete Pavement Rehabilitation-Guide for Diamond Grinding. Report No. FHWA-SRC 1/10-01 (5M); Federal Highway Administration, US Department of Transportation: Washington, DC, USA, 2001. [Google Scholar]
  29. Khalili, M.; Amirkhanian, S.N.; Karakouzian, M.; Xiao, F.; Jadidi, K. Evaluation of New Innovations in Rubber-Modified Asphalt Binders and Rubberized Asphalt Mixes for Nevada DOT. Report No. 513-13-803; Nevada Department of Transportation: Carson City, NV, USA, 2016. [Google Scholar]
  30. Fuentes, L.; Gunaratne, M.; Hess, D. Evaluation of the effect of pavement roughness on skid resistance. J. Transp. Eng. 2010, 136, 640–653. [Google Scholar] [CrossRef]
  31. Susanna, A.; Crispino, M.; Giustozzi, F.; Toraldo, E. Deterioration trends of asphalt pavement friction and roughness from medium-term surveys on major Italian roads. Int. J. Pavement Res. Technol. 2017, 10, 421–433. [Google Scholar] [CrossRef]
  32. Noyce, D.A.; Bahia, H.U.; Yambo, J.M.; Kim, G. Incorporating Road Safety into Pavement Management: Maximizing Asphalt Pavement Surface Friction for Road Safety Improvements; Midwest Regional University Transportation Center (UMTRI): Madison, WI, USA, 2005. [Google Scholar]
  33. Oh, S.M.; Ragland, D.R.; Chan, C.Y. Evaluation of Traffic and Environment Effects on Skid Resistance and Safety Performance of Rubberized Open-Grade Asphalt Concrete. Report No. UCB-ITS-PRR-2010-14; University of California: Berkeley, CA, USA, 2010. [Google Scholar]
  34. Santos, A.; Freitas, E.F.; Faria, S.; Oliveira, J.R.; Rocha, A.M.A. Prediction of Friction Degradation in Highways with Linear Mixed Models. Coatings 2021, 11, 187. [Google Scholar] [CrossRef]
  35. Sprinkel, M.M.; McGhee, K.K.; de León Izeppi, E.D. Virginia’s experience with high-friction surface treatments. Transp. Res. Rec. 2015, 2481, 100–106. [Google Scholar] [CrossRef] [Green Version]
  36. Wang, H.; Wang, Z. Evaluation of pavement surface friction subject to various pavement preservation treatments. Constr. Build Mater. 2013, 48, 194–202. [Google Scholar] [CrossRef]
  37. Chan, S.; Lane, B.; Kazmierowski, T.; Lee, W. Pavement preservation: A solution for sustainability. Transp. Res. Rec. 2011, 2235, 36–42. [Google Scholar] [CrossRef] [Green Version]
  38. Najafi, S.; Flintsch, G.W.; Khaleghian, S. Fuzzy logic inference-based Pavement Friction Management and real-time slippery warning systems: A proof of concept study. Accid. Anal. Prev. 2016, 90, 41–49. [Google Scholar] [CrossRef] [PubMed]
  39. Najafi, S.; Flintsch, G.W.; Khaleghian, S. Pavement friction management–artificial neural network approach. Int. J. Pavement Eng. 2019, 20, 125–135. [Google Scholar] [CrossRef]
  40. Marcelino, P.; de Lurdes Antunes, M.; Fortunato, E.; Gomes, M.C. Machine learning for pavement friction prediction using scikit-learn. In Proceedings of the EPIA Conference on Artificial Intelligence, Porto, Portugal; Springer: Cham, Switzerland, 2017. [Google Scholar] [CrossRef]
  41. McDonald, M.P.; Crowley, L.G.; Turochy, R.E. Determining the Causes of Seasonal Variation in Pavement Friction: Observational Study with Datapave 3.0 Database. Transp. Res. Rec. 2009, 2094, 128–135. [Google Scholar] [CrossRef]
  42. Amjadi, R.; Sherwood, J.; Flintsch, D.G. Seasonal Temperature Changes Impact on Pavement Safety Performance: Case Study. In Proceedings of the Draft Paper Prepared for 3rd International Friction Conference, Gold Coast, Australia, 15–18 May 2011. [Google Scholar]
Figure 1. Participating states in the Pavement Friction Management (PFM) survey of practice.
Civileng 03 00032 g001
Figure 2. Road classifications tested for friction by state DOTs.
Civileng 03 00032 g002
Figure 3. Selection criteria of testing pavement friction at specific locations.
Civileng 03 00032 g003
Figure 4. Pavement friction testing methods followed by state DOTs.
Civileng 03 00032 g004
Figure 5. Pavement friction indices commonly used by state DOTs.
Civileng 03 00032 g005
Figure 6. State DOTs feedback of about the pavement friction treatment practice.
Civileng 03 00032 g006
Figure 7. Types of pavement friction treatments considered for asphalt pavement.
Civileng 03 00032 g007
Figure 8. Types of pavement friction treatments considered for concrete pavement.
Civileng 03 00032 g008
Figure 9. Overall criteria considered in decision making of managing pavement friction.
Civileng 03 00032 g009
Figure 10. Average number of friction tests per mile for state DOTs.
Civileng 03 00032 g010
Figure 11. State DOT practices of maintaining a database for pavement friction measurements.
Civileng 03 00032 g011
Figure 12. State DOT practices of pavement friction treatments on rigid pavement.
Civileng 03 00032 g012
Table 1. Questions used in the correlation analysis and statistical tests.
QuestionVariableDescription
Q2PFM applicationDoes your agency apply skid resistance and pavement friction management (PFM) into your state pavement management system (PMS)?
Q4Data volumeDo you collect friction data statewide or at specific locations?
Q7OwnershipDo you use your own friction devices to collect your data?
Q10TireWhat type of tire does your agency use for the locked-wheel tester?
Q13Specific locationDo you conduct friction testing on specific roads characteristics (such as curves, ramps, intersections, etc.)?
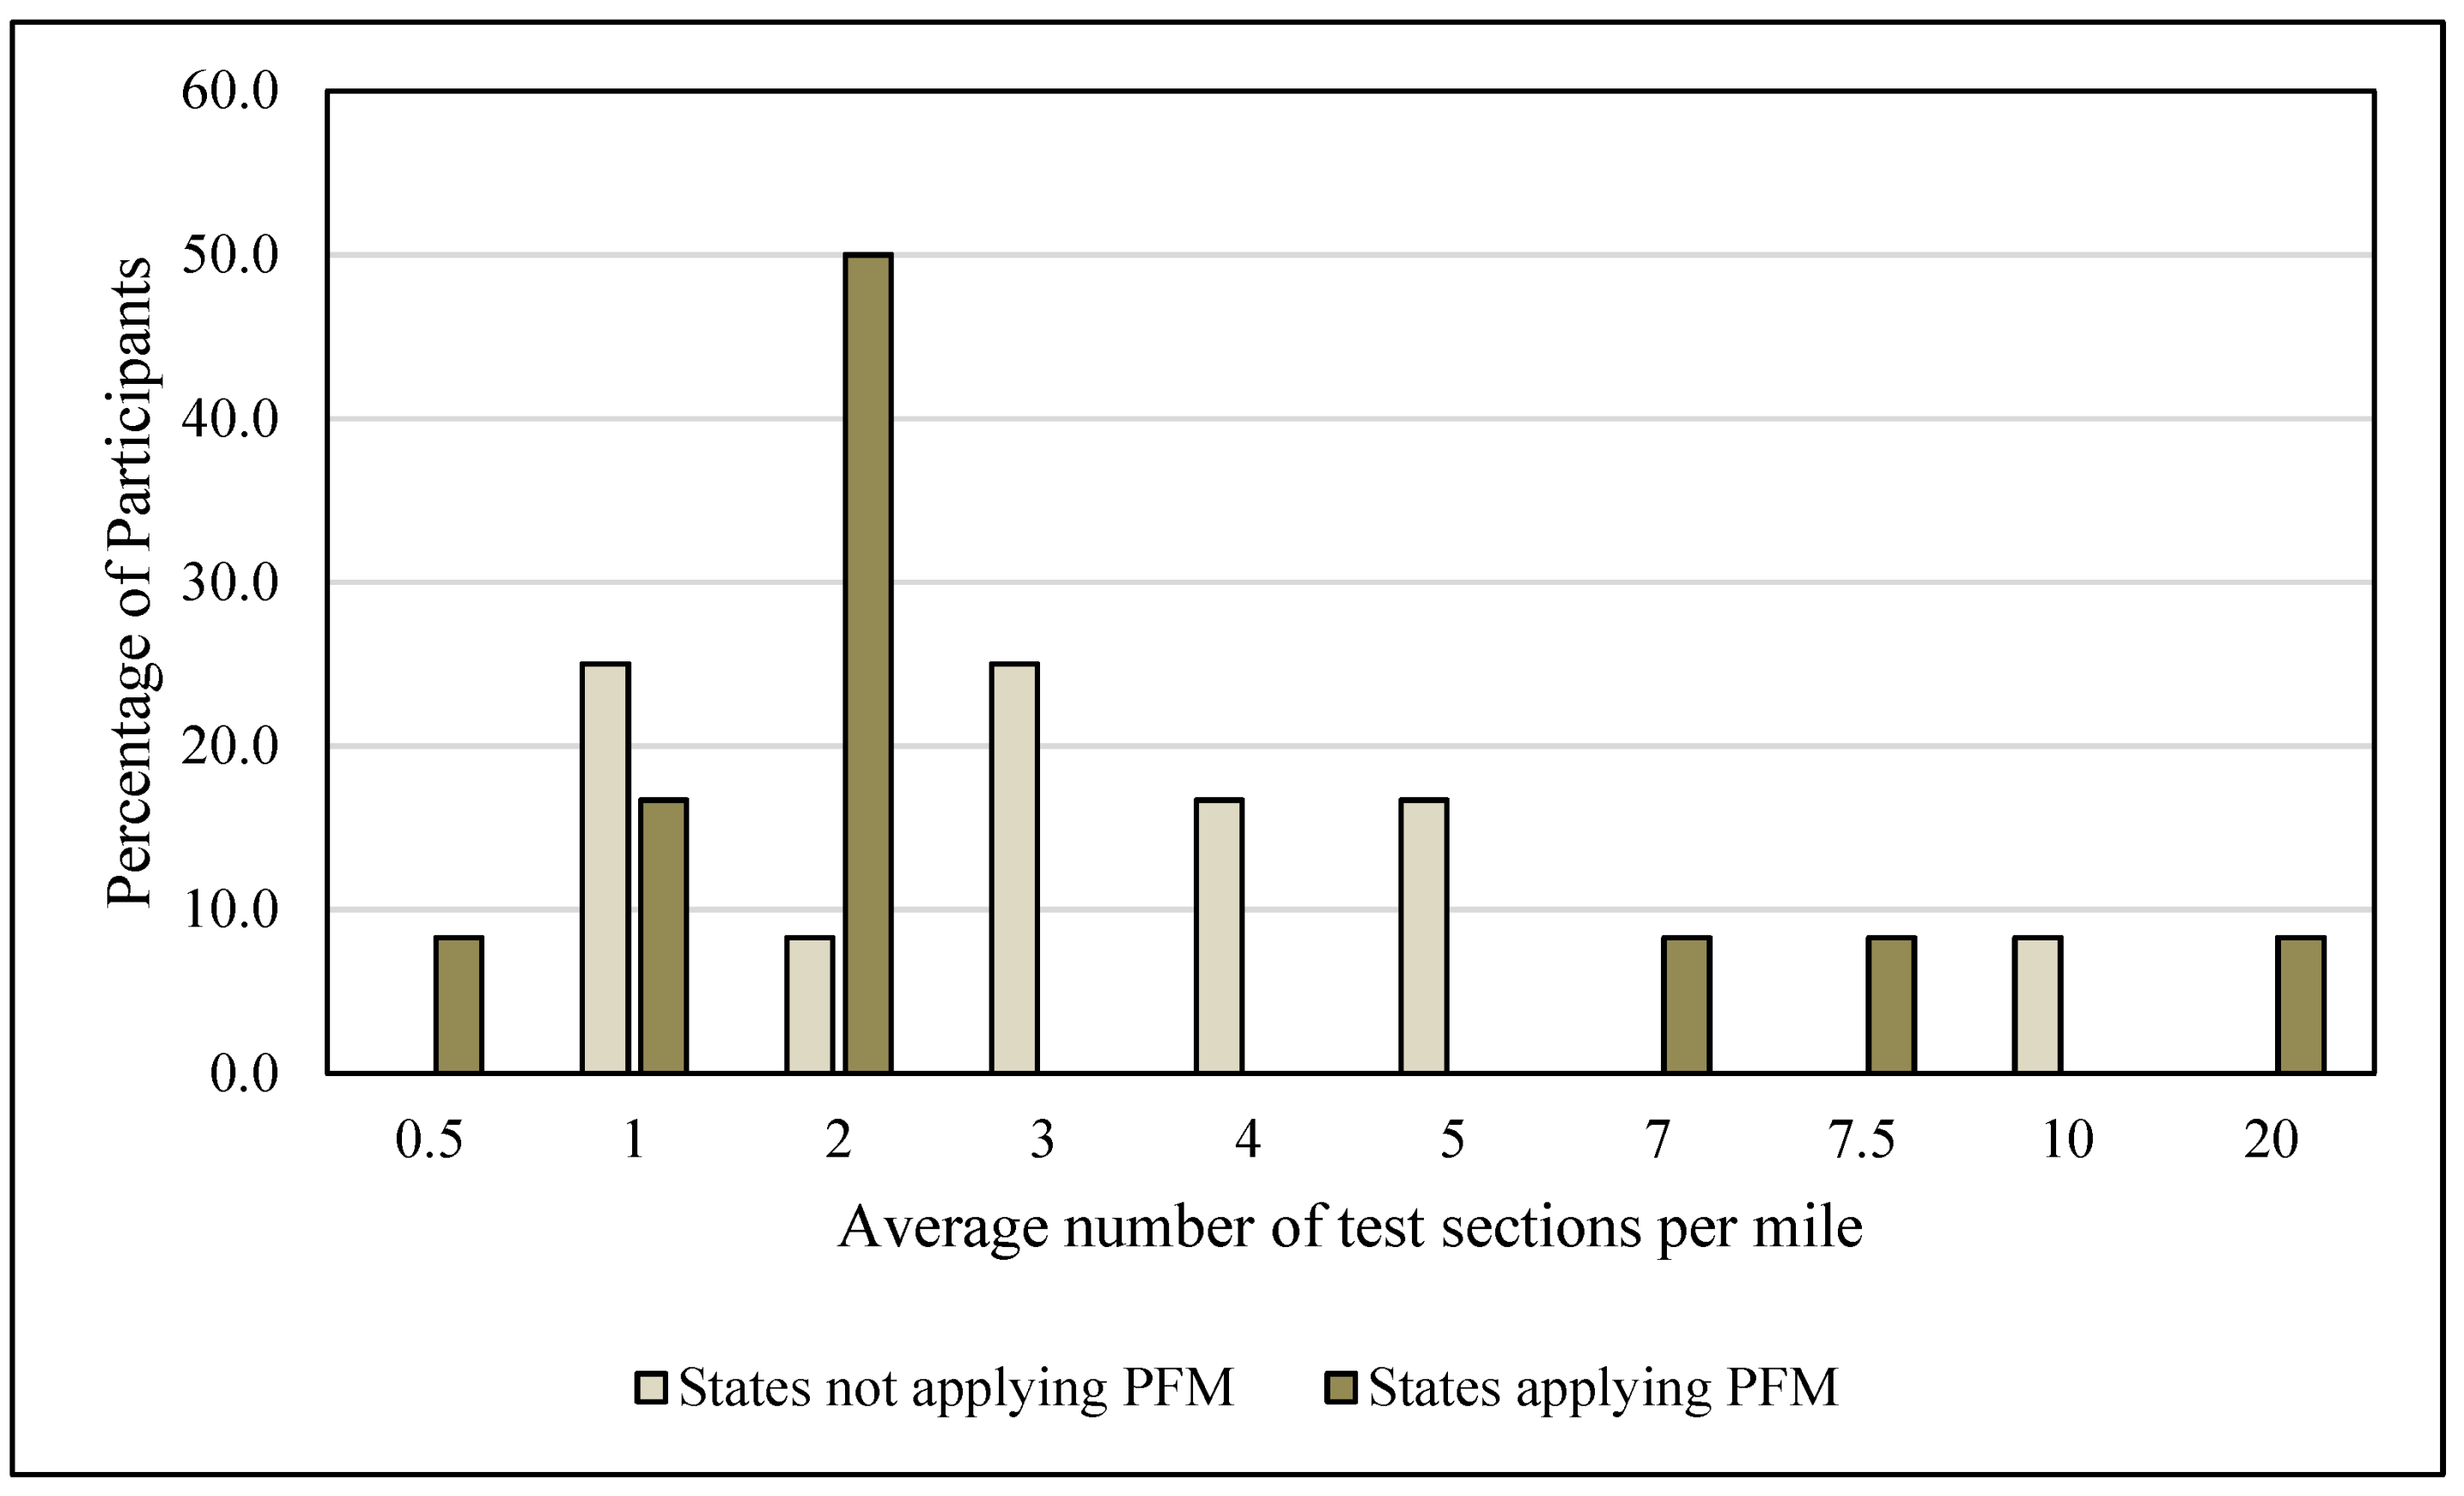
Q14Tests/mileOn average, how many friction tests are conducted per mile?
Q16DatabaseDoes your agency maintain a database of pavement friction values?
Q22Minimum FNDoes your agency have a minimum friction value on your roads?
Q26Treatment decisionDoes your agency consider a specific surface treatment to enhance pavement friction?
Q27Treatments on flexibleHow many surface treatments are applied by your agency? (Flexible pavement)
Q28Treatments on rigidHow many surface treatments are applied by your agency? (Rigid pavement)
Q33StudiesAre there any studies developed by your agency related to skid resistance?
Table 2. Types of variables for the studied survey questions.
VariableTypeLabelValue
PFM applicationCategorical (Binary)No0
Yes1
Data volumeCategoricalNo response0
Specific locations only1
Statewide2
Both statewide and specific locations3
OwnershipCategorical (Binary)No0
Yes1
TireCategoricalDo not use it/No response0
Smooth1
Ribbed2
Both3
Specific locationCategorical (Binary)No0
Yes1
Tests/mileRatio-Scale
DatabaseCategorical (Binary)No0
Yes1
Minimum FNCategorical (Binary)No0
Yes1
Treatment decisionCategorical (Binary)No0
Yes1
Treatments on flexibleRatio-Scale
Treatments on rigidRatio-Scale
OwnershipCategorical (Binary)No0
Yes1
Table 3. State DOT feedback of the general policy of the pavement friction management.
QuestionState DOT Response
YesNo
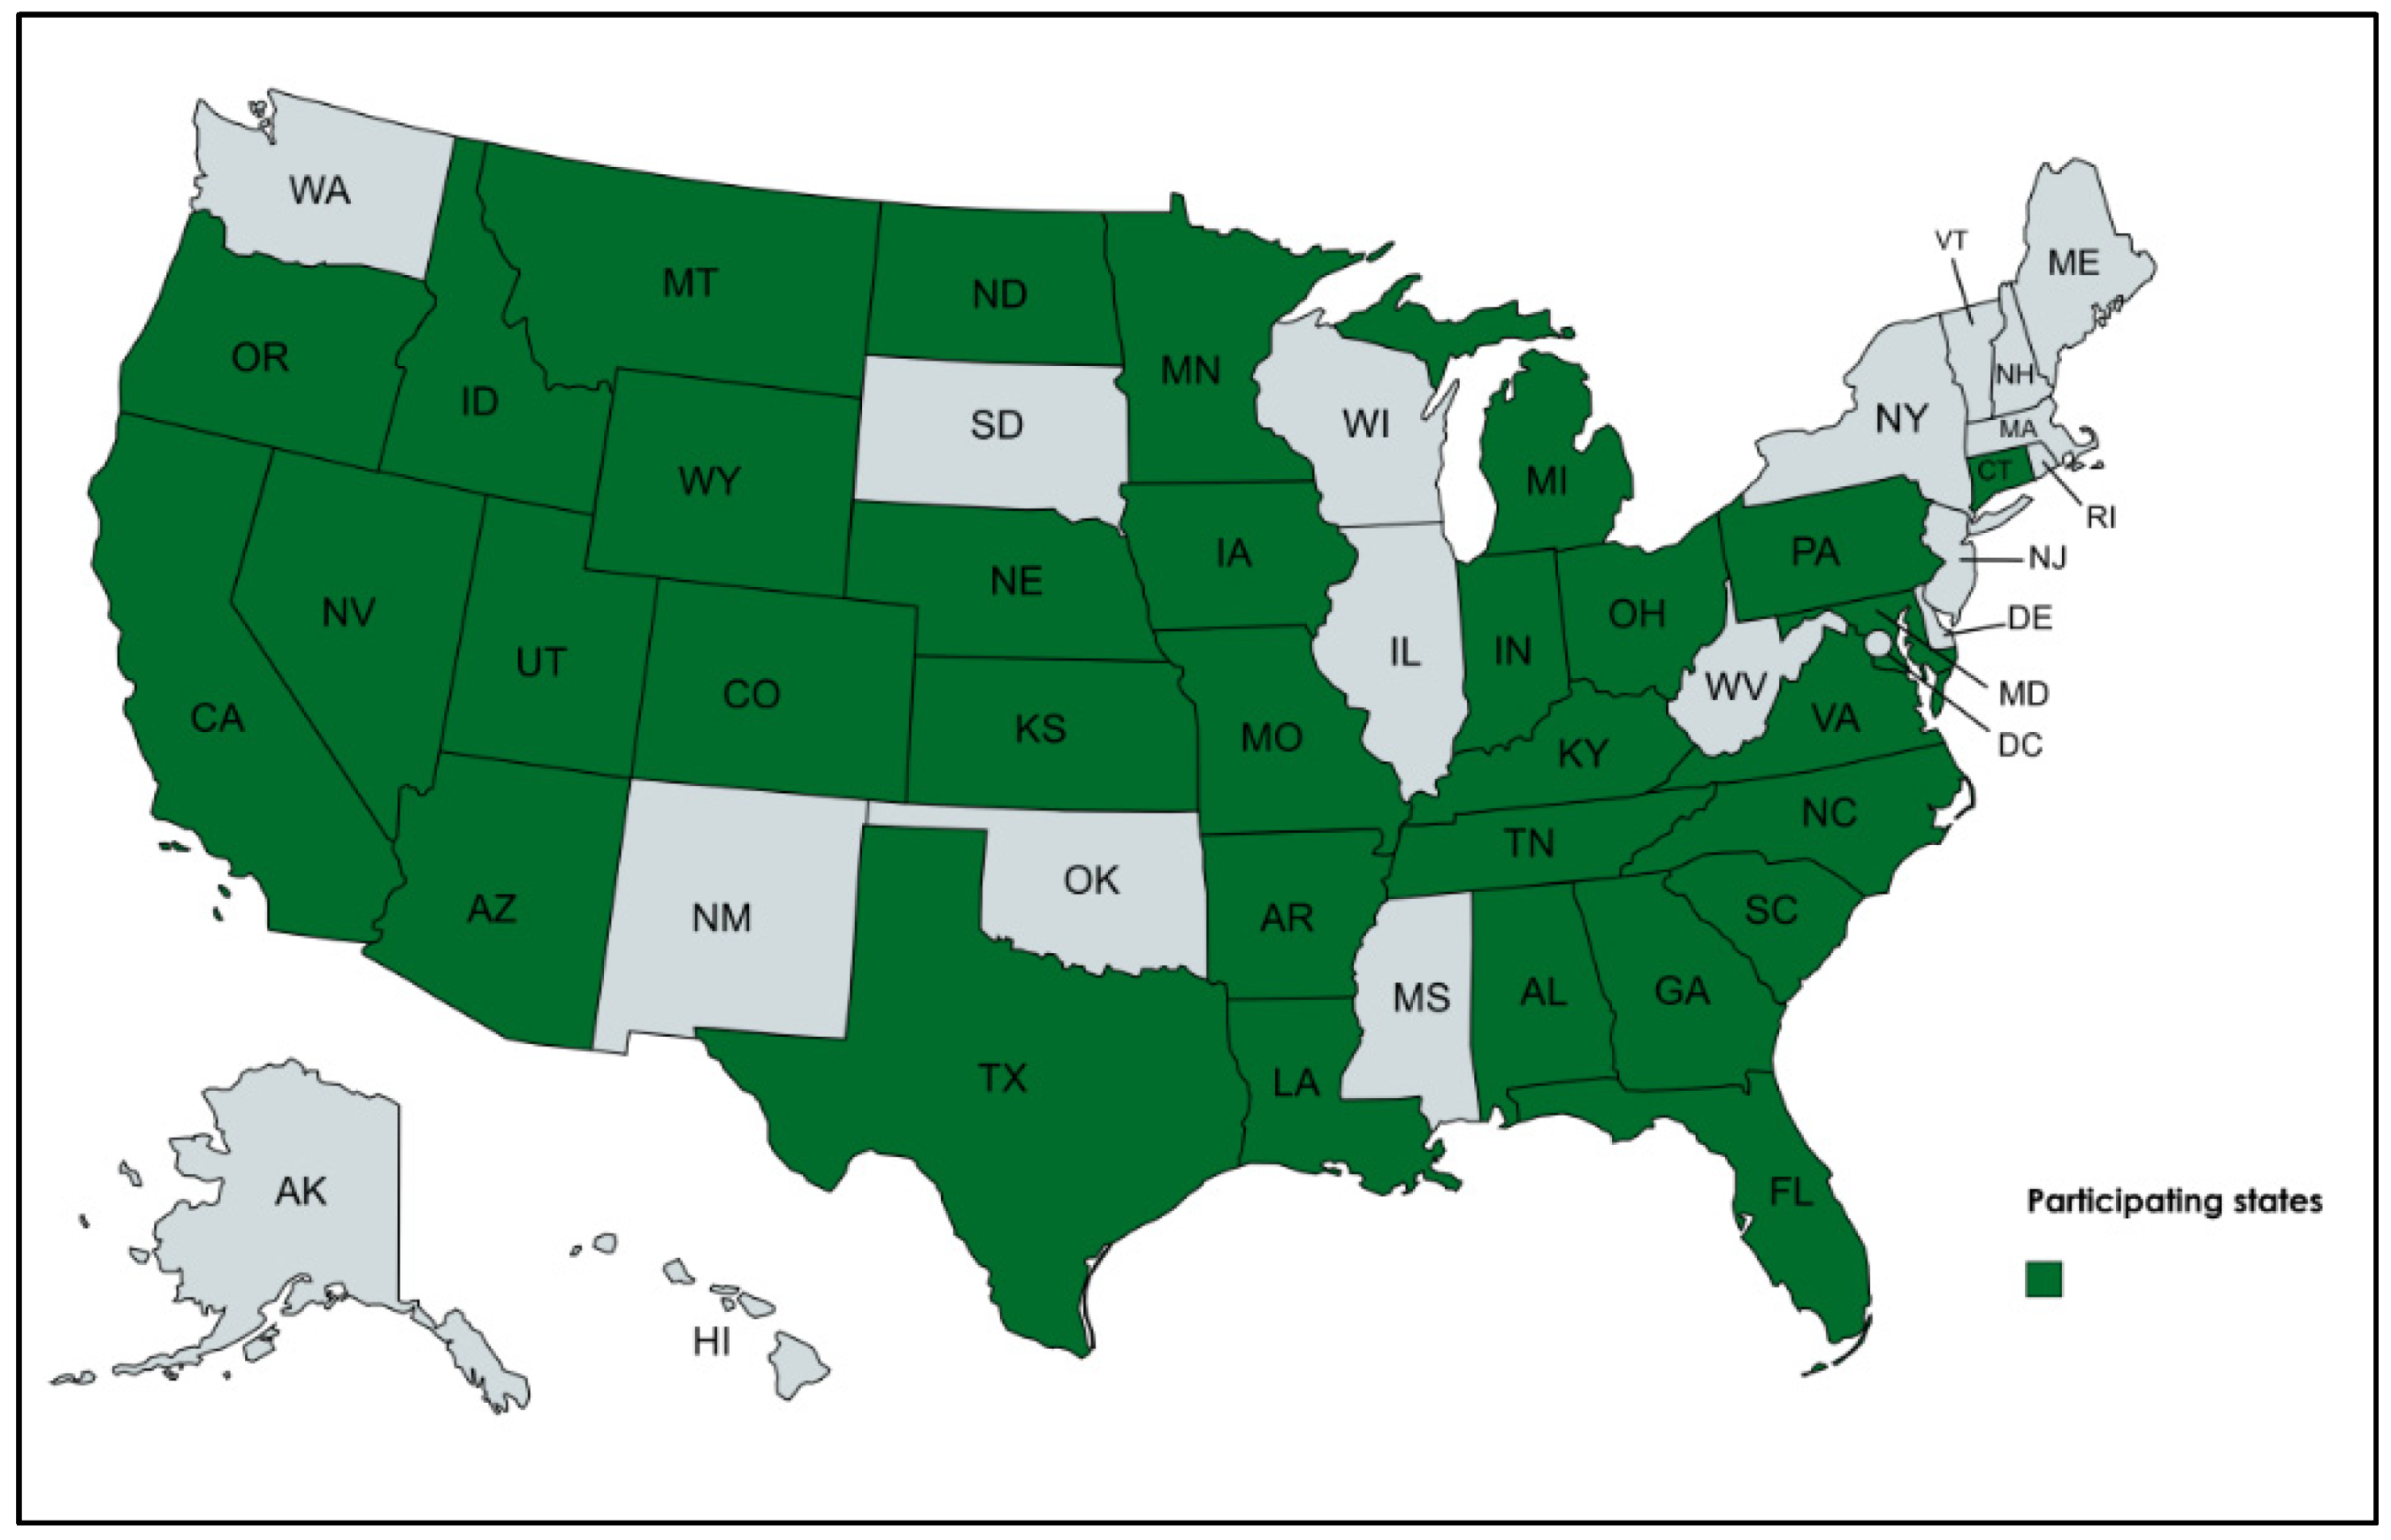
Does your agency incorporate a skid resistance and pavement friction management into your state pavement management system PMS?Idaho, Indiana, Iowa, Kansas, Kentucky, Louisiana, Maryland, Nevada, Oregon, Pennsylvania, Texas, WyomingAlabama, Arizona, Arkansas, California, Colorado, Connecticut, Florida, Georgia, Michigan, Minnesota, Missouri, Montana, Nebraska, North Carolina, North Dakota, Ohio, South Carolina, Tennessee, Utah, Virginia
Response count1220
Response rate38%62%
Table 4. Pavement friction data collection frequencies.
QuestionState DOT Response
By RequestEvery YearEvery 2 YearsResearch Needs OnlyOther Response
How frequently does your agency collect friction data?Arizona, Missouri, Montana, Ohio, Pennsylvania, VirginiaConnecticut, Kentucky, Michigan, Minnesota, Nevada, Texas, UtahOregon, Tennessee, WyomingColoradoAlabama, California, Florida, Georgia, Idaho, Indiana, Iowa, Kansas, Louisiana, Maryland, North Carolina, South Carolina
Response count673112
Response rate21%24%10%3%41%
Table 5. The minimum intervention friction levels considered by the surveyed state DOTs.
State DOTMinimum Friction Value
InterstateNational HighwayNon-National Highway
MarylandFN * = 46 for urban
FN * = 49 for rural
No defined criteriaNo defined criteria
FloridaFN * = 40
IdahoDepending on speed (s):
FN * = 35 if s > (45 mile per h)
FN * = 30 if s ≤ (45 mile per h)
IndianaFN40S = 20
WyomingFN40R = 40
* The respondent did not specify the testing speed or the type of testing tire. (However, ribbed tires are used by the mentioned state.)
Table 6. Correlation results between the policy of applying PFM and related practices.
Variable 1Variable 2CoefficientMethod
PFM applicationData volume0.172Cramer’s V
PFM applicationOwnership0.254Phi
PFM applicationTire0.378Cramer’s V
PFM applicationSpecific location0.119Phi
PFM applicationTests/mile0.852Eta
PFM applicationDatabase0.509Phi
PFM applicationMinimum FN0.289Phi
PFM applicationTreatment decision0Phi
PFM application#Treatments on flexible0.2Eta
PFM application#Treatments on rigid0.503Eta
PFM applicationStudies0.279Phi
Publisher’s Note: MDPI stays neutral with regard to jurisdictional claims in published maps and institutional affiliations.

