1. Introduction
Global greenhouse gas emissions have reached critical levels, with 2023 recording 57.4 gigatons of CO
2 equivalent (GtCO
2e), marking the highest level in history [
1]. The Paris Agreement’s goal of limiting global temperature rise to 1.5 °C requires a 43% reduction in emissions by 2030 compared to 2019 levels, prompting nations worldwide to implement various carbon pricing mechanisms. As of 2024, 75 carbon pricing initiatives operate globally, covering 24% of global GHG emissions through either carbon taxes or emissions trading systems (ETSs) [
2]. While developed economies have established mature carbon markets, emerging markets face unique challenges in implementing effective carbon pricing mechanisms while maintaining economic growth and development objectives.
The global carbon pricing landscape shows significant variations that reflect different stages of market development and economic contexts. The EU ETS trades at EUR 80–90/tCO
2e, demonstrate mature market pricing, while emerging market systems show diverse approaches: China’s national ETS trades at CNY 50–60/tCO
2e and South Korea’s ETS at CNY 8000–12,000/tCO
2e in 2023 [
3]. These price differences show how markets vary in maturity, economic conditions, and climate goals, offering lessons for emerging markets designing their carbon pricing approaches. The development of carbon pricing mechanisms in Southeast Asian emerging markets also demonstrates increasing momentum. Singapore implemented a carbon tax in 2019, currently at SGD 25/tCO
2e and scheduled to rise to SGD 80/tCO
2e by 2030 [
4]. Indonesia introduced its carbon tax in 2022 at IDR 30,000/tCO
2e (however, the implementation has been delayed to 2025) [
5], while Thailand launched a voluntary ETS pilot program in 2015 [
6]. Also, Vietnam has announced plans for ETS development by 2028, indicating growing regional recognition of carbon pricing’s importance in climate action [
7].
East Asian economies, particularly China and South Korea, offer instructive examples of successful carbon market development in emerging market contexts. China’s ETS, the world’s largest carbon market, and South Korea’s comprehensive system demonstrate how emerging economies can establish effective carbon pricing mechanisms while maintaining economic competitiveness. Their experiences are particularly relevant for other emerging markets, as they showcase different approaches to balancing environmental objectives with development needs.
Malaysia provides a representative case study of emerging market challenges in carbon pricing development. Its commitment to reduce GHG emissions intensity of GDP by 45% by 2030 compared to 2005 levels, followed by achieving net zero emissions by 2050 [
8], exemplifies the ambitious climate targets adopted by emerging economies. The country’s emissions profile reflects typical emerging market challenges, with emissions rising by a factor of 1.3, from 246 million tons in 2005 to 330.4 million tons in 2019 [
9]. While various projections suggest potential further increases by 2030, the verified historical data demonstrate a clear upward trend in emissions over the 14-year period from 2005 to 2019. Based on the 2022 sectoral CO
2 emissions data for Malaysia (
Figure 1), electricity and heat producers dominated the emissions profile at 48.8%, followed by transport (22.3%), industry (15.0%), and other energy industries (10.7%), with smaller contributions from commercial, residential, agricultural, and fishing sectors [
10].
This research examines carbon pricing development in emerging markets through three key aspects: the ratio legis underpinning carbon pricing policies, implementation frameworks and challenges, and policy effectiveness through the FASTER principles framework. Emerging markets face three specific challenges in implementing carbon pricing that remain inadequately addressed in the existing literature [
11] first, the structural conflict between emissions reduction and economic development priorities, where fossil fuel subsidies often create negative effective carbon rates; second, limited institutional capacity for monitoring, reporting, and verification systems critical to market function; and third, insufficient market liquidity due to narrow sectoral coverage and limited participant readiness.
The comparative analysis of China and South Korea provides unique insights into addressing these challenges through their contrasting approaches. China’s rate-based allocation system accommodating industrial growth and South Korea’s phased approach to market stringency have successfully balanced environmental and economic objectives. Malaysia’s experience contributes empirical evidence of these specific barriers, offering valuable lessons for other emerging markets with similar challenges.
The remainder of this paper is organized as follows:
Section 2 reveals literature on carbon pricing development.
Section 3 outlines the methodological approach employed in this research.
Section 4 analyzes Malaysia’s current carbon market status.
Section 5 and 6 present ETS implementation and comparative analysis of carbon pricing systems in China and South Korea through the FASTER principles framework.
Section 7 provides policy recommendations for Malaysia’s carbon pricing implementation based on the comparative analysis. Finally,
Section 8 concludes with key findings and implications for carbon pricing development in emerging markets.
2. Literature Review
This section reviews foundational frameworks and empirical evidence on carbon pricing mechanisms, evaluative frameworks, and the underlying principles that shape their design and implementation.
2.1. Overview of Carbon Pricing Mechanism
Carbon pricing initiatives represent market-based mechanisms designed to reduce greenhouse gas emissions by assigning a monetary value to carbon pollution. These mechanisms create economic incentives for businesses and individuals to reduce emissions while providing flexibility in how these reductions are achieved. As shown in
Table 1, there are two primary carbon pricing mechanisms which dominate the global implementation, which are carbon taxes and emissions trading systems (ETSs).
The global distribution shown in
Figure 2a,b reveals Asia as a significant hub for carbon pricing development [
2].
2.2. FASTER Principles as Carbon Pricing Mechanism Guideline
The FASTER Principles, developed jointly by the World Bank and OECD, serves as the key evaluation methodology for carbon pricing mechanisms, drawing from empirical evidence across multiple jurisdictions to establish critical success criteria. These frameworks’ principles identify six essential characteristics for effective carbon pricing based on empirical evidence across jurisdictions [
12]:
Fairness—Implements “polluter pays” approach and ensures equitable distribution of impacts;
Policy Alignment: Functions as part of an integrated system supporting wider environmental and non-environmental objectives;
Stability: Provides steady, escalating market signals within consistent policy frameworks;
Transparency: Maintains clear design and implementation processes;
Economic Efficiency: Optimizes cost-effectiveness and economic performance;
Environmental Impact: Delivers measurable reductions in environmentally harmful behavior.
The FASTER framework operationalizes carbon pricing effectiveness through a multi-dimensional evaluation methodology that establishes specific performance indicators across six principles. For fairness, it applies quantitative metrics like Gini coefficient changes from revenue redistribution alongside qualitative assessments of stakeholder inclusion in policy design processes [
13]. Alignment evaluation employs policy coherence mapping to trace how carbon price signals interact with broader regulatory ecosystems, identifying potential conflicts or synergies with existing incentive structures [
14]. Stability assessment analyzes both price volatility metrics and regulatory consistency as investment signals for low-carbon transitions, recognizing that predictability drives capital allocation decisions [
15]. Transparency evaluation measures information asymmetry reduction between market participants through data standardization and verification robustness, with particular attention to MRV systems integrity [
16]. Economic Efficiency employs marginal abatement cost curve analysis to determine whether emissions reductions occur where most economically rational, while examining transaction cost minimization across regulated entities [
17]. Reliability integrates environmental integrity metrics with implementation feasibility factors, including tracking emissions trends against policy targets and compliance rates [
18].
The FASTER framework explicitly recognizes the developmental stages of carbon pricing systems, applying contextualized benchmarking for emerging markets rather than absolute standards. This approach acknowledges structural challenges including competitiveness concerns, institutional capacity constraints, and political economy considerations, while providing empirically grounded implementation pathways that balance environmental integrity with developmental realities [
12].
2.3. The Ratio Legis Behind Carbon Pricing Policy
Carbon pricing mechanisms are built on both theoretical and practical considerations. Understanding these foundations is essential for policies that balance environmental goals with economic stability. The ratio legis of carbon pricing encompasses philosophical principles of environmental justice, social and ecological imperatives of climate action, and judicial frameworks that enable market-based environmental regulation [
19,
20].
2.3.1. Philosophical Reasoning
Carbon pricing is philosophically grounded in principles of environmental justice and economic efficiency. The polluter-pays principle (PPP), formalized by the OECD in 1972, establishes that entities responsible for environmental degradation should bear the costs [
21]. This has evolved to encompass broader concepts of environmental justice [
22]. In carbon pricing, PPP creates a direct link between emissions and financial responsibility, serving prevention, restoration, and deterrence functions [
23]. Successful PPP implementation must balance environmental effectiveness with economic efficiency while avoiding the creation of perverse incentives that might undermine environmental objectives [
24].
The economic philosophical framework draws substantially from A.C. Pigou’s analysis of externalities, developed in “The Economics of Welfare” (1920). Pigou argued that negative externalities require government intervention to align private incentives with social welfare [
25]. Recent developments have expanded this to consider dynamic efficiency and innovation incentives. Critics argue that PPP creates a “license to pollute”, but the principle aims to create reduction incentives while ensuring polluters bear costs.
Intergenerational equity, introduced by Brown Weiss in 1989, establishes moral obligations to preserve environmental resources for future generations [
23]. Climate change has been categorized as “the greatest market failure” requiring immediate action [
26]. The discourse also addresses global justice questions regarding developing nations’ development rights versus historical emissions, leading to frameworks based on common but differentiated responsibilities [
27].
2.3.2. Social and Ecological Reasoning
Social and ecological imperatives for carbon pricing emerge from the urgent need to address climate change while managing complex socio-economic transitions. The IPCC’s Sixth Assessment Report (2021) emphasizes that limiting global warming to 1.5 °C requires immediate and substantial decreases in greenhouse gas emissions, with global emissions needing a 45% reduction from 2010 levels by 2030 [
27]. This scientific consensus establishes the ecological urgency for effective carbon pricing mechanisms that can drive rapid decarbonization across economic sectors.
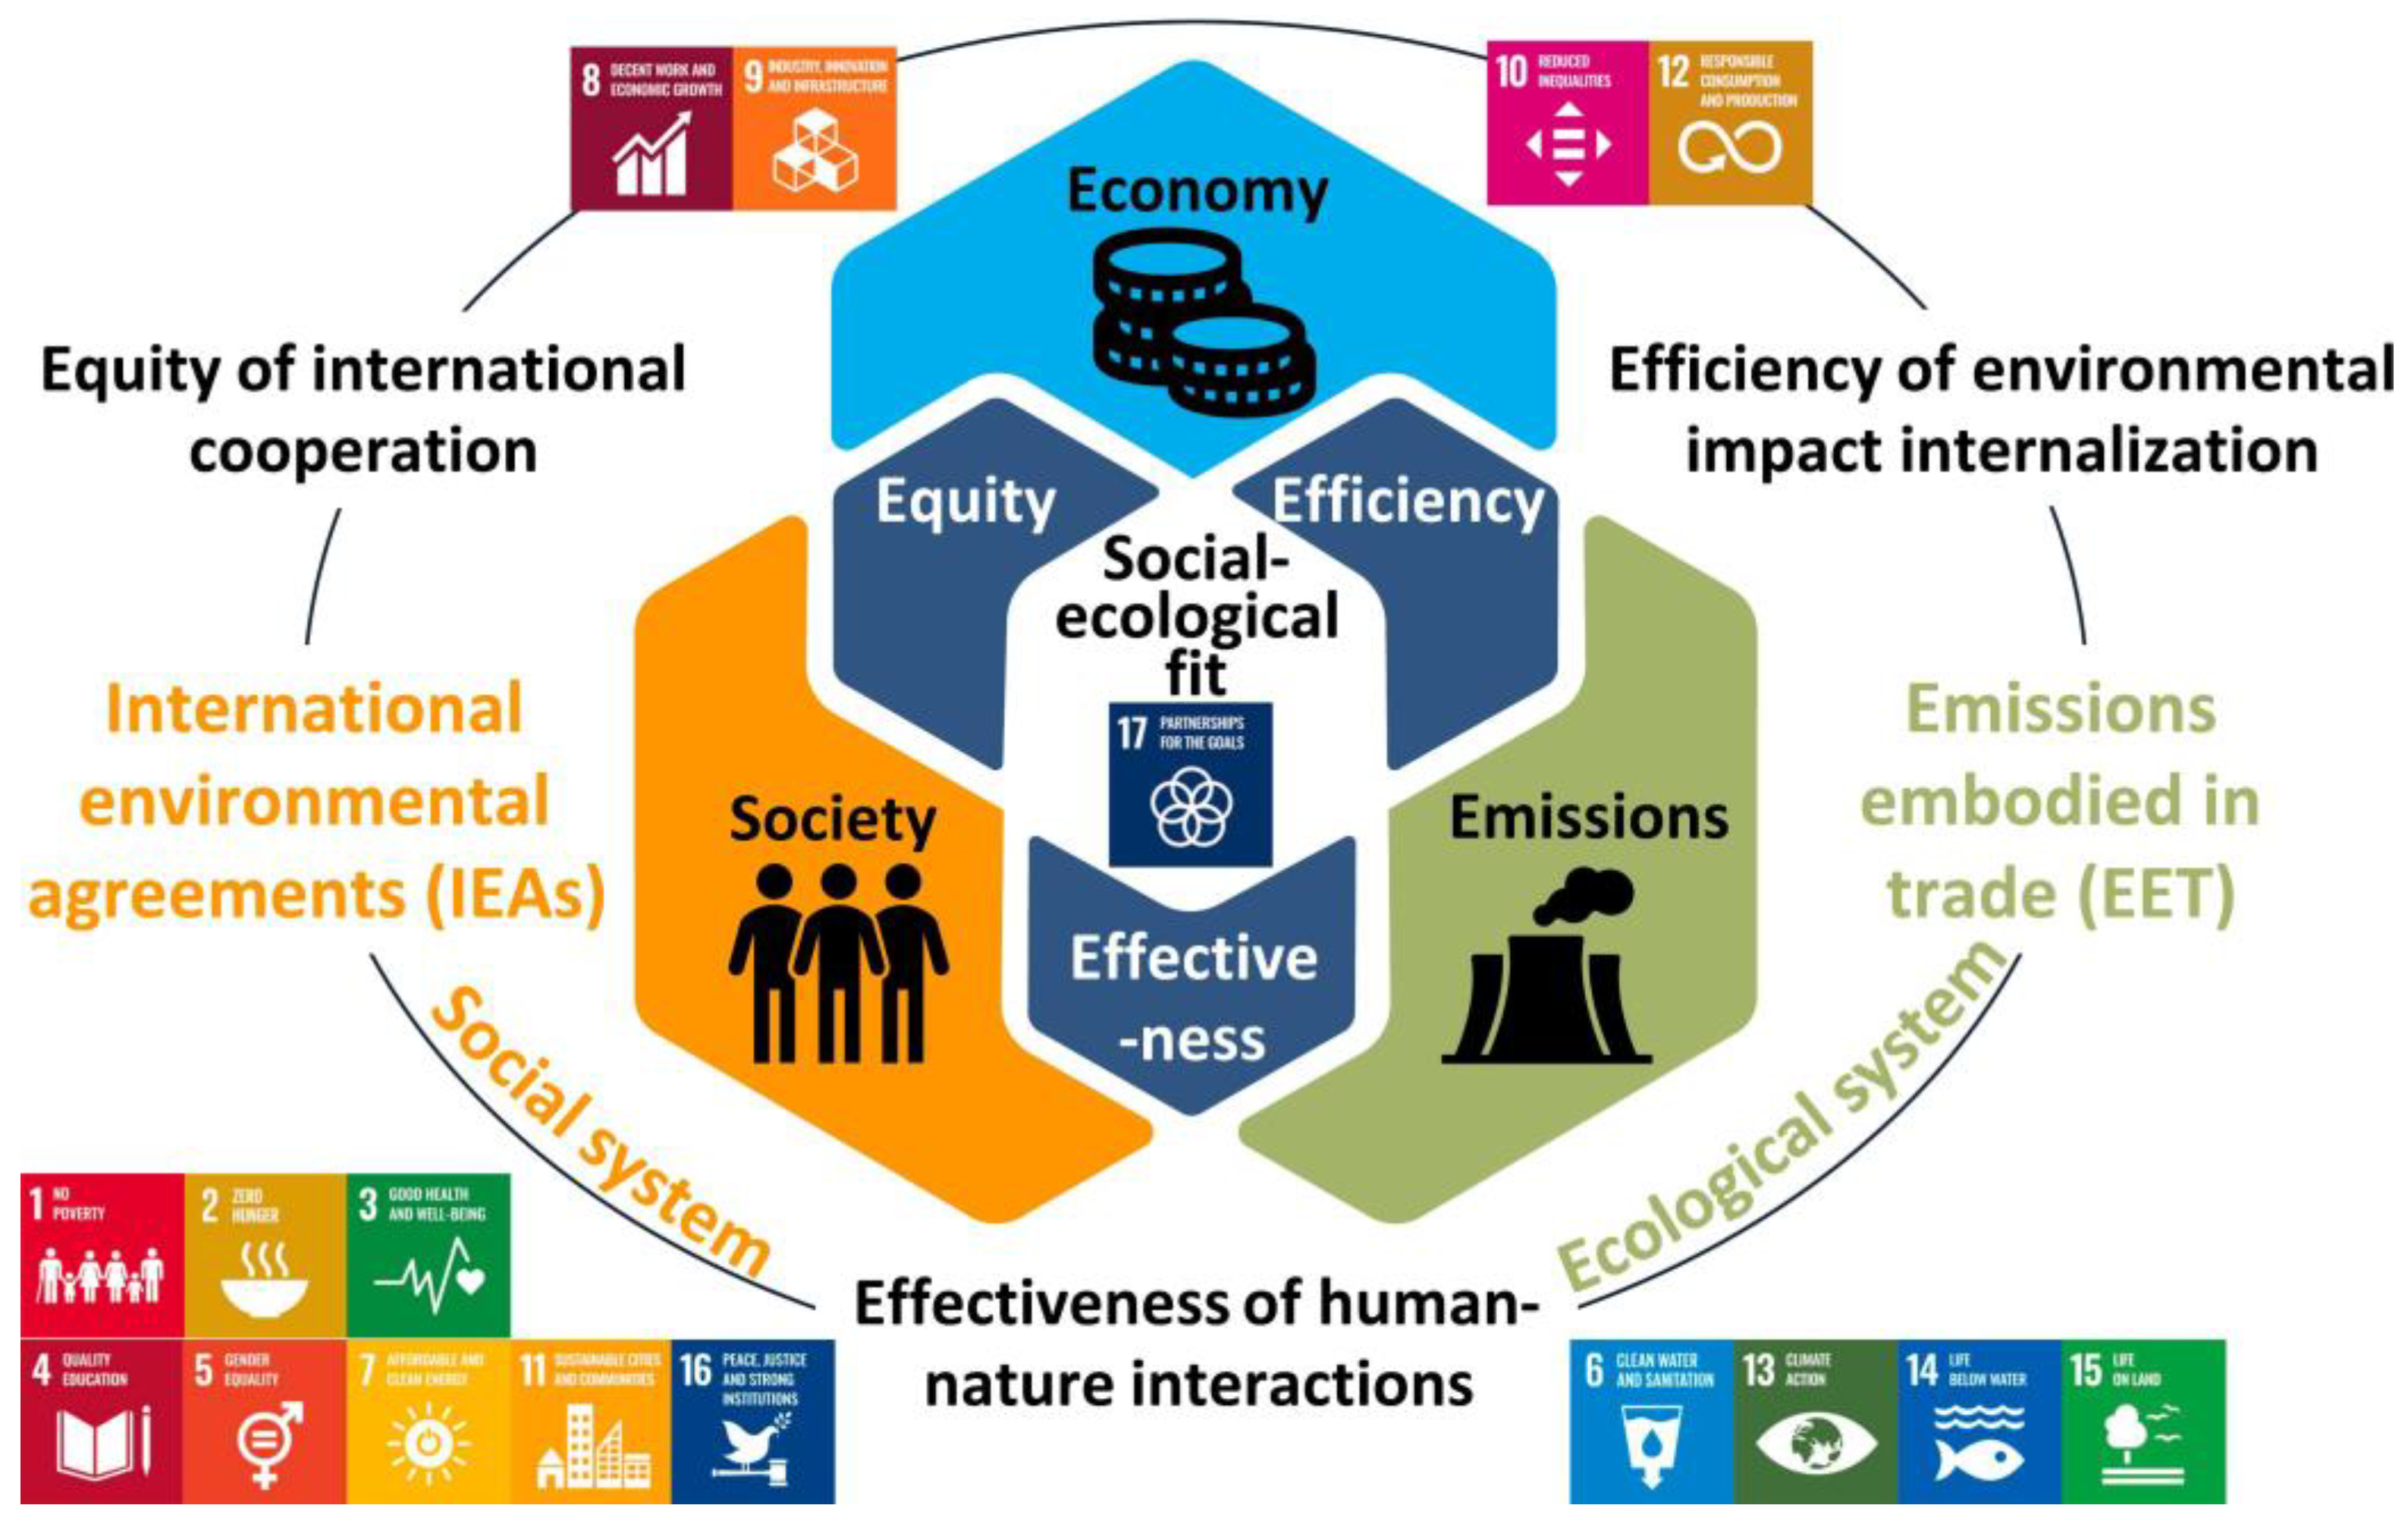
Figure 3 shows the relationships between economic, social, and ecological systems in carbon pricing. The framework highlights three key dimensions: equity in international cooperation, efficiency in internalizing environmental impacts, and effectiveness of human–nature interactions. This interconnected approach is particularly relevant in Southeast Asia, where the economy could shrink by 11% by 2100 due to climate change impacts [
28]. This risk grows as more people move to cities—projected to reach 68% of the population by 2050, leading to higher energy use and emissions.
2.3.3. Judicial Reasoning
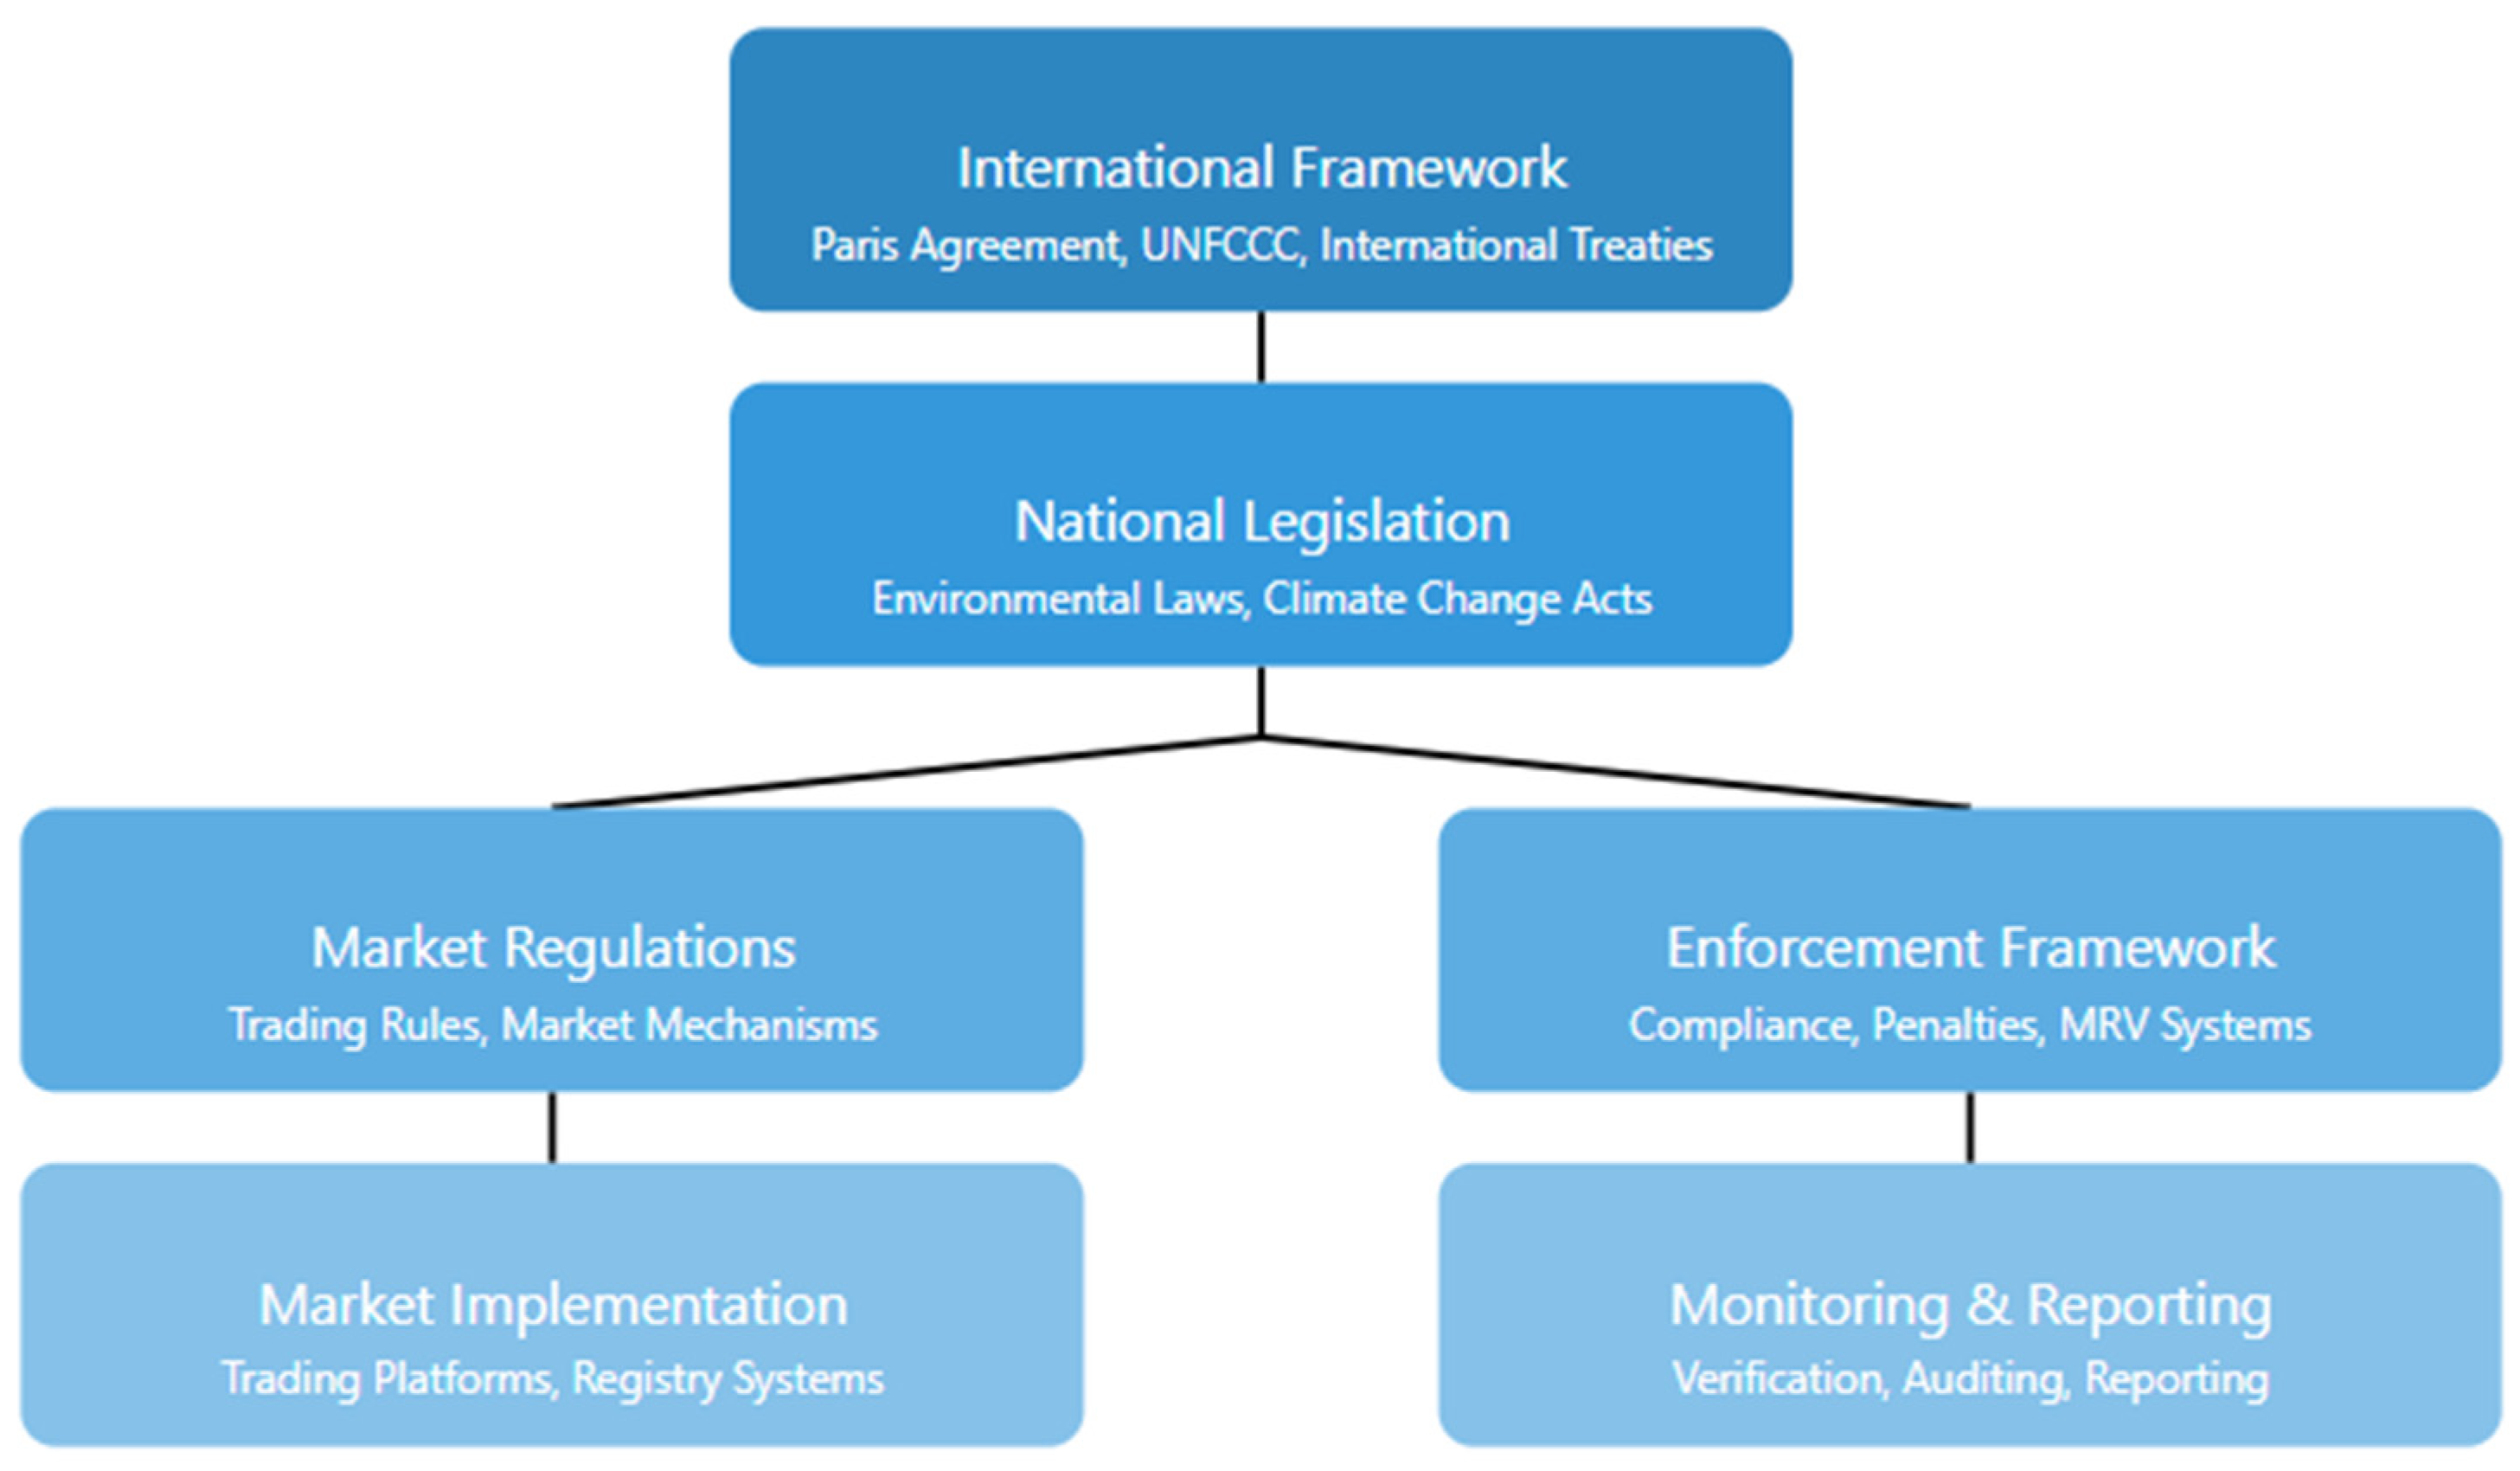
Carbon pricing has legal foundations at multiple levels, from international frameworks to domestic legislation.
Figure 4 illustrates this hierarchical legal structure and shows how various components interact. At the international level, the Paris Agreement’s Article 6 provides the fundamental legal basis for market mechanisms, establishing frameworks for cooperative approaches to emissions reduction [
30].
Domestic courts have embraced Pound’s theory of law as a tool for social engineering, applying this principle to develop nuanced interpretations of environmental legislation that facilitate carbon market creation [
31]. Key judicial considerations focus on three critical areas: the legal definition of carbon credits as tradable commodities, the establishment of comprehensive liability frameworks for market participants, and the determination of enforcement jurisdiction across multiple governmental levels [
32,
33]. Courts must also address emerging challenges in carbon market operations, including the legal treatment of cross-border carbon adjustments and the integration of diverse market systems. This evolving body of jurisprudence requires courts to balance market stability with environmental effectiveness while maintaining consistent legal principles across jurisdictions [
34]. Recent judicial decisions have expanded these interpretations to encompass new market mechanisms and enforcement tools, reflecting the dynamic nature of carbon pricing regulation.
3. Methods
This research employs qualitative doctrinal legal research methodology integrated with comparative policy analysis to examine carbon pricing mechanisms across selected jurisdictions [
35]. Carbon pricing mechanisms exist at the intersection of legal frameworks, economic principles, and political realities, necessitating an integrated methodological approach. Doctrinal legal research enables rigorous examination of the formal structures and legal foundations that establish carbon markets, which is crucial because market effectiveness ultimately depends on the robustness of these legal frameworks [
36] As recent literature argues, legal research must integrate empirical observations with normative analyses to fully understand how legal principles manifest in practice [
35]. The carbon pricing context exemplifies this need, as statutory provisions alone reveal little about implementation challenges without examining their practical effects.
Comparative policy analysis complements this legal perspective by enabling systematic evaluation of how similar policy instruments function differently across jurisdictions with varying institutional contexts. This approach has proven particularly valuable for understanding policy transferability in environmental governance contexts, where policy effectiveness often depends on institutional arrangements and implementation pathways rather than formal policy design alone [
13]. For carbon pricing specifically, comparative analysis reveals critical insights about adaptation strategies that remain hidden in single-jurisdiction studies or purely theoretical models.
Alternative methodologies were considered but determined insufficient for addressing the research questions. Quantitative econometric analysis would offer statistical correlations between carbon pricing variables and economic outcomes but would fail to capture the legal–institutional dynamics and implementation processes crucial to understanding emerging market challenges. Pure case studies would provide rich contextual understanding but limit the identification of generalizable principles necessary for developing transferable insights. Mixed-methods approaches incorporating surveys were also considered but rejected due to the limited market participant pool in emerging carbon markets and challenges in accessing key decision-makers across multiple jurisdictions.
Data collection encompasses both primary and secondary sources, focusing on legislative frameworks, policy documents, and market performance data from 2015 to 2023. Primary data sources include national legislation, official policy documents, government reports, climate action plans, and carbon market regulations from Malaysia, China, and South Korea. These are supplemented by market performance data from respective carbon exchanges and regulatory bodies. Secondary sources comprise peer-reviewed academic literature, reports from international organizations including the World Bank, International Carbon Action Partnership (ICAP), and International Emissions Trading Association (IETA), along with industry analyses and market assessment reports.
The analytical framework employs three complementary approaches to address different research dimensions. First, ratio legis analysis examines the philosophical foundations underlying carbon pricing mechanisms [
12]. This approach reveals how alignment between legal instruments and normative principles influences political acceptance in emerging markets [
20]. Second, comparative policy assessment evaluates implementation strategies across jurisdictions, identifying transferable insights by examining why certain approaches succeed in specific contexts [
37]. Previous literature has demonstrated that implementation pathways significantly influence market outcomes even with similar formal policies [
33]. Third, the FASTER principles framework assesses policy effectiveness across six dimensions: Fairness, Alignment, Stability, Transparency, Efficiency, and Reliability [
12]. This framework was selected specifically because it was developed by the World Bank and OECD for evaluating carbon pricing mechanisms at different development stages.
4. Malaysia’s Current Carbon Market Status
Malaysia’s carbon market is in an early stage with only initial policy frameworks and basic infrastructure in place. The Malaysian Green Technology and Climate Change Corporation (MGTC) has initiated foundational steps through project registrations and baseline studies, marking the country’s early progression toward carbon market implementation [
38]. In line with these efforts, Malaysia has announced plans to introduce a carbon tax aimed at the iron, steel, and energy industries by 2026. This initiative, highlighted in the recent Budget 2025, is designed to incentivize carbon reductions, and align with international developments, such as the European Union’s Carbon Border Adjustment Mechanism (CBAM), which may impact Malaysia’s export competitiveness [
39].
The establishment of market infrastructure marked a crucial development with Bursa Malaysia’s launch of the Voluntary Carbon Market (VCM) exchange in 2022. This exchange implements a multi-faceted trading approach, incorporating auction-based trading for price discovery, spot trading for standardized contracts, and off-market transactions for direct deals. A significant milestone in market development occurred on March 16, 2023, with the inaugural carbon credit auction. This event successfully placed 150,000 Verra-registered carbon credits through two innovative products: the Global Technology-Based Carbon Contract (GTC) and the Global Nature-Based Plus Carbon Contract (GNC+). Market response proved encouraging, with GTC Contracts from China’s Linshu Biogas Recovery and Power Generation Project being oversubscribed at RM18 (approximately USD 3.95) per contract, while GNC+ Contracts from Cambodia’s Southern Cardamom REDD+ project cleared at RM68.00 (approximately USD 14.53) per contract [
40].
The development of supporting ecosystem infrastructure has progressed through several key initiatives. The launch of the Malaysia Carbon Market Association (MCMA) in August 2024 aims to accelerate market development through policy formulation contributions, talent capability enhancement, and strategic collaborations [
41]. Financial incentives have also been introduced, including tax deductions of up to RM300,000 for companies undertaking Measurement, Reporting, and Verification (MRV) activities related to such projects, applicable for applications submitted to the Malaysian Green Technology and Climate Change Corporation (MGTC) from January 1, 2024, to December 31, 2026 [
42]. Additionally, Malaysia has developed an MRV framework for REDD (Reducing Emissions from Deforestation and Forest Degradation) Plus activities, involving multi-agency collaboration to ensure alignment with international standards set by UNFCCC [
43].
The financial sector has demonstrated meaningful progress in supporting carbon market development, guided by Bank Negara Malaysia’s policy initiatives. The publication of additional guidance for implementing the Climate Change and Principle-based Taxonomy (CCPT) has provided financial institutions with clearer direction for assessing and classifying green activities [
44]. This has contributed to significant sector engagement, with Bank Negara Malaysia’s data showing that, out of 66 financial groups, 41 have set specific climate targets, and 43 have incorporated climate risk into their risk appetite statements. Additionally, 50 institutions now offer green products and solutions, with the sector collectively allocating over RM110 billion for Environment, Social and Governance (ESG) financing up to 2025. The CCPT guidance has been particularly instrumental in helping financial institutions develop standardized approaches for green financing and supporting the growth of the carbon market.
However, significant implementation challenges persist in Malaysia’s carbon market development. Market participation has been constrained by several factors, notably the absence of a carbon tax, which limits incentives for businesses to reduce emissions and engage in carbon trading. This challenge was notably acknowledged by PETRONAS President and Group CEO, Tan Sri Tengku Muhammad Taufik, who identified the lack of carbon tax as a missing element in Malaysia’s energy transition that could enable “wholesale shifts” in energy systems [
45]. The limited range of eligible carbon credits available for trading on the BCX has emerged as another barrier to market development. This policy gap, combined with existing fossil fuel subsidies covering 18.6% of emissions, has resulted in a negative Net Effective Carbon Rate of EUR −24.83 per ton of CO
2e in 2023, effectively creating counterproductive incentives in the market [
46].
The current state of Malaysia’s carbon market indicates an early stage system requiring substantial development across multiple dimensions. While foundational elements and institutional frameworks have been established, significant advancement is needed in corporate readiness, policy framework completion, and market infrastructure enhancement. This assessment suggests that, despite initial progress, considerable work remains to achieve a fully functional carbon market aligned with international standards and capable of effectively contributing to Malaysia’s climate objectives.
5. Emissions Trading System (ETS) Implementation: Case Studies of China and South Korea
More Asian economies now use ETSs, with China running the largest system and South Korea having a comprehensive one. This trend matters for Malaysia as it considers its own ETS. Different regional approaches offer valuable lessons for countries just starting out.
5.1. China’s Case
China’s national ETS represents a landmark development in global climate policy, establishing the world’s largest carbon market and effectively doubling the global volume of CO
2 emissions subject to carbon pricing. Covering approximately 3.5 billion tons of CO
2 annually, the ETS evolved from regional pilots into a comprehensive national program through a methodical, phased approach [
47].
5.1.1. Implementation of China’s ETS
The foundation of the national ETS was laid through pilot programs initiated in 2013 across seven regions, namely Beijing, Shanghai, Guangdong, Shenzhen, Tianjin, Chongqing, and Hubei. These pilots covered around 3000 companies and 20% of national energy use, serving as testing grounds for market mechanisms. The pilots achieved emission reductions of 30–40% among covered entities while identifying challenges related to data quality, market liquidity, and regulatory harmonization [
48]. The transition to a national system followed a three-phase implementation strategy. Lessons learned during this phase informed the transition to a national system, implemented in three stages: a development period (2018) to establish essential infrastructure, a mock operations period (2019) to test market reliability, and full operations starting in July 2021. The national ETS now encompasses approximately 4.5 billion tons of CO
2 emissions annually.
China has adopted a strategic, sector-specific approach to ETS implementation. Initially targeting the power sector for its concentrated emissions and established management capacity, the scheme plans gradual expansion to eight industries, including petrochemicals, steel, and aviation [
49]. The framework sets a threshold of 26,000 tons of CO
2 equivalent annual emissions, focusing on power generators. This phased approach builds capacity and refines the system before expanding to more sectors. The ETS has shown steady improvement. In its first year, trading volumes exceeded 179 million tons of CO
2, with prices stabilizing between CNY 40 and CNY 60 (USD 6–9) per ton. By 2023, trading volumes grew to 250 million tons, supported by increased market liquidity and 240 active trading days. Compliance rates reached 99.5% among 2162 power generation companies, reflecting the success of the regulatory framework [
50,
51]. These outcomes build on insights from the pilot programs, which tested allocation methods like benchmarking and grandfathering [
52].
China’s ETS uses a multi-tiered MRV system. The Ministry of Ecology and Environment provides oversight, while provincial authorities manage implementation. This system requires regulated companies to submit annual reports, which must undergo rigorous third-party verification by approved verifiers who operate under strict standards [
53,
54]. The infrastructure is built on four integrated pillars: a data reporting system tracking company emission, a registry system for market participants to register allowances and CCERs (based in Hubei), a trading platform enabling inter-company transactions (based in Shanghai), and a settlement system managing transaction capital [
49]. While the system demonstrates robust data collection capabilities supported by 80,000 enforcement officials, it faces ongoing challenges in data quality consistency [
55].
The system faces additional challenges as it continues to develop. The rate-based cap with ex post adjustments raises concerns about environmental effectiveness, prompting calls for a transition to an absolute, mass-based cap. Coordinating between national and pilot markets, ensuring data accuracy, and managing the integration of new sectors also remain critical issues. Despite these challenges, China is moving forward with a significant expansion planned for 2024, which will include the cement, steel, and aluminum industries. This expansion, incorporating around 1500 companies and 3 billion tons of CO
2e, will increase total coverage by approximately 5% of global emissions [
56].
The expansion will follow a two-phase approach. Phase 1 (2024–2026) will focus on familiarizing companies with the system and improving data quality, while Phase 2 (starting in 2027) will tighten regulations and enhance system effectiveness. The current output-based allowance allocation method will continue, covering both energy-related and process CO2 emissions, though indirect emissions will remain excluded to align with international standards. These developments align with China’s broader climate objectives to peak carbon emissions by 2030 and achieve carbon neutrality by 2060.
China’s ETS reflects a balance between its unique developmental needs and global climate ambitions. The rate-based allocation methodology accommodates growing energy demands while promoting efficiency improvements. Combined with systematic expansion plans and demonstrated compliance success, the ETS positions China as a leader in global climate action. Its experiences offer valuable lessons for emerging carbon markets worldwide.
5.1.2. Empirical Support for China’s ETS Carbon Pricing Outcomes
China’s national ETS uses intensity-based allocation (free allowances based on benchmarks per unit of output) and is intended to ratchet down those benchmarks over time. Empirical data from its operation show a steadily growing market: by the end of 2023, the ETS had traded a cumulative 442 million tons CO
2, valued at CNY 24.9 billion (≈ USD 3.5 billion) [
57]. Carbon prices on the Chinese market have generally been low compared to Europe—roughly CNY 40–60 per ton (USD 6–9) in the first compliance periods—but have begun to rise as the market matures. Notably, the price broke the CNY 100/ton mark for the first time in April 2024, equivalent to about USD 14, signaling increasing demand as regulators prepare to expand the scheme. Indeed, China plans to include steel, cement, aluminum, and other heavy industries in the ETS by 2024–2025, which will boost coverage to roughly 75% of China’s emissions (adding ~3 billion tons of CO
2 from 1500 additional emitters). While it is too early to gauge full impact, there are encouraging signs: carbon intensity in China’s economy has continued to improve, dropping 3.8% in 2021 compared to the prior year [
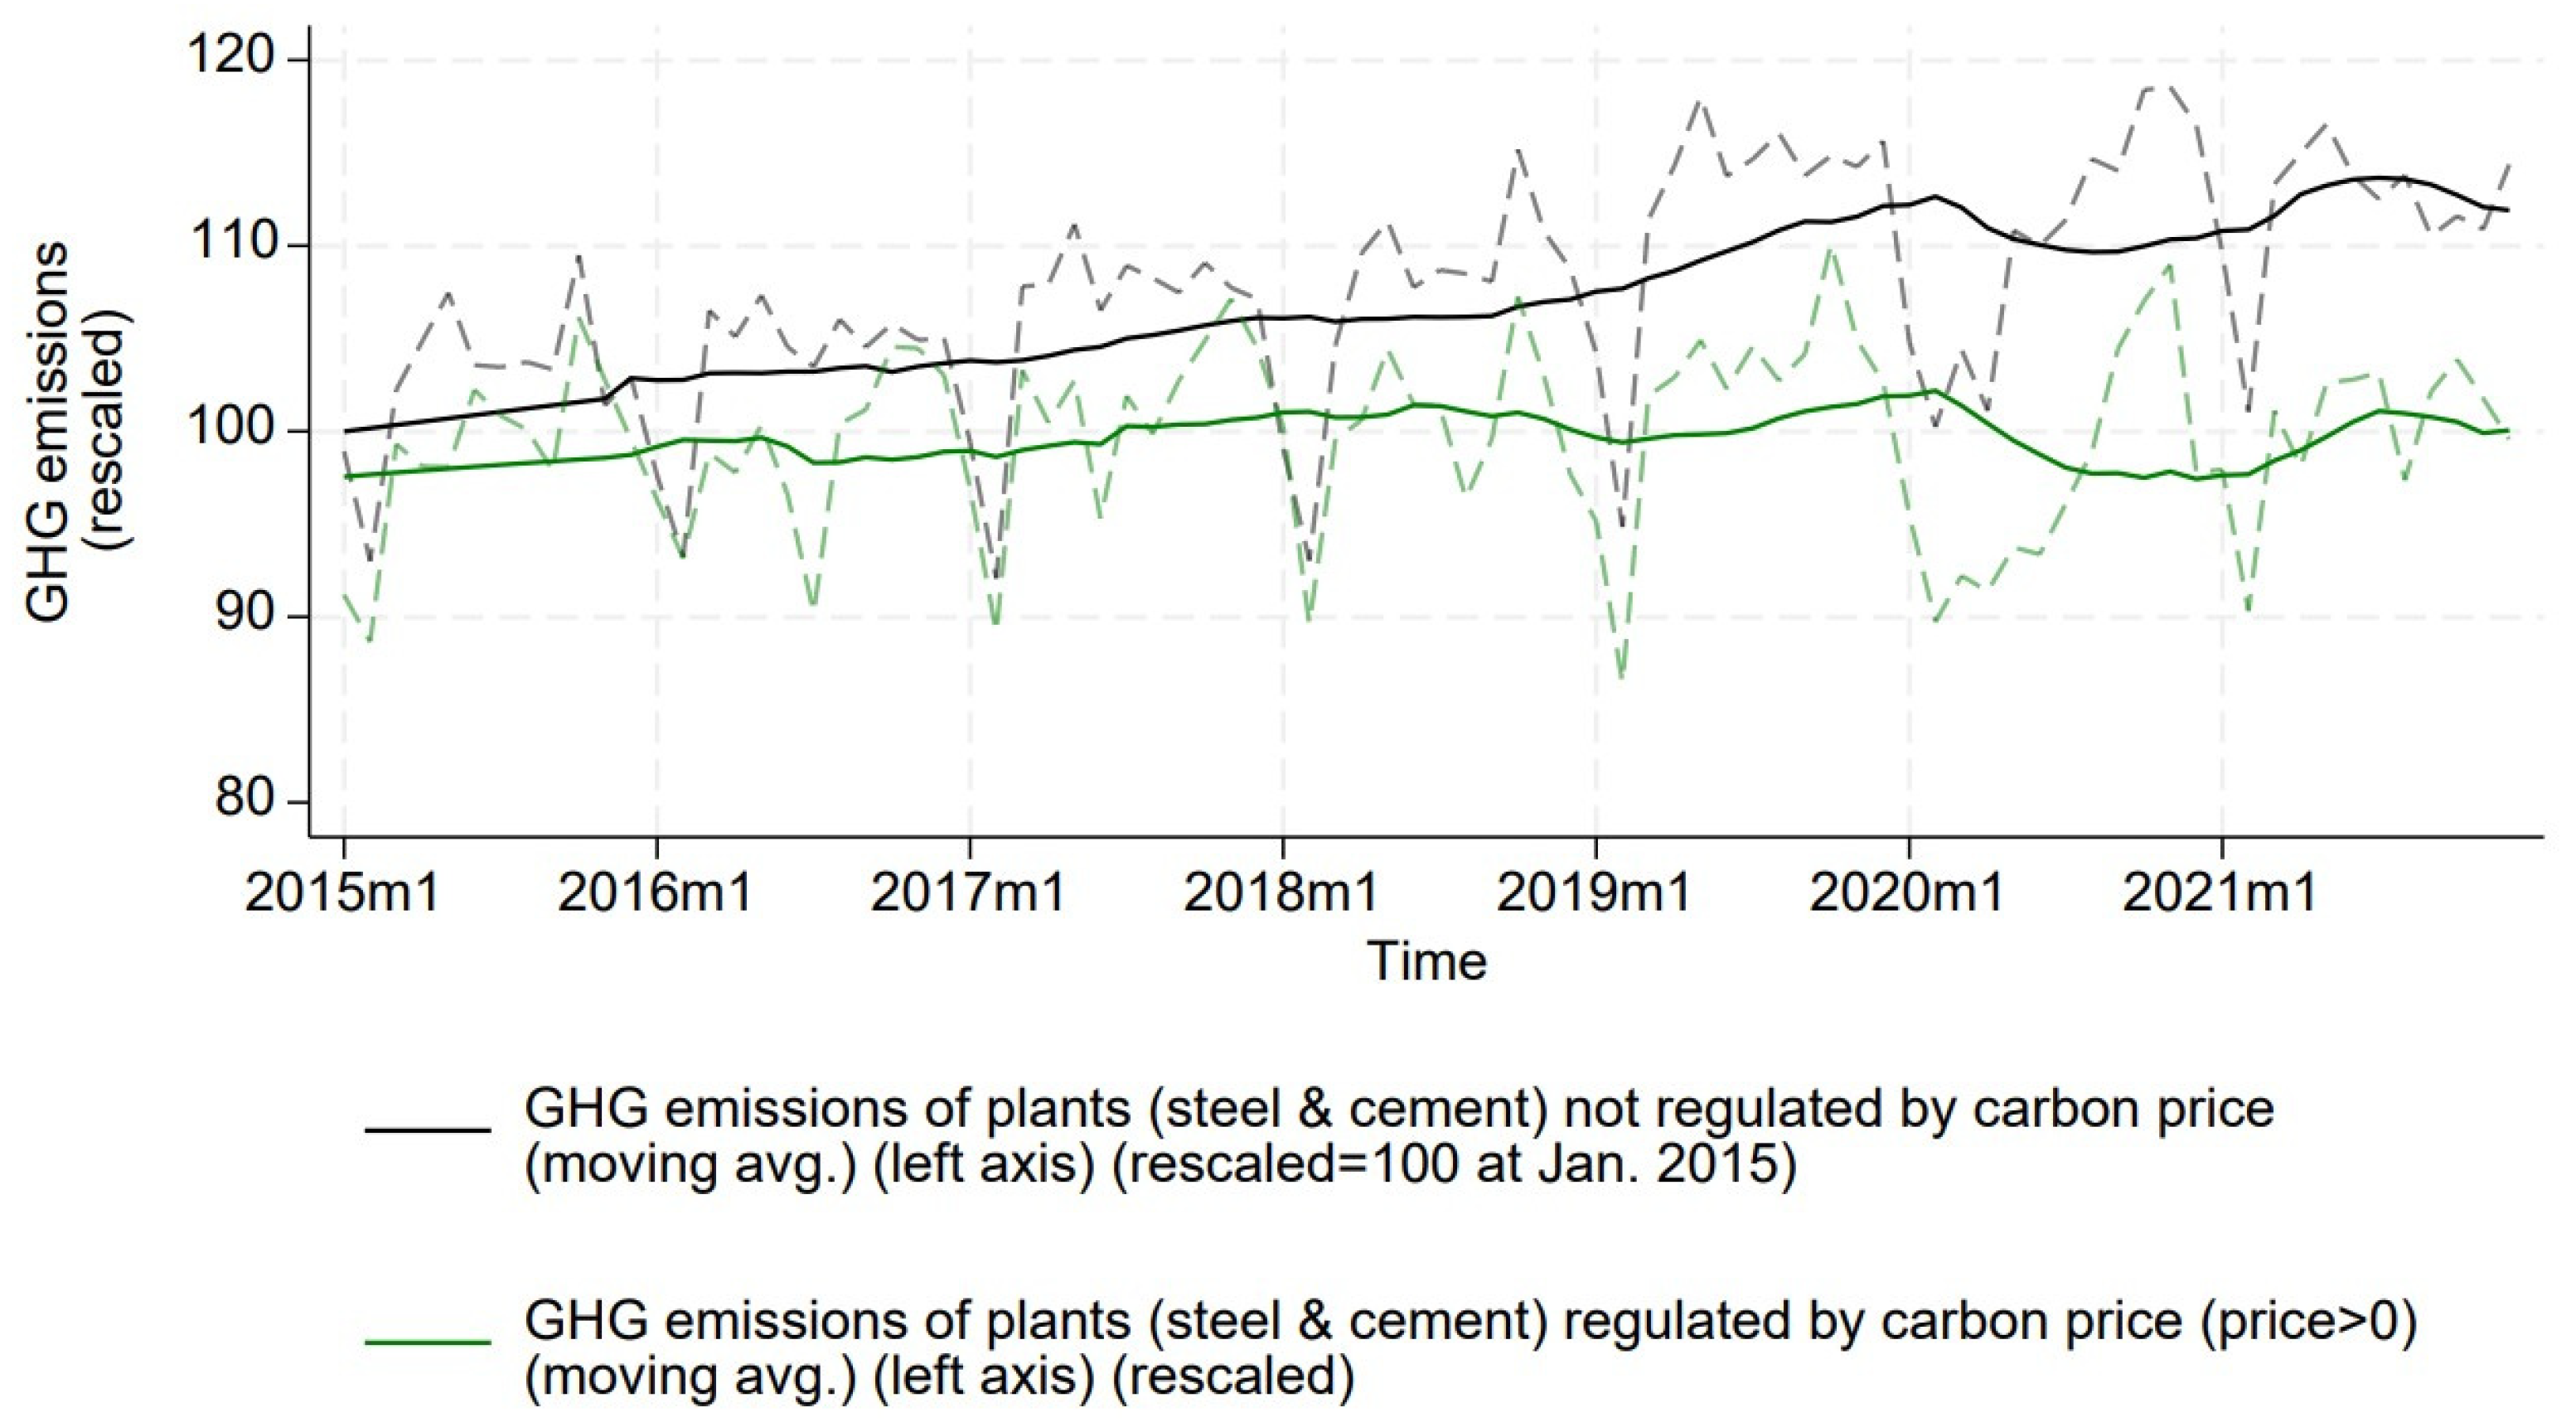
58]. Experts attribute this partly to the surge in renewables and gradual policy tightening, to which the ETS contributes by incentivizing efficiency in the power sector. One empirical analysis found that industrial plants under a carbon price (in sectors like power, steel, cement) held their emissions flat from 2015 to 2022 (
Figure 5), whereas similar plants without a carbon price saw emissions rise, indicating the pricing mechanism is constraining growth in emissions [
59].
Going forward, the effectiveness of China’s carbon market will hinge on stricter caps or lower benchmark levels. If these tighten in line with China’s carbon peaking goals, it is projected that the ETS could contribute substantially to bending down the emissions curve by 2030 (helping China peak emissions before 2025 and drive CO
2 lower thereafter) [
60].
5.2. South Korea Case
South Korea launched its emissions trading system (K-ETS) in January 2015, establishing East Asia’s first nationwide cap-and-trade program. Building on the Target Management System (TMS) introduced in 2012, the K-ETS evolved through multiple phases. Phase I (2015–2017) focused on building operational capacity, ensuring a smooth launch, and establishing monitoring, reporting, and verification (MRV) frameworks. During this phase, allowances were allocated 100% free, leveraging the TMS experience. Phase II (2018–2020) expanded the system’s scope, increased emission reduction targets, and improved verification standards. Free allocation was reduced to 97%, with 3% auctioned to encourage market activity. Phase III (2021–2025) marked a period of market maturation, featuring increased credit supply flexibility, voluntary reduction incentives, and further reductions in free allocation to less than 90%, with over 10% auctioned [
61,
62].
5.2.1. Implementation of K-ETS
Building on these phases, key reforms in 2023 further enhanced market functionality. Compliance procedures were streamlined, aligning deadlines for compliance and banking applications to reduce administrative burdens. Holding limits for Korean Allowance Units (KAUs) were increased, while the offset credit system became a vital cost-containment tool. Entities could meet up to 5% of their compliance obligations using domestic or international credits, subject to strict criteria. By 2023, 292 offset methodologies had been registered, including 211 for CDM and 81 for domestic credits, directly supporting South Korea’s 2030 NDC targets [
63].
The K-ETS has demonstrated significant growth in market performance since its inception. Trading volumes surged from 5.7 million tons in 2015 to 39.2 million tons by 2018, with 257.2 M tons CO
2e traded by August 2022, while cumulative auction revenues surpassed KRW 1092.6 billion (USD 845.2 million) by 2023. The Market Stability Reserve played a key role in maintaining price stability by releasing additional allowances, adjusting banking limits, and implementing temporary price floors when needed. For instance, a price floor of KRW 7020 was introduced in 2023 to address a sharp decline in KAU prices. By 2023, the system covered 804 major emitters, showcasing its success in fostering market development, and supporting Korea’s broader carbon reduction goals [
64,
65,
66]
Supporting these outcomes is the K-ETS which operates on a well-developed market infrastructure centered on robust MRV protocols. At its core, the GHG Management System ensures centralized data collection and processing, while the Korean Exchange provides real-time market updates. The system builds upon the foundation established by the Target Management System (TMS), which facilitated the collection of verified emissions data and training in the MRV process. The framework includes stringent annual reporting requirements where entities must submit verified emissions reports by the end of March, followed by third-party verification and certification by the Ministry of Environment’s Certification Committee by the end of May. Compliance mechanisms, such as banking allowances across phases and borrowing up to 15% during phases III, provide flexibility while maintaining strict enforcement. Non-compliant entities face penalties of three times the market price of allowances or KRW 100,000 per ton, which encourages accurate reporting and emissions reduction (compliance rate >99% in 2021). The market infrastructure is designed to provide transparency, support market integrity, and align with South Korea’s national carbon reduction objectives [
63].
Despite its successes, the K-ETS has faced key challenges, such as balancing market stability with flexibility. Structured interventions by the Allocation Committee, triggered by price thresholds or trading volume changes, have effectively addressed price volatility. These interventions include allowance auctions, adjustments to holding limits, and modifications to borrowing and offset limits, which successfully stabilized prices in 2023. Another challenge has been integrating offset credits without compromising environmental integrity. The system mitigates this by capping offset usage at 5% per entity and enforcing strict eligibility criteria for domestic and international credits.
Looking ahead, the K-ETS is poised for further evolution. Planned reforms include the introduction of carbon price-linked financial products, expanded future markets by 2025, and increased market access for financial institutions. The Phase 4 Basic Plan, scheduled for completion by December 2024, aims to align the K-ETS with South Korea’s enhanced NDC target of a 40% reduction below 2018 levels by 2030. Key enhancements will include increased auction shares, cap adjustment pathways, and the introduction of the Korean Market Stabilization Reserve. These developments reflect the system’s continued adaptation to more ambitious climate goals and its commitment to integrating emissions reduction with sustainable economic transformation.
5.2.2. Empirical Support for Korea’s ETS Carbon Pricing Outcomes
By Phase III, KETS coverage expanded to ~73.5% of national GHG emissions, encompassing 685 large emitters across power, industry, buildings, transport, waste, and aviation. Not only does it cover direct emissions, but also indirect emissions from electricity use, making its scope quite broad [
66]. In practice, this means almost 90% of South Korea’s total emissions face a carbon price signal when including the KETS and complementary fuel taxes [
3]. In 2021, an OECD analysis found 96.5% of CO
2 emissions from energy use in Korea were priced in some form, with the ETS permit price alone covering ~80% [
66]. The carbon price in Korea’s ETS started modest—in 2015 it was under USD 10—and remained in the single digits (USD) for several years. In 2022, the average traded price was around KRW 10,000 per ton (~USD 7.7). This relatively low price reflected ample free allocation and past oversupply of permits, but recent reforms are aimed at boosting ambition. South Korea’s government has begun auctioning a growing share of allowances (at least 10% must be auctioned, with more for power companies) and tightening the overall cap. Total ETS emission allowances for 2024 are set at 547.9 MtCO
2e and will decline thereafter aligned with Korea’s pledge to cut emissions 40% below 2018 levels by 2030 [
64].
The KETS has delivered a measurable slowdown in emissions growth. After decades of rising GHG output, Korea’s emissions plateaued around 2018–2019 and have since started to decline modestly [
66]. While it is hard to attribute this solely to the ETS (other policies and economic factors play a role), the carbon price has integrated into business planning. Power companies and manufacturers now include carbon costs in operations, and the government reports that the ETS has mobilized around KRW 1.18 trillion (~ USD 900 million) in auction revenue to fund green projects and industry upgrades [
64]. Crucially, the feared negative impacts on competitiveness have been limited so far. A study of firms on the KOSPI stock exchange found the ETS’s financial impact to be manageable, with no significant drop in profitability for most regulated companies [
67]. This is partly due to policy design (gradual implementation, free permits for trade-exposed sectors) and companies’ efforts to innovate (energy efficiency, process improvements) to reduce their carbon costs. South Korea is continually refining its system; for example, in 2023, it introduced a market stability reserve and loosened banking limits to improve liquidity [
64]. With these enhancements and the legal mandate for carbon neutrality by 2050, the KETS is expected to ramp up stringency. By driving emissions reductions (especially in power and heavy industry) and funding low-carbon investments, carbon pricing is set to play a central role in South Korea’s climate strategy.
5.3. Lessons from China and South Korea Through FASTER Principles
The comparative analysis of carbon pricing implementation between China and South Korea through the FASTER principle’s framework reveals distinct yet successful approaches to market development. This section focuses on key differentiating factors and success elements across the FASTER dimensions, followed by emerging markets.
Comparative Analysis Through FASTER Principles
Table 2 presents a comparative analysis of carbon pricing implementation between China and South Korea through the FASTER principles’ framework.
In terms of fairness, both nations demonstrate distinct approaches to sectoral implementation. China adopts a phased sectoral strategy, initiating with the power sector at 4.38 tons CO2e and employing differentiated benchmarks (0.877 tCO2/MWh for conventional coal, 0.893 tCO2/MWh for unconventional coal). The system incorporates output-based allocation mechanisms with regional considerations to protect local interests. In contrast, South Korea has progressed through a three-phase evolution, transitioning from 100% free allocation to <90% by Phase III, while implementing sector-specific allocations that account for trade exposure considerations.
Both countries have ambitious climate targets but use different approaches. China aims for peak emissions by 2030 and carbon neutrality by 2060. It integrates carbon pricing with national goals through a multi-tiered governance system. South Korea demonstrates stronger near-term targets, pursuing a 40% reduction below 2018 levels by 2030 and carbon neutrality by 2050 through the Carbon Neutral Framework Act. Their system is notably integrated with the Target Management System for smaller entities.
The stability mechanisms reveal distinct institutional approaches. China implemented a three-year national rollout (2018–2021) and plans expansion to eight industries by 2024. Their system maintains a steady price range of CNY 40–60 tCO2e. South Korea has established more advanced stability measures, including a Market Stability Reserve with intervention triggers and a predictable sector expansion framework across 23 sub-sectors in multiple phases. They have also implemented a price floor mechanism (KRW 7020 implemented in 2024).
Transparency frameworks in both nations exhibit robust but differently structured systems. China has developed a multi-tiered MRV system with 408 verification agencies and maintains a data reporting system with provincial oversight, complemented by regular public reporting requirements. South Korea has established a more centralized approach through the GIR Certification Committee and implemented a Centralized Data Management System. They mandate annual reporting with verified emissions disclosure and have appointed market makers to enhance market liquidity.
Economic efficiency measures demonstrate varying approaches to cost management. China focuses on regional implementation, offering flexible compliance options through regional pilots and maintaining relatively low implementation costs (CNY 200,000 facility/year). However, studies indicate that there remains substantial potential for improvement in energy efficiency and CO
2 emission performance across various provinces, suggesting that current measures may not fully capitalize on all available efficiencies [
68]. South Korea has developed more detailed financial mechanisms, including diverse trading options like banking and borrowing with interest rates up to 5%. They have also established a Climate Response Fund for mitigation efforts. Empirical analyses suggest that South Korean cities exhibit higher energy efficiency and CO
2 emission performance compared to their Chinese counterparts, indicating a more effective utilization of resources within its carbon pricing framework [
68].
Regarding reliability, both nations have achieved significant compliance rates, though through different mechanisms. China reports a >95% compliance rate among 2162 power generators and has established strong infrastructure with 80,000 officials for registry and trading settlement. South Korea maintains an impressive >99% compliance rate and has implemented a triple penalty system (market price or KRW 100,000/ton) along with 292 registered methodologies. Their system demonstrates strength in methodological rigor and enforcement mechanisms.
This comparative analysis reveals that, while both nations have established robust carbon pricing systems, they have adopted different implementation strategies reflecting their unique economic and institutional contexts. South Korea’s system generally demonstrates more structured market mechanisms and stability measures, while China’s approach emphasizes gradual expansion and regional considerations in its implementation strategy.
6. Comparison of Emissions Trading System and Implications for Emerging Markets
China and South Korea’s carbon pricing systems represent fundamentally different regulatory philosophies that have significant implications for emerging markets. This section critically examines these contrasting approaches across key dimensions to identify the advantages, limitations, and transferability of each model.
Dimension 1. Regulatory Philosophy and Market Design.
China’s carbon pricing approach exemplifies a flexible, growth-accommodating regulatory philosophy. The system employs intensity-based benchmarks rather than absolute caps, allowing for continued industrial expansion while improving carbon efficiency. This rate-based allocation system permits production increases as long as carbon intensity improves, reflecting China’s prioritization of economic development alongside environmental objectives. In contrast, South Korea implemented a more stringent absolute cap system that places firm limits on total emissions regardless of economic growth. This approach reflects South Korea’s stronger emphasis on environmental certainty, with economic adaptation expected to follow environmental constraints. These philosophical differences manifest in concrete market design choices. China’s benchmark system for power generation (0.877 tCO2/MWh for conventional coal, 0.893 tCO2/MWh for unconventional coal) provides flexibility for regional economic differences while incentivizing efficiency improvements. South Korea’s approach of steadily decreasing absolute caps (536.9 MtCO2e in Phase I to 394.1 MtCO2e in Phase III) creates stronger emissions reduction certainty but potentially higher economic adjustment costs. For emerging markets, this represents a critical policy choice between environmental certainty (South Korea model) and economic flexibility (China model), with significant implications for both climate outcomes and development pathways.
Dimension 2. Strategic Implementation and Sectoral Approach.
China adopted a narrow-but-deep implementation strategy, focusing initially on the power sector while covering over 2000 entities. This sector-specific approach enabled concentrated capacity-building within a manageable scope before expansion. South Korea chose a broad-but-comprehensive strategy, covering 73.5% of national emissions across multiple sectors from inception, including power generation, industry, buildings, waste, and domestic aviation, but with fewer total entities (approximately 800). The South Korean approach prioritized comprehensive emissions coverage while China emphasized system capacity development. The implications of these contrasting sectoral approaches are significant for emerging markets. China’s model offers advantages in administrative feasibility and targeted capacity building, particularly valuable for countries with limited initial technical capabilities. Evidence from China’s pilot programs demonstrated this approach could achieve significant emission reductions (30–40% within covered sectors) while building implementation capacity. South Korea’s comprehensive model offers greater environmental coverage but requires more extensive initial monitoring and administrative systems. For emerging markets with limited institutional capacity, China’s phased sectoral approach may provide a more feasible implementation pathway, while countries with stronger existing environmental governance systems might benefit from South Korea’s comprehensive coverage.
Dimension 3. Market Development and Price Management.
Market development requires careful attention to price management and trading mechanisms, with both nations demonstrating different but effective approaches to market stability. China’s maintenance of price stability in the CNY 40–60/ton range through supply management shows how gradual market development can support price discovery, achieving trading volumes of 250 million tons by 2023 with 240 active trading days. The system’s two-phase expansion approach (2024–2026 and post-2027) demonstrates commitment to systematic market development. This approach prioritizes price predictability over strong price signals. South Korea’s Market Stability Reserve, with a price floor mechanism of KRW 7020 implemented in 2023, allows for higher but potentially more volatile prices (KRW 8000–30,000/tCO2e). South Korea’s system provides stronger price signals but requires more sophisticated market intervention capabilities. The empirical evidence demonstrates the implications of these approaches. China’s system maintained stable compliance rates (99.5% among 2162 power generators) with relatively low-price volatility but potentially weaker abatement incentives. South Korea’s approach generated higher carbon prices that more closely reflect marginal abatement costs but required more frequent market interventions to manage volatility. For emerging markets, this represents a fundamental tradeoff between price stability (China’s approach) and stronger abatement incentives (South Korea’s approach). The appropriate balance depends on market readiness, institutional capacity for managing price volatility, and the degree of economic transformation required to meet climate objectives.
Dimension 4. Governance Structure and Administrative Requirements.
China and South Korea use different governance approaches. China employs a multi-tiered system with national oversight but provincial implementation. This creates regional flexibility but may cause coordination problems. South Korea established a more centralized system with the Ministry of Environment maintaining primary authority and three specialized institutions handling specific functions: registry management (GIR), trading platform (KRX), and certification (Certification Committee). These structural differences reflect fundamental choices about administrative design and governmental coordination. The administrative requirements of these systems have significant implications for emerging markets. China’s decentralized approach accommodates varied regional capacities but creates potential consistency challenges, as evidenced by ongoing data quality issues despite significant enforcement resources (80,000 officials). South Korea’s centralized system enables more consistent implementation but may be less responsive to regional economic conditions. For emerging markets with diverse regional economic structures and varying sub-national capacities, China’s model may offer advantages in implementation flexibility. Countries with more centralized administrative structures or smaller geographical scope may benefit from South Korea’s more integrated approach.
Dimension 5. Policy Integration Framework.
China and South Korea demonstrate contrasting approaches to integrating carbon pricing with broader policy landscapes. China uses a coordinated but compartmentalized approach, maintaining separate policy instruments with coordination mechanisms. Their ETS aligns with energy efficiency targets in the 14th Five-Year Plan and coordinates with the Renewable Portfolio Standard, allowing specialized agencies to retain authority while requiring cross-agency collaboration. This approach minimizes institutional disruption while enabling policy alignment across different domains. South Korea implemented a centralized integration strategy embedding carbon pricing within the Framework Act on Carbon Neutrality, with explicit linkages to sectoral roadmaps and its NDC target (40% reduction below 2018 levels by 2030). Their system directs auction revenues to the Climate Response Fund and includes an offset mechanism allowing entities to meet up to 5% of compliance obligations using credits from 292 registered methodologies (211 CDM, 81 domestic). The Ministry of Environment maintains oversight across multiple climate policy instruments. For emerging markets, China’s model offers advantages where institutional structures are fragmented, or jurisdictional concerns exist. South Korea’s approach provides stronger policy consistency but requires more substantial institutional reforms. The choice between models should consider existing governance structures and policy priorities. Regardless of approach, effective integration requires identifying potential conflicts between carbon pricing and existing subsidies or industrial policies, with clear coordination mechanisms established during implementation.
This critical comparison reveals that neither the Chinese nor South Korean model offers a universally superior approach. Instead, each presents distinct advantages and limitations that must be evaluated based on specific emerging market conditions and priorities. The Chinese model offers advantages in implementation feasibility, economic flexibility, and incremental capacity building, making it potentially more appropriate for larger emerging economies with significant development needs and limited initial capabilities. The South Korean model provides stronger environmental certainty, more robust price signals, and comprehensive emissions coverage, potentially better suited for more advanced emerging economies with stronger existing governance systems and higher climate ambitions. The optimal approach for a specific emerging market will depend on several critical factors:
Development Stage and Priorities: Economies prioritizing rapid industrial development may benefit from China’s flexible approach, while those focusing on economic transformation may find South Korea’s model more appropriate.
Institutional Capacity: Countries with limited monitoring and enforcement capabilities may need China’s phased sectoral approach, while those with stronger institutional frameworks can consider South Korea’s comprehensive model.
Economic Structure: Economies with high dependence on emissions-intensive industries may require China’s growth-accommodating approach, while more diversified economies might implement more stringent systems.
Policy Landscape: Countries with fragmented policy environments may benefit from China’s compartmentalized integration approach that minimizes institutional disruption, while those with more centralized structures might adopt South Korea’s comprehensive integration model.
Market Size and Complexity: Larger economies with diverse regional conditions may benefit from China’s multi-tiered approach, while smaller economies may achieve greater efficiency through centralized systems like South Korea’s.
Figure 6 illustrates how emerging markets can selectively adapt elements from China’s flexible, growth-accommodating carbon pricing model or South Korea’s more stringent, environmentally focused approach based on their specific development stage, institutional capacity, economic structure, policy landscape, and market complexity.
This analysis suggests that emerging markets should adopt contextualized approaches that selectively incorporate elements from both models rather than attempting wholesale replication of either system. The most effective implementation strategy will integrate the administrative feasibility of China’s model with the environmental ambition of South Korea’s system in proportions appropriate to local conditions and capabilities.
7. Policy Recommendations for Emerging Market’s Carbon Pricing Implementation: Malaysia as Case Study
The comparative analysis of China and South Korea’s carbon pricing systems reveals critical insights for Malaysia and similar emerging markets. Based on this analysis, we recommend the implementation of an Emissions Trading System (ETS) rather than a carbon tax for Malaysia, as an ETS offers greater flexibility, stronger institutional learning mechanisms, and better alignment with regional frameworks. This section translates these findings into a structured implementation framework for Malaysia’s carbon pricing development, addressing specific challenges emerging markets face while balancing economic competitiveness with environmental objectives.
7.1. Implementation Challenges for Malaysia and Similar Emerging Markets
Drawing from the experiences of China and South Korea, Malaysia faces several distinct challenges in implementing effective carbon pricing mechanisms. First, Malaysia exhibits significant technical and institutional capacity constraints, with only 8% of companies maintaining comprehensive GHG inventory systems and 35% having basic emissions monitoring. This mirrors challenges China faced during early implementation, where data quality issues persisted despite substantial enforcement resources (80,000 officials). South Korea’s transition from the Target Management System demonstrates how prerequisite monitoring systems are essential for effective carbon pricing. Second, Malaysia’s export-oriented economy (with manufacturing representing 25% of GDP) faces potential competitiveness impacts from carbon pricing. This echo concerns that shaped both China’s output-based allocation system and South Korea’s phased approach to auctioning. Malaysia’s position in global value chains makes these concerns particularly acute, especially with the implementation of mechanisms like the EU’s Carbon Border Adjustment Mechanism (CBAM). Third, the effectiveness of carbon pricing in Malaysia is undermined by existing fossil fuel subsidies creating a negative Net Effective Carbon Rate of EUR −24.83 per ton of CO
2e [
46]. This policy contradiction creates counterproductive incentives and reflects the alignment challenges South Korea addressed through its Framework Act on Carbon Neutrality and China through its coordination with the Five-Year Plan. Fourth, Malaysia’s limited experience with emissions trading (approximately 150,000 carbon credits traded through voluntary mechanisms) indicates potential market readiness and liquidity constraints. Finally, transition costs associated with carbon pricing create political economy constraints through resistance from affected industries and concerns about distributional impacts. This political economy challenge influenced both China’s rate-based allocation system and South Korea’s gradual transition from free allocation to auctioning.
7.2. Structured Implementation Framework for Malaysia
Addressing these challenges requires a carefully calibrated implementation strategy that draws selectively from both the Chinese and South Korean models while acknowledging Malaysia’s specific circumstances. The following implementation framework provides a pathway for effective carbon pricing for Malaysia.
7.2.1. Market Selection and Design
A phased approach of ETSs represents the most appropriate carbon pricing mechanism for Malaysia, beginning with a pilot phase targeting the power generation sector. This strategic sector selection reflects several considerations: the power sector accounts for 48.8% of national emissions through TNB and Independent Power Producers (IPPs), representing the largest concentrated emission source; the sector has relatively mature monitoring capabilities through existing environmental reporting systems; and the limited number of entities (approximately 45 major facilities) simplifies initial implementation. This sector-specific approach mirrors China’s successful implementation strategy while addressing Malaysia’s largest emission source. Following South Korea’s proven threshold model, the system should encompass facilities emitting more than 25,000 tCO2e annually, with sector-specific benchmarks established for different types of power generation facilities. The initial design should employ output-based allocation with intensity benchmarks rather than absolute caps, accommodating economic growth while incentivizing efficiency improvements. The empirical evidence from China’s system demonstrates that this approach can achieve emission intensity reductions of 3.8% annually while maintaining economic growth.
7.2.2. Implementation Timeline and Sectoral Expansion
A carefully phased implementation timeline is essential: Phase 1 (2025–2026) would establish the legal framework, registry system, and MRV guidelines, conducting pilot trading among power generators. Phase 2 (2027–2028) would expand to cement and steel sectors, begin partial auctioning (5% for power sector), and implement a price floor mechanism at MYR 15 per tCO2e. Phase 3 (2029–2030) would expand to chemical and petrochemical industries, increase auctioning percentages (15% for power sector, 5% for other sectors), and implement more sophisticated market mechanisms, including limited cross-border trading pilots.
7.2.3. Price Management and Market Stability
Based on comprehensive analysis of regional carbon pricing implementations, Malaysia should implement a calibrated price corridor of MYR 15–60 per tCO2e in initial phases. This range aligns with regional benchmarks: Singapore began with SGD 5/tCO2e (approximately MYR 17) in 2019, Indonesia implemented IDR 30,000/tCO2e (approximately MYR 8–9) in 2024. More mature systems in the region provide upper-bound references, with China’s ETS trading at CNY 40–60/tCO2e (approximately MYR 25–38) and South Korea’s system at KRW 8000–12,000/tCO2e (approximately MYR 25–39). This calibrated range acknowledges the importance of a gradual transition for Malaysian industries while still providing sufficient incentive for emissions reduction activities. A Market Stability Reserve holding 5% of total allowances, with intervention mechanisms triggered at specific price points (above MYR 70 or below MYR 10 for consecutive trading days) would provide necessary stability while allowing for price discovery. Banking provisions allowing entities to carry forward allowances between compliance periods, similar to South Korea’s approach, and limited borrowing options (up to 10% of compliance obligations) would provide temporal flexibility.
7.2.4. Governance Structure and Market Infrastructure
The governance structure should balance centralized oversight with implementation flexibility. The Malaysian Green Technology and Climate Change Corporation (MGTC) should serve as the central coordinating agency, with sector-specific technical working groups developing appropriate benchmarks. The existing Bursa Malaysia infrastructure provides the foundation for trading platform development, while a separate verification framework ensures data integrity. At the same time, the existing technical systems need significant enhancements, which includes development of a centralized registry system linking emitters, verifiers, and trading platforms; implementation of standardized reporting templates and verification protocols; establishment of a transparent allowance allocation system; and integration with international standards to facilitate future market linkages. This governance structure could address the institutional capacity constraints identified in the analysis while creating a foundation for market development.
7.3. Balancing Economic Competitiveness with Carbon Pricing Effectiveness
The comparative analysis reveals several mechanisms to balance economic competitiveness with carbon pricing effectiveness. Malaysia should implement sector-specific benchmarking and output-based allocation, which can reduce compliance costs by 15–30% compared to uniform standards while maintaining environmental integrity. Following South Korea’s model, Malaysia should maintain strategic free allocation for trade-exposed sectors, which effectively prevents carbon leakage while maintaining reduction incentives. For Malaysia’s manufacturing sectors, which represent 25% of GDP and face international competition, this targeted approach provides protection during transition periods. This is particularly important given the more modest initial carbon price corridor (MYR 15–60/tCO2e), which helps address competitiveness concerns while the market develops.
Auction revenues should be directed toward industrial transformation programs emission reduction technology development, and targeted relief for affected sectors through revenue recycling. Revenue recycling is critical for maintaining political support and economic competitiveness [
69]. South Korea’s Climate Response Fund provides a model for this approach, directing resources toward mitigation activities while supporting economic transition. Carbon pricing should be integrated with complementary policies including renewable energy incentives and green finance mechanisms. Integrated policy packages has been proven achieve more cost-effective outcomes than carbon pricing alone [
12]. Malaysia’s existing Climate Change and Principle-based Taxonomy (CCPT) framework provides a foundation for financial sector support in this transition. Regional coordination was observed a reduction of competitive distortions while creating more efficient carbon markets [
70]. Singapore’s carbon tax implementation (starting at SGD 5/tCO
2e in 2019 and progressively increasing) and Indonesia’s early stage carbon tax (IDR 30,000/tCO
2e implemented in 2024) create opportunities for regional alignment as these systems mature.
8. Conclusions
This study’s comparative analysis of carbon pricing mechanisms in China and South Korea provides valuable insights for emerging markets transitioning to low-carbon economies. Through the FASTER principles framework, we identify distinct approaches to balancing environmental objectives with economic development needs.
The comparison reveals fundamental differences in regulatory philosophy and market design. China implemented a rate-based allocation system with intensity benchmarks (0.877 tCO2/MWh for conventional coal) that accommodates economic growth while improving carbon efficiency. This approach achieved a 99.5% compliance rate among 2162 power generators while maintaining steady prices in the CNY 40–60/tCO2e range. In contrast, South Korea adopted an absolute cap system with comprehensive sectoral coverage (73.5% of national emissions) and a phased transition from free allocation to auctioning. Their system achieved >99% compliance through centralized stability mechanisms, including a Market Stability Reserve and price floor at KRW 7020. These contrasting models demonstrate that successful carbon pricing in emerging markets requires attention to three critical dimensions: market design adaptation to local conditions, regional integration potential, and development stage considerations. The Chinese model offers advantages in implementation feasibility, economic flexibility, and incremental capacity building, while the South Korean model provides stronger environmental certainty, more robust price signals, and comprehensive emissions coverage.
For Malaysia’s carbon market development, this comparative analysis suggests implementing a phased ETS approach beginning with the power sector (48.8% of emissions), establishing an initial price corridor of MYR 15–60 per tCO2e with market stability mechanisms, and adopting a graduated transition to auctioning (starting at 5% in 2027). Meanwhile, development stage considerations must guide the timing and stringency of carbon pricing implementation, ensuring that price signals reflect local economic conditions while maintaining compatibility with regional markets in Malaysia. This approach balances environmental objectives with economic competitiveness concerns particularly relevant to Malaysia’s export-oriented economy.
This study has several limitations. First, China and South Korea experiences may not fully reflect the challenges faced by smaller emerging economies with different institutional capacities and economic structures. Second, the analysis primarily focuses on market design aspects and may not fully capture political and social factors influencing implementation. Third, the rapidly evolving nature of carbon markets means these findings may need reassessment as market conditions change. Future research should investigate three key areas. First, institutional capacity development in emerging economies with varied governance structures and administrative capabilities. Second, the interplay between production-based versus consumption-based emission approaches and comparative advantage theory, particularly for export-oriented economies like Malaysia wherein carbon pricing may shift competitive positions in global value chains. Third, interactions between carbon pricing and complementary climate policies, including how carbon markets align with international frameworks under the Paris Agreement.
This paper demonstrates that emerging markets can develop effective carbon pricing mechanisms when adapted to their specific economic contexts and institutional capacities. By selectively incorporating elements from both Chinese and South Korean ETS models, emerging economies can design carbon pricing systems that advance climate objectives while supporting their unique development trajectories.


