1. Introduction
Mental health disorders represent one of the most significant public health challenges of the 21st century, particularly in rapidly developing regions such as Southeast Asia. These conditions, including depression, anxiety, and substance dependence, impose substantial economic and societal burdens by reducing productivity and increasing healthcare expenditures. According to Whiteford et al. [
1], mental health disorders are major contributors to disability-adjusted life years (DALYs), with their impact being particularly pronounced in regions undergoing rapid urbanization and environmental change.
Southeast Asia serves as a compelling case study for examining mental health challenges due to its unique convergence of rapid socioeconomic transformation, climate vulnerability, and cultural diversity. The region’s distinctive monsoon patterns, accelerating urbanization, and diverse healthcare infrastructure have created a complex environment where traditional mental health determinants interact with emerging environmental stressors. These conditions are increasingly linked to chronic diseases and premature mortality, challenging conventional healthcare approaches and necessitating integrated care models [
2]. The influence of socioeconomic factors on mental health outcomes has been well documented for decades, with established connections between the rising prevalence of mental health disorders and various socioeconomic challenges, including poverty, unemployment, low educational attainment, and limited access to quality healthcare services [
3]. These factors are often interconnected, forming a complex web of challenges that individuals and healthcare systems must navigate. The environmental dimension is increasingly recognized as a crucial factor in the complex interplay of influences affecting mental health, particularly in Southeast Asia’s climate-sensitive context. Climate-related variables, including extreme temperatures, natural disasters, and gradual environmental changes, are now acknowledged to have psychological impacts. The psychological consequences of exposure to or the anticipation of climate-related events may manifest in various mental health conditions, such as acute stress disorders, persistent depression, and anxiety disorders [
4]. Mental health epidemiology trends in Southeast Asia are distinctively shaped by socioeconomic, demographic, and urbanization factors [
3,
5]. Lund et al. [
5] identified socioeconomic status, education level, gender, and age as the significant determinants of mental health issues. The region’s rapid urbanization and associated lifestyle changes have further complicated the mental health landscape, with urban stressors and social isolation contributing to a higher prevalence of mental health disorders in urban areas [
6].
A critical gap in the current research lies in understanding how climate change, particularly temperature extremes, affects mental health outcomes in Southeast Asia’s unique environmental and sociocultural context. As global temperatures rise, the relationship between mental health and climate-related variables is becoming increasingly evident through both direct and indirect mechanisms. Direct associations exist between events, such as heatwaves and natural disasters, and the rising prevalence of post-traumatic stress disorder (PTSD), anxiety, and depression. Indirectly, climate change can exacerbate mental health issues by disrupting economic stability and social structures [
7,
8]. Factors, such as community support, access to mental health resources, and individual coping mechanisms, influence individuals’ vulnerability and resilience to these impacts [
9]. The relationship between climate indices and mental health is particularly significant in Southeast Asia. Hansen et al. [
10] highlighted the importance of the TN90p and TX90p indices, which measure warm nights and hot days, transforming them from mere meteorological data points into crucial indicators of the impact of environmental stress on mental health. Studies by Basu and Samet [
11] and Kim et al. [
12] have identified clear associations between the TN90p index and adverse health outcomes, including increased stress and mental health disorders. High temperatures act as physiological and psychological stressors, particularly for individuals with pre-existing conditions, such as schizophrenia, where thermoregulation is already impaired [
13]. Hospital admissions for mood and behavioral disorders increase significantly during periods of extreme heat [
10], suggesting that the rising frequency of hot days drive a greater demand for mental healthcare services. The impact of severe weather extends beyond its immediate effects, often resulting in long-term psychological consequences, including PTSD and anxiety-related conditions [
14]. Populations with prior exposure to severe weather events frequently experience heightened anticipatory anxiety and chronic stress [
15]. This effect is especially pronounced in poorly designed urban areas, where the urban heat island phenomenon exacerbates both the temperature extremes and socioeconomic challenges. The interplay between these interconnected factors—ranging from socioeconomic conditions [
3] to environmental stressors—necessitates sophisticated analytical approaches. While traditional epidemiological studies have established links between mental health and various socioeconomic challenges [
4], the growing influence of climate-related variables introduces new analytical complexities. The psychological consequences of climate events manifest across multiple dimensions, from acute stress disorders to persistent depression [
5], requiring advanced methodological frameworks capable of capturing these intricate relationships. The emergence of machine learning in public health research has significantly improved the ability to analyze complex datasets and predict health outcomes. Algorithms, including decision trees, Random Forests, Gradient Boosting, and Support Vector Machines, have enabled the examination of the factors influencing mental health mortality [
16]. These techniques have proven valuable for identifying risk factors and predicting intervention outcomes with improved precision [
17], while also providing new insights into climate change’s health impacts [
18]. However, challenges remain concerning data privacy, quality, and availability [
19,
20]. James et al. [
19] emphasized that machine learning models excel at handling high-dimensional data and identifying nonlinear correlations that traditional statistical methods might overlook. The application of machine learning in mental health research has been particularly impactful. Random Forest algorithms have effectively captured the complex interplay of demographic, socioeconomic, environmental, and genetic factors in mental health outcomes. Gradient Boosting Machines (GBMs) have advanced risk categorization and personalized intervention strategies [
21], while Support Vector Machines (SVMs) have proven robust at categorizing mental health risk factors, even with limited data [
22].
Despite the growing recognition of climate’s impact on mental health, current research remains constrained by significant gaps in the quantitative analysis of the climate–mental health relationship in Southeast Asia, an incomplete understanding of temperature extremes (particularly the TN90p and TX90p indices), and the limitations of traditional statistical methods for capturing the nonlinear interactions among these complex variables. These interrelated challenges have hindered the development of comprehensive frameworks capable of accurately predicting and explaining how climate factors influence mental health outcomes across diverse socioeconomic contexts and geographic regions, particularly in vulnerable populations with limited adaptive resources. This study addresses these methodological limitations by employing machine learning techniques—specifically a Random Forest model—to analyze the complex interplay between the socioeconomic, demographic, and climate factors that influenced mental health mortality in Southeast Asia over a 30-year period (1990–2019). By integrating healthcare quality metrics (HALE and PQLI) with climate stressors (TX90p and TN90p), this approach provides a more nuanced understanding of how these factors interact. The computational power of machine learning enables the identification of complex patterns and country-specific variations in climate sensitivity that traditional statistical methods often overlook. Building on this methodological foundation, the primary objective of this study is to determine the extent to which climate factors—particularly extreme temperatures—indirectly influence mental health mortality through socioeconomic pathways. While this research hypothesizes that climate variables may not directly predict mental health mortality, they are expected to interact significantly with socioeconomic vulnerabilities, exacerbating mental health risks. By quantifying these indirect effects, this study aims to develop a comprehensive framework that more accurately captures the complex relationship between climate change and mental health outcomes. The insights gained from this analysis will provide regional policymakers with evidence-based guidance for developing targeted interventions to mitigate the psychological impacts of climate change, particularly in high-risk communities.
2. Materials and Methods
This study employed a methodological framework to analyze the relationships between climate factors, socioeconomic conditions, and mental health outcomes across Southeast Asia from 1990 to 2019. First, data were collected and integrated from multiple authoritative sources, including mental health mortality data from the Global Burden of Disease study, climate indices from the Copernicus Climate Data Store, and socioeconomic indicators from various international databases. The analysis focused on eight Southeast Asian countries—Indonesia, Malaysia, Thailand, Laos, Myanmar, Vietnam, Cambodia, and the Philippines—selected based on data availability and their representation of diverse socioeconomic and environmental conditions within the region.
The analytical approach consisted of three main components. First, descriptive statistical analyses were conducted to examine the distribution and fundamental relationships among the variables. Second, a Random Forest machine learning model was implemented to assess the relative importance of different factors for predicting mental health outcomes. Spearman correlation was used to specifically examine the relationships between climate indices (TX90p and TN90p) and socioeconomic factors (population, PQLI, and HALE). The model’s performance was validated using cross-validation techniques, with particular attention to consistency across different geographical regions and population sizes. Throughout the analysis, special consideration was given to regional variations and country-specific patterns, recognizing the diverse geographical, cultural, and socioeconomic contexts within Southeast Asia.
2.1. Study Area
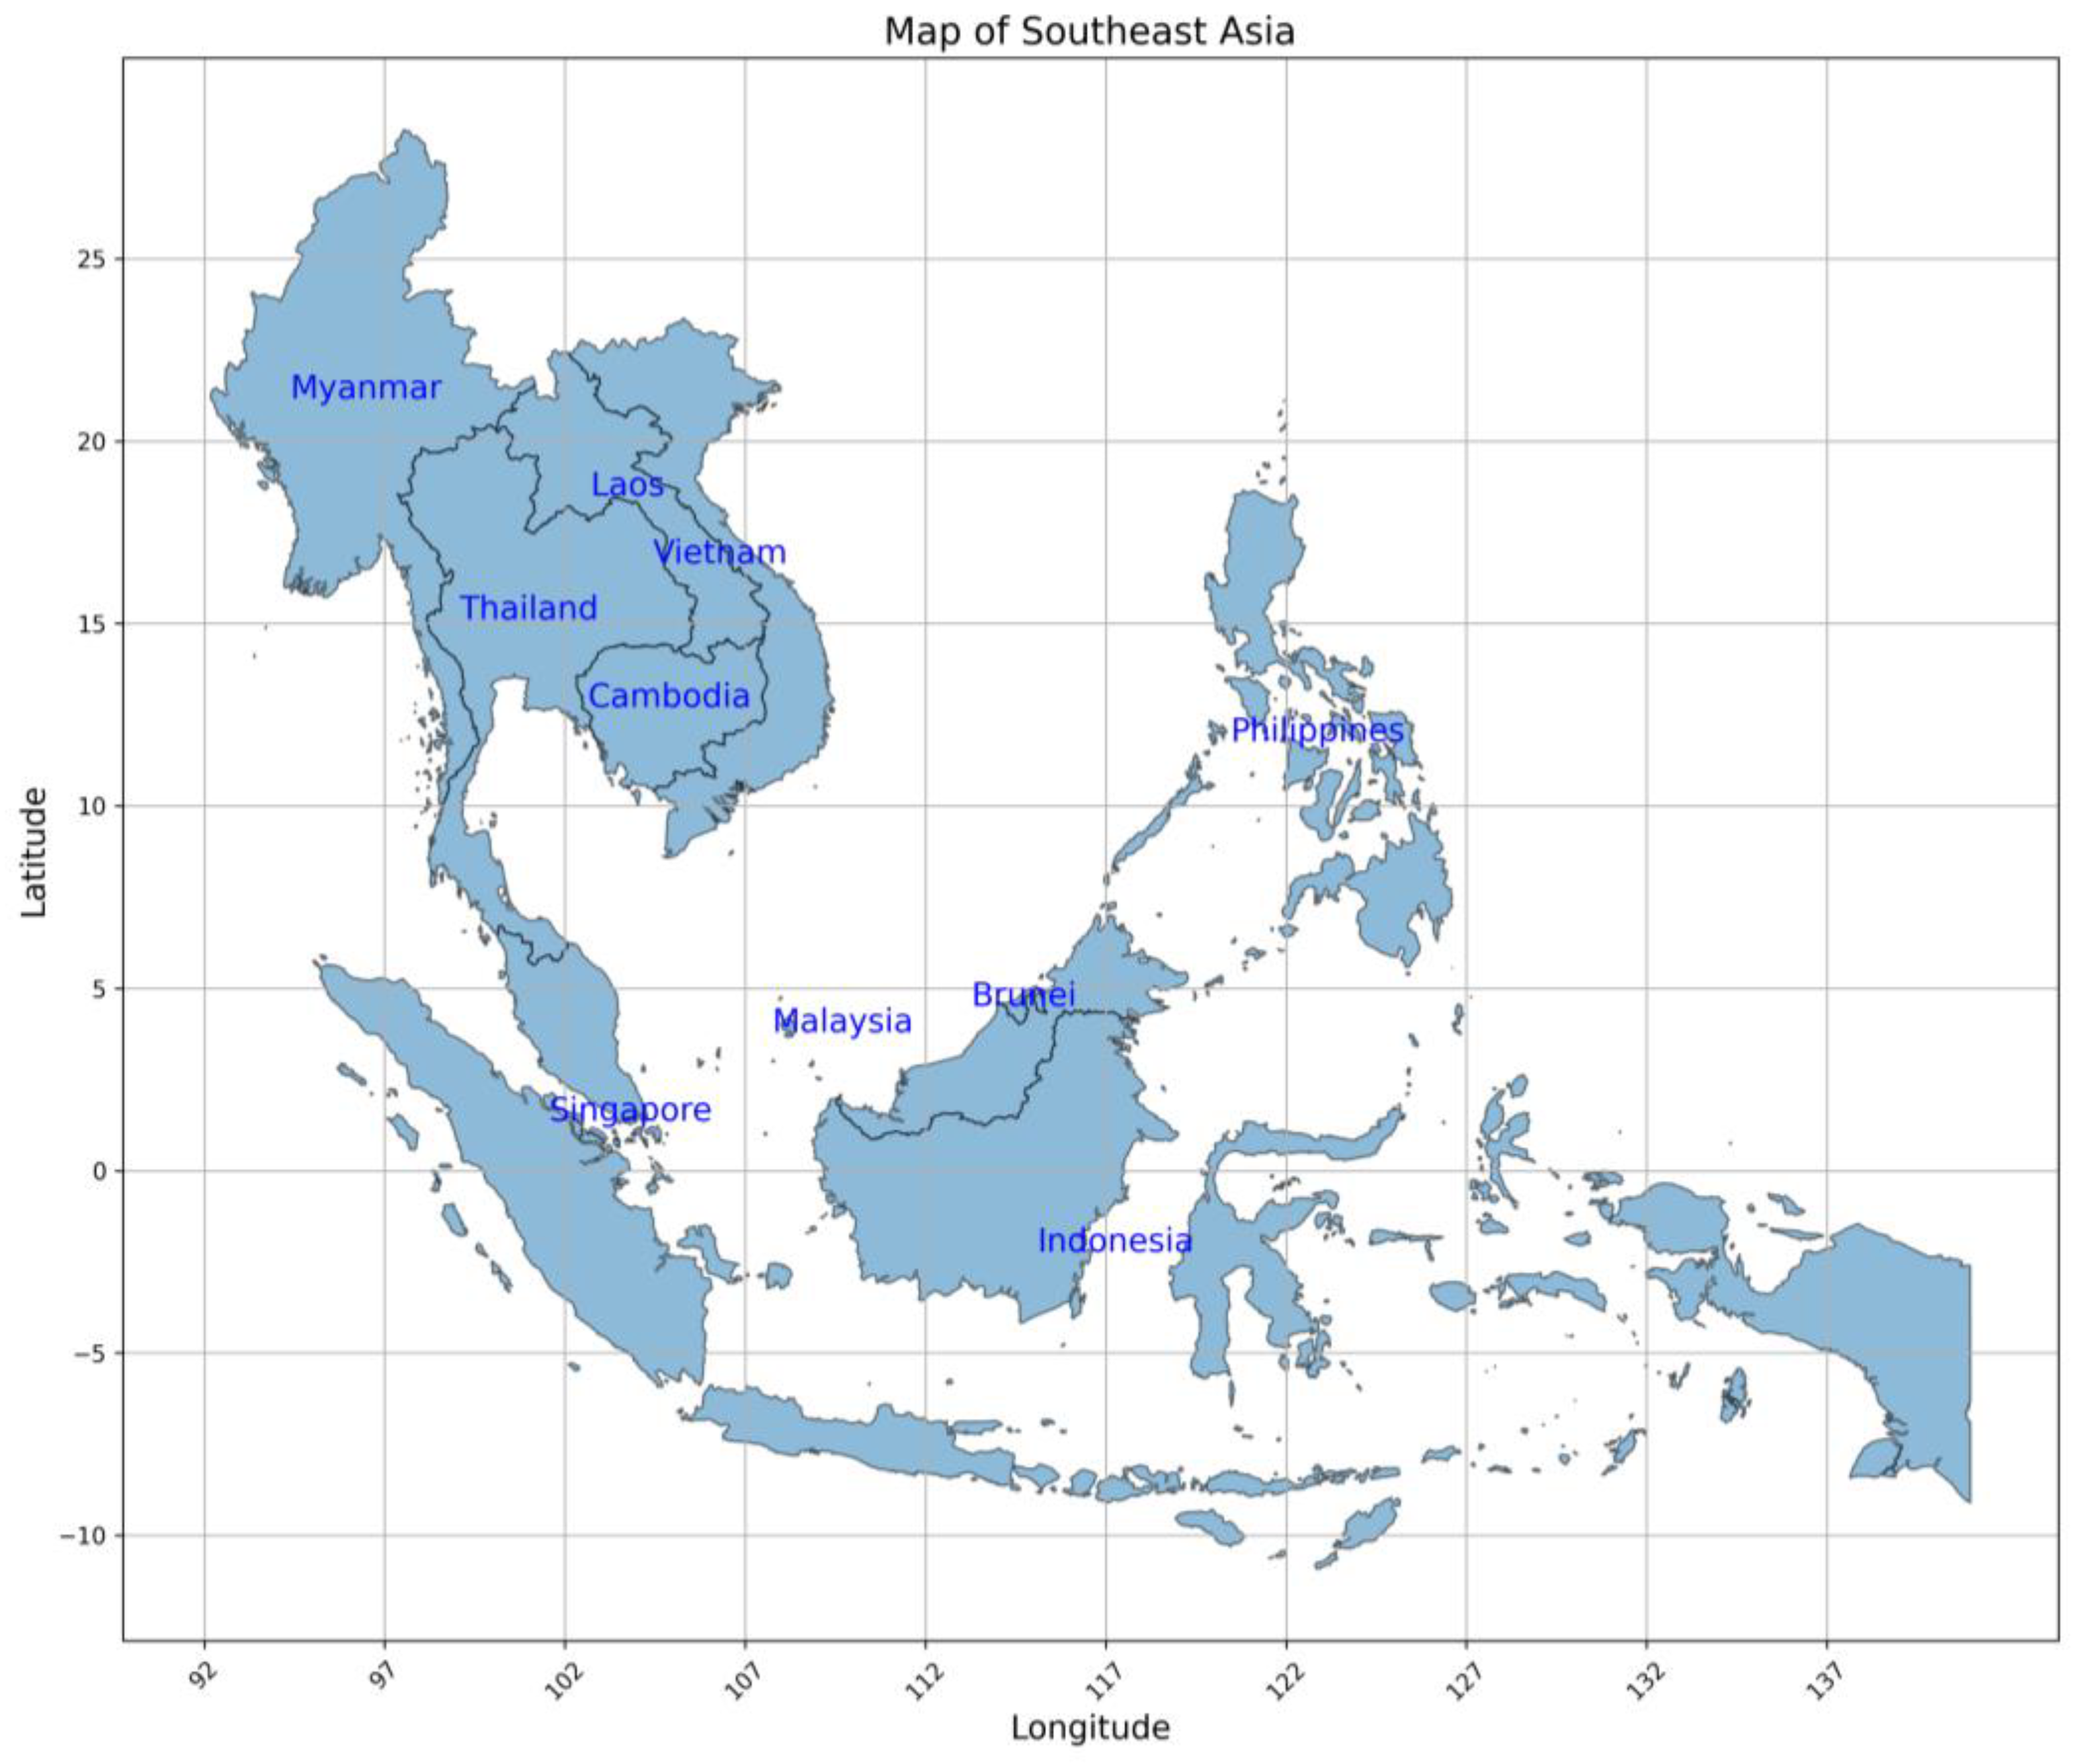
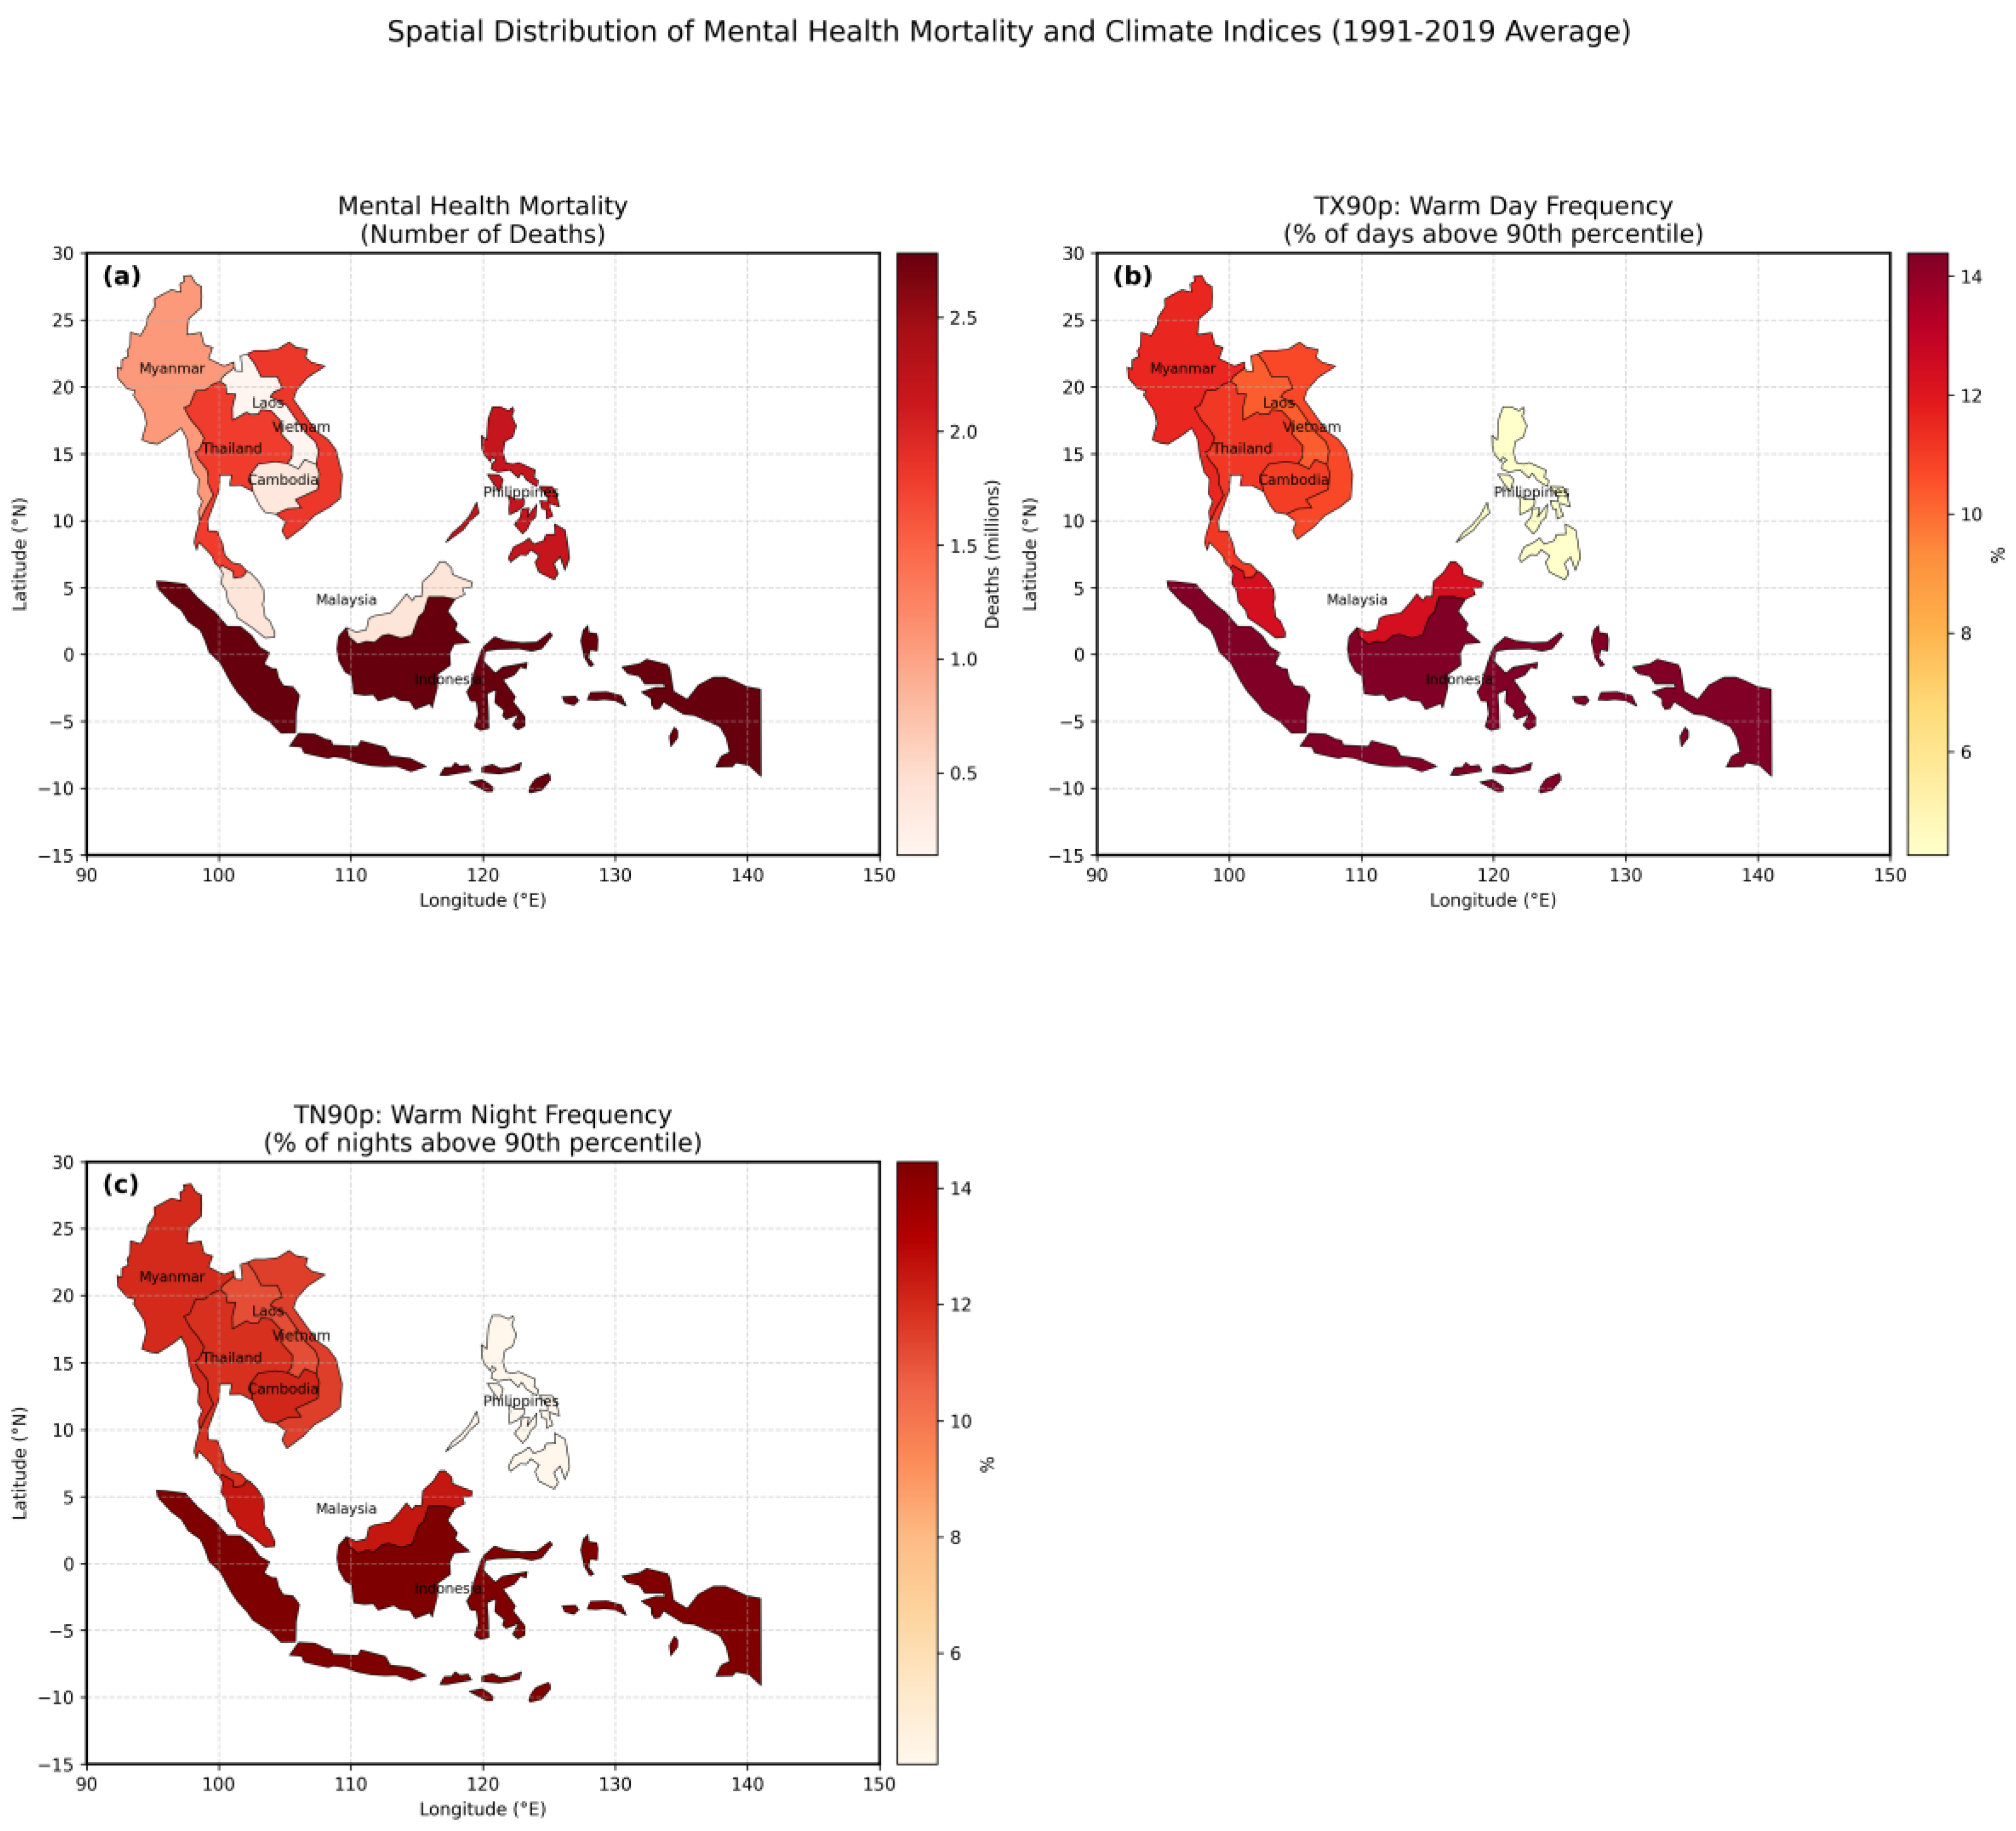
Southeast Asia is a distinctive geographical and sociocultural region strategically positioned between the Indian and Pacific Oceans (
Figure 1). This study includes eight countries selected to represent the region’s diversity: Indonesia, Malaysia, Thailand, Laos, Myanmar, Vietnam, Cambodia, and the Philippines. These nations were chosen based on three criteria: data availability across the 1990–2019 study period, representation of varied development stages, and coverage of different geographical and climatic zones within Southeast Asia.
The region’s climate characteristics make it particularly relevant for studying climate–mental health relationships. Southeast Asia experiences a tropical climate marked by high precipitation, elevated temperatures, and significant humidity throughout the year [
23,
24]. This study’s area spans diverse temperature zones, from tropical rainforests of Borneo to the temperate highlands of northern Vietnam [
25]. This climatic diversity is further influenced by monsoon patterns, which create distinct wet and dry seasons rather than conventional summer–winter cycles [
26]. These seasonal variations have important implications for understanding the temporal aspects of climate impacts on mental health outcomes.
Demographically, this study’s area encompasses approximately 655 million people, characterized by remarkable ethnic, religious, and linguistic diversity [
27]. This demographic composition varies significantly between urban and rural areas, with rapid urbanization posing distinct challenges for mental health service delivery. Urban populations experience unique stressors related to high population density and infrastructure development, while rural communities often contend with limited access to healthcare services.
The region’s economic landscape exhibits substantial variation in development levels and healthcare infrastructure. Countries, such as Singapore and Malaysia, have achieved significant economic advancement and maintain well-developed healthcare systems [
28]. In contrast, other nations rely more heavily on agricultural and natural resource sectors, resulting in disparities in healthcare accessibility and quality [
28]. Meanwhile, the manufacturing and service industries have expanded considerably, driving urbanization and economic transformation across the region [
28].
Southeast Asia is also undergoing a major demographic transition, marked by a large youth population that presents both opportunities and challenges. While this demographic shift could provide future economic advantages, it also brings challenges, such as urban congestion, environmental degradation, and the need to create employment opportunities aligned with the expanding workforce [
29]. These socioeconomic dynamics directly influence mental health outcomes through various pathways, including stress levels, healthcare access, and social support systems.
2.2. Data Description
This study integrates multiple datasets to analyze the relationship between climate, socioeconomic factors, and mental health mortality across Southeast Asia. The primary data sources include the Global Burden of Disease (GBD) dataset, the Physical Quality of Life Index (PQLI), and the climate indices TX90p and TN90p.
The GBD dataset, developed by the Institute for Health Metrics and Evaluation (IHME), provides comprehensive epidemiological estimates across different regions and time periods. This study utilizes GBD mortality data related to mental health conditions, Health-Adjusted Life Expectancy (HALE), and total population size of eight Southeast Asian countries—Indonesia, Malaysia, Thailand, Laos, Myanmar, Vietnam, Cambodia, and the Philippines—over a 30-year period (1990–2019). Mental health mortality is defined as deaths attributed to mental health-related disorders, including depression, anxiety, bipolar disorder, schizophrenia, and substance use disorders [
29]. HALE measures overall life expectancy adjusted for years lived in poor health due to disease or injury, while population size is included to control for country-specific differences in demographic scale and density. To ensure data completeness, missing values in the GBD dataset are addressed using multiple imputation techniques. If missingness is minimal (≤5%), mean imputation is applied, whereas predictive modeling-based imputation is used when patterns of missing data are detected. Data are standardized where necessary to maintain consistency across different years and countries. Additionally, outliers in population and mortality values are identified using interquartile range (IQR) filtering and removed if deemed erroneous.
PQLI [
30], an established composite measure of societal well-being, is also incorporated into the analysis. This index comprises three key indicators: literacy rate (the percentage of individuals aged 15 and above who can read and write), infant mortality rate (deaths per 1000 live births), and life expectancy at age one (the expected remaining years of life for a one-year-old). PQLI scores range from 0 to 100, with higher values indicating greater social development. Data for this index were sourced from the Human Progress database and span the 30-year study period (1990–2019). To address missing values, trend-based interpolation is applied when feasible; otherwise, predictive imputation techniques are used. To ensure comparability across countries and variables, all PQLI values are z-score normalized, transforming them into a standard distribution with a mean of 0 and a standard deviation of 1.
This study also incorporates climate indices TN90p and TX90p, which represent the proportion of nights and days, respectively, with temperatures exceeding the 90th percentile. The selection of these indices was guided by empirical evidence, regional climate trends, and their established relevance to mental health outcomes. TN90p measures the percentage of nights with extreme warmth, while TX90p quantifies the frequency of hot days surpassing the 90th percentile threshold. These indices were chosen because they capture extreme temperature events rather than simple averages, making them more effective for assessing potential mental health impacts [
31]. Existing research has demonstrated strong associations between extreme temperatures and mental health risks, including anxiety, depression, and suicide [
32,
33]. TN90p is particularly relevant, as elevated nighttime temperatures disrupt sleep quality and duration—both fundamental to mental health regulation. Studies have shown that poor sleep caused by warm nights contributes to increased psychological stress, cognitive impairments, and heightened susceptibility to mental health disorders. The inability to recover from daytime heat stress due to persistent nighttime warmth results in cumulative physiological and psychological strain. Meanwhile, TX90p captures the frequency of extreme daytime heat, which has been linked to heat exhaustion, increased psychiatric hospital admissions, reduced outdoor activity, social isolation, and decreased work productivity—all of which negatively impact mental well-being. From a regional climate perspective, TN90p and TX90p are particularly relevant for Southeast Asia, where extreme heat events have intensified in recent decades. Studies have indicated that nighttime warming trends in tropical climates are more pronounced than daytime warming, making TN90p a critical indicator for assessing heat-related mental health risks. Both TN90p and TX90p were derived from the Centre National de Recherches Météorologiques Climate Model Version 6 (CNRM-CM6) dataset [
34], which is considered more reliable for Southeast Asia than other global climate models, particularly for temperature simulations. Developed collaboratively by France’s Centre National de Recherches Météorologiques (CNRM) and Centre National de la Recherche Scientifique (CNRS), the CNRM-CM6 model represents a significant advancement in global climate modeling. This model, an improvement within the Coupled Model Intercomparison Project Phase 6 (CMIP6), plays a critical role in the study of climate dynamics [
35]. A distinguishing feature of CNRM-CM6 is its comprehensive integration of multiple climate system components, including the atmosphere, oceans, cryosphere, and land processes. This integration enables a more detailed and accurate simulation of the Earth’s climate system. This model improves upon its predecessor, the CNRM-CM5, by incorporating higher resolution and enhanced components. The atmospheric module, ARPEGE-Climat, accurately captures atmospheric dynamics, thermodynamics, and chemical composition [
36]. The oceanic model, Nucleus for European Modelling of the Ocean (NEMO), simulates complex oceanic dynamics and biogeochemical processes [
37], while the GELATO model represents sea ice dynamics. Additionally, the SURFEX model simulates land processes, accounting for interactions among soil, vegetation, and hydrology [
38,
39]. As part of the CMIP6 initiative, CNRM-CM6 contributes to historical climate simulations and projections of future climatic scenarios based on the Shared Socioeconomic Pathways (SSPs) framework. It also supports research on climate change detection and attribution. According to Eyring et al. [
40], the model offers extensive capabilities and a robust understanding of climate dynamics, making it an essential tool for retrospective climate assessments and policy development addressing future climate-related challenges. The TN90p and TX90p variables were obtained from the Copernicus Climate Data Store (CDS), accessed at
https://cds.climate.copernicus.eu/ (accessed on 7 April 2025). These indices represent the proportion of days in a calendar year when nocturnal and diurnal temperatures, respectively, exceed the 90th percentile threshold for a specific geographical location, as defined by a historical reference period. These variables provide critical insights into population exposure to extreme temperatures, which have been proposed to affect mental health through various physiological and psychological pathways.
2.3. Data Preprocessing
To ensure methodological transparency and enhance model accuracy, this study employed a systematic data preprocessing approach to integrate multiple datasets, address inconsistencies, and improve data quality. The dataset included mental health-related mortality data, socioeconomic indicators (HALE, PQLI, and population), and climate indices (TX90p and TN90p) across Southeast Asia. Missing values were handled using a combination of imputation techniques based on the extent of missingness. For variables with minimal missing data (<5%), mean imputation was applied, while for variables with moderate missingness (5–15%), multiple imputation by chained equations (MICE) was used. This approach ensured that missing data were estimated based on their relationships with other predictors, minimizing bias and preserving data integrity [
41]. To identify and mitigate the impact of extreme values, interquartile range (IQR)-based filtering was applied, flagging observations outside the range as potential outliers [
42]. Depending on their impact on model’s performance, extreme values were either removed if they resulted from data entry errors or adjusted using Winsorization, which caps extreme values within a reasonable range to minimize distortions in statistical analyses. This step was particularly relevant for variables, such as population size and mortality rates, where extreme fluctuations could skew model’s predictions. Given the varying numerical scales of the dataset, feature scaling was performed to improve interpretability and computational efficiency. Z-score normalization was applied to climate indices (TX90p and TN90p) and socioeconomic indicators (PQLI and HALE), standardizing values to a mean of zero and a standard deviation of one to prevent variables with larger numerical values from disproportionately influencing the model [
43]. Additionally, since population size had a significantly larger magnitude than other predictors, a log base 10 transformation was applied to reduce skewness and improve comparability. To prevent undefined values in cases where population values were zero, a small constant was added before transformation. To maintain model integrity and prevent data leakage, all preprocessing steps—including missing value imputation, outlier handling, and feature scaling—were applied separately to the training and test datasets. This ensured that no information from the test set was inadvertently incorporated into the model training process, preserving the validity of the predictive analysis [
16]. These preprocessing techniques were essential for ensuring robust, unbiased, and generalizable model performance.
2.4. Machine Learning
The primary machine learning model chosen for this study was Random Forest (RF). It was strategically selected to examine the complex relationship among socioeconomic, demographic, and climate factors and their impact on mental health outcomes in Southeast Asia. RF is particularly effective for analyzing datasets with diverse variables. The choice of Random Forest (RF) over alternative machine learning models, such as Gradient Boosting (GB) and Neural Networks (NNs), was based on the specific requirements of this study, including interpretability, computational efficiency, and robustness of small datasets. First, RF excels in handling high-dimensional data with complex, nonlinear relationships, making it well suited for this study’s dataset, which includes socioeconomic and climatic predictors. Unlike GB, which is more prone to overfitting, RF employs bagging (bootstrap aggregation) to reduce variance, ensuring more stable and generalizable predictions. Additionally, RF inherently provides feature importance rankings, which are essential for identifying key determinants of mental health mortality—an area where GB is less transparent and NNs do not naturally provide insights. Second, NNs typically require large datasets to achieve optimal performance, as they rely on extensive training to capture intricate patterns. However, while comprehensive, this study’s dataset is relatively small (covering eight Southeast Asian countries over a 30-year period), making RF a more suitable choice. NNs also demand intensive hyperparameter tuning and computational resources, which may not be practical given this study’s focus on regional mental health patterns rather than deep predictive modeling. Finally, RF offers both computational efficiency and interpretability, making it preferable for policy-related studies. While GB and NNs can outperform RF in highly complex tasks, they often sacrifice interpretability. Since this research aims to inform mental health policies and climate adaptation strategies, interpretability is essential for translating findings into actionable recommendations. Therefore, RF was selected as the optimal model due to its balance of predictive accuracy, interpretability, and robustness against overfitting, ensuring reliable insights into the climate–socioeconomic determinants of mental health mortality.
As described by Breiman [
20], a RF algorithm is an ensemble learning technique based on decision tree principles. It constructs an ensemble of decision trees, with each tree trained on randomly selected subset of the dataset. The algorithm employs bagging (bootstrap aggregating) to introduce stochasticity, enhancing model stability. When making prediction, RF integrates outputs from individual trees to generate a final prediction. A key advantage of RF is its ability to effectively handle high-dimensional datasets. The use of multiple trees improves predictive accuracy and mitigates overfitting, a common limitation of individual decision trees. Additionally, RF leverages spatial patterns and data relationships to enhance predictive precision within a downscaling framework, making it particularly suitable for complex climatic data. The core principle underlying this methodology is that an ensemble of multiple, relatively independent models (decision trees) operating as a committee will outperform any single constituent model. In the context of regression, RF predictions are generated based on a set of training samples, ensuring robust and generalizable outcomes. Let X be a set consisting of items
, each of which is assigned a label. Let Y be a set with the members
. Mathematical Equation (1) is as follows:
where B represents the total count of trees within the forest and
denotes the forecast made by the bth tree.
The implementation of the Random Forest (RF) model involved careful consideration of feature selection, hyperparameter optimization, and validation procedures. As an ensemble learning technique, RF inherently ranks predictor variables based on their contribution to model’s accuracy. In this study, population and PQLI emerged as the most influential predictors, while climate indices (TX90p and TN90p) exhibited weaker direct effects (<0.1), suggesting their influence operates through socioeconomic factors. Model’s parameter selection was conducted through a grid search cross-validation process, testing various hyperparameter combinations to determine the optimal configuration. The number of trees was evaluated across a range of 50 to 250, with 100 selected as the optimal choice, balancing computational efficiency and predictive accuracy. Maximum depth values of 3 to 10 were tested and ultimately set to 5, preventing overfitting while maintaining model interpretability—a decision supported by cross-validation performance metrics. The minimum number of samples required for node splitting was tested for values of 2 to 10, with 5 chosen as the optimal value to ensure sufficient data within each node while maintaining model flexibility. Additionally, the minimum number of samples per leaf was set to 2 to prevent excessively small leaf nodes that could introduce high variance. To enhance model generalization, the maximum number of features considered at each split was set to ‘sqrt,’ reducing correlations among trees and improving robustness.
To evaluate the performance of the ML model, the statistical analysis was conducted alongside a 5-fold cross-validation strategy to ensure consistency across different data subsets [
44]. To account for population size differences among countries, population-weighted validation metrics were applied, preventing larger-population countries from disproportionately influencing model’s performance. The mathematical descriptions for the coefficient of determinant (R
2), root mean square error (RMSE), mean absolute error (MAE), and mean square error (MSE) are shown in Equations (2)–(5):
where M
i is the model data and O
i is the actual data for each i data.
2.5. Spearman Correlation
To assess the relationships between climate variables (TX90p and TN90p) and socioeconomic factors (population, PQLI, and HALE), Spearman correlation analysis was employed [
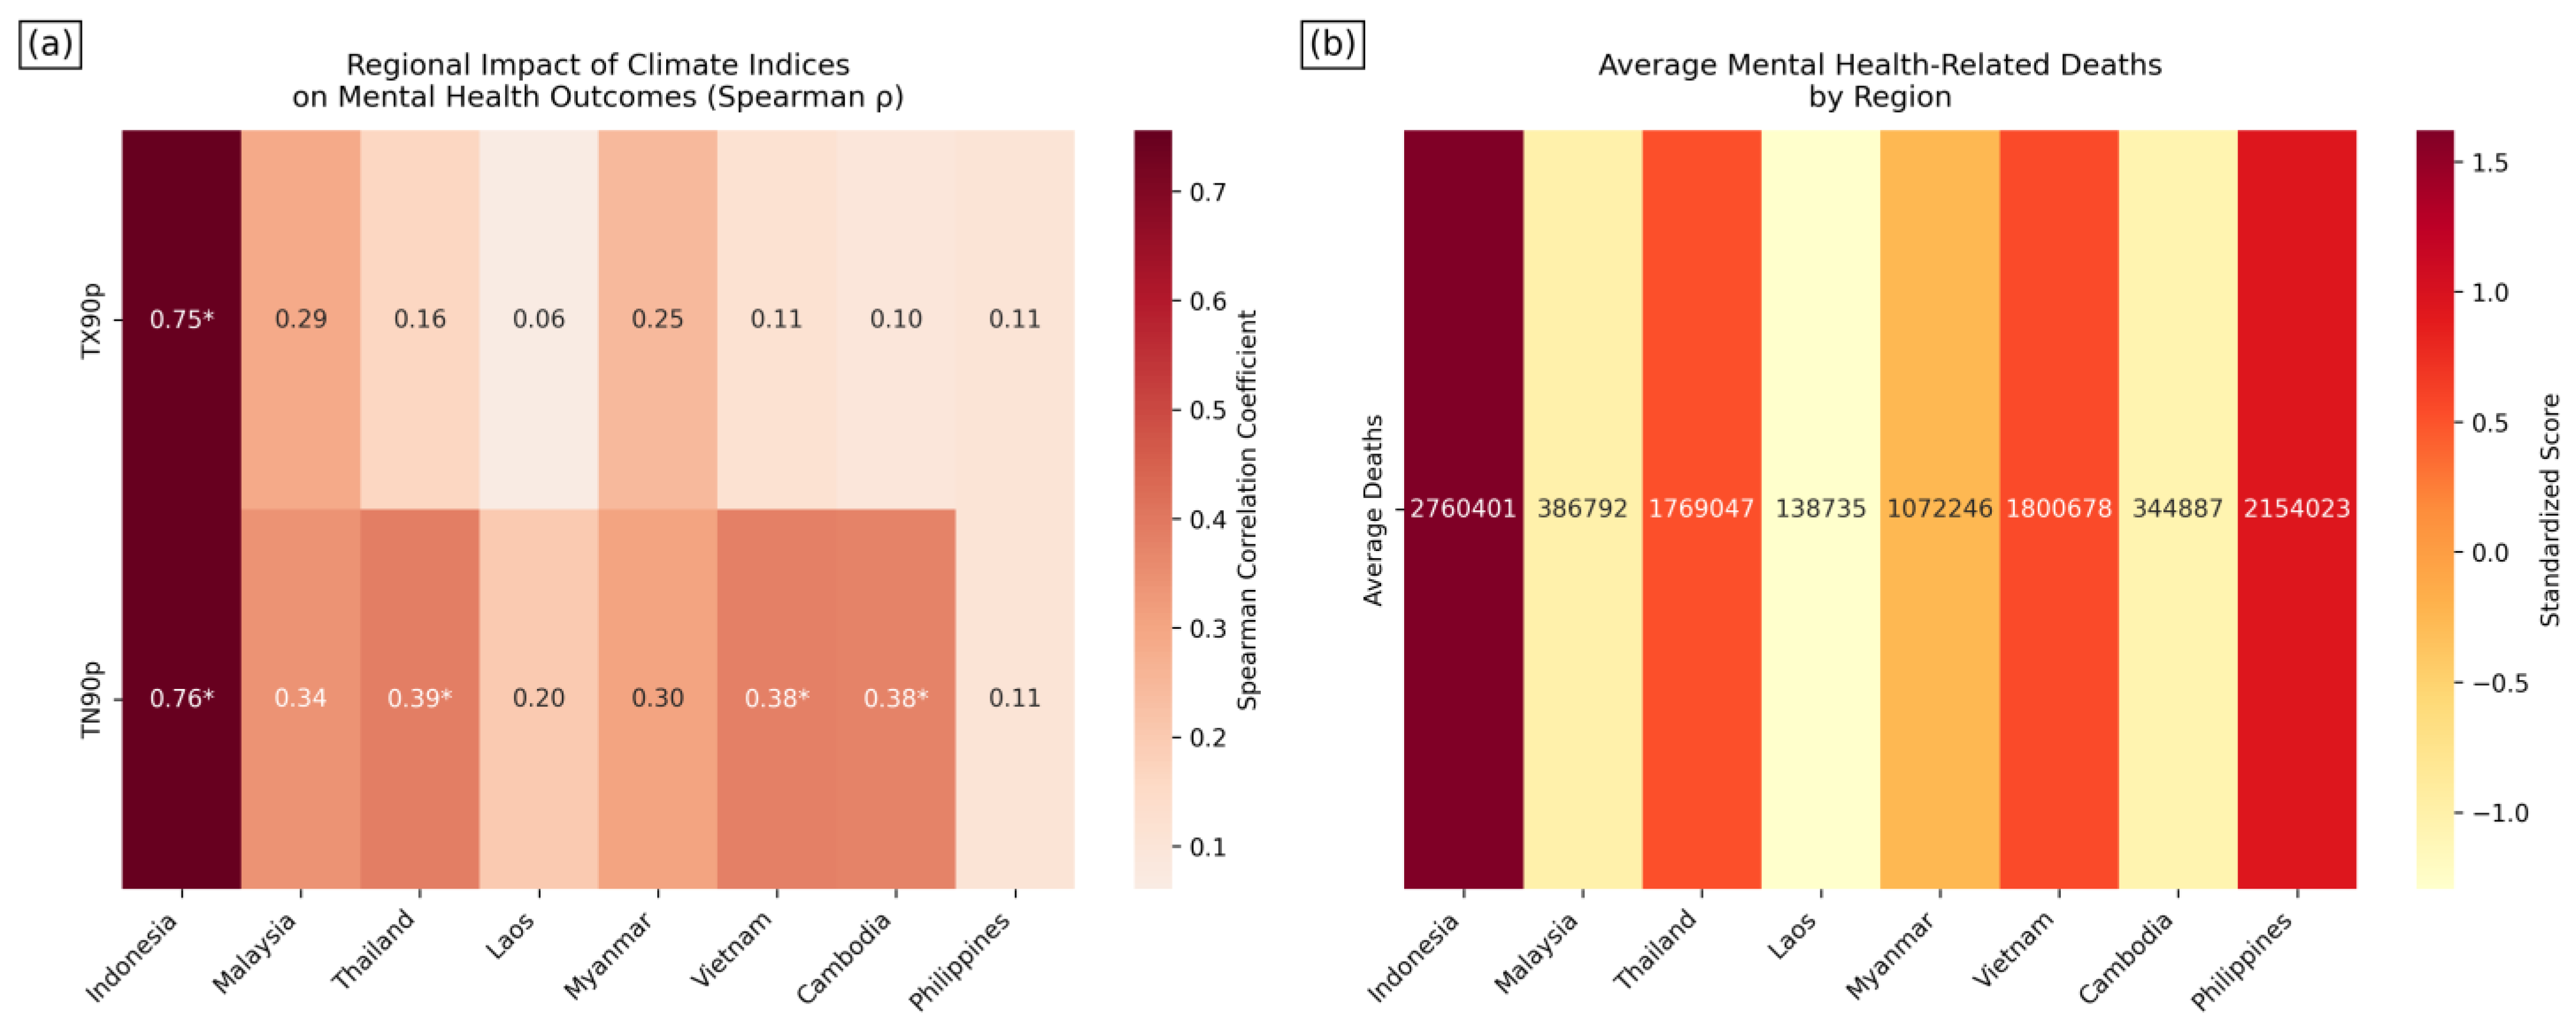
45]. Spearman’s rank correlation coefficient is a nonparametric measure that evaluates the strength and direction of the association between two ranked variables. This method was selected for its robustness in handling nonlinear relationships and its suitability for ordinal data, making it particularly appropriate for the diverse and non-normally distributed datasets used in this study. Data for TX90p and TN90p were collected for each country included in this study, along with socioeconomic indicators, such as population, PQLI, and HALE. The dataset spans multiple years, providing a comprehensive view of trends and patterns across Southeast Asia. For each country, Spearman correlation coefficients were computed between the climate variables (TX90p and TN90p) and each of the socioeconomic factors. The Spearman correlation coefficient, denoted by ρ (rho), ranges from −1 to 1, and indicates the following:
A ρ value close to 1 indicates a strong positive correlation, meaning that as one variable increases, the other variable tends to increase.
A ρ value close to −1 indicates a strong negative correlation, meaning that as one variable increases, the other variable tends to decrease.
A ρ value around 0 indicates no correlation, meaning that the variables do not exhibit a linear relationship.
The Spearman correlation coefficient (ρ) was then computed as follows by Equation (6):
where d
i is the difference between the ranks of the ith pair of values, and n is the number of pairs of values.
4. Discussion
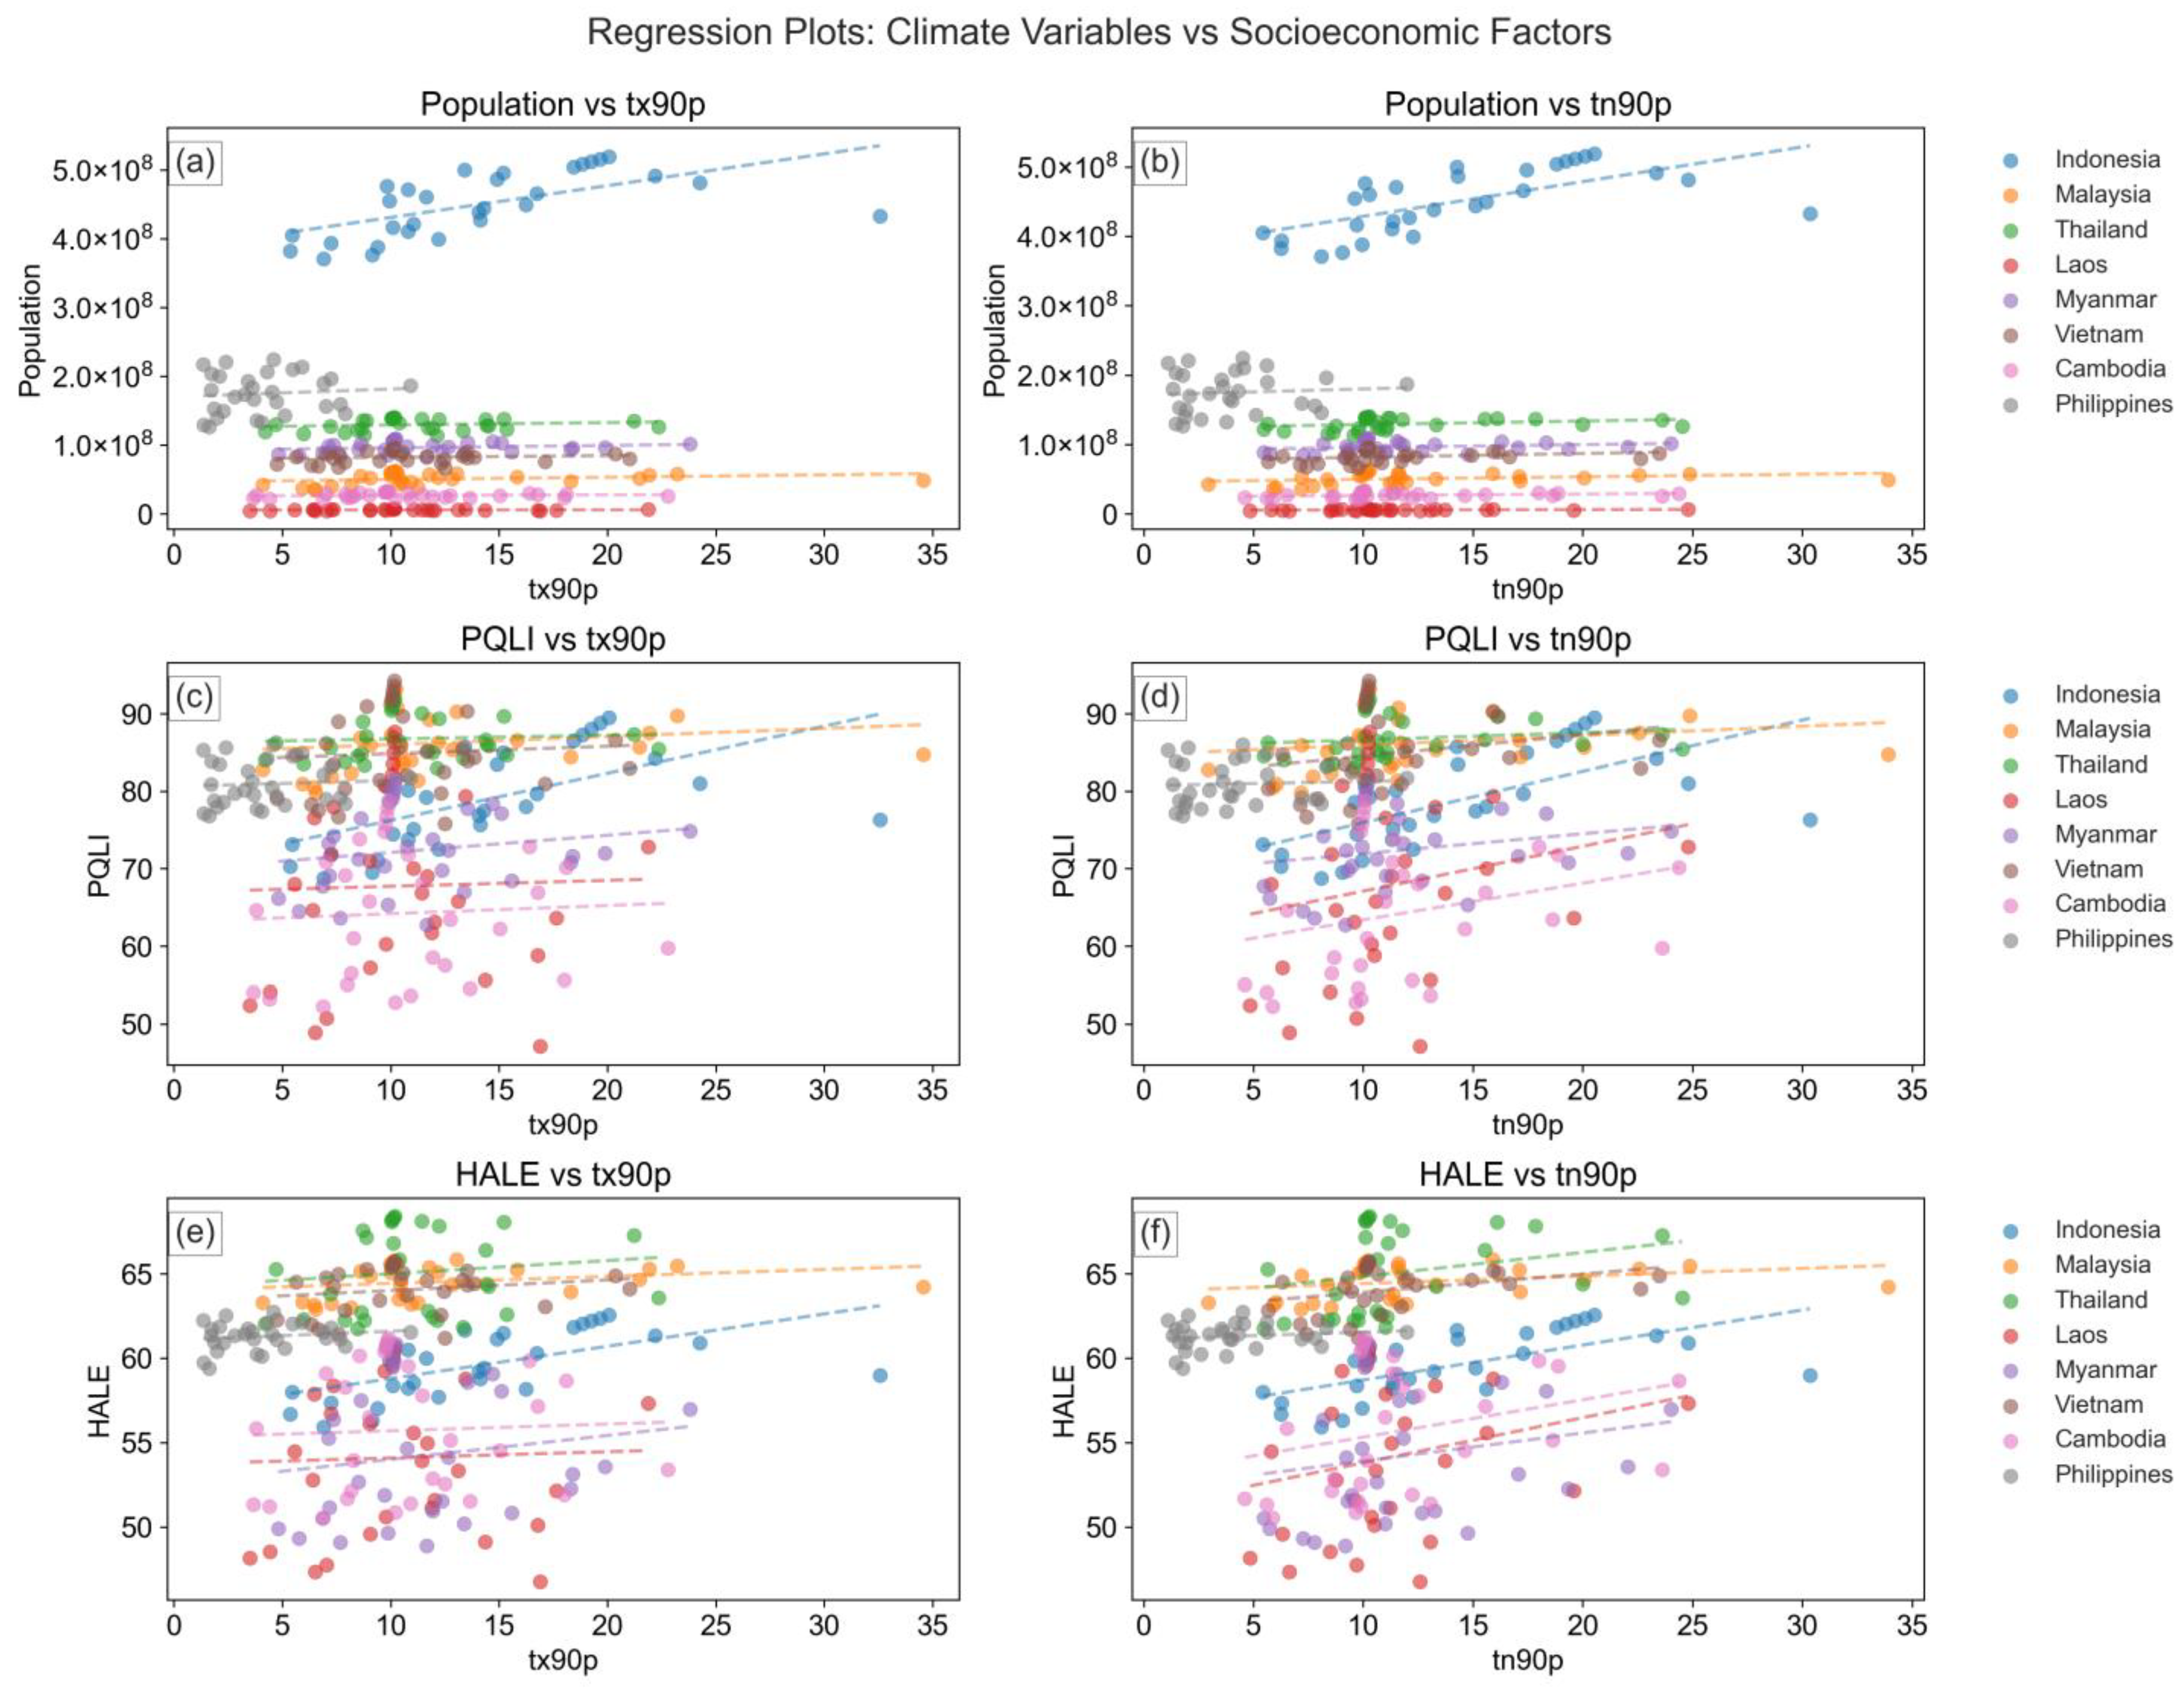
This study provides important insights into the ongoing debate within global mental health research by examining the complex interplay of the factors influencing mental health mortality. The findings confirm that the population size and PQLI are the strongest predictors of mental health mortality in Southeast Asia, while the climate indices (TX90p and TN90p) primarily exert indirect effects through socioeconomic pathways. However, the spatial distribution patterns reveal significant regional disparities in climate sensitivity, with Myanmar, Cambodia, and Indonesia exhibiting stronger associations between extreme temperatures and mental health mortality. These regions experience frequent extreme warm nights (high TN90p), which have been linked to sleep disturbances, physiological stress, and increased susceptibility to mental health disorders [
32]. In contrast, Malaysia and the Philippines, despite experiencing climate stress, report lower mental health mortality, likely due to a stronger healthcare infrastructure, cooling systems, and socioeconomic resilience. The analysis of the Spearman correlations and regression models further highlights these regional differences. Indonesia demonstrates the strongest climate–socioeconomic relationships, aligning with prior research on climate vulnerability and its mental health impacts [
7,
8,
10]. The high correlation (0.99) between the TX90p and TN90p and moderate associations with socioeconomic variables reinforce Indonesia’s climate sensitivity. The regression analysis confirms this, with substantial coefficients for the population (TX90p: −10,526,549.62; TN90p: 15,529,620.57) and notable effects on the PQLI (−1.51, 2.18) and HALE (−0.44, 0.65). The Philippines presents a contrasting case, where the correlation results show weak associations (e.g., TN90p-HALE at 0.14), yet the regression analysis reveals significant but uniquely directed coefficients (population: 5,361,560.88, −3,956,493.95). Malaysia and Thailand exhibit moderately strong climate–socioeconomic relationships, though Malaysia’s regression coefficients are an order of magnitude smaller than Indonesia’s (population: −866,944.28, 1,207,374.63), suggesting a more adaptive socioeconomic structure. Smaller countries, like Laos and Cambodia, show weaker climate–mortality relationships, yet Cambodia presents a notable exception with a moderate TN90p-PQLI correlation (0.38), reinforcing how environmental factors connected to climate change can influence health outcomes [
46,
47]. Building on previous research by Patel et al. [
3] and Vigo et al. [
48], these findings confirm that nations with stronger social and health indices report higher prevalence rates of mental health issues, largely due to their greater detection and evaluation capabilities. Population emerges as the most influential predictor of mental health mortality, as larger populations face greater healthcare strains, complex service delivery challenges, and disparities in mental health access [
3,
48]. Additionally, rapid urbanization in Southeast Asia has amplified stressors, such as overcrowding, social isolation, and income inequality, which can exacerbate mental health challenges [
13,
29]. These findings align with Murray et al.’s [
49] work on the demographic determinants of health outcomes, while extending the discussion by highlighting the spatial variability in climate stress and its interaction with population dynamics in shaping mental health mortality.
Climate change has emerged as a significant global health challenge, with increasing evidence pointing to its role in shaping mental health outcomes. While this study finds limited direct effects of climate variables on mental health mortality, their indirect influence through socioeconomic pathways appears substantial. These climate–socioeconomic–mental health relationships operate through complex mechanisms that vary across geographical and social contexts, highlighting the spatial disparities in climate sensitivity [
50]. For instance, Myanmar, Cambodia, and Indonesia exhibit stronger associations between extreme nighttime temperatures (TN90p) and mental health mortality, likely due to poor housing conditions, economic vulnerability, and limited mental health services. In contrast, Malaysia and the Philippines, despite experiencing similar climate stress, report lower mental health mortality rates, suggesting that stronger healthcare infrastructure, cooling systems, and disaster preparedness strategies help to mitigate risks. These spatial variations underscore that climate stressors alone do not determine mental health outcomes, but rather their interaction with socioeconomic resilience and policy interventions do. This study’s findings align with the eco-social theory of Krieger [
51], which explains how individuals and populations “embody” environmental stressors within specific social, political, and economic contexts [
7,
8]. Indonesia demonstrates the strongest climate–socioeconomic relationships, with statistically significant effects of the TN90p on all three socioeconomic variables (
p < 0.05). The high TN90p-PQLI correlation (0.38) in Cambodia further supports the role of environmental stress in shaping health outcomes, particularly in regions with weaker adaptive capacity. The regression results show that climate variables explain approximately 40% of the socioeconomic variation in Indonesia (adjusted R
2 = 0.402–0.423), reinforcing the idea that climate effects manifest themselves through economic and infrastructural vulnerabilities rather than direct causation. Several key pathways mediate the relationship between climate and mental health outcomes. Economic instability is a primary mechanism, as extreme temperatures disrupt the productivity of climate-sensitive industries (e.g., agriculture, fisheries, and construction), leading to financial strain, increased anxiety, and heightened suicide risks, particularly in low-income populations with limited job security. The urban heat island (UHI) effect intensifies heat exposure in major cities such, as Jakarta, Yangon, and Phnom Penh, where dense infrastructure exacerbates the retained heat, increasing psychiatric emergencies and suicide risks [
52,
53]. Prolonged high nighttime temperatures (TN90p) contribute to sleep disruption, a well-documented risk factor for mental health conditions [
32]. The deterioration in the quality of life due to climate stressors—including reduced outdoor activity, social isolation, and limited access to mental health care—further compounds psychological distress, particularly among marginalized communities [
54]. Climate stress also strains healthcare systems, as rising demand for psychiatric services coincides with climate-related disasters that damage medical infrastructure and disrupt access to essential mental health resources [
55]. Countries with weaker healthcare systems, such as Myanmar and Cambodia, are particularly vulnerable, as their existing mental health services are already insufficient. Additionally, climate-driven displacement and migration contribute to mental health burdens, as rising sea levels, extreme weather events, and environmental degradation force communities to relocate, triggering displacement stress, social instability, and cultural loss—all known contributors to anxiety, PTSD, and depression. These findings reinforce that climate change acts as a force multiplier, exacerbating existing social and economic inequalities that shape mental health disparities [
48,
49]. In regions with weaker healthcare infrastructure and higher socioeconomic inequality, prolonged heat exposure disproportionately affects vulnerable populations, amplifying their psychological distress [
9]. Conversely, countries with stronger healthcare systems, cooling infrastructure, and disaster response programs exhibit weaker climate–mortality correlations, demonstrating that policy interventions can mitigate climate stress impacts on mental health.
This study provides valuable insights into the relationship between the socioeconomic, demographic, and climate factors and mental health outcomes in Southeast Asia, but several limitations must be acknowledged. Country-level aggregated data mask local variations in mental health, healthcare access, and socioeconomic conditions, particularly in geographically diverse nations [
29,
48]. This approach overlooks urban–rural and coastal–inland differences, limiting insights into localized climate–mental health dynamics [
13,
14]. The lack of individual-level data further restricts the analysis of personal risk factors, such as genetic predisposition and socioeconomic status [
3,
5]. Additionally, the underreporting of mental health-related deaths due to stigma and inconsistent national reporting may introduce a measurement bias, potentially underestimating the true mortality rates [
29,
48]. The climate indices TX90p and TN90p do not account for other environmental stressors, such as humidity, air pollution, and heatwave duration, which may significantly influence mental health. The Random Forest model, despite its strong performance, is prone to overfitting due to the small dataset (eight countries) and a large number of features, potentially capturing noise rather than generalizable patterns [
20,
41]. The feature importance ranking is biased toward high-variance features, highlighting the need for additional interpretability techniques. While Shapley Additive Explanations (SHAPs) could provide more granular insights, they were not applied in this study due to their high computational cost. Instead, permutation-based feature importance was used, prioritizing broad trends over individual-level explanations. This approach aligns with prior climate–mental health research and facilitates policy integration. Future studies may consider SHAPs for country-specific or sensitivity analyses where computational feasibility allows. Additionally, the cross-sectional design limits causal inference, as the observed associations may be influenced by unmeasured confounders. Future research should employ causal inference methods (e.g., instrumental variable regression or structural equation modeling) to better isolate the climate effects from the socioeconomic factors. Several confounding variables were not explicitly accounted for, which should be addressed in future work. Urbanization and the urban heat island (UHI) effect may intensify heat-related stress in cities due to the heat-retaining infrastructure and pollution, though better healthcare access in urban areas may mitigate some of these effects [
56,
57,
58]. Healthcare infrastructure is critical, as stronger systems (e.g., in Malaysia and Thailand) correlate with lower climate-related mental health mortality, while weaker infrastructure may heighten vulnerabilities after climate-induced disasters [
59,
60]. Socioeconomic disparities further compound climate stress, as lower-income populations often lack cooling infrastructure, healthcare, and social safety nets, increasing their psychological burdens. Urban green spaces have been linked to better mental well-being, offering protection against stress and fostering social cohesion [
61]. Addressing these limitations through longitudinal studies with larger datasets would improve the generalizability of the findings and provide a better understanding of climate–mental health interactions over time [
47,
62]. Another important limitation should be acknowledged. The original model’s high predictive performance (R
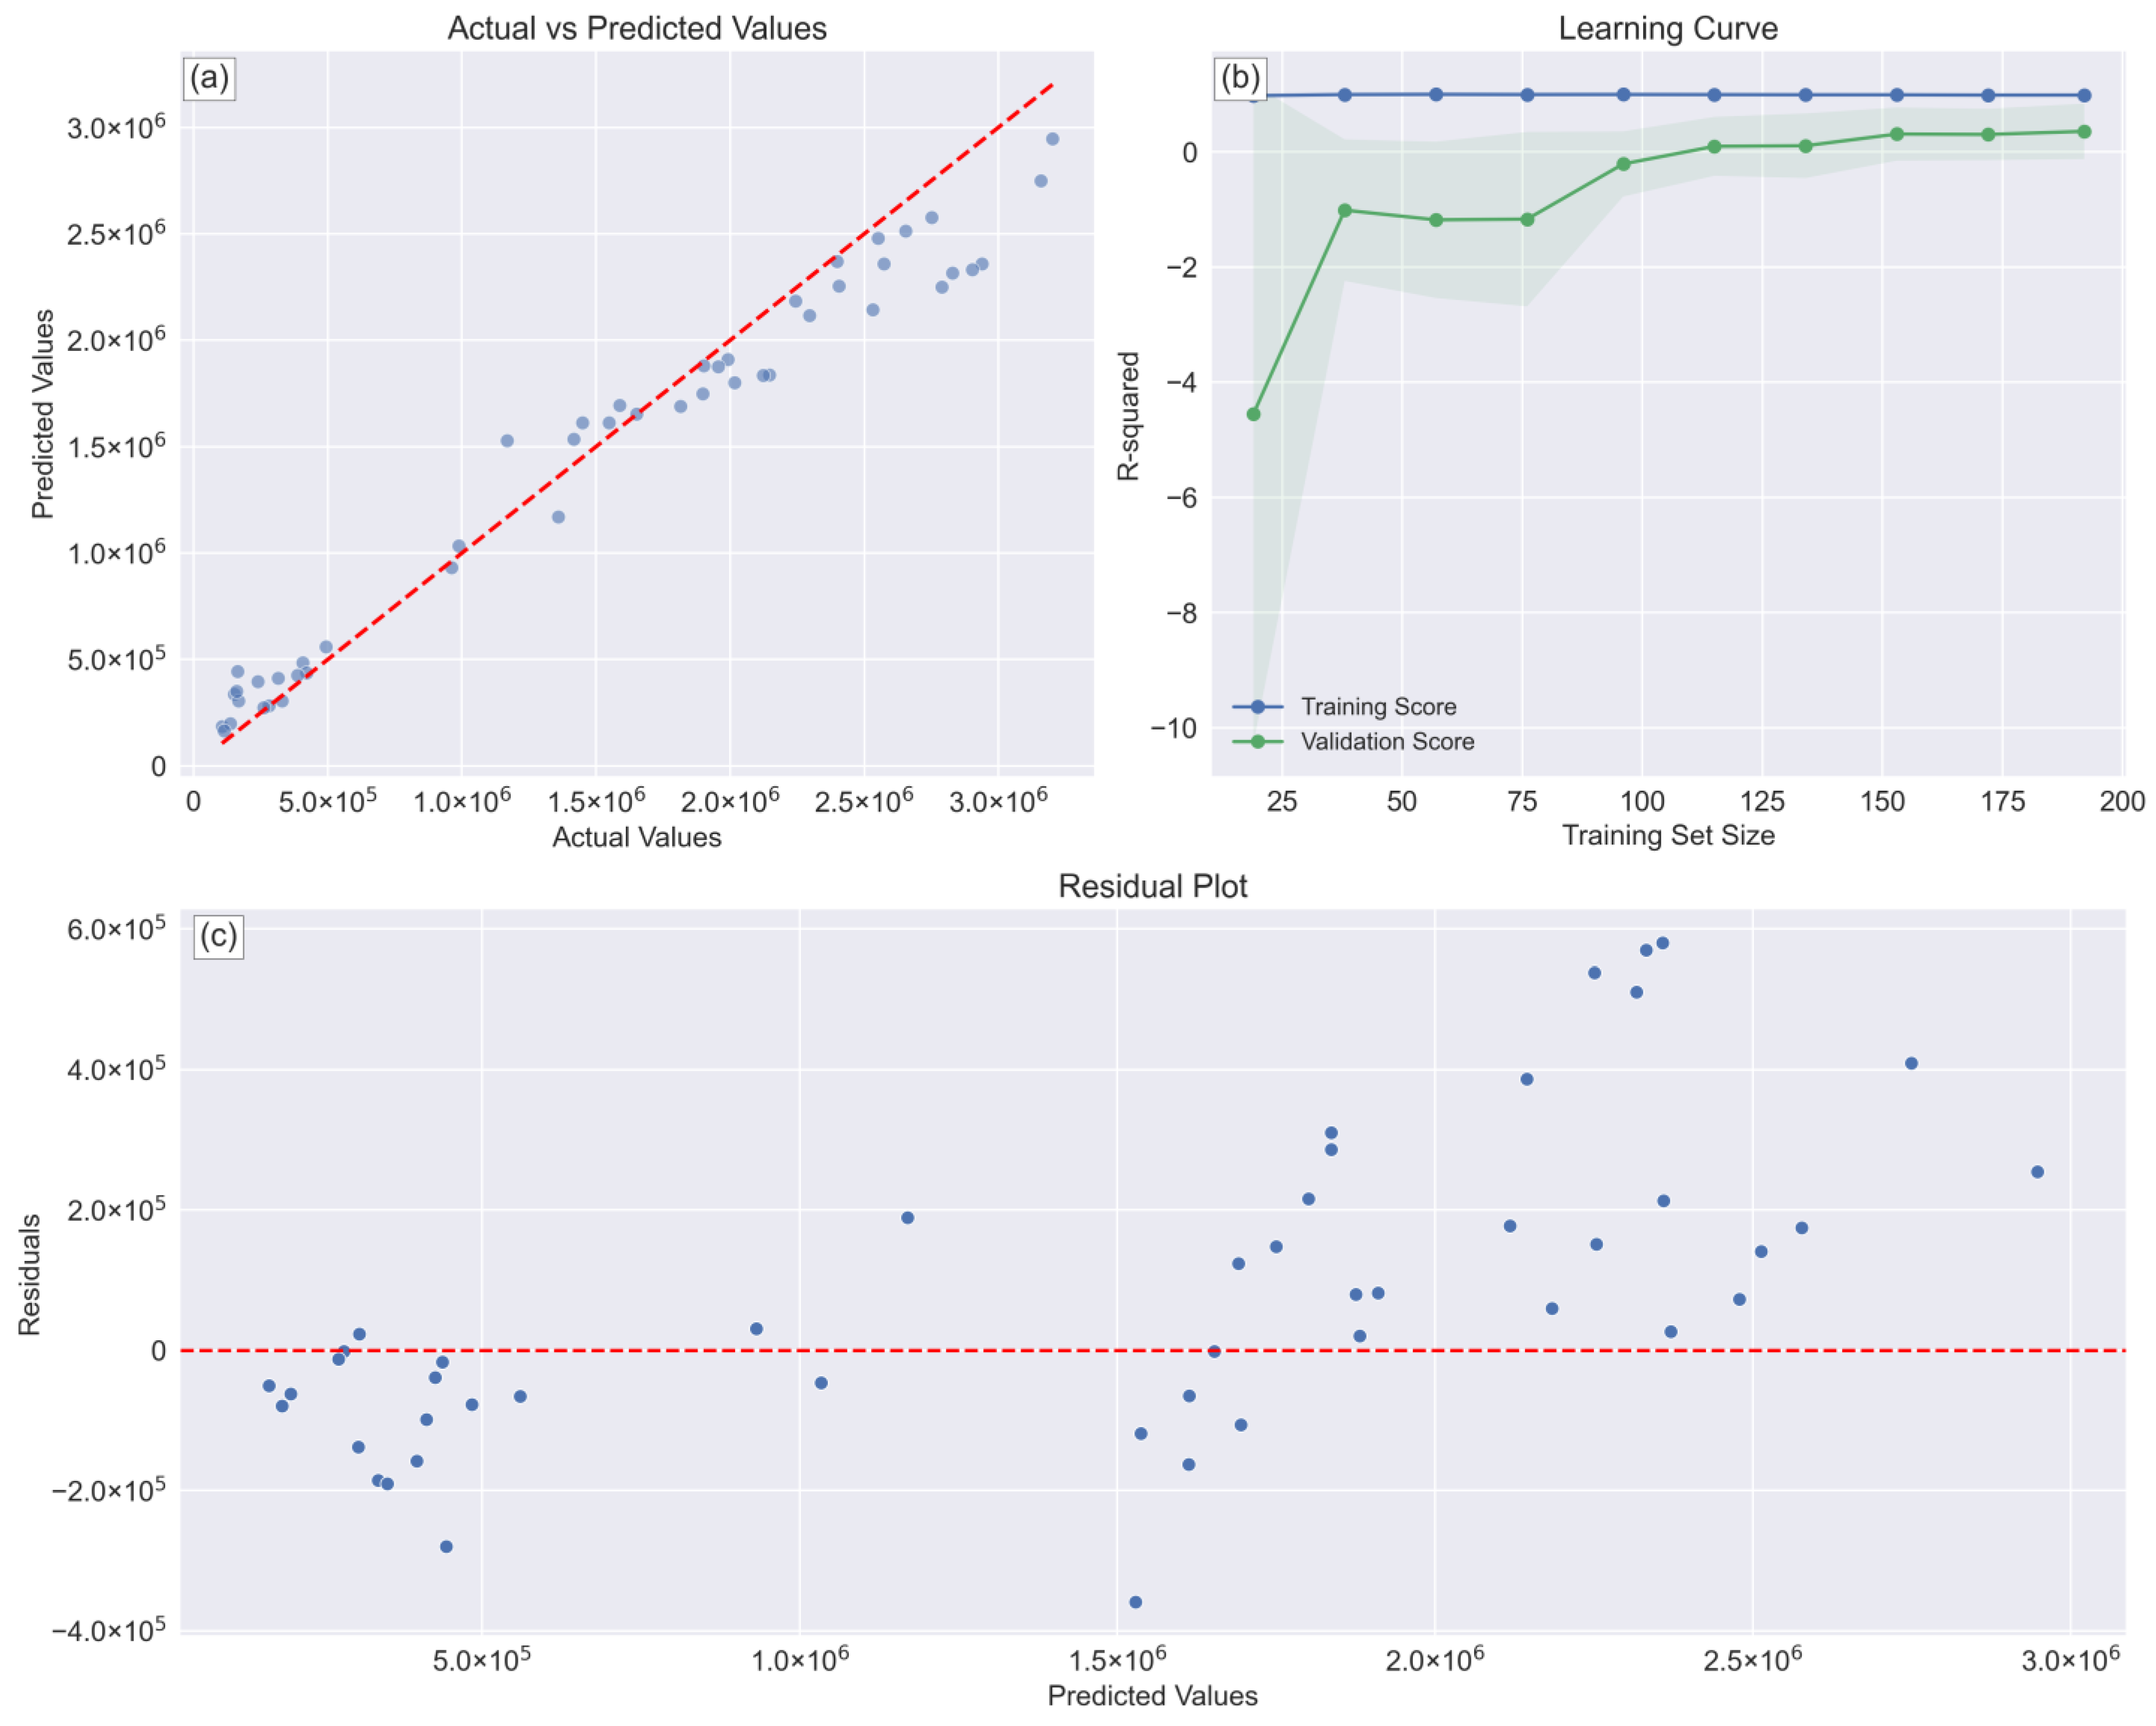
2 = 0.95) was found to be heavily influenced by the population size, as demonstrated by the supplementary analysis using normalized death rates (R
2 = 0.13;
Table S1). This stark contrast confirms that the population size was the dominant driver of the model’s explanatory power. While the population is indeed a structural determinant of the healthcare capacity and mental health burden, these findings highlight the limitations of using absolute mortality counts as a proxy for relative mental health risk.
Supplementary Figure S1 illustrates the weaker alignment between the predicted and actual values, a wider distribution of the residuals, and a flatter learning curve—hallmarks of poor generalizability.
Supplementary Figure S2 shows that the feature importance rankings became less distinct and more evenly distributed, suggesting that no single predictor—unlike population in the original model—dominates the prediction of normalized outcomes. These results underscore that population alone does not adequately explain the cross-country variations in relative mental health mortality. The diminished performance of the normalized model highlights the likely influence of omitted variables, such as poverty, income inequality, unemployment, political instability, and age structure—factors that could offer a more nuanced understanding of mental health vulnerability in the region. While the original model provides valuable insights into the macro-level trends, future studies should incorporate finer-grained socioeconomic indicators and consider multilevel or hierarchical modeling frameworks to better account for within-country variations. Future work should also prioritize the integration of subnational data (e.g., province- or city-level), the longitudinal tracking of mental health outcomes over time, and the inclusion of environmental co-factors, such as air pollution and humidity. Combining machine learning models with causal inference techniques—such as structural equation modeling or propensity score matching—could help disentangle the complex, overlapping pathways linking climate exposure, socioeconomic stressors, and mental health outcomes. Finally, engaging with local stakeholders and health authorities to co-develop context-sensitive indicators and policy responses will be critical for ensuring that future research translates into effective, equitable mental health interventions across Southeast Asia.
Addressing the mental health impacts of climate change in Southeast Asia requires a multidisciplinary approach with both immediate interventions and long-term strategies. In the short term, high-risk countries like Indonesia and Myanmar should implement early-warning systems, with mental health advisories, cooling shelters in urban centers, and psychological first aid training for frontline workers. Rapid response outreach programs and temporary economic relief (e.g., financial aid, housing subsidies, and provisional employment) could help stabilize communities affected by climate-related disasters. For long-term resilience, governments must expand their climate-resilient mental health infrastructure, particularly in rural and low-income urban areas. Telemedicine, integrated mental health services and primary care, and community-based interventions could improve accessibility. Investing in urban planning and green infrastructure (e.g., tree planting, reflective materials, and improved ventilation) could reduce heat exposure, addressing a root cause of climate-related mental distress. Additionally, economic diversification policies that reduce dependence on climate-vulnerable sectors (e.g., agriculture and fisheries) could protect mental well-being by promoting income stability. Workforce development is crucial—mental health professionals should receive specialized training on climate-induced psychological conditions. Establishing longitudinal research and monitoring systems will enable evidence-based policy adjustments as climate patterns evolve. By integrating environmental, economic, and health system considerations, policymakers could design holistic mental health strategies that will mitigate the indirect effects of climate change and foster the long-term psychological resilience of Southeast Asia.
5. Conclusions
This study’s findings reveal significant insights into the determinants of mental health outcomes across Southeast Asia. The RF model demonstrated a strong predictive performance (R2 = 0.95; RMSE = 227,381.56 deaths; MAE = 168,570.72 deaths), with a 5-fold cross-validation yielding an average R2 of 0.95, RMSE of 189,777.23 deaths, and MAE of 141,829.93 deaths, confirming the model’s stability and generalizability. The feature importance analysis consistently identified the PQLI as the strongest predictor across all the countries (importance = 0.3–0.4), followed by the HALE, while the climate indicators (TX90p and TN90p) showed lower direct effects (importance < 0.1), suggesting that their influence operates through socioeconomic pathways. The Spearman correlation analysis revealed substantial regional differences in climate–mortality associations. Indonesia exhibited the highest correlation between extreme temperatures and mental health mortality (TX90p: ρ = 0.75, p < 0.001; TN90p: ρ = 0.76, p < 0.001), while the Philippines showed the weakest associations (ρ < 0.2, p > 0.05). The regression analysis confirmed Indonesia’s high climate sensitivity, with significant coefficients for the population (TX90p: −10,526,549.62; TN90p: 15,529,620.57, p < 0.05), PQLI (−1.51, 2.18, p < 0.05), and HALE (−0.44, 0.65, p < 0.05). In contrast, the Philippines exhibited inverse climate–population relationships, suggesting differing adaptive capacities. The spatial distribution analysis further highlighted the geographic disparities, with Indonesia, Myanmar, and Cambodia exhibiting the highest mental health mortality rates, particularly in regions experiencing frequent extreme warm nights. Meanwhile, Malaysia and the Philippines reported lower mortality rates despite climate stress, suggesting that healthcare infrastructure and socioeconomic resilience can mitigate climate impacts. These findings emphasize that while climate factors contribute to mental health outcomes, their effects are modulated by country-specific socioeconomic structures, healthcare access, and adaptive capacity. The strong cross-validation results support the robustness of the model’s predictions. Understanding these regional disparities is essential for developing targeted interventions that integrate climate considerations into mental health strategies, ensuring that vulnerable populations across Southeast Asia receive adequate support.


