Article

Enrichment, Bioaccumulation and Health Risks of Trace Metals in Soils and Leafy Vegetables Grown on the Banks of the Ugandan Lifeline River, River Rwizi

1
Department of Chemistry, Faculty of Science, Mbarara University of Science and Technology, Mbarara P.O. Box 1410, Uganda
2
Department of Chemistry, College of Natural Sciences, Makerere University, Kampala P.O. Box 7062, Uganda
3
Centre for Water, Environment and Development-School of Water, Energy and Environment, Cranfield University, Cranfield Road, Cranfield, Bedfordshire MK43 0AL, UK
*
Author to whom correspondence should be addressed.
World 2024, 5(1), 136-154; https://doi.org/10.3390/world5010008
Submission received: 1 February 2024 / Revised: 11 March 2024 / Accepted: 12 March 2024 / Published: 15 March 2024

Abstract

:
Urban vegetable farming in wetlands and riverbanks are common features of Ugandan cities. However, urbanization has led to various anthropogenic activities that can lead to the pollution of water resources, enrichment of pollutants in soils and, consequently, pollutant bioaccumulation in edible tissues of plants cultivated on such soils. In this study, we report on the levels of six trace metals (TMTs) in 75 samples of leafy vegetables (Brassica oleracea L., Spinacia oleracea L., Amaranthus hybridus L., Cucurbita pepo L. and Solanum nigrum L.) and soils (n = 75) grown on the banks of River Rwizi, the second longest river in Uganda only after the Nile River. The concentrations of TMTs (Mn, Zn, Cd, Pb, Cr and Cu) in edible vegetable tissues and soils were quantified using flame atomic absorption spectrometry. The mean concentrations (in mg kg−1) of the TMTs in the soil samples were 205–373.84 (Mn), 12.72–65.04 (Zn), 0.26–0.42 (Cd), 3.36–16.80 (Pb), 5.96–25.06 (Cr) and 2.83–35.27 (Cu). In vegetable samples, the concentrations ranged from 43.25 to 110.00 (Mn), 1.08 to 1.83 (Cd), 41.06 to 71.20 (Zn), 4.31 to 6.16 (Pb), 0.65 to 0.81 (Cr) and 5.70 to 14.35 (Cu). With the exception of Mn and Cr, the rest of the TMTs were bioaccumulated in the edible vegetable tissues (bioconcentration factors = 1.03 to 10.71). Considering chronic daily intake through ingestion, dermal contact and inhalation of the TMTs in soils from the banks of River Rwizi, there are no potential non-cancer and carcinogenic health effects that could be experienced in both adults and children. Consumption of leafy vegetables could pose both non-cancer health risks (from ingestion of Zn, Pb, Cr, Mn and Cd) and cancer health risks (due to intake of Cd) in both children and adults. There is therefore a need to enforce regulations to mitigate the pollution of River Rwizi for a more sustainable economic development.

1. Introduction

Globally, no less than 4.4 billion (56%) of the world’s population resides in cities, and this proportion is anticipated to reach 68% by the year 2050 [1]. By 2045, the global urban population will approach 6 billion, and this implies that city authorities ought to plan for such a growth as well as provide the required basic services, infrastructure, and housing [1]. One of the greatest challenges in cities is ensuring a reliable supply of food [2]. City inhabitants subsist on either imported food originating from complex supply chains or urban horticulture, which may lead to food insecurity, as witnessed in the crucible of the COVID-19 pandemic [3,4].
In recent times, urban horticulture has remained pivotal to the food, social, economic, and ecological sustainability of cities [5]. Like elsewhere in Africa [6], urban vegetable farming in wetlands and riverbanks is a common feature of Ugandan cities [7]. However, urbanization has led to various anthropogenic activities that can lead to the pollution of water resources, enrichment of pollutants in soils and, consequently, pollutant bioaccumulation in edible tissues of plants cultivated on such soils [8]. Uganda, an East African country, is a late urbanizer characterized by speculative urbanism. In the absence of lucrative industrial opportunities, investments in land and real estate as well as agriculture as a capital gains strategy are the last resort [9,10]. As of May 2023, the country had more than 16 cities, most of which were municipalities in 2019 [9,11].
Mbarara City is among the top five rapidly growing cities in Uganda. It is expanding at a rate that is believed to be faster than that of Kampala, the country’s central business district and capital city [9]. In the suburban areas of Mbarara city, urban agriculture is practiced, especially on the banks of River Rwizi [12]. Some of the crops grown include bananas, coffee, tea, sugarcane and vegetables (cabbages, spinach, amaranth, pumpkin) [13,14]. Such urban agricultural activities coupled with indiscriminate disposal of municipal wastes and sewage, brick laying and sand mining along the river bank [15] have been speculated to impact the quality of water in Lake Victoria, a lentic East African water resource. Reports on the pollution of Lake Victoria are widely documented, but studies investigating the potential sources of its water contaminants, especially from the transboundary, in-country and influent rivers such as Nzoia, Rwizi and Kagera, are still limited [16,17].
For River Rwizi (the focus of this study), there have been reports on its water quality and concentration of trace metals (TMTs), nutrients and polycyclic aromatic compounds in water, sediments, damselfly larvae (Ceriagrion glabrum) and selected fish species (Brycinus sadleri and Barbus altianalis) [18,19,20,21,22]. Heavy metals, sometimes called trace metals or potentially toxic elements, are naturally present in the earth’s crust, but they are enriched in the environment following their release from various anthropogenic activities. In the case of water, TMTs such as manganese (Mn), zinc (Zn), cadmium (Cd), lead (Pb), chromium (Cr), copper (Cu) and nickel (Ni) have been reported to induce toxic physiological effects when they are ingested at higher concentrations than their thresholds in animals. For example, environmental exposure to Pb contributes to at least 500,000 new cases of children with intellectual disabilities every year [23]. Lead poisoning following long-term exposure has been associated with hypertension [24], and several inorganic Pb compounds are probable human carcinogens [25]. The environmental and toxic effects of TMTs largely depend on the metal in question, its exposure concentration, the oxidation state, the chemical form, and the exposure route, among other extrinsic factors [26].
To our knowledge, no previous efforts have been devoted to the examination of the transferability and health risks of regulatory TMTs in soils and leafy vegetables cultivated on the banks of River Rwizi. We herein report on the trace metal contamination of soils as well as their accumulation in edible leafy vegetables grown on the banks of River Rwizi in Mbarara City, Western Uganda. Ecological and human health risks were assessed, and, in all cases, the results were compared with findings of previous studies conducted around the world in a similar setting to assess the relative pollution levels of River Rwizi’s urban vegetable gardens in a global context.

2. Materials and Methods

2.1. Description of the Targeted River and Its Stretch in Mbarara City

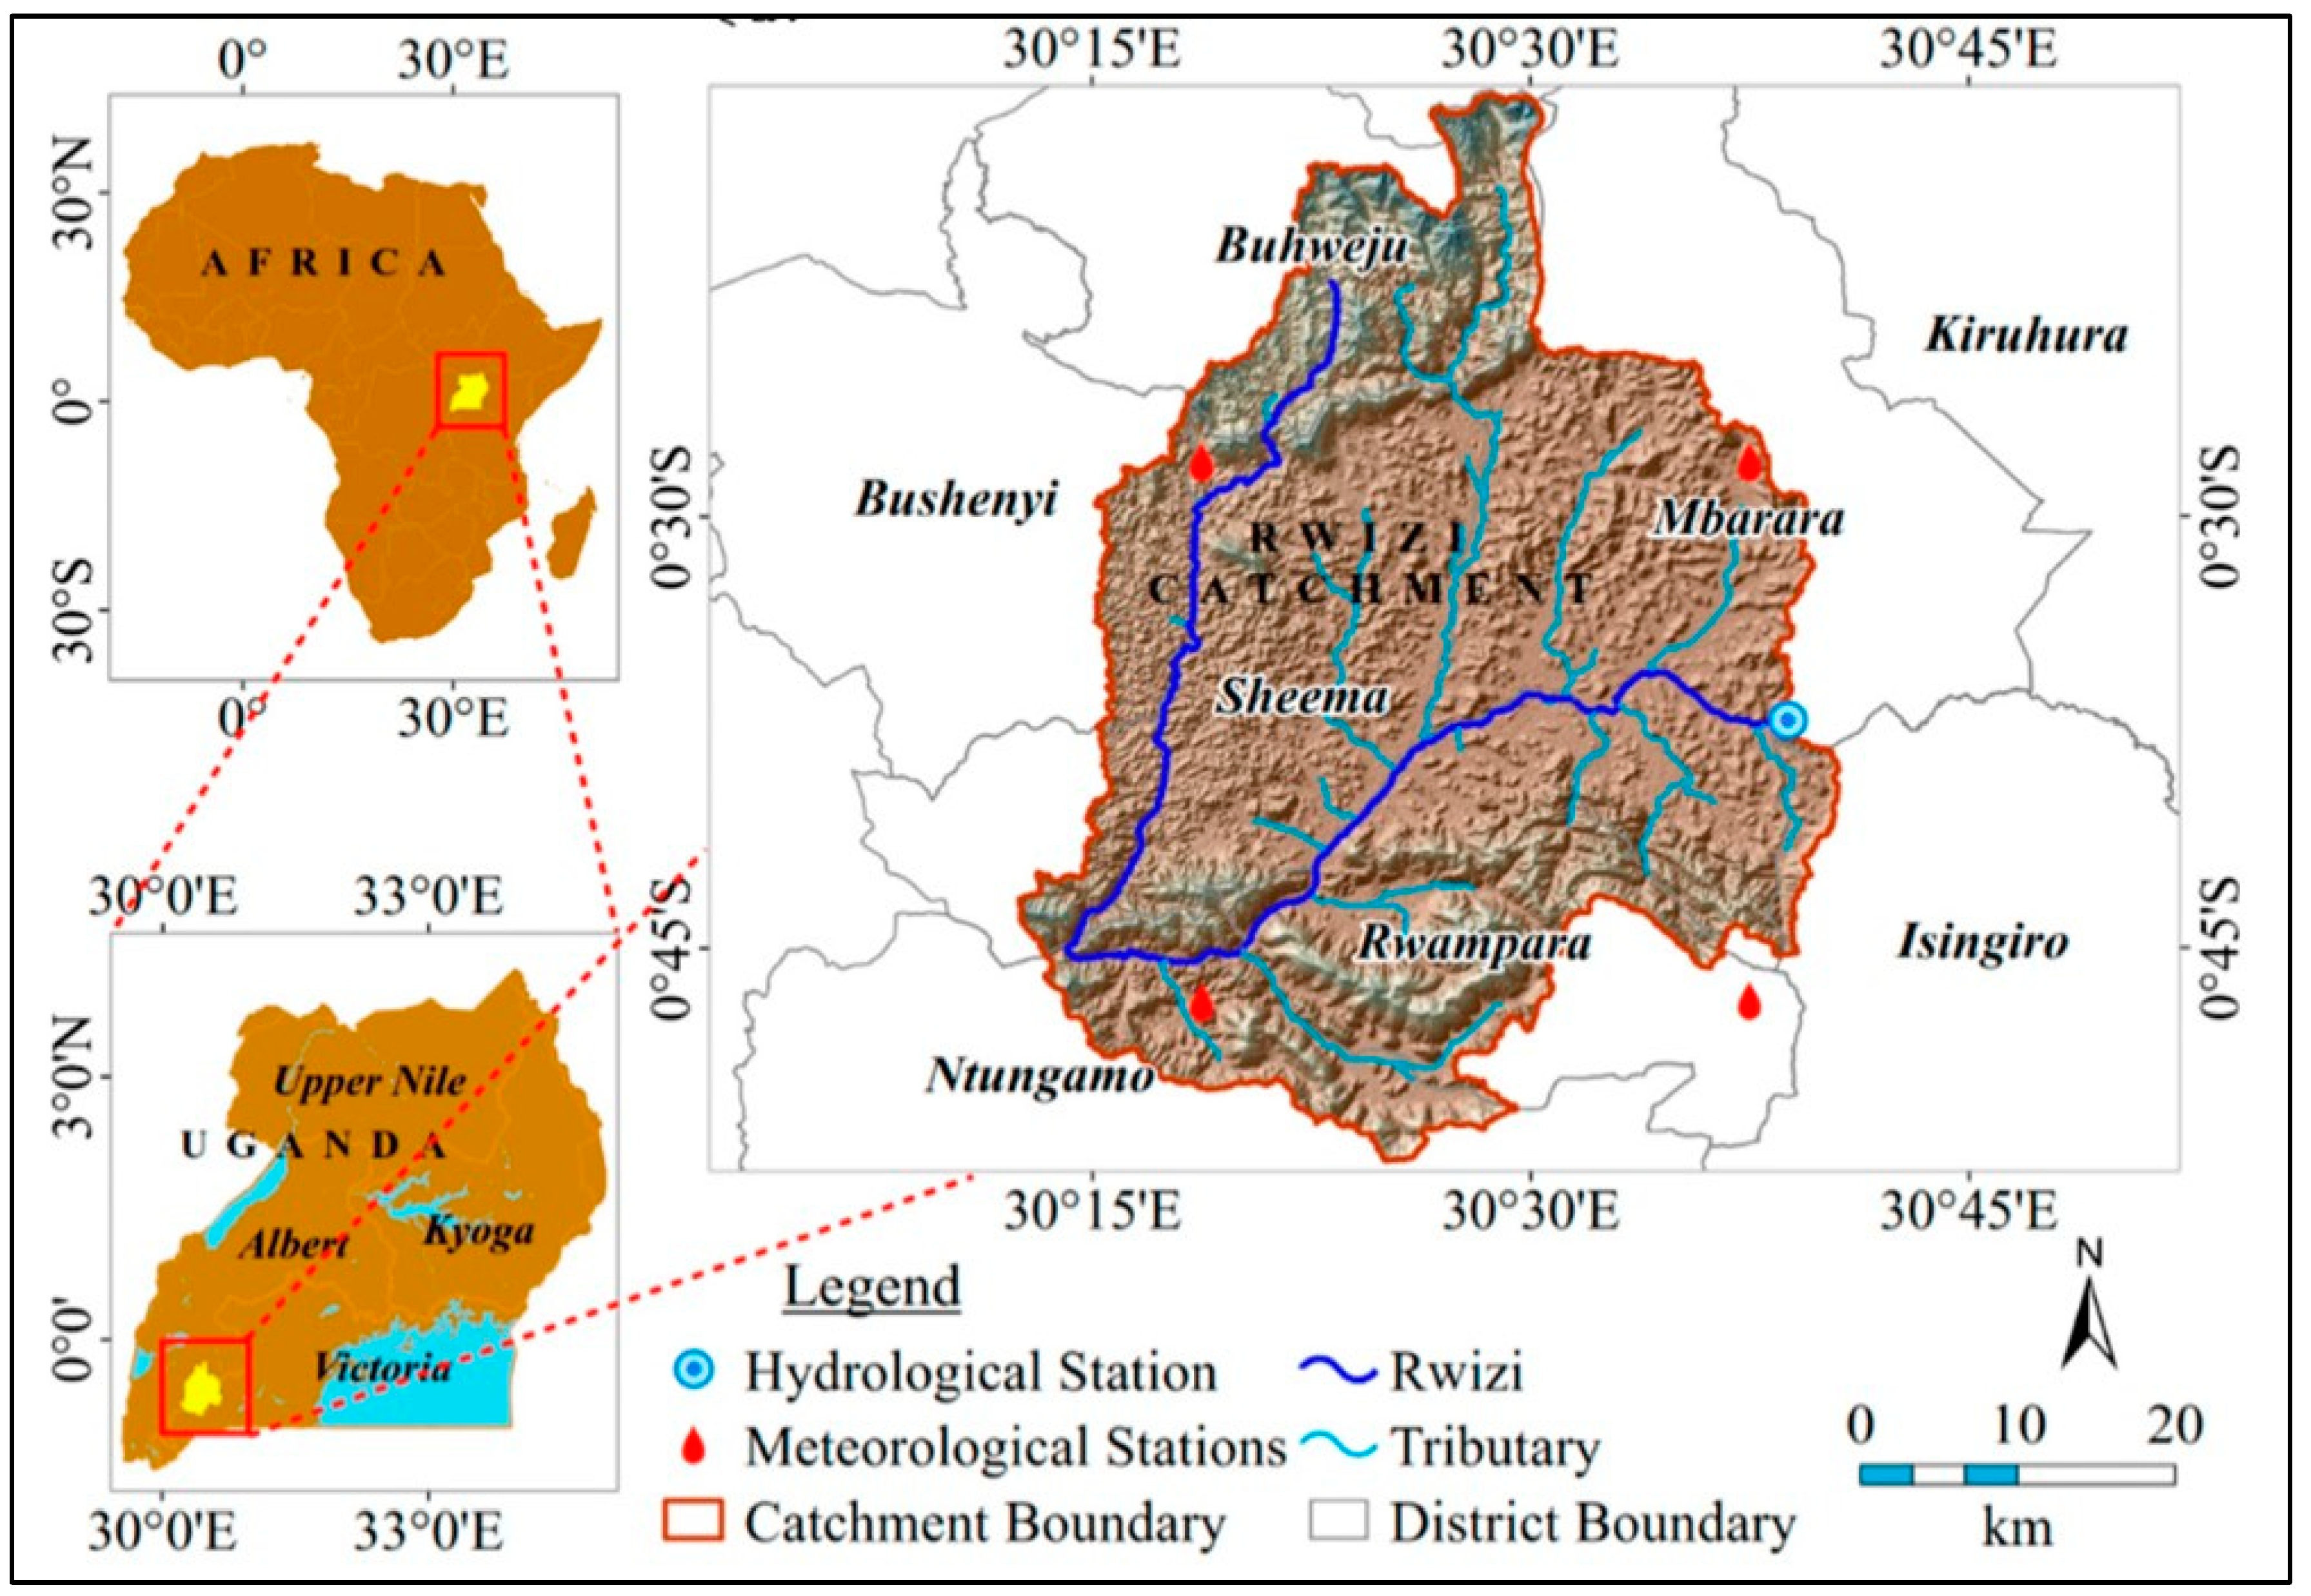
River Rwizi in the upstream areas of Ankole (or otherwise the Bukola River in the downstream areas of Buganda kingdom) is an 8200 km river (Figure 1). It is an influent river that discharges its water into the Ugandan portion of L. Victoria through interconnected wetlands of the Kooki lakes (i.e., Lake Mburo, Lake Kachera, Lake Nakivale and Lake Kijanebarola) system and the Sango Bay wetland forest [27,28,29]. The river is traced to originate from the mountainous parts of Buhweju district. It has various tributaries emanating from the hilly regions of the Nkore area, covering a total distance of approximately 55 km with a catchment area of 2521 km2 [22]. The river flows eastward for about 57 km until the gauge at Mbarara water works before it joins the Kagera transboundary river, which then pours into L. Victoria and progresses through the White Nile until the Mediterranean Sea in Egypt [30].
Also known as the “Life-line River” [20,30], River Rwizi is the main river that traverses Mbarara District and is thus the principal source of water for millions of people and livestock in Mbarara City boroughs. It is the biggest and longest river in the Ankole sub-region, serving 14 districts (Buhweju, Bushenyi, Isingiro, Kiruhura, Kyotera, Lyantonde, Rakai, Sheema, Mbarara, Rubirizi, Rwampara, Sembabule, and Ntungamo). Various anthropogenic activities are evident on River Rwizi. For example, there is sand mining, washing, brick laying, agriculture and dumping of medical and industrial wastes as well as treated water from Kakoba and Taso wastewater treatment plants [31]. More than 200 farmers illegally have hectares of land on the banks of River Rwizi, which have accelerated the degradation of its water quality, biodiversity, colonization by the invasive water hyacinth especially at the Taso village bridge, and reduction in its water levels such that it is traversable on foot [18,19,27]. Coupled with the looming impacts of the decadal climate change, there are worries that River Rwizi may be at the brink of drying up [30,32].

2.2. Collection of Soil and Vegetable Samples

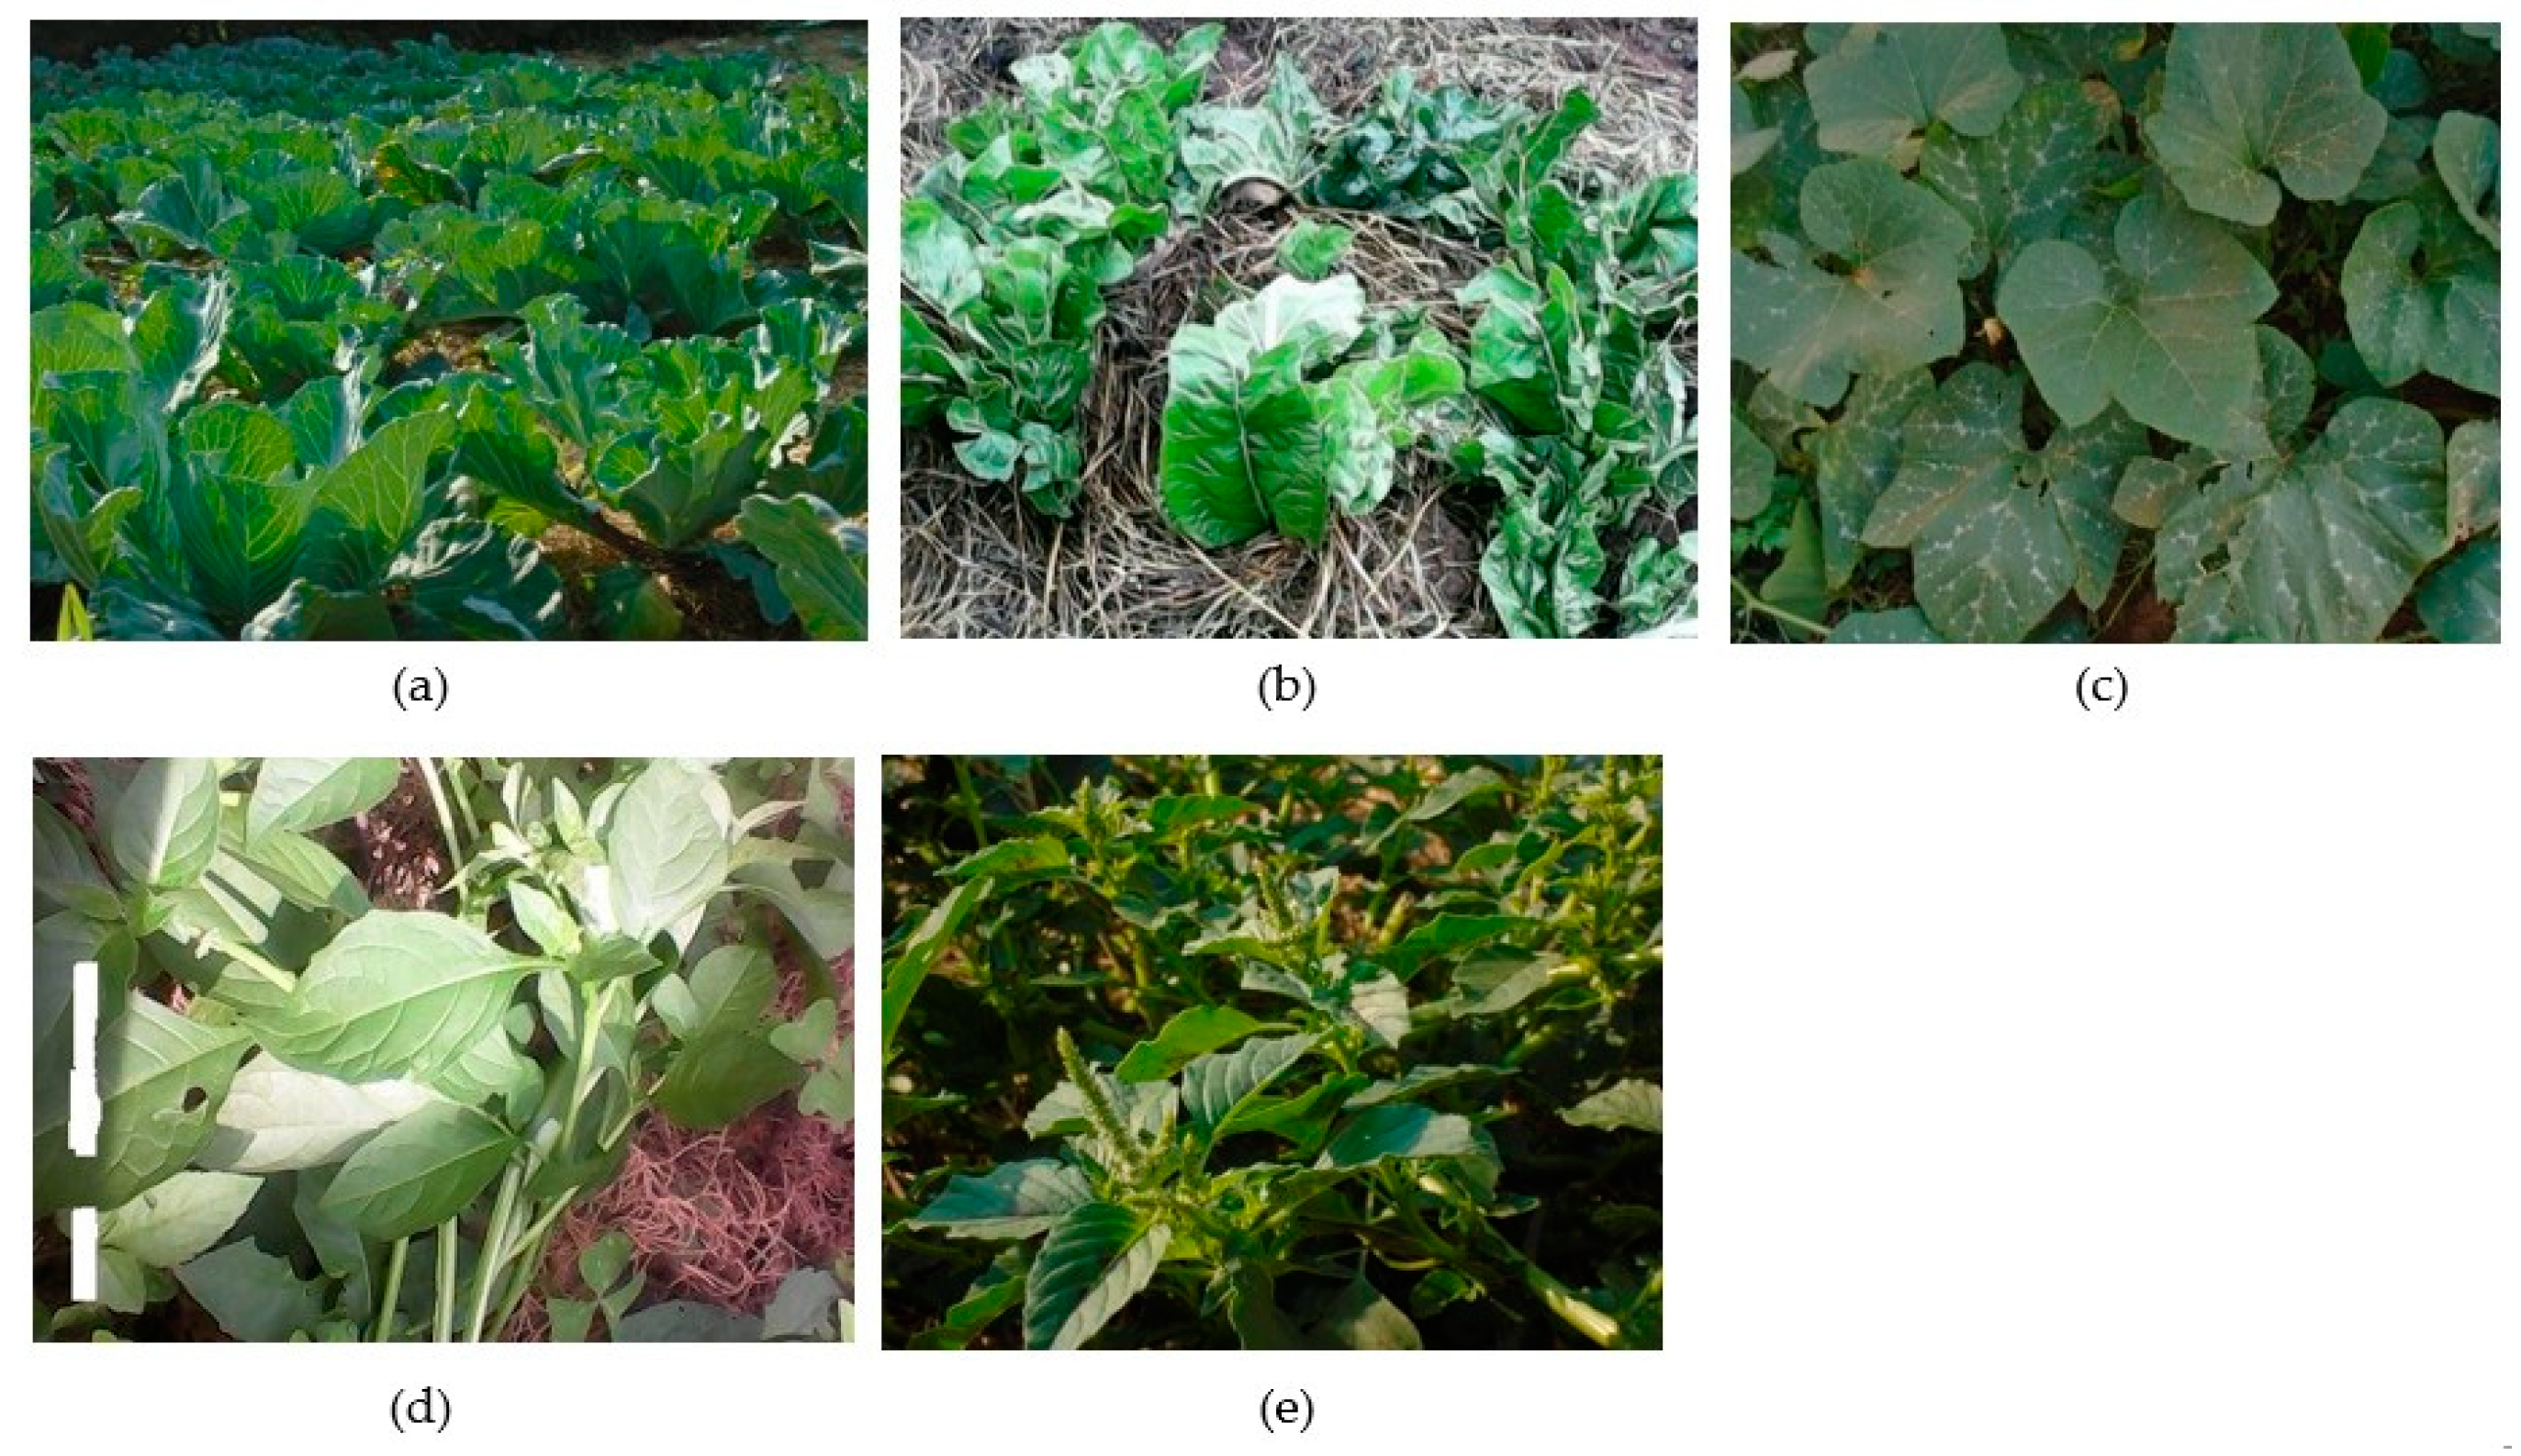
Sampling of both vegetables and soils was performed from January 2023 to April 2023. Five sampling sites were selected in the cultivated areas along the river at least 500 m apart, and these were based on the intensity of cultivation or potential anthropogenic activities (Table 1). Five samples of each vegetable were collected in triplicate per site, giving a total of 75 samples. These included cabbages (Brassica oleracea var. capitata), pumpkin (Cucurbita pepo L.), spinach (Spinacia oleracea L.), black nightshade (Solanum nigrum L.), and green amaranth (Amaranthus hybridus L.) (Figure 2). The corresponding soil samples (from depths of 0 to 15 cm) were obtained using a plastic scoop [33] from the same positions where the vegetables were uprooted (n = 75). All the samples were packed in labelled paper bags, sealed and transported to the laboratory.

2.3. Sample Preparation Procedures

The vegetable samples were washed under running tap water and then rinsed with distilled water to preclude contamination by pesticides, fertilizers and dust. Thereafter, they were blotted dry with tissue paper, put on labelled stainless-steel pans and dried in a hot air oven for 24–72 h at 70 °C [34].
The dried samples were cooled and then pulverized using a non-metallic motor and pestle to reduce the particle size. Each vegetable sample (2.0 g) was weighed and transferred into a 250 mL Pyrex glass beaker. Perchloric acid (70%, 5 mL) was added followed by concentrated nitric acid (15 mL). The sample was kept at room temperature for 1 h to allow for cold digestion, after which the sample was heated in a sand bath to achieve heat digestion. Digestion went on until no more brown fumes were present, and then the sides of the beaker were washed down with double distilled water to ensure all the sample was in solution.
Soil samples, on the other hand, were dried at 110 °C in an oven for 24 h. The dried samples were cooled and pulverized using a porcelain motor and pestle to reduce the particle size. For each soil sample, 1.0 g was weighed and transferred into a 250 mL beaker. Hydrochloric acid (37%, 5 mL) was added followed by concentrated nitric acid (15 mL). Cold digestion and heat digestion were then carried out for the vegetable samples above.

2.4. Trace Metal Analysis

Each digested sample was cooled and then filtered into 100 mL volumetric flasks. The filtrate was carefully washed down the flask and topped up to the mark with double distilled water. The flask was stoppered and the contents were shaken well. The diluent used was 1% nitric acid prepared using double distilled water. The samples were thereafter analyzed on a flame atomic absorption spectrometer (Analyst 300, Perkin Elmer, Waltham, MA, USA).
We ensured the quality of our data through the use of reagents of analytical grade, analysis of procedural blanks and spiked samples. The analytical recoveries obtained in the analyzed blanks and spikes ranged from 97.9% to 99.5%. The relative standard deviations were found to range from 4.4% to 5.1%.

2.5. Assessment of TMTs Bioconcentration in Leafy Vegetables

To establish whether or not the leafy vegetables grown on contaminated soils on the river bank were bioaccumulating the TMTs, the bioconcentration factor (BCF) was calculated using Equation (1) [35].
BCF = T r a c e   m e t a l ( l o i d ) c o n c e n t r a c t i o n   i n   t h e   l e a f y   v e g e t a b l e T r a c e   m e t a l ( l o i d ) c o n c e n t r a c t i o n   i n   t h e   s o i l  
Conventionally, BCF values higher than 1 confirm that a plant is a hyperaccumulator of the metal in question, whereas values less than 1 are indicative of an excluder [36].

2.6. Human Health Risk Assessment Due to Exposure to the TMTs

Human health risk assessments were used to examine the relationship between the environment and human health. The model proposed by United States Environmental Protection Agency [37], and used by previous studies [35,
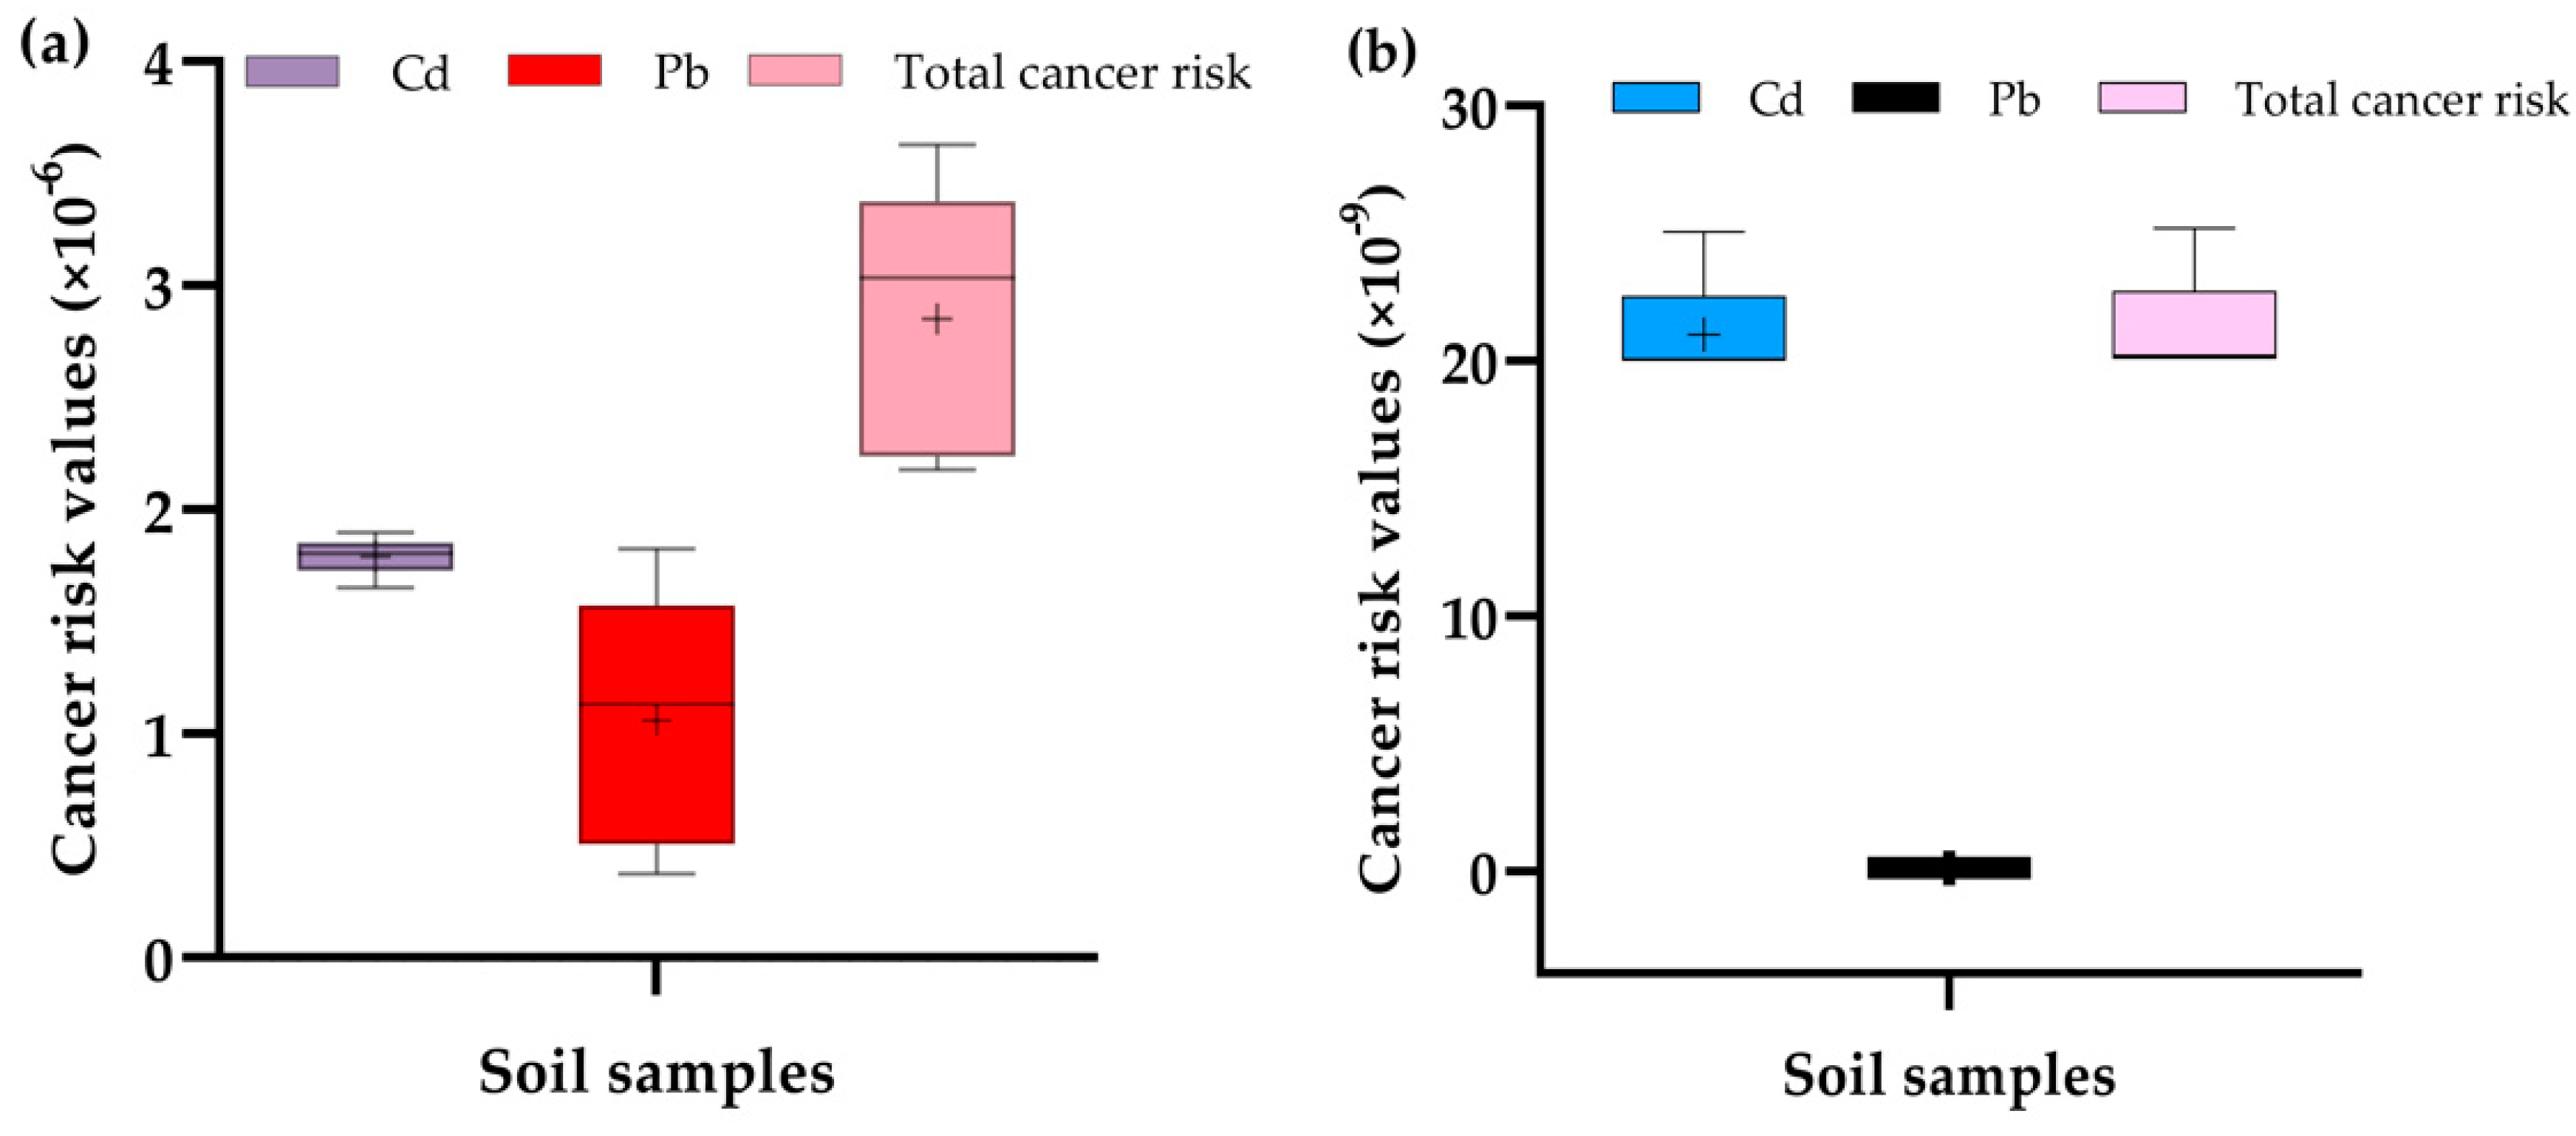
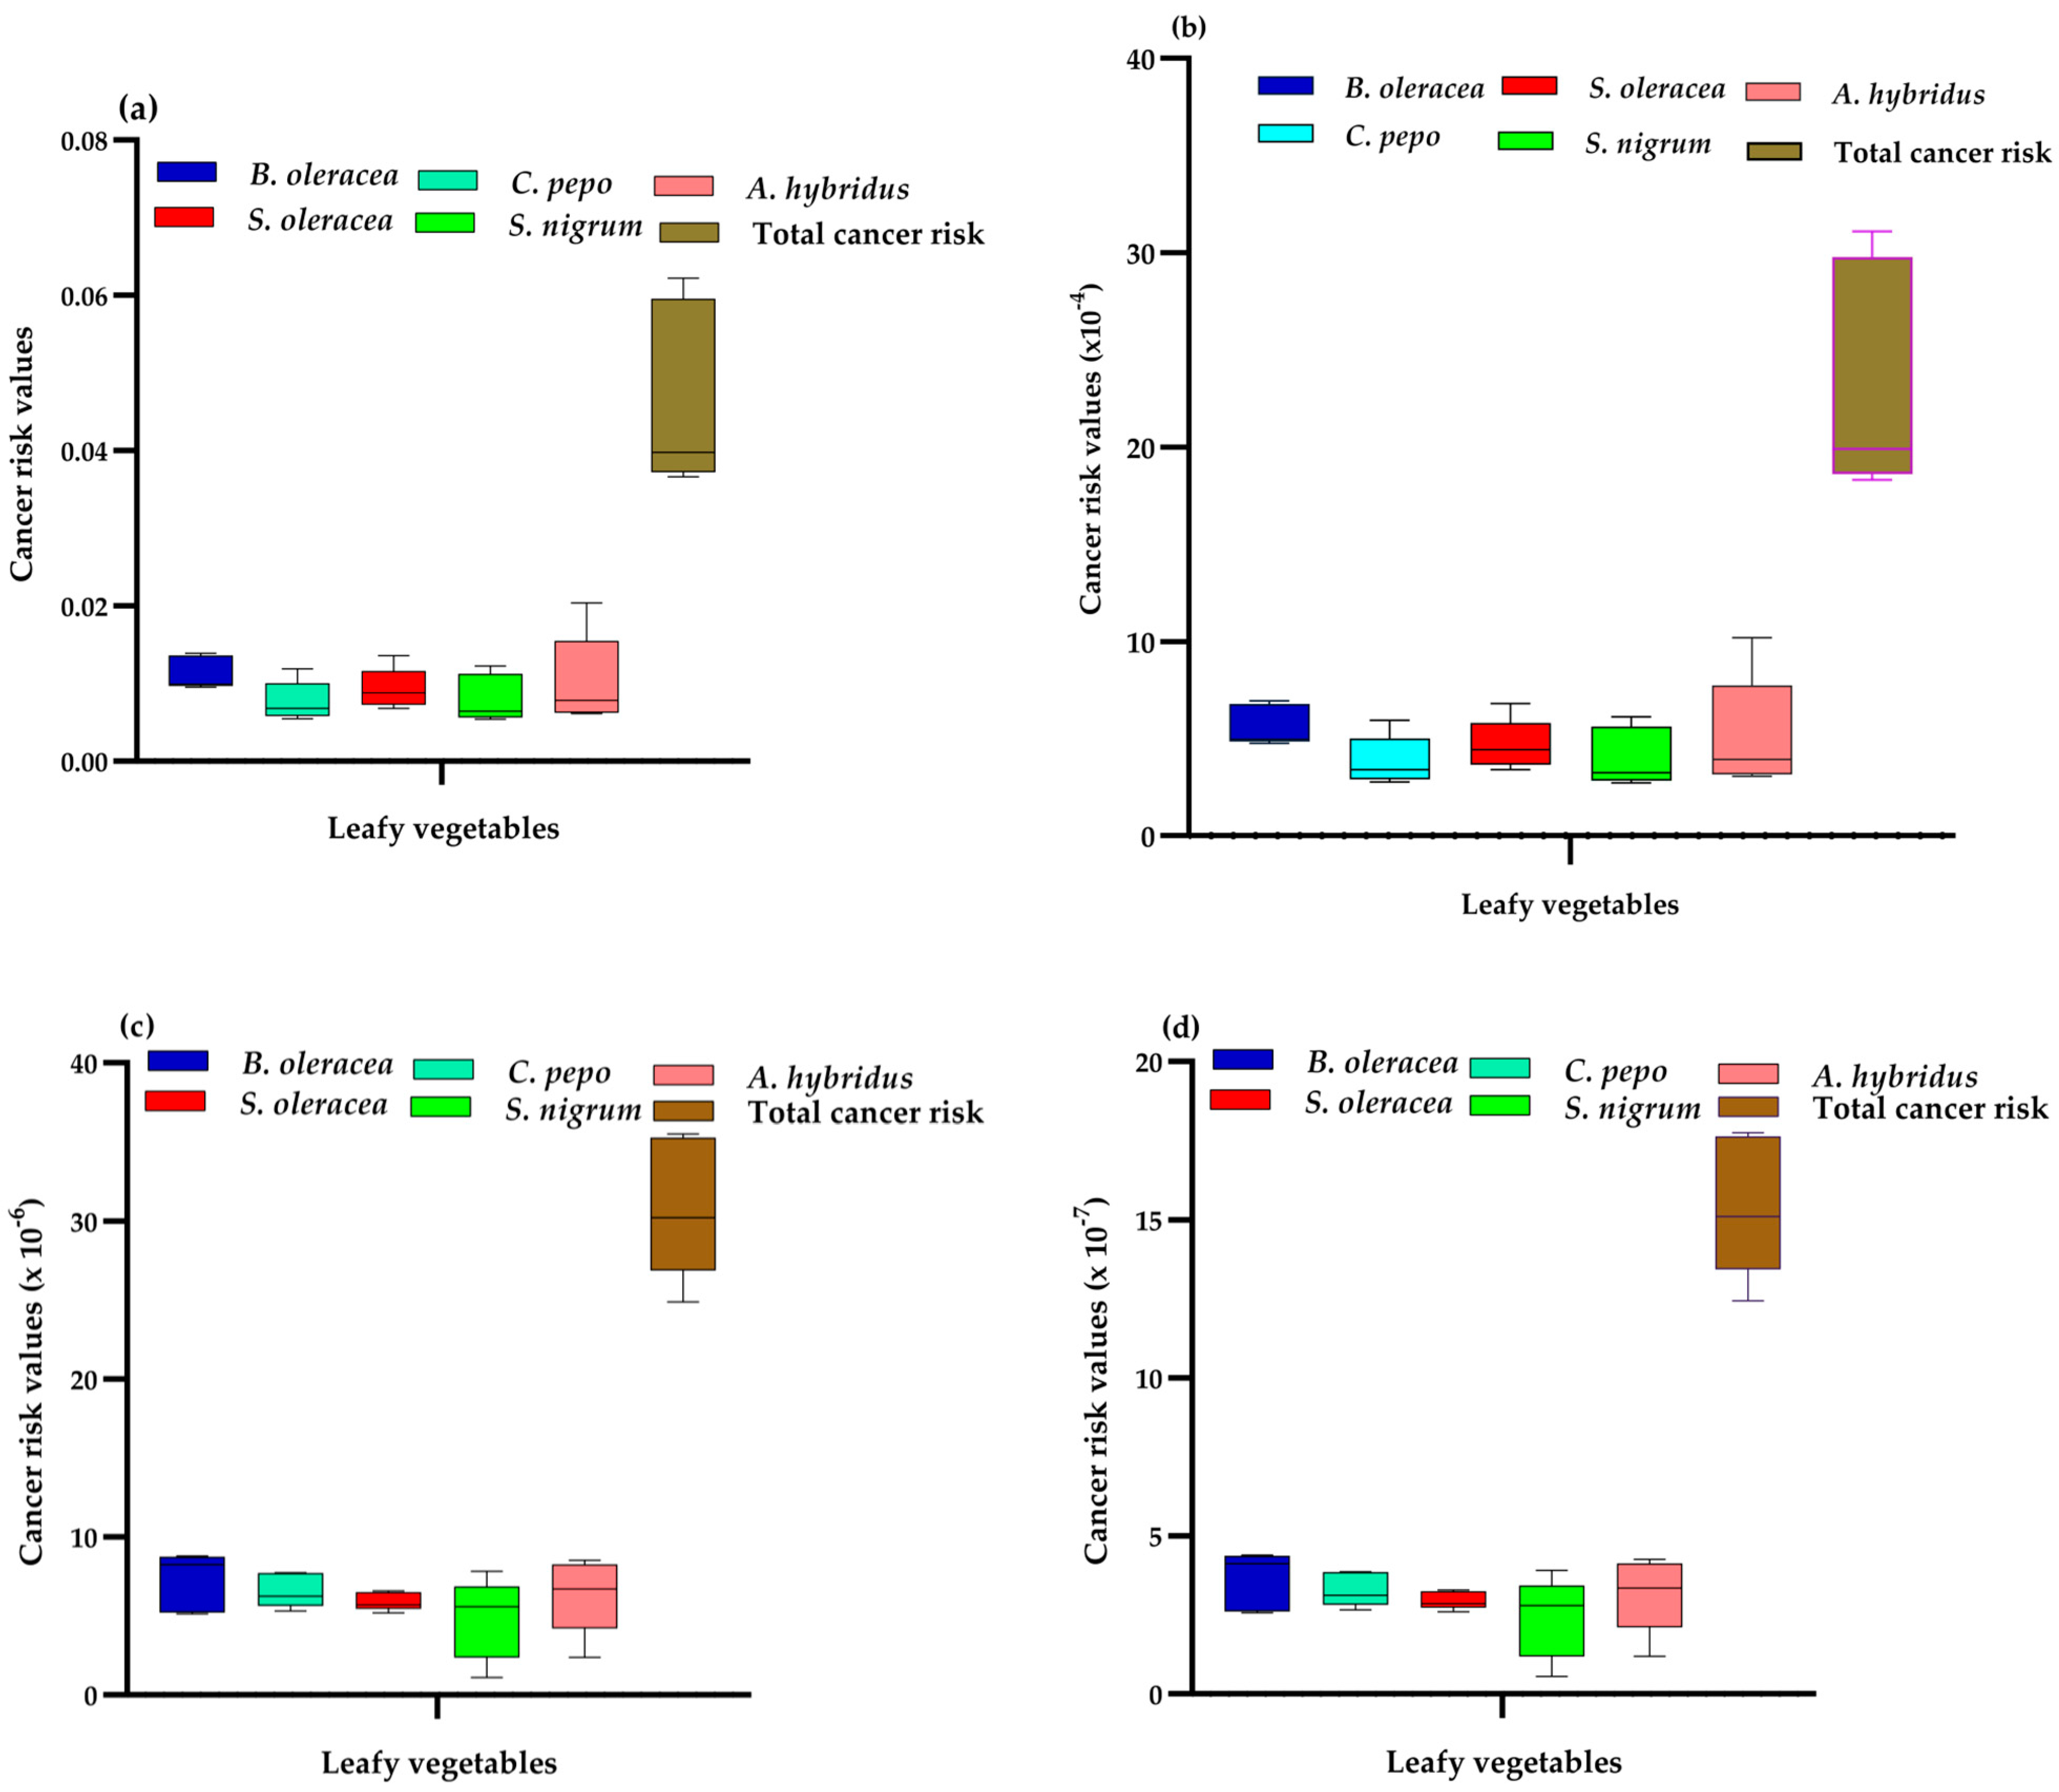
38] was adopted in this study. According to the US EPA carcinogenic chemical classification standards, the trace metal(loid)s investigated in this study can pose chronic non-cancer risks, but among which Cd and Pb can also pose cancer health risks [39]. From a sensitivity perspective, we further delineated such exposures by children (as a sensitive group) and adults (as representative of the general population), given that the toxicity of trace metalloids are expected to be influenced by the age of the intoxicated organism [26].

2.6.1. Non-Cancer Health Risks

The chronic daily intake (mg kg−1day−1) through inhalation (CDIINH), incidental ingestion (CDIING), and dermal contact (CDIDC) with soils was calculated using Equations (2)–(4) [40]. Similarly, the estimated daily intake (EDI) for direct ingestion of the contaminated leafy vegetables (mg kg−1 day−1) was calculated using Equation (5) [38,41]. Supplementary Materials (Table S1) describe the factors used, their units and values [34,40,42,43,44,45].
CDI INH   C T M T × I n h R S × E X F × E X D P E F × W a b × T a e t
CDI ING   C T M T × I n g R S   × C V F × F I × E X F × E X D W a b × T a e t
CDI DC   C T M T × S A F × C V F × A F × D A F × E X F × E X D W a b × T a e t
EDI = E X F × E X D ×   I n g R V × C T M T W a b × T a e t
Target Hazard Quotient (THQ) was calculated to establish non-cancer risks from the TMTs through the three different exposure routes (Equations (6)–(9)). Due to the well-established additive effects of TMTs, the hazard index (HI) was established as the sum of the THQ of the individual element through a given exposure pathway (Equation (10)) [40].
THQ INH = C D I I N H R f D I N H
THQ ING = C D I I N G R f D I N G
THQ DC = C D I D C R f D D C
THQ EDI = E D I R f D I N G
HI = i = 1 n = 6 THQ
where RfDING, RfDINH and RfDDC are the oral (direct ingestion), inhalation and dermal reference doses of the specific element.

2.6.2. Cancer Health Risks Evaluation

To assess the probable cancer risks (CR), the incremental lifetime cancer risk for ingestion of the carcinogenic elements (Cd and Pb) was estimated for direct ingestion of soils or vegetables using Equations (11) and (12) [40].
CRING = CDIING × IGCSF
CREDI = EDI × IGCSF
where IGCSF is the ingestion cancer slope factor = 5.01 × 10⁻¹ and 8.5 × 10⁻³ mg kg−1 day−1, respectively, for Cd and Pb [40].

2.7. Soil Pollution Extents and Ecological Health Risks Posed by the TMTs

To decipher soil pollution levels of the TMTs along the banks of River Rwizi, geostatistical indices, i.e., the contamination factor [46] and geo-accumulation index [47], were calculated (Equations (13) and (14)). This was performed with respect to the concentrations of TMTs in the soils to the concentration of the metals in uncontaminated soils sampled from Mbarara City in our previous study [33] for Mn (695.3 mg kg−1), Cd (0.13 mg kg−1), Pb (19.88 mg kg−1), and Cr (40.69 mg kg−1). The background concentrations for Cu (38.9 mg kg−1) and Zn (64.00 mg kg−1) used are the global averages of the upper continental crust [48].
Contamination   factor   ( CFs )   = C TMT C b g
I geo = Log 2   C TMT 1.5   C b g
where CTMT is the concentration of the TMT in the soil sample, Cbg is the background concentration of the same TMT in the background soil sample, and 1.5 is the background matrix correction factor [33]. The classification of CFs and Igeo values is described in Table S2.
To discern the cumulative pollution load in a particular soil sample, the pollution load index (PLDI) was calculated using Equation (15).
PLDI = (CFS1 × CFS2 × CFS3 × CFS4 × CFS5× CFS6)1/6
wherein CFS1 to CFS6 are the calculated contamination factors for the six TMTs.
The potential ecological risk index technique based on the work of Hakanson [46] was used to assess the sensitivity of the biotic community to the TMTs. The potential ecological risk coefficient ( E R i ) and potential ecological risk index (PERI) were calculated (Equations (16) and (17)).
E R i = T R i × CF s
PERI = i = 1 i = 6 E R i
From which T R i = biological toxic factor of the TMTs: Mn = Zn = 1, Cd = 30, Pb = Cu = 5, and Cr = 2 [49]. The risk characterization criterion is provided in Table S2.

2.8. Statistical Analysis

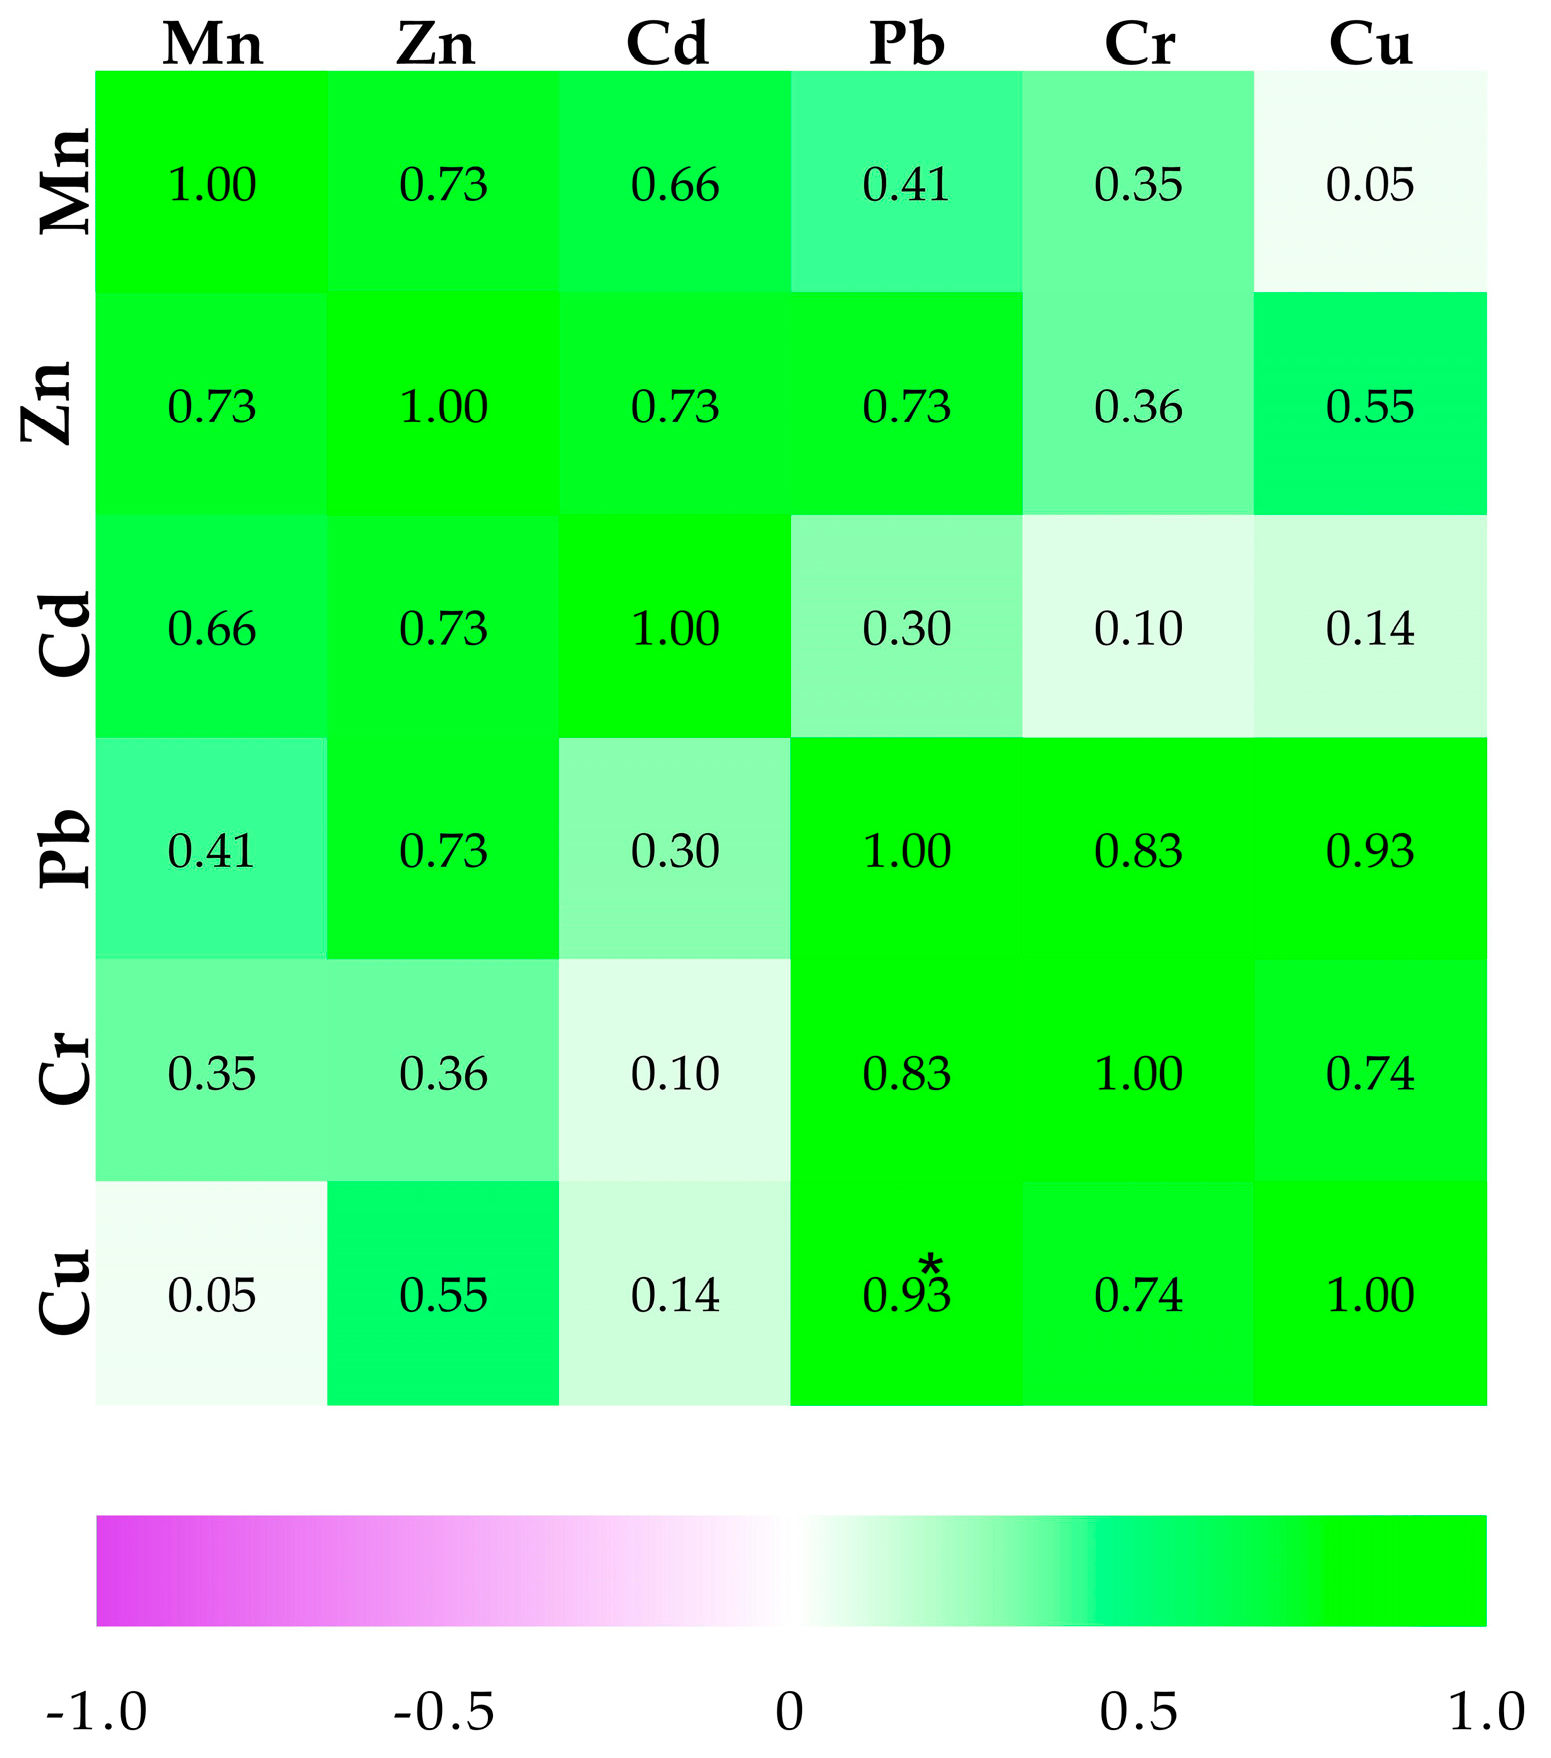
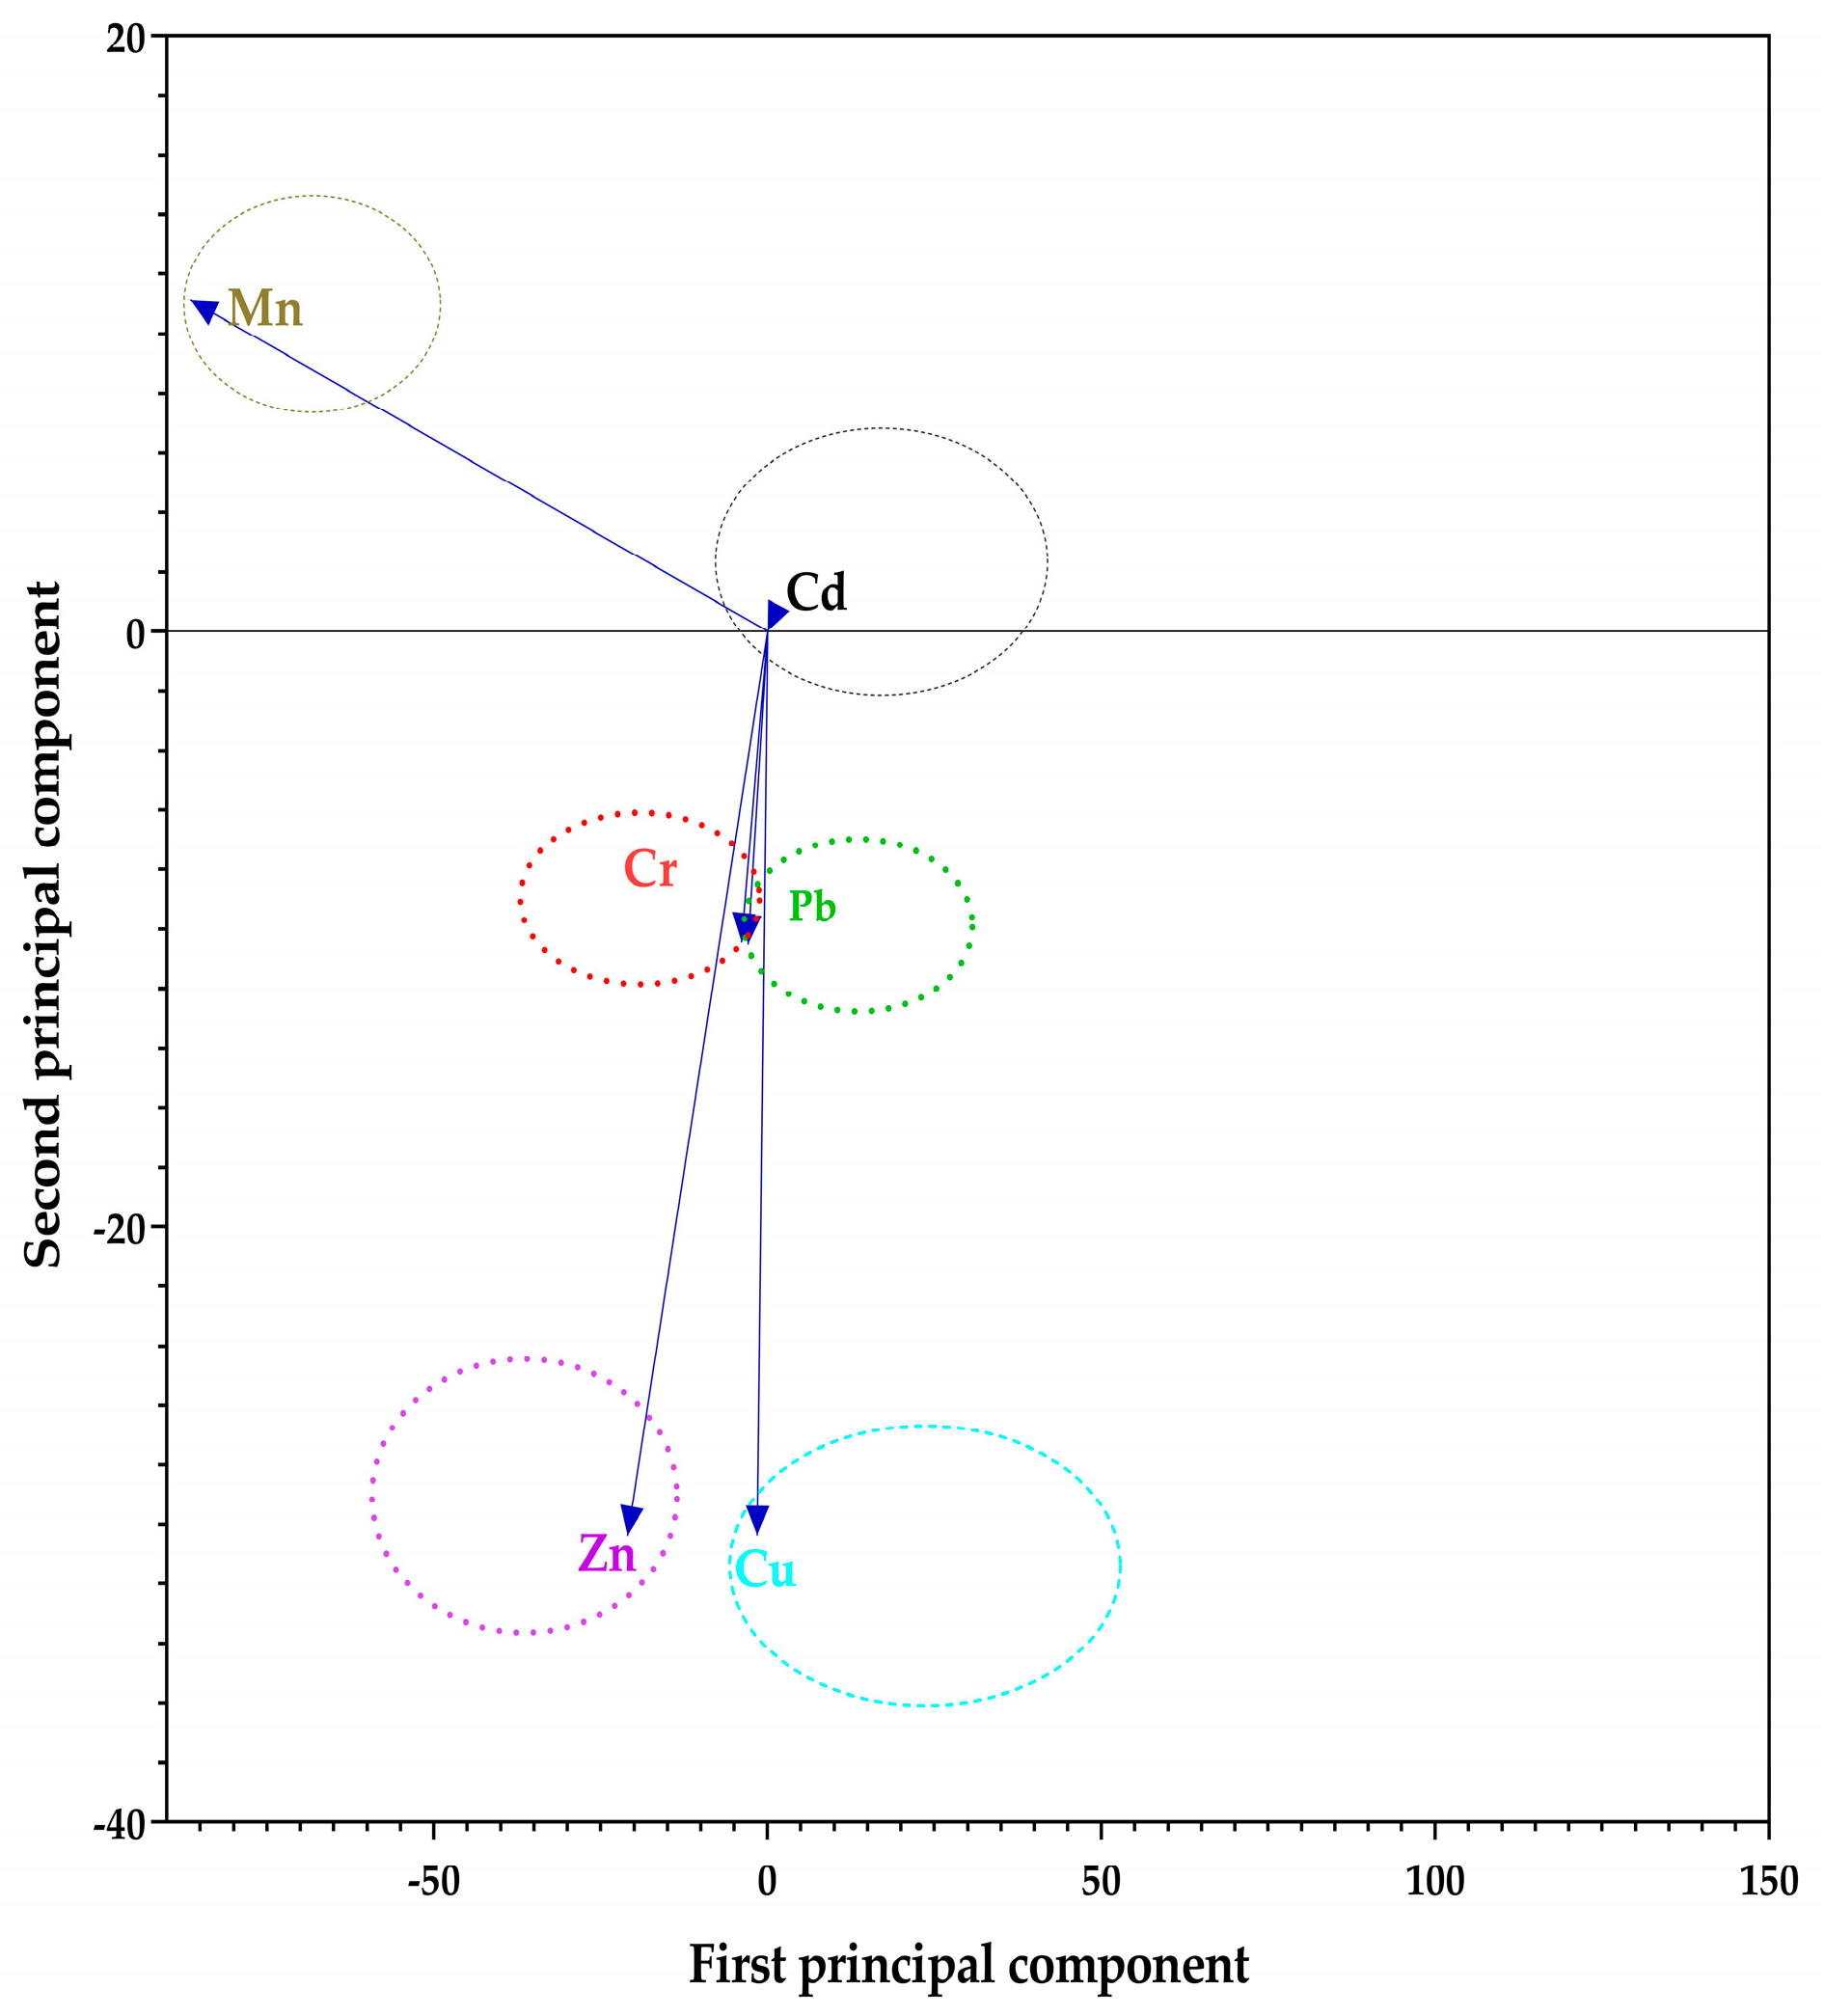
All the numerical data were captured in Microsoft Excel where descriptive statistics were used to summarize them as means with standard deviations. Pearson’s correlation analysis was used to establish potential pairwise relationships between the concentration of TMTs in the soils and the leafy vegetable tissues. To establish the hypothetical sources of the TMTs, Principal Component Analysis (PCA) was used. Further, PCA components were transformed using a varimax rotation with Kaiser normalization post analysis. One-way analysis of variance (ANOVA) at p < 0.05 was employed to identify potential significant differences among the means for the TMTs at the different sites. All statistical analyses and data visualizations proceeded in GraphPad Prism (v9.3.1 for Windows, GraphPad Software, San Diego, CA, USA).

3. Results

3.1. Trace Metal Content of the Soil Samples and Leafy Vegetables

The average concentration of Mn in the soils ranged from 205.60 ± 0.40 mg kg−1 for samples from the area below Bishop Stuart University to 373.84 ± 0.60 mg kg−1 at Kashanyarazi area (Figure 3). Zinc, on the other hand, showed an interesting trend, with the lowest average concentration (12.72 ± 0.52 mg kg−1) being for samples from the area below Bishop Stuart University while the highest average concentration was 65.04 ± 1.50 mg kg−1 for samples from the Kashanyarazi area. The other concentration ranges were 0.26 ± 0.09 to 0.42 ± 0.19, 3.46 ± 1.91 to 16.80 ± 4.67, and 2.83 ± 1.57 to 35.27 ± 30.11 mg kg−1 in soils from the Katete area and below Bishop Stuart University for Cd, Pb and Cu, respectively. These metals showed a similar enrichment trend in soils from the area below Bishop Stuart University. Chromium occurred at concentrations of 5.96 ± 4.52 to 25.06 ± 10.75 mg kg−1 in soils from behind Mbarara Regional Hospital.
On the other hand, vegetables cultivated along the Mbarara City stretch of River Rwizi had the highest mean concentration of Mn (131.7 ± 1.60 mg kg−1) in B. oleracea from the Kashanyarazi area (Figure 4a). Its lowest concentration (25.04 ± 0.47 mg kg−1) occurred in C. pepo leaves sampled from the area below Bishop Stuart University. For Zn, the concentrations were generally lower in the vegetable samples (Figure 4b), i.e., 25.43 ± 0.01 mg kg−1 in B. oleracea from the Katete area to 126.1 ± 0.35 mg kg−1 in S. oleracea from the Kashanyarazi area. Both Mn and Zn had no statistically significant differences among the study sites (p < 0.05). Like in the soils, Cd occurred at the lowest concentrations in the vegetables (0.80 ± 0.03 mg kg−1 in S. nigrum from the area below Bishop Stuart University to 3.00 ± 0.15 mg kg−1 in A. hybridus from the Kashanyarazi area; Figure 4c). Considering Pb, the recorded concentrations varied from 0.95 ± 0.01 mg kg−1 in S. nigrum from the area below Bishop Stuart University to 7.63 ± 0.44 mg kg−1 in S. oleracea from the area below Bishop Stuart University (Figure 4d). The same pattern was observed for Cr where the lowest mean value of 0.6 ± 0.00 mg kg−1 was recorded in S. oleracea samples from the area below Bishop Stuart University and the highest mean value (0.85 ± 0.20 mg kg−1) occurred in A. hybridus from the same area (Figure 4e). Finally, Cu was recorded from 2.2 ± 0.10 mg kg−1 in S. oleracea from the Katete area to 37.65 ± 0.25 mg kg−1 in S. nigrum from the Kashanyarazi area (Figure 4f). Overall, the accumulation followed the order Mn > Zn > Cu > Pb > Cr > Cd.

3.2. Correlation of Trace Metals in Soils and the Leafy Vegetables

Assessment of inter-metal correlations showed that in soils, only Cu and Zn had a significant positive correlation (r = 0.93, p = 0.023; Figure 5). Other metal pairs that had insignificant but strong positive correlations were Mn and Zn (r = 0.73, p = 0.162), Mn and Cd (r = 0.66, p = 0.224), Zn and Pb (r = 0.73, p = 0.157), Zn and Cd (r = 0.73, p = 0.163), Pb and Cr (r = 0.83, p = 0.082), and Cr and Cu (r = 0.74, p = 0.156). In agreement with these observations, the PCA results showed that there is only a close association between the Cu and Zn, which is in complete agreement with Pearson’s correlation results (Figure 6).
The interrelationships between the concentration of the TMTs in the soils and in the plants indicated that Mn in the soils had very strong and significant positive correlation with Mn in B. oleracea (r = 0.90, p = 0.03; Table S3). Similar positive correlations could be observed for Mn in C. pepo (r = 0.66, p = 0.03), Zn in soils and S. nigrum (r = 0.70, p = 0.02), Cr in soils, C. pepo and S. oleracea (r = 0. 0.75, p = 0.142; r = 0. 0.75, p = 0.146, respectively) and Cu in S. oleracea (r = 0.65, p = 0.234). It was observed that A. hybridus had either a negative or weak positive correlation between the levels of TMTs in its tissues relative to that in the soils.

3.3. Trace Metal Bioconcentration in Leafy Vegetables

Regarding bioaccumulation, Mn had a BCF of 0.01 to 0.50 while Cr had BCF of 0.02 to 0.14 in the vegetables. Cadmium had the highest bioconcentration in the leafy vegetables (BCF = 1.90 to 10.71), with the highest level of accumulation found in A. hybridus leaves from behind Mbarara Regional Referral Hospital. Zinc was bioconcentrated in 76% (19/25) of the vegetable samples (BCF = 1.03 to 4.76). Similarly, Cu was bioconcentrated in 44% (11/25) of the vegetable samples (BCF = 1.08 to 4.12). These bioaccumulations occurred mostly in C. pepo and S. nigrum (from the Kashanyarazi area, Rugazi bridge area and the area below Bishop Stuart University), B. oleracea (from the Kashanyarazi area), S. oleracea and A. hybridus (from the Rugazi bridge area and the area below Bishop Stuart University). On the other hand, Pb was mostly bioconcentrated in 24% (6/25) samples from the Rugazi bridge area and the area below Bishop Stuart University (BCF = 1.13 to 2.21) but was not bioaccumulated in S. nigrum (Table 2).

3.4. Human Health Risk Assessment Indices

3.4.1. Non-Cancer Risk Indices

Regarding chronic daily intake through inhalation (CDIINH), the values ranged from 0.000031 × 10⁻⁶ mg kg−1 day−1 for Cd in soils from the Rugazi Bridge area inhaled by adults to 3.63 × 10⁻⁶ mg kg−1 day−1 for Mn in soils from the Kashanyarazi area inhaled by children (Table 3). These values were lower than the corresponding oral (direct ingestion) reference dose. The hazard indices ranged from 0.00719881 in soil samples from below Bishop Stuart University for adults to 0.23437897 for soil samples from behind Mbarara Regional Hospital with TMTs inhaled by children. Taken together, there are no potential non-cancer health effects that could arise from the inhalation of soil particles from the sampled stretch of River Rwizi bank with vegetable growing activities.
Considering chronic daily intake through ingestion of TMTs in soils from the banks of River Rwizi (CDIING), the values ranged from 0.004 × 10⁻⁵ mg kg−1 day−1 for Cd in soils from the Kashanyarazi area ingested by adults to 477.95 × 10⁻⁵ mg kg−1 day−1 for Mn in soils from the same area ingested by children (Table 4). Similar to the observation for inhalation as an exposure pathway, the chronic daily intakes through direct oral ingestion were never higher than the corresponding individual trace metal’s oral (direct ingestion) reference doses. Accordingly, the hazard indices for exposure through this pathway (0.009665 for contaminated soil samples from below Bishop Stuart University ingested by adults to 0.9678897 for samples from the Katete area ingested by children) would pose no discernable non-cancer health risk to the overall population.
Exposure through dermal contact to the TMTs was also assessed. The results (Table 5) indicated that the values ranged from 0.0166 × 10⁻⁶ mg kg−1 for Cd in soils from the Rugazi Bridge area to 13.3831 × 10⁻⁶ mg kg−1 day−1 for Mn in soils from the Kashanyarazi area adsorbed into the skin of children. The hazard indices in all cases, however, never exceeded 1.
Similarly, we established the potential health effects that could arise from consumption of the leafy vegetables by both adults and children. The estimated daily intakes and hazard indices calculated showed that children were the most likely to experience non-cancer risks (Tables S4–S9). The hazard indices were as follows: Mn (1.124 for adults consuming vegetables from the Rugazi Bridge area to 53.67 for children consuming the vegetables sources from behind Mbarara Regional Hospital), Zn (0.46 for adults consuming vegetables from the areas below Bishop Stuart University to 16.12 for children consuming the vegetables from the Kashanyarazi area), Cd (3.65 for adults consuming vegetables from the areas below Bishop Stuart University to 124.16 for children consuming the vegetables from the Kashanyarazi area), Pb (0.42 for adults consuming vegetables from the areas below Bishop Stuart University to 11.95 for children consuming the vegetables from the Katete area), Cr (0.08 for adults consuming vegetables from the Kashanyarazi area to 1.83 for children consuming the vegetables from the Katete area), and Cu (0.01 for adults consuming vegetables from the Kashanyarazi area to 0.65 for children consuming the vegetables from the Kashanyarazi area).

3.4.2. Estimation of Potential Carcinogenic Health Risks

Evaluation of potential cancer risks revealed that through ingestion of contaminated soils, the risk values ranged from 1.5 × 10⁻⁹ for Pb ingested by adults to 1.9038 × 10⁻⁶ for Cd, both in soils sampled from the Kashanyarazi area (Figure 7; Table S10). Taking the calculated total cancer risk values into consideration, there are no potential cancer risks that could be experienced in both adults and children following oral ingestion of soils from the considered stretch of River Rwizi.
For the consumption of the leafy vegetables, cancer risk values ranged from 5.48505 × 10⁻⁸ for Pb in S. nigrum from below Bishop Stuart University consumed by adults to 1.39 × 10⁻² for Cd in B. oleracea from the Kashanyarazi area consumed by children (Figure 8). In both children and adults, the individual cancer risk values for Cd (Figure 8a,b; Table S11) laid outside the safe limit of 10−6 to 10−4, suggesting that there are potential carcinogenic health effects.

3.5. Pollution Level and Ecological Risk Assessment Indices

Assessment of potential enrichment of the TMTs in the soils from the banks of River Rwizi was performed. The results of CFs, Igeo and pollution load indices are given in Table 6. The computed CFs were all less than 1 for Mn, Pb, Cr and Cu. Zinc also had CFs < 1 at most of the sites, except for soils from the Kashanyarazi area (CFs = 1.02). In contrast, Cd had the highest CFs ranging from 2.00 for soils from the Katete area to 3.23 from the area below Bishop Stuart University.
The geoaccumulation indices calculated for the soil samples were mainly less than 1 (−4.366 for Cu at areas below Bishop Stuart University to −0.726 for Cu in soils from the Katete area). Only Cd had positive Igeo values (range: 0.415 for soils sampled from the Katete area to 1.107 for soils sampled from areas below Bishop Stuart University). In this index, the TMTS followed the sequence Cd > Zn > Mn > Pb > Cr > Cu. For the values obtained following pollution load index PLDI computation, none of them were greater than 1.
Further, the E R i and PERI were calculated to establish the risk the TMTs could pose to biodiversity of the riverbanks. The values obtained ranged from 0.20 for Zn in soils from the area below Bishop Stuart University to 96.9 for Cd in soils from the area (for E R i ) and 67.54 for soils from the Rugazi Bridge area to 98.90 for soil samples from the area below Bishop Stuart University for PERI (Table 7). Considered closely, the E R i followed the order Cd > Pb > Cu > Cr > Zn > Mn.

4. Discussion

4.1. Trace Metal Pollution of Soils and Their Bioaccumulation in Leafy Vegetables

This study established that the leafy vegetables cultivated along the banks of River Rwizi accumulated toxic TMTs from contaminated soils. Overall, Mn had the highest concentration in soils. The order followed by the TMTs was Mn > Zn > Cu > Cr > Pb > Cd. In reference to the World Health Organization (WHO) target values that are considered to be the desirable maximum levels of TMTs in unpolluted soils (50.0, 0.8, 85, 100, and 36 mg kg−1 for Zn, Cd, Pb, Cr and Cu, respectively [50]), only Zn in soil samples from Kashanyarazi and Katete areas exceeded its target value in the sampling sites. When compared with the global averages of the TMTs in the upper continental crust (571.0, 64.0, 0.40, 59.5, 27.0 and 38.9 mg kg−1 for Mn, Zn, Cd, Cr, Pb and Cu, respectively) reported by previous studies [48,51], only Zn in soils from the Kashanyarazi area was above the reported average value. In soils in the proximity of the Boac and Mogpog rivers (Marinduque, Philippines), Mn was reported at concentrations of 8600 mg kg−1 to 59,000 mg kg−1 [52], which are higher concentrations than reported in this study. The high levels of Mn in the soils in this study may be attributed to carriers of Mn during flooding events on the river (iron oxyhydroxides), which are more stable than Mn oxides but also more abundant in the soils [52].
Regarding leafy vegetables, the FAO/WHO permissible limits for TMTs in edible vegetables are 0.60, 0.3, 0.30, 1.30, and 10.00 mg kg−1 for Zn, Cd, Pb, Cr and Cu, respectively [53,54]. In the suburb of Zhengzhou City, People’s Republic of China, the concentrations of TMTs found in B. oleracea var. italica P. were Cd = 0.048, Pb = 0.34, Cr = 0.64 and Cu = 9.52 mg kg−1. These values are lower than those found in this study [55]. In wastewater-irrigated areas of Titagarh (India), TMTs (Zn = 136.5–181.0, Cd = 6.5–32, Pb = 41.9–60.5, Cr = 74.0–115.4 and Cu = 22.1–48.6 mg/kg dry weight) occurred at higher concentrations than those obtained in this study. In another study in some vegetable-growing fields beside the Paira River (Bangladesh), Islam et al. found that A. hybridus had comparable concentrations (mg/kg dry weight) of Cd (0.01–1.60), Pb (0.07–4.50), Cr (0.49–2.40) and Cu (0.86–5.80) to those obtained in this study [56]. While the concentrations of the TMTs recorded were expected, the spatial variations in their levels along the stretch of River Rwizi may be associated with different anthropogenic activities taking place there and the different mechanisms that mediate trace metal bioaccumulation and phytoavailability metals in plants [38,56,57].
Inter-metal correlations showed that Cu and Zn in the soils had a significant positive correlation. The other metal pairs had insignificant but strong positive correlations. These also agreed with PCA results. It should be cited that such significant positive correlations between the metal pairs indicate that they are originating from a common or combined source, whereas weak correlations indicate otherwise [58]. Positive correlations may also confirm that there are mutual dependences among the metals or that they exhibit identical behaviors during their transport. In the case of positive relationships between the levels of the same metal in the soils and in the leafy vegetables, it attests to its accumulation from the soils into the vegetables.
Our assessment of bioaccumulation factors indicated that Mn and Cr were not bioconcentrated in the vegetables (BCF < 1). On the other hand, Cd was hyperaccumulated in the vegetables (BCF >1), with the highest level of accumulation found in A. hybridus leaves from behind Mbarara Regional Referral Hospital. Taken together, the level of bioaccumulation of the TMTs followed the order Cd > Zn > Cu > Pb > Mn > Cr. Hyperaccumulation of Cd in leafy vegetables has been reported previously in leafy vegetables such as B. oleracea [59], Brassica campestris L., Brassica chinensis L. and Brassica juncea L. [60].

4.2. Human Health Risks Posed by the TMTs in Soils and Leafy Vegetables

Human health risk assessment indicated that there are no potential non-cancer health effects that could arise from ingestion, inhalation or dermal contact with soils. In the context of leafy vegetables consumption, it occurred that Cu posed no potential non-cancer risks. On the other hand, Zn, Pb, and Cr could only pose health risks in children. Manganese and Cd could pose health risks in both children and adults. Further, the individual cancer risk values for Cd were outside the safe limit of 10−6 to 10−4, suggesting that there are potential carcinogenic health effects. This suggested that Cd is the sole driver of carcinogenicity in the study area, and the effects may be exacerbated in individuals who consume more than one of the leafy vegetables. In our previous study, we unveiled that there were discernable non-carcinogenic as well as cancer risks associated with the consumption of B. oleracea by the local community around River Nyamwamba (the Kilembe mines) of Kasese District, Western Uganda [61]. Elsewhere, health risk assessment revealed that the consumption of vegetables grown from beside the Paira River of Bangladesh (including A. hybridus) could result in adverse non-carcinogenic and carcinogenic health risks to the consumers [56].

4.3. Pollution Level and Ecological Risk Assessment Indices

The computed contamination factors indicated that there is low contamination of the soils from River Rwizi banks regarding Mn, Pb, Cr and Cu (CFs < 1). With the exception of soils from the Kashanyarazi area, Zn also had low contamination at most of the sites. However, Cd had moderate contamination (1 CF < 3) based on the classification of Hakanson [46]. On the other hand, the Igeo values fell mainly in class 0, i.e., Igeo < 0, which, based on the criterion of Muller [47], alludes to practically uncontaminated soils. As with BCFs, Cd is the only metal with Igeo values ranging from class 1 (0 < Igeo < 1) for soils sampled from the Katete area to class 2 (1 < Igeo < 2) for soils sampled from areas below Bishop Stuart University. These corresponded to low-to-median contamination and median contamination. Nevertheless, the PLDI indicated no pollution of the sampled stretch of River Rwizi since none of the values was greater than 1.

4.4. Study Limitations

This study (i) did not measure the body weights and daily intakes for Ugandans; (ii) the ingested trace metal doses were considered to be equal to the absorbed doses; (iii) the probability variables used were from US EPA guidelines, which may not apply to this population; and (iv) did not involve the assessment of the specific species of the metal ions, which may imply either higher or lower toxicity. Moreover, (v) the carcinogenic health risks were estimated for Cd and Pb only because there is no established IGCSF for the other TMTs considered in this study; (vi) the IGCSF was considered as a constant for all individuals, but may reasonably vary between individuals; and (vii) the health risks were estimated considering the potential toxicity of the TMTs in the edible tissues of the leafy vegetables as well as exposure from soils, but these matrices may contain other contaminants from other possible exposure routes. Thus, the overall health risks may, in essence, be higher than we have found.

5. Conclusions

Leafy vegetables constitute an important part of a healthy and nutritionally balanced diet but could be harmful if they contain food pathogens or contaminants. Our study findings on leafy vegetables grown on the banks of River Rwizi indicated that, with the exception of Mn and Cr, the studied TMTs were bioaccumulated in the edible vegetable tissues. Considering potential health risks, chronic intake through ingestion, dermal contact and inhalation of the TMTs in soils from the banks of River Rwizi, there are no potential non-cancer and carcinogenic health effects that could be experienced. However, consumption of the leafy vegetables could likely pose both non-cancer and cancer health risks. This study therefore suggests that there is a need for pollution control measures to be instituted to mitigate pollution of River Rwizi. In this context, further studies are necessary to assess if these TMTs are occurring along with other environmental contaminants such as pesticides, per- and polyfluoroalkyl substances, antibiotic residues and microplastics.

Supplementary Materials

The following supporting information can be downloaded at: https://www.mdpi.com/article/10.3390/world5010008/s1, Table S1: Values of exposure factors used in health risk assessments due to TMTs in soils from banks of River Rwizi, Mbarara City, Uganda; Table S2: Classification values of pollution and risk indices used in study of TMTs in soils from banks of River Rwizi, Mbarara City, Uganda; Table S3: Pearson’s correlation (r) for the trace metals in soils and leafy vegetables grown along the stretch of River Rwizi in Mbarara City, Uganda; Table S4: Estimated daily intake, hazard quotients, and indices for intake of manganese in leafy vegetables from the banks of River Rwizi, Mbarara City, Uganda; Table S5: Estimated daily intake, hazard quotients, and indices for intake of zinc in leafy vegetables from the banks of River Rwizi, Mbarara City, Uganda; Table S6: Estimated daily intake through ingestion, hazard quotients, and indices for intake of cadmium in leafy vegetables from the banks of River Rwizi, Mbarara City, Uganda; Table S7: Estimated daily intake, hazard quotients, and indices for intake of lead in leafy vegetables from the banks of River Rwizi, Mbarara City, Uganda; Table S8: Estimated daily intake, hazard quotients, and indices for intake of chromium in leafy vegetables from the banks of River Rwizi, Mbarara City, Uganda; Table S9: Estimated daily intake, hazard quotients, and indices for intake of copper in leafy vegetables from the banks of River Rwizi, Mbarara City, Uganda; Table S10: Carcinogenic risk values for ingestion of cadmium and lead in soils sampled along the stretch of Rwizi River, Mbarara City, Uganda; Table S11: Carcinogenic risk values of cadmium and lead from consumption of leafy vegetables grown along the stretch of Rwizi River, Mbarara City, Uganda.

Author Contributions

Conceptualization, D.R.R., C.A. (Christopher Adaku) and E.N.; methodology, D.R.R., C.A. (Christopher Adaku), T.O. and E.N.; software, D.R.R. and T.O.; validation, C.A. (Christopher Adaku) and E.N.; formal analysis, D.R.R.; investigation, D.R.R.; resources, D.R.R.; data curation, T.O. and C.A. (Christopher Angiro); writing—original draft preparation, T.O. and C.A. (Christopher Angiro); writing—review and editing, C.A. (Christopher Adaku), T.O., C.A. (Christopher Angiro) and E.N.; visualization, T.O. and C.A. (Christopher Angiro); supervision, C.A. (Christopher Adaku) and E.N. All authors have read and agreed to the published version of the manuscript.

Funding

The article processing charge for this article was in part supported by Cranfield University through its Institutional Open Access Program (No. 2877470).

Institutional Review Board Statement

Not applicable.

Informed Consent Statement

Not applicable.

Data Availability Statement

Data supporting the conclusions of this study are available on request from the authors.

Conflicts of Interest

The authors declare no conflicts of interest.

References

  1. The World Bank. Urban Development. Available online: https://www.worldbank.org/en/topic/urbandevelopment/overview#:~:text=Globally%2C%20over%2050%25%20of%20the,housing%20their%20expanding%20populations%20need (accessed on 19 November 2023).
  2. Knorr, D.; Khoo, C.S.H.; Augustin, M.A. Food for an Urban Planet: Challenges and Research Opportunities. Front. Nutr. 2018, 4, 73. [Google Scholar] [CrossRef]
  3. Rudin-Rush, L.; Michler, J.D.; Josephson, A.; Bloem, J.R. Food insecurity during the first year of the COVID-19 pandemic in four African countries. Food Policy 2022, 111, 102306. [Google Scholar] [CrossRef]
  4. Kakaei, H.; Nourmoradi, H.; Bakhtiyari, S.; Jalilian, M.; Mirzaei, A. Effect of COVID-19 on food security, hunger, and food crisis. In COVID-19 and the Sustainable Development Goals; Elsevier: Amsterdam, The Netherlands, 2022; pp. 3–29. [Google Scholar]
  5. Khan, M.M.; Akram, M.T.; Janke, R.; Qadri, R.W.K.; Al-Sadi, A.M.; Farooque, A.A. Urban Horticulture for Food Secure Cities through and beyond COVID-19. Sustainability 2020, 12, 9592. [Google Scholar] [CrossRef]
  6. Denga, R.V.; Marambanyika, T.; Simwanda, M.; Vinya, R. Socio-economic determinants of participating in riverbank cultivation at the household level in the Upper Kafue River basin in Kitwe District, Zambia. Sci. Afric. 2023, 21, e01789. [Google Scholar] [CrossRef]
  7. Mawerere, S. Uganda: Farmers Grow Vegetables and Fruits While Protecting Wetlands. Available online: https://wire.farmradio.fm/farmer-stories/uganda-farmers-grow-vegetables-and-fruits-while-protecting-wetlands/ (accessed on 19 November 2023).
  8. Hu, N.W.; Yu, H.W.; Deng, B.L.; Hu, B.; Zhu, G.P.; Yang, X.T.; Wang, T.Y.; Zeng, Y.; Wang, Q.Y. Levels of heavy metal in soil and vegetable and associated health risk in peri-urban areas across China. Ecotoxicol. Environ. Saf. 2023, 259, 115037. [Google Scholar] [CrossRef] [PubMed]
  9. Mackay, H.; Tusabe, R.; Mugagga, F. Similar, yet different! Comparing Ugandan secondary cities’ food system and nutritional transformations to findings from African primary cities. Urban Transform. 2022, 4, 16. [Google Scholar] [CrossRef] [PubMed]
  10. Sabiiti, E.N.; Katongole, C.B. Role of Peri-Urban Areas in the Food System of Kampala, Uganda. In Balanced Urban Development: Options and Strategies for Liveable Cities; Maheshwari, B., Thoradeniya, B., Singh, V.P., Eds.; Water Science and Technology Library; Springer: Cham, Switzerland, 2016; Volume 72, pp. 387–392. [Google Scholar]
  11. Angiro, C.; Abila, P.P.; Omara, T. Effects of industrial effluents on the quality of water in Namanve stream, Kampala Industrial and Business Park, Uganda. BMC Res. Notes 2020, 13, 220. [Google Scholar] [CrossRef]
  12. Kyembabazi, L.; Ssemakula, E. The Effect Peri-Urban Farming on Food Security among Smallholder Farmers in Mbarara Municipality; Bishop Stuart University: Mbarara, Uganda, 2020; pp. 1–15. [Google Scholar]
  13. Nseka, D.; Opedes, H.; Mugagga, F.; Ayesiga, P.; Semakula, H.; Wasswa, H.; Ologe, D. Implications of Land Use and Cover Changes on Upper River Rwizi Macro-Watershed Health in South Western Uganda; IntechOpen: London, UK, 2022; pp. 1–22. [Google Scholar]
  14. Atwongyeire, D.; Ssekandi, J.; Tumwesigye, W.; Ndihiziwe, D.; Nagawa, G. Land Use Practices in the Rural and Urban Sub Catchments of River Rwizi, Western-Uganda; Their Effect on Its Ecological Characteristics. Int. J. Energy Environ. Sci. 2018, 3, 45–50. [Google Scholar]
  15. Kayamba, W.K.; Kwesiga, P. Ancient technology as mitigation to the 21st century problems: A case of coping with climate change in Ankole region, Western Uganda. Net. J. Soc. Sci. 2019, 7, 64–75. [Google Scholar] [CrossRef]
  16. Nshimiyimana, F.; Nhapi, I.; Wali, U.G.; Nsengimana, H.; Banadda, N.; Nansubuga, I.; Kansiime, F. Assessment of Heavy Metal Pollution in a Trans-Boundary River: The Case of the Akagera River. Int. J. Math. Comput. 2010, 9, 10. [Google Scholar]
  17. Wali, U.G.; Nhapi, I.; Ngombwa, A.; Banadda, N.; Nsengimana, H.; Kimwaga, R.J.; Nansubuga, I. Modelling of Nonpoint Source Pollution in Akagera Transboundary River in Rwanda. Open Environ. Eng. J. 2011, 4, 124–132. [Google Scholar] [CrossRef]
  18. Egor, M.; Mbabazi, J.; Ntale, M. Heavy metal and nutrient loading of River Rwizi by effluents from Mbarara Municipality, Western Uganda. Int. J. Chem. Mater. Environ. Res. 2014, 2, 36–47. [Google Scholar]
  19. Soanirina, M.; Bolender, J.; Asia, L.; Lebarillier, S.; Kiwanuka, C.; Doumenq, P. Assessment of polyaromatic hydrocarbons and heavy metals in the River Rwizi, Mbarara, Uganda. Abstr. Pap. Am. Chem. Soc. 2019, 258, 1155. [Google Scholar]
  20. Atwebembeire, J.; Bazira, J.; Kagoro, G.; Yatuha, J.; Andama, M.; Lejju, J.B. The physico-chemical quality of streams and channels draining into River Rwizi, South Western Uganda. East Afr. J. Sci. Technol. Innov. 2019, 1, 82–101. [Google Scholar] [CrossRef]
  21. Basooma, A.; Teunen, L.; Semwanga, N.; Bervoets, L. Trace metal concentrations in the abiotic and biotic components of River Rwizi ecosystem in western Uganda, and the risks to human health. Heliyon 2021, 7, e08327. [Google Scholar] [CrossRef]
  22. Nijeje, E.; Senyonjo, A.; Sahan, S.J.; Byamugisha, D.; Ntambi, E. Speciation of Selected Heavy Metals in Bottom Sediments of River Rwizi, Mbarara City, Uganda. Water Air Soil Pollut. 2023, 234, 193. [Google Scholar] [CrossRef]
  23. WHO. Exposure to Lead: A Major Public Health Concern, 2nd ed.; World Health Organization: Geneva, Switzerland, 2021; Available online: https://www.who.int/publications/i/item/9789240037656 (accessed on 6 September 2023).
  24. WHO. Lead in Drinking-Water: Health Risks, Monitoring and Corrective Actions. 2022. Available online: https://apps.who.int/iris/rest/bitstreams/1460455/retrieve (accessed on 5 September 2023).
  25. Kim, H.C.; Jang, T.W.; Chae, H.J.; Choi, W.J.; Ha, M.N.; Ye, B.J.; Kim, B.G.; Jeon, M.J.; Kim, S.Y.; Hong, Y.S. Evaluation and management of lead exposure. Ann. Occup. Environ. Med. 2015, 27, 30. [Google Scholar] [CrossRef]
  26. Eid, R.; Arab, N.T.; Greenwood, M.T. Iron mediated toxicity and programmed cell death: A review and a re-examination of existing paradigms. Biochim. Biophys. Acta Mol. Cell Res. 2017, 1864, 399–430. [Google Scholar] [CrossRef]
  27. Mugira, F.; McGinnis, A. Road River: The Story of a River Dried by Illegal Land Acquisitions. Available online: https://earthjournalism.net/stories/road-river-the-story-of-a-river-dried-by-illegal-land-acquisitions (accessed on 20 December 2023).
  28. GOU. River Rwizi. Mbarara District Local Government. Available online: https://web.archive.org/web/20140803221711/http://mbarara.go.ug/Rivers.html (accessed on 11 November 2023).
  29. Songa, P.; Rumohr, J.; Musota, R. A shared water risk assessment for a vulnerable river basin: River Rwizi in Uganda. In WIT Transactions on Ecology and the Environment; WIT Press: Southampton, UK, 2015; Volume 197, pp. 213–224. [Google Scholar]
  30. Onyutha, C.; Nyesigire, R.; Nakagiri, A. Contributions of Human Activities and Climatic Variability to Changes in River Rwizi Flows in Uganda, East Africa. Hydrology 2021, 8, 145. [Google Scholar] [CrossRef]
  31. Atwebembeire, J.; Andama, M.; Yatuha, J.; Lejju, J.B.; Rugunda, G.K.; Bazira, J. The Physico-Chemical Quality of Effluents of Selected Sewage Treatment Plants Draining into River Rwizi, Mbarara Municipality, Uganda. J. Water Resour. Prot. 2019, 11, 20–36. [Google Scholar] [CrossRef]
  32. E and J Tourism Consultants. Rwizi River. Available online: https://www.insidelakemburonationalpark.com/rwizi-river.html (accessed on 11 November 2023).
  33. Nuwamanya, E.; Byamugisha, D.; Nakiguli, C.K.; Angiro, C.; Khanakwa, A.V.; Omara, T.; Ocakacon, S.; Onen, P.; Omoding, D.; Opio, B.; et al. Exposure and Health Risks Posed by Potentially Toxic Elements in Soils of Metal Fabrication Workshops in Mbarara City, Uganda. J. Xenobiot. 2024, 14, 176–192. [Google Scholar] [CrossRef]
  34. Nyangena, D.M.; Arasa, J.; Omara, T. Occurrence of priority trace metals in tomatoes (Solanum lycopersicum L.) from some areas of Uasin Gishu County, Kenya. Fr.-Uk. J. Chem. 2020, 8, 83–92. [Google Scholar]
  35. Huang, X.; Luo, D.; Zhao, D.; Li, N.; Xiao, T.; Liu, J.; Wei, L.; Liu, Y.; Liu, L.; Liu, G. Distribution, source and risk assessment of heavy metal(oid)s in water, sediments, and Corbicula Fluminea of Xijiang River, China. Int. J. Environ. Res. Public Health 2019, 16, 1823. [Google Scholar] [CrossRef] [PubMed]
  36. Usman, K.; Al-Ghouti, M.A.; Abu-Dieyeh, M.H. The assessment of cadmium, chromium, copper, and nickel tolerance and bioaccumulation by shrub plant Tetraena qataranse. Sci. Rep. 2019, 9, 5658. [Google Scholar] [CrossRef] [PubMed]
  37. US EPA. Risk Assessment Guidance for Superfund, Vol. I: Human Health Evaluation Manual (EPA/540/1–89/002); Office of Solid Waste and Emergency Response: Washington, DC, USA, 1989. [Google Scholar]
  38. Omara, T.; Karungi, S.; Kalukusu, R.; Nakabuye, B.; Kagoya, S.; Musau, B. Mercuric pollution of surface water, superficial sediments, Nile tilapia (Oreochromis nilotica Linnaeus 1758 [Cichlidae]) and yams (Dioscorea alata) in auriferous areas of Namukombe stream, Syanyonja, Busia, Uganda. PeerJ 2019, 7, e7919. [Google Scholar] [CrossRef] [PubMed]
  39. US EPA. IRIS, Environmental Protection Agency Region I. Washington DC. 20460. Available online: https://cfpub.epa.gov/ncea/iris2/chemicalLanding.cfm?substance_nmbr=422 (accessed on 19 December 2023).
  40. Ajeh, E.A.; Modi, F.J.; Omoregi, I.P. Health risk estimations and geospatial mapping of trace metals in soil samples around automobile mechanic workshops in Benin city, Nigeria. Toxicol. Rep. 2022, 9, 575–587. [Google Scholar] [CrossRef] [PubMed]
  41. Ordonez, A.; Alvarez, R.; Charlesworth, S.; De Miguel, E.; Loredo, J. Risk assessment of soils contaminated by mercury mining, Northern Spain. J. Environ. Monit. 2011, 13, 128. [Google Scholar] [CrossRef] [PubMed]
  42. US EPA. Recommended Use of BW3/4 as the Default Method in Derivation of the Oral Reference Dose. EPA/100/R11/001. Office of the Science Advisor. 2011. Available online: https://www.epa.gov/sites/default/files/2013-09/documents/recommended-use-of-bw34.pdf (accessed on 19 December 2023).
  43. US EPA. Risk-Based Concentration Table. United States Environmental Protection Agency. 2010. Available online: http://www.epa.gov/reg3hwmd/risk/human/index.htm (accessed on 19 December 2023).
  44. Ferreira-Baptista, L.; De Miguel, E. Geochemistry and risk assessment of street dust in Luanda, Angola: A tropical urban environment. Atmos. Environ. 2005, 39, 4501–4512. [Google Scholar] [CrossRef]
  45. Ministry of Health. National Guidelines for Management of Common Conditions. Uganda Clinical Guidelines 2023. Available online: https://www.differentiatedservicedelivery.org/wp-content/uploads/UCG-2023-Publication-Final-PDF-Version-1.pdf (accessed on 11 March 2024).
  46. Hakanson, L. An ecological risk index for aquatic pollution control. A sedimentological approach. Water Res. 1980, 14, 975–1001. [Google Scholar] [CrossRef]
  47. Müller, G. Die Schwermetallbelastung der Sedimenten des Neckars und Seiner Nebenflüsse. Chemiker-Zeitung 1981, 6, 157–164. [Google Scholar]
  48. Kabata-Pendias, A. Trace elements in soils and plants. In Trace Elements in Soils and Plants; Kabata-Pendias, A., Pendias, H.K., Eds.; Taylor and Francis: Oxfordshire, UK, 2011; Volume 548, p. 2010. [Google Scholar]
  49. Mondal, S.; Singh, G. Pollution evaluation, human health effect and tracing source of trace elements on road dust of Dhanbad, a highly polluted industrial coal belt of India. Environ. Geochem. Health 2021, 43, 2081–2103. [Google Scholar] [CrossRef]
  50. Denneman, C.A.J.; Robberse, J.G. Ecotoxicological Risk Assessment as a Base for Development of Soil Quality Criteria. In Contaminated Soil’90; Springer: Dordrecht, The Netherlands, 1990; pp. 157–164. [Google Scholar]
  51. Xiao, X.; Zhang, J.; Wang, H.; Han, X.; Ma, J.; Ma, Y.; Luan, H. Distribution and health risk assessment of potentially toxic elements in soils around coal industrial areas: A global meta-analysis. Sci. Total Environ. 2020, 713, 135292. [Google Scholar] [CrossRef] [PubMed]
  52. Monjardin, C.E.F.S.; Senoro, D.B.; Magbanlac, J.J.M.; de Jesus, K.L.M.; Tabelin, C.B.; Natal, P.M. Geo-Accumulation Index of Manganese in Soils Due to Flooding in Boac and Mogpog Rivers, Marinduque, Philippines with Mining Disaster Exposure. Appl. Sci. 2022, 12, 3527. [Google Scholar] [CrossRef]
  53. FAO/WHO. General Standard for Contaminants and Toxins in Food and Feed. CXS 193-1995, Adopted in 1995. Revised in 1997, 2006, 2008, 2009. Amended in 2010, 2012, 2013, 2014, 2015, 2016, 2017, 2018, 2019, 2021, 2022. Available online: https://www.fao.org/fao-who-codexalimentarius/sh-proxy/en/?lnk=1&url=https%253A%252F%252Fworkspace.fao.org%252Fsites%252Fcodex%252FStandards%252FCXS%2B193-1995%252FCXS_193e.pdf (accessed on 20 December 2023).
  54. FAO/WHO. Joint FAO/WHO Food Standards Programme Codex Committee on Contaminants in Foods, Food CF/5 INF/1. Fifth Session. The Hague, The Netherlands. Available online: https://www.fao.org/input/download/report/758/REP11_CFe.pdf (accessed on 20 December 2023).
  55. Liu, W.; Li, X.; Li, H.H.; Wang, Y.W. Heavy metal accumulation of edible vegetables cultivated in agricultural soil in the Suburb of Zhengzhou City, People’s Republic of China. Bull. Environ. Contam. Toxicol. 2006, 76, 163–170. [Google Scholar]
  56. Islam, M.S.; Ahmed, M.K.; Habibullah-Al-Mamun, M. Metal speciation in soil and health risk due to vegetables consumption in Bangladesh. Environ. Monit. Assess. 2015, 187, 288. [Google Scholar] [CrossRef]
  57. Rehman, Z.U.; Khan, S.; Qin, K.; Brusseau, M.L.; Shah, M.T.; Din, I. Quantification of inorganic arsenic exposure and cancer risk via consumption of vegetables in southern selected districts of Pakistan. Sci. Total Environ. 2016, 550, 321–329. [Google Scholar] [CrossRef]
  58. Nazzal, Y.; Ghrefat, H.; Rosen, M.A. Heavy Metal Contamination of Roadside Dusts: A Case Study for Selected Highways of the Greater Toronto Area, Canada Involving Multivariate Geostatistics. Res. J. Environ. Sci. 2014, 8, 259–273. [Google Scholar] [CrossRef]
  59. Mawari, G.; Kumar, N.; Sarkar, S.; Daga, M.K.; Singh, M.M.; Joshi, T.K.; Khan, N.A. Heavy Metal Accumulation in Fruits and Vegetables and Human Health Risk Assessment: Findings From Maharashtra, India. Environ. Health Insights 2022, 16, 11786302221119151. [Google Scholar] [CrossRef]
  60. Xiao, Q.; Wang, S.; Chi, Y. Accumulation and Chemical Forms of Cadmium in Tissues of Different Vegetable Crops. Agronomy 2023, 680, 13. [Google Scholar] [CrossRef]
  61. Masereka, J.; Byamugisha, D.; Adaku, C. Heavy Metal Accumulation in Vegetables Grown in Rock Soils of Kilembe Copper Mine, Kasese, Western Uganda. Asian J. Appl. Chem. Res. 2022, 12, 30–40. [Google Scholar] [CrossRef]
Figure 1. Map of Mbarara City showing the location of River Rwizi, Uganda. Adapted from Onyutha et al. [30].
World 05 00008 g001
Figure 2. Leaves of vegetables sampled from the banks of River Rwizi in Mbarara City, Uganda: (a) Brassica oleracea var. capitata, (b) Spinacia oleracea L., (c) Cucurbita pepo L., (d) Solanum nigrum L., and (e) Amaranthus hybridus L.
World 05 00008 g002
Figure 3. Mean concentrations of trace metals in soils sampled along the stretch of Rwizi River in Mbarara City, Uganda. The concentration for Cd is × 10−2 mg kg−1.
World 05 00008 g003
Figure 4. Mean concentrations of trace metals in edible vegetable tissues sampled along the stretch of Rwizi River, Mbarara City, Uganda: (a) manganese, (b) zinc, (c) cadmium (d) lead, (e) chromium and (f) copper. Indicates statistically different means at p < 0.05 as per Tukey post hoc test. Mean values are indicated with (+).
World 05 00008 g004
Figure 5. Pearson’s bivariate correlation coefficient matrix plot for the trace metals in soils from the sampled from the banks of Rwizi River, Mbarara City, Uganda. * Significant at the 0.05 level (2−tailed).
World 05 00008 g005
Figure 6. Biplot loading of the principal components for the six TMTs in soils from the banks of Rwizi River, Mbarara City, Uganda.
World 05 00008 g006
Figure 7. Carcinogenic risk values for ingestion of cadmium and lead in soils sampled along the stretch of River Rwizi, Mbarara City, Uganda: (a) children and (b) adults.
World 05 00008 g007
Figure 8. Box-and-whisker plot of the carcinogenic health risks from consumption of the leafy vegetables: (a) cadmium in children, (b) cadmium in adults, (c) lead in children, and (d) lead in adults. Boxes represent minimum to maximum cancer risk values.
World 05 00008 g008
Table 1. Major anthropogenic activities justifying the choice of the sampling sites along the stretch of River Rwizi in Mbarara City, Uganda.
Sampling Site (Code)Major Suspected Pollution Sources
Kashanyarazi area (A)Milling factory, milk processing factory, hostel
Behind Mbarara Regional Referral Hospital (B)Mbarara Hospital, University
Katete area (C)Sewage lagoons (wastewater irrigation)
Rugazi bridge area (D)Garages
Area below Bishop Stuart University (E)Bishop Stuart University
Table 2. Bioconcentration factors of the trace metals in the leafy vegetables along River Rwizi, Mbarara City, Uganda.
Trace MetalSampling SiteB. oleraceaC. pepoS. oleraceaS. nigrumA. hybridus
Manganese A0.360.130.350.010.12
B0.380.310.220.280.48
C0.180.120.200.200.17
D0.270.110.390.130.50
E0.320.120.340.130.37
ZincA1.080.921.940.820.72
B2.012.011.491.652.42
C0.490.950.770.831.03
D1.512.493.041.963.01
E2.473.314.762.403.20
CadmiumA7.296.257.146.435.54
B6.963.213.575.3910.71
C5.384.624.423.654.42
D5.183.574.643.073.39
E3.481.933.361.902.14
LeadA0.440.440.480.650.50
B0.370.470.370.400.48
C0.430.400.290.300.41
D1.271.130.940.531.25
E2.211.501.650.270.60
ChromiumA0.070.060.060.060.06
B0.030.030.030.030.02
C0.040.040.040.040.04
D0.100.090.090.100.10
E0.130.090.120.100.14
CopperA0.901.370.884.120.58
B0.510.410.390.800.57
C0.060.310.270.230.19
D0.812.341.771.171.85
E1.432.892.431.082.23
Values in bold are greater than 1.0, suggesting that the vegetable in question is a hyperaccumulator of the trace metal. The sampling sites A to E are the Kashanyarazi area, behind Mbarara Regional Referral Hospital, the Katete area, the Rugazi bridge area, and the area below Bishop Stuart University, respectively.
Table 3. Chronic daily intake through the inhalation of TMTs in soils from the banks of River Rwizi, Mbarara City, Uganda.
Age GroupSampling SiteAverage Chronic Daily Intake (×10−6 mg kg−1 day−1)Hazard Quotient (×10−6)Hazard Index
MnZnCdPbCrCuMnZnCdPbCrCu
ChildrenA3.630.6300.000270.0100.0980.08925,384.62.10.272.93426.62.20.02881867
B3.230.3300.000270.0120.2430.144225,874.11.10.273.48496.53.60.23437897
C2.440.5100.000250.0160.2050.342170,629.41.70.254.67167.88.50.17781225
D2.370.1900.000270.0060.0760.038165,734.30.60.271.72657.30.90.16839507
E2.000.1200.000410.0030.0580.027139,860.10.40.410.92028.00.70.14189051
AdultsA0.4540.0790.0000340.00130.0120.01131,748.30.30.0340.44195.80.30.03594513
B0.4040.0410.0000340.00150.0300.01828,251.70.10.0340.41049.00.40.02930163
C0.3050.0640.0000340.00200.0260.04321,328.670.20.0340.6909.11.10.22239704
D0.2960.0240.0000310.00070.0090.0056883.70.080.0310.2314.70.10.00719881
E0.2500.0150.0000340.00040.0070.00317,482.50.050.0340.1244.80.10.01772758
Inhalation reference dose, RfDINH (mg kg−1)0.00001430.3000.0010.00350.00002860.0402
Note: Kashanyarazi area (A), behind Mbarara Regional Hospital (B), Katete area (C), Rugazi Bridge area (D) and below Bishop Stuart University (E).
Table 4. Average hazard quotients and indices for chronic intake through incidental ingestion of TMTs in soils from the banks of River Rwizi, Mbarara City, Uganda.
Age GroupSampling Site Average Chronic Daily Intake (×10−5 mg kg−1 day−1)Hazard Quotient (×10−5)Hazard Index
MnZnCdPbCrCuMnZnCdPbCrCu
ChildrenA477.9583.150.38132.9612.9511.6910,390.21277.1738.0037,988.5712,950.00290.800.6193475
B424.9242.980.36155.3432.0419.009237.39143.2736.0044,382.8632,040.00472.640.8631216
C321.4767.210.36214.7927.0545.106988.48224.0336.0061,368.5727,050.001121.890.9678897
D312.2625.510.3375.699.995.006788.2685.0333.0021,625.719990.00124.380.3864638
E262.8616.260.3644.247.623.605714.3554.2036.0012,640.007620.0089.550.261541
AdultsA59.7510.400.050.170.161.501298.9134.675.0048.57160.0037.310.015845
B53.125.400.040.190.402.401154.7818.004.0054.29400.0059.700.016908
C40.198.400.040.270.345.60873.7028.004.0077.14340.00139.300.014621
D39.033.200.040.090.126.00848.4810.674.0025.71120.00149.250.011581
E32.862.000.040.060.105.00714.356.674.0017.14100.00124.380.009665
Oral (direct ingestion) reference dose, RfDING (mg kg−1)0.04600.3000.0100.00350.0010.0402
Note: Kashanyarazi area (A), behind Mbarara Regional Hospital (B), Katete area (C), Rugazi Bridge area (D) and below Bishop Stuart University (E).
Table 5. Chronic daily intake through dermal contact, hazard quotients, and indices for chronic intake through dermal contact of TMTs in soils from the banks of River Rwizi, Mbarara City, Uganda.
Age GroupSampling SiteAverage Chronic Daily Intake (×10−6 mg kg−1 day−1)Hazard Quotient (×10−6)Hazard Index
MnZnCdPbCrCuMnZnCdPbCrCu
ChildrenA13.38312.32840.01070.66310.03630.3272290.93738.8066710.700126.3056050.00027.2670.06544
B11.89821.20360.01000.04350.08970.5313258.65720.060010.00082.85714,950.00044.2750.015366
C9.00131.88200.01000.060140.07581.2626195.68031.3666710.000114.55212,633.333105.2170.013090
D8.74350.71420.00930.021190.02800.1407190.07611.9033339.30040.3624666.66711.7250.004930
E7.36030.45540.01000.012390.02130.1013160.0077.5900010.00023.6003550.0008.4420.003759
AdultsA23.83874.14740.01910.066320.06460.5828518.23369.1233319.100126.32410,766.66748.5670.115480
B21.19362.14380.01790.077480.15980.9463460.730435.730017.900147.58126,633.33378.8580.027374
C16.03363.35220.01790.107130.13492.2491348.55755.8700017.900204.05722,483.333187.4250.023297
D15.57451.27220.01660.037750.04980.2506338.57621.2033316.60071.9058300.000020.8830.008769
E13.11050.81110.01790.022060.03800.1805285.01113.5183317.90042.0196333.33315.0420.006706
Dermal reference dose, RfDING (mg kg−1)0.04600.0600.0010.0005250.0000060.012
Note: Kashanyarazi area (A), behind Mbarara Regional Hospital (B), Katete area (C), Rugazi Bridge area (D) and below Bishop Stuart University (E).
Table 6. Geoaccumulation indices for trace metals in soils from the banks of River Rwizi, Uganda.
Sampling Site MnZnCdPbCrCuPLDI
CFsIgeoCFsIgeoCFsIgeoCFsIgeoCFsIgeoCFsIgeo
A0.54−1.4801.02−0.5622.150.5230.52−1.5200.25−2.5910.23−2.6740.575
B0.48−1.6500.53−1.5142.150.5230.61−1.2950.62−1.2840.38−1.9750.653
C0.36−2.0520.82−0.8692.000.4150.85−0.8280.52−1.5280.91−0.7260.787
D0.35−2.0940.31−2.2672.150.5220.30−2.3330.19−2.9660.10−3.8920.333
E0.30−2.3430.20−2.9163.231.1070.17−3.1070.15−3.3560.07−4.3660.266
Note: Kashanyarazi area (A), behind Mbarara Regional Hospital (B), Katete area (C), Rugazi Bridge area (D) and below Bishop Stuart University (E). PLDI = pollution load index.
Table 7. Ecological risks posed by the TMTs in soils from the banks of River Rwizi, Mbarara City, Uganda.
Sampling Site Ecological   Risk   ( E R i ) PERIContamination Level (PERI)
MnZnCdPbCrCu
A0.541.0264.52.600.501.1570.31Low
B0.480.5364.53.051.241.9071.70Low
C0.360.8260.04.251.044.5571.02Low
D0.350.3164.51.500.380.5067.54Low
E0.300.2096.90.850.300.3598.90Moderate
Note: Kashanyarazi area (A), behind Mbarara Regional Hospital (B), Katete area (C), Rugazi Bridge area (D) and below Bishop Stuart University (E).
Disclaimer/Publisher’s Note: The statements, opinions and data contained in all publications are solely those of the individual author(s) and contributor(s) and not of MDPI and/or the editor(s). MDPI and/or the editor(s) disclaim responsibility for any injury to people or property resulting from any ideas, methods, instructions or products referred to in the content.

