Article

Demographic Delusions: World Population Growth Is Exceeding Most Projections and Jeopardising Scenarios for Sustainable Futures

by
Jane N. O’Sullivan
School of Agriculture and Food Sciences, The University of Queensland, St. Lucia, QLD 4072, Australia
World 2023, 4(3), 545-568; https://doi.org/10.3390/world4030034
Submission received: 21 July 2023 / Revised: 4 September 2023 / Accepted: 5 September 2023 / Published: 6 September 2023

Abstract

:
The size of the world’s population has profound implications for demand for food, energy and resources, land use change and greenhouse gas emissions. This study examines why most population projections have underestimated world population growth, and the implications for actions required to achieve sustainable societies. The main determinant of future population is family size choices. Population projections by different research groups embed different assumptions about drivers of fertility decline. The common assumptions that fertility decline is driven by economic betterment, urbanisation or education levels are not well supported in historical evidence. In contrast, voluntary family planning provision and promotion achieved rapid fertility decline, even in poor, rural and illiterate communities. Projections based on education and income as drivers of fertility decline ignore the reverse causation, that lowering fertility through family planning interventions enabled economic advancement and improved women’s education access. In recent decades, support for family planning has waned, and global fertility decline has decelerated as a result. Projections calibrated across the decades of strong family planning support have not acknowledged this change and are consequently underestimating global population growth. Scenarios used to model sustainable futures have used overly optimistic population projections while inferring these outcomes will happen without targeted measures to bring them about. Unless political will is rapidly restored for voluntary family planning programs, the global population will almost certainly exceed 10 billion, rendering sustainable food security and a safe climate unachievable.

1. Introduction

When U.S. climate envoy John Kerry recently voiced his opinion that a global population of 10 billion would be unsustainable, it was treated as highly controversial in the media [1]. Nevertheless, his assessment aligns with a number of well-grounded scientific reports, discussed below. The controversy reflects a reluctance to see population growth as problematic—a reluctance that has only deepened as evidence mounts that human impacts on Earth systems are exceeding planetary limits.
Although studies mapping out sustainable futures depend on population projections, population is usually treated as background context, not considering either the implications of the projections being inaccurate or the potential for interventions to change population outcomes. This paper argues that population complacency is jeopardising the possibility of avoiding calamitous levels of climate change and hunger.
Humanity’s impact on the environment is a product of the number of humans, their lifestyles, and the combination of technologies, institutions, cultural and individual values, attitudes and behaviours that determine how those lifestyles are achieved. This three-factor relationship is often represented in Ehrlich and Holdren’s famous IPAT equation: Impact = Population × Affluence × Technology (in which “Affluence” corresponds to lifestyles, and “Technology” covers all of the determinants of how lifestyles are achieved) [2]. Similarly, the Global Footprint Network assesses human impacts on the biosphere as a product of population and per capita consumption of items derived from photosynthesis (including fossil fuels), and compares this with the total biocapacity of land [3].
However, environmental impacts can only poorly be represented by any aggregate measure, whether IPAT’s invoked variable “I” or Global Footprint Network’s “global hectares”. Liebig’s Law of the Minimum teaches us that all aggregate measures deceive [4]. Just as a plant’s deficiency of potassium cannot be compensated for by a surfeit of nitrogen, an ecosystem’s loss of pollinators cannot be negated by an improvement in water supply. An intolerable deficiency or excess of only one factor is all that is needed to bring the whole system down, whether that system is an organism, an ecosystem, a machine or a civilisation. In humanity’s case, the depletion of groundwater in the world’s major breadbasket regions could be the stumbling block, no matter how successfully we decarbonise energy or clean up pollution [5].
The concept of nine biophysical “planetary boundaries”, introduced by Röckstrom et al. (2009), goes some way toward disaggregating these non-fungible impacts [6]. Raworth (2018) married this idea with the equally non-fungible basic needs of humans, in the notion of “doughnut economics” [7]. This model poses a “floor” defined by the minimum resource requirements to meet the basic needs of all people, and a “ceiling” defined by the maximum sustainable impacts on each of the planetary boundaries, leaving a Goldilocks zone in between (the doughnut) defining a “safe and just space” for humanity (Figure 1).
These useful conceptual models give us plenty of fronts on which to focus sustainability efforts, but can distract attention from the human population as a fundamental multiplier of impact. The inference of doughnut economics is that ecological limits are only breached by luxury consumption, well above basic needs. However, if there are so many people that even meeting their basic needs exceeds environmental tolerances, there is no “safe and just space” for humanity. This is evidently the situation in many locations where people are impoverished by resource scarcity, but is also arguably the case for the entire planet [10], at least until we find better ways to meet our needs.
This paper reviews the treatment of human population size in scenarios for sustainable futures, and critiques the projections on which they are based. It reveals that overly optimistic projections are masking recalcitrant population growth that heightens risks of making sustainable futures unachievable.

2. The Treatment of Population in Future Scenarios

Much has been written on the threat climate change poses to food and water security, but the role of population growth, and the potential to influence future population growth, often goes unmentioned [11,12], even when the focus is on reducing food demand [13,14]. Indeed, the population taboo is evident in the disappearance of population as a focus in food security literature, from a central theme half a century ago to relatively rare today [15].
The relatively few studies that compare outcomes of differing population projections illustrate their profound impact on outcomes. O’Neill et al. (2010) estimated the difference in projected greenhouse gas emissions between scenarios assuming the UN’s medium population projection and those assuming the low projection, taking account of country-specific emissions profiles and impacts of changing age structure, household size and urbanization. They concluded that achieving the low population projection could provide 16–29% of the emissions reductions needed by 2050, and could reduce energy demand by 37–41% by the end of the century [16]. Bajželj et al. (2014) found that greenhouse gas emissions from the food system were sensitive to population outcomes by a factor of 1.9, meaning that a 10% higher population would result in 19% more emissions from the food system, assuming the same wealth and dietary preferences [14]. The World Resources Institute’s study Creating a Sustainable Food Future found that achieving replacement level fertility (around 2.1 children per woman) in sub-Saharan Africa by 2050 would spare an area of forest and savannah larger than Germany from conversion to cropland, and in doing so save 16 Gt of carbon dioxide emissions [17]. Moreland and Smith (2012) found that a modest acceleration in contraceptive uptake in Ethiopia could completely compensate for the anticipated impacts of climate change on food security in 2050 [18].
The regions most vulnerable to critical shortages of food and water tend to be those with high population densities and growth rates. In these regions, population growth is a much greater driver of water and food insufficiency than climate change. Modelling by Molotoks et al. (2020) found, “Although climate change scenarios had an effect on future crop yields, population growth appeared to be the dominant driver of change in undernourishment prevalence [by 2050]” [19]. Similarly, Gunasekara and co-workers (2013) concluded that small reductions in population growth could have large effects on the numbers of people exposed to acute water stress [20]. Carter and Parker (2009) evaluated threats to groundwater access in Africa, concluding, “The climate change impacts [on groundwater] are likely to be significant, though uncertain in direction and magnitude, while the direct and indirect impacts of demographic change on both water resources and water demand are not only known with far greater certainty, but are also likely to be much larger. The combined effects of urban population growth, rising food demands and energy costs, and consequent demand for fresh water represent real cause for alarm, and these dwarf the likely impacts of climate change on groundwater resources, at least over the first half of the 21st century” [21], p. 676. Food and water scarcity are common triggers of violent unrest [22].
There is no doubt that the current food system is over-reaching several planetary boundaries for sustainable impacts [23]. A study commissioned by The Lancet found current production and consumption patterns could sustainably provide a balanced diet for only 3.4 billion people [24,25]. They concluded that global food systems could provide healthy diets for up to 10 billion people by 2050 and remain within environmental boundaries, but it would take a global transformation of production systems, while reducing food loss and waste by half and red meat consumption to about a third of current levels globally—all formidable challenges with a low likelihood of achievement. At above a population of 10 billion, even their highly optimistic measures would be insufficient.
If feeding 10 billion people sustainably is infeasible, it seems equally infeasible to limit global warming to below 2 °C in the presence of 10 billion people. This is a conclusion drawn from a major study exploring the range of climate change mitigation outcomes achievable under each of five “shared socioeconomic pathways” (SSPs) [26]. The SSPs are a set of narratives describing alternative socio-economic trajectories for global development, and posing different challenges for both mitigation of and adaptation to global warming. They serve to provide consistent baselines for comparing alternative models [27]. Each SSP incorporates one of three population projections: a standard run used in SSP2 and SSP4, a lower version in the more optimistic SSP1 and SSP5, and a high projection used in SSP3. These projections will be discussed in more detail below. For now, we note that in SSP2 (the “middle of the road” scenario, assuming business-as-usual), the world population peaks below 10 billion, while in SSP3, it surpasses 10 billion before 2050 and heads towards 14 billion by the end of the century. Riahi and co-workers used six different “integrated assessment models” (IAMs) to test the range of outcomes possible through mitigation actions under each SSP. They observed, “As a matter of fact reaching the lowest target of 2.6 W/m2 from an SSP3 baseline was found infeasible across all IAM models” [26], p. 164. This target roughly corresponds with 2 °C of warming, according to the IPCC [28]. This outcome was not due to profligate use of energy or luxury consumption: SSP3 is by far the poorest, least industrialised of the pathways. The main problem was the infeasibility of reversing deforestation, due to increasing population pressure and demand for food. Agricultural expansion is the largest driver of deforestation [29], and forest loss correlates closely with the increase in rural populations [30].
The IPCC’s most recent mitigation report acknowledged this finding, stating “high levels of global population growth … may render modelled pathways that limit warming to 2 °C (>67%) or lower infeasible” [28], p. 22. However, the lack of further discussion infers that the risk of this happening is low. To assess this risk, we must look in detail at the projections on which these analyses rely.

3. The United Nations Projections

The Population Division of the United Nations Department of Economic and Social Affairs (UNDESA) has been collating global demographic data and publishing projections since 1952 [31]. The UN projections are the most commonly cited. The projections are revised every two to three years and published under the title World Population Prospects (WPP) [32].
Like most research groups, the UN uses a cohort component model, taking account of the numbers of people in each age group, and their probability of dying or having a live birth, for each country or region. The art of projection lies in how changes in age-specific fertility or mortality are anticipated. It is important to realise that past estimates are also modelled to fill the gaps between infrequent and incomplete information from censuses and the “demographic and health surveys” (DHS) undertaken intermittently in many less-developed countries with the help of the UN. Numbers estimated for the recent past, in particular, have considerable uncertainty, and change from one revision to the next.
The UN publishes a range of projections, but its ‘medium fertility’ model represents its view of the most likely future. Its probabilistic projections (Figure 2), first introduced in 2012, vary parameters in the model according to a statistical distribution for each country separately, to build a picture of the likely variability [33]. As they are statistically symmetrical around the medium-fertility projection, this then becomes the ‘median’ (that for which higher or lower outcomes are equally likely). The ‘high fertility’ and ‘low fertility’ projections are not realistic scenarios: they merely add or subtract half a child per woman from the fertility of every country, compared with the medium variant. This is what is known as a sensitivity analysis, posing the hypothetical, “How much difference would half a child per woman make?” Thus, they do not show what would happen if fertility fell slower or faster in high-fertility countries, but only what would happen if we were mistaken about current fertility and it was really half a child higher or lower everywhere (including low-fertility countries), but changed in the future exactly in parallel with the medium fertility model (in practice, the higher or lower fertility is ramped in over a decade or so, but this change is hardly more realistic than an instant shift).
On release of the 2012 revision, director of the UN’s Population Division, John Wilmoth, noted that recent fertility falls had been smaller than expected, but the projections continue to be on the same basis as before. He concluded, “The medium-variant projection is thus an expression of what should be possible … [it] could require additional substantial efforts to make it possible.” (Emphasis in the original) [35], p. 1.
This statement is the last time I have seen the UN Population Division or UNFPA state or infer that the medium fertility projection is anything other than business-as-usual. Only a year later, the Population Division team described the medium projection as the most likely “based on an implicit assumption of a continuation of existing policies” [36], p. 2. It could be argued that the probabilistic projections brought a more fatalistic outlook, with the language of chance displacing the language of choices. The UNFPA embodies this shift. Established in 1968 as the United Nations Fund for Population Activities, it now prefers to be known as “the United Nations sexual and reproductive health agency.” Instead of calling for “additional substantial efforts”, more recent statements from the UNFPA have denounced any concern about population growth as “alarmist” and even claimed that past efforts aimed at lowering fertility were “ineffective and even dangerous” [37].

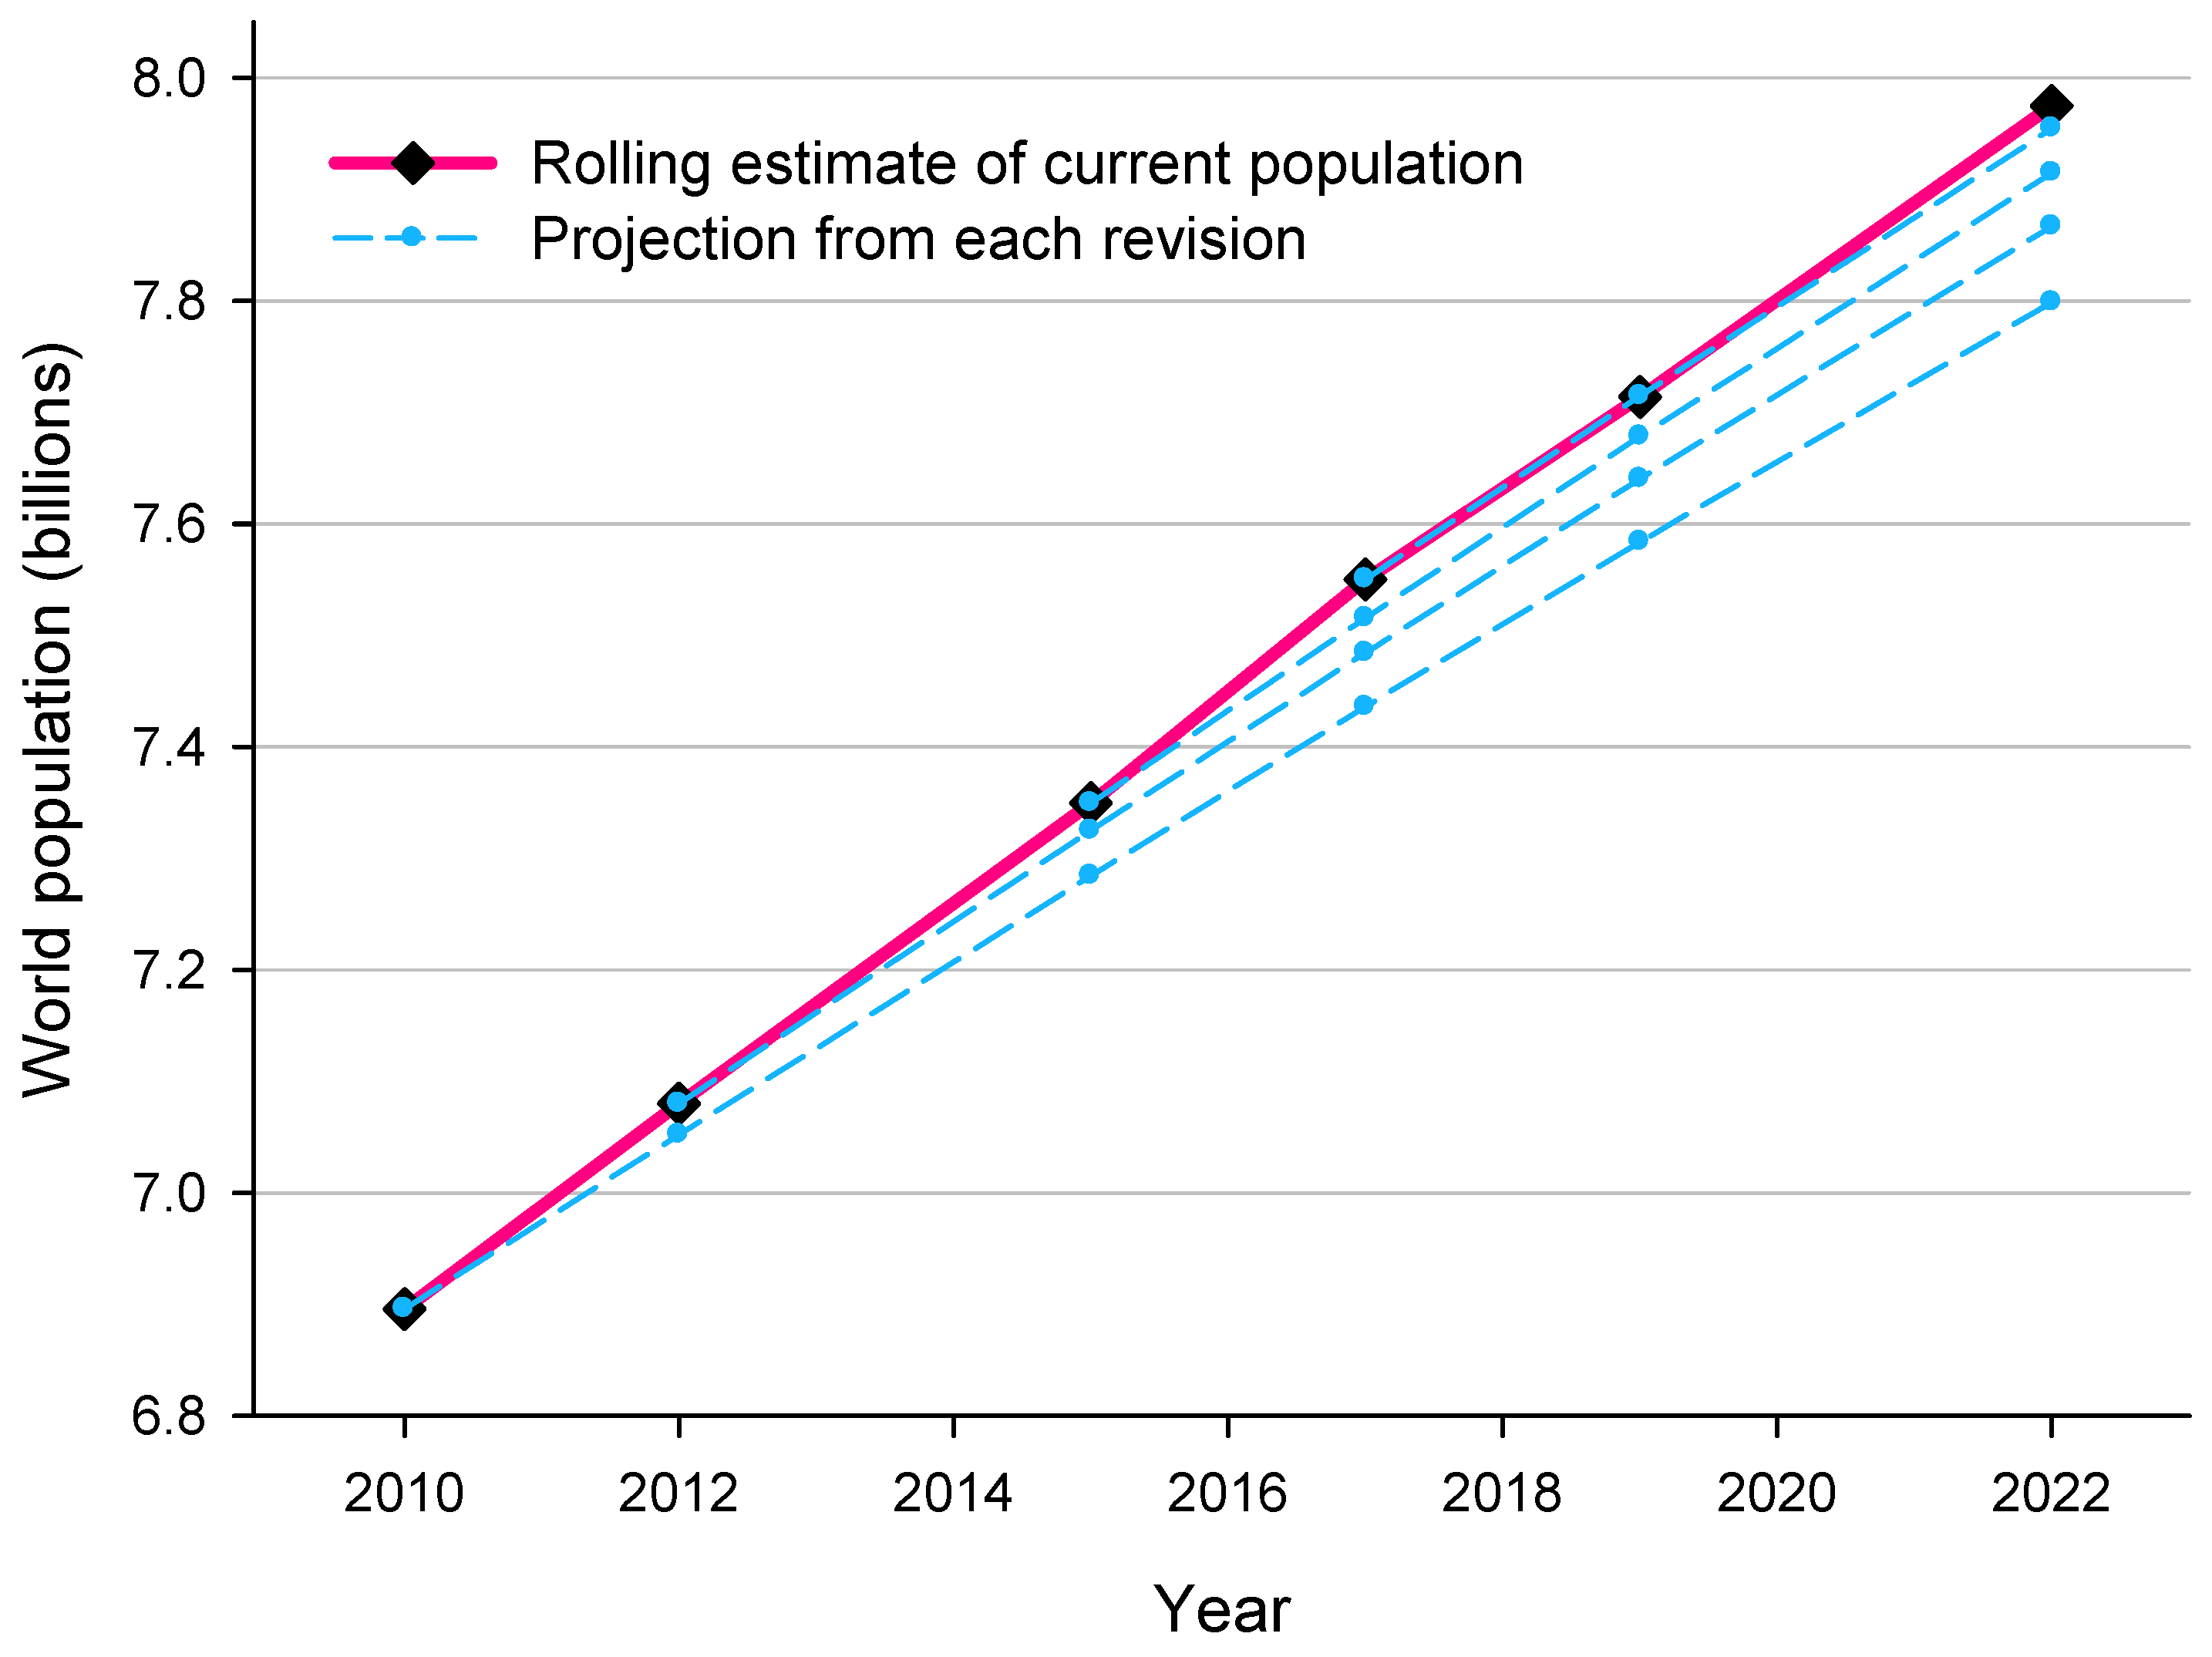
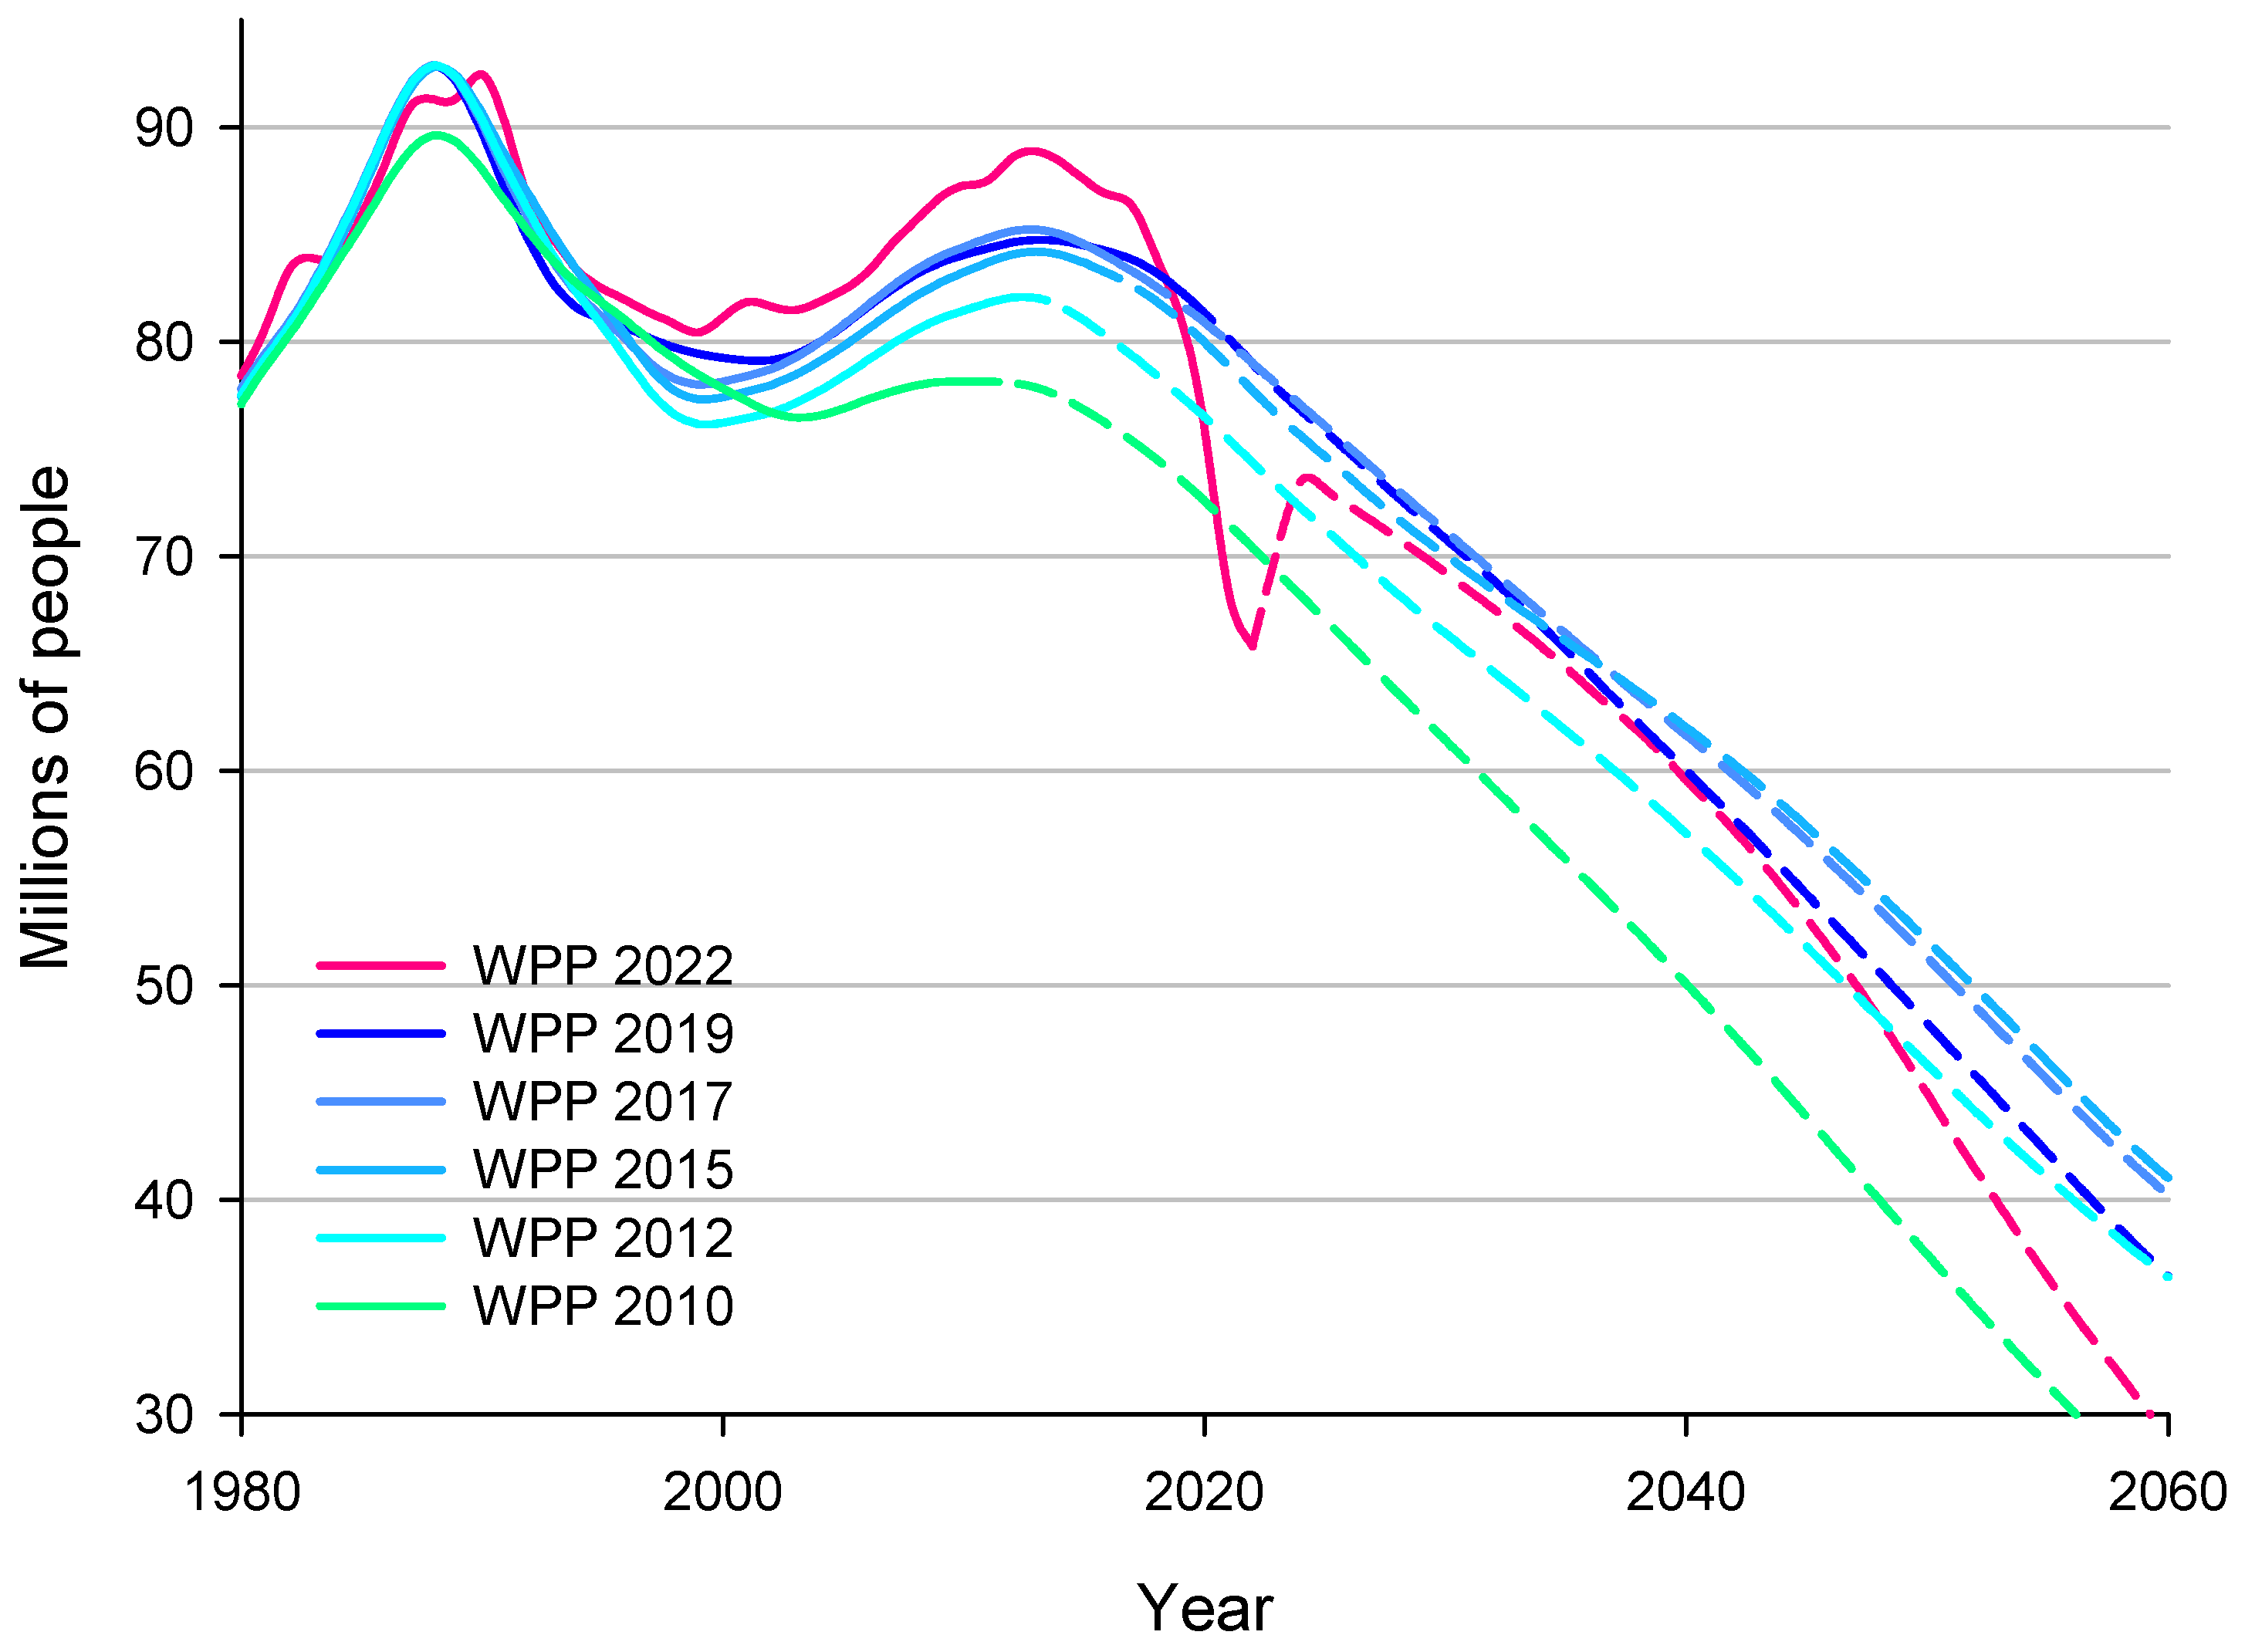
4. The World Population Is Growing Faster than We Are Told

Commentary on the latest revision of UN population projections almost never refers to earlier versions. Consequently, almost nobody is aware how consistently the UN has been underestimating global growth this century. Figure 3 shows the world population as it was estimated in each revision of World Population Prospects (WPP) from 2010 to 2022. The pink line connects each revision’s estimate of the current population, i.e., the mid-2010 population as estimated by WPP2010 connected to the mid-2012 population as estimated by WPP2012, etc.
In blue dashed lines are the projected growths anticipated in each of those revisions. With the exception of 2019, where recent past estimates closely matched what was expected in 2017, each new revision has concluded that growth since the last update was greater than they anticipated.
In 2012, 2015 and 2017, these upward revisions of current estimates resulted in an upward revision of the projected population throughout this century. In 2019, when the estimate of current population closely matched its 2017 expectation, we might have expected that the projection would stay the same too. Instead, the UN anticipated faster future fertility decline than previously and a lower population in 2100 (down from 11.2 billion to 10.9 billion). At the time, I questioned the validity of this change [38].
Now, WPP2022 tells us that, in mid-2022, there were 21 million more humans than were anticipated in 2019. The date for reaching 8 billion was brought forward to 15 November 2022—two and a half months earlier than expected in 2019. This is despite 15 million extra deaths due to COVID-19 up to December 2021 according to the WHO [39], and more millions in the first half of 2022. The pandemic was not anticipated in the 2019 figures; without it, the population would have been above expectation by 36 million or more, in just three years. Compared with the 2010 projection, a shocking 177 million more people were present in mid-2022 than were expected. If we look back to the 2000 projection, the excess population is 253 million.
Despite this, the new projection is for an even steeper deceleration into the future. Without a good explanation of why the future will behave differently to the past, this simply defies logic. We often read that the world is adding around 80 million people per year. However, if we take the UN’s estimate for the current population at the time of each issue (the solid line in Figure 3), the average annual increment over this period is 90 million.
The UN’s rhetoric also seems to be increasingly keen to emphasise that “the pace of growth is slowing down” [34], despite their data providing no evidence for this. Of course, the relative growth rate (percentage growth) has declined, because this is the annual increment divided by the total population. As the total population doubled between 1975 and 2022, so the rate of growth halved. But the UN refers to a declining ‘pace’ of growth, misusing the word ‘pace’, which rightly refers to the actual increment over a period of time. If you set out walking at one pace per second, your journey has increased by 100% when you take the second step, 50% with the third, 33% with the fourth, 25% with the fifth, etc., but your pace has not changed. The world has been adding around 80 million people per year for 50 years, and (given the uncertainty of current estimates, as is evident from Figure 3) we have no sound evidence that this pace has slackened.
Despite all this, according to WPP2022, some 14 million fewer people were born between mid-2019 and mid-2022 than were anticipated in WPP2019. How can this be possible? By revising the past, so that the extra people present are deemed to have been born earlier. This allows the UN’s model to keep showing that, despite recalcitrant growth in the past, we are on the cusp of a steady decline. Figure 4 shows the annual increment of global population published in each of the recent revisions. It shows how the extra 36 million or more people have been spread over the past 30 years (i.e., the area between the solid pink line and those below it). The figure shows the dramatic effect of the COVID-19-related deaths, but after the pandemic, the increment resumes well below the previous (dark blue) projection. This is despite the higher figures for the past and despite life expectancy resuming its previous upward trend. That is to say, they do not anticipate a lasting impact of COVID-19 on deaths, so the lower future increments are due to more rapid fertility decline, apparently based on wishful thinking.
Is it reasonable to project the future to diverge so dramatically from the recent past? A partial explanation is that we are coming to the end of the second echo of the post-war baby-boom (in the 1950s to early 1960s, more babies in the global north coincided with fewer infant deaths in the global south). The first echo, seen in Figure 4 as the peak around 1989, reflects those big cohorts of baby-boomers becoming parents. The children from that peak are parenting now but the bulge is passing. However, while this explains the humps, it does not explain the revisions repeatedly pushing this bulge out further: the UN’s model has always accounted for the size of cohorts entering parenthood. It seems the anticipated decline is repeatedly eluding us. The only explanation for this is that the UN’s model has consistently over-estimated fertility decline.
Relatively few countries remain with very high fertility, and they strongly influence future world growth. Most are in sub-Saharan Africa. Africa alone accounts for all of the increase in the UN’s projections this century. The 2010 projection was the first to run to 2100; earlier editions had ended in 2050, but a long-run projection was published in 2004 [40]. In Figure 5, projections for the world and for Africa are shown for 2004, 2010 and 2017 (the last before the unexplained recalibration of the model accelerating future fertility decline).

5. Projecting Fertility Decline

In the UN’s model, the greatest predictor of the rate of fertility decline is the level of fertility: the higher fertility currently is, the faster it is expected to decline. The model is calibrated on the real experience of countries in the past, and the ‘medium fertility’ model brings all countries toward the average pathway. This is illustrated in Figure 6, where the ‘fertility transition’ (the shift from large families to small) sees countries migrate from the right to the left area of the chart, at a speed indicated by their vertical position. All countries are assumed to continue their fertility transition steadily until they reach below-replacement levels [41]. The model does not allow for any high fertility country to remain recalcitrant (in the ‘pre-transition’ state indicated in Figure 6, with high fertility but a low rate of change), despite its current high fertility indicating its past recalcitrance. It also does not allow for mid-transition stalls or fertility rebounds.
Equally, the UN’s model does not allow for the possibility of very fast fertility transitions, such as were experienced by many countries under active family planning programs in the 1970s to 1990s. No role is acknowledged for interventions aimed at lowering fertility. This reflects the change in the UN position following the 1994 UN International Conference on Population and Development in Cairo. This watershed event is generally referred to in population literature as the ICPD, or simply ‘Cairo’. During the decade leading up to this meeting, increasing concern was expressed about instances of forced sterilisations and abortions, or coerced acceptance of contraception, practiced in some countries in the name of population control. Concern focused on China’s one-child policy and India’s brief period of forced vasectomies in the late 1970s. It must be stressed that these were exceptions to the rule, as most countries implemented programs on a purely voluntary basis, and all international agencies and donor governments, as well as statements from previous UN population conferences, emphasised that birth control should be voluntary. The Cairo consensus statement emphasised that family planning should elevate the reproductive health and rights of individuals (especially women) and not place demographic targets above these priorities [42]. However, it also acknowledged the impacts of population growth on poverty and environmental damage, and affirmed the legitimacy of efforts to end population growth. Nevertheless, the subsequent position taken by the UNFPA has vilified all demographic targets as inherently conflicting with women’s reproductive rights [37,43].
In Figure 6, we can see that rapid fertility transitions were much more prevalent in 1977, during the period of widespread support for voluntary family planning programs, than in 2007, in the post-Cairo era. This change could explain the UN’s persistent overestimation of fertility declines, if the model is calibrated including the decades of active promotion of family planning, which is not representative of recent decades, in which the emphasis is on access to reproductive health services without encouragement of smaller families.
Despite repeated over-estimation of fertility declines and continued denunciation of any direct efforts intended to reduce birth rates, the UN has recalibrated its model to expect more rapid fertility decline in the future, rather than less rapid. This is evident in the steepness of the decline in population increment in Figure 4. It is also evident in Figure 7, which shows the relationship between fertility in 2032 and its rate of decline, as given in projections before and after this shift. The 2022 estimates (blue, identical to the blue symbols in Figure 6) follow a higher regression line than the 2015 estimates (pink). The highest fertility countries to the right are (with the exception of Niger) acknowledged in the 2022 revision to be lagging well behind their fertility decline anticipated in 2015, yet are expected to be reducing fertility even faster (NE = Niger, CD = Democratic Republic of the Congo, TD = Chad, SO = Somalia, ML = Mali, CF = Central African Republic).
The mismatch between the UN’s modelled fertility decline and reality is evident in Figure 8. This shows the reported fertility rates for the 21 countries the UN expects will contribute most to future growth. Between them, according to WPP2022, they will add 2.4 billion people by the time global population peaks in 2086. That is 97% of the total expected increase in global population (other countries will also contribute substantially, but will be off-set by population declines elsewhere.) Figure 8 shows their fertility change between 2019 and 2022, as projected by WPP2019 (using UN’s interpolated data) and as estimated by WPP2022. Countries are listed in order of their contribution to future growth, from just over 300 million additional people in Nigeria to just under 50 million in Madagascar.
The “current” fertility line joins the 2019 fertility level that was reported in WPP2019 and the 2022 fertility level that was reported in WPP2022. This might not be more correct than either revision but at least it is less influenced by the UN model’s bias toward giving all high-fertility countries high rates of fertility decline, whether or not this is actually happening. Of these 21 countries, 12 are reported to have a higher fertility in 2022 than was expected in the 2019 projection (i.e., the slope of the pink line is less than the slope of the brown line). Averaging across all 21, fertility is higher than anticipated by 0.1 children per woman. This might not seem much, but it means half of the decline UN demographers expected between 2019 and 2022 did not happen. Five countries (DR Congo, Sudan, Philippines, Afghanistan and Mali) have a higher fertility in 2022 than they were believed to have in 2019 (i.e., the slope of the pink line is upward). If true, they have gone backwards.
Of course, the 2022 revision has also revised these countries’ 2019 fertility upwards (blue lines in Figure 8) and therefore shows a healthy fertility decline for each of them. We can only speculate whether the revised 2019 numbers are due to new and better information, or are merely the products of a model that rigidly links rate of fertility decline with level of fertility. The fact WPP2022 ascribes Afghanistan among the biggest fertility falls—and we all know why its fertility is likely to have risen—suggests model-forcing. In any case, the data are showing more births and less fertility decline happened over the past three years in these crucial countries than were anticipated in 2019. On these grounds, the projected lower peak population in the 2022 revision is bewildering.
A few countries have had greater fertility decline than expected in 2019. Among the countries in Figure 8, India, Egypt and Madagascar stand out. All have reinvigorated family planning services and public messaging about birth control in the past few years, in an explicit effort to rein in population growth, e.g., [44,45,46], respectively. The Indian state of Uttar Pradesh has been criticised for penalising parents of large families by not letting them stand for election to public positions [47], but no other coercive measures are evident. Other countries (smaller than those in Figure 8) with greater than anticipated fertility declines include Malawi and Rwanda, both having governments openly expressing concerns about population growth and promoting family planning [48,49], respectively.
It would have been nice to see the UN draw attention to this relationship between more government concern about population growth and more fertility decline. Instead, the UNFPA decried any expressed concern about population growth as “alarmist” and efforts to reduce birth rates as “ineffective” [43].

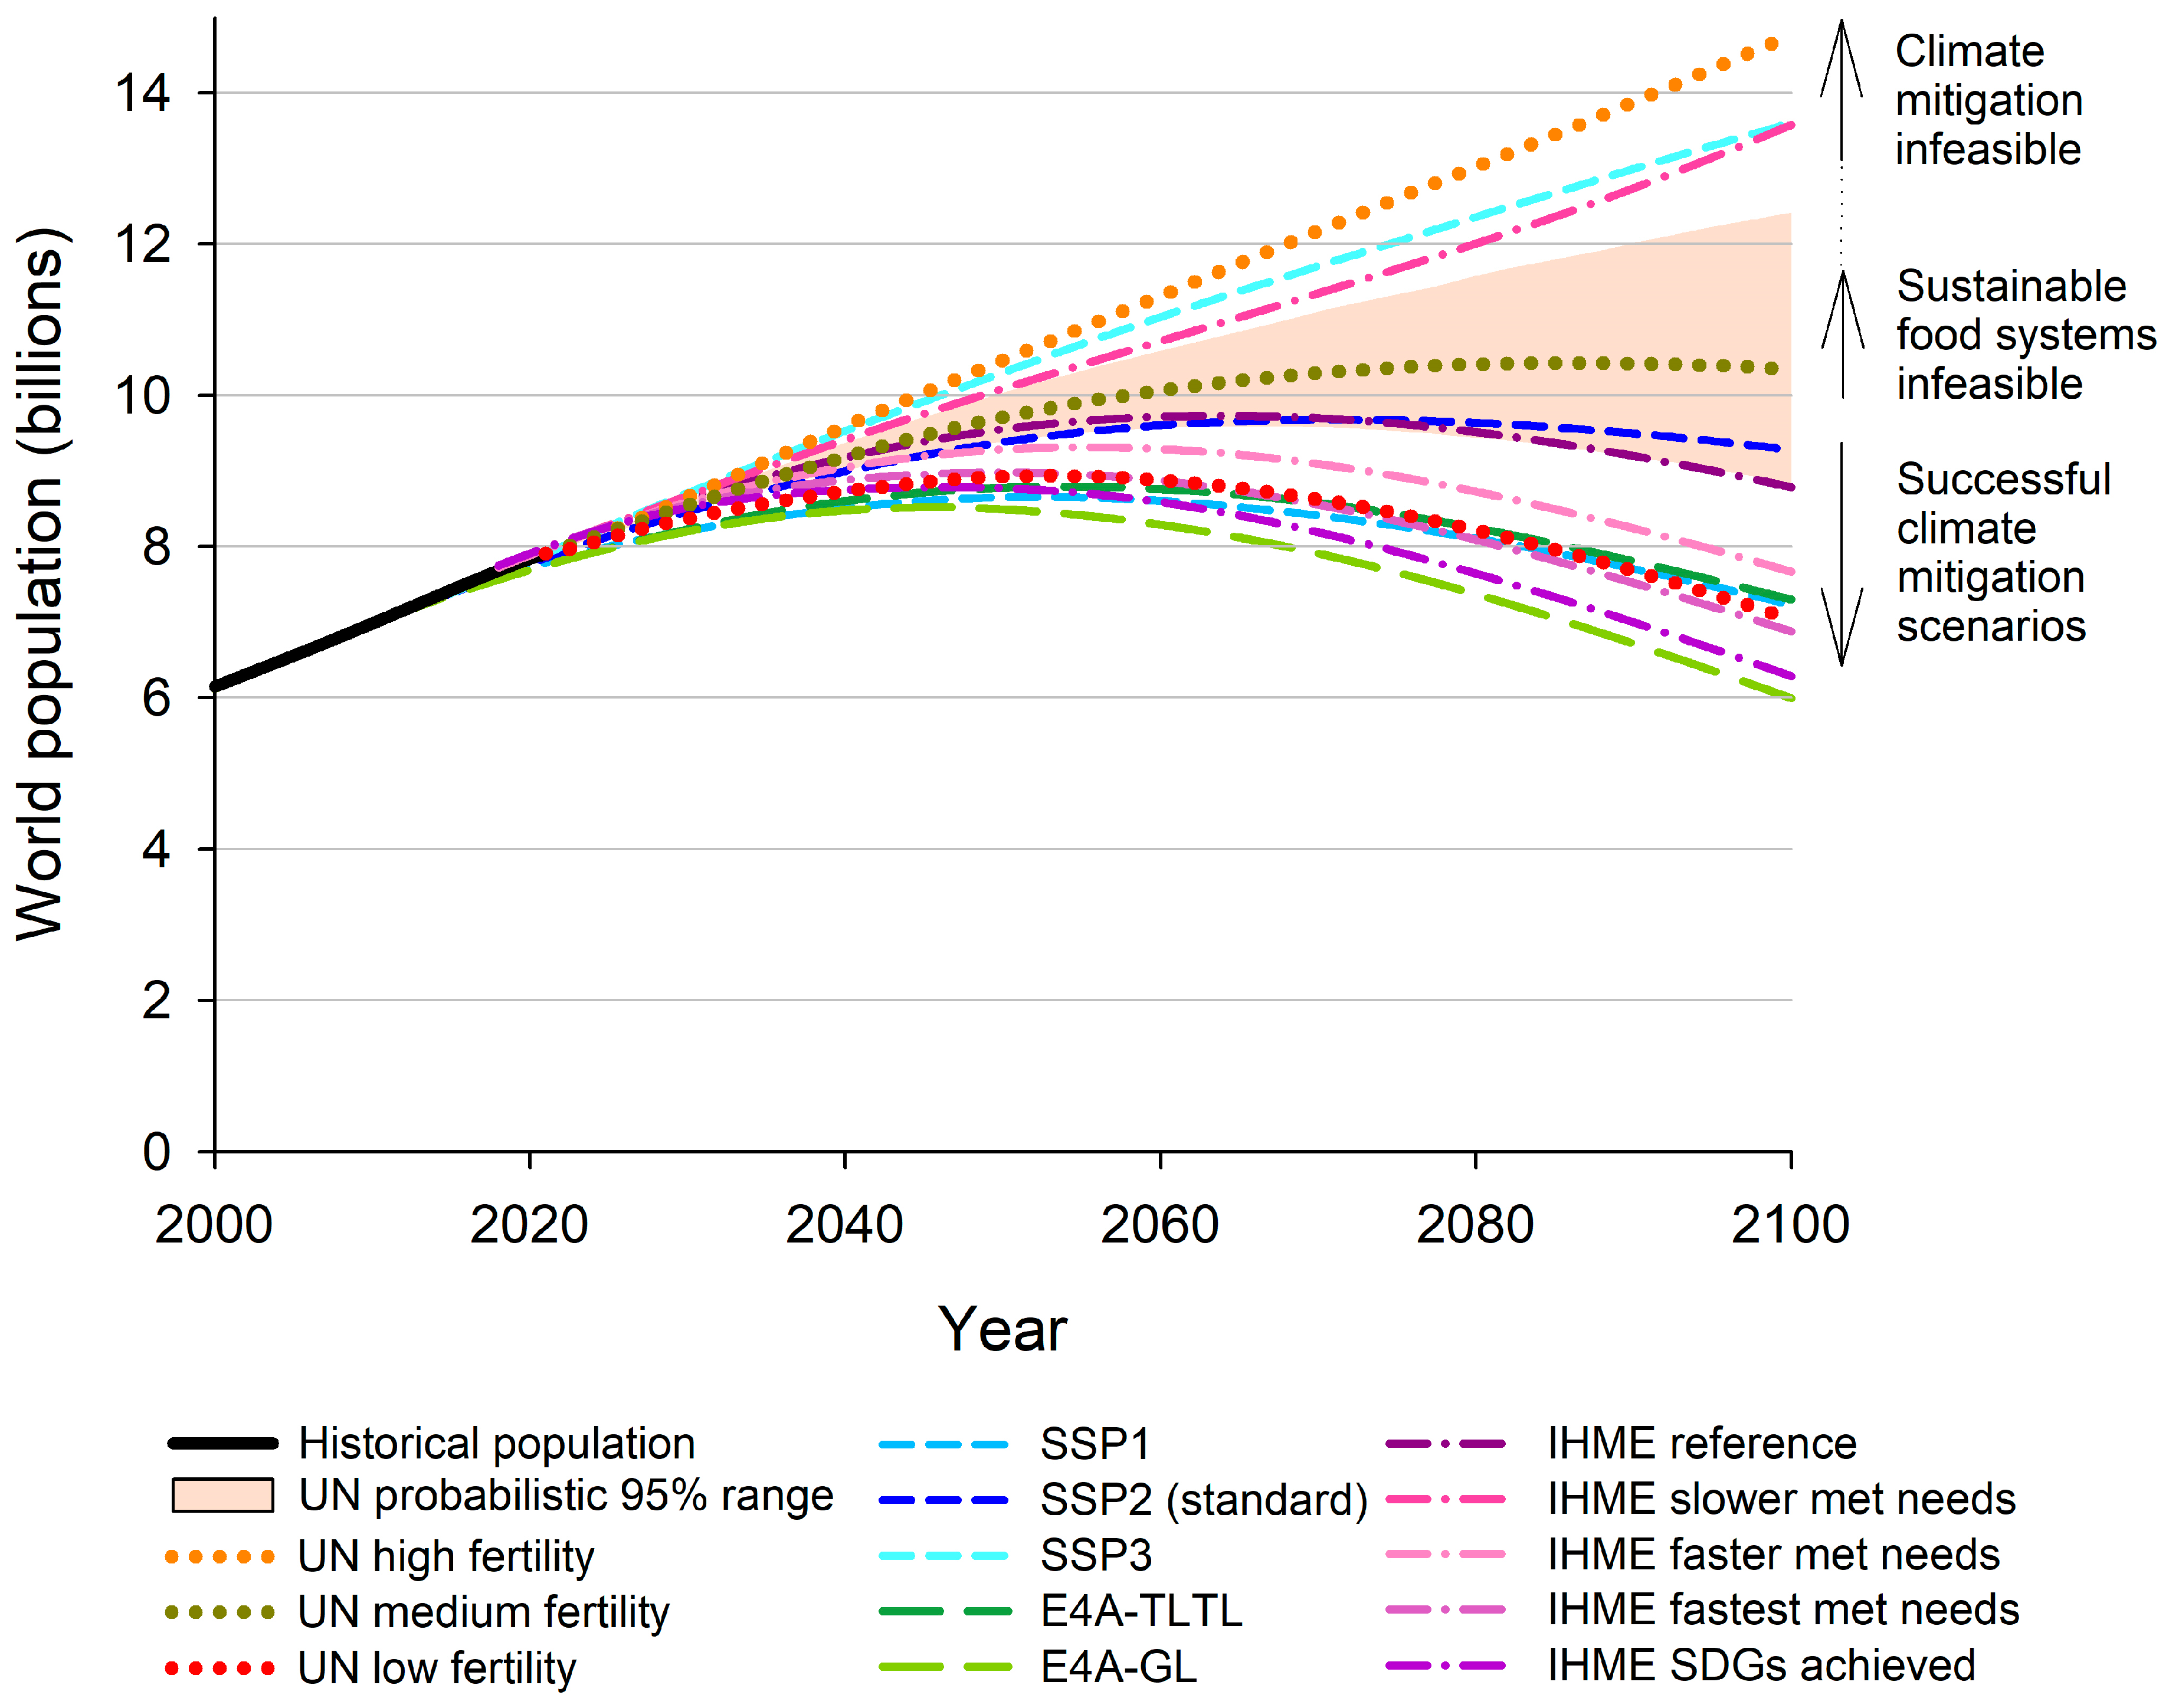
6. Alternative Projections of Global Population

Several other research groups have published their own population projections. These include:
  • The population component of the Shared Socioeconomic Pathways mentioned above, developed for climate change modelling under the IPCC [50]. These projections were developed by the Wittgenstein Centre for Demography and Global Human Capital in Austria. The SSP projections originally had a base year of 2010, while the 2018 revision (“version 2”) has a base year of 2015 [51].
  • The Institute for Health Metrics and Evaluation (IHME), based at the University of Washington. Their projections were developed as part of their Global Burden of Disease project [52].
  • The Earth4All project, including members of the Potsdam Institute for Climate Impact Research, Stockholm Resilience Centre and the BI Norwegian Business School [53]. The population modelling is part of a larger exercise in mapping out a sustainable future for humanity. The project is sponsored by the Club of Rome, as a follow-up to its famous 1972 Limits to Growth study, featuring MIT’s then-groundbreaking Earth3 model [54]. Earth4All is a creative extension of Earth4, intended to be Earth3’s successor.
These projections of world population are compared in Figure 9. The standard run (business-as-usual case) for both SSPs and IHME are similar, peaking below 10 billion. Until the UN’s 2022 revision (which is argued above to be unjustified in lowering its estimates for the latter part of this century), these projections both fell below the UN’s 95% probability range. Now, they would be considered to be between five and fifteen percent likely, according to WPP2022. Both groups have published lower and higher projections, deemed to correspond with policies more or less favourable to extending education and contraception access to the world’s women. SSP1 and IHME’s “fastest met needs” scenario resemble the UN’s “low fertility” projection—an outcome considered by the UN to have near zero likelihood. Both offer only one scenario higher than the standard, nearly as high as the UN’s “high fertility” projection, leaving a wide gap of unexplored territory in between.
Remarkably, Earth4All’s business-as-usual projection (labelled TLTL, for “too little, too late”) also resembles the UN’s “low fertility” projection, peaking below 9 billion. Absurdly, Earth4All says of TLTL, “This scenario represents ‘decision-making as usual” [53], p. 18. It is difficult to judge whether Earth4All’s authors are dismissive of the role of population growth in achieving a sustainable society because their model yielded such a low projection, or if their model yielded such a low projection because they set out to be dismissive of population growth.
Comparing the fertility data from these projections with fertility trends to date challenges their credibility. As an example, Figure 10 gives TFR projections for the Democratic Republic of the Congo. DR Congo is projected to be the second biggest contributor to future world population growth after Nigeria. In Figure 10, the rolling estimate is the fertility reported in each UN revision, five years prior to the revision date (i.e., the 2000–2005 fertility cited in 2010, 2005–2010 fertility cited in 2012, 2010–2015 fertility cited in 2017 and 2017 fertility cited in 2022). This lag minimises the influence of the model’s assumption of rapid fertility decline since the last survey on its estimate of current fertility. The chart illustrates how the UN projections have shifted to the right in response to TFR failing to fall in the way the previous projection anticipated, and yet each revision continues to project fertility decline as fast as before, if not faster. IHME and SSP standard run projections are lower still. Their low-end projections are presented as the likely outcome of improved investments in development and education (with no reference to family planning promotion). They assume rates of fertility decline rarely seen in the past, and never in the absence of strong family planning promotion. Earth4All has not released country-level data, but reports crude birth rates of world regions falling rapidly to implausibly low levels [58].

7. Drivers of Fertility Decline

These four research groups differ in their assumptions about drivers of fertility decline. As mentioned above, the UN uses current fertility as the main determinant of the rate of decline. This approach treats the fertility transition as an autonomous process which, once started, proceeds to completion regardless of socioeconomic circumstances. It is consistent with the hypothesis that a reduction in infant mortality triggers a subsequently autonomous transition [59]. However, in today’s high-fertility countries, infant mortality is already far lower than it was during fertility transitions in the early adopters of family planning. The argument that parents feel the need to have 8–10 children to offset the chance of losing some lacks potency when the national average would see them lose f than one in 10.
The Wittgenstein Centre and IHME place an emphasis on female education. IHME relates completed fertility at age 45 with education attainment at age 25, arguing that completed fertility is a more robust measure than TFR [52]. However, the lag involved means that the calibration period for education ended twenty years before the projections begin.
The Wittgenstein Centre’s calibration is less transparent as it eschews “statistical extrapolation” in favour of “substantive reasoning and assessments of alternative arguments” [60], elsewhere referred to as “expert-argument based projections” [51]. The apparent rationale is that the future can be expected to behave differently to the past. However, in the 2018 update, their experts seem to have taken no lessons from the mismatch between the first edition of SSP2 and the past decade’s reality. The narrative infers fertility decline is driven by investments in education and health, fuelled by economic development [51,61], but in practice, the high and low projections are much like the UN’s, simply adding or subtracting fertility relative to SSP2.
In the Earth4All model, its creators explain, “birth rates are explicitly and causally modelled as a function of GDP per person, depicting a negative correlation between income and fertility rate. … In this context, GDP per person is to be understood as a proxy for a number of key factors, such as female education, access to contraceptives and socio-economic mobility” [53].
None of the research groups include any role for policies and programs intended to modify family size preferences. This is despite family planning program efforts historically accounting for the greatest share of variation in fertility decline between countries, with education and wealth having only a weak influence, if any [62]. Bongaarts and Hardee (2019) found that the strength of family planning programs was the dominant predictor of contraception use in sub-Saharan Africa, while female education had little effect where family planning efforts were weak (Figure 11) [63]. They found no significant effects of GNI per capita, percent urban or child mortality. Psaki et al. (2019) similarly found only small impacts of education [64]. In contrast, where family planning programs are able to overcome the barriers preventing women from using effective contraception, differences in fertility between educated and illiterate women largely disappear [65].
Voluntary family planning programs were implemented by many developing country governments and NGOs during the 1970s and 1980s. They combined the delivery of reproductive health services with the promotion of contraceptive methods, small families and child spacing as well as addressing other barriers to uptake such as child marriage. However, following the UN’s International Conference on Population and Development in 1994, the emphasis shifted to meeting women’s expressed desires for contraception regardless of their family size preferences. The new rhetoric declares (contradicting historical evidence [66]) that all attention to population outcomes abetted coercive measures contravening individual rights, typified by China’s one-child policy, and were conducted “without heed to people’s reproductive aspirations, their health, or the health of their children.” [67], p. 223, while being “ineffective” [37] in reducing births, empowering women or promoting development. Stanley Johnson, a member of the UK delegation at Cairo, presciently reflected, “It remained to be seen to what extent the new paradigm, which effectively dethroned demographic objectives in favour of other social policy goals, would be capable of generating the resources necessary for the attainment of those goals” [68], p. 188. His concern was well founded. From the mid-1990s, funding for family planning programs plummeted [69], fertility declines slowed, stalled or rebounded [70], absolute numbers (if not percentages) of women with an unmet need for contraception increased [71] and population projections for African countries shifted sharply upward [72].
Inattention to the role of family planning promotion could explain the UN model’s underestimations of global growth since 2000. Similarly, by focusing on women over 45 who completed their schooling before the mid-1990s, IHME’s model calibrates during the decades of strong family planning promotion, a condition not present in the projection period to date.
While the correlations between fertility and its purported drivers are real, none of the research groups acknowledge any reverse causation. In each case, fertility decline is seen to be the dependent factor, not a driver in improving infant survival, education outcomes or economic development. Yet, reverse causation is well documented. Infant survival is among the first and greatest impacts of any extension of reproductive health services, and family planning programs tend to reduce the most risky pregnancies, including closely spaced births and those in young teenagers and older women. Hence, there is little wonder that a correlation exists.
There are many plausible causal influences of education on fertility outcomes, but evidence for each is inconsistent, with effects often small and context-dependent [73,74,75,76]. The literature does not support a strong, generalizable, causal relationship such as the IHME and Wittgenstein Centre models assume.
Where rapid fertility transitions have occurred, changing fertility within education levels accounts for most of the change, with a relatively small contribution from change in proportions of women with higher education attainment [77,78]. The same is true for the slower transitions in sub-Saharan Africa for increasing contraception use [79] and fertility decline [80]. Diamond et al. (1999) noted synergy between education and family planning programs, suggesting a little education helped women understand family planning messaging and access services [81]. Cleland (2002) suggested the experience of institutionalised schooling might confer greater confidence in interacting with health institutions [75]. Little if any effect of education has been observed on desired family size [75,80].
Almost none of the literature relating education to fertility considers the reverse causation, rather presuming education explains differences in fertility [74,82]. Eloundou-Enyegue (1999) identifies reverse causation as an area needing greater research, but in the two intervening decades, little has emerged [83]. She mentions only the effect of a girl’s fertility on her own education (discontinuation due to pregnancy) but not the many other potential channels within households and across communities and generations. The effect of family planning promotion on adolescent pregnancy is certainly an important factor: even in the USA, a program providing free contraception for youth significantly reduced female non-completion of high school [84]. Larger families might be less likely to send girls to school, either because of competing resources [85,86,87,88] or household duties including care of younger siblings [89]. At the societal level, slower growth in cohorts of children eases the challenge of building, staffing and provisioning additional school capacity [90]. As smaller cohorts enter labour markets, improved employment prospects might also motivate greater educational efforts from both parents and students. These society-level effects are not measured in household-level studies of impacts of sibsize [91]. Whichever factors dominate, rapid fertility transitions have occurred in countries with widely differing education levels, while some countries (e.g., Philippines, Malaysia, Nigeria) have seen slow fertility transitions despite relatively high school enrolments [92].
The negative impact of rapid population growth on economic development was considered self-evident in the 1950s to 1970s, and was the main motivation for international family planning efforts, but this view went out of fashion in the 1980s [93]. Instead, the clear relationship between per capita GDP and fertility was usually considered due to effects of industrialisation on family size choices. To examine the direction of causation, Figure 12 compiles data on TFR and GDP per capita for all countries in each five-year period with available data between 1960 and 2010. In Figure 12a, the rapidity of fertility change is related to the level of GDP per capita at the start of the period (including only those with fertility greater than two). This analysis finds no influence of national income levels on rates of fertility decline. In contrast, Figure 12b relates the change in GDP per capita to the level of fertility at the beginning of the period. It unequivocally shows that high fertility strongly impedes economic advancement. Where fertility has remained above four children per woman, few countries have sustained any economic betterment. The outliers in the top-right region of the chart are all Middle East oil states. Economic growth tended to take off after TFR fell below three.
The demographic models are not wrong to correlate wealth and fertility, but by assuming the wrong direction of causation, they dismiss the role of family planning promotion and instead advocate policies aimed at general development, efforts that have proven futile in the face of rapid population growth. In contrast, family planning programs are relatively inexpensive and have been successfully implemented by poor countries, changing reproductive behaviour even among illiterate people in rural settings [65,66]. The cost is quickly recouped as each dollar spent directly saves several dollars on unneeded services for women and infants [94].

8. Living Sustainably with Dignity for All

On the basis of the evidence reviewed above, the world population is on track to exceed 10 billion, outside the bounds of scenarios capable of peaceful transitions to sustainable food security and successful climate stabilisation. Yet, even this figure is irrespective of persistent poverty. To achieve even modest modern lifestyles for all the world’s people, much greater consumption of energy and resources per person is needed. Consequently, the sustainable population is much lower.
Assuming decent living standards, most estimates of Earth’s carrying capacity range from 2 billion to 3.5 billion. Daily et al. (1994) calculated 2 billion based on providing energy at a rate of 3 kW per person [95]. Pimentel et al. (2010) estimated that a European standard of living could be sustained for around 2 billion people, based on land resources needed for food and renewable energy [96]. A reduction in meat consumption could conceivably raise this estimate. Tucker (2019) estimated 3 billion [97]. Lianos and Pseiridis (2016) defined sustainable welfare at a European average per capita product of $11,000 and used Ecological Footprint to estimate the proportion of current Gross World Product (GWP) that is sustainable, arriving at a sustainable population of 3.1 billion [98]. Dasgupta et al. (2021) take a similar approach, but define the target living standard at $20,000 per year, a level at which measures of happiness reach a plateau, and calculate a sustainable population of 3.3 billion [99]. In 2019, Dasgupta considered the potential future costs of diminished biospheric capacity and a range of rationales for discounting the interests of future generations, concluding that a sustainable population is likely to lie in the range of 0.5 to 5 billion [100]. None of these studies factor in the interests of other species, and whether a proportion of resources that are potentially useful to humans should be set aside to conserve ecosystems and biodiversity [101], although Dasgupta (2019) discusses this caveat [100].
Clearly, then, the world population must not only stop growing but undertake a long, steady contraction in order to allow all people to escape poverty and achieve wellbeing. The above studies do not exhaust all possibilities for technological and behavioural improvements, to allow the same wellbeing to be achieved at lower levels of resource and energy consumption. However, equally, they do not account for the dependence of modern lifestyles and global food production on non-renewable resources that are becoming increasingly scarce [102], nor the increased demands for certain mineral resources needed to shift from fossil fuelled energy to renewables [103]. They also do not consider how much of Earth’s productive capacity might be degraded during the period of overshoot, before sustainability is restored. Sustainable prosperity might require a population at the lower end of the range of above estimates, rather than the higher end.
In contrast to these studies, Earth4All asserts, “If one assumes low and very equally distributed material consumption per person, then there seems to be room on Earth for more people, not fewer. … Or, put even more concisely: humanity’s main problem is distribution rather than population” [53], p. 34. Yet, even their radical Giant Leap scenario continues to exceed planetary boundaries for global warming, biodiversity loss and land use change through to 2100, while nutrient overloading of ecosystems is only avoided by assuming radical reductions in fertiliser use will not affect global food production. Dasgupta et al. (2021) demonstrate that redistribution must increase average ecological footprint per capita, not decrease it, because resource use increases more sharply from poverty to modest incomes than from modest to high incomes [99].
In this light, the widespread consternation about low birth rates, e.g., [104,105], appears a folly. Total fertility rates between 1.2 and 1.5 children per woman should be welcomed. Even lower rates are unlikely to be universal, so the few countries in which they occur can use modest rates of immigration to moderate their population descent. Even at these rates, it would take over a century to reach sustainable prosperity.
Population decline goes hand in hand with an older age profile, with the largest cohorts of people in their 60s and 70s. An enormous amount of literature has emerged in the past two decades decrying demographic ageing as an economic disaster. Yet countries that have been in the ageing phase, with shrinking proportions of working-age people, for more than two decades, have not encountered any contraction of the workforce or tax revenues as a result [106]. Instead of fewer workers, these countries have seen workforce participation rise and unemployment fall in response to labour market tightening. These predictable adjustments of the labour market are not factored into the models that predict worker shortages. As Turner (2018) explains, “in a world of radical automation potential, which threatens low wage growth and rising inequality, a rapidly growing workforce is neither necessary nor beneficial, and a slightly contracting supply of workers may create useful incentives to improve productivity and support real wage growth” [107].
National expenditure on healthcare and pensions will rise but will be off-set by lower expenditure on infrastructure and education [106]. For many countries, reduced import-dependence for food and energy would further benefit the economy. The decades it takes for the age structure to shift is plenty of time to adapt, whether that includes later retirement, shifting the balance between public pensions and private savings, adjusting tax levels or greater controls on pharmaceutical pricing, to name a few options. Overall, the benefits of population decline are likely to outweigh the disbenefits [108,109,110].

9. Conclusions

Unjustifiably low projections of global population growth create a culture of complaisance and even antagonism against efforts to reduce birth rates. The public is told that population growth will end well within manageable limits, when we are already overburdening planetary systems [111] and on track to exceed the world’s sustainable capacity under even the most radical implementation of sustainability measures [25,26]. We are told that fertility rates are falling rapidly when they have all but stalled globally [70]. We are told that voluntary family planning efforts were ineffective when they were stunningly effective, not only in changing fertility behaviours of families, even in poor, illiterate, rural settings, but also in triggering a virtuous cycle of economic, social and environmental betterment [65,69,90,112].
A 1992 UNICEF report said, “Family planning could bring more benefit to more people at less cost than any other single technology now available to the human race” [113], p. 58. It is no panacea for the environmental crises our crowded world now suffers, but it is an indispensable ingredient in any sustainable future.
It is an extraordinary tragedy that the global community shuns this opportunity, on the grounds that we are defending the poor from abominations like China’s one-child policy, instead of championing the great family planning successes such as Thailand and Iran. Instead of emulating these successes, the high-fertility countries in Africa and elsewhere are being served an insipid and ineffectual reproductive health agenda, in denial of the harms wrought by population growth. It is supposedly centring women’s rights but effectively impedes women’s emancipation through lack of funding and political will for the services they need to avoid unwanted pregnancies, and through lack of a clear motive to challenge the patriarchal cultures that limit women’s roles to motherhood.
Population projections, like all complex modelling exercises, are rarely questioned because their details are difficult for the average person to fathom. However, models are only as good as their assumptions and data. The current crop of global population projections embeds the myth that rapid fertility decline can be achieved through indirect socioeconomic drivers, together with the myth that direct promotion of contraception and small families is ineffective and incompatible with human rights.
Lulled by these fantasies, plans for achieving sustainable futures exclude population measures. An integrated approach is needed across the environmental and social justice agendas, which acknowledges the essential role of rapid population stabilisation in climate change mitigation, biodiversity protection, poverty reduction, food security and world peace [114]. Unless we take a more proactive approach to ending population growth very soon, we will miss our last chance to avoid a hungry, hothouse world.

Funding

This research received no external funding.

Data Availability Statement

All data were sourced from publicly accessible databases cited in the text.

Acknowledgments

The author would like to thank Alon Tal, Paul Sutton, Paul Ehrlich, Céline Delacroix and anonymous reviewers for constructive feedback on the manuscript.

Conflicts of Interest

The author declares no conflict of interest.

References

  1. AFP. 10 Billion Global Population ‘Unsustainable’: US Climate Envoy Kerry. 8 June 2023. The Business Standard. Available online: https://www.tbsnews.net/world/10-billion-global-population-unsustainable-645870 (accessed on 17 July 2023).
  2. Ehrlich, P.R.; Holdren, J.P. One-dimensional ecology. Bull. Sci. 1972, 16, 18–27. [Google Scholar]
  3. Wackernagel, M.; Rees, W. Our Ecological Footprint: Reducing Human Impact on the Earth; New Society Publishers: Philadelphia, PA, USA, 1996; 160p. [Google Scholar]
  4. Wikipedia. Leibig’s Law of the Minimum. Undated. Available online: https://en.wikipedia.org/wiki/Liebig%27s_law_of_the_minimum (accessed on 17 July 2023).
  5. Dalin, C.; Taniguchi, M.; Green, T.R. Unsustainable groundwater use for global food production and related international trade. Glob. Sustain. 2019, 2, e12. [Google Scholar] [CrossRef]
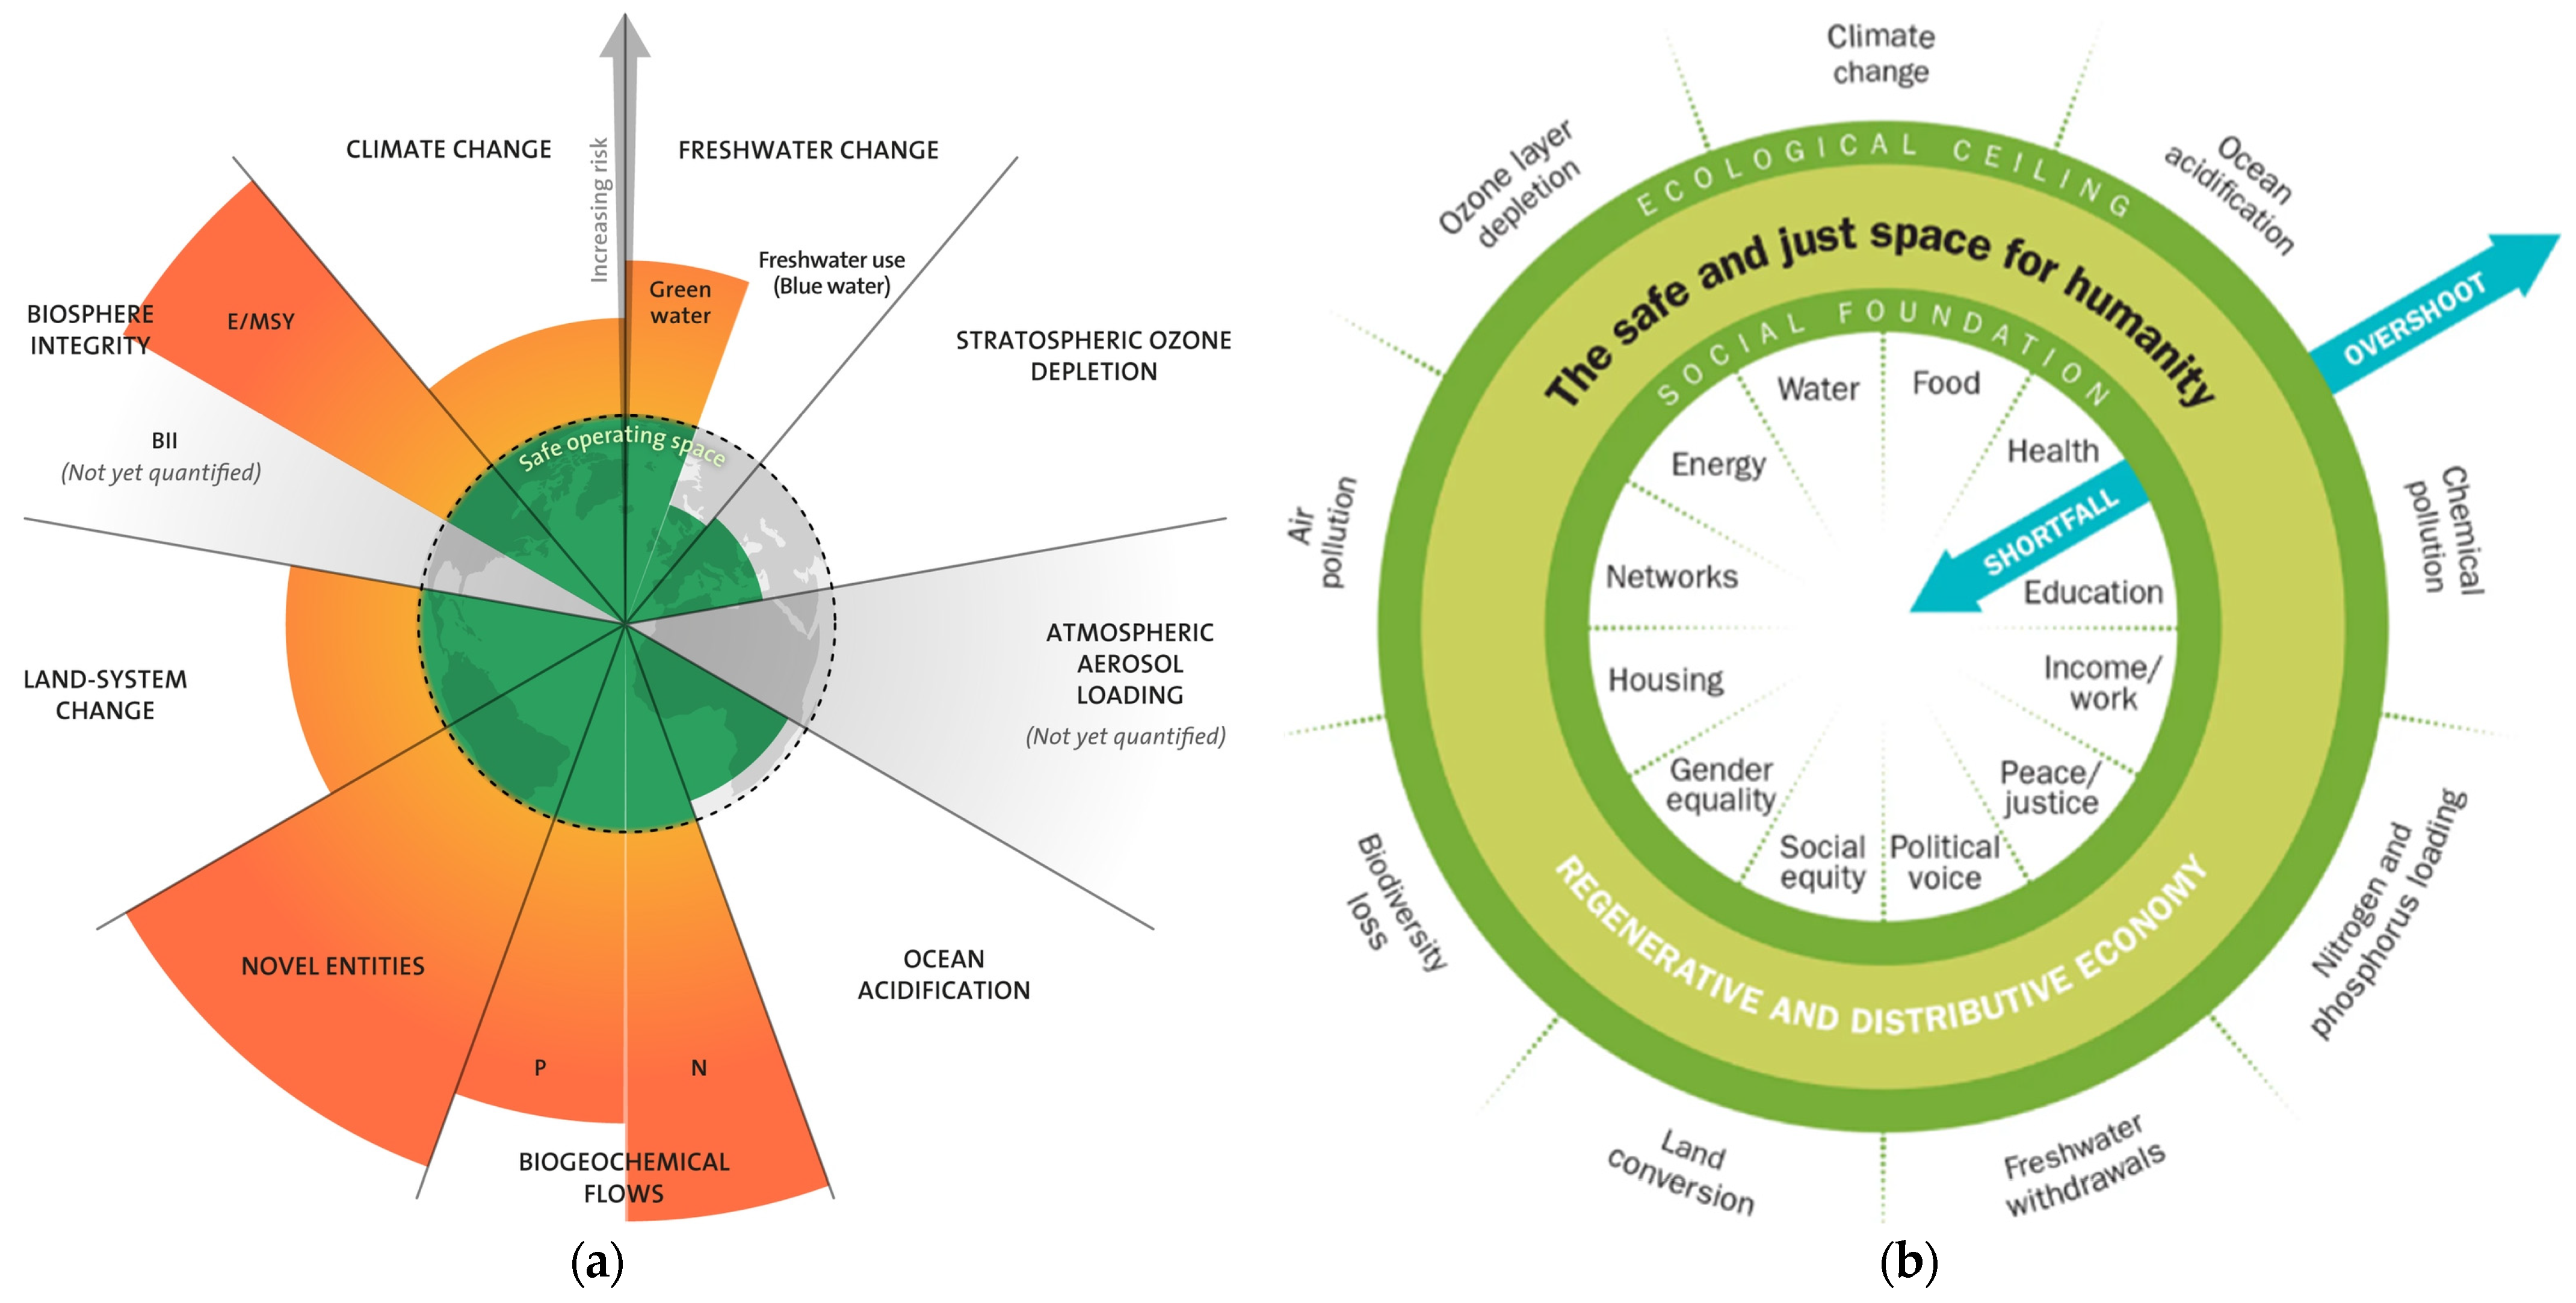
  6. Rockström, J.; Steffen, W.; Noone, K.; Persson, Å.; Chapin, F.S., III; Lambin, E.; Lenton, T.M.; Scheffer, M.; Folke, C.; Schellnhuber, H.; et al. Planetary Boundaries: Exploring the Safe Operating Space for Humanity. Ecol. Soc. 2009, 14, 32. Available online: http://www.ecologyandsociety.org/vol14/iss2/art32/ (accessed on 17 July 2023). [CrossRef]
  7. Raworth, K. Doughnut Economics: Seven Ways to Think Like a 21st-Century Economist; Random House: London, UK, 2018; 384p. [Google Scholar]
  8. Stockholm Resilience Centre. Planetary Boundaries. Available online: https://www.stockholmresilience.org/research/planetary-boundaries.html (accessed on 17 July 2023).
  9. Wang-Erlandsson, L.; Tobian, A.; van der Ent, R.J.; Fetzer, I.; Wierik, S.T.; Porkka, M.; Staal, A.; Jaramillo, F.; Dahlmann, H.; Singh, C.; et al. A planetary boundary for green water. Nat. Rev. Earth Environ. 2022, 3, 380–392. [Google Scholar] [CrossRef]
  10. Rees, W.E. The Human Ecology of Overshoot: Why a Major ‘Population Correction’ Is Inevitable. World 2023, 4, 509–527. [Google Scholar] [CrossRef]
  11. Beddington, J.; Asaduzzaman, M.; Fernandez, A.; Clark, M.; Guillou, M.; Jahn, M.; Erda, L.; Mamo, T.; Van Bo, N.; Nobre, C.A.; et al. Achieving Food Security in the Face of Climate Change: Summary for Policy Makers from the Commission on Sustainable Agriculture and Climate Change; CGIAR Research Program on Climate Change, Agriculture and Food Security (CCAFS): Copenhagen, Denmark, 2011; Available online: https://ccafs.cgiar.org/publications/achieving-food-security-face-climate-change-summary-policy-makers-commission#.X03Yq8gzbIU (accessed on 17 July 2023).
  12. Steiner, A.; Aguilar, G.; Bomba, K.; Bonilla, J.P.; Campbell, A.; Echeverria, R.; Gandhi, R.; Hedegaard, C.; Holdorf, D.; Ishii, N.; et al. Actions to Transform Food Systems under Climate Change; CGIAR Research Program on Climate Change, Agriculture and Food Security (CCAFS): Wageningen, The Netherlands, 2020; Available online: https://cgspace.cgiar.org/bitstream/handle/10568/108489/Actions%20to%20Transform%20Food%20Systems%20Under%20Climate%20Change.pdf (accessed on 17 July 2023).
  13. Tilman, D.; Balzer, C.; Hill, J.; Befort, B.L. Global food demand and the sustainable intensification of agriculture. Proc. Natl. Acad. Sci. USA 2011, 108, 20260–20264. [Google Scholar] [CrossRef]
  14. Bajželj, B.; Richards, K.S.; Allwood, J.M.; Smith, P.; Dennis, J.S.; Curmi, E.; Gilligan, C.A. Importance of food-demand management for climate mitigation. Nat. Clim. Change 2014, 4, 924–929. [Google Scholar] [CrossRef]
  15. Tamburino, L.; Bravo, G.; Clough, Y.; Nicholas, K.A. From population to production: 50 years of scientific literature on how to feed the world. Glob. Food Secur. 2020, 24, 100346. [Google Scholar] [CrossRef]
  16. O’Neill, B.C.; Dalton, M.; Fuchs, R.; Jiang, L.; Pachaui, S.; Zigova, K. Global demographic trends and future carbon emissions. Proc. Natl. Acad. Sci. USA 2010, 107, 17521–17526. [Google Scholar] [CrossRef] [PubMed]
  17. Searchinger, T.; Hanson, C.; Waite, R.; Lipinski, B.; Leeson, G.; Harper, S. Achieving Replacement Level Fertility. World Resources Institute Working Paper, Instalment 3 of “Creating a Sustainable Food Future”. 2013. Available online: https://www.wri.org/research/achieving-replacement-level-fertility (accessed on 17 July 2023).
  18. Moreland, S.; Smith, E. Modeling Climate Change, Food Security and Population: Pilot Testing the Model in Ethiopia; USAID: Washington, DC, USA, 2012. Available online: https://pdf.usaid.gov/pdf_docs/PA00K2RH.pdf (accessed on 17 July 2023).
  19. Molotoks, A.; Smith, P.; Dawson, T.P. Impacts of land use, population, and climate change on global food security. Food Energy Secur. 2021, 10, e261. [Google Scholar] [CrossRef]
  20. Gunasekara, N.K.; Kazama, S.; Yamazaki, D.; Oki, T. The effects of country-level population policy for enhancing adaptation to climate change. Hydrol. Earth Syst. Sci. 2013, 17, 4429–4440. [Google Scholar] [CrossRef]
  21. Carter, R.C.; Parker, A. Climate change, population trends and groundwater in Africa. Hydrol. Sci. J. 2009, 54, 676–689. [Google Scholar] [CrossRef]
  22. Cincotta, R.P.; Engelman, R.; Anastasion, D. The Security Demographic: Population and Civil Conflict after the Cold War; Population Action International: Washington, DC, USA, 2003; Available online: https://pai.org/wp-content/uploads/2012/01/The_Security_Demographic_Population_and_Civil_Conflict_After_the_Cold_War-1.pdf (accessed on 17 July 2023).
  23. Conijn, J.G.; Bindraban, P.S.; Schröder, J.J.; Jongschaap, R.E.E. Can our global food system meet food demand within planetary boundaries? Agric. Ecosyst. Environ. 2018, 251, 244–256. [Google Scholar] [CrossRef]
  24. Willett, W.; Rockström, J.; Loken, B.; Springmann, M.; Lang, T.; Vermeulen, S.; Garnett, T.; Tilman, D.; DeClerck, F.; Wood, A.; et al. Food in the Anthropocene: The EAT–Lancet Commission on healthy diets from sustainable food systems. Lancet 2019, 393, 447–492. [Google Scholar] [CrossRef]
  25. Gerten, D.; Heck, V.; Jägermeyr, J.; Bodirsky, B.L.; Fetzer, I.; Jalava, M.; Kummu, M.; Lucht, W.; Rockström, J.; Schaphoff, S.; et al. Feeding ten billion people is possible within four terrestrial planetary boundaries. Nat. Sustain. 2020, 3, 200–208. [Google Scholar] [CrossRef]
  26. Riahi, K.; Van Vuuren, D.P.; Kriegler, E.; Edmonds, J.; O’Neill, B.C.; Fujimori, S.; Bauer, N.; Calvin, K.; Dellink, R.; Fricko, O.; et al. The shared socioeconomic pathways and their energy, land use and greenhouse gas emissions implications: An overview. Glob. Environ. Change 2017, 42, 153–168. [Google Scholar] [CrossRef]
  27. O’Neill, B.C.; Kriegler, E.; Riahi, K.; Ebi, K.L.; Hallegatte, S.; Carter, T.R.; Mathur, R.; van Vuuren, D.P. A new scenario framework for climate change research: The concept of shared socioeconomic pathways. Clim. Change 2014, 122, 387–400. [Google Scholar] [CrossRef]
  28. IPCC. Climate Change 2022: Mitigation of Climate Change. Working Group III Contribution to the IPCC Sixth Assessment Report. 2022. Available online: https://www.ipcc.ch/report/sixth-assessment-report-working-group-3/ (accessed on 17 July 2023).
  29. Carter, S.; Herold, M.; Avitabile, V.; De Bruin, S.; De Sy, V.; Kooistra, L.; Rufino, M.C. Agriculture-driven deforestation in the tropics from 1990-2015: Emissions, trends and uncertainties. Environ. Res. Lett. 2018, 13, 014002. [Google Scholar] [CrossRef]
  30. FAO. State of the World’s Forests 2016. Forests and Agriculture: Land-Use Challenges and Opportunities; FAO: Rome, Italy, 2016; Available online: https://www.fao.org/publications/sofo/en/ (accessed on 17 July 2023).
  31. Buettner, T. World Population Prospects—A Long View. Econ. Stat. 2020, 520, 9–27. [Google Scholar] [CrossRef]
  32. UNDESA. World Population Prospects, the 2022 Revision; Population Division, Department of Economic and Social Affairs: New York, NY, USA, 2022; Available online: http://population.un.org/wpp (accessed on 17 July 2023).
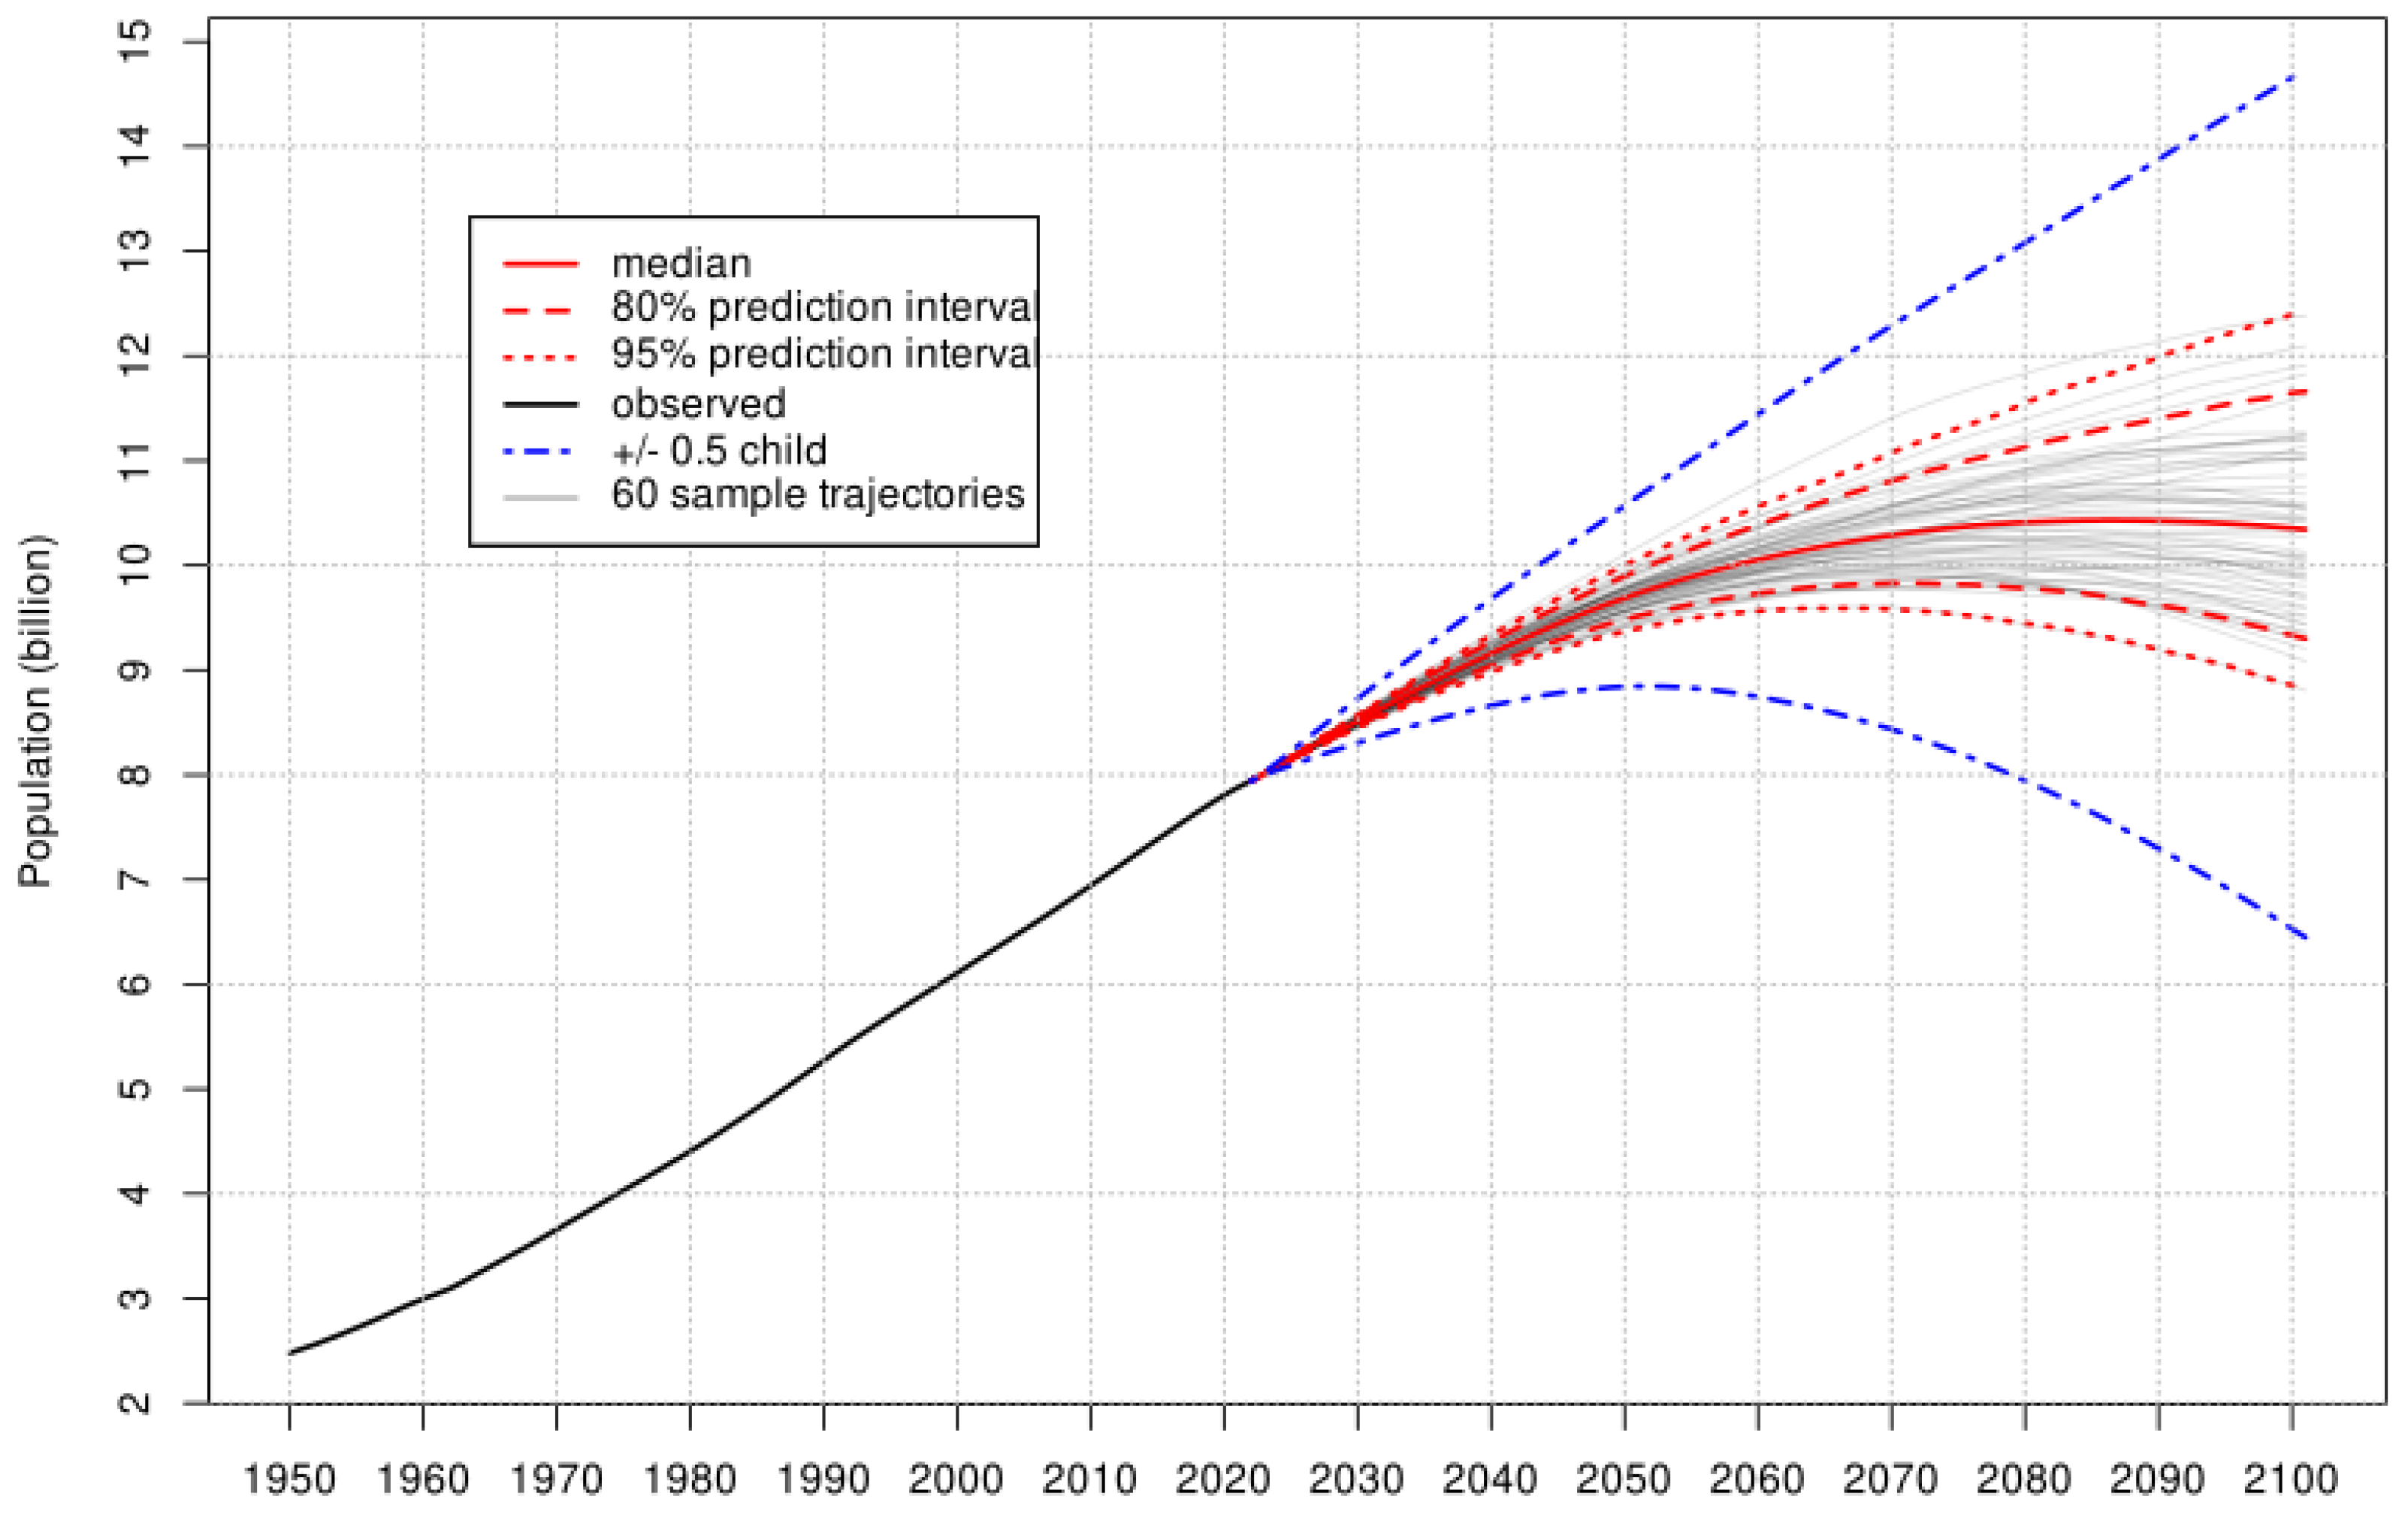
  33. Raftery, A.E.; Li, N.; Ševčíková, H.; Gerland, P.; Heilig, G.K. Bayesian probabilistic population projections for all countries. Proc. Natl. Acad. Sci. USA 2012, 109, 13915–13921. [Google Scholar] [CrossRef]
  34. UNDESA. Key Messages, World Population Prospects. 2022. Available online: https://www.un.org/development/desa/pd/sites/www.un.org.development.desa.pd/files/undesa_pd_2022_wpp_key-messages.pdf (accessed on 17 July 2023).
  35. Wilmoth, J. Press Briefing upon Publication of World Population Prospects: The 2012 Revision; Statement by Mr. JohnWilmoth, Director, Population Division Department of Economic and Social Affairs, United Nations. Thursday, 13 June 2013; UN Headquarters: New York, NY, USA, 2013. [Google Scholar]
  36. Gerland, P.; Raftery, A.E.; Ševčíková, H.; Li, N.; Gu, D.; Spoorenberg, T.; Alkema, L.; Fosdick, B.D.; Chunn, J.; Lalic, N.; et al. World population stabilization unlikely this century. Science 2014, 346, 234–237. [Google Scholar] [CrossRef] [PubMed]
  37. Davies, L. UN Warns against Alarmism as World’s Population Reaches 8bn Milestone. The Guardian, 18 October 2022. Available online: https://www.theguardian.com/global-development/2022/oct/18/global-population-growth-8-billion-unfdp-united-nations-warning-alarmism (accessed on 17 July 2023).
  38. O’Sullivan, J. World Population Prospects, 2019—Good News or Bad? The Overpopulation Project, 26 June 2019. Available online: https://overpopulation-project.com/world-population-prospects-2019-good-news-or-bad/ (accessed on 17 July 2023).
  39. WHO. 14.9 Million Excess Deaths Associated with the COVID-19 Pandemic in 2020 and 2021. World Health Organisation News Release, 9 May 2022. Available online: https://www.who.int/news/item/05-05-2022-14.9-million-excess-deaths-were-associated-with-the-covid-19-pandemic-in-2020-and-2021 (accessed on 17 July 2023).
  40. UNDESA. World Population to 2300; Population Division, Department of Economic and Social Affairs: New York, NY, USA, 2004; Available online: https://www.un.org/development/desa/pd/sites/www.un.org.development.desa.pd/files/files/documents/2020/Jan/un_2002_world_population_to_2300.pdf (accessed on 17 July 2023).
  41. Alkema, L.; Raftery, A.E.; Gerland, P.; Clark, S.J.; Pelletier, F.; Buettner, T.; Heilig, G.K. Probabilistic projections of the total fertility rate for all countries. Demography 2011, 48, 815–839. [Google Scholar] [CrossRef] [PubMed]
  42. UNFPA. Programme of Action Adopted at the International Conference on Population and Development, Cairo, 5–13 September 1994. Available online: https://www.unfpa.org/sites/default/files/event-pdf/PoA_en.pdf (accessed on 17 July 2023).
  43. O’Sullivan, J. The United Nations Celebrates World Population Day by Shaming Population ‘Alarmists’. The Overpopulation Project, 11 July 2022. Available online: https://overpopulation-project.com/the-united-nations-celebrates-world-population-day-by-shaming-population-alarmists/ (accessed on 17 July 2023).
  44. Chandrashekhar, V. Why India Is Making Progress in Slowing Its Population Growth. Yale Environment360, 12 December 2019. Available online: https://e360.yale.edu/features/why-india-is-making-progress-in-slowing-its-population-growth (accessed on 17 July 2023).
  45. Aleem, A. Two Is Enough: A Fix for Egypt’s Overpopulation. Al Monitor, 4 August 2017. Available online: http://www.al-monitor.com/pulse/originals/2017/08/egypt-overpopulation-two-children-program-social-solidarity.html (accessed on 17 July 2023).
  46. UNFPA. Madagascar President Champions Family Planning as a Lever for Development. UNFPA Press Release, 5 October 2021. Available online: https://esaro.unfpa.org/en/news/madagascar-president-champions-family-planning-lever-development (accessed on 17 July 2023).
  47. Mishra, C.M.; Paul, S. Population control bill of Uttar Pradesh (two-child norm): An answer to population explosion or birth of a new social problem? J. Fam. Med. Prim. Care 2022, 11, 4123–4126. [Google Scholar] [CrossRef]
  48. Exemplars News. Malawi Emerges as a Leader in Family Planning. Exemplars in Global Health, 14 November 2022. Available online: https://www.exemplars.health/stories/malawi-emerges-as-a-leader-in-family-planning (accessed on 17 July 2023).
  49. Wadhams, N. Progress in Rwanda’s drive to slow population growth. Lancet World Rep. 2010, 376, 81–82. [Google Scholar] [CrossRef]
  50. KC, S.; Lutz, W. The human core of the shared socioeconomic pathways: Population scenarios by age, sex and level of education for all countries to 2100. Glob. Environ. Change 2017, 42, 181–192. [Google Scholar] [CrossRef]
  51. Lutz, W.; Stilianakis, N.; Stonawski, M.; Goujon, A.; KC, S. (Eds.) Demographic and Human Capital Scenarios for the 21st Century—2018 Assessment for 201 Countries; Joint Research Centre (Publications Office of European Commission): Luxembourg, 2018; Available online: https://data.europa.eu/doi/10.2760/835878 (accessed on 17 July 2023).
  52. Vollset, S.E.; Goren, E.; Yuan, C.-W.; Cao, J.; Smith, A.E.; Hsiao, T. Fertility, mortality, migration, and population scenarios for 195 countries and territories from 2017 to 2100: A forecasting analysis for the Global Burden of Disease Study. Lancet 2020, 396, 1285–1306. [Google Scholar] [CrossRef] [PubMed]
  53. Callegari, B.; Stoknes, P.E. People and Planet: 21st Century Sustainable Population Scenarios and Possible Living Standards within Planetary Boundaries. Earth4All Working Paper, 1 March 2023. Available online: https://earth4all.life/wp-content/uploads/2023/04/E4A_People-and-Planet_Report.pdf (accessed on 17 July 2023).
  54. Meadows, D.H.; Meadows, D.L.; Randers, J.; Behrens, W.W. The Limits to Growth: A Report for the Club of Rome’s Project on the Predicament of Mankind; Universe Books: New York, NY, USA, 1972; ISBN 0876631650. Available online: https://archive.org/details/limitstogrowthr00mead (accessed on 17 July 2023).
  55. Wittgenstein Centre. Human Capital Data Explorer. Available online: http://dataexplorer.wittgensteincentre.org/wcde-v2/ (accessed on 17 July 2023).
  56. IHME. GHDx Global Fertility, Mortality, Migration, and Population Forecasts 2017–2100. Available online: https://ghdx.healthdata.org/record/ihme-data/global-population-forecasts-2017-2100 (accessed on 17 July 2023).
  57. Earth4All. Earth4All Global Model—Beta Version with Data and Charts. Available online: https://earth4all.life/the-science-rp/ (accessed on 17 July 2023).
  58. O’Sullivan, J. The Imaginary World of Earth4All’s Low Population Projections. The Overpopulation Project, 4 April 2023. Available online: https://overpopulation-project.com/the-imaginary-world-of-earth4alls-low-population-projections/ (accessed on 17 July 2023).
  59. Dyson, T. Population and Development: The Demographic Transition; ZED: West Yorkshire, UK, 2010; ISBN 10-1842779605. [Google Scholar]
  60. Lutz, W.; Butz, W.; KC, S.; Sanderson, W.; Scherbov, S. Population growth: Peak probability. Science 2014, 346, 561. [Google Scholar] [CrossRef]
  61. Jiang, L. Internal consistency of demographic assumptions in the shared socioeconomic pathways. Popul. Environ. 2014, 35, 261–285. [Google Scholar] [CrossRef]
  62. de Silva, T.; Tenreyo, S. Population control policies and fertility convergence. J. Econ. Perspect. 2017, 31, 205–228. Available online: https://pubs.aeaweb.org/doi/pdf/10.1257/jep.31.4.205 (accessed on 17 July 2023). [CrossRef]
  63. Bongaarts, J.; Hardee, K. Trends in contraceptive prevalence in sub-Saharan Africa: The roles of family planning programs and education. Afr. J. Reprod. Health 2019, 23, 96–105. [Google Scholar] [CrossRef]
  64. Psaki, S.R.; Chuang, E.K.; Melnikas, A.J.; Wilson, D.B.; Mensch, B.S. Causal effects of education on sexual and reproductive health in low and middle-income countries: A systematic review and meta-analysis. SSM Popul. Health 2019, 8, 100386. [Google Scholar] [CrossRef]
  65. Potts, M.; Marsh, L. The Population Factor: How Does It Relate to Climate Change? Climate Adaptation, 3 February 2010. Available online: https://bixby.berkeley.edu/publications/population-factor-how-does-it-relate-climate-change (accessed on 17 July 2023).
  66. Robinson, W.C.; Ross, J.A. (Eds.) The Global Family Planning Revolution; World Bank: Washington, DC, USA, 2007; 496p, ISBN 10-08213-6951-2. Available online: https://openknowledge.worldbank.org/handle/10986/6788 (accessed on 17 July 2023).
  67. UNFPA. Framework of Actions for the Follow-Up to the Programme of Action of the International Conference on Population and Development Beyond 2014: Report of the Operational Review of the Implementation of the Programme of Action of the International Conference on Population and Development and its Follow-up Beyond 2014. Available online: https://www.unfpa.org/publications/framework-actions-follow-programme-action-international-conference-population-and (accessed on 17 July 2023).
  68. Johnson, S. The Politics of Population: The International Conference on Population and Development Cairo 1994; Earthscan Publications: London, UK, 1995; 247p, ISBN 1-85383-297-9. [Google Scholar]
  69. Sinding, S.W. Population, poverty and economic development. Phil. Trans. R. Soc. B 2009, 364, 3023–3030. [Google Scholar] [CrossRef] [PubMed]
  70. Bongaarts, J. Fertility Transitions in Developing Countries: Progress or Stagnation? Stud. Fam. Plan. 2008, 39, 105–110. [Google Scholar] [CrossRef] [PubMed]
  71. Kantorova, V.; Wheldon, M.C.; Ueffing, P.; Dasgupta, A.N.Z. Estimating progress towards meeting women’s contraceptive needs in 185 countries: A Bayesian hierarchical modelling study. PLOS Med. 2020, 17, e1003026. [Google Scholar] [CrossRef]
  72. Ezeh, A.C.; Mberu, B.U.; Emina, J.O. Stall in fertility decline in Eastern African countries: Regional analysis of patterns, determinants and implications. Phil. Trans. R. Soc. B 2009, 364, 2991–3007. [Google Scholar] [CrossRef]
  73. Cochrane, S.H. Fertility and Education: What Do We Really Know? The World Bank (Staff Occasional Paper No. 26); Johns Hopkins University Press: Baltimore, MD, USA, 1979. [Google Scholar]
  74. Bledsoe, C.H.; Casterline, J.B.; Johnson-Kuhn, J.A.; Haaga, J.G. (Eds.) Critical Perspectives on Schooling and Fertility in the Developing World (1999); Committee on Population, National Research Council: Washington, DC, USA, 1999; Available online: http://nap.nationalacademies.org/6272 (accessed on 29 August 2023).
  75. Cleland, J. Education and Future Fertility Trends, with Special Reference to Mid-Transitional Countries. United Nations Population Division Background Paper 2002. Available online: https://www.un.org/development/desa/pd/sites/www.un.org.development.desa.pd/files/unpd_egm_200203_backgroundpaper_education_and_future_fertility_trends_cleland.pdf (accessed on 2 August 2023).
  76. Basu, A.M. Why does Education Lead to Lower Fertility? A Critical Review of Some of the Possibilities. World Dev. 2002, 30, 1779–1790. [Google Scholar] [CrossRef]
  77. Choe, M.K.; Retherford, R.D. The contribution of education to South Korea’s fertility decline to ‘lowest-low’ level. Asian Popul. Stud. 2009, 5, 267–288. [Google Scholar] [CrossRef]
  78. Buathong, T.; Pothisiri, W.; Muttarak, R.; Shaikh, M. What Difference does Education Make? Education Expansion and Rapid Cohort Fertility Decline in Thailand, 1970—2010. In Proceedings of the IUSSP, International Population Conference, Cape Town, South Africa, 30 September 2017; Available online: https://iussp.org/en/cape-town-2017 (accessed on 17 July 2023).
  79. Emina, J.B.O.; Chirwa, T.; Kandala, N.-B. Trend in the use of modern contraception in sub-Saharan Africa: Does women’s education matter? Contraception 2014, 90, 154–161. [Google Scholar] [CrossRef]
  80. Garenne, M. Education and Fertility in Sub-Saharan Africa: A Longitudinal Perspective. UNAID: DHS Analytical Studies 33. 2012. Available online: https://www.dhsprogram.com/pubs/pdf/as33/as33.pdf (accessed on 29 August 2023).
  81. Diamond, I.; Newby, M.; Varle, S. Female education and fertility: Examining the links. In Critical Perspectives on Schooling and Fertility in the Developing World (1999); Bledsoe, C.H., Casterline, J.B., Johnson-Kuhn, J.A., Haaga, J.G., Eds.; Committee on Population, National Research Council: Washington, DC, USA, 1999; pp. 23–48. Available online: http://nap.nationalacademies.org/6272 (accessed on 29 August 2023).
  82. Zahra, F.; Haberland, N.; Psaki, S. Causal mechanisms linking education with fertility, HIV, and child mortality: A systematic review. Campbell Syst. Rev. 2022, 18, e1250. [Google Scholar] [CrossRef]
  83. Eloundou-Enyegue, P.M. Fertility and education: What Do We Now Know. In Critical Perspectives on Schooling and Fertility in the Developing World (1999); Bledsoe, C.H., Casterline, J.B., Johnson-Kuhn, J.A., Haaga, J.G., Eds.; Committee on Population, National Research Council: Washington, DC, USA, 1999; pp. 287–305. Available online: http://nap.nationalacademies.org/6272 (accessed on 29 August 2023).
  84. Stevenson, A.J.; Genadek, K.R.; Yeatman, S.; Mollborn, S.; Menken, J.A. The impact of contraceptive access on high school graduation. Sci. Adv. 2021, 7, eabf6732. [Google Scholar] [CrossRef] [PubMed]
  85. Lloyd, C.B. Investing in the Next Generation: The Implications of High Fertility at the Level of the Family; Population Council Working Papers, No. 63; Population Council: New York, NY, USA, 1994; Available online: https://books.google.com.au/books/about/Investing_in_the_Next_Generation.html?id=6q2RAAAAIAAJ&redir_esc=y (accessed on 17 July 2023).
  86. Blake, J. Family Size and Achievement. University of California Press E-Books Collection. 1992. Available online: https://publishing.cdlib.org/ucpressebooks/view?docId=ft6489p0rr (accessed on 30 August 2023).
  87. Montgomery, M.R.; Lloyd, C.B. Excess Fertility, Unintended Births, and Children’s Schooling. In Critical Perspectives on Schooling and Fertility in the Developing World (1999); Bledsoe, C.H., Casterline, J.B., Johnson-Kuhn, J.A., Haaga, J.G., Eds.; Committee on Population, National Research Council: Washington, DC, USA, 1999; pp. 216–266. Available online: http://nap.nationalacademies.org/6272 (accessed on 29 August 2023).
  88. Chen, S.H.; Chen, Y.-C.; Liu, J.-T. The Impact of Family Composition on Educational Achievement. National Bureau of Economic Research Working Paper 20443. 2014. Available online: http://www.nber.org/papers/w20443 (accessed on 17 July 2023).
  89. Fuller, B.; Liang, X. Which Girls Stay in School? The Influence of Family Economy, Social Demands, and Ethnicity in South Africa. In Critical Perspectives on Schooling and Fertility in the Developing World (1999); Bledsoe, C.H., Casterline, J.B., Johnson-Kuhn, J.A., Haaga, J.G., Eds.; Committee on Population, National Research Council: Washington, DC, USA, 1999; pp. 181–215. Available online: http://nap.nationalacademies.org/6272 (accessed on 29 August 2023).
  90. Campbell, M.; Cleland, J.; Ezeh, A.; Prata, N. Public Health: Return of the Population Growth Factor. Science 2007, 315, 1501–1502. Available online: https://www.science.org/doi/10.1126/science.1140057 (accessed on 17 July 2023). [CrossRef]
  91. Eloundou-Enyegue, P.M.; Giroux, S.C. Fertility transitions and schooling: From micro- to macro-level associations. Demography 2012, 49, 1407–1432. [Google Scholar] [CrossRef] [PubMed]
  92. O’Sullivan, J.N. Revisiting Demographic Transition: Correlation and Causation in the Rate of Development and Fertility Decline. In Proceedings of the 27th International Population Conference, IUSSP, Busan, Republic of Korea, 26–31 August 2013; Available online: http://iussp.org/sites/default/files/event_call_for_papers/OSullivan_IUSSP27_DemographicTransition_FullPaper.pdf (accessed on 29 August 2023).
  93. Finkle, J.L.; Crane, B.B. Ideology and Politics at Mexico City: The United States at the 1984 International Conference on Population. Popul. Dev. Rev. 1985, 11, 1–28. Available online: https://www.jstor.org/stable/1973376 (accessed on 17 July 2023). [CrossRef]
  94. Sully, E.A.; Biddlecom, A.; Darroch, J.E.; Riley, T.; Ashford, L.S.; Lince-Deroche, N.; Firestein, L.; Murro, R. Adding It up: In-Vesting in Sexual and Reproductive Health 2019; Guttmacher Institute: New York, NY, USA, 2020. [Google Scholar] [CrossRef]
  95. Daily, G.C.; Ehrlich, A.H.; Ehrlich, P.R. Optimum human population size. Popul. Environ. 1994, 15, 469–475. [Google Scholar] [CrossRef]
  96. Pimentel, D.; Whitecraft, M.; Scott, Z.R.; Zhao, L.; Satkiewicz, P.; Scott, T.J.; Phillips, J.; Szimak, D.; Singh, G.; Gonzalez, D.O.; et al. Will Limited Land, Water, and Energy Control Human Population Numbers in the Future? Human Ecol. 2010, 38, 599–611. [Google Scholar] [CrossRef]
  97. Tucker, C.K. A Planet of 3 Billion: Mapping Humanity’s Long History of Ecological Destruction and Finding Our Way to a Resilient Future: A Global Citizen’s Guide to Saving the Planet; Atlas Observatory Press: Alexandria, VA, USA, 2019; 342p, ISBN 10-0578491427. [Google Scholar]
  98. Lianos, T.P.; Pseiridis, A. Sustainable welfare and optimum population size. Environ. Dev. Sustain. 2016, 18, 1679–1699. [Google Scholar] [CrossRef]
  99. Dasgupta, P.; Dasgupta, A.; Barrett, S. Population, Ecological Footprint and the Sustainable Development Goals. Environ. Resource Econ. 2021, 84, 659–675. [Google Scholar] [CrossRef]
  100. Dasgupta, P. Time and the Generations: Population Ethics for a Diminishing Planet; Columbia University Press: New York, NY, USA, 2019; Available online: http://cup.columbia.edu/book/time-and-the-generations/9780231160124 (accessed on 17 July 2023).
  101. Wilson, E.O. Half-Earth: Our Planet’s Fight for Life; WW Norton & Company: New York, NY, USA, 2017; 272p, ISBN 9781631492525. [Google Scholar]
  102. Clugston, C.O. Industrialism—Our Commitment to Impermanence; Booklocker Publishing: St. Petersburg, FL, USA, 2023; 246p, ISBN 10-1958889652. [Google Scholar]
  103. Michaux, S. The Mining of Minerals and the Limits to Growth; Geological Survey of Finland: Loppi, Finland, 2021; Available online: https://tupa.gtk.fi/raportti/arkisto/16_2021.pdf (accessed on 17 July 2023).
  104. The Economist. Global Fertility Has Collapsed, with Profound Economic Consequences. The Economist, 1 June 2023. Available online: https://www.economist.com/leaders/2023/06/01/global-fertility-has-collapsed-with-profound-economic-consequences (accessed on 17 July 2023).
  105. Leatherby, L. How a Vast Demographic Shift Will Reshape the World. New York Times, 16 July 2023. Available online: https://www.nytimes.com/interactive/2023/07/16/world/world-demographics.html (accessed on 17 July 2023).
  106. O’Sullivan, J.N. Silver Tsunami or Silver Lining?—Why We Should Not Fear an Ageing Population; Discussion Paper, Sustainable Population Australia; National Library of Australia: Canberra, Australia, 2020; ISBN 978-0-6487082-3-0. Available online: https://population.org.au/discussion-papers/ageing/ (accessed on 17 July 2023).
  107. Turner, A. Falling Fertility Rates in the US Don’t Mean Economic Collapse. Here’s Why. World Economic Forum, 13 June 2018. Available online: https://www.weforum.org/agenda/2018/06/america-s-baby-bust (accessed on 17 July 2023).
  108. Kluge, F.; Zagheni, E.; Loichinger, E.; Vogt, T. The Advantages of Demographic Change after the Wave: Fewer and Older, but Healthier, Greener, and More Productive? PLoS ONE 2014, 9, e108501. [Google Scholar] [CrossRef] [PubMed]
  109. Götmark, F.; Cafaro, P.; O’Sullivan, J. Aging Human Populations: Good for Us, Good for the Earth. Trends Ecol. Evol. 2018, 33, 851–862. [Google Scholar] [CrossRef]
  110. Heinberg, R. Why News of Population Decline and Economic Slowdown Isn’t Necessarily a Bad Thing. The Fifth Estate, 1 March 2023. Available online: https://thefifthestate.com.au/columns/spinifex/why-news-of-population-decline-and-economic-slowdown-isnt-necessarily-a-bad-thing/ (accessed on 17 July 2023).
  111. Steffen, W.; Richardson, K.; Rockström, J.; Cornell, S.E.; Fetzer, I.; Bennett, E.M.; Biggs, R.; Carpenter, S.R.; De Vries, W.; De Wit, C.A.; et al. Planetary boundaries: Guiding human development on a changing planet. Science 2015, 347, 1259855. [Google Scholar] [CrossRef]
  112. Kohler, H.-P.; Behrman, J.R. Benefits and Costs of the Population and Demography Targets for the Post-2015 Development Agenda in Prioritizing Development: A Cost Benefit Analysis of the United Nations’ Sustainable Development Goals; Lomborg, B., Ed.; Cambridge University Press: Cambridge, UK, 2018; pp. 375–398. [Google Scholar] [CrossRef]
  113. Grant, J.P. State of the World’s Children 1992: 10 Propositions for Ending Extreme Poverty among One Quarter of the World’s People; UNICEF: New York, NY, USA; Oxford University Press: Oxford, UK, 1992; Available online: https://www.unicef.org/reports/state-worlds-children-1992 (accessed on 17 July 2023).
  114. Speidel, J.J.; O’Sullivan, J.N. Advancing the Welfare of People and the Planet with a Common Agenda for Reproductive Justice, Population, and the Environment. World 2023, 4, 259–287. [Google Scholar] [CrossRef]
Figure 1. Conceptual models of planetary boundaries. (a) The nine earth system boundaries proposed by the Stockholm Resilience Centre [8], indicating the extent to which human impacts have exceeded safe levels for at least six of the nine. Creative Commons licence CC BY-NC-ND 3.0, Credit: Azote for Stockholm Resilience Centre, based on analysis in Wang-Erlandsson et al., 2022 [9]. (b) Doughnut economics, defining a “safe and just space for humanity” between the minimum provision of human needs (“social foundation”) and the maximum tolerance of planetary biophysical boundaries (“ecological ceiling”). Source: Raworth (2018) [7].
World 04 00034 g001
Figure 2. United Nations projections of world population, according to World Population Prospects 2022. The “medium fertility” model is here labelled “median”, while the “high fertility” and “low fertility” models are “+0.5 child” and “−0.5 child”, respectively. Source: [34].
World 04 00034 g002
Figure 3. The world population as it was estimated in each revision of World Population Prospects (WPP) from 2010 to 2022. The pink line connects each revision’s estimate of the current population. Blue dashed lines are the projected growths anticipated in each of those revisions, according to the medium fertility model.
World 04 00034 g003
Figure 4. The annual increment of growth in world population, estimated (solid lines) and projected (dashed lines) by each edition of UN World Population Prospects from 2010 to 2022.
World 04 00034 g004
Figure 5. Population projections from the United Nations 2004, 2010 and 2017 revisions, showing that the dramatic rise in expected World population since 2004 (blue lines) is mainly due to revised estimates for Africa (pink lines).
World 04 00034 g005
Figure 6. The relationship between each country’s total fertility rate (TFR, average births per woman in her lifetime) and the rate of fertility decline (the difference between the fertility five years before and after the indicated date), in different time periods. Past estimates are marked by the country’s ISO two-letter code; symbols are used for projected data. Projected fertility is given in symbols. All data from WPP2022 [32].
World 04 00034 g006
Figure 7. The relationship between fertility and its rate of decrease, anticipated in 2032 by medium fertility projections from WPP2022 (blue) and WPP2015 (orange). Countries are identified by their ISO two-letter code, as listed in WPP [32].
World 04 00034 g007
Figure 8. Total fertility rate (TFR) in 2019–2021 of the 21 countries projected to contribute most to future world growth. Data compare WPP2019 (brown) and WPP2022 (blue), and a ‘rolling current estimate’ (pink).
World 04 00034 g008
Figure 9. Projections of world population by the UN, Wittgenstein Centre (SSPs) IHME and Earth4All. Data sources: [32,55,56,57].
World 04 00034 g009
Figure 10. Total fertility rate in DR Congo anticipated in 2010, 2015 and 2022 revisions of UN’s projections, and in the SSP (version 2) and IHME scenarios. The red line connects the estimated actual fertility given in each UN revision, five years before the revision date.
World 04 00034 g010
Figure 11. Contraceptive prevalence by mean years of schooling in 24 sub-Saharan countries, 1970–2015. The size of circles indicates the country’s score for family planning program strength. Source: Bongaarts and Hardee (2019) [63].
World 04 00034 g011
Figure 12. Evidence for the direction of causation relating fertility with economic advancement. (a) The change in fertility over a five-year period plotted against the GDP per capita (inflation adjusted) at the start of the period. Countries where fertility was already below two children per woman are excluded. (b) The change in GDP per capita plotted against the TFR at the start of the five-year period. For each country, data points are recorded for each five-year period with available data from 1960 to 2010. Box plots span the 25th percentile, median and 75th percentile, and whiskers extend to the 10th and 90th percentile. GDP per capita (inflation-adjusted 2005$US) are from the World Bank economic database, and fertility data from the United Nations [32].
World 04 00034 g012
Disclaimer/Publisher’s Note: The statements, opinions and data contained in all publications are solely those of the individual author(s) and contributor(s) and not of MDPI and/or the editor(s). MDPI and/or the editor(s) disclaim responsibility for any injury to people or property resulting from any ideas, methods, instructions or products referred to in the content.

