Article

Assessing Lactation Curve Characteristics of Dairy Cows Managed under Contrasting Husbandry Practices and Stressful Environments in Tanzania

by
Dismas Said Shija
1,2,*,
Okeyo A. Mwai
3,
Julie M. K. Ojango
3,
Daniel M. Komwihangilo
4 and
Bockline Omedo Bebe
1
1
Department of Animal Sciences, Egerton University, Njoro P.O. Box 536-20115, Kenya
2
Department of Animal, Aquaculture and Range Sciences, Sokoine University of Agriculture, Morogoro P.O. Box 3004, Tanzania
3
International Livestock Research Institute, Nairobi P.O. Box 30709-00100, Kenya
4
Tanzania Livestock Research Institute, Dodoma P.O. Box 834, Tanzania
*
Author to whom correspondence should be addressed.
World 2022, 3(4), 1032-1052; https://doi.org/10.3390/world3040059
Submission received: 29 September 2022 / Revised: 1 December 2022 / Accepted: 2 December 2022 / Published: 6 December 2022

Abstract

:
The ability of smallholder dairy farming systems (SHDFS) to achieve desirable lactation-curve characteristics is constrained or reduced by environmental stresses. Under stressful production environments in the tropics, the better lactation-curve characteristics in smallholder dairy farms are a result of improved dairy genetics and husbandry practices. Better husbandry practices improve animal health and welfare status, which is important to sustain SHDFS in the tropics where dairy cattle are constantly exposed to multiple environmental stresses of feed scarcity, disease infections and heat load. In this case, lactating cows in smallholder dairy farms labelled positive deviants are expected to express lactation curve characteristics differently from typical farms, regardless of the stress levels confronted. Thus, this study tested this hypothesis with Holstein–Friesian and Ayrshire cows in two milksheds in Tanzania classified them into low-and high-stress environments. A two-factor nested research design was used, with farm (positive deviant and typical) nested within the environment. Positive deviant farms were farms that performed above the population average, attaining ≥0.35 Mcal NEL/d energy balance, ≥6.32 L/cow/day milk yield, ≤1153.28 days age at first calving, ≤633.68 days calving interval and ≤12.75 per 100 animal-years at risk disease-incidence density. In this study, a total of 3262 test-day milk production records from 524 complete lactations of 397 cows in 332 farms were fitted to the Jenkins and Ferrell model to estimate lactation curve parameters. In turn, the outcome parameters a and k were used to estimate lactation curve characteristics. The lactation curve characteristic estimates proved the study hypothesis. Regardless of the stress levels, cows in positive deviant farms expressed lactation curve characteristics differently from cows managed in typical farms. The scale (a) and shape (k) parameters together with peak yield and time to peak yield indicated higher lactation performance in positive deviant farms than in typical farms under low- and high-stress environments (p < 0.05). Lactation persistency was higher in positive deviants than typical farms by 14.37 g/day and 2.33 g/day for Holstein–Friesian cows and by 9.91 g/day and 2.16 g/day for Ayrshire cows in low- and high-stress environments. Compared to cows managed in typical farms, cows in positive deviant farms attained higher lactation performance under low- and high-stress; Holstein–Friesian produced 50.2% and 36.2% more milk, respectively, while Ayrshire produced 52.4% and 46.0% more milk, respectively. The higher milk productivity in positive deviant farms can be associated with the deployment of husbandry practices that more effectively ameliorated feed scarcity, heat load and disease infections stresses, which are prevalent in tropical smallholder dairy farms.

1. Introduction

Lactation curve characteristics are important in revealing the influence of genetic and environmental factors in a dairy herd. Under tropical conditions, smallholder dairy herds perform sub-optimally when under persistent exposure to the environmental stresses of heat load, nutritional scarcity and disease infections. These environmental stresses disrupt the physiology, reproductive and productive performance of dairy cows [1,2,3]. These disruptions, in Tanzania smallholder dairy farms operating low-input-low-yield production systems, are such that production performance is sub-optimal. The average production is less than 9 litres of milk per cow per day [4,5,6]. This suboptimal production performance is a widespread observation that can be detected in the expression of lactation curve characteristics.
Despite persistent exposure to environmental stresses, some farms, labelled positive deviant farms, manage to attain higher production performance than their comparable contemporaries, labelled typical farms [7,8]. The observed outperformance in positive deviant farms can be associated with the deployment of more effective amelioration of the environmental stresses. Studies of positive deviance have shown that positive deviant farmers are remarkably successful when confronting same and similar environmental stresses than typical farmers [8,9,10]. For example, Migose [11] observed that successful positive deviant farmers tended to have larger herds, yielding higher milk production per cow compared to average performing dairy farms. Positive deviant farmers used inputs (level, quality and cost management), knowledge, skills and financial stability to improve dairy husbandry practices (feeding, breeding and healthcare services) and attained higher lactation performance.
Analysing the differences in lactation curve characteristics of dairy cows managed in positive deviants and typical farms can inform on husbandry practices suited to local production circumstance for improving farm productivity. This has been articulated in several studies of positive deviance behaviour observed in ecology, agriculture and livestock [9,12,13,14]. These studies have revealed that locally determined successful management strategies can be scaled to enhance husbandry practices among smallholder farmers in order to raise agricultural and animal productivity. For instance, positive deviants may accelerate local adoption of more environmentally and friendly fodder production practices that address feed scarcity and improve animal production performance [9,12]. This presents opportunities to use a positive deviance approach to bring about change in lactation performance of dairy cattle through the processes of analysing, and then communicating, the underlying management practices.
The observed differences in production performance of dairy cattle in positive deviants and typical farms reflect differences in husbandry practices, and those husbandry practices can ameliorate the environmental stresses considerably. This minimizes the levels of disrupted physiology, reproductive and productive performance of the dairy cows, which, in Tanzania, are predominantly crossbreds of Holstein–Friesian and Ayrshire dairy cattle breeds [15]. Therefore, cows of same breed but under low- or high-level of animal husbandry would express lactation curve characteristics differently.
The lactation curve parameters of dairy crossbreeds in the tropics have been adequately modelled to generate standardized lactation curves using a wide variety of empirical linear and nonlinear parametric functions [16,17,18,19,20,21]. However, some functions may be more appropriate than others because these functions vary in their mathematical properties, processing, number of parameters, relevance to a typical lactation cycle and ability to fit a larger range of curves [22]. For this issue, some studies have assessed models that can accurately predict values for the scale and shape parameters, daily milk yield, peak day, peak yield and lactation milk yield.
Models that accurately estimate lactation curve parameters and lactation milk yield are relevant for genetic evaluation, herd management and breeding decisions for dairy cattle maintained in varied production conditions with different environmental stress levels. The Wood equation [16], the Dijkstra equation [20], Pollott model [21], and the MilkBot model [23] are all noteworthy examples of models in this area. The modified Wood’s equation, as specified by Jenkins and Ferrell (JF) [17], has the advantage of having been designed for crossbred cattle in the tropics. The JF model has been successfully used to assess lactation performance of cattle in smallholder dairy farming systems (SHDFS) in the tropics [11,24]. This model uses only two, instead of three, parameters to estimate lactation curves with minimal lactation data points [25]. The JF model is suited to differentiating lactation curve characteristics between cows managed in positive deviants and typical farms where large variation in milk records and breed composition prevails [3,24,26].
Consistent recording is time-consuming and expensive, thus farmers’ recollections of past events are sometimes used in addition to cross-sectional studies [11]. Because of these capacity challenges, relatively few records exist in smallholder farms to enable accurate assessment of the lactation curve characteristics. One record per lactation can be collected in cross-sectional studies, but for accurate assessment of lactation curve characteristics, longitudinal studies typically provide a relatively larger number of records per lactation [11]. However, whether with or without access to cross-sectional or longitudinal lactation data, previous lactation curve modelling studies did not differentiate between varying levels of dairy husbadry practices nor similar husbandry practices under same and similar environmental stresses. This is important to improving the informativeness of the parameter estimates obtained for designing effective amelioration of heat load, feed scarcity and disease infections stresses that limit and reduce productivity in dairy cattle in the tropics [27,28,29,30,31,32].
Using a data-powered positive deviance approach, Shija et al. [15] has shown that positive deviant farms deploy relatively more effective husbandry practices that minimise cow exposure to environmental stresses of feed scarcity, disease infections and heat load. Building on this observation, this study tested the hypothesis that Holstein–Friesian and Ayrshire cows, and their crossbreeds, managed in positive deviants and typical farms express lactation curve characteristics differently, regardless of the stress levels they confront. The underlying assumption was that cows managed in positive deviant farms are under high-level of husbandry practices that minimise cow exposure to environmental stresses of feed scarcity, disease infections and heat load stress [15].

2. Materials and Methods

2.1. Data Source

The test-day milk yield data used to analyse the lactation curve characteristics reported in this paper were from smallholder dairy farms affiliated to the African Dairy Genetic Gain (ADGG) Project. In Tanzania, the ADGG Project is being implemented by the International Livestock Research Institute (ILRI) and Tanzania Livestock Research Institute (TALIRI) through TALIRI/ILRI Contract Research Agreement [33]. Specifically, the farms were in the eastern coastal lowlands and northern highlands milksheds of Tanzania. The eastern coastal lowland, which is the Tanga region, is classified as a high-stress environment for dairy production. This is because dairy cattle are exposed to multiple stresses, including high humidity, low altitude and high temperature, high heat load with temperature–humidity index (THI) reaching 77.29 units and high prevalence of parasitic diseases. In contrast, the northern highlands, which is the Kilimanjaro region, is classified as a low-stress environment for dairy production, with an average THI of 68.20 units [8,15]. Dairy cattle here are exposed to high altitude with a moderating effect on high tropical temperatures and bimodal rainfall patterns that support year-round high biomass supply of pastures.
In both northern and eastern milksheds, farmers keep small herds, fewer than ten heads of cattle, predominantly of Holstein–Friesian and Ayrshire and their crossbreeds. These dairy cattle breeds are the most popular with smallholder farms in Tanzania, and their test-day milk yield records over a 42-month period were accessible from the ADGG database. Crossbreeding (i.e., breeding between different breeds of animals) is practiced for upgrading through artificial insemination and bull service. Production system is predominantly mixed crop–livestock, with cut and carry stall feeding of fodder, forages, maize and bean crop residues and supplemental agro-industrial by-products. Milking is performed twice a day, and the milk is measured using a graduated milking jar (1 litre capacity) for recording the yield for every milking of each cow.
Test-day milk yield data was available from October 2016 to July 2020 in the ILRI database (https://www.adgg.ilri.org/uat/auth/auth/login (accessed on 1 August 2022)). ILR granted access to the database as part of supporting this study. The data was screened for individual animal information (date of birth, genotype, parity, calving date, milking and drying-off dates) in individual farms and production environments. Test-day milk yield data for individual cows conformed to the standard recording procedure. This requires milk being recorded on the 4th evening and the 5th morning after calving, and thereafter on the 14th evening and the 15th morning of the month, until drying-off [34]. However, test-day milk yield data for the specified monthly recording dates for the evening of the 14th and the morning of the 15th were not always available. In such cases, data were edited to remove test-day records that were collected earlier than five days after calving, in which case the subsequent TD milk yield record was considered the first test-day record. Further, where recording was more than once in a month, milk production records were removed in favour of records closest to the 14th and 15th days of recording.
After screening, the available test-day milk production data were 3262 records of 524 complete lactations for 397 cows in 332 farms. Following screening of individual records, the structure of the dataset for the farms and test-day records that proceeded to estimation of lactation curve parameters is summarised in Table 1.

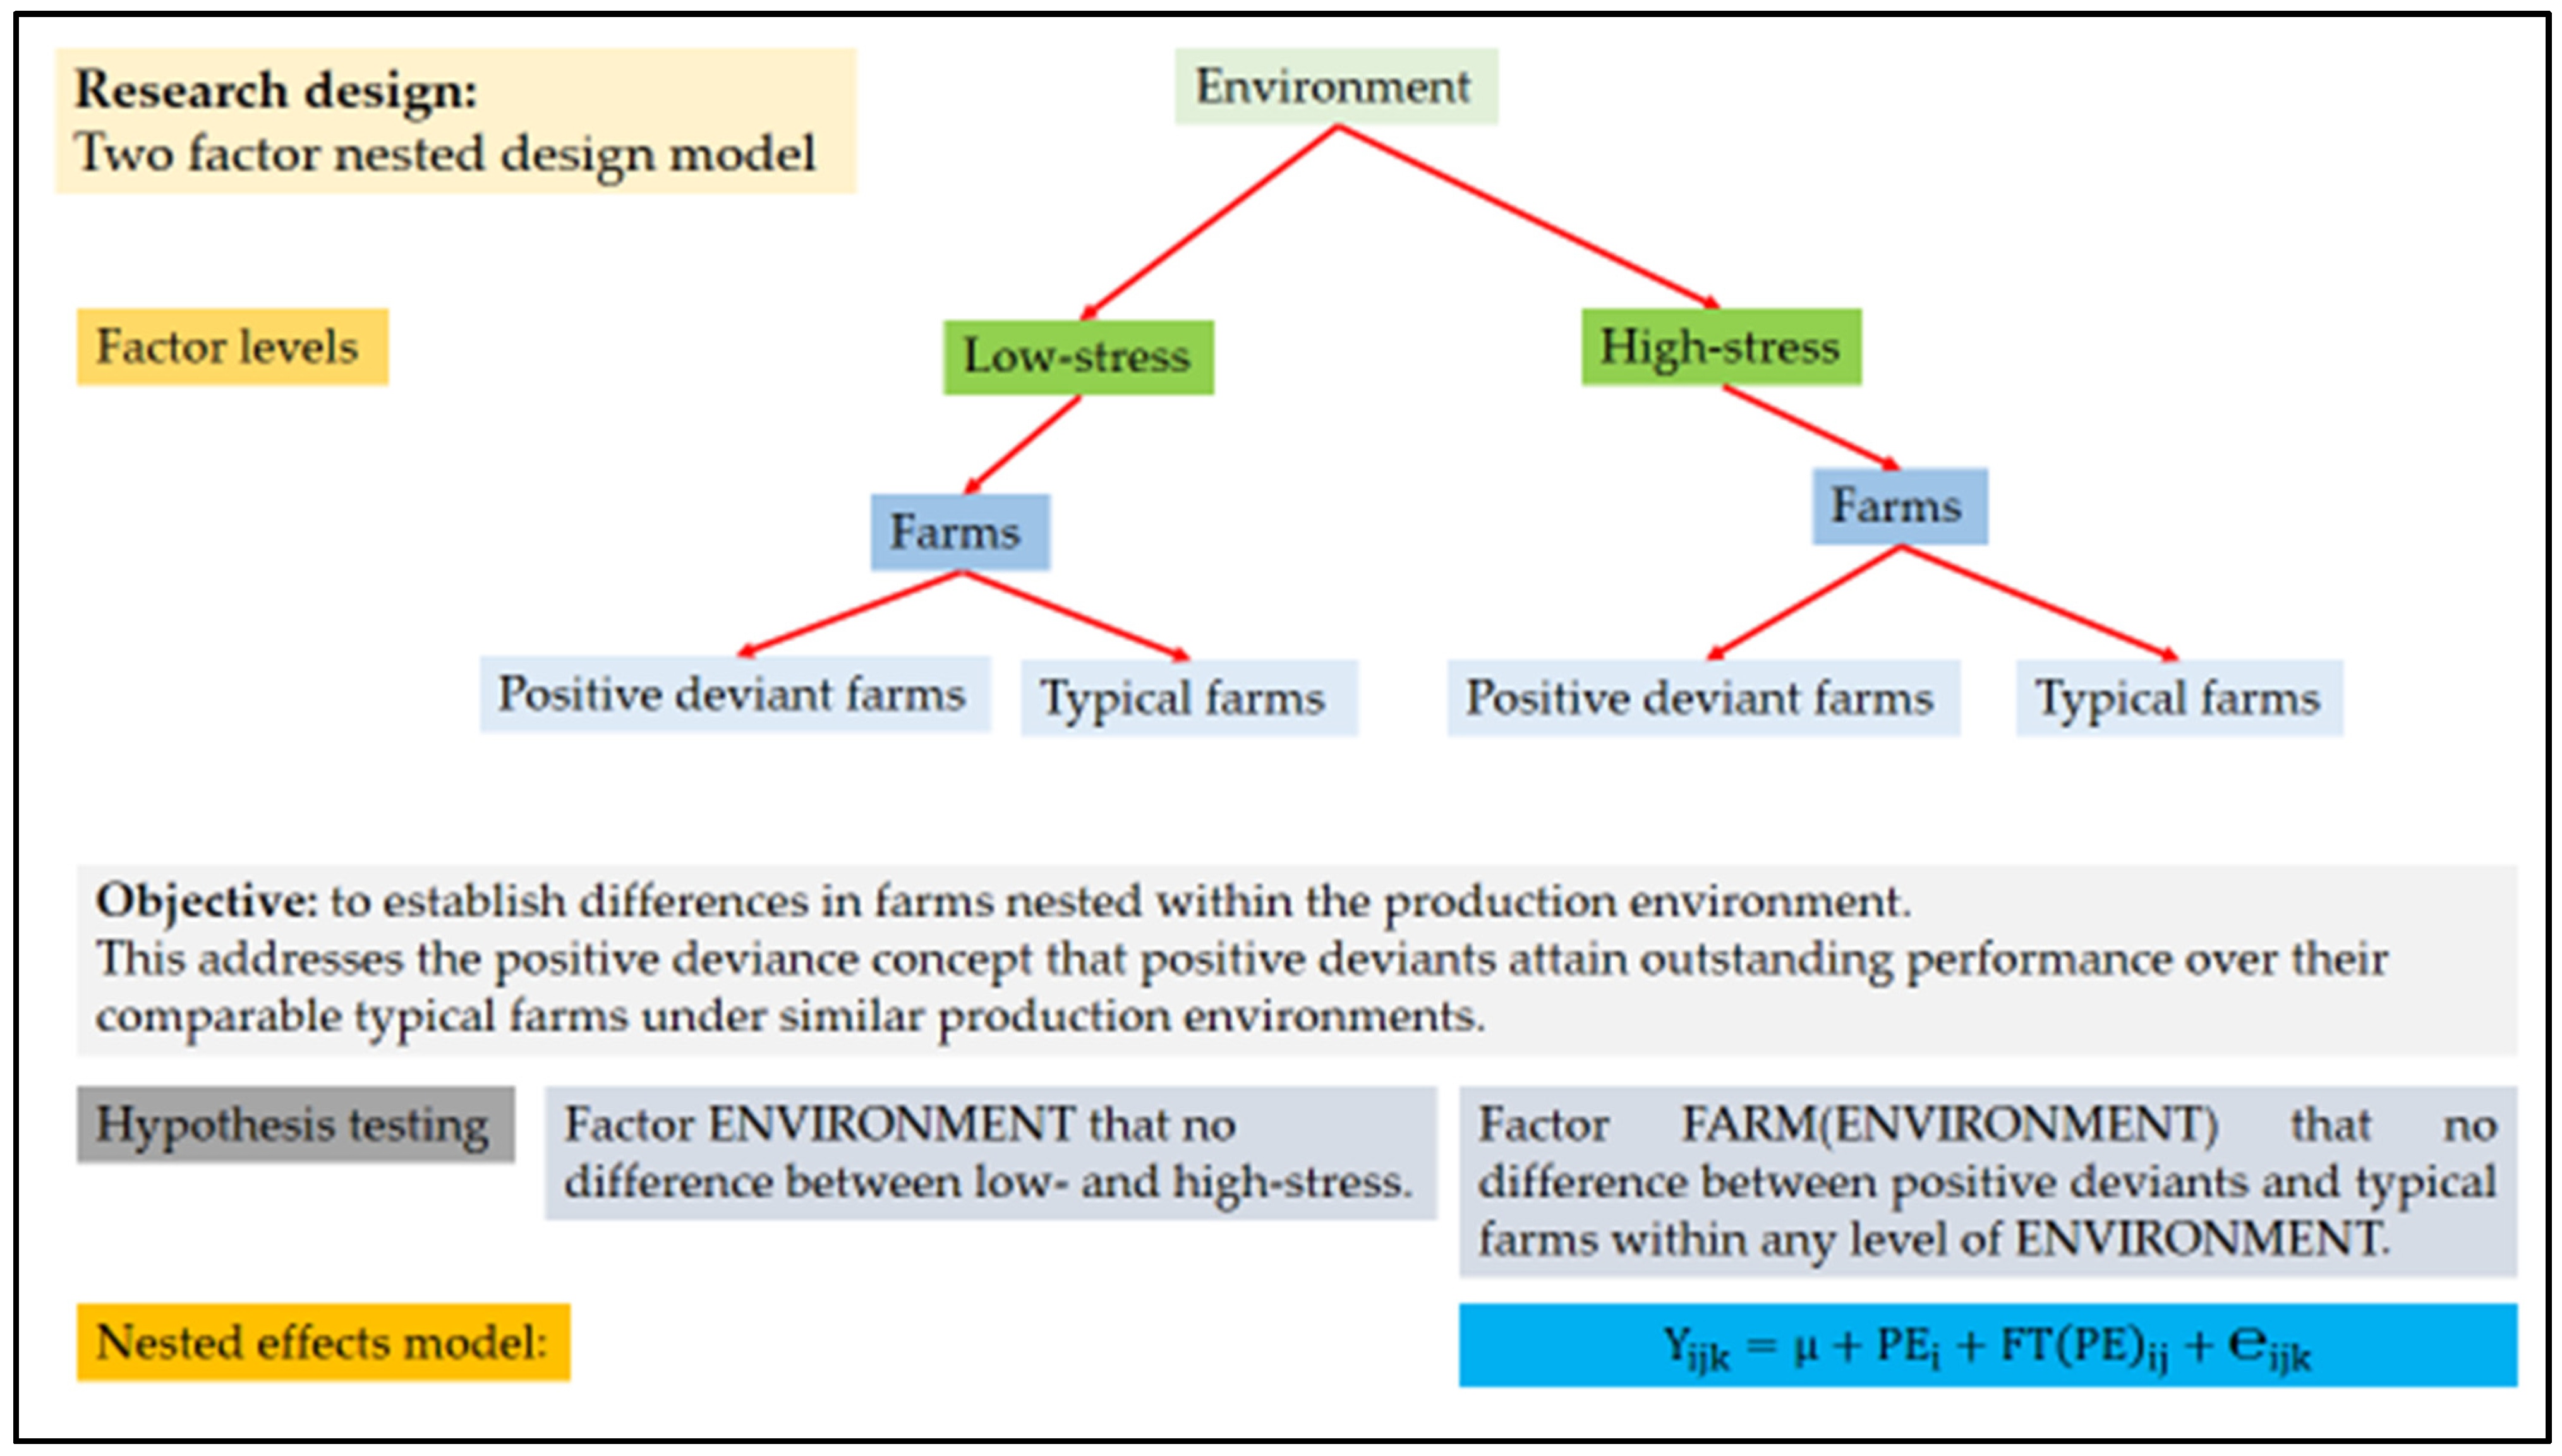
2.2. Research Design

This study builds upon a study already described by Shija et al. [8,15], detailing the data source, research design and objective identification of positive deviant farms in a large sample population. A brief description is presented here with details of the data collection on lactation milk production being reported in this paper. The study implemented a two-factor nested design model, with farm (positive deviants and typical) nested within the environment (low- and high-stress). The environment was a fixed effect while the farm nested within the environment was a random effect. Figure 1 represents a two-factor nested research design model. The experimental units were the individual farms, each with a herd of cows [35].
The positive deviant farms were objectively isolated in a random sample population (3.4%; 27/794) using Pareto-Optimality ranking technique [8]. This was a data-powered positive deviance approach facilitating the defining of positive deviant farms objectively, based on a set of five production performance indicators, implemented stepwise. First, averages for each performance indicator in each of the 794 individual farms were computed. The next step was computing overall farm averages for each performance indicator in order to set the threshold points (population mean). This yielded population threshold points as follows: ≥0.35 Mcal NEL/d (1.46 MJ NEL/day) energy balance based on 12,539 data points from 1551 lactating cows; ≥6.32 L/cow/day milk yield based on observed 1551 cows; ≤1153.28 days age at first calving based on 1625 heifers; ≤633.68 days calving interval based on 1348 records of 1118 cows; and ≤12.75 per 100 animal-years at risk disease-incidence density based on 1912 health treatment events of 849 animals [8].
Energy balance (EB) was estimated on the basis of body weight (BW) and body condition scoring (BCS). Precise EB estimates for individual cows are of great importance to monitor animal health, lactation, reproduction and feed management. In most cases, EB is usually calculated as energy input minus output (EBinout), requiring measurements of feed intake and energy output sources (milk, maintenance, activity, growth and pregnancy). Except for milk yield, direct measurements of the other sources are difficult to obtain in practice, and estimates contain considerable error sources, limiting on-farm use [36]. To identify positive deviant farms using multiple animal performance criteria [8], EB was estimated from body reserve changes (EBbody) based on BW and BCS for all lactating cows regardless of lactation phases at the farm level. Evaluation of body condition using a BCS (on a 5 scale) is a useful management tool to assess body fat stores (energy reserves) of cows [37] from 1 (thin with no detectable fat cover) to 5 (obviously over fat) for each cow, using (+) and (−) gradations between integers [38].
The BCS is a 5-, 8- or 9-point scale system that is highly related to body fat in cows [39]. Lactating dairy cows were scored on appearance and palpation of body fat stores in certain body regions of the cows to assess the amount of tissue under the skin. Classifiers gave attention to the fatty tissue layer at the end of the spinous and transverse processes (loin area), the hip and the pinbones and the tailhead area. Body condition scoring during the lactation period provides a good indication of an animal’s nutritional status. Excessive body condition has been recognised as a risk factor for health problems in dairy cows and as a factor modulating feed intake and milk production. On the other side, excessive loss of body condition has been associated with lowered reproductive performance and reduced milk production in dairy cattle. Equation (1) was used to convert a BCS scale of 1 to 5 (BCS[1–5]), to a BCS scale of 1 to 9 (BCS[1–9]).
BCS [ 1 9 ] ,   i = ( BCS [ 1 5 ] , i 1 ) × 2 + 1
where BCS [ 1 5 ] ,   i is the BCS on a scale of 1 to 5 and BCS [ 1 9 ] ,   i , is the BCS on a scale of 1 to 9. As adopted by Tedeschi et al. [39], shrunk BW (SBW) was computed from BW as shown in Equation (2) and empty BW (EBW) was estimated from SBW as shown in Equation (3), which was then used to predict body reserves,
SBW i = BW i × 0.96
EBW i = SBW i × 0.851
where SBW i is shrunk BW (kg) and EBW i is empty BW (kg).
The empirical reserves model, which is based on the equations published by Tedeschi et al. [39], in which BCS[1–9] and EBW were used to compute the amount of body fat (TF) and protein (TP):
TF i = ( 0.037683 × BCS [ 1 9 ] , i ) × EBW i
TP i = ( 0.200886 0.0066762 × BCS [ 1 9 ] , i ) × EBW i
where EBW i is empty BW (kg), TFi is the amount of body fat (kg), BCS[1–9], is the BCS (on a scale of 1 to 9), and TPi is the amount of body protein (kg). A change in BW for mature lactating cows does not always signify a change in tissue reserves, and the opposite is also true. For example, Andrew et al. [40] analysed slaughter data of dairy cows and reported as much as 40% variation in energy with no change in BW. This is likely because the gut fill varies from 2.5 to 4 kg/kg of increase in dry matter intake [41,42], which may offset the weight loss attributable to tissue mobilization by an increase in dry matter intake during lactation. Due to this disconnection between actual BW and energy reserves, Tedeschi et al. [39] estimated EBW and energy reserves using BCS changes. In this case, Shija et al. [8] obtained the total energy balance values as follows:
TE i = 9.367 × TF i + 5.554 × TP i                                                      
where TFi is the amount of body fat (kg), TPi is the amount of body protein (kg), TEi is the total energy (Mcal), and the subscript i is the ith period.
Because any discrepancy between energy inputs and outputs must be met by changes in body energy, EBbody (MJ/d) was assessed from changes in body fat and body protein. Energy balance was measured using a proxy indicator variable, i.e., the variation in total energy balance (change in total energy balance (ΔTEB)) per cow in the farm and was calculated using an adapted equation of Tedeschi et al. [39]:
Δ TEB i = TE i TE i 1 ; i 2
where ΔTEBi is a change in total energy (Mcal), and subscripts i and i − 1 represent actual and previous TE values, respectively. A negative ΔTEB value indicates a situation where reserve energy is mobilized for milk production. The amount of milk produced supported from mobilized reserves is added to the diet-allowable milk production. A positive ΔTEB value indicates that the energy intake is greater than the energy required for milk production. In this case, part of the available energy is used for reserve deposition besides milk production. Therefore, the amount of energy deposited can be used to reduce the diet-allowable milk production.
Following the estimation of performance indicator variables, a standardization of the averages of each performance indicator for each of the 794 individual farms obtained in step one followed, using z-transformation to obtain z-scores [8,13]. These performance scores for the 794 sample farms were subjected to the Pareto-optimality ranking algorithm [14], to maximize total energy balance and daily milk yield while minimizing age at first calving, calving interval and disease-incidence density. This matched management goals of increasing productivity and livelihood benefits in smallholder dairying.
With these criteria, farms subjected to Pareto-optimality ranking were assigned Pareto-optimal solutions rank 1 only when they were not dominated by other farms for the performance-indicator variables. These farms outperform other farms with equivalent characteristics in at least one dimension without being outperformed in any other dimension. Next, the farms with rank 1 are removed from the set and the procedure is repeated by identifying the next set of non-dominated farms, which are then assigned to rank 2. This ranking procedure is repeated until the sample farms are all ranked. The resulting farms are called Pareto-optimal or non-dominated solutions.
However, Pareto-optimality ranking identifies a wide array of Pareto-optimal solutions, including extreme cases, which are solutions that excel in one indicator but perform very poorly in all the others. To deal with this, a comparison was made between the individual farm performance obtained in step one and the threshold points set in step two to identify the truly positive deviant farms. This involved sorting individual farms on multiple indicator variables to select farms that had attained milk yield and energy balance above the threshold points, while their disease-incidence density, age at first calving and calving interval were below the threshold points. This approach thus defined a narrow set of truly positive deviant farms with consistent outstanding performances for each of the indicator variables simultaneously from rank 1. To increase the number of isolated truly positive deviant farms for subsequent analysis, all farms that scored rank 2 and 3 with all other criteria held constant were included in selection, ending up with true positive deviant farms that consistently outperformed above threshold points among Pareto-optimal solutions on five performance indicators simultaneously [8].
In turn, positive deviants and typical farms were compared to assess their differences in dairy productivity, yield gap, total benefits and management practices that positive deviant farms deploy differently from typical farms to ameliorate local prevalent environmental stresses. Figure 2 presents a methodological framework followed to identify positive deviant farms and management practices in smallholder dairy farming system. Boxes in the right indicate methods used in the corresponding steps from data collection through characterisation of management practices for environmental stresses [8,15].

2.3. Estimating Lactation Curve Parameters and Lactation Milk Production

Lactation curve parameters were estimated with the modified Wood‘s equation as specified by Jenkins and Ferrell [17,43]. The choice of this model was on the basis that the model accommodates two parameters (Equation (1)), and can estimate lactation milk production with at least three data points, sparsely distributed [25]. The model is suited to dairy crossbred cattle in the tropics, which dominated in the sample. The JF model fitted to estimate the lactation curve parameters was in the form:
Y ( n ) = n a × e k × n
where Y(n) is the milk production observed on the nth week after calving, n is the number of weeks in lactation after calving, a is a curve scale parameter, and k is a curve shape parameter, indicating lactation persistence, while e is the exponential function (Euler’s number which is the root of natural logarithms, approximately 2.718). The scale and shape parameters were estimated using the Marquardt method with starting values of 0.270 and 0.127 for a and k obtained for Jersey × (Angus or Hereford) that were previously reported [17]. In turn, the outcome parameters a and k were used to calculate parameter characteristics of a lactation curve defined by JF [17].
The lactation curve characteristics estimated included time to peak lactation (peak week), peak milk yield attained (peak yield), and total lactation milk production truncated to a standard of 305 days (LMP305). In this case, LMP305 is considered equivalent to an integral area of the fitted lactation curve from calving up to 305 d lactation period. Computation of LMP305, using Equation (11), specified 43.57 as the number of weeks for a 305-day lactation period for a standard lactation period, and derived characteristics of the lactation curves with the following equations:
Peak   week = 1 k
Peak   yield = 1 a k e
LMP 305 = 7 a k × ( 43.57 e k 43.57 + 1 k e k 43.57 1 k )
Lactation persistency was also computed to measure the ability of lactating cows to sustain higher levels of milk production from the time of peak lactation to the last day of milking. This is the linear average daily change in milk production (g/d) between peak lactation and drying off [24,26]:
Persistency ,   g / d = ( yield   last   day   lactation   measured yield   at   peak   lactation days   from   peak   lactation   to   last   day   lactation   measured   ) 1000
As defined in the present study, larger negative estimates for persistency indicate a more rapid loss in daily milk production from the time of peak lactation to the end of the lactation period [26].

2.4. Statistical Analysis

This study assessed lactation curve parameters (scale and shape parameters), observed milk yield, predicted milk yield, time to peak yield, peak yield, lactation persistency and total lactation milk production (LMP305) of Holstein–Friesian and Ayrshire raised in positive deviants and typical farms nested within low- and high-stress environments. Estimates of the curve parameters a and k and the derived curve characteristics were analysed with a Linear Mixed Model to test for lactation performance differences between the environments, and between positive deviants and typical farms within low- and high-stress environments. The two-factor nested design model fitted was in the form:
Y ijk = μ + PE i + FT ( PE ) j ( i ) + kj ( i )
where, Y ijklm is any of the lactation performance variables. These included daily milk yield, model predicted milk yield, scale and shape parameters, a and k, time to reach peak week, peak yield, persistency and LMP305. µ is the overall mean, PE i is a fixed effect of environment, FT ( PE ) j ( i ) is the random effect of farm nested within the environment and kj ( i ) is the random error. A mixed model analysis of variance of this model was performed in SAS Statistics software [44]. Differences in least square means were tested using Fisher’s least significant difference, with PDIFF option [45]. Next, least square means for scale and shape parameters (a and k) were used in the computation to generate lactation curves.

3. Results

The lactation curve parameters for Holstein–Friesian breed are presented in Table 2, and those for Ayrshire breed are presented in Table 3, for cattle managed in positive deviants and typical farms under low- and high-stress environments. Both observed and predicted lactation parameters reveal that lactation performance was consistently better (p < 0.05) in positive deviant farms than in typical farms, and in low-stress than in high-stress level environments. Exceptions (p > 0.05) were observed in days to peak milk yield of Holstein–Friesian under low-stress environment and in peak milk yield of Ayrshire under high-stress environment. While Holstein–Friesian consistently attained better lactation performance (Table 2) under low-stress than under high-stress environment (p < 0.05), Ayrshire consistently did not (p > 0.05) under low- and high-stress environments (Table 3). Compared to typical farms, positive deviants realised 1339 litres more milk in 305-d lactation (4008 vs. 2669 L) and 5.6 L more daily milk (14.3 vs. 8.7 L/cow/day) under low-stress environments. Under high-stress environments, positive deviants realised 871 litres more milk in 305-d lactation (3275 vs. 2604 L) and 3.0 litres more daily milk (11.0 vs. 8.0 L/cow/day).
Cows managed in positive deviant farms attained higher observed daily milk yield (MPt) than those managed in typical farms (p < 0.05). Evidence of this is that Holstein–Friesians in positive deviant farms produced 5.83 litres more milk in low-stress environments and 3.24 litres more milk in high-stress environments (Table 2), and Ayrshire breeds produced 4.41 litres more milk in low-stress environments and 3.48 litres higher in high-stress environments (Table 3). The model prediction minimised bias (observed–predicted) to between 5 and 7% for Holstein–Friesian cows (Table 2) and to between 4 and 8.5% for Ayrshire cows (Table 3) in both positive deviant and typical farms.
Cows managed in positive deviant farms attained higher peak milk yields than those managed in typical farms. This is observed in Holstein–Friesian cows attaining 6 litres more in low-stress environments and 3.4 litres more in high-stress environments (Table 2) whereas Ayrshire cows attained 4 litres more in low-stress environments and 2.9 litres more in high-stress environments (Table 3). Regardless of the stress levels, cows managed in positive deviant farms consistently attained peak milk yield 0.5 to 5.7 weeks later than those managed in typical farms. For Holstein–Friesian, peak milk yield was attained at 15.2 to 15.4 weeks in positive deviant farms compared to 14.1 to 14.9 weeks in typical farms (Table 2). For the Ayrshire (Table 3), the peak milk yield was attained at 17.5 to 19.3 weeks in positive deviant farms compared to 12.7 to 13.6 weeks in typical farms.
Figure 3 and Figure 4 are lactation curves of Holstein–Friesian and Ayrshire cattle breeds managed in positive deviants and typical farms under low- and high-stress environments. Lactation curves indicated that milk production was higher under low-stress compared to high-stress environment for both Holstein–Friesian and Ayrshire cattle breeds (Figure 3) and milk production was consistently higher in positive deviant farms than in typical farms for both Holstein–Friesian and Ayrshire cattle breeds (Figure 4). This is further observed in the low scale and shape parameters, indicating that both Holstein–Friesian and Ayrshire cows were more productive in positive deviants than in typical farms under both low- and high-stress environments (Figure 4).
Estimated lactation length and persistency are presented in Table 4. Larger negative values for lactation persistency indicate a more rapid decline in daily milk yield from the time of peak lactation until the last day of lactation. In contrast, a positive or even a smaller negetaive value indicates a slow descending rate, and this is desirable for optimising total lactation milk production because of higher daily milk yield from peak to the day of drying-off. Results show that lactation persistency was consistently slower-descending (smaller negative values) in positive deviant farms compared to those in typical farms under low- and high-stress production environments, though they were not significantly different (p > 0.05). It is further observed that lactation persistency had a slower descending rate in positive deviant farms than in typical farms for both Holstein–Friesian and for Ayrshire cows, regardless of the environmental stress levels. Though not significant, a relative numerical difference in lactation persistency of Holstein–Friesian cows was 14.37 g/day and 2.33 g/day more decline in typical farms over positive deviant farms in low- and high-stress environments, respectively, whereas for Ayrshire cows it was 9.91 g/day and 2.16 g/day more decline in low- and high-stress environments, respectively. The lactation persistency with slow descending rate means a lower decrease in milk yield in positive deviants compared to those in typical farms under low- and high-stress dairy-production environments.
The overall lactation length (Table 4) in this study was 454 days for Holstein–Friesian and 472 days for Ayrshire dairy cattle, revealing a practice of extended milking of cows. However, lactation lengths were somewhat shorter in positive deviant farms (range 428–457 days) than in typical farms (range 450–509 days). However, a marked exception was observed in typical farms for Ayrshire cattle managed under high-stress environments, where lactation length was about 10 days longer in positive deviant farms.

4. Discussion

The popularity of Holstein–Friesian and Ayrshire dairy cattle breeds with smallholder farmers has been associated with their commercial attributes for high milk yield potential, suited to supplying a household with quality nutrition and income where milk market price is on a volume basis [3,46]. The fitted JF model produced typical lactation curves from the milk yield test-day data of Holstein–Friesian and Ayrshire cows managed in positive deviants and typical farms under low- and high-stress environments. The model prediction minimised bias (observed–predicted) to between 4 and 8.5% for Holstein–Friesian (Table 2) and Ayrshire (Table 4) cows managed in both positive deviant and typical farms under low- and high-stress environments. This further provides evidence of the suitability and capability of the JF model to predicting milk yield with good accuracy for cows in smallholder dairy farms in the tropics.
The choice of JF model was because the model is suited to the production circumstance in the tropics, where data scarcity and missing values are frequent in smallholder dairy farms. The JF model has an added advantage of computing lactation milk yield standardised to 305-days, thus allowing to discount for cases of either shorter or protracted lactation lengths. In this study, lactation lengths were generally long, with averages varying from 428 to 509 days, depending on the levels of dairy husbandry standards and stress levels in the production environment. Long lactation lengths reflected the practice of extended milking of cows, which, to smallholders, is a livelihood strategy of assuring a steady supply of milk for household nutrition and income [3,46]. For this, smallholder dairy farming practices extended lactations to optimise the output of high-yielding cows [47]. Improved dairy cows can maintain high milk yields for longer proportion of lactation, though these animals can be affected by an extended period of negative energy balance. Some studies have shown that effective feeding management practices are necessary if an extended lactation system is to yield a desired levels of milk production [15,47]. Following extended lactation management strategy, some benefits such as more spread of income across the year can be realized by farmers. In addition, an extended lactation strategy enhances animal welfare by minimising stresses associated with the higher prevalence of reproductive and productive diseases [48]. Some researchers contend that the adoption of extended lactation presents an alternative strategy for resolving these issues [49]. However, the suitability of an extended lactation strategy will depend on a number of factors, such as the potentiality of a cow for milk production, herd size and the ability of farmers to supply sufficient quantities and well-balanced feeds for lactating cows.
The lactation curve characteristics derived from the test-day data proved the hypothesis that was tested in this study. Dairy cows in positive deviant farms expressed lactation curve characteristics differently from those cows managed in typical farms under similar level of environmental stresses. The scale (a) and shape (k) parameters for both Holstein–Friesian and Ayrshire cows indicated that lactating cows were more productive in positive deviant farms than in typical farms under both low- and high-stress environments. For the 305-day total lactation milk production, positive deviant farms attained higher milk yield than typical farms (p < 0.05), meaning more improved animal genetics and nutrition enhanced dairy productivity in positive deviants as compared to typical farms [15,48]. For example, Holstein–Friesian produced 50.2% more milk in low-stress environments and 36.2% more milk in high-stress environments (Table 2), whereas Ayrshire produced 52.4% more milk in low-stress environments and 46% more milk in high-stress environments (Table 3; Figure 4). These findings are in line with the results of other researchers working in SHDFS. For example, pure Holstein cows at higher THI were observed to have a reduced daily milk yield and peak milk yield in a rate of 23.8% and 12.9% compared to those in lower THI conditions in Egypt [50]. This is because dairy cows have fewer chances to fight off heat stress during the lactation period, so it has the greatest impact on milk production, especially during the first lactation phase. In addition, a negative energy balance in dairy cows at the start of lactation can be exacerbated by the creation and emission of a greater quantity of thermal energy during a period when animals consume less feed [51]. For this reason, greater sensitivity of Holstein–Friesian and Ayrshire genotypes to heat stress caused a reduced productivity of cows in high-stress environments compared to those in low-stress environments as observed in this study.
Holstein–Friesian and Ayrshire cattle breeds had consistent lactation persistency, indicating a slower decline in milk yield after reaching peak yield in positive deviant farms compared to those cows managed in typical farms, and under low-stress environment compared to high-stress environment. Higher production performance in positive deviant farms would suggest differences in dairy cattle husbandry between positive deviants and typical farms [52]. In the positive deviant farms, cattle husbandry practices were better than were in the typical farms [15,32]. In contrast, lower production performance under high-stress environments would suggest greater production limitation resulting from exposure to high-level environmental stresses of heat load and disease infections found in the dairy-production environments classified a high-stress, which was the Tanga coastal lowlands of Tanzania [53].
Management practices mostly deployed to ameliorate environmental stresses include selection of tolerant genotype that matches with the production environment, feeding, housing and regular animal health services [3,28,53,54]. For example, as observed in this study, the higher daily milk yield, peak yield and lactation milk yield estimates with smaller negative lactation persistency in low-stress environments could be associated with relatively better feeding practices, adequate spacing per animal to allow air movement in the cowshed and frequently sourcing professional animal health services [15]. In contrast, the higher THI (77.29 THI units) and disease incidence rate (9.55 per 100 animal-years at risk) as observed earlier in the high-stress environment could be related with the reduction in production performance [8,32], especially for Holstein–Friesian cattle breeds. Persistent exposure of dairy cattle to heat load and disease infections stresses are the causes of a reduction of milk production performance in dairy cattle [3,53]. The higher THI is associated with poor milk production because of elevated blood insulin and protein catabolism [2,55]. Elevated blood insulin and protein catabolism negatively affect milk synthesis. Further, persistent exposure to heat load and disease incidence lowers natural immunity making animals more vulnerable to disease infections. Disease infections disrupt the physiology and lactation performance of dairy cows by interfering cell proliferation responsible for milk synthesis which defines the lactation curves. This is especially an important aspect for consideration in high-stress environments where dairy cattle are constantly exposed to the level of mild to moderate heat stress (77.29 THI units). With exposure of a lactating dairy cattle to such THI range, the prevailing level of heat load stress is sufficient to cause depressed feed intake, even during the periods of very high wind speed in the coastal zone [53]. Depressed feed intake caused by heat stress cannot support higher daily milk yield, peak yield as well as total lactation milk yield of dairy cattle in high-stress environments compared to those in low-stress environments.
The higher milk yields attained from dairy cattle managed in low-stress environments than those in high-stress environments corroborate with research findings previously observed in SHDFS in Indonesia. The study reported lower milk yields (8.3 kg/cow/day) for cows managed in lowland farms than that of the highland farms (13.5 kg/cow/day) [56]. However, the study only made a simple comparison between the lowland and highland farms without taking into account the effects of other confounding variables such as the random effect of farm nested within production environment. Thus, the observed differences in lactation curve characteristics of the current study reflect the great influences of production environments and animal husbandry practices to which dairy cattle are persistently exposed to. This brings to fore the necessity to implement appropriate management and breeding strategies to optimise the benefit of maternal ability within the breeding system. The results of this study provide some evidence that the improved performance of dairy cows in low-stress as compared to high-stress production environments can be associated with effective ameliorative management practices.
Effective ameliorative management practices that were observed in the study areas include better feeding practices, floor spacing per animal that create suitable microclimate in the cowshed and high-quality animal health services [15]. In addition, the variation in climatic conditions (for example, temperature, humidity and rainfall) between production environments affects genetic potential of dairy cattle as well as the availability and quality of forages [24]. It follows that dairy cattle reared under low-stress environments could easily meet their nutritional requirement, being in a favourable climate for high productivity and quality forage. For farms in high-stress environments, it becomes necessary to invest more in management practices that minimise the effects of environmental stresses affecting animal welfare and lactation performance.
The lactation curve characteristics obtained in this study indicated higher lactation performance of cows in positive deviant farms compared to typical farms. The higher lactation performance means that a lower milk yield gap is realised in positive deviant farms compared to typical farms. This lower yield gap was attained with deploying better animal husbandry practices including feeding, health, watering and housing [8,15,32]. Good animal husbandry ameliorates the environmental stresses to enable dairy cows express their genetic potential to a greater degree [57].
The findings of the current study agree with the earlier results obtained from different dairy cattle genotypes, where positive deviant farms consistently attained higher milk yield than typical farms [8]. For example, farmers who adopt challenge feeding strategy among their high yielding cows also increase peak milk yield, realise a slow descending milk yield after peak yield and subsequently higher lactation milk yield [43]. This is because dairy cows have higher feed demands during lactation period to meet nutrients requirements for maintenance and production [58]. Thus, effective management practices that meet these higher nutritional requirements for energy and metabolisable protein would be the adoption of challenge feeding. In implementation, challenge feeding is feeding large quantities of well-balanced diet through a combination of locally available forage with concentrates supplementation to support milk synthesis, particularly during early- and mid-lactation periods to attain optimum milk yields. These observations position positive deviant farms as local role models for innovation and supporting up-scaling to improve dairy cattle farming. Thus, the results of the current study highlight the significance of bottom-up policy developments for transforming the food system in a way that supports food sovereignty and boosts smallholder farmers’ incomes.
Previous studies have reported that when energy availability increases, the rate of increase in lactation milk yield increases as well [43,53,59]. This is an indication of a strong relationship between feeding management practices and milk production. Moreover, well fed lactating cows on a positive total energy balance at calving period tend to resume oestrous earlier and therefore significantly improve both milk and calf-crop production per life-time. It thus follows that farmers need good knowledge of dairy feeding to offer a ration with crude protein content between 14 and 16%, and 10 MJ/kg DM as the minimum metabolisable energy that cows require for production and maintenance [60]. This is a responsibility that extension service can offer to farmers through capacity building in ration formulation to ensure that dairy cattle are fed with a well-balanced diet that can meet nutritional requirement for growth, maintenance and production.
Persistency, which is a measure of the average rate of decline in milk yield from peak time, was consistently slower-descending in positive deviants compared to those in typical farms under low- and high-stress production environments. In lactation milk yield, a slow-descending persistency indicates a slow rate of decline. This is in contrast to a larger negative value that indicates a rapid rate of decline [26,61]. Although the difference was not significant, lactating cows in positive deviant farms had a slower-descending rate of persistency, which implies that cows had relative greater lactation persistency, were reaching peak time later and thus realised greater peak yield. This is relative to cows in typical farms, though the observed differences were not statistically significant.
The observed lactation performances in this study were better in comparison to earlier observed mean peak yields that were between 7 and 9 kg/day, which occurred earlier in 6 weeks postcalving, with lactation persistency of –52 to –41 g/day [26]. In the present sample, lactation persistency was of slower rate, ranging from −30.34 to −15.97 g/day for dairy cows in typical farms and positive deviant farms. This suggest better lactation performance because a slower-descending rate implies higher daily milk yield from peak to the day of drying-off [26,61].
Lactation persistency parameters are related to the balance of mammary epithelial cell (MEC) proliferation and apoptosis, as well as the exfoliation of MEC from the mammary epithelium into milk [62]. These processes can be influenced by production environments and management practices such as the feeding regime in a farm [62]. Among the sample farms, animal feeding, watering and health and housing were comparatively better in positive deviant farms than in typical farms [15]. What this demonstrates is that dairy cattle breeds will attain higher production potential when under improved husbandry practices [63].
Consistently better lactation performance observed for Holstein–Friesian and Ayrshire cattle breeds in positive deviants compared to those in typical farms can be linked to investing more in improved feeding, housing and animal health, aggregately bettering the animal welfare [64]. Better animal welfare contributes to lowering stress levels on lactating cows, allowing them to overcome reduced production performance related to stress and diseases [3,65,66]. This is based on the fact that the availability of more feeds, good quality housing with adequate floor spacing per animal and more sourcing for professional animal health service was positively observed on positive deviant farms [15]. In case of financial crisis such as the lack of funds which can be used to purchase forage or pay for private health services, smallholder farmers can select appropriate genotypes, set aside a proportion of land for growing improved pasture and practice feed conservation (Figure 5, Figure 6 and Figure 7), join cooperatives, and consult government extension workers or animal health service providers for healthcare management to effectively minimise production constraints. These strategies contributed to higher productivity levels in positive deviants compared to typical farms and in low-stress environments compared to high-stress environments.
In addition, farms with limited resources may be more susceptible to disease infections and loss of livestock assets because of an increased mortality rate [8,15,32]. In light of this, public infrastructure investments by increasing the budgets dedicated to SHDFS are therefore necessary to support research, extension services and farmers’ organisations in establishing co-innovative solutions adapted to local contexts and needs, such as structured crossbreeding, forage production and effective delivery of veterinary services. Crossbred animals outperform purebred animals in a number of significant traits under different stressful production environments. For instance, crossing parents from different strains or breeds frequently produces offspring that are stronger, have better growth, higher fertility, and higher production. Therefore, the development and management of smallholder dairy breeding programs should be comprehensive, directed toward existing production systems, and also focusing on enhancing husbandry practices such as feeding, watering and housing and better animal health and animal welfare.
Further, the period around lactation peak is important for the health of cows and later reproductive efficiency. A commonly reported consequence is the increase of average lactation length and lactation milk yield observed in some studies, with more than 50% of cows exceeding the 305-days period [67,68]. For the current study, high producing cows managed in positive deviant farms tended to have higher lactation peaks and also attained their peak yield later than those in typical farms. The findings show that both Holstein–Friesian and Ayrshire dairy cattle breeds took about 14.1 to 15.4 and 12.7 to 19.3 weeks to reach peak milk yield, respectively. This is about 3 months or 90 days above normal expectation of 40 to 60 days (8 weeks), or 7.6 to 11.1 weeks observed from various production environments and cattle breeds [17,43]. Other studies have reported a peak milk yield occurring from around 58 to 78 days on average [69], indicating that different models, genotypes and management practices may affect peak days and lactation milk yield.
The results of the present study corroborate with the findings of other studies which characterised lactation curves of different dairy cattle breeds. For example, time at peak yield for dairy cattle of different genotypes from different production environments and management practices estimated with various models tended to vary from around 38 to 144 days in lactation [31,61,67,70]. Results of these studies indicate higher lactation yield and persistency for cows reaching peak milk yield at later periods than cows attaining their peak milk yield earlier in their lactation cycle. Such results support the current findings in which dairy cows in positive deviant farms under low- and high-stress environments attained higher peak milk yield at later periods in lactation compared to those in typical farms.
The results of this study indicate that better lactation curve characteristics observed in positive deviant farms can be associated with more effective management practices deployed to ameliorate multiple pervasive environmental stresses. For example, the adoption of feed technology utilization combined with other improved dairy technologies has been related with success in smallholder dairy cattle farming. Previous studies have demonstrated that the quantity and quality of animal feeds, household networking, membership in dairy related cooperatives, level of training, willingness to invest more in dairy technologies and larger herd size significantly influenced the success of dairy production in positive deviant farms [11,71,72,73]. This supports the need to strengthen dairy cooperatives to allow smallholder farmers access to high quality production inputs and services to ameliorate nutritional deficit and disease infection stresses [63,74,75,76].

5. Conclusions

Results of the study show that Holstein–Friesian and Ayrshire dairy cattle breeds managed in positive deviant farms consistently expressed lactation curve characteristics indicating higher lactation performances than those managed in typical farms. The observed higher lactation performance observed of the dairy cows can be associated with deployment of suitable management practices that ameliorated feed scarcity, heat load and disease infections stresses. These are prevalent environmental stresses in tropical smallholder dairy farms, those in Tanzania included. Lactation curve characteristics indicating higher lactation performance in positive deviant farms demonstrate that deployment of management practices has influential effect on dairy productivity. This is a success factor to consider whenever planning dairy interventions targeted to smallholder farmers. Moreover, lactation curve characteristics indicating higher lactation performance of dairy cattle under low-stress environments reveal that production environment is a factor to consider when promoting dairy production for smallholder livelihood interventions.

Author Contributions

Conceptualization, D.S.S. and B.O.B.; methodology, D.S.S. and B.O.B.; software, D.S.S.; validation, D.S.S., B.O.B., O.A.M. and D.M.K.; formal analysis, D.S.S.; investigation, D.S.S.; resources, D.S.S., O.A.M., J.M.K.O. and D.M.K.; data curation, D.S.S.; writing—original draft preparation, D.S.S.; writing—review and editing, D.S.S., B.O.B., O.A.M. and J.M.K.O.; visualization, D.S.S. and B.O.B.; supervision, D.S.S., B.O.B. and O.A.M.; project administration, D.S.S., B.O.B., O.A.M., D.M.K. and J.M.K.O.; funding acquisition, D.S.S., O.A.M., D.M.K. and J.M.K.O. All authors have read and agreed to the published version of the manuscript.

Funding

The study was funded by The World Bank Centre of Excellence in Sustainable Agriculture and Agribusiness Management at Egerton University, Kenya, grant number: IDA Credit P151847 and The African Dairy Genetic Gains (ADGG) Project, Tanzania’s ADGG component implemented through TALIRI/ILRI Contract Research Agreement No. 005/2016 dated 11 March 2016 as amended in 2018, 2019 and 2021 to facilitate data collection.

Institutional Review Board Statement

The animal study protocol was approved as provided for by the Tanzania Livestock Research Institute Regulations (2020) and the research clearance was issued by the Tanzania Livestock Research Institute on behalf of the Tanzania Commission for Science and Technology (Ref. No. TLRI/RCC.21/003 of 2 August 2021).

Informed Consent Statement

Not applicable.

Data Availability Statement

Research data are available from the authors upon request.

Acknowledgments

We are thankful to CESAAM under the leadership of George Owuor for funding this study. In addition, we thank the ADGG Project Management for facilitating the data collection process and granting access to the database. We appreciate the hard work of the Tanzanian ADGG Project Team. We especially appreciate the efforts of all dairy cattle farmers in the study sites and of all ADGG technical team i.e., Eliamoni Lyatuu, Gilbert Msuta, Neema Joseph Kelya, Edwin Oyieng and David Mogaka for data and farms access. We are also grateful to all Performance Recording Agents i.e., Judith Shayo, Deogratius Mfuko, Edward Moshi, Rashid Seif Abdul-Azizi and Daudi Kisakeni for data collection and farms access in Moshi Rural, Hai, Tanga City and Muheza districts. The same to all animal resource officers in the study areas and farmers for their greater cooperation during the data collection period.

Conflicts of Interest

The authors declare no conflict of interest.

References

  1. Sekaran, U.; Lai, L.; Ussiri, D.A.N.; Kumar, S.; Clay, S. Role of Integrated Crop-Livestock Systems in Improving Agriculture Production and Addressing Food Security—A Review. J. Agric. Food Res. 2021, 5, 100190. [Google Scholar] [CrossRef]
  2. M’Hamdi, N.; Darej, C.; Attia, K.; El Akrem Znaidi, I.; Khattab, R.; Djelailia, H.; Bouraoui, R.; Taboubi, R.; Marzouki, L.; Ayadi, M. Modelling THI Effects on Milk Production and Lactation Curve Parameters of Holstein Dairy Cows. J. Therm. Biol. 2021, 99, 102917. [Google Scholar] [CrossRef] [PubMed]
  3. Mbuthia, J.M.; Mayer, M.; Reinsch, N. Modeling Heat Stress Effects on Dairy Cattle Milk Production in a Tropical Environment Using Test-Day Records and Random Regression Models. Animal 2021, 15, 100222. [Google Scholar] [CrossRef] [PubMed]
  4. Ekine-Dzivenu, C.C.; Mrode, R.A.; Ojango, J.M.K.; Okeyo Mwai, A. Evaluating the Impact of Heat Stress as Measured by Temperature- Humidity Index (THI) on Test-Day Milk Yield of Dairy Cattle in Tanzania. Livest. Sci. 2019, 242, 104314. [Google Scholar] [CrossRef]
  5. Ojango, J.M.K.; Mrode, R.; Rege, J.E.O.; Mujibi, D.; Strucken, E.M.; Gibson, J.; Mwai, O. Genetic Evaluation of Test-Day Milk Yields from Smallholder Dairy Production Systems in Kenya Using Genomic Relationships. J. Dairy Sci. 2019, 102, 5266–5278. [Google Scholar] [CrossRef] [PubMed] [Green Version]
  6. Mrode, R.; Ojango, J.; Ekine-Dzivenu, C.; Aliloo, H.; Gibson, J.; Okeyo, M.A. Genomic Prediction of Crossbred Dairy Cattle in Tanzania: A Route to Productivity Gains in Smallholder Dairy Systems. J. Dairy Sci. 2021, 104, 11779–11789. [Google Scholar] [CrossRef] [PubMed]
  7. Chawala, A.R.; Banos, G.; Peters, A.; Chagunda, M.G.G. Farmer-Preferred Traits in Smallholder Dairy Farming Systems in Tanzania. Trop. Anim. Health Prod. 2019, 51, 1337–1344. [Google Scholar] [CrossRef] [PubMed] [Green Version]
  8. Shija, D.S.; Mwai, O.A.; Migwi, P.K.; Komwihangilo, D.M.; Bebe, B.O. Identifying Positive Deviant Farms Using Pareto-Optimality Ranking Technique to Assess Productivity and Livelihood Benefits in Smallholder Dairy Farming under Contrasting Stressful Environments in Tanzania. World 2022, 3, 639–656. [Google Scholar] [CrossRef]
  9. Albanna, B.H.; Heeks, R.; Pawelke, A.; Boy, J.; Handl, J.; Gluecker, A. Data-Powered Positive Deviance: Combining Traditional and Non-Traditional Data to Identify and Characterise Development-Related Outperformers. Dev. Eng. 2022, 7, 100090. [Google Scholar] [CrossRef]
  10. Ulukan, D.; Grillot, M.; Benoit, M.; Bernes, G.; Dumont, B.; Magne, M.-A.; Amaral Monteiro, L.; Parsons, D.; Veysset, P.; Ryschawy, J.; et al. Positive Deviant Strategies Implemented by Organic Multi-Species Livestock Farms in Europe. Agric. Syst. 2022, 201, 103453. [Google Scholar] [CrossRef]
  11. Migose, S.A. Addressing Variation in Smallholder Farming Systems to Improve Dairy Development in Kenya. Ph.D. Thesis, Wageningen University, Wageningen, The Netherlands, 2020. [Google Scholar] [CrossRef]
  12. Modernel, P.; Dogliotti, S.; Alvarez, S.; Corbeels, M.; Picasso, V.; Tittonell, P.; Rossing, W.A.H. Identification of Beef Production Farms in the Pampas and Campos Area That Stand out in Economic and Environmental Performance. Ecol. Indic. 2018, 89, 755–770. [Google Scholar] [CrossRef]
  13. Steinke, J.; Mgimiloko, M.G.; Graef, F.; Hammond, J.; van Wijk, M.T.; van Etten, J. Prioritizing Options for Multi-Objective Agricultural Development through the Positive Deviance Approach. PLoS ONE 2019, 14, e0212926. [Google Scholar] [CrossRef] [PubMed] [Green Version]
  14. Adelhart Toorop, R.; Ceccarelli, V.; Bijarniya, D.; Jat, M.L.; Jat, R.K.; Lopez-Ridaura, S.; Groot, J.C.J. Using a Positive Deviance Approach to Inform Farming Systems Redesign: A Case Study from Bihar, India. Agric. Syst. 2020, 185, 102942. [Google Scholar] [CrossRef]
  15. Shija, D.S.; Mwai, O.A.; Migwi, P.K.; Mrode, R.; Bebe, B.O. Characterizing Management Practices in High- and Average-Performing Smallholder Dairy Farms under Contrasting Environmental Stresses in Tanzania. World 2022, 3, 821–839. [Google Scholar] [CrossRef]
  16. Wood, P.D.P. Algebraic Model of the Lactation Curve in Cattle. Nature 1967, 216, 164–165. [Google Scholar] [CrossRef]
  17. Jenkins, T.G.; Ferrell, C.L. A Note on Lactation Curves of Crossbred Cows. Anim. Sci. 1984, 39, 479–482. [Google Scholar] [CrossRef]
  18. Grossman, M.; Kuck, A.L.; Norton, H.W. Lactation Curves of Purebred and Crossbred Dairy Cattle. J. Dairy Sci. 1986, 69, 195–203. [Google Scholar] [CrossRef]
  19. Ali, T.E.; Schaeffer, L.R. Accounting for Covariances among Test Day Milk Yields in Dairy Cows. Can. J. Anim. Sci. 1987, 67, 637–644. [Google Scholar] [CrossRef]
  20. Dijkstra, J.; France, J.; Dhanoa, M.S.; Maas, J.A.; Hanigan, M.D.; Rook, A.J.; Beever, D.E. A Model to Describe Growth Patterns of the Mammary Gland During Pregnancy and Lactation. J. Dairy Sci. 1997, 80, 2340–2354. [Google Scholar] [CrossRef]
  21. Pollott, G.E. A Biological Approach to Lactation Curve Analysis for Milk Yield. J. Dairy Sci. 2000, 83, 2448–2458. [Google Scholar] [CrossRef]
  22. Pizarro Inostroza, M.G.; Navas González, F.J.; Landi, V.; León Jurado, J.M.; Delgado Bermejo, J.V.; Fernández Álvarez, J.; Martínez, M.D.A. Software-Automatized Individual Lactation Model Fitting, Peak and Persistence and Bayesian Criteria Comparison for Milk Yield Genetic Studies in Murciano-Granadina Goats. Mathematics 2020, 8, 1505. [Google Scholar] [CrossRef]
  23. Ehrlich, J.L. Quantifying Shape of Lactation Curves, and Benchmark Curves for Common Dairy Breeds and Parities. Bov. Pract. 2011, 45, 88–96. [Google Scholar]
  24. Rodrigues, P.F.; Menezes, L.M.; Azambuja, R.C.C.; Suñé, R.W.; Barbosa Silveira, I.D.; Cardoso, F.F. Milk Yield and Composition from Angus and Angus-Cross Beef Cows Raised in Southern Brazil1. J. Anim. Sci. 2014, 92, 2668–2676. [Google Scholar] [CrossRef] [PubMed]
  25. Landete-Castillejos, T.; Gallego, L. Technical Note: The Ability of Mathematical Models to Describe the Shape of Lactation Curves1. J. Anim. Sci. 2000, 78, 3010–3013. [Google Scholar] [CrossRef] [PubMed]
  26. Jenkins, T.G.; Ferrell, C.L.; Roberts, A.J. Lactation and Calf Weight Traits of Mature Crossbred Cows Fed Varying Daily Levels of Metabolizable Energy. J. Anim. Sci. 2000, 78, 7–14. [Google Scholar] [CrossRef] [PubMed]
  27. Quist, M.A.; LeBlanc, S.J.; Hand, K.J.; Lazenby, D.; Miglior, F.; Kelton, D.F. Agreement of Predicted 305-Day Milk Yields Relative to Actual 305-Day Milk Weight Yields. J. Dairy Sci. 2007, 90, 4684–4692. [Google Scholar] [CrossRef] [Green Version]
  28. Marshall, K. Optimizing the Use of Breed Types in Developing Country Livestock Production Systems: A Neglected Research Area. J. Anim. Breed. Genet. 2014, 131, 329–340. [Google Scholar] [CrossRef]
  29. Marshall, K.; Gibson, J.P.; Mwai, O.; Mwacharo, J.M.; Haile, A.; Getachew, T.; Mrode, R.; Kemp, S.J. Livestock Genomics for Developing Countries—African Examples in Practice. Front. Genet. 2019, 10, 297. [Google Scholar] [CrossRef] [Green Version]
  30. Marshall, K.; Salmon, G.R.; Tebug, S.; Juga, J.; MacLeod, M.; Poole, J.; Baltenweck, I.; Missohou, A. Net Benefits of Smallholder Dairy Cattle Farms in Senegal Can Be Significantly Increased through the Use of Better Dairy Cattle Breeds and Improved Management Practices. J. Dairy Sci. 2020, 103, 8197–8217. [Google Scholar] [CrossRef]
  31. Lee, M.; Lee, S.; Park, J.; Seo, S. Clustering and Characterization of the Lactation Curves of Dairy Cows Using K-Medoids Clustering Algorithm. Animals 2020, 10, 1348. [Google Scholar] [CrossRef]
  32. Shija, D.S.; Okeyo, M.A.; Migwi, P.K.; Kelya, N.J.; Bebe, B.O. Assessing Animal Disease Prevalence and Mortality in Smallholder Dairy Farms under Contrasting Management Practices and Stressful Environments in Tanzania. Open J. Vet. Med. 2022, 12, 117–134. [Google Scholar] [CrossRef]
  33. ILRI. African Dairy Genetic Gains: Building the Business Case; International Livestock Research Institute: Nairobi, Kenya, 2019; p. 32. [Google Scholar]
  34. International Committee for Animal Recording (ICAR). ICAR Recording Guidelines; ICAR: Rome, Italy, 2014; Available online: http://www.icar.org (accessed on 1 August 2022).
  35. Tempelman, R.J. Invited Review: Assessing Experimental Designs for Research Conducted on Commercial Dairies. J. Dairy Sci. 2009, 92, 1–15. [Google Scholar] [CrossRef] [PubMed] [Green Version]
  36. Thorup, V.M.; Edwards, D.; Friggens, N.C. On-Farm Estimation of Energy Balance in Dairy Cows Using Only Frequent Body Weight Measurements and Body Condition Score. J. Dairy Sci. 2012, 95, 1784–1793. [Google Scholar] [CrossRef] [PubMed] [Green Version]
  37. Ferguson, J.D.; Galligan, D.T.; Thomsen, N. Principal Descriptors of Body Condition Score in Holstein Cows. J. Dairy Sci. 1994, 77, 2695–2703. [Google Scholar] [CrossRef]
  38. Murray, R.D.; Cartwright, T.A.; Downham, D.Y.; Murray, M.A. Some Maternal Factors Associated with Dystocia in Belgian Blue Cattle. Anim. Sci. 1999, 69, 105–113. [Google Scholar] [CrossRef]
  39. Tedeschi, L.O.; Seo, S.; Fox, D.G.; Ruiz, R. Accounting for Energy and Protein Reserve Changes in Predicting Diet-Allowable Milk Production in Cattle. J. Dairy Sci. 2006, 89, 4795–4807. [Google Scholar] [CrossRef] [PubMed] [Green Version]
  40. Andrew, S.M.; Waldo, D.R.; Erdman, R.A. Direct Analysis of Body Composition of Dairy Cows at Three Physiological Stages. J. Dairy Sci. 1994, 77, 3022–3033. [Google Scholar] [CrossRef]
  41. Komaragiri, M.V.; Erdman, R.A. Factors Affecting Body Tissue Mobilization in Early Lactation Dairy Cows. 1. Effect of Dietary Protein on Mobilization of Body Fat and Protein. J. Dairy Sci. 1997, 80, 929–937. [Google Scholar] [CrossRef]
  42. Chilliard, Y.; Cissé, M.; Lefaivre, R.; Rémond, B. Body Composition of Dairy Cows According to Lactation Stage, Somatotropin Treatment, and Concentrate Supplementation. J. Dairy Sci. 1991, 74, 3103–3116. [Google Scholar] [CrossRef] [PubMed]
  43. Jenkins, T.G.; Ferrell, C.L. Lactation Characteristics of Nine Breeds of Cattle Fed Various Quantities of Dietary Energy. J. Anim. Sci. 1992, 70, 1652–1660. [Google Scholar] [CrossRef] [PubMed]
  44. SAS Institute Inc. SAS/ACCESS® 9.4 Interface to ADABAS: Reference; SAS Institute Inc.: Cary, NC, USA, 2013. [Google Scholar]
  45. Meier, U. A Note on the Power of Fisher’s Least Significant Difference Procedure. Pharm. Stat. 2006, 5, 253–263. [Google Scholar] [CrossRef]
  46. Bebe, B.O.; Udo, H.M.J.; Rowlands, G.J.; Thorpe, W. Smallholder Dairy Systems in the Kenya Highlands: Cattle Population Dynamics under Increasing Intensification. Livest. Prod. Sci. 2003, 82, 211–221. [Google Scholar] [CrossRef]
  47. Borman, J.M.; Macmillan, K.L.; Fahey, J. The Potential for Extended Lactations in Victorian Dairying: A Review. Aust. J. Exp. Agric. 2004, 44, 507–519. [Google Scholar] [CrossRef]
  48. Niozas, G.; Tsousis, G.; Malesios, C.; Steinhöfel, I.; Boscos, C.; Bollwein, H.; Kaske, M. Extended Lactation in High-Yielding Dairy Cows. II. Effects on Milk Production, Udder Health, and Body Measurements. J. Dairy Sci. 2019, 102, 811–823. [Google Scholar] [CrossRef] [Green Version]
  49. Knight, C.H. Extended Lactation: Turning Theory into Reality. Adv. Dairy Technol. Proc. West. Can. Dairy Semin. 2005, 17, 113–123. [Google Scholar]
  50. El-Tarabany, M.S.; Roushdy, E.M.; El-Tarabany, A.A.; El-Tarabany, M.S.; Roushdy, E.M.; El-Tarabany, A.A. Production and Health Performance of Holstein, Brown Swiss and Their Crosses under Subtropical Environmental Conditions. Anim. Prod. Sci. 2016, 57, 1137–1143. [Google Scholar] [CrossRef]
  51. Mahyari, S.A.; Hosseini, S.H.; Mahin, M.; Mahdavi, A.H.; Mahnani, A. Genetic analysis of production and reproduction traits of Isfahan Holstein dairy cows under heat stress conditions. Iran. J. Anim. Sci. Res. 2022, 14, 267–281. [Google Scholar] [CrossRef]
  52. Alvåsen, K.; Jansson Mörk, M.; Hallén Sandgren, C.; Thomsen, P.T.; Emanuelson, U. Herd-Level Risk Factors Associated with Cow Mortality in Swedish Dairy Herds. J. Dairy Sci. 2012, 95, 4352–4362. [Google Scholar] [CrossRef] [Green Version]
  53. King, J.M.; Parsons, D.J.; Turnpenny, J.R.; Nyangaga, J.; Bakari, P.; Wathes, C.M. Modelling Energy Metabolism of Friesians in Kenya Smallholdings Shows How Heat Stress and Energy Deficit Constrain Milk Yield and Cow Replacement Rate. Anim. Sci. 2006, 82, 705–716. [Google Scholar] [CrossRef]
  54. Macciotta, N.P.P.; Dimauro, C.; Steri, R.; Cappio-Borlino, A. Mathematical Modelling of Goat Lactation Curves. In Dairy Goats Feeding and Nutrition; Cannas, A., Pulina, G., Eds.; CABI: Wallingford, UK, 2008; pp. 31–46. [Google Scholar] [CrossRef]
  55. Wang, J.; Li, J.; Wang, F.; Xiao, J.; Wang, Y.; Yang, H.; Li, S.; Cao, Z. Heat Stress on Calves and Heifers: A Review. J. Anim. Sci. Biotechnol. 2020, 11, 79. [Google Scholar] [CrossRef]
  56. Moran, J.; Doyle, R. Cow Talk: Understanding Dairy Cow Behaviour to Improve Their Welfare on Asian Farms; CSIRO Publishing: Clayton South, VI, Australia, 2015. [Google Scholar]
  57. Pant, L.P.; Odame, H.H. The Promise of Positive Deviants: Bridging Divides between Scientific Research and Local Practices in Smallholder Agriculture. Knowl. Manag. Dev. J. 2009, 5, 160–172. [Google Scholar] [CrossRef]
  58. Humer, E.; Petri, R.M.; Aschenbach, J.R.; Bradford, B.J.; Penner, G.B.; Tafaj, M.; Südekum, K.-H.; Zebeli, Q. Invited Review: Practical Feeding Management Recommendations to Mitigate the Risk of Subacute Ruminal Acidosis in Dairy Cattle. J. Dairy Sci. 2018, 101, 872–888. [Google Scholar] [CrossRef] [Green Version]
  59. Armstrong, D.V. Heat Stress Interaction with Shade and Cooling. J. Dairy Sci. 1994, 77, 2044–2050. [Google Scholar] [CrossRef]
  60. National Academies of Sciences, Engineering, and Medicine. Nutrient Requirements of Dairy Cattle: Eighth Revised Edition; The National Academies Press: Washington, DC, USA, 2021. [Google Scholar] [CrossRef]
  61. Val-Arreola, D.; Kebreab, E.; Dijkstra, J.; France, J. Study of the Lactation Curve in Dairy Cattle on Farms in Central Mexico. J. Dairy Sci. 2004, 87, 3789–3799. [Google Scholar] [CrossRef] [Green Version]
  62. Herve, L.; Quesnel, H.; Veron, M.; Portanguen, J.; Gross, J.J.; Bruckmaier, R.M.; Boutinaud, M. Milk Yield Loss in Response to Feed Restriction Is Associated with Mammary Epithelial Cell Exfoliation in Dairy Cows. J. Dairy Sci. 2019, 102, 2670–2685. [Google Scholar] [CrossRef] [Green Version]
  63. McClearn, B.; Delaby, L.; Gilliland, T.J.; Guy, C.; Dineen, M.; Coughlan, F.; Buckley, F.; McCarthy, B. An Assessment of the Production, Reproduction, and Functional Traits of Holstein-Friesian, Jersey × Holstein-Friesian, and Norwegian Red × (Jersey × Holstein-Friesian) Cows in Pasture-Based Systems. J. Dairy Sci. 2020, 103, 5200–5214. [Google Scholar] [CrossRef]
  64. Twine, E.E.; Omore, A.; Githinji, J. Uncertainty in Milk Production by Smallholders in Tanzania and Its Implications for Investment. Int. Food Agribus. Manag. Rev. 2018, 21, 53–72. [Google Scholar] [CrossRef]
  65. Gustafson, C.R.; VanWormer, E.; Kazwala, R.; Makweta, A.; Paul, G.; Smith, W.; Mazet, J.A. Educating Pastoralists and Extension Officers on Diverse Livestock Diseases in a Changing Environment in Tanzania. Pastoralism 2015, 5, 1. [Google Scholar] [CrossRef] [Green Version]
  66. Bang, N.N.; Gaughan, J.B.; Hayes, B.J.; Lyons, R.E.; Chanh, N.V.; Trach, N.X.; Khang, D.N.; McNeill, D.M. Characteristics of Cowsheds in Vietnamese Smallholder Dairy Farms and Their Associations with Microclimate—A Preliminary Study. Animals 2021, 11, 351. [Google Scholar] [CrossRef]
  67. Macciotta, N.P.P.; Dimauro, C.; Rassu, S.P.G.; Steri, R.; Pulina, G. The Mathematical Description of Lactation Curves in Dairy Cattle. Ital. J. Anim. Sci. 2011, 10, e51. [Google Scholar] [CrossRef] [Green Version]
  68. Cole, J.B.; Null, D.J.; VanRaden, P.M. Best Prediction of Yields for Long Lactations. J. Dairy Sci. 2009, 92, 1796–1810. [Google Scholar] [CrossRef] [Green Version]
  69. Ahmed, B.A.; Laurence, P.; Pierre, G.; Olivier, M. Lactation Curve Model with Explicit Representation of Perturbations as a Phenotyping Tool for Dairy Livestock Precision Farming. bioRxiv 2019, 661249. [Google Scholar] [CrossRef] [Green Version]
  70. Dematawewa, C.M.B.; Pearson, R.E.; VanRaden, P.M. Modeling Extended Lactations of Holsteins. J. Dairy Sci. 2007, 90, 3924–3936. [Google Scholar] [CrossRef] [Green Version]
  71. Gellynck, X.; Kühne, B. Horizontal and Vertical Networks for Innovation in the Traditional Food Sector. Int. J. Food Syst. Dyn. 2010, 2, 123–132. [Google Scholar] [CrossRef]
  72. Savikurki, A. Positive Deviance in Smallholder Crop-Livestock Farming Systems in Northern Ghana. Master’s Thesis, University of Helsinki, Helsinki, Finland, 2013. [Google Scholar]
  73. Birhanu, M.Y.; Girma, A.; Puskur, R. Determinants of Success and Intensity of Livestock Feed Technologies Use in Ethiopia: Evidence from a Positive Deviance Perspective. Technol. Forecast. Soc. Chang. 2017, 115, 15–25. [Google Scholar] [CrossRef]
  74. Sumner, C.L.; von Keyserlingk, M.A.G.; Weary, D.M. Perspectives of Farmers and Veterinarians Concerning Dairy Cattle Welfare. Anim. Front. 2018, 8, 8–13. [Google Scholar] [CrossRef]
  75. Thapa Shrestha, U.; Adhikari, N.; Kafle, S.; Shrestha, N.; Banjara, M.R.; Steneroden, K.; Bowen, R.; Rijal, K.R.; Adhikari, B.; Ghimire, P. Effect of Deworming on Milk Production in Dairy Cattle and Buffaloes Infected with Gastrointestinal Parasites in the Kavrepalanchowk District of Central Nepal. Vet. Rec. Open 2020, 7, e000380. [Google Scholar] [CrossRef]
  76. Schumacher, C. Veterinary Services: Improving Accessibility for Smallholder Farmers. GALVmed 2020. Available online: https://www.galvmed.org/veterinary-services-improving-accessibility-for-smallholder-farmers/ (accessed on 1 August 2022).
Figure 1. Schematic representation of a two factor nested research design model.
World 03 00059 g001
Figure 2. The methodological framework used to identify positive deviant farms and effective ameliorative management practices in smallholder dairy cattle farming systems under stressful production environments.
World 03 00059 g002
Figure 3. Lactation curves of dairy cows managed under low- and high-stress production environments: (A). Friesian cows and (B). Ayrshire cows. The low-stress environment means lower heat load threshold conditions (68.20 THI units) whereas high-stress environment means mild to moderate heat load stress production environment (77.29 THI units).
World 03 00059 g003
Figure 4. Lactation curves of dairy cows managed in positive deviants (PD) and typical (TYP) farms nested within low- and high-stress production environments: (A,C). Holstein–Friesian cows and (B,D). Ayrshire cows. The farms which attain consistent outstanding performance are labelled positive deviants while the average performers are labelled typical farms.
World 03 00059 g004aWorld 03 00059 g004b
Figure 5. Improved forage production in smallholder dairy cattle farming systems (SHDFS).
World 03 00059 g005
Figure 6. Feed conservation practices in smallholder dairy cattle farming systems.
World 03 00059 g006
Figure 7. Improved dairy cattle genotypes in positive deviants and typical farms under stressful production environments.
World 03 00059 g007
Table 1. The number of dairy farms, cows, lactations and monthly test-day (TD) milk production records available for analysis of lactation curve characteristics.
FactorLevelHolstein–Friesian CowsAyrshire Cows
FarmsCowsLactationsTD RecordsFarmsCowsLactationsTD Records
Environment
Low-stress7692117564333345192
High-stress1872353112174363751332
Farm(environment)
Low-stress
Positive deviant3563633615
Typical 7387111528303039177
High-stress
Positive deviant79141051115
Typical 1802262972069353650327
TOTAL2633274282738697096524
Table 2. Means (LSMEANS ± SE) of lactation curve parameters for Holstein–Friesian cows managed in positive deviants and typical farms nested within low- and high-stress production environments.
FactorLevelMPtakModelMPtPeak WeekPeak YieldLMP305
Production environment
Low-stress12.08 ± 0.330.4475 ± 0.02340.0699 ± 0.001511.50 ± 0.3415.14 ± 0.2715.25 ± 0.353338.62 ± 79.81
High-stress10.19 ± 0.190.4616 ± 0.01360.0703 ± 0.00099.52 ± 0.2014.66 ± 0.1512.89 ± 0.202840.03 ± 46.35
Mean difference1.89 ***−0.0141 NS−0.0003 NS1.98 ***0.48 NS2.36 ***498.58 ***
Farm(environment)
Low-stress
Positive deviants 15.00 ± 0.650.3616 ± 0.04520.0673 ± 0.002914.30 ± 0.6615.37 ± 0.5118.26 ± 0.684008.19 ± 154.45
Typical 9.17 ± 0.190.5333 ± 0.01180.0726 ± 0.00088.69 ± 0.1714.91 ± 0.1312.24 ± 0.182669.05 ± 40.33
Mean difference5.83 ***−0.1718 ***−0.0053 NS5.61 ***0.46 NS6.02 ***1339.14 ***
High-stress
Positive deviants 11.81 ± 0.380.3961 ± 0.02650.0664 ± 0.001710.99 ± 0.3915.21 ± 0.3014.59 ± 0.403275.79 ± 90.44
Typical 8.57 ± 0.090.5271 ± 0.00590.0741 ± 0.00048.05 ± 0.0914.10 ± 0.0711.20 ± 0.092404.28 ± 20.37
Mean difference3.24 ***−0.1310 ***−0.0077 ***2.95 ***1.11 ***3.40 ***871.51 ***
MPt observed daily milk yield measured in litres per cow per day; a is a scale parameter of lactation curve; k is a shape parameter of lactation curve; ModelMPt is a model predicted daily milk yield at animal level measured in litres per cow per day; Peak week is the time taken to reach peak lactation (weeks); Peak yield is the maximum milk yield attained at peak day measured in litres per cow per day; LMP305 is a total lactation milk production for a 305-d lactation period measured in litres per cow per lactation; *** <0.001; NS >0.05.
Table 3. Means (LSMEANS ± SE) of lactation curve parameters for Ayrshire cows managed in pos-itive deviants and typical farms nested within low- and high-stress production environments.
FactorLevelMPtakModelMPtPeak WeekPeak YieldLMP305
Production environment
Low-stress10.39 ± 0.530.4398 ± 0.03390.0740 ± 0.00359.96 ± 0.5415.09 ± 0.4213.46 ± 0.572931.09 ± 132.11
High-stress9.46 ± 0.890.5715 ± 0.05680.0643 ± 0.00599.17 ± 0.9016.48 ± 0.7011.53 ± 0.962646.72 ± 221.37
Mean difference0.93 NS−0.1318 *0.0098 NS0.79 NS−1.38 NS1.94 NS284.36 NS
Farm(environment)
Low-stress
Positive deviants 12.60 ± 1.020.4223 ± 0.06510.0607 ± 0.006712.13 ± 1.0417.50 ± 0.8115.48 ± 1.103539.64 ± 253.68
Typical 8.19 ± 0.300.4572 ± 0.01890.0873 ± 0.00207.80 ± 0.3012.69 ± 0.2311.44 ± 0.322322.53 ± 73.85
Mean difference4.41 ***−0.0350 NS−0.0266 ***4.33 ***4.81 ***4.04 ***1217.11 ***
High-stress
Positive deviants 11.20 ± 1.760.5473 ± 0.11270.0518 ± 0.011711.16 ± 1.7919.31 ± 1.3912.98 ± 1.903141.66 ± 439.39
Typical 7.72 ± 0.220.5958 ± 0.01390.0767 ± 0.00147.18 ± 0.2213.65 ± 0.1710.07 ± 0.232151.79 ± 54.33
Mean difference3.48 *−0.0485 NS−0.0249 *3.98 *5.66 ***2.90 NS989.87 *
MPt represents daily milk yield measured in litres per cow per day; a is a scale parameter of lactation curve; k is a shape parameter of lactation curve; ModelMPt is a model predicted daily milk yield at animal level measured in litres per cow per day; Peak week is the time taken to reach peak lactation (weeks); Peak yield is the maximum milk yield attained at peak day measured in litres per cow per day; LMP305 is a total lactation milk production for a 305-d lactation period measured in litres per cow per lactation; * <0.05; *** <0.001; NS >0.05.
Table 4. Means (LSMEANS ± SE) of lactation length and persistency for Holstein–Friesian and Ayrshire cows managed in positive deviants and typical farms nested within low- and high-stress production environments.
FactorLevelLactation Length, DaysPersistency, g/day
Holstein–FriesianAyrshireHolstein–FriesianAyrshire
Production environment
Low-stress439.40 ± 31.71469.28 ± 45.30−23.15 ± 4.93−23.26 ± 4.79
High-stress442.48 ± 21.28452.12 ± 76.02−25.13 ± 3.31−21.49 ± 8.03
Mean difference−3.08 NS17.16 NS1.98 NS−1.77 NS
Farm(environment)
Low-stress
Positive deviants 428.20 ± 61.95429.00 ± 86.84−15.97 ± 9.63−18.31 ± 9.18
Typical 450.59 ± 13.52509.56 ± 25.80−30.34 ± 2.10−28.22 ± 2.73
Mean difference−22.39 NS−80.56 NS14.37 NS9.91 NS
High-stress
Positive deviants 428.64 ± 41.77457.00 ± 150.42−23.97 ± 6.49−20.41 ± 15.10
Typical 456.32 ± 8.16447.24 ± 22.18−26.29 ± 1.27−22.57 ± 2.34
Mean difference−27.69 NS9.76 NS2.33 NS2.16 NS
NS >0.05.
Publisher’s Note: MDPI stays neutral with regard to jurisdictional claims in published maps and institutional affiliations.

