Comparative Evidence on Corporate Governance Outcomes in the G20 Countries


Abstract
1. Introduction
2. Materials and Methods
2.1. Data Source
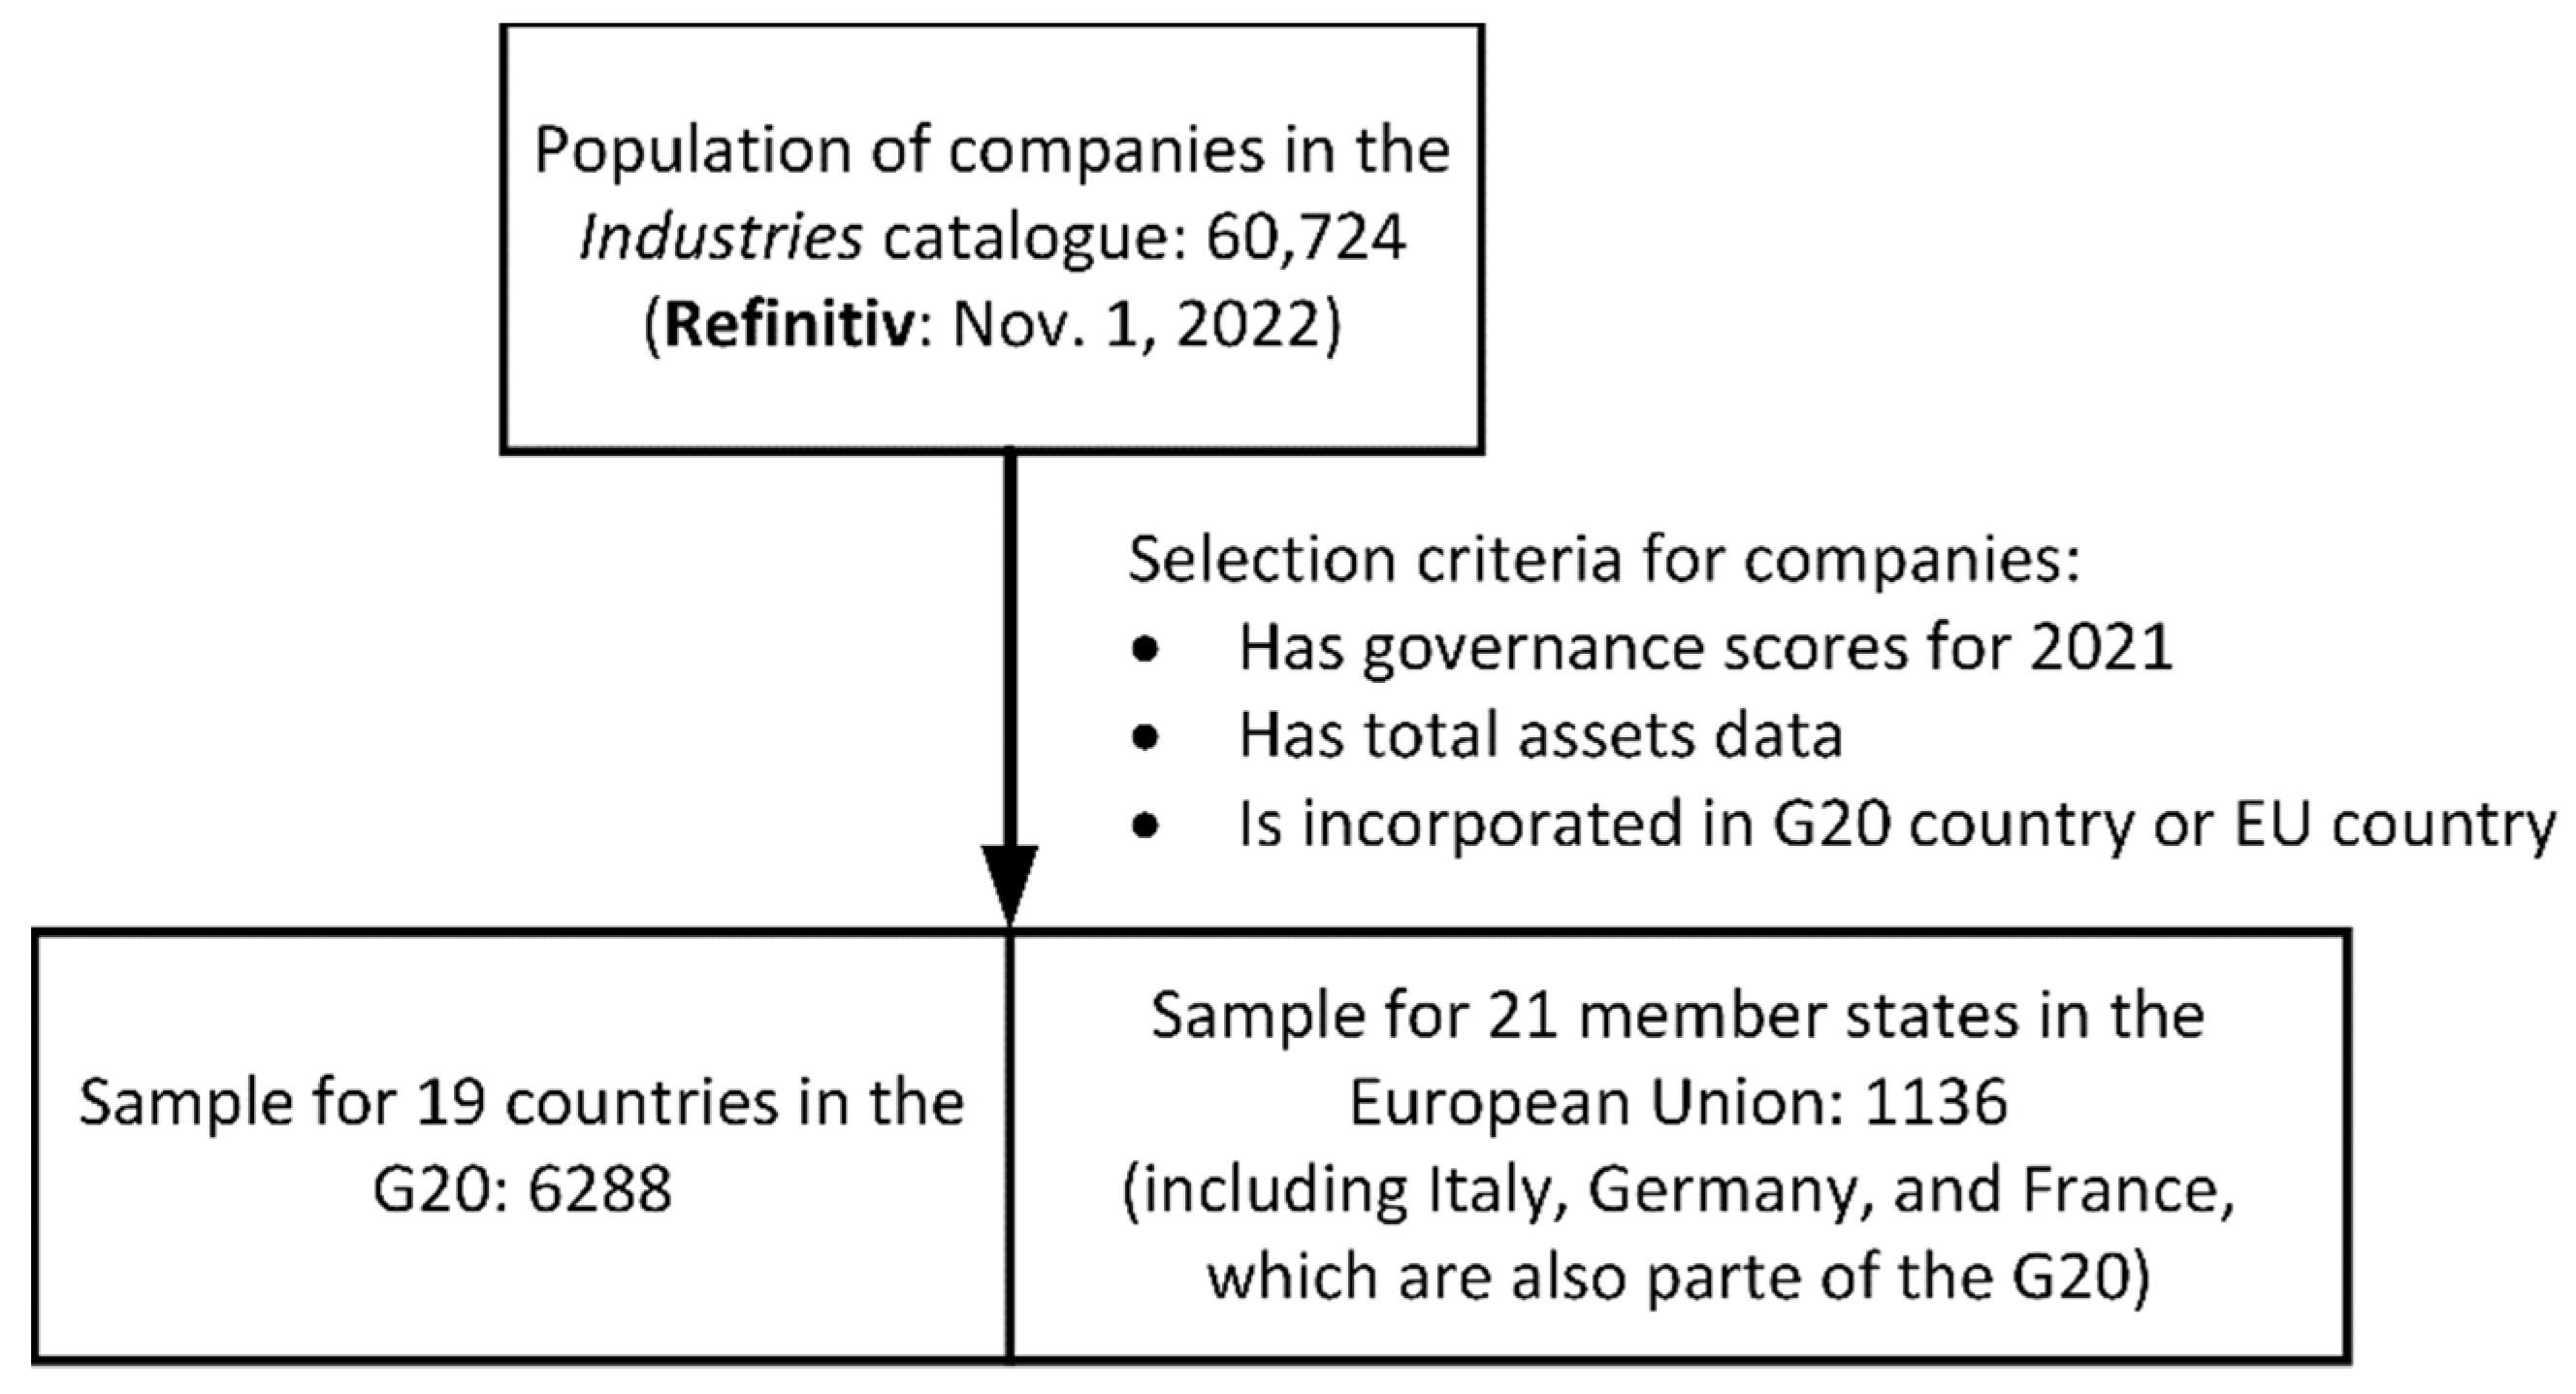
2.2. Sample Selection
2.3. Hypothesis and Variables
- The Governance Pillar Score (GovScore) is a weighted score on a scale of 0 to 100 and measures the company’s systems and processes, ensuring that board members and executives act in the interest of shareholders [25]. It reflects the creation of managerial incentives and the system of checks and balances to generate long-term shareholder value. This score is normalized by industry and its calculation algorithm is not disclosed by Refinitiv. The Governance Pillar Score is a weighted average of the Management Score, the Shareholder Rights Score, and the CSR Strategy Score. The Governance Pillar Score has been used in the literature as a proxy of corporate governance quality [29].
- Management Score (ManScore) is a weighted score on a scale of 0 to 100 and measures a company’s commitment and effectiveness towards following best practice governance practices [25]. Some relevant indicators are the existence of policies related to the audit committee, nomination committee, remuneration committee; board structure, independence, diversity, skills, and tenure; audit committee structure, independence, and expertise; remuneration committee independence; executive compensation policies and targets; ethnic minorities as board members. This score is normalized by industry and its calculation algorithm is not disclosed by Refinitiv.
- Shareholder Rights score (ShareScore) is a weighted score on a scale of 0 to 100 and measures the company’s effectiveness towards the equal treatment of shareholders and the use of anti-takeover devices [25]. Some relevant indicators are policies related to shareholder rights, equal voting rights, different voting rights, director election majority, and the advance notice period; limitation of director liability; litigation expenses; auditor tenure. This score is normalized by industry and its calculation algorithm is not disclosed by Refinitiv.
- The CSR Strategy Score (CsrScore) is a weighted score on a scale of 0 to 100 and reflects the company’s efforts to integrate the economic, social and environmental dimensions of the business model into the decision-making process [25]. In the literature, this score has been used as a proxy for the company’s capacity of integrated thinking [30,31]. It refers to the following aspects: the existence of a sustainability committee; the integration of financial and non-financial factors in the management report; compliance with the Global Reporting Initiative; stakeholder engagement; reporting on the Sustainable Development Goals. Thus, CSR can be understood as a function of the corporate governance system [32]. This score is normalized by industry and its calculation algorithm is not disclosed by Refinitiv.
- Board independence (BoardIndep) is the percentage of independent board members reported by the company. From the perspective of agency theory, a higher proportion of board independence is widely considered as one of the most important aspects of good corporate governance [33,34]. From the perspective of stakeholder theory, board credibility and company reputation are enhanced by the presence of independent directors [35]. From the perspective of signaling theory, board independence is a positive signal to the market that leads to reduced information asymmetry and ensures favorable responses from different stakeholders [36].
- Board-specific skills (BoardSkills), measured as the percentage of board members who have either an industry-specific background or a strong financial background [40]. From the perspective of agency theory, board-specific skills can support the monitoring function of the board [41,42]. This aspect of good governance has scarcely been explored in the literature, probably due to a lack of reliable data at the international level.
- Auditor Tenure (AuditTenure) is the number of years the current auditor is providing services to the organization. A longer audit tenure is considered to adversely affect the quality of audit reports, and, by consequence, the quality of the corporate governance system [43]. However, other authors provided evidence that increased auditor tenure reduces the probability of earnings management [44]. Refinitiv assigns a positive valence to a longer auditor tenure.
2.4. Statistical Procedures
3. Results
3.1. Hypothesis Testing for the Governance Pillar Score
3.2. Hypothesis Testing for the Management Score
3.3. Hypothesis Testing for the Shareholder Rights Score
3.4. Hypothesis Testing for the CSR Strategy Score
3.5. Hypothesis Testing for Board Independence
3.6. Hypothesis Testing for Gender Diversity
3.7. Hypothesis Testing for Board Skills
3.8. Hypothesis Testing for Auditor Tenure
4. Discussion
5. Conclusions
Funding
Institutional Review Board Statement
Informed Consent Statement
Data Availability Statement
Conflicts of Interest
Appendix A
| Algorithm A1: Code selection in RStudio for the ANCOVA and post-hoc analysis |
| library(rstatix) # version 0.7.0 anova_test(govscore_change1, GovScore ~ ISO + lnTA, type = 3, detailed = TRUE, white.adjust = TRUE) adj_means <- emmeans_test(govscore_change1, GovScore ~ ISO, covariate = lnTA) get_emmeans(adj_means) posthoc <- emmeans_test(govscore_change1, GovScore ~ ISO, covariate = lnTA, p.adjust.method = “bonferroni”) |
References
- Turnbull, S. Corporate governance: Its scope, concerns and theories. Corp. Gov. 1997, 5, 180–205. [Google Scholar] [CrossRef]
- OECD. G20/OECD Principles of Corporate Governance 2015; OECD Publishing: Berlin, Mexico, 2015; ISBN 978-92-64-23687-5. [Google Scholar]
- Ammann, M.; Oesch, D.; Schmid, M.M. Corporate governance and firm value: International evidence. J. Empir. Financ. 2011, 18, 36–55. [Google Scholar] [CrossRef]
- Hopt, K. Comparative corporate governance: The state of the art and international regulation. Am. J. Comp. Law 2011, 59, 1–73. [Google Scholar] [CrossRef]
- Claessens, S. Corporate governance and development. World Bank Res. Obs. 2006, 21, 91–122. [Google Scholar] [CrossRef]
- La Porta, R.; Lopez-de-Silanes, F.; Shleifer, A.; Vishny, R. Investor protection and corporate governance. J. Financ. Econ. 2000, 58, 3–27. [Google Scholar] [CrossRef]
- Mallin, C. Institutional investors and voting practices: An international comparison. Corp. Gov. 2001, 9, 118–126. [Google Scholar] [CrossRef]
- Ray, D.M. Corporate boards and corporate democracy. J. Corp. Citizsh. 2005, 93–105. [Google Scholar] [CrossRef]
- Stoelhorst, J.W.; Vishwanathan, P. Beyond primacy: A stakeholder theory of corporate governance. Acad. Manag. Rev. 2022; in press. [Google Scholar] [CrossRef]
- Ahmad, S.; Omar, R. Basic corporate governance models: A systematic review. Int. J. Law Manag. 2016, 58, 73–107. [Google Scholar] [CrossRef]
- Licht, A.N.; Goldschmidt, C.; Schwartz, S.H. Culture, law, and corporate governance. Int. Rev. Law Econ. 2005, 25, 229–255. [Google Scholar] [CrossRef]
- Colares Oliveira, M.; Ceglia, D.; Antonio Filho, F. Analysis of corporate governance disclosure: A study through BRICS countries. Corp. Gov. 2016, 16, 923–940. [Google Scholar] [CrossRef]
- Qurashi, M.H. Corporate governance code comparison for South Asian emerging economies. Int. J. Law Manag. 2018, 60, 250–266. [Google Scholar] [CrossRef]
- Dumitru, M.; Dyduch, J.; Gușe, R.-G.; Krasodomska, J. Corporate reporting practices in Poland and Romania—An ex-ante study to the new non-financial reporting European directive. Account. Eur. 2017, 14, 279–304. [Google Scholar] [CrossRef]
- Cuomo, F.; Mallin, C.; Zattoni, A. Corporate governance codes: A review and research agenda. Corp. Gov. Int. Rev. 2016, 24, 222–241. [Google Scholar] [CrossRef]
- Filatotchev, I.; Wright, M. Agency Perspectives on Corporate Governance of Multinational Enterprises. J. Manag. Stud. 2011, 48, 471–486. [Google Scholar] [CrossRef]
- Aguilera, R.V.; Marano, V.; Haxhi, I. International corporate governance: A review and opportunities for future research. J. Int. Bus Stud. 2019, 50, 457–498. [Google Scholar] [CrossRef]
- Bhaumik, S.; Driffield, N.; Gaur, A.; Mickiewicz, T.; Vaaler, P. Corporate governance and MNE strategies in emerging economies. J. World Bus. 2019, 54, 234–243. [Google Scholar] [CrossRef]
- Țiclău, T.; Hințea, C.; Andrianu, B. Adaptive and turbulent governance. Ways of governing that foster resilience. The case of the COVID-19 pandemic. Transylv. Rev. Adm. Sci. 2020, SI2020, 167–182. [Google Scholar] [CrossRef]
- Ghabri, Y. Legal protection systems, corporate governance and firm performance: A cross-country comparison. Stud. Econ. Financ. 2022, 39, 256–278. [Google Scholar] [CrossRef]
- Daniel, S.J.; Cieslewicz, J.K.; Pourjalali, H. The impact of national economic culture and country-level institutional environment on corporate governance practices: Theory and empirical evidence. Manag. Int. Rev. 2012, 52, 365–394. [Google Scholar] [CrossRef]
- Salterio, S.E.; Conrod, J.E.D.; Schmidt, R.N. Canadian evidence of adherence to “comply or explain” corporate governance codes: An international comparison. Account Perspect. 2013, 12, 23–51. [Google Scholar] [CrossRef]
- Chen, J.; Xian, Q.; Zhou, J.; Li, D. Impact of income inequality on CO2 emissions in G20 countries. J. Environ. Manag. 2020, 271, 110987. [Google Scholar] [CrossRef]
- Erdoğan, S.; Yıldırım, S.; Yıldırım, D.Ç.; Gedikli, A. The effects of innovation on sectoral carbon emissions: Evidence from G20 countries. J. Environ. Manag. 2020, 267, 110637. [Google Scholar] [CrossRef] [PubMed]
- Refinitiv Environmental, Social and Governance Scores from Refinitiv. Available online: https://www.refinitiv.com/content/dam/marketing/en_us/documents/methodology/refinitiv-esg-scores-methodology.pdf (accessed on 1 November 2022).
- Shakil, M.H.; Mahmood, N.; Tasnia, M.; Munim, Z.H. Do environmental, social and governance performance affect the financial performance of banks? A cross-country study of emerging market banks. Manag. Environ. Qual. 2019, 30, 1331–1344. [Google Scholar] [CrossRef]
- Shakil, M.H.; Tasnia, M.; Mostafiz, M.I. Board gender diversity and environmental, social and governance performance of US banks: Moderating role of environmental, social and corporate governance controversies. Int. J. Bank Mark. 2021, 39, 661–677. [Google Scholar] [CrossRef]
- Arayssi, M.; Jizi, M.I. Does corporate governance spillover firm performance? A study of valuation of MENA companies. Soc. Responsib. J. 2019, 15, 597–620. [Google Scholar] [CrossRef]
- Duque-Grisales, E.; Aguilera-Caracuel, J. Environmental, social and governance (ESG) scores and financial performance of multilatinas. J. Bus. Ethics 2021, 168, 315–334. [Google Scholar] [CrossRef]
- Zouari, G.; Dhifi, K. The impact of board characteristics on integrated reporting: Case of European companies. Int. J. Discl. Gov. 2021, 18, 83–94. [Google Scholar] [CrossRef]
- García-Sánchez, I.-M.; Noguera-Gámez, L. Institutional investor protection pressures versus firm incentives in the disclosure of integrated reporting. Aust. Account. Rev. 2018, 28, 199–219. [Google Scholar] [CrossRef]
- Zaman, R.; Jain, T.; Samara, G.; Jamali, D. Corporate governance meets corporate social responsibility: Mapping the interface. Bus. Soc. 2022, 61, 690–752. [Google Scholar] [CrossRef]
- Frías-Aceituno, J.V.; Rodríguez-Ariza, L.; García-Sánchez, I.M. Is integrated reporting determined by a country’s legal system? An exploratory study. J. Clean. Prod. 2013, 44, 45–55. [Google Scholar] [CrossRef]
- Muttakin, M.B.; Mihret, D.; Lemma, T.T.; Khan, A. Integrated reporting, financial reporting quality and cost of debt. Int. J. Account. Inf. Manag. 2020, 28, 517–534. [Google Scholar] [CrossRef]
- Liu, X.; Zhang, C. Corporate governance, social responsibility information disclosure, and enterprise value in China. J. Clean. Prod. 2017, 142, 1075–1084. [Google Scholar] [CrossRef]
- Bae, S.; Masud, M.; Kim, J. A cross-country investigation of corporate governance and corporate sustainability disclosure: A signaling theory perspective. Sustainability 2018, 10, 2611. [Google Scholar] [CrossRef]
- Reddy, S.; Jadhav, A.M. Gender diversity in boardrooms—A literature review. Cogent Econ. Financ. 2019, 7, 1644703. [Google Scholar] [CrossRef]
- Amorelli, M.; García-Sánchez, I. Trends in the dynamic evolution of board gender diversity and corporate social responsibility. Corp. Soc. Responsib. Environ. 2021, 28, 537–554. [Google Scholar] [CrossRef]
- Ain, Q.U.; Yuan, X.; Javaid, H.M.; Zhao, J.; Xiang, L. Board gender diversity and dividend policy in Chinese listed firms. SAGE Open 2021, 11, 215824402199780. [Google Scholar] [CrossRef]
- Karkowska, R.; Acedański, J. The effect of corporate board attributes on bank stability. Port. Econ. J. 2020, 19, 99–137. [Google Scholar] [CrossRef]
- John, K.; Senbet, L.W. Corporate governance and board effectiveness. J. Bank. Financ. 1998, 22, 371–403. [Google Scholar] [CrossRef]
- Apostolides, N. Exercising corporate governance at the annual general meeting. Corp. Gov. Int. J. Bus. Soc. 2010, 10, 140–149. [Google Scholar] [CrossRef]
- Dao, M.; Mishra, S.; Raghunandan, K. Auditor tenure and shareholder ratification of the auditor. Account. Horiz. 2008, 22, 297–314. [Google Scholar] [CrossRef]
- Lin, J.W.; Hwang, M.I. Audit quality, corporate governance, and earnings management: A meta-analysis. Int. J. Audit. 2010, 14, 57–77. [Google Scholar] [CrossRef]
- Kyere, M.; Ausloos, M. Corporate governance and firms financial performance in the United Kingdom. Int J Fin Econ 2021, 26, 1871–1885. [Google Scholar] [CrossRef]
- Field, A.; Miles, J.; Field, Z. Discovering Statistics Using R, 1st ed.; SAGE Publications Ltd.: London, UK, 2012; ISBN 978-1-4462-0045-2. [Google Scholar]
- Levy, K.J. A Monte Carlo study of analysis of covariance under violations of the assumptions of normality and equal regression slopes. Educ. Psychol. Meas. 1980, 40, 835–840. [Google Scholar] [CrossRef]
- Blanca, M.J.; Alarcón, R.; Arnau, J. Non-normal data: Is ANOVA still a valid option? Psicothema 2017, 29, 552–557. [Google Scholar] [CrossRef] [PubMed]
- Kassambara, A. Package ‘Rstatix’ (Version 0.7.0). Available online: https://cran.r-project.org/web/packages/rstatix/rstatix.pdf (accessed on 15 October 2022).
- Bottenberg, K.; Tuschke, A.; Flickinger, M. Corporate governance between shareholder and stakeholder orientation: Lessons from Germany. J. Manag. Inq. 2017, 26, 165–180. [Google Scholar] [CrossRef]
- Jackson, G.; Moerke, A. Continuity and change in corporate governance: Comparing Germany and Japan. Corp. Gov. 2005, 13, 351–361. [Google Scholar] [CrossRef]
- Kuzey, C.; Uyar, A. Determinants of sustainability reporting and its impact on firm value: Evidence from the emerging market of Turkey. J. Clean. Prod. 2017, 143, 27–39. [Google Scholar] [CrossRef]
- Setia, N.; Abhayawansa, S.; Joshi, M.; Huynh, A.V. Integrated reporting in South Africa: Some initial evidence. Sustainability 2015, 6, 397–424. [Google Scholar] [CrossRef]
- dos Santos, P.G.; Albuquerque, F.; Rodrigues, M.A.B.; Morais, A.I. The views of stakeholders on mandatory or voluntary use of a simplified standard on non-financial information for SMEs in the European Union. Sustainability 2022, 14, 2816. [Google Scholar] [CrossRef]
- La Torre, M.; Sabelfeld, S.; Blomkvist, M.; Dumay, J. Rebuilding trust: Sustainability and non-financial reporting and the European Union regulation. Meditari Account. Res. 2020, 28, 701–725. [Google Scholar] [CrossRef]
- Hamed, R.S.; Al-Shattarat, B.K.; Al-Shattarat, W.K.; Hussainey, K. The impact of introducing new regulations on the quality of CSR reporting: Evidence from the UK. J. Int. Account. Audit. Tax. 2022, 46, 100444. [Google Scholar] [CrossRef]
- Weir, C.; Laing, D. Governance structures, director independence and corporate performance in the UK. Eur. Bus. Rev. 2001, 13, 86–95. [Google Scholar] [CrossRef]
- N26 The Female Opportunity Index 2021. Available online: https://n26.com/en-eu/female-opportunity-index (accessed on 1 November 2022).
- Srinidhi, B.; Sun, Y.; Zhang, H.; Chen, S. How do female directors improve board governance? A mechanism based on norm changes. J. Contemp. Account. Econ. 2020, 16, 100181. [Google Scholar] [CrossRef]
- Gangi, F.; Daniele, L.M.; D’Angelo, E.; Varrone, N.; Coscia, M. The impact of board gender diversity on banks’ environmental policy: The moderating role of gender inequality in national culture. Corp. Soc. Responsib. Environ. 2022, csr.2418. [Google Scholar] [CrossRef]
- Adams, R.B.; Akyol, A.C.; Verwijmeren, P. Director skill sets. J. Financ. Econ. 2018, 130, 641–662. [Google Scholar] [CrossRef]
- Firth, M.; Rui, O.M.; Wu, X. How do various forms of auditor rotation affect audit quality? Evidence from China. Int. J. Account. 2012, 47, 109–138. [Google Scholar] [CrossRef]
- Bowlin, K.O.; Hobson, J.L.; Piercey, M.D. The effects of auditor rotation, professional skepticism, and interactions with managers on audit quality. Account. Rev. 2015, 90, 1363–1393. [Google Scholar] [CrossRef]
- Cumming, D.; Filatotchev, I.; Knill, A.; Reeb, D.M.; Senbet, L. Law, finance, and the international mobility of corporate governance. J. Int. Bus. Stud. 2017, 48, 123–147. [Google Scholar] [CrossRef]
- European Parliament Women on Boards: Deal to Boost Gender Balance in Companies. Available online: https://www.europarl.europa.eu/news/en/press-room/20220603IPR32195/women-on-boards-deal-to-boost-gender-balance-in-companies (accessed on 1 November 2022).
- Conroy, S.J.; Emerson, T.L.N. Changing ethical attitudes: The case of the Enron and ImClone scandals. Soc. Sci. Q. 2006, 87, 395–410. [Google Scholar] [CrossRef]
- Beugelsdijk, S.; Kostova, T.; Roth, K. An overview of Hofstede-inspired country-level culture research in international business since 2006. J. Int. Bus. Stud. 2017, 48, 30–47. [Google Scholar] [CrossRef]
- Gallego-Álvarez, I.; Pucheta-Martínez, M.C. Corporate social responsibility reporting and corporate governance mechanisms: An international outlook from emerging countries. Bus. Strat. Dev. 2020, 3, 77–97. [Google Scholar] [CrossRef]
- European Commission. Gender Equality: The EU is Breaking the Glass Ceiling Thanks to New Gender Balance Targets on Company Boards. 2022. Available online: https://ec.europa.eu/commission/presscorner/detail/en/statement_22_7074 (accessed on 15 October 2022).
- Terjesen, S.; Aguilera, R.V.; Lorenz, R. Legislating a Woman’s Seat on the Board: Institutional Factors Driving Gender Quotas for Boards of Directors. J. Bus. Ethics 2015, 128, 233–251. [Google Scholar] [CrossRef]
- Sharma, R.R.; Chawla, S. Gender Equality & Gender Equity: Strategies for Bridging the Gender Gap in the Corporate World. In Exploring Gender at Work; Marques, J., Ed.; Springer International Publishing: Cham, Switzerland, 2021; pp. 197–212. ISBN 978-3-030-64318-8. [Google Scholar]
- Financial Reporting Council. UK Corporate Governance Code; Financial Reporting Council: London, UK, 2018. [Google Scholar]
- Calderón, R.; Piñero, R.; Redín, D.M. Understanding Independence: Board of Directors and CSR. Front. Psychol. 2020, 11, 552152. [Google Scholar] [CrossRef]
- Boivie, S.; Lange, D.; McDonald, M.L.; Westphal, J.D. Me or We: The Effects of CEO Organizational Identification on Agency Costs. Acad. Manag. J. 2011, 54, 551–576. [Google Scholar] [CrossRef]
- Cavaco, S.; Challe, E.; Crifo, P.; Rebérioux, A.; Roudaut, G. Board independence and operating performance: Analysis on (French) company and individual data. Appl. Econ. 2016, 48, 5093–5105. [Google Scholar] [CrossRef]


| G20 Member | Sample | GovScore Adj. Mean | SE | Sig. Differences 1 |
|---|---|---|---|---|
| South Korea (KR) | 22 | 65.1 | 4.21 | JP, CN |
| Germany (DE) | 186 | 63.9 | 1.45 | IN, JP, US, CN |
| United Kingdom (GB) * | 527 | 57.4 | 0.86 | JP, US, CN |
| Italy (IT) | 82 | 57.2 | 2.18 | JP, CN |
| European Union (EU) | 1136 | 56.8 | 0.58 | JP, US, CN, DE |
| Turkey (TR) | 73 | 56.4 | 2.31 | JP, CN |
| Indonesia (ID) | 39 | 55.8 | 3.16 | - |
| Australia (AU) * | 358 | 55.7 | 1.05 | CN, JP, DE |
| Brazil (BR) | 36 | 54.6 | 3.29 | - |
| France (FR) | 148 | 54.2 | 1.62 | CN, DE |
| United States (US) * | 2540 | 52.0 | 0.39 | JP, GB, EU, DE |
| Canada (CA) * | 295 | 51.6 | 1.15 | DE, JP, CN |
| Mexico (MX) | 69 | 51.1 | 2.37 | DE |
| South Africa (ZA) | 114 | 51.1 | 1.85 | DE |
| India (IN) * | 221 | 50.7 | 1.33 | DE, GB, EU |
| Russia (RU) | 16 | 50.3 | 4.93 | - |
| Saudi Arabia (SA) ** | 28 | 49.5 | 3.73 | - |
| Argentina (AR) | 24 | 49.2 | 4.02 | - |
| China (CN) | 1105 | 46.3 | 0.60 | DE, EU, GB, US, AU |
| Japan (JP) | 405 | 44.5 | 0.99 | US, IT, GB, FR, EU |
| G20 Member | Sample | ManScore Adj. Mean | SE | Sig. Differences 1 |
|---|---|---|---|---|
| South Korea (KR) | 22 | 74.0 | 5.45 | JP, CN |
| Germany (DE) | 186 | 66.8 | 1.87 | US, EU |
| Italy (IT) | 82 | 59.7 | 2.82 | JP, CN |
| European Union (EU) | 1136 | 58.5 | 0.75 | CN |
| United Kingdom (GB) * | 527 | 58.2 | 1.12 | CN |
| Brazil (BR) | 36 | 58.1 | 4.26 | - |
| Indonesia (ID) | 39 | 58.0 | 4.09 | - |
| Australia (AU) * | 358 | 57.5 | 1.36 | JP, CN |
| Turkey (TR) | 73 | 56.6 | 2.99 | - |
| United States (US) * | 2540 | 56.1 | 0.51 | CN, DE |
| France (FR) | 148 | 55.7 | 2.10 | - |
| Saudi Arabia (SA) ** | 28 | 54.2 | 4.83 | - |
| Canada (CA) * | 295 | 54.1 | 1.49 | DE |
| Mexico (MX) | 69 | 53.3 | 3.08 | - |
| South Africa (ZA) | 114 | 51.4 | 2.39 | DE |
| India (IN) * | 221 | 51.3 | 1.72 | DE |
| Russia (RU) | 16 | 50.0 | 6.39 | - |
| Argentina (AR) | 24 | 49.6 | 5.22 | - |
| China (CN) | 1105 | 47.4 | 0.77 | US, GB, EU, DE |
| Japan (JP) | 405 | 46.2 | 1.29 | US, GB, EU, DE |
| G20 Member | Sample | ShareScore Adj. Mean | SE | Sig. Differences 1 |
|---|---|---|---|---|
| Germany (DE) | 186 | 64.8 | 1.92 | US, JP, IN |
| South Korea (KR) | 22 | 60.1 | 5.59 | - |
| Russia (RU) | 16 | 59.4 | 6.56 | - |
| European Union (EU) | 1136 | 57.1 | 0.77 | JP |
| Turkey (TR) | 73 | 56.9 | 3.07 | - |
| France (FR) | 148 | 56.7 | 2.16 | - |
| United Kingdom (GB) * | 527 | 56.7 | 1.14 | JP |
| Indonesia (ID) | 39 | 55.7 | 4.20 | - |
| Italy (IT) | 82 | 54.8 | 2.90 | - |
| United States (US) * | 2540 | 54.6 | 0.52 | JP |
| Australia (AU) * | 358 | 54.5 | 1.40 | DE |
| Mexico (MX) | 69 | 54.1 | 3.16 | - |
| Saudi Arabia (SA) ** | 28 | 53.6 | 4.96 | - |
| Brazil (BR) | 36 | 53.2 | 4.37 | - |
| India (IN) * | 221 | 51.2 | 1.76 | DE |
| South Africa (ZA) | 114 | 50.8 | 2.46 | DE |
| Argentina (AR) | 24 | 50.7 | 5.35 | - |
| Canada (CA) * | 295 | 49.7 | 1.53 | DE, EU |
| China (CN) | 1105 | 48.8 | 0.79 | US, GB, EU, DE |
| Japan (JP) | 405 | 48.5 | 1.32 | DE, EU, GB, US |
| G20 Member | Sample | CsrScore Adj. Mean | SE | Sig. Differences 1 |
|---|---|---|---|---|
| Turkey (TR) | 73 | 55.0 | 3.14 | US, SA, CN |
| United Kingdom (GB) * | 527 | 54.2 | 1.17 | US, SA, MX, JP |
| South Africa (ZA) | 114 | 49.8 | 2.51 | US, SA, CN |
| Australia (AU) * | 358 | 48.5 | 1.43 | US, SA, JP, CN |
| Italy (IT) | 82 | 48.3 | 2.96 | US, JP, SA |
| Germany (DE) | 186 | 47.6 | 1.96 | US, SA, JP |
| European Union (EU) | 1136 | 47.1 | 0.79 | US, SA, JP, GB |
| India (IN) * | 221 | 46.3 | 1.80 | US, JP, SA, CN |
| Indonesia (ID) | 39 | 45.0 | 4.29 | US |
| Argentina (AR) | 24 | 44.8 | 5.47 | - |
| France (FR) | 148 | 43.0 | 2.21 | US, JP, SA, GB |
| Canada (CA) * | 295 | 41.9 | 1.56 | US, JP, GB |
| Brazil (BR) | 36 | 40.7 | 4.47 | - |
| Russia (RU) | 16 | 37.3 | 6.70 | - |
| China (CN) | 1105 | 36.6 | 0.81 | US, GB, EU, DE |
| Mexico (MX) | 69 | 35.2 | 3.23 | TR, GB |
| Japan (JP) | 405 | 29.7 | 1.35 | ZA, TR, CN |
| South Korea (KR) | 22 | 28.4 | 5.72 | TR, GB |
| United States (US) * | 2540 | 27.2 | 0.53 | TR, GB, EU, CN |
| Saudi Arabia (SA) ** | 28 | 19.7 | 5.07 | US, CA, GB, EU |
| G20 Member | Sample | BoardIndep (%) Adj. Mean | SE | Sig. Differences 1 |
|---|---|---|---|---|
| United States (US) * | 2539 | 79.6 | 0.34 | GB, FR, EU, DE, CN |
| Canada (CA) * | 295 | 76.7 | 1.02 | EU, CN, FR, GB, IN |
| Australia (AU) * | 355 | 67.2 | 0.93 | CA, CN, DE, EU, FR |
| South Africa (ZA) | 114 | 64.6 | 1.63 | US, CN, AR, TR |
| United Kingdom (GB) * | 526 | 63.5 | 0.76 | IN, ID, JP, MX |
| European Union (EU) | 1134 | 58.7 | 0.52 | FR, GB, IN, JP |
| South Korea (KR) | 22 | 54.9 | 3.72 | US, TR, CA |
| Italy (IT) | 82 | 53.8 | 1.92 | US, JP, TR, CN, AU |
| Mexico (MX) | 69 | 50.8 | 2.10 | US, TR, ZA, CA |
| India (IN) * | 220 | 47.9 | 1.17 | US, JP, TR, AU |
| Brazil (BR) | 36 | 47.4 | 2.90 | CA, GB, US, ZA, AU |
| Indonesia (ID) | 39 | 47.4 | 2.79 | US, ZA, CA, AU |
| Russia (RU) | 16 | 46.6 | 4.36 | US, AR, AU |
| France (FR) | 148 | 46.4 | 1.43 | GB, JP, TR |
| Germany (DE) | 186 | 43.2 | 1.28 | EU, GB, ZA, CA |
| Saudi Arabia (SA) ** | 28 | 42.4 | 3.29 | US, ZA, AU |
| China (CN) | 1100 | 38.3 | 0.53 | FR, GB, IN, MX, ZA |
| Japan (JP) | 402 | 35.6 | 0.88 | US, MX, ZA, KR, AU |
| Turkey (TR) | 72 | 32.4 | 2.05 | US, ZA, GB, EU, AU |
| Argentina (AR) | 24 | 21.2 | 3.56 | US, CA, AU, EU, etc. |
| G20 Member | Sample | GenDiv (%) Adj. Mean | SE | Sig. Differences 1 |
|---|---|---|---|---|
| France (FR) | 148 | 43.4 | 1.01 | US, GB, JP, KR, etc. |
| Italy (IT) | 82 | 37.4 | 1.35 | GB, DE, CN, CA, etc. |
| European Union (EU) | 1134 | 32.6 | 0.36 | FR, US, JP, KR, etc. |
| South Africa (ZA) | 114 | 32.2 | 1.15 | US, DE, CA, CN, etc. |
| United Kingdom (GB) * | 526 | 30.1 | 0.53 | US, TR, SA, RU, MX |
| Australia (AU) * | 355 | 27.8 | 0.65 | EU, CN, FR, IT, etc. |
| Canada (CA) * | 295 | 26.6 | 0.71 | EU, CN, FR, IT, etc. |
| Germany (DE) | 186 | 26.5 | 0.89 | FR, IN, IT, JP, etc. |
| United States (US) * | 2539 | 25.6 | 0.24 | CN, EU, FR, GB, etc. |
| Turkey (TR) | 72 | 17.3 | 1.44 | EU, DE, GB, FR, etc. |
| India (IN) * | 220 | 16.8 | 0.82 | US, ZA, JP, SA, etc. |
| Brazil (BR) | 36 | 14.7 | 2.04 | EU, DE, FR, GB, etc. |
| China (CN) | 1102 | 13.6 | 0.37 | US, SA, JP, GB, FR |
| Russia (RU) | 16 | 13.2 | 3.06 | ZA, IT, EU, etc. |
| Indonesia (ID) | 39 | 11.0 | 1.96 | ZA, US, IT, GB, etc. |
| Argentina (AR) | 24 | 10.6 | 2.50 | EU, DE, FR, GB, etc. |
| South Korea (KR) | 22 | 10.0 | 2.61 | US, ZA, IT, DE, etc. |
| Mexico (MX) | 69 | 9.89 | 1.47 | US, ZA, IT, EU, etc. |
| Japan (JP) | 402 | 7.82 | 0.62 | US, ZA, IT, EU, etc. |
| Saudi Arabia (SA) ** | 28 | 1.34 | 2.31 | US, ZA, TR, etc. |
| G20 Member | Sample | BoardSkills (%) Adj. Mean | SE | Sig. Differences 1 |
|---|---|---|---|---|
| Japan (JP) | 402 | 63.0 | 0.90 | KR, MX, TR, RU, SA |
| South Africa (ZA) | 114 | 61.1 | 1.67 | EU, DE, BR, RU |
| United States (US) * | 2539 | 58.6 | 0.35 | DE, CN, EU, etc. |
| United Kingdom (GB) * | 526 | 57.5 | 0.77 | ID, IN, IT, KR, MX |
| Canada (CA) * | 295 | 56.9 | 1.04 | DE, EU, FR, IN, AR |
| China (CN) | 1101 | 53.6 | 0.54 | FR, ID, JP, MX, SA, TR |
| Australia (AU) * | 355 | 48.3 | 0.95 | BR, CA, DE, EU, FR, etc. |
| India (IN) * | 220 | 47.7 | 1.20 | JP, MX, SA, US, ZA |
| Italy (IT) | 82 | 39.8 | 1.97 | US, ZA, JP, CN, CA |
| Russia (RU) | 16 | 39.3 | 4.46 | ZA, US, DE |
| Turkey (TR) | 72 | 39.1 | 2.10 | US, ZA, DE, CA |
| South Korea (KR) | 22 | 36.7 | 3.80 | US, ZA, CA, CN |
| Indonesia (ID) | 39 | 31.7 | 2.85 | IN, JP, US, ZA, CA |
| France (FR) | 148 | 31.0 | 1.47 | GB, IN, JP, US, ZA |
| Mexico (MX) | 69 | 30.9 | 2.14 | US, ZA, CA |
| Brazil (BR) | 36 | 30.6 | 2.97 | CA, CN, GB, IN, JP, US |
| European Union (EU) | 1134 | 29.8 | 0.52 | US, GB, IN, JP, CN, TR |
| Argentina (AR) | 24 | 23.0 | 3.64 | AU, CN, GB, US, IN, etc. |
| Saudi Arabia (SA) ** | 28 | 22.5 | 3.37 | US, ZA, GB, CA |
| Germany (DE) | 186 | 18.7 | 1.31 | EU, FR, GB, IN, IT, JP |
| G20 Member | Sample | AuditTenure (Years) Adj. Mean | SE | Sig. Differences 1 |
|---|---|---|---|---|
| Canada (CA) * | 294 | 11.9 | 0.33 | CN, DE, EU, FR, GB, etc. |
| United States (US) * | 2539 | 11.6 | 0.11 | ZA |
| Argentina (AR) | 24 | 8.58 | 1.17 | - |
| Japan (JP) | 402 | 8.42 | 0.29 | TR, US |
| Australia (AU) * | 358 | 7.62 | 0.31 | IT, DE, CA, CN, US |
| Mexico (MX) | 65 | 7.40 | 0.71 | US |
| South Africa (ZA) | 114 | 6.64 | 0.54 | US, CA, IN |
| United Kingdom (GB) * | 527 | 6.41 | 0.25 | IN, JP, US |
| European Union (EU) | 1132 | 5.84 | 0.17 | AU, IN, JP, US |
| France (FR) | 147 | 5.56 | 0.47 | JP, US |
| China (CN) | 1104 | 5.33 | 0.17 | JP, US, CA |
| Indonesia (ID) | 39 | 5.15 | 0.91 | US |
| Germany (DE) | 186 | 5.13 | 0.42 | JP, US |
| Italy (IT) | 80 | 4.49 | 0.64 | JP, US |
| Russia (RU) | 16 | 4.31 | 1.43 | US |
| Turkey (TR) | 73 | 3.88 | 0.67 | US, AU |
| South Korea (KR) | 21 | 3.79 | 1.25 | US |
| Saudi Arabia (SA) ** | 28 | 3.70 | 1.08 | US |
| India (IN) * | 221 | 3.67 | 0.38 | JP, US, ZA, MX |
| Brazil (BR) | 36 | 3.63 | 0.95 | JP, CA, US |
| Variable | Hypothesis Status | Sig. Differences |
|---|---|---|
| Governance Pillar Score | Confirmed | Between the upper half and lower half of the sample |
| Management Score | Confirmed | Between best performers and worst performers |
| Shareholder Rights Score | Confirmed | Between best performers and worst performers |
| CSR Score | Confirmed | Between the upper half and lower half of the sample |
| Board independence | Confirmed | Between almost all countries in the sample |
| Board gender diversity | Confirmed | Between almost all countries in the sample |
| Board-specific skills | Confirmed | Between almost all countries in the sample |
| Auditor tenure | Confirmed | Between the upper half and lower half of the sample |
Publisher’s Note: MDPI stays neutral with regard to jurisdictional claims in published maps and institutional affiliations. |
© 2022 by the author. Licensee MDPI, Basel, Switzerland. This article is an open access article distributed under the terms and conditions of the Creative Commons Attribution (CC BY) license (https://creativecommons.org/licenses/by/4.0/).
Share and Cite
Dragomir, V.D. Comparative Evidence on Corporate Governance Outcomes in the G20 Countries. World 2022, 3, 993-1008. https://doi.org/10.3390/world3040056
Dragomir VD. Comparative Evidence on Corporate Governance Outcomes in the G20 Countries. World. 2022; 3(4):993-1008. https://doi.org/10.3390/world3040056
Chicago/Turabian StyleDragomir, Voicu D. 2022. "Comparative Evidence on Corporate Governance Outcomes in the G20 Countries" World 3, no. 4: 993-1008. https://doi.org/10.3390/world3040056
APA StyleDragomir, V. D. (2022). Comparative Evidence on Corporate Governance Outcomes in the G20 Countries. World, 3(4), 993-1008. https://doi.org/10.3390/world3040056