Article

Concrete vs. Ceramic Blocks: Environmental Impact Evaluation Considering a Country-Level Approach

by
Lucas R. Caldas
1,2,*,
Francesco Pittau
3,
Roberto Schaeffer
4,
Anna K. E. B. Saraiva
1,
Rayane de L. M. Paiva
1 and
Romildo D. Toledo Filho
1
1
Civil Engineering Program (PEC), COPPE, Universidade Federal do Rio de Janeiro (UFRJ), Cidade Universitária, Ilha do Fundão, Rio de Janeiro 21941-972, Brazil
2
Graduate Program in Architecture (PROARQ), FAU, Universidade Federal do Rio de Janeiro (UFRJ), Cidade Universitária, Ilha do Fundão, Rio de Janeiro 21941-901, Brazil
3
Department of Architecture, Built Environment and Construction Engineering (ABC), Politecnico di Milano, Via G. Ponzio 31, 20133 Milan, Italy
4
Centre for Energy and Environmental Economics (CENERGIA), Energy Planning Programme (PPE), COPPE, Universidade Federal do Rio de Janeiro (UFRJ), Cidade Universitária, Ilha do Fundão, Rio de Janeiro 21941-972, Brazil
*
Author to whom correspondence should be addressed.
World 2021, 2(4), 482-504; https://doi.org/10.3390/world2040030
Submission received: 4 October 2021 / Revised: 4 November 2021 / Accepted: 12 November 2021 / Published: 17 November 2021

Abstract

:
In continental countries, building materials are often moved over long distances from factories to building sites. This is especially important when quality and performance certification systems are required for the building materials’ acquisition. In this scenario, the transportation phase tends to have a great contribution to building materials’ environmental impacts. Taking into consideration that countries such as China, India, and Brazil, i.e., continental countries, are expecting the largest future housing demand, the issue of transportation will have a crucial role in environmental impacts. Through a Brazilian case study, the present work investigates the potential environmental impacts of structural masonry made of concrete and ceramic blocks certified by the Brazilian Quality Program. A cradle-to-site Life-Cycle Assessment (LCA) is carried out while considering a country-level approach using data from the literature and Ecoinvent. The results show that ceramic blocks are preferable for most states and scenarios. Human Health and Ecosystem Quality are the two categories most affected by transportation, and they can reach more than 96% and 99%, respectively. The efficiency of the building material transportation system plays an important role in reducing greenhouse gas emissions. A shift in building components from concrete to ceramic blocks has the potential to mitigate between 154 and 229 Mt CO2-eq between 2020 and 2050. The methodological approach used in this work can be applied to other building materials and other countries, especially those of continental dimensions that are expected to have a significant future housing demand.

1. Introduction

1.1. Contextualization: Housing Landscape in Brazil

The environmental impacts of the construction sector have been a subject of extensive discussions on a global level. Currently, the quest for environmental sustainability has become the target of many building projects, including the United Nations (UN) Sustainable Development Goals (SDGs), which strive to provide sustainable, dignified, and resilient housing for all [1]. The demand for construction is mainly concentrated in emerging economies, such as those in Asia, Africa, and South America, including Brazil [2].
This construction demand will result in increasing consumption of raw materials and in environmental impacts, which need to be quantified. One way to measure the environmental sustainability of buildings and their components is through a Life-Cycle Assessment (LCA), which evaluates all of the resources’ inputs, including energy, water, and material consumption, together with environmental loadings, including CO2-eq emissions and the liquid and solid wastes of products and processes [3].
Unlike in small-to-midsize countries, Brazil’s road transportation distances are large, and the influence of the transportation stage may be significant in terms of environmental impacts. Moreover, Brazil, as a developing economy, risks negatively influencing the impact of the building sector in the upcoming years. Currently, there is a housing deficit in Brazil, and to overcome this problem, previous Brazilian governments initiated a large social housing program named “My house, my life” [4]. According Pinheiro [5], in 2014, there was a Brazilian housing shortage of an estimated 6 million units. Brazil adopted an important constructive system of building social dwellings of structural masonry, which is normally composed of concrete or ceramic blocks, depending on local availability and material costs.
In Rio de Janeiro, among other states, it is estimated that at least 50% of social housing is built of structural masonry using ceramic or concrete blocks [6], and this percentage is expected to increase shortly due to the quality improvements in blocks and skilled labor. Paulsen and Sposto [4] evaluated Brazilian social housing buildings’ structural systems that were made with ceramic blocks and concluded that they presented a percentage in mass equal to 63% of that of the whole house. Therefore, the significance of walls in the total mass of a house is high, especially when used as a structural system.
To improve the quality of the building sector, the Brazilian government developed the Qualification System of Materials, Components, and Constructive Systems (SiMaC), which has been implemented within the Brazilian Program of Productivity and Habitat Quality (PBQP-H). Brazilian Quality Programs (Programas Setoriais da Qualidade (PSQ)) were created for each building material (e.g., ceramic blocks, concrete blocks, steel profiles, cement binders, etc.). Every building material manufacturer can apply the PSQ, but the fulfillment of the quality standards and rules is required to be classified and to receive the label. All PSQ-classified manufacturers are listed in an open-access database [7]. This action aims to create a competitive isonomy and an environment with technical compliance, which enables quality and technological evolution, increases productivity, and reduces costs.
In structural masonry, since the walls and, consequently, the blocks are responsible for building stability and structural safety, it is highly recommended that builders buy their blocks from companies certified in PSQ. Unfortunately, the current number of PSQ-classified manufacturing companies is still relatively low, and their distribution in the country is not homogeneous. Thus, the impact of material transportation from manufacturing to construction sites may be very significant. It is important to highlight that Brazil has an extensive territory with different levels of technological development among its five regions (Northern, Northeastern, Central-western, Southeastern, and Southern), which results in high variability in materials’ availability and quality in these regions.

1.2. Construction Sector and Life Cycle Assessment (LCA)

Recently, the number of international studies related to LCA in the construction sector has increased enormously [8,9]. Some of them applied LCA for very diverse building materials and components, such as cement [10], bamboo [11], conventional building materials [12], wood products [13,14], other bio-based materials, earth materials [15], concrete [16,17,18], and recycled materials [19,20,21]. In terms of recycled materials, special attention is given to studying recycled aggregates, some of them using LCA and Life-Cycle Costs (LCC); for example, the Sustainable Aggregates Resource Management project (SARMa) [22]. The interest in a circular economy process tends to demand more studies concerned about transportation, since local waste, in some cases, will be transported over great distances, resulting in higher costs and GHG emissions [23]. Other researchers studied LCAs when applied to walls and buildings [24,25,26,27,28]. However, most LCA studies of buildings process transportation in a very specific manner (e.g., considering just one fixed distance), and frequently, this phase is not even considered, claiming it to be insignificant when related to the environmental impacts of the entire life cycle. Some studies, e.g., that of Göswein et al. [29], proposed a combination of LCA with geospatial analysis by using a Geographical Information System (GIS) to assess the transportation-related impacts of raw materials for concrete production.
Some researchers compared the environmental impacts of concrete and ceramic blocks by using LCA methods. Condeixa et al. [30] and Souza et al. [31] applied LCAs to compare the environmental impacts of ceramic and concrete roofing tiles in the Brazilian context. They concluded that ceramic tiles have less of an impact on most of the impact categories, including non-renewable energy and global warming. Souza et al. [32] also studied the Brazilian context and, particularly, building materials for wall systems. They compared ceramic and concrete alternatives, and according to their results, a better environmental performance of ceramic block walls can be expected, especially due to the wood chips used in the firing process, while concrete blocks use a large amount of Portland cement. Contrarily, Bueno et al. [33] found better values for the environmental impacts of concrete blocks when compared to ceramic blocks. However, general data were used for inventory analyses.
In all of these studies, the quality of production (in terms of PSQs) and transportation stage from the factory to the construction site were not accounted for, especially while considering a country-level approach through which the distribution of factories in Brazil could be analyzed. At first, one type of block can seem more advantageous in terms of environmental impacts. However, longer transportation distances can change the results completely, especially in countries with continental dimensions, as in the case of Brazil, as well as when quality aspects are considered. In summary, the evaluation of the quality aspect and the transportation can have a very important influence on decision making.
Although several comparative studies have already been carried out, the literature offers a limited amount of data on the influence of transporting both block types in different Brazilian regions. Caldas and Sposto [34] are some of the few who evaluated the CO2-eq emissions during this stage. However, they did not evaluate how the efficiency of transportation can influence the results. In comparison with international studies, there is also a lack of LCA studies that focus on the transportation phase.
An important justification for a stronger focus on material transportation is the trend of future energy efficiency requirements, which will contribute to a significant decrease in the operational energy consumption of buildings [35]. According to Weißenberger et al. [36], the European Union guidelines (2010/31/EU) imposed a nearly zero-energy building (NZEB) standard for new buildings by 2020. In this sense, future building projects, including those in developing countries, such as Brazil, will be highly influenced by the material selection, which threatens to shift the impacts from operational energy to manufacturing and construction, including transportation.

1.3. Research Questions and Objectives of the Study

This work raises the following research questions: (1) Which type of block has fewer environmental impacts when a country-level evaluation is considered? (2) What is the environmental impact contribution of factory-to-site transportation? (3) How are the environmental impacts and the distribution of factories related to the future housing deficit?
Based on the previous research questions, our study has three main objectives: (1) comparison between cradle-to-site impacts of concrete and ceramic blocks; (2) evaluation of the transportation stage’s contribution in relation to total impacts; (3) evaluation of the reduction of climate change potential related with the housing deficit. The research scope is restricted to the blocks’ production and transportation from different kinds of factories (according to PSQs) to construction sites.
The main contribution of our research is to call attention to cases where quality affects the choice of manufacturer, and consequently, the transportation from factory to site can have a great influence on the environmental impacts, especially in countries with continental dimensions, such as Brazil. Finally, these data can be combined with the country’s housing deficit data.
We also considered different sensitivity analysis aspects (block production, transportation efficiency, and vehicle emission standards). The method employed in this study and the data found here can be applied to other continental countries that have a large housing deficit and may serve as guidelines for public policies related to the environmental impact of transportation in the building sector. To our knowledge, this is the first study to focus on these issues.

2. Methodological Overview

The materials and methods are divided into the following steps: (1) block specification, factory, and site locations; (2) Life-Cycle Assessment (LCA); (3) Brazilian housing deficit and reduction of climate change potential.

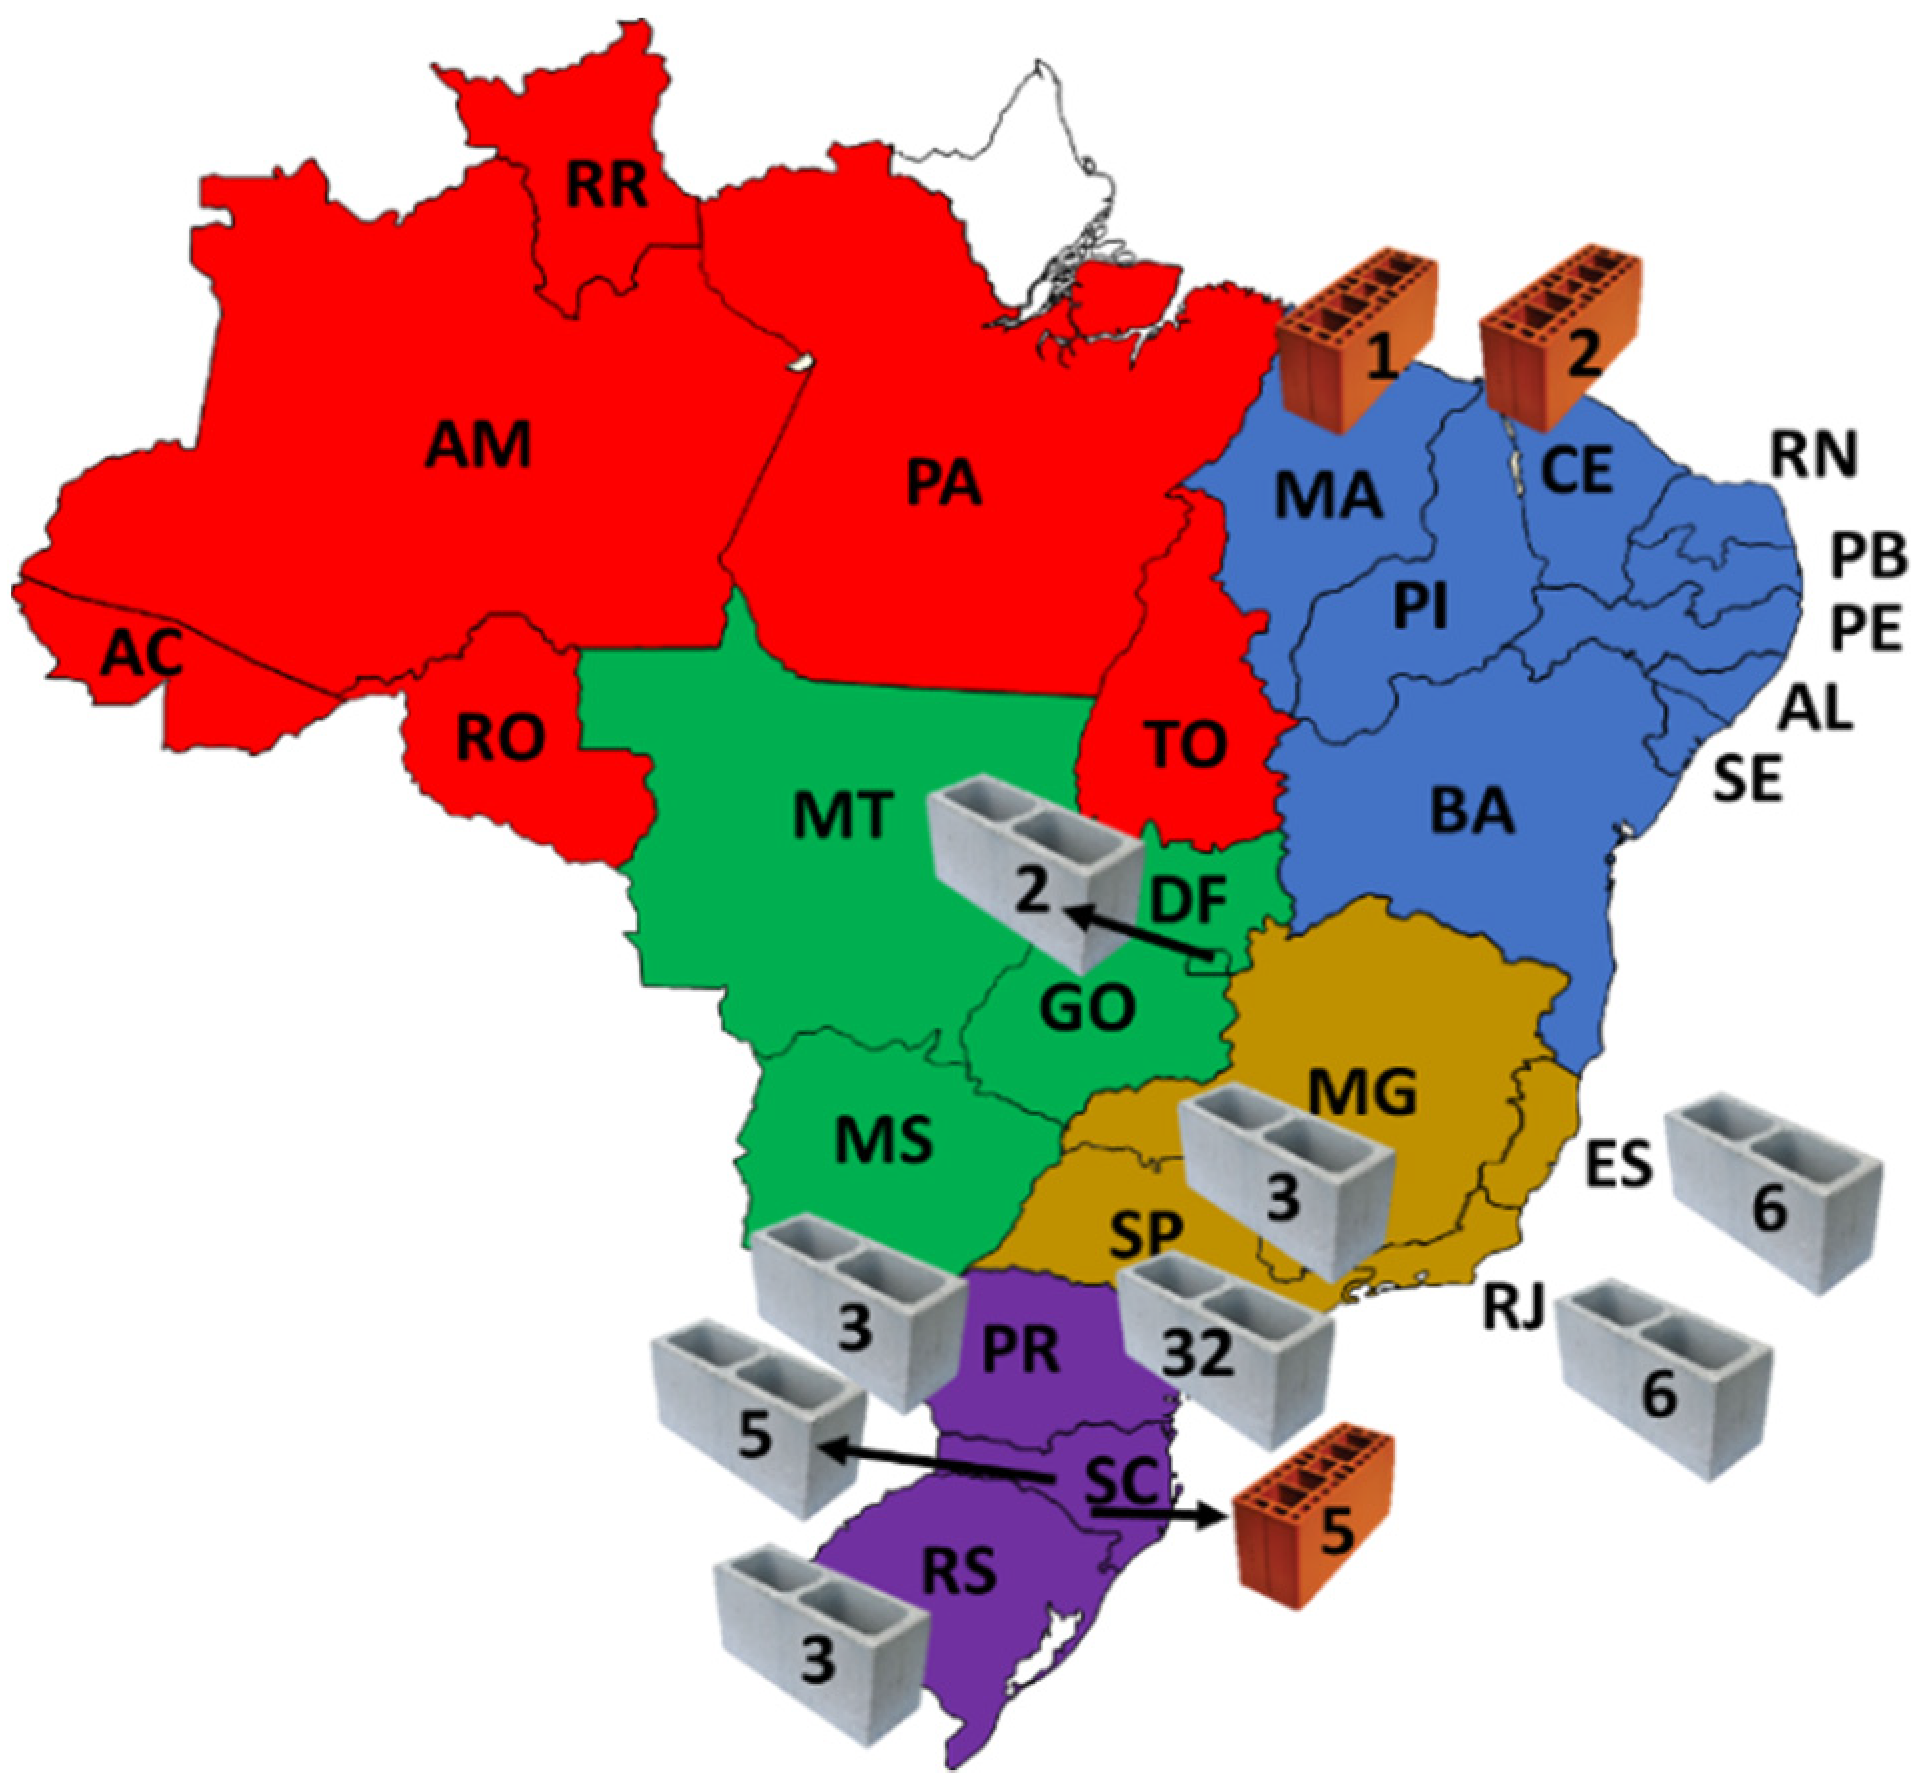
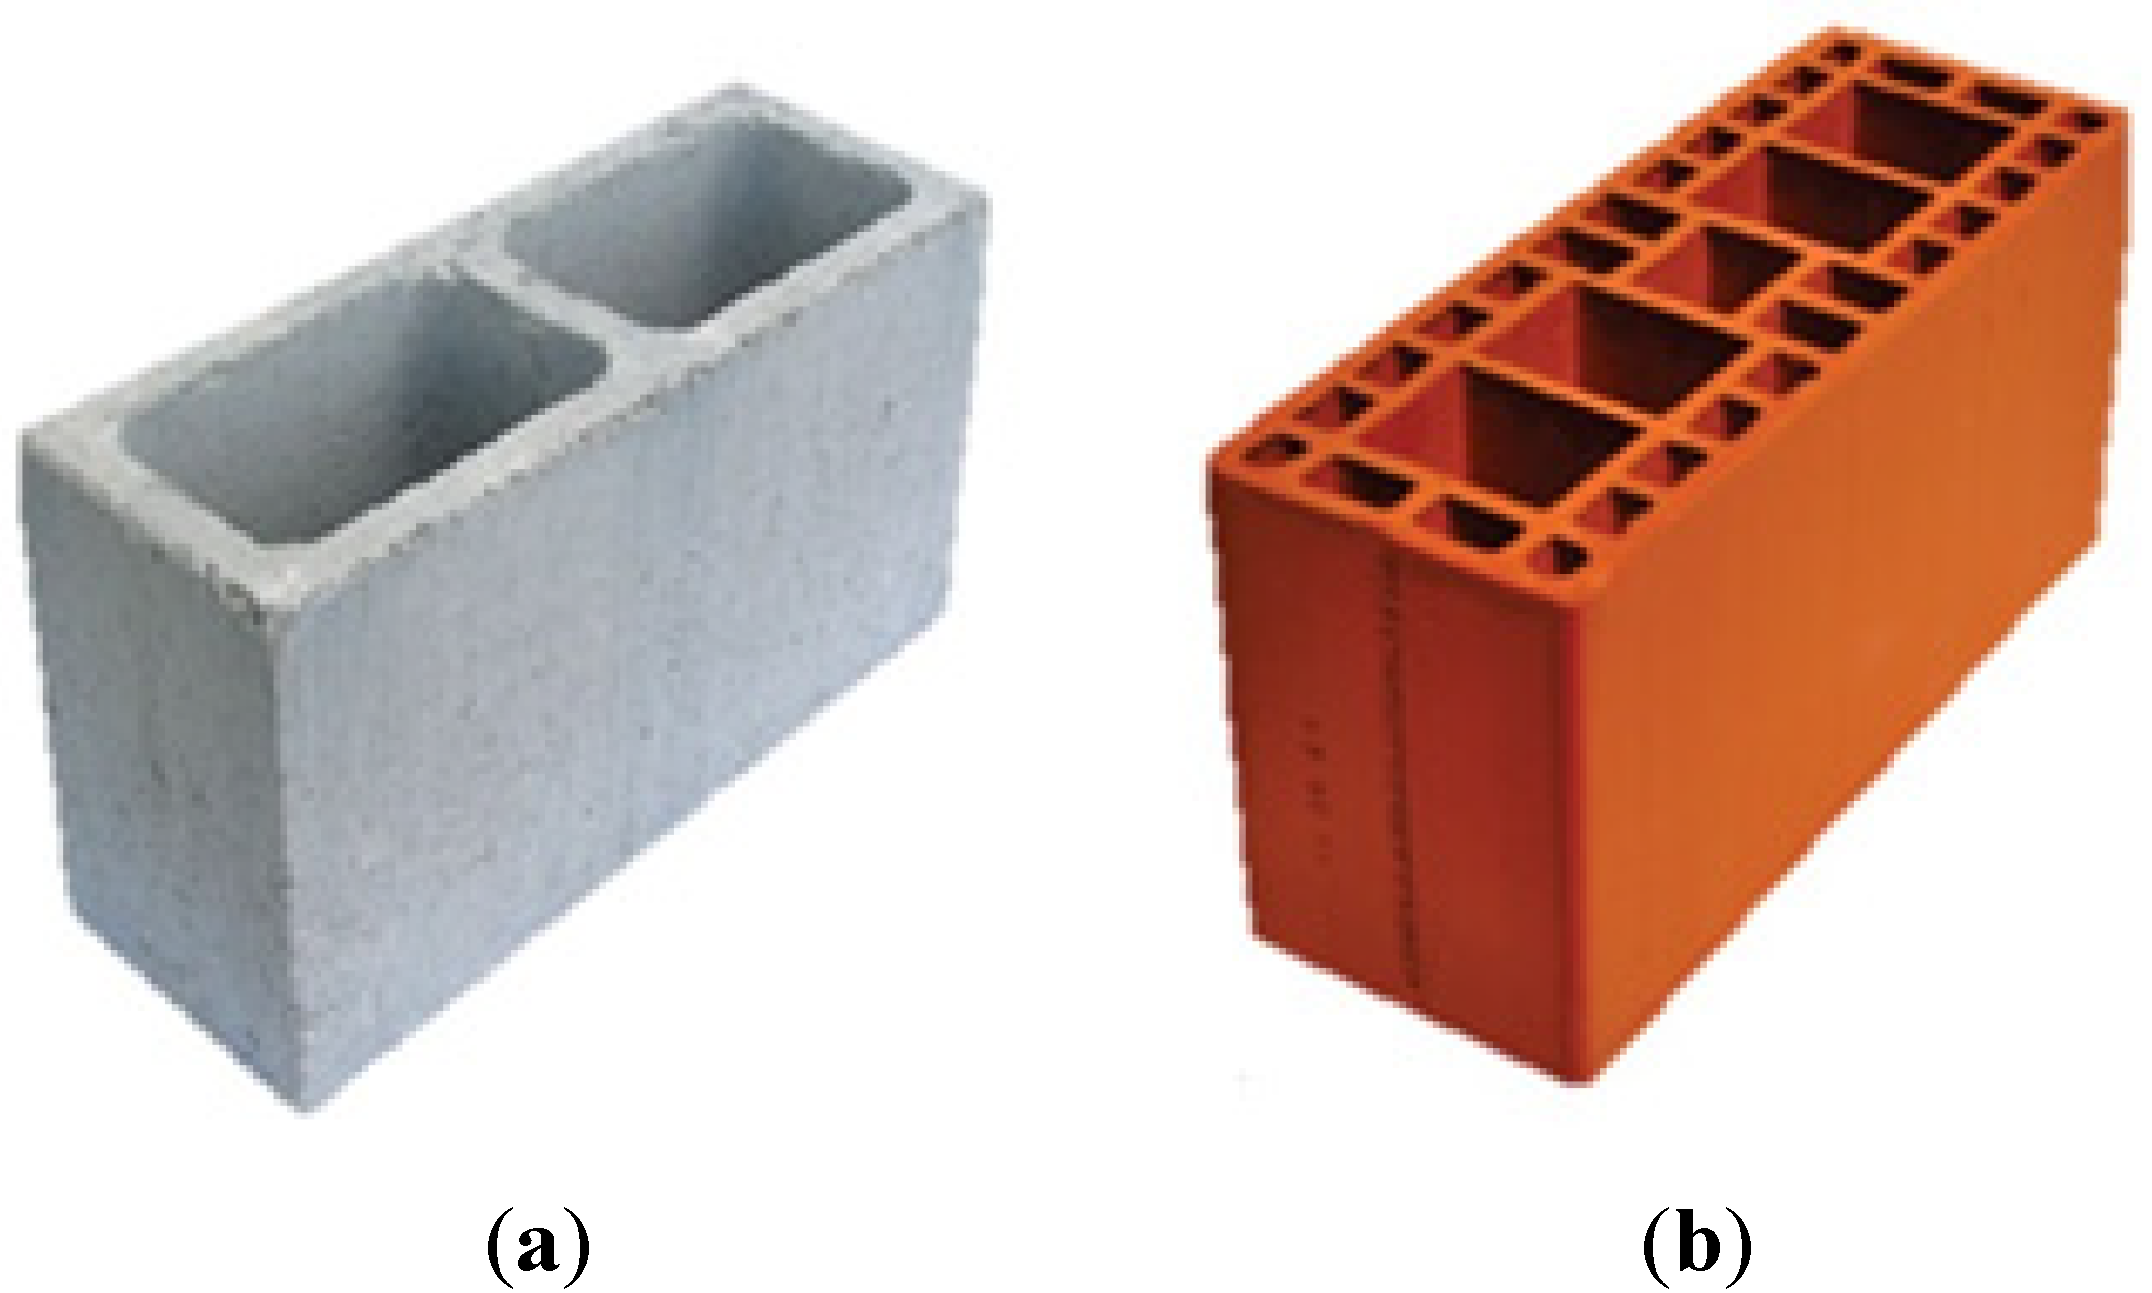
2.1. Block Specification, Factory, and Site Locations

Brazilian concrete and ceramic structural blocks were chosen according to the specifications shown in Figure 1 and Table 1, since both have the same dimensions and structural functions. Although they have differences in terms of thermal, acoustic, and other properties, their comparison is valid on the level of a building system (e.g., wall element). Since a wall is composed of other materials, such as steel reinforcements, mortar coverings, paint, etc., the blocks tend to have similar performance and service life, and the comparison between them is justified. Although the materials are different in terms of their physical, mechanical, thermal, and other properties, they can be compared, since they are competitive technologies in the Brazilian market. They have equal dimensions and are used for the same applications. Souza et al. [32], Bueno et al. [33], and Caldas et al. [37] have already compared these elements using LCAs.
We selected factories that were classified in the PSQ and defined the site locations in a central area of each chosen city. Data from the factories were listed in an electronic report [7], and the distances were measured by using Google Maps [39]. We adopted the shortest distances between the factories and the site locations. The values are presented in the Supplementary Material (Figure S1).
The chosen cities were the 26 Brazilian state capitals, divided by region (Figure 2):
  • Northern region: Rio Branco—AC, Manaus—AM, Belém—PA, Porto Velho—RO, Boa Vista—RR;
  • Northeastern region: Maceió—AL, Salvador—BA, Fortaleza—CE, São Luis—MA, João Pessoa—PB, Recife—PE; Teresina—PI, Natal—RN, Aracaju—SE;
  • Central-western region: Brasília—DF, Goiânia—GO, Cuiabá—MT, Campo Grande MS;
  • Southeastern region: Vitória—ES, Belo Horizonte—BH, São Paulo—SP, Rio de Janeiro—RJ;
  • Southern region: Curitiba—PR, Porto Alegre—RS, Florianópolis—SC.

2.2. Life-Cycle Assessment (LCA)

2.2.1. Objective and Scope of the LCA and Functional Unit

The objective of this LCA study was to compare the potential environmental impacts of concrete and ceramic blocks while assuming a country-level approach. In this study, as a structural unit, we adopted one square meter (1 m²) of the built wall and the classification of block factories in their respective PSQs. The joint and mortar coatings were not considered because the two material systems have the same mortar consumption.
The LCA scope adopted in this study was cradle to site. According to EN 15978 [40], we considered the extraction and processing of raw materials (A1), transportation (A2) and manufacturing of the building materials (A3), and the transportation from factories to the site location (A4).
We considered this scope because one of the main objectives of this research was to evaluate the influence of the A4 stage. The other stages, including wall construction (A5), use (B1–B5), and end of life (C1–C4), were not considered because the two blocks and walls tend to have very similar construction processes, characteristics, and performance (in terms of service life and durability) in use. Normally, during the walls’ life cycle, the main structure (e.g., blocks or bricks) is not replaced—just the outer layers, such as coatings and finishing, are replaced [37]. Then, it makes no sense to consider this stage. In terms of the end-of-life stage, the waste generated when these walls are demolished can be classified as inorganic material and should be destined for inert landfills or recycling plants. In addition, the end-of-life stage of inorganic building materials normally has negligible impacts (below 5%) when compared to other life-cycle stages [41,42].

2.2.2. Life Cycle Inventory (LCI)

For the block production, in the A1–A3 stages, data from Souza et al. [32] were used. These researchers quantified the environmental impacts of ceramic and concrete blocks in the Brazilian context. For the ceramic block production, the following stages were considered: clay extraction, preparation of dough, forming operations, drying, firing (using wood chips as fuel), and packing. For the concrete blocks, the following stages were considered: raw material extraction (cement, aggregates, and water), mixing, shaping, curing, and packing. Electricity and diesel are used as fuels in both blocks’ production processes.
In Brazil, according to the Brazilian Ministry of Mines and Energy [43], the ceramic sector consumes natural gas in the ceramic blocks’ firing stage. Therefore, it is important to evaluate how the environmental impacts of the production process of ceramic blocks are affected when natural gas is used (called Ceramic—Natural Gas here) instead of wood chips (called Ceramic—Wood Chips here).
The modal road division was adopted for the transportation stage (A4). As road transportation of building materials in Brazil is mostly done by diesel trucks, our focus was on diesel fuel, as stated by Morales et al. [28] and Souza et al. [32].
According to Souza et al. [32], the ceramic blocks’ transportation load is around 14 t/load. We considered trucks with 10 to 20 t, EURO 3, from the Ecoinvent v.3.3 database. EURO 3 refers to the European Emission Standard for vehicles produced in 2000. In Brazil, trucks used for transportation of building materials, such as blocks, are mostly old. Therefore, the adoption of EURO 3 vehicles is a reasonable assumption.
Since this study focused on the transportation phase, a sensitivity analysis on this stage was carried out. The return of trucks, empty or loaded, and the change to the EURO 5 emission standard were considered. The following scenarios were evaluated by using the Ecoinvent v.3.3 database:
  • Loaded 100%: 1 tkm Transport, truck 10–20 t, EURO3, 100%LF, default/GLO mass;
  • Loaded 50% with empty return: 1 tkm Transport, truck 10–20 t, EURO3, 50%LF, empty return/GLO;
  • Loaded 100%: 1 tkm Transport, truck 10–20 t, EURO5, 100%LF, default/GLO mass;
  • Loaded 50% with empty return: 1 tkm Transport, truck 10–20 t, EURO5, 50%LF, empty return/GLO.
The final results (the impacts considering the production and transportation phases) were calculated as averages and errors in terms of the standard deviation for each location, which is the same approach adopted by Caldas et al. [23].

2.2.3. Life Cycle Impact Assessment (LCIA)

The LCIA method IMPACT 2002+ (version 2.12) was used in this research. The datasets and sources are detailed and presented in the Supplementary Material (Table S1).
This method was chosen to reduce the number of impact categories to be evaluated in the study and to facilitate the interpretation of the results. In addition, it was used based on other studies that evaluated the environmental impacts of materials and buildings in the Brazilian context, such as those of Souza et al. [31], Souza et al. [32], and Caldas et al. [44], which facilitated future comparisons. The impacts are presented in four damage categories: (1) Climate Change (expressed in kg CO2-eq); (2) Human Health (in DALY); (3) Ecosystem Quality (in PDF.m². year); (4) Resources Depletion (in MJ Primary).

2.3. Brazilian Housing Deficit and Reduction of Climate Change Potential

Data from Brazilian Ministry of Cities [45] were used to account for the reduction of climate change emission potential due to the choice of different wall alternatives concerning each Brazilian state and the housing deficit in each state. According to this study, data on the housing deficit were shared for each Brazilian state, and each one had different values and different growth rates.
We employed the econometric probit logistic regression model. The fraction of houses in the housing stock was influenced by variables such as availability of urban space, housing size, household income, the apartment’s relative price, geographic location, etc. [45]. The database consisted of 297 pieces of information from 27 units of the Brazilian Federation over 11 years, beginning in 2004. The following variables were used to estimate the model: percentage of apartments in the housing stock, urban population density, household size, rent, and relative price. Only three of the 84 coefficients found were not significantly different from zero at the significance level of 5%. The detailed modeling can be accessed at the Brazilian Ministry of Cities [45].
In combination with the climate change values for each state, a more realistic scenario could be recreated. We chose climate change, as it is a global impact indicator and it is related to the fact that Brazil is part of the Paris Agreement and made a public Nationally Determined Contribution (NDC) in 2016.
Considering the number of dwellings that need to be built to meet the housing deficit, CO2-eq emissions were calculated by examining the construction of three standard projects of one, two, and three bedrooms. The chosen projects were typical popular Brazilian building projects that were defined by national standards [46,47] and were similar to the projects used by Condeixa et al. [30] with one bedroom and 98.9 m² of wall/unit (39.6 m² of built area), two bedrooms and 154.9 m² of wall/unit (61.9 m² of built area), or three bedrooms of 266.1 m² of wall/unit (106.4 m² of built area).
The total CO2-eq emissions due to the housing deficit reduction were calculated for each state according to Equation (1). They were summed up to have the total CO2-eq emissions for Brazil in order to evaluate the best and worst transportation scenarios. The same equation was used to calculate the other environmental damages investigated.
T C O 2 E = i = 2020 t C O 2 E   x   N ( ti ) ×   Ewa ( ti ) 10 9
where: TCO2E—total CO2-eq emissions due to the housing deficit reduction (MtCO2-eq); t—year 2050; i—year 2020; CO2E—CO2-eq emissions of the constructive solution (ceramic or concrete blocks) (kgCO2-eq /m²); N(ti)—total number of new units per state per year i (unit/year); Ewa—equivalent wall area per housing unit per year i (m²/unit).
Details on the data and calculation model used in this study can be found in the Supplementary Material (Table S2).

3. Results

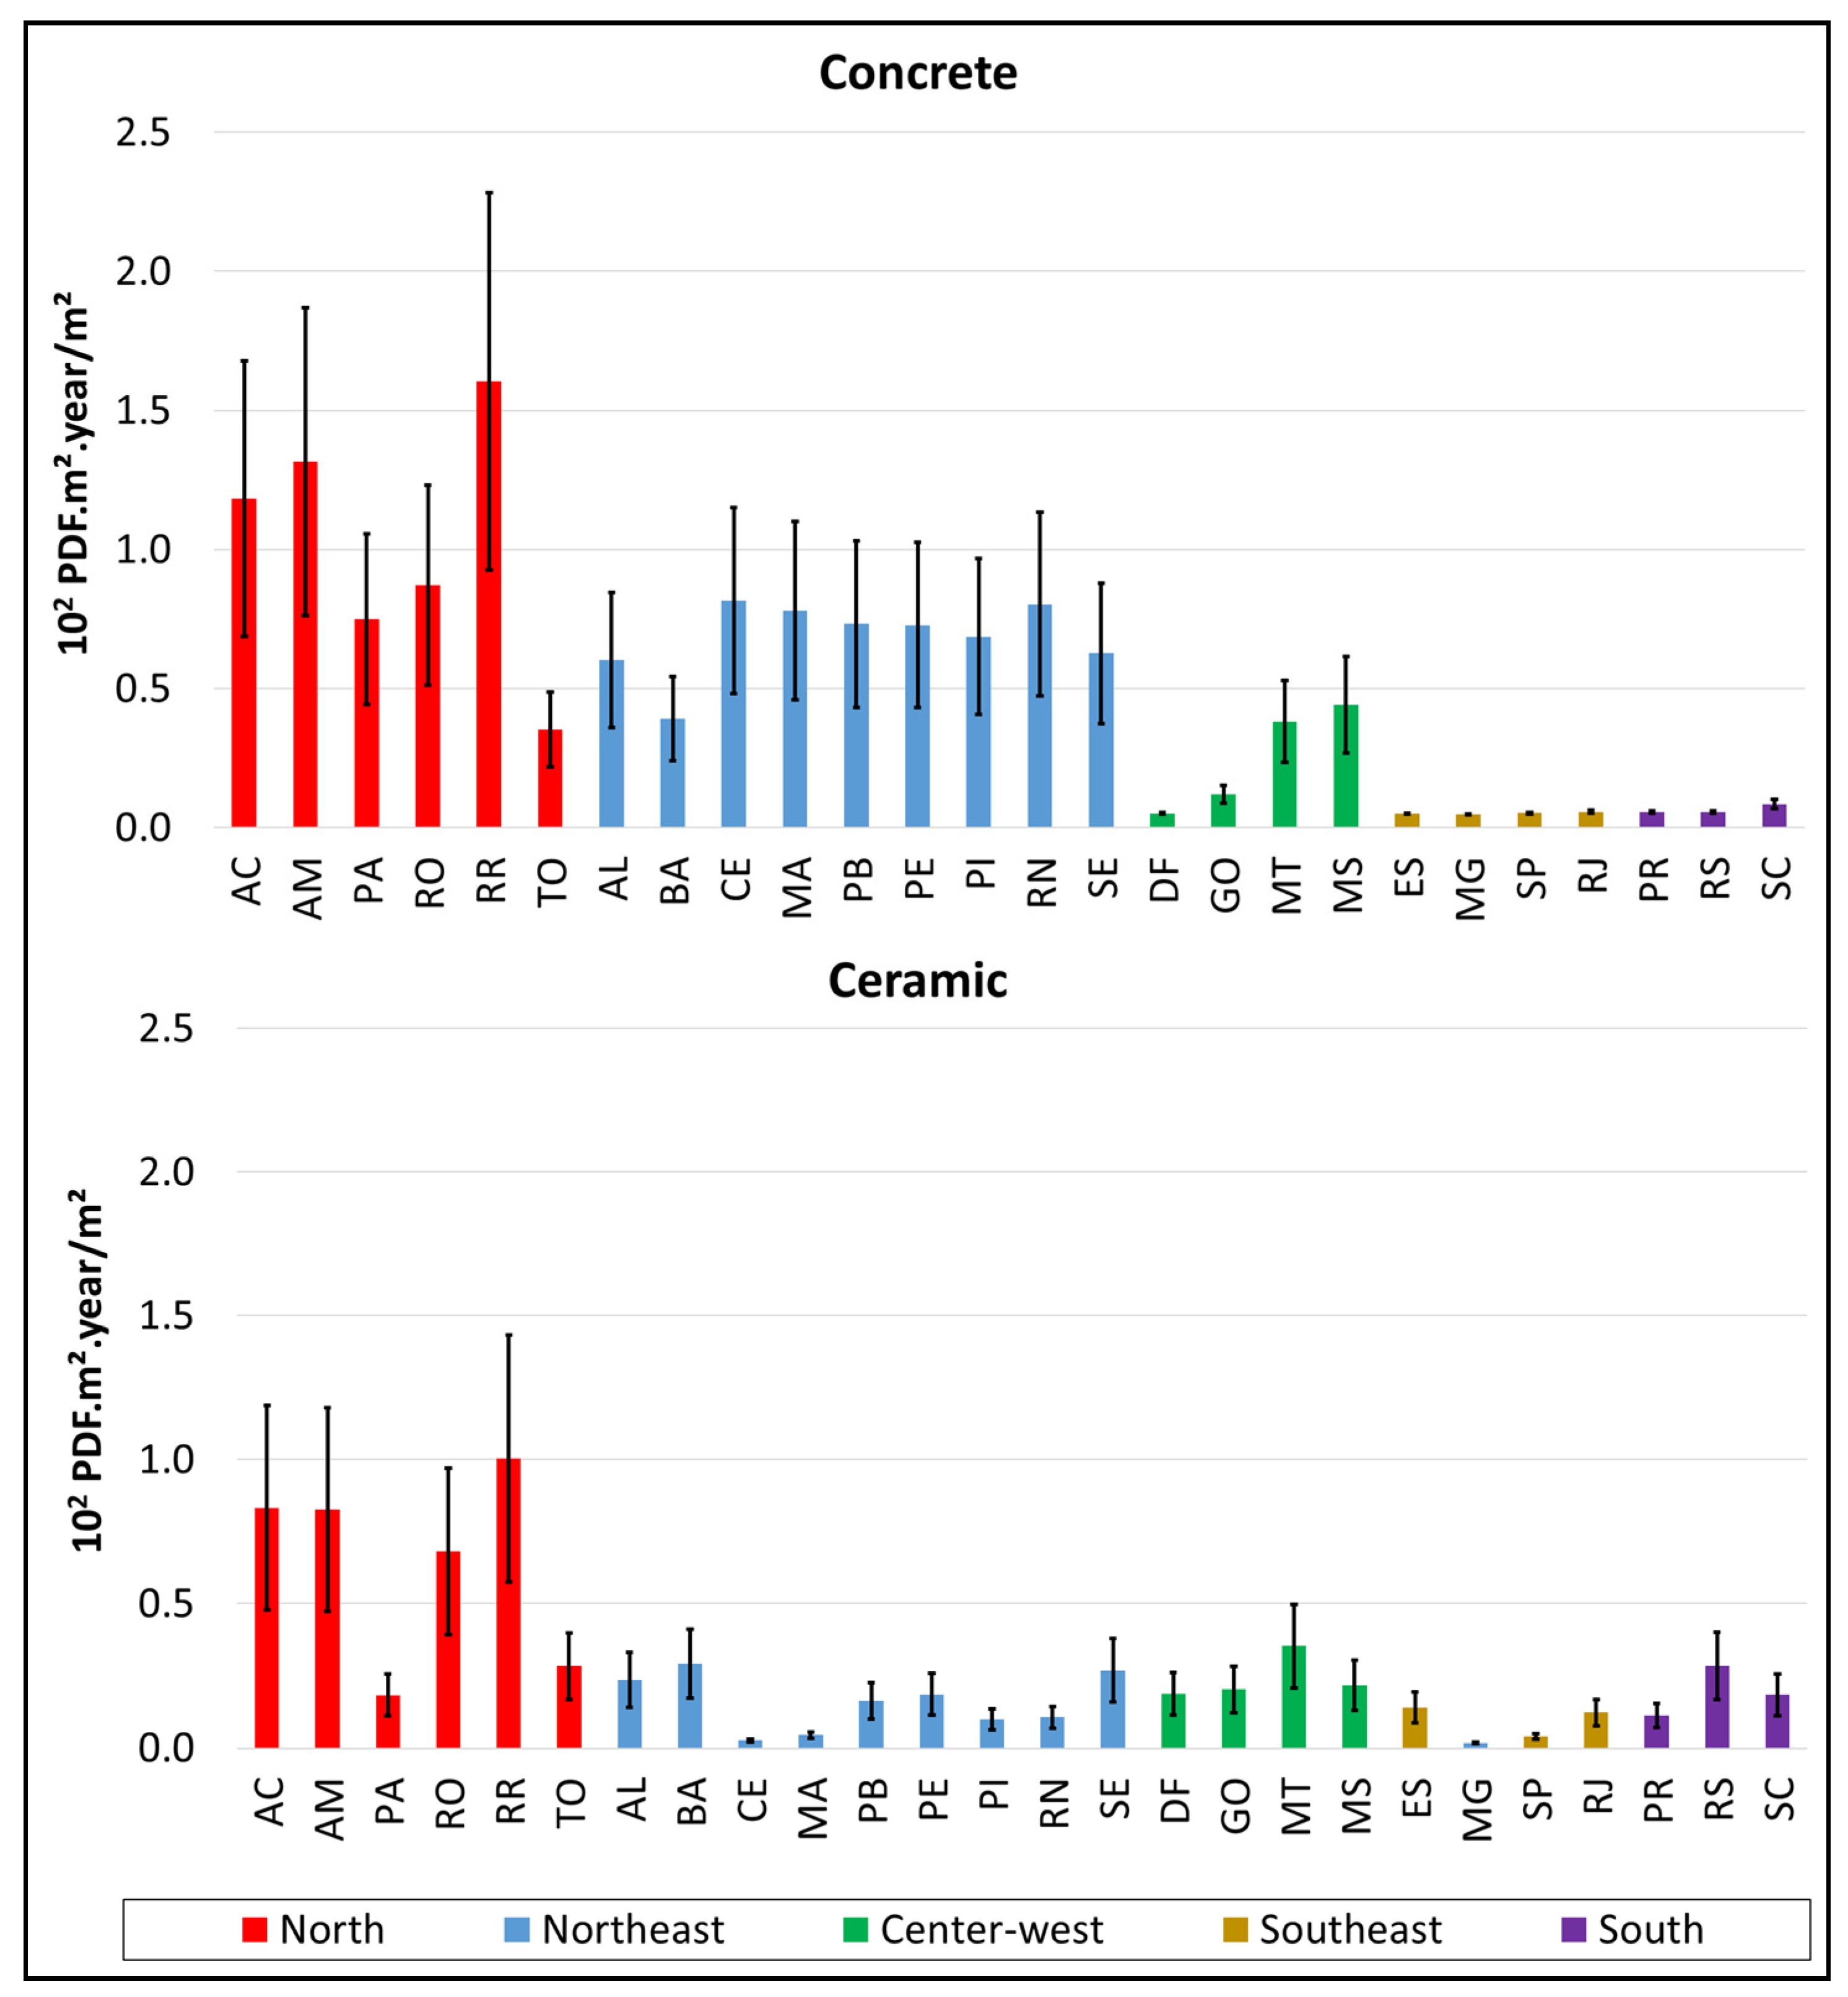
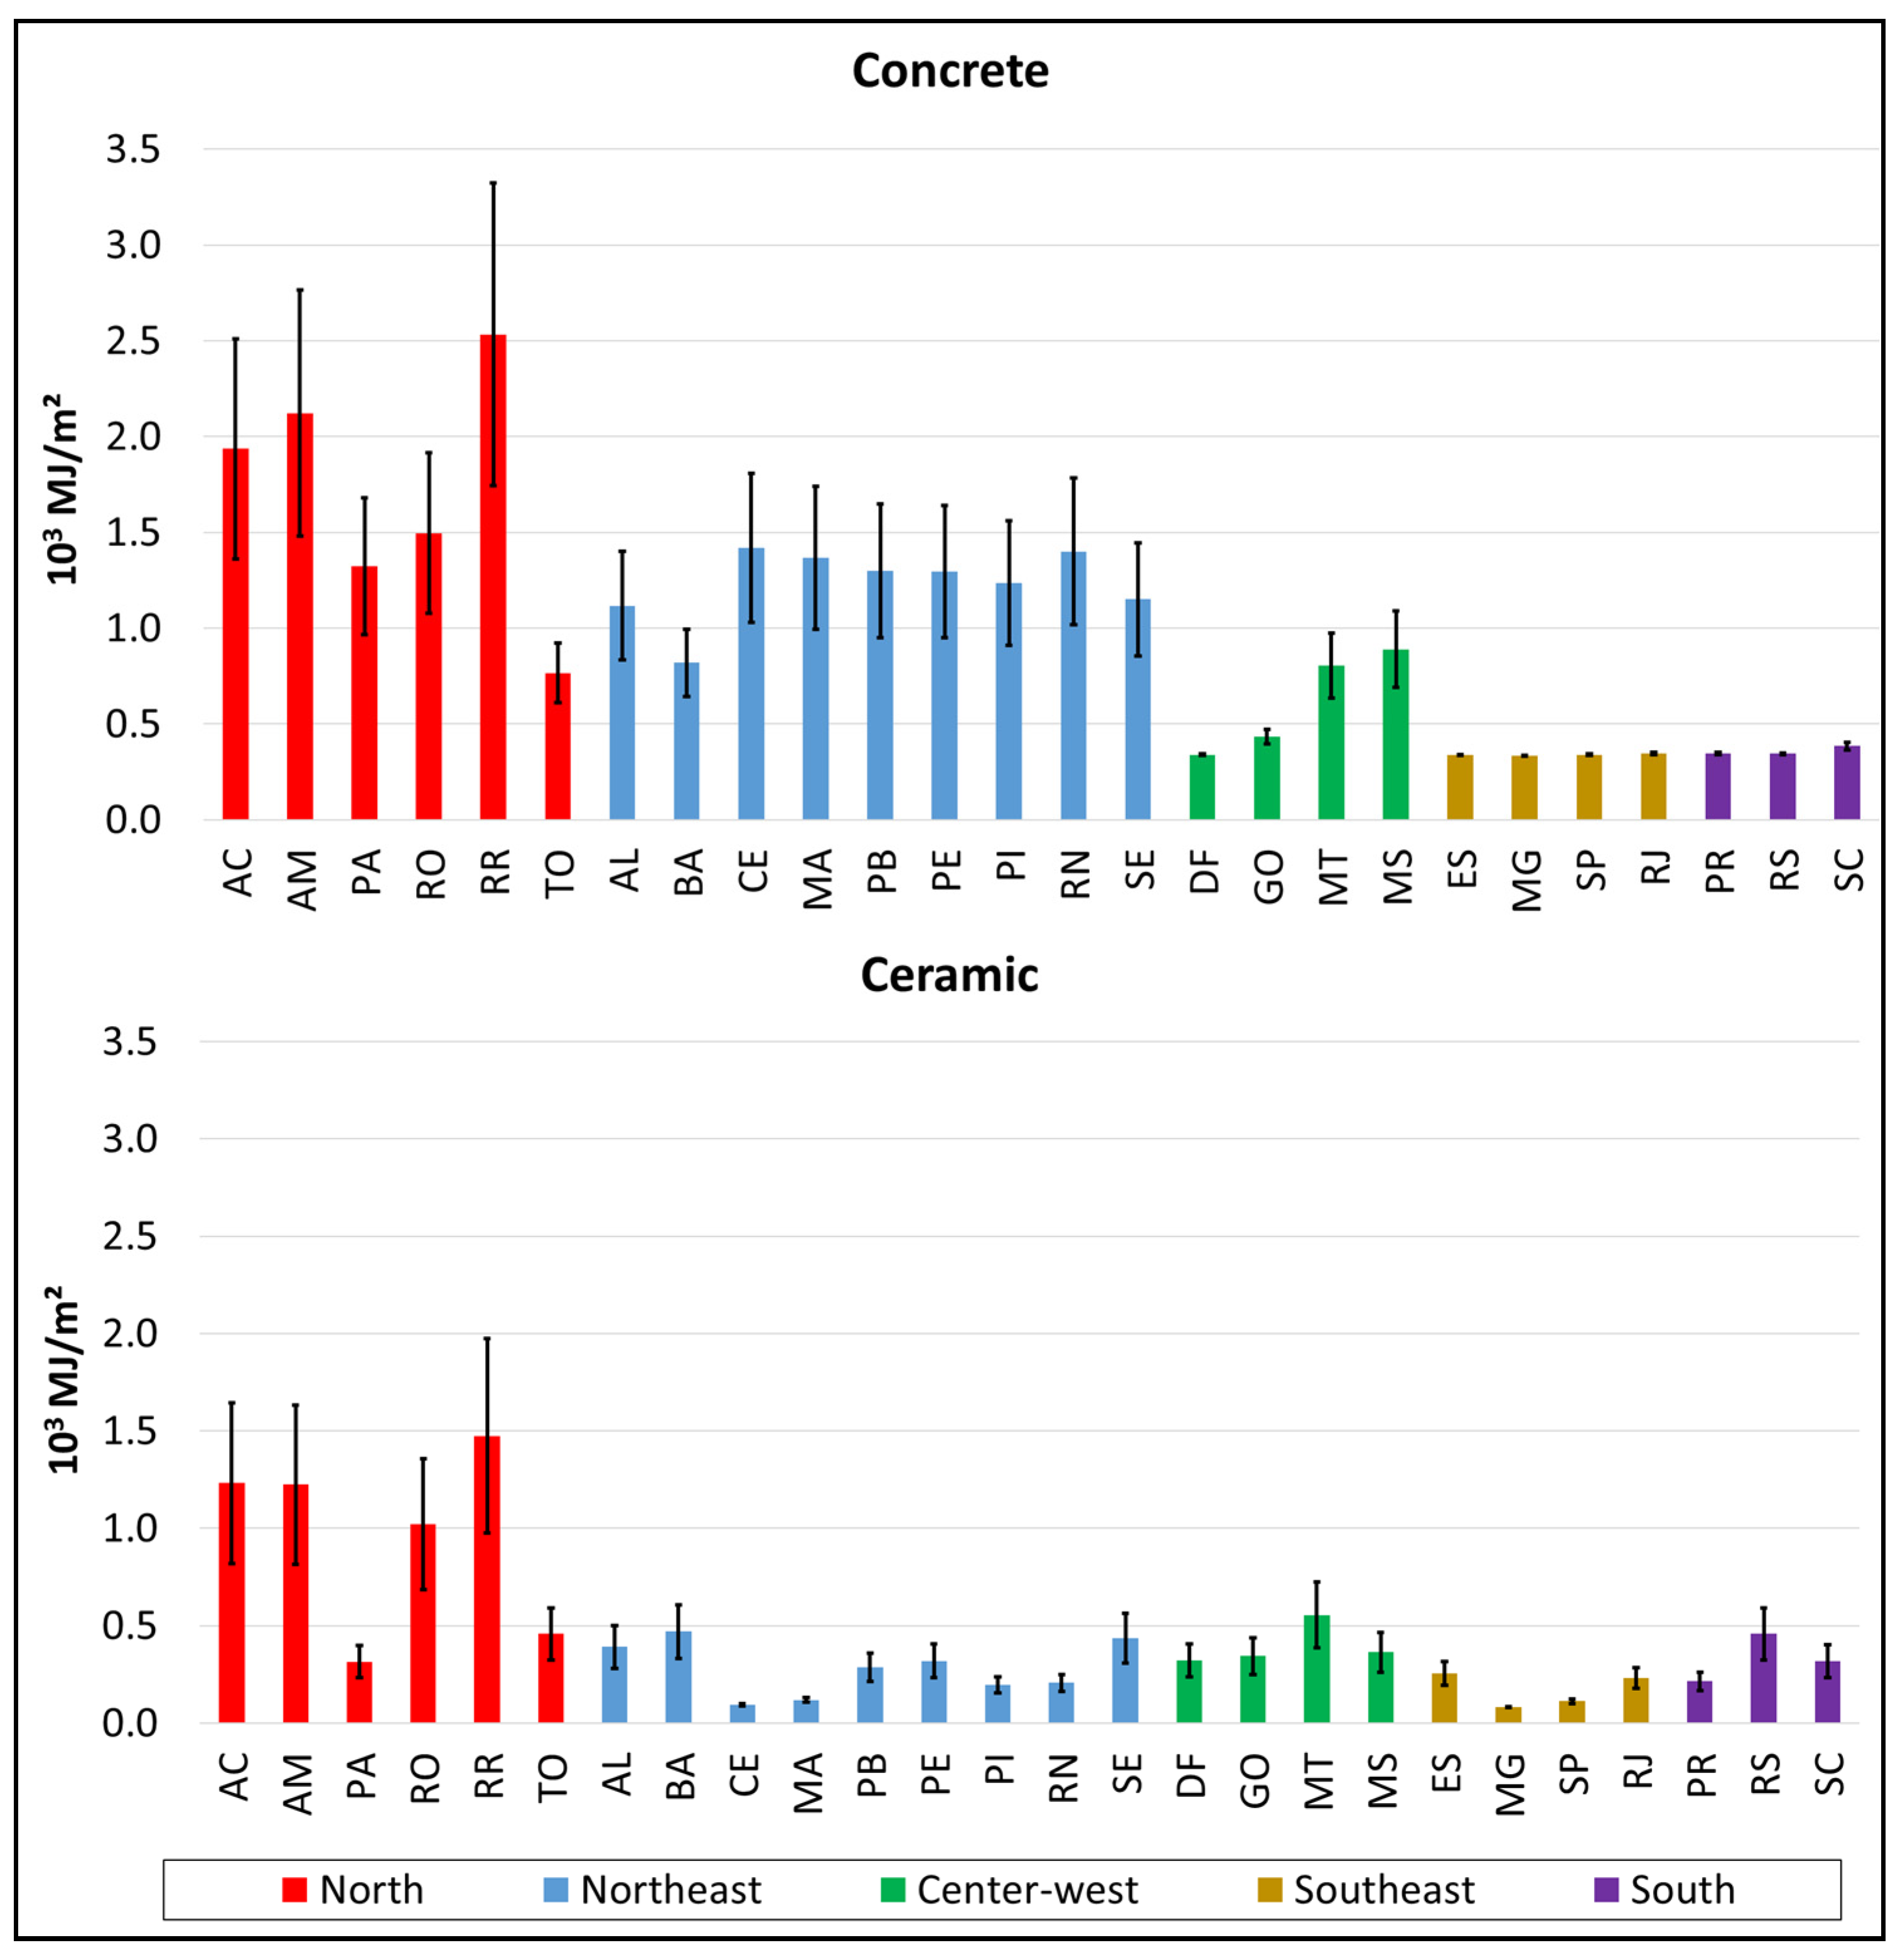
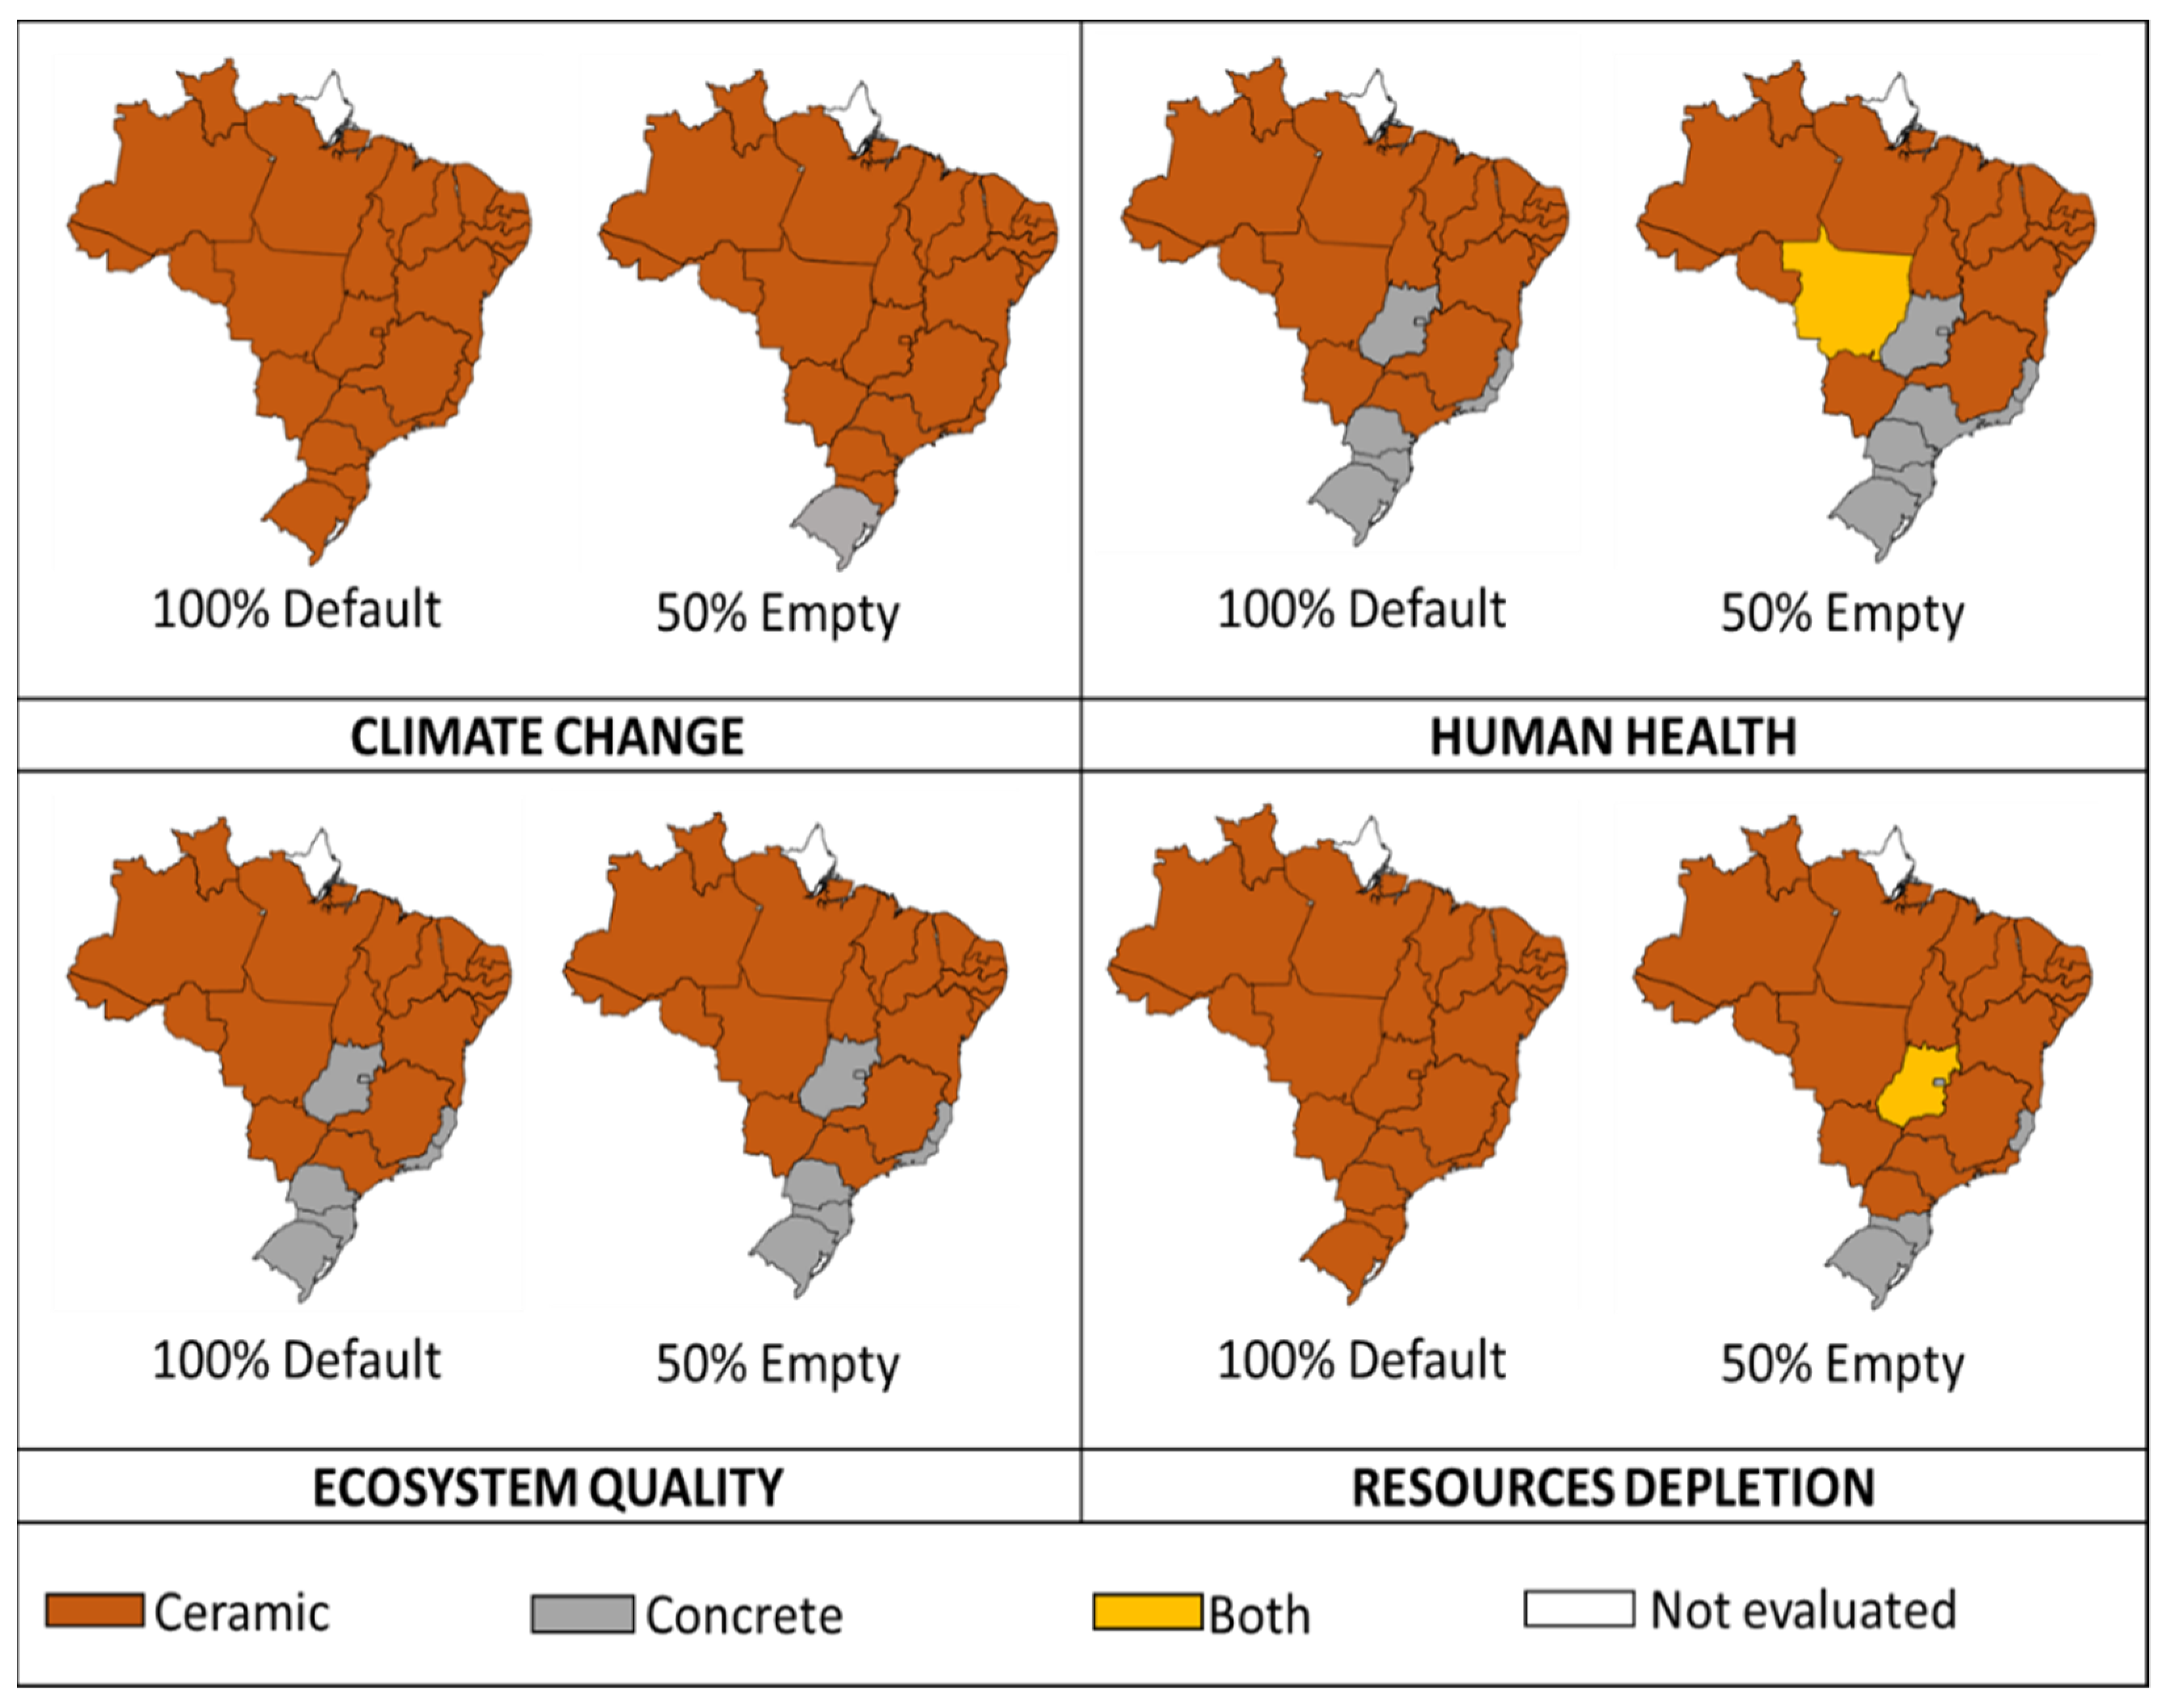
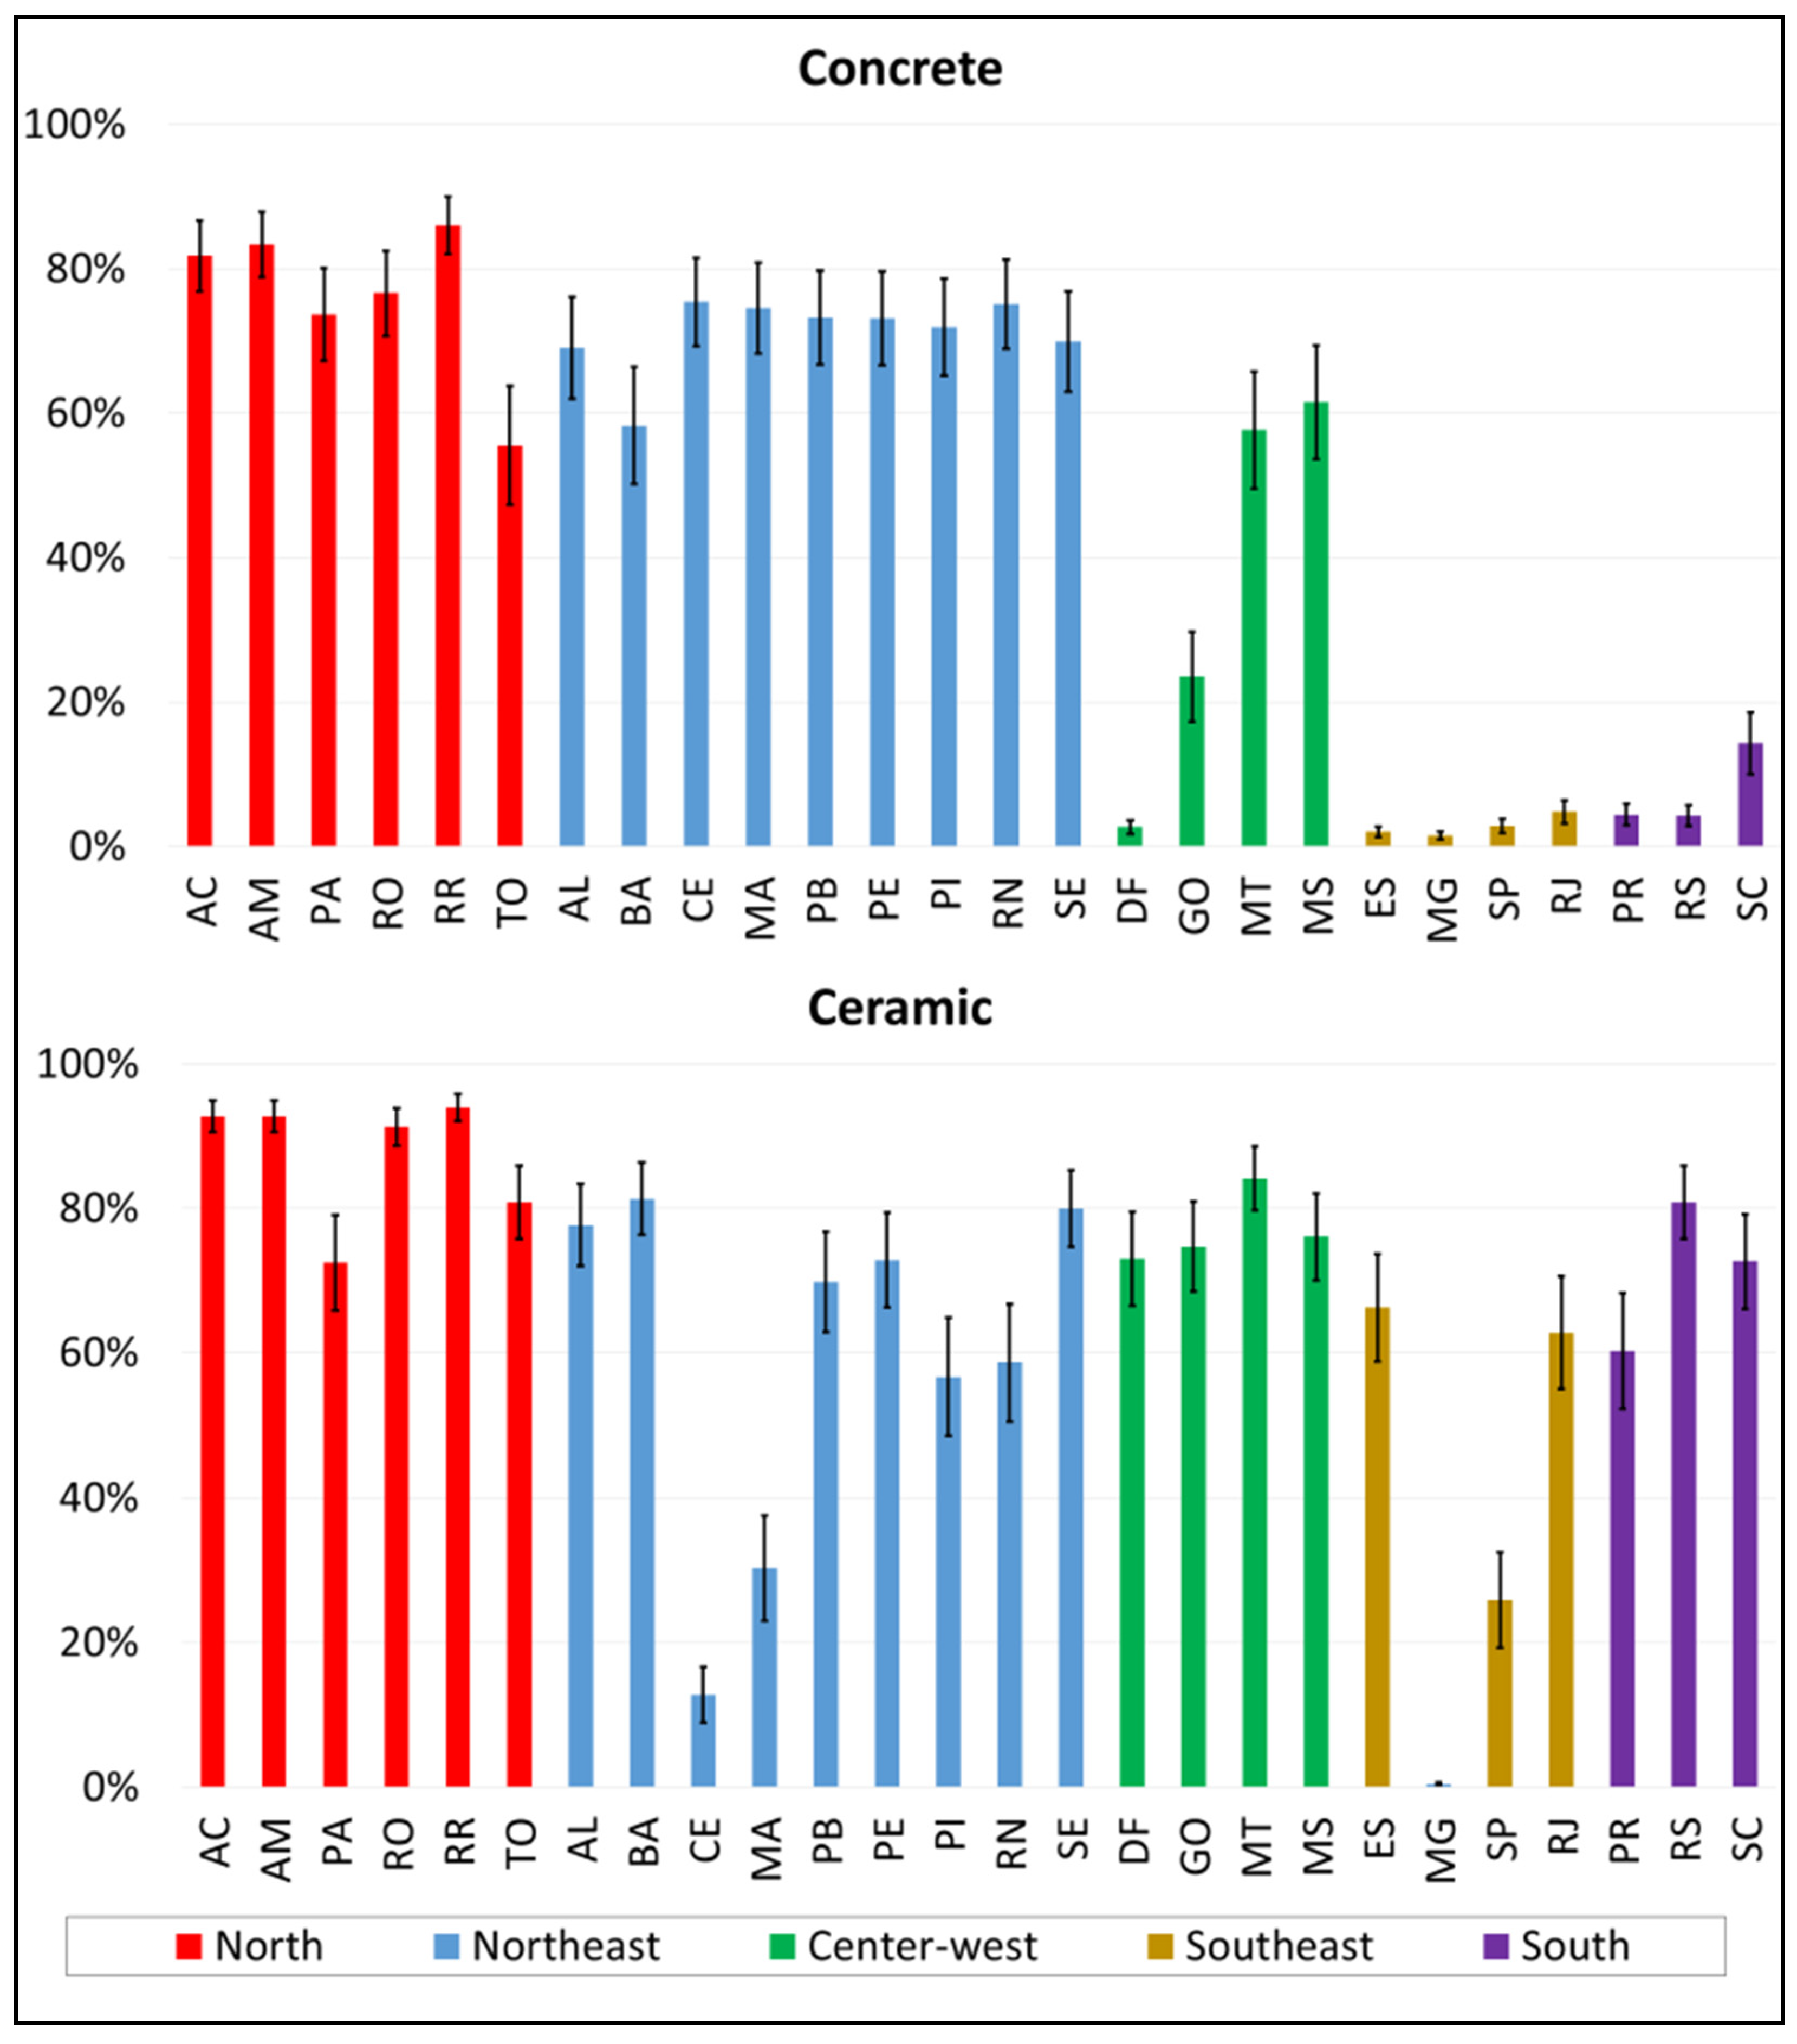
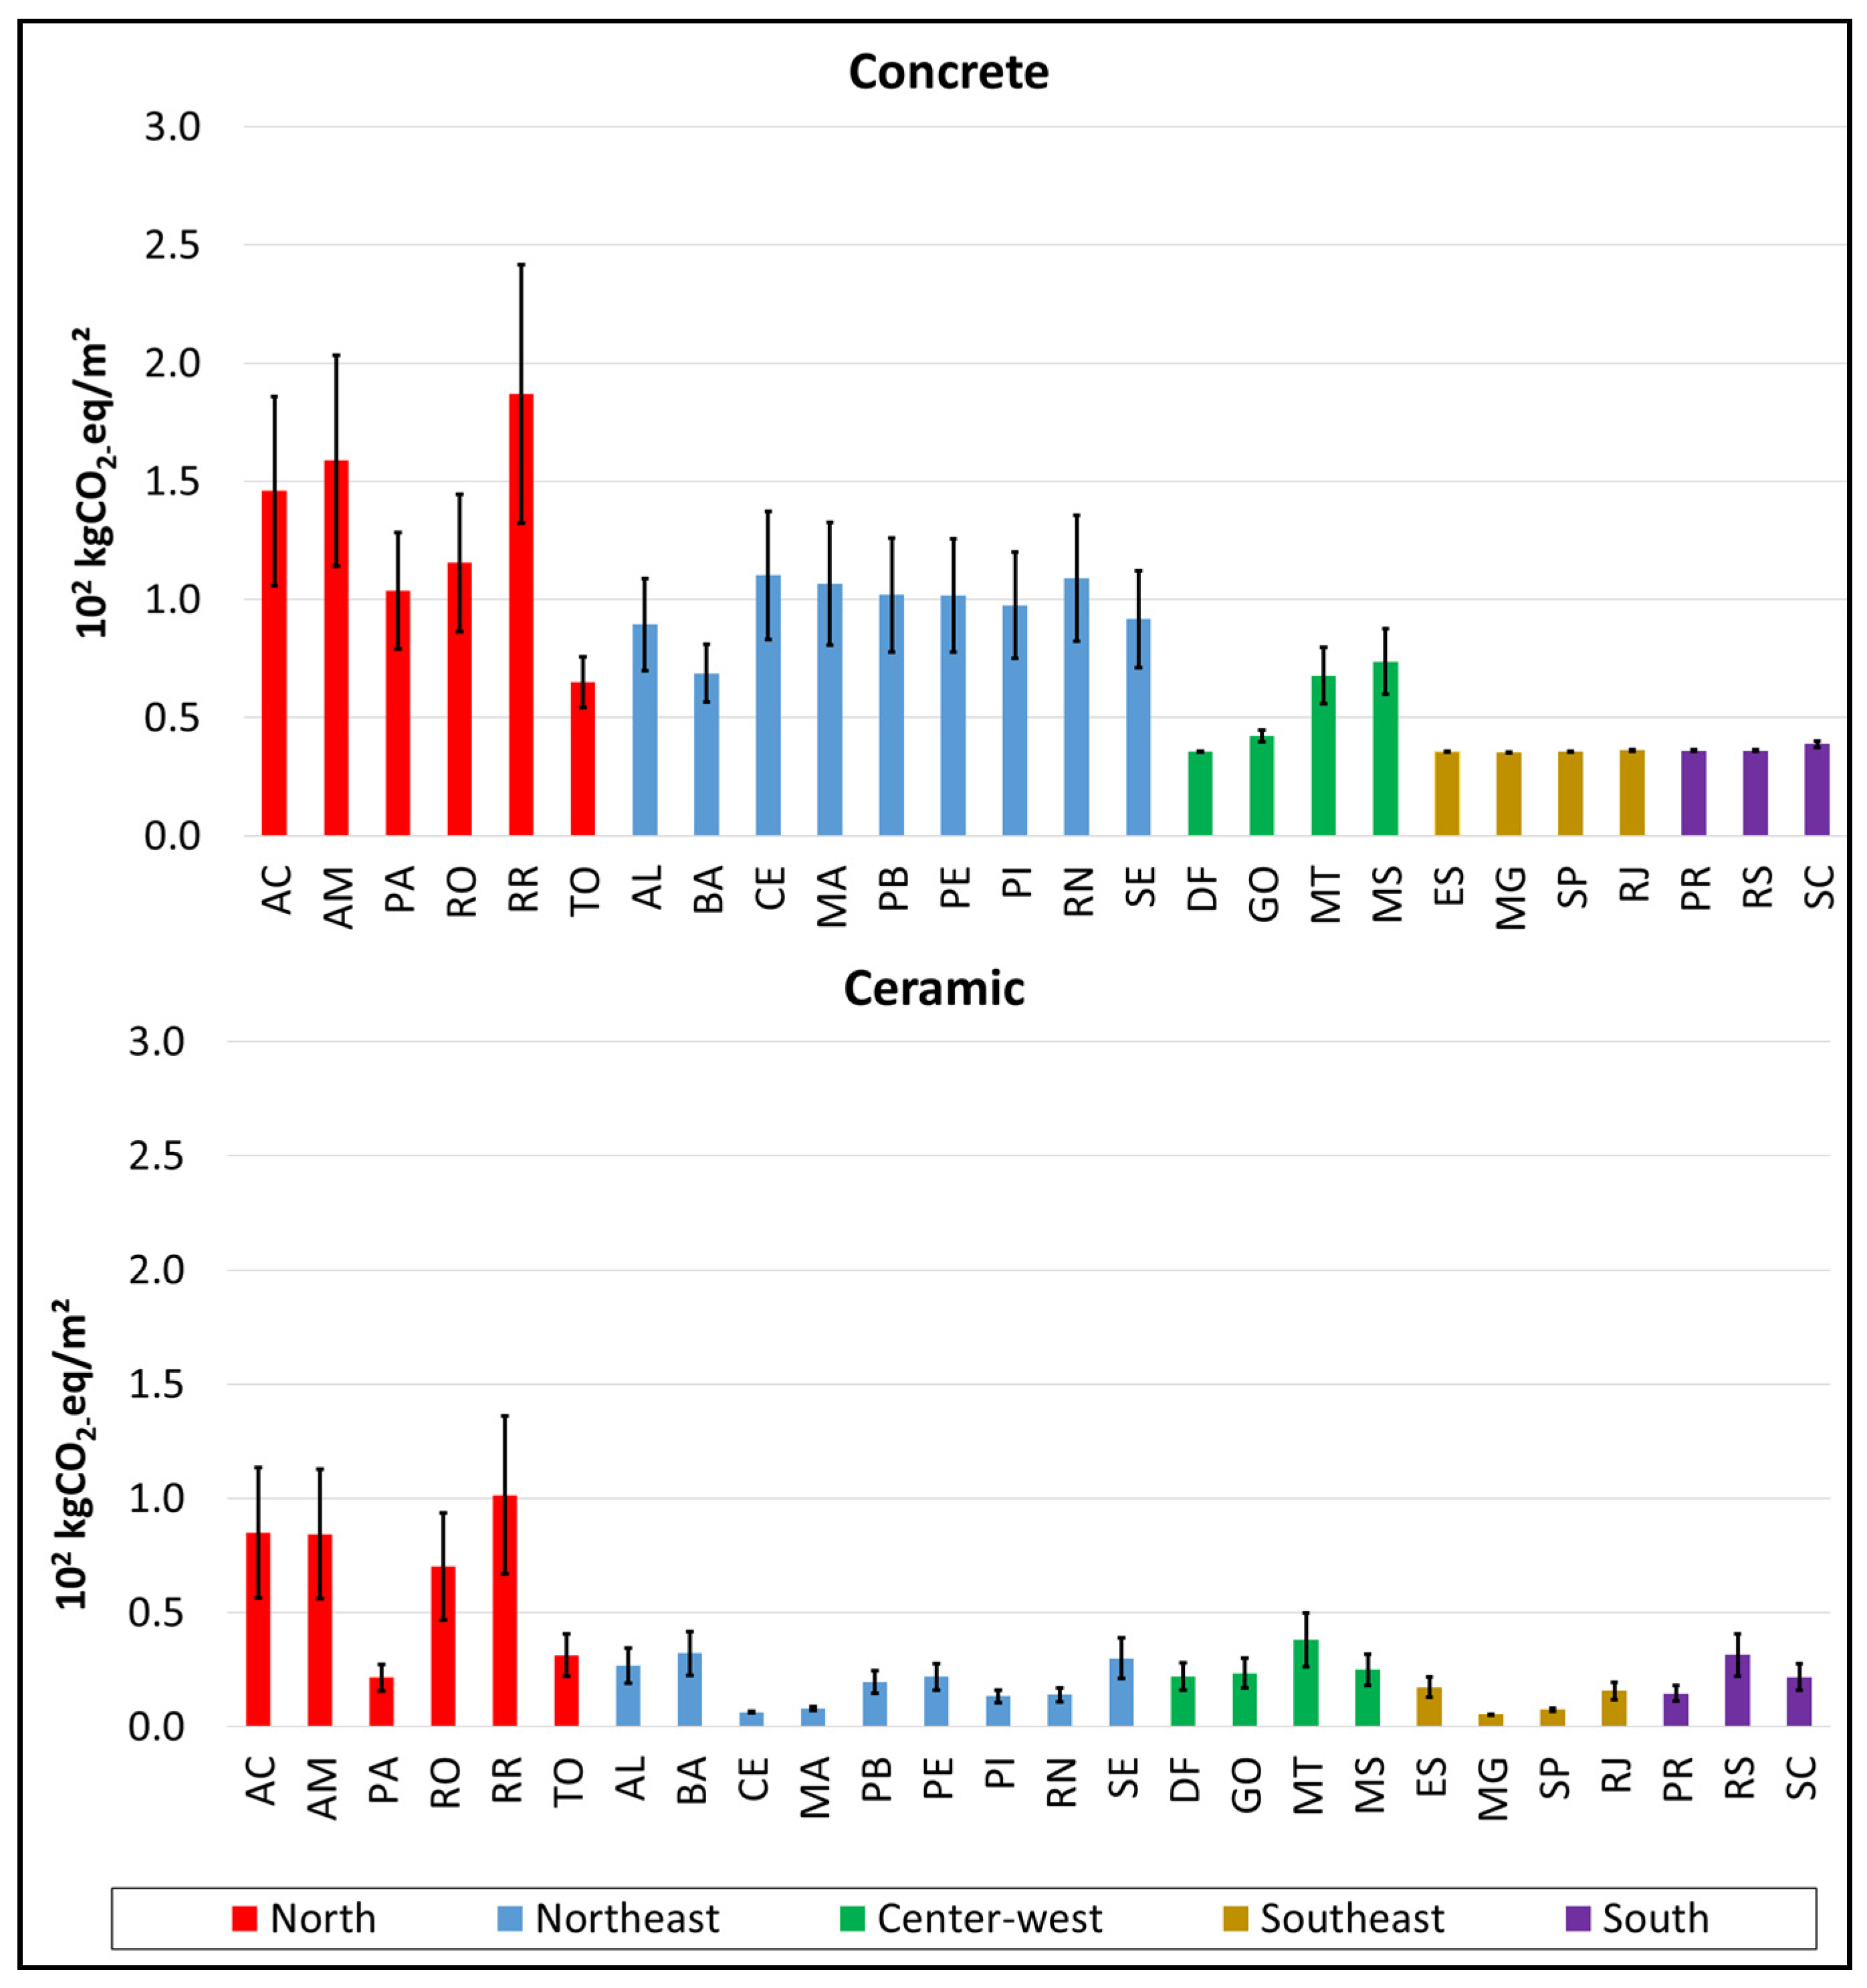
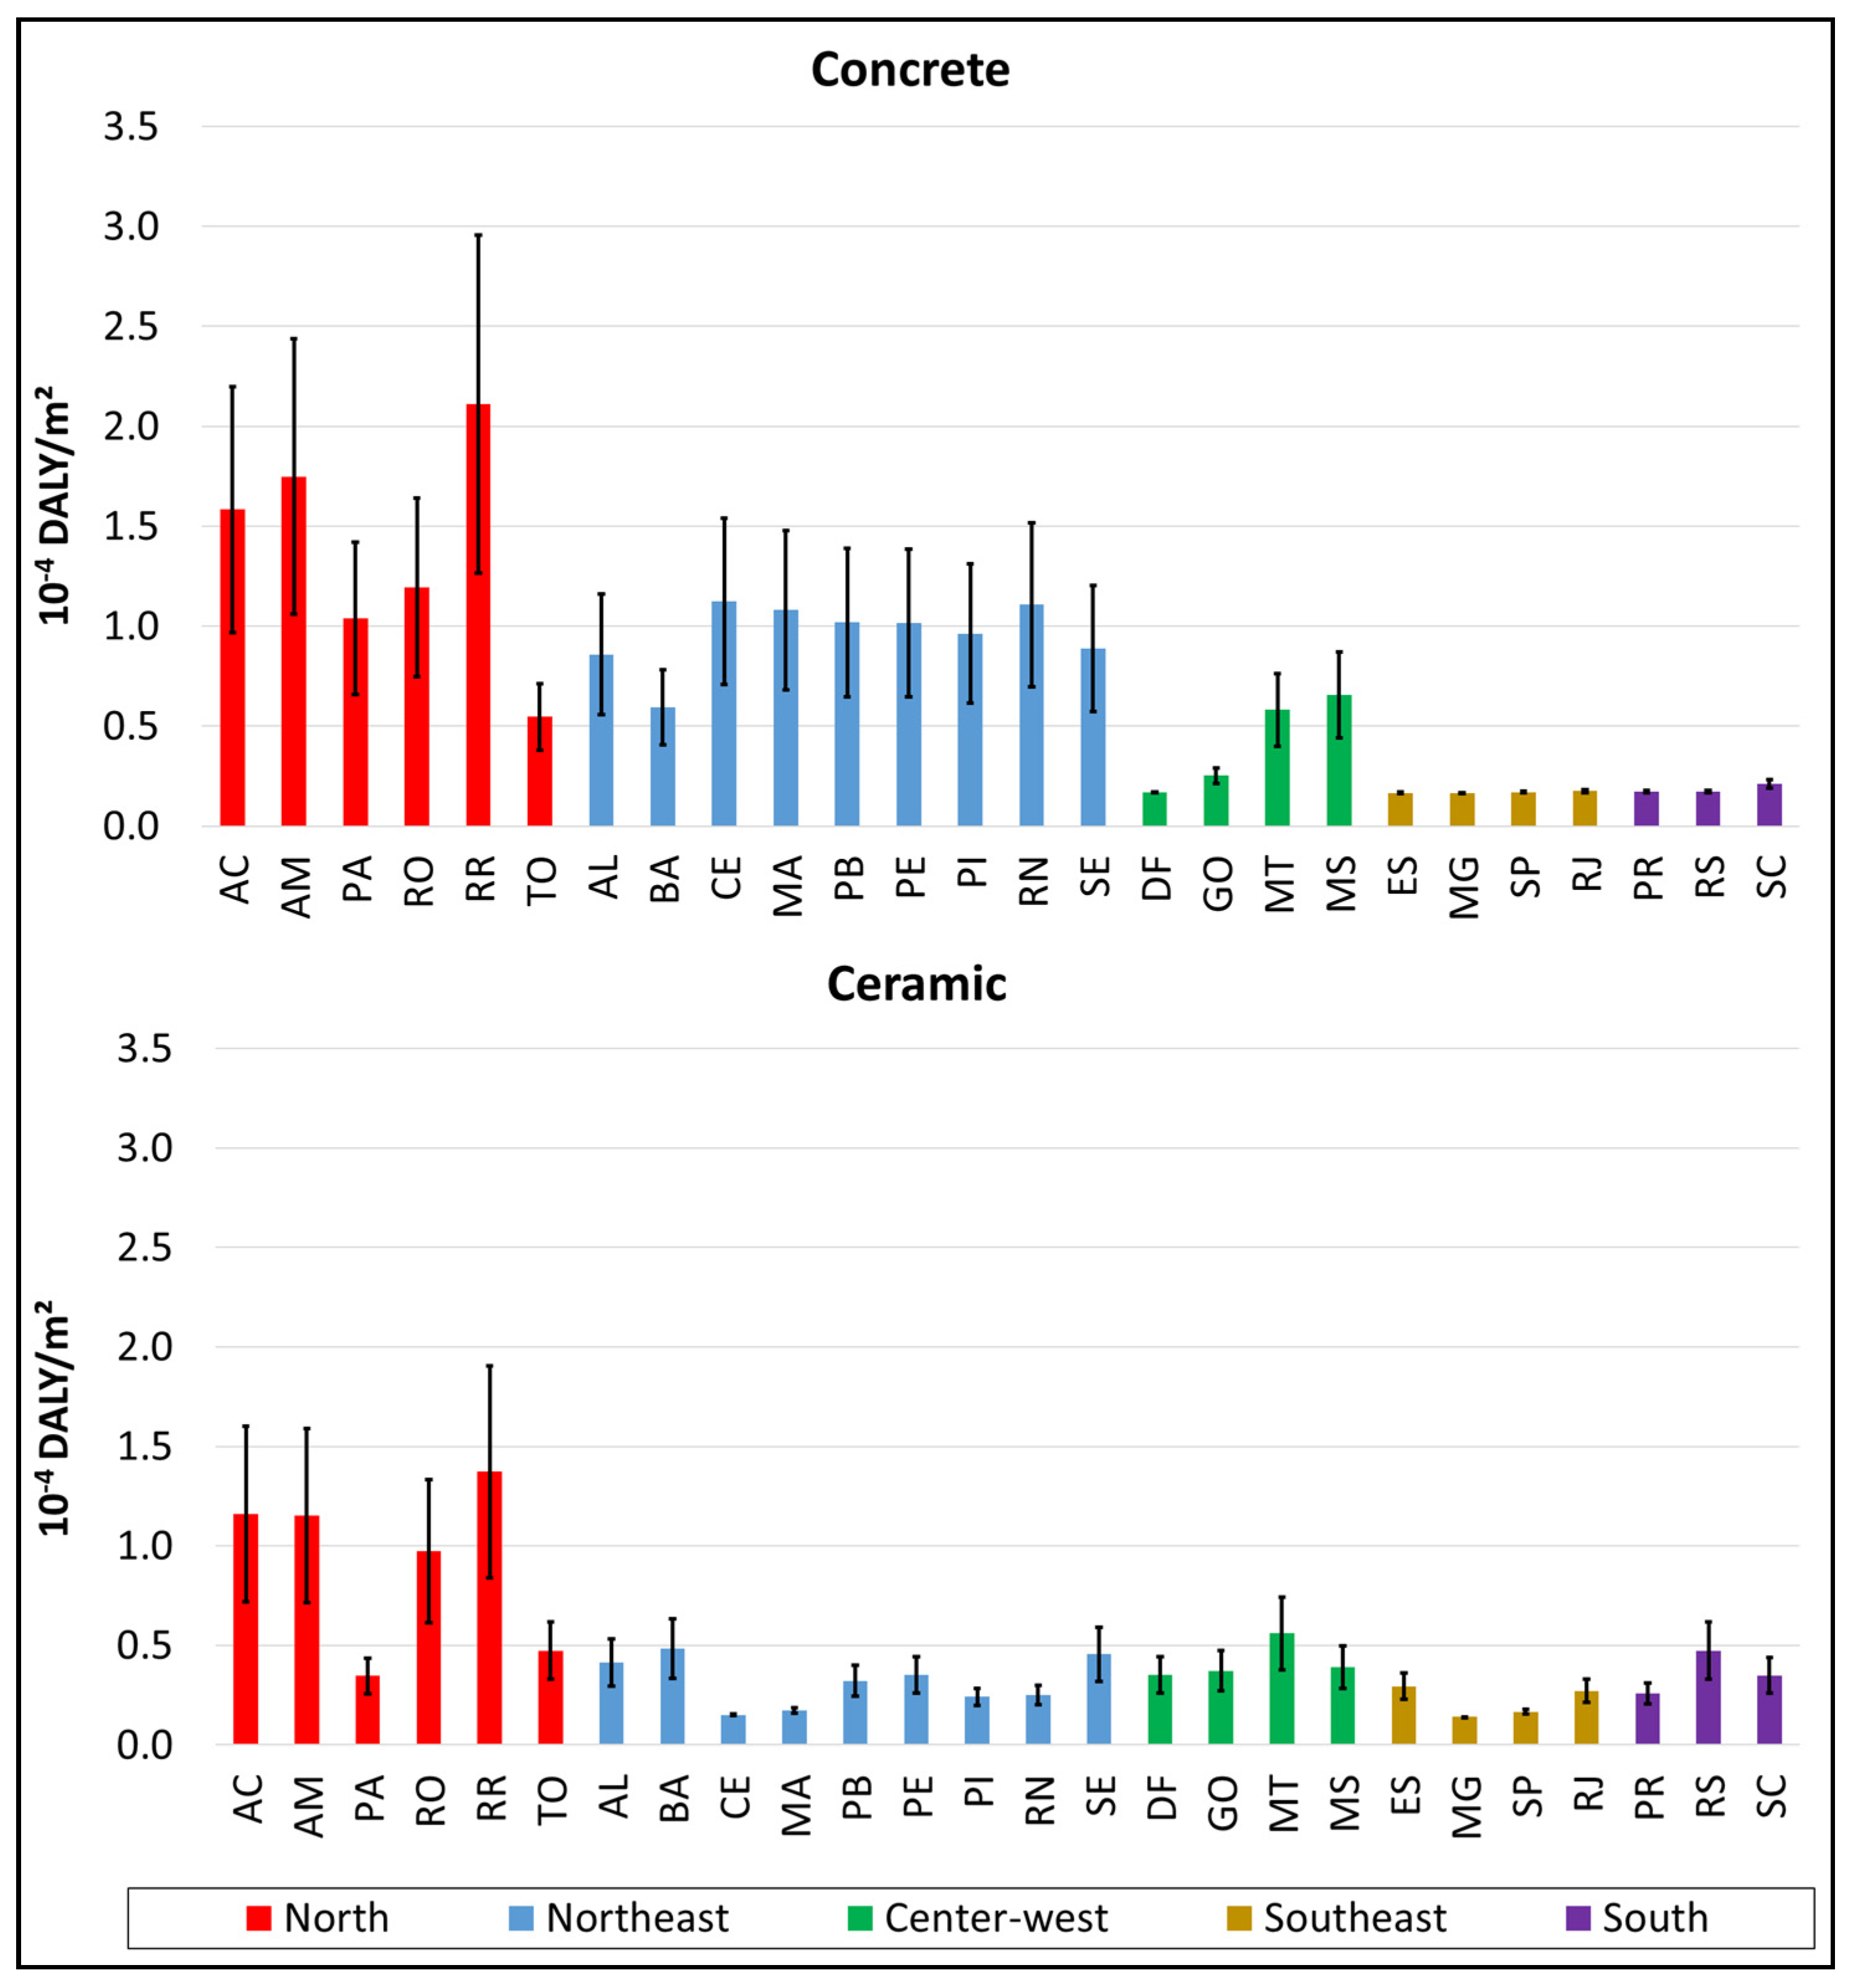
3.1. Concrete Blocks vs. Ceramic Blocks: Evaluation of Cradle-to-Site Impacts

The total environmental impacts for concrete and ceramic blocks are presented in Figure 3, Figure 4, Figure 5 and Figure 6.
The total environmental impacts of the ceramic block walls were lower for all of the capitals analyzed with the different transportation datasets, which reinforced this result. For the Climate Change impact (average values), ceramic block walls presented 6 to 101 kgCO2-eq/m², while concrete blocks presented 35 to 187 kgCO2-eq/m²; for the Human Health impact (average values), ceramic block walls presented 1.4 × 10⁻⁵ to 8.4 × 10⁻⁵ DALY/m², while concrete blocks presented 1.7 × 10⁻⁵ to 2.1 × 10⁻⁴ DALY/m². For the Ecosystem Quality impact (average values), ceramic blocks presented 2 to 100 PDF.m².year/m², while concrete blocks presented 5 to 161 PDF.m².year/m²; for Resource Depletion (average values), ceramic block walls presented 335 to 1470 MJ/m², while concrete blocks presented 83 to 2530 MJ/m². This is a consequence of the lower values of the environmental impacts of the ceramic blocks in the production stage, except for the Human Health category, together with the lower values of the transportation impacts in most of the cases, as ceramic blocks are roughly 50% lighter than concrete blocks. The cities located in the Northern and Northeastern regions (in this order) presented the highest values of impacts as a consequence of the longer transportation distances in these regions, reaching 4194 km for RR (Northern region for ceramic blocks) and 2051 km for CE (Northeastern region for concrete blocks), since there were no factories classified in a PSQ in the Northern region, and some factories classified for ceramic blocks were located in the MA and CE states. Other Brazilian studies have also demonstrated similar trends [23].
The state capitals of the Northern region were those with the longest distances for both blocks. Note that these capital cities are located in the Northern part of the country, and the differences between the components are not so large. The state capitals of the Southeastern region showed the shortest distances for both materials, with distances ranging from 10 (MG for ceramic blocks) to 105 km (SC for concrete blocks). The major differences in the distances between the ceramic and concrete blocks were seen in the state capitals of CE, MA, DF, ES, RS, GO, and SC. In 11 of the states, the transportation distance was longer in the case of concrete blocks, while in the 15 remaining capitals, it was longer for ceramic blocks.
According to the functional unit (m²), properties, and waste values adopted in this study, the material consumption considered was 168.03 kg/m² for the concrete block walls and 88.84 kg/m² for the ceramic block walls. It can be observed that concrete block walls presented almost twice as much material consumption as the ceramic block walls. These values influenced the environmental impacts, as higher mass values indicate higher impacts through material transportation.
Considering the data and assumptions adopted in this study, it is possible to conclude that the wall systems composed of ceramic blocks are more benign when compared to those with concrete blocks in the context of national coverage and in terms of Climate Change, Human Health, Ecosystem Quality, and Resource Depletion impacts. The emission impact related to the transportation phase will be presented in the next section.
The environmental impacts in the distinct Brazilian regions are visualized in Figure 7, presenting the most and least efficient transportation scenarios. The results of the intermediate transportation scenarios are presented in the Supplementary Material (Figures S2–S5).
It can be seen that when transportation becomes less efficient (loaded with 50% and empty return), concrete blocks become more advantageous in the Southern and Southeastern regions and in the state of GO, where more concrete block factories are located.

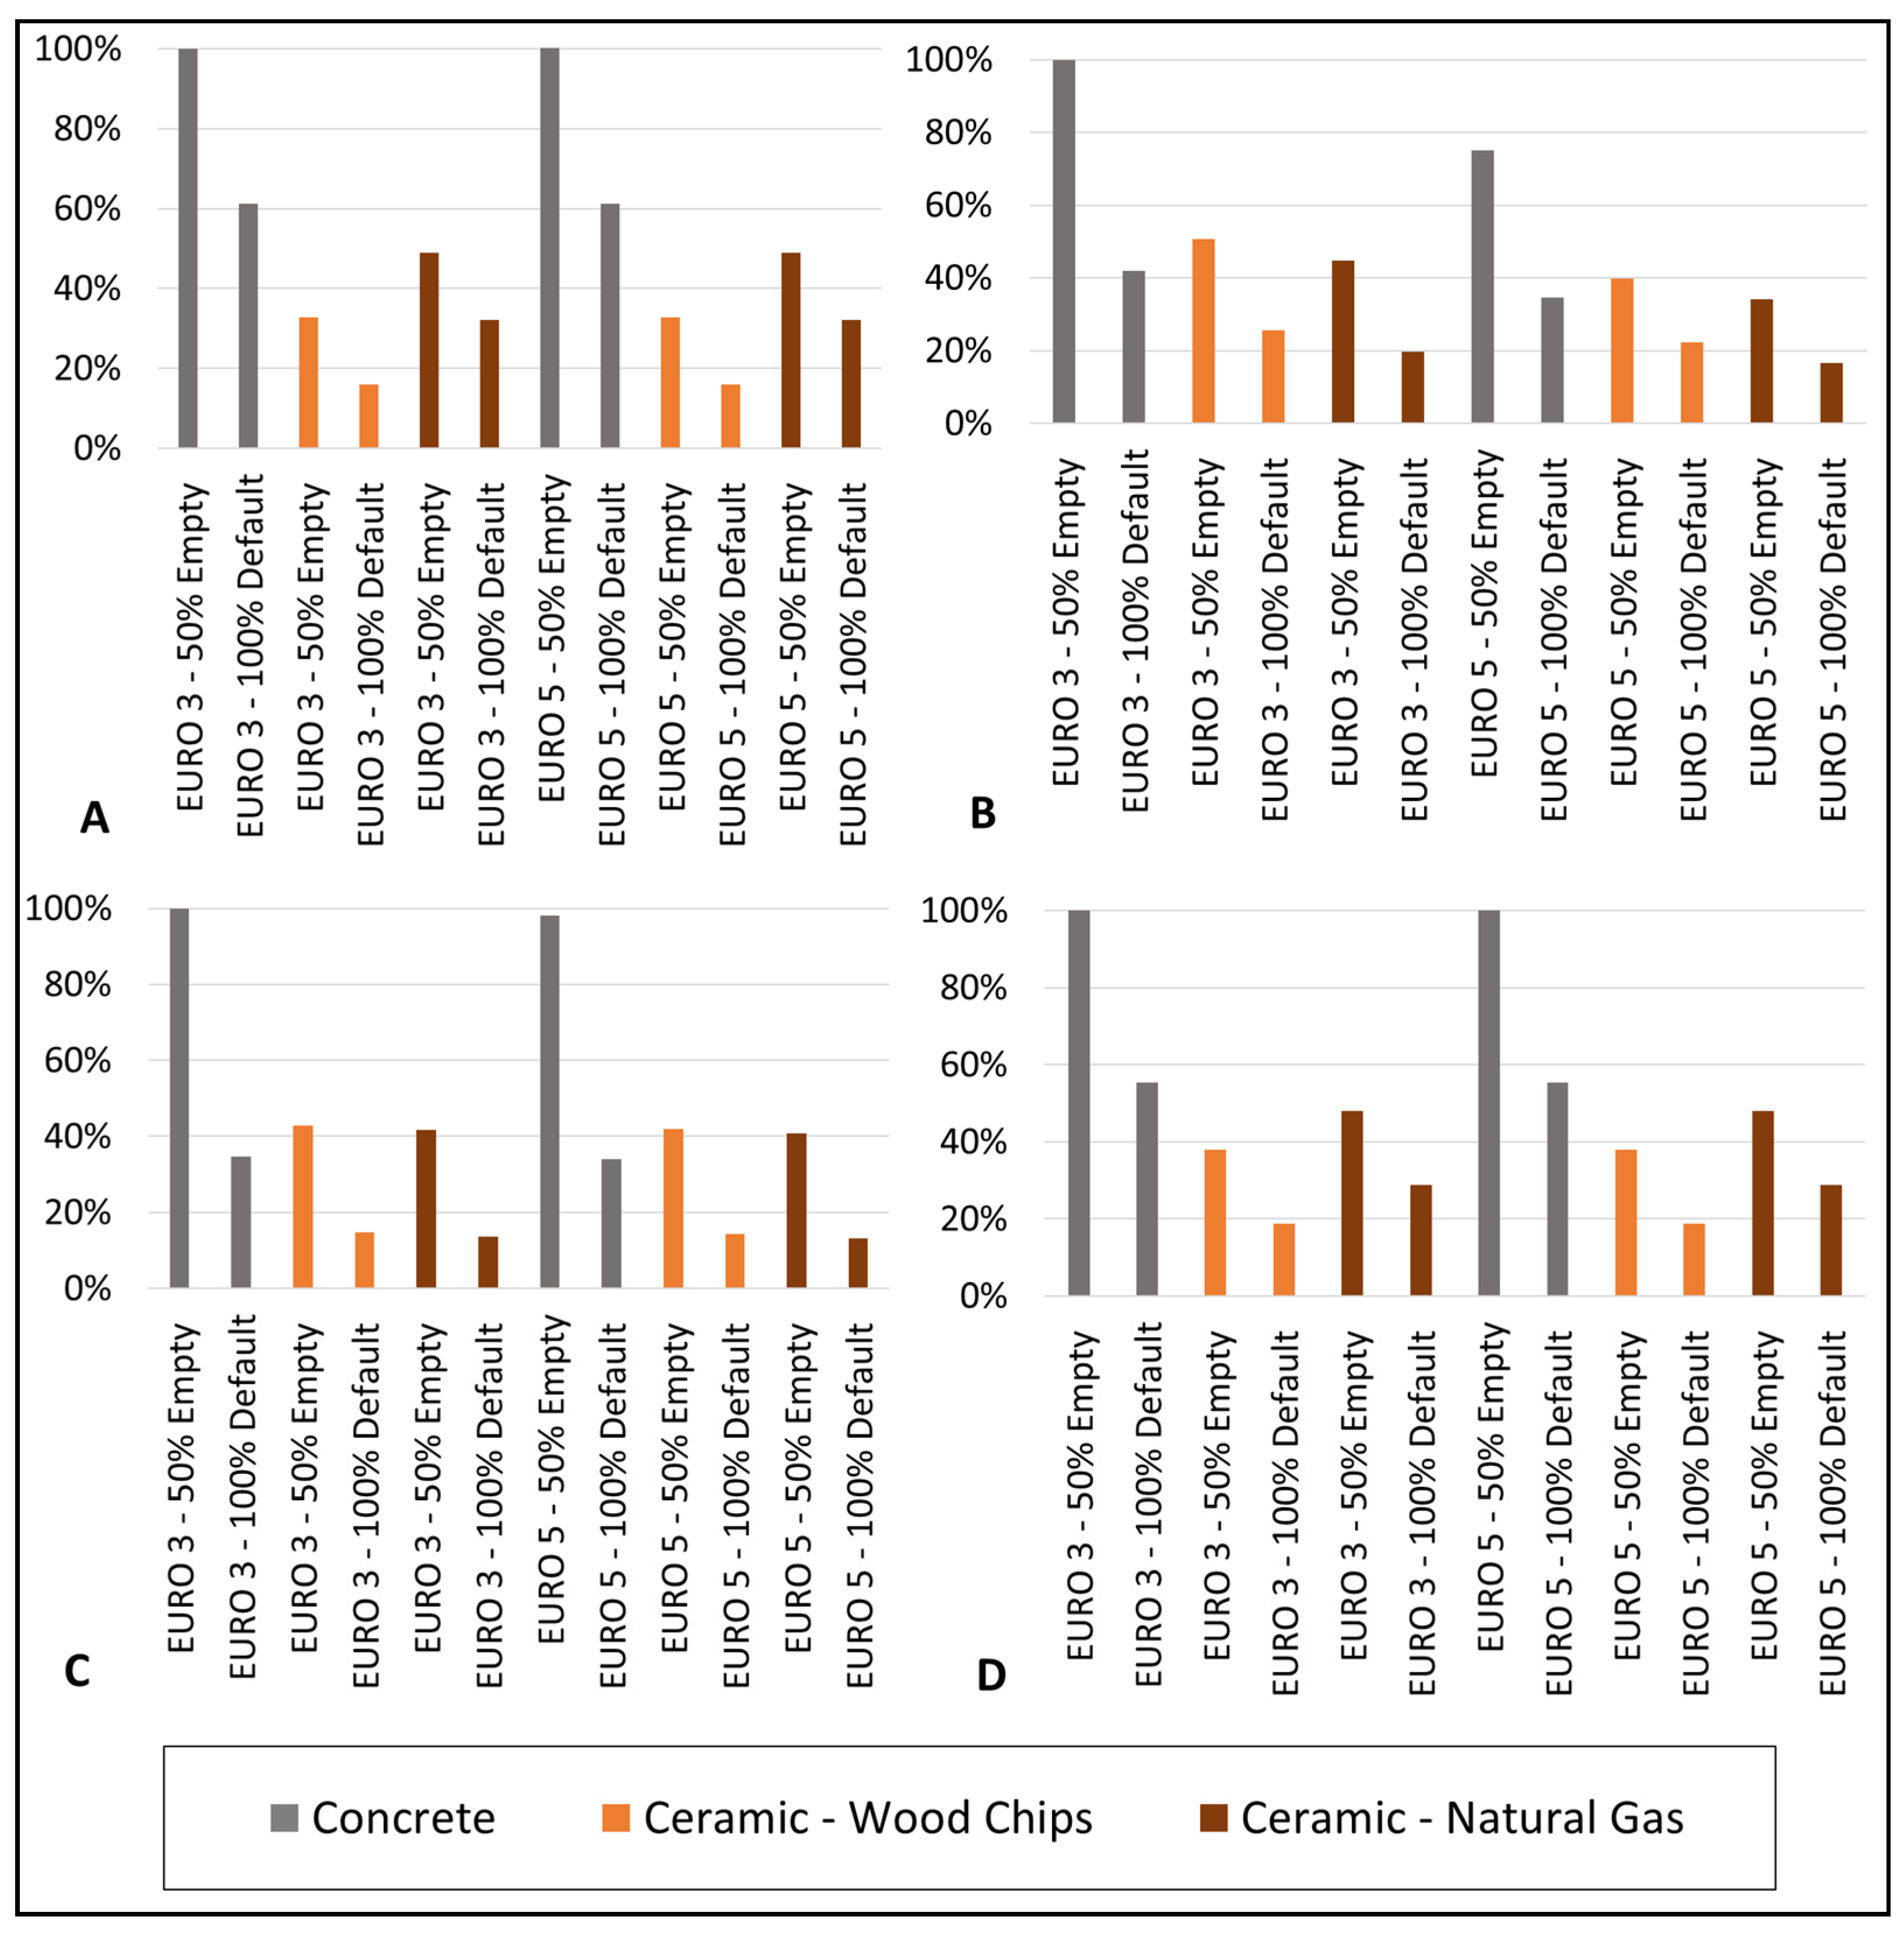
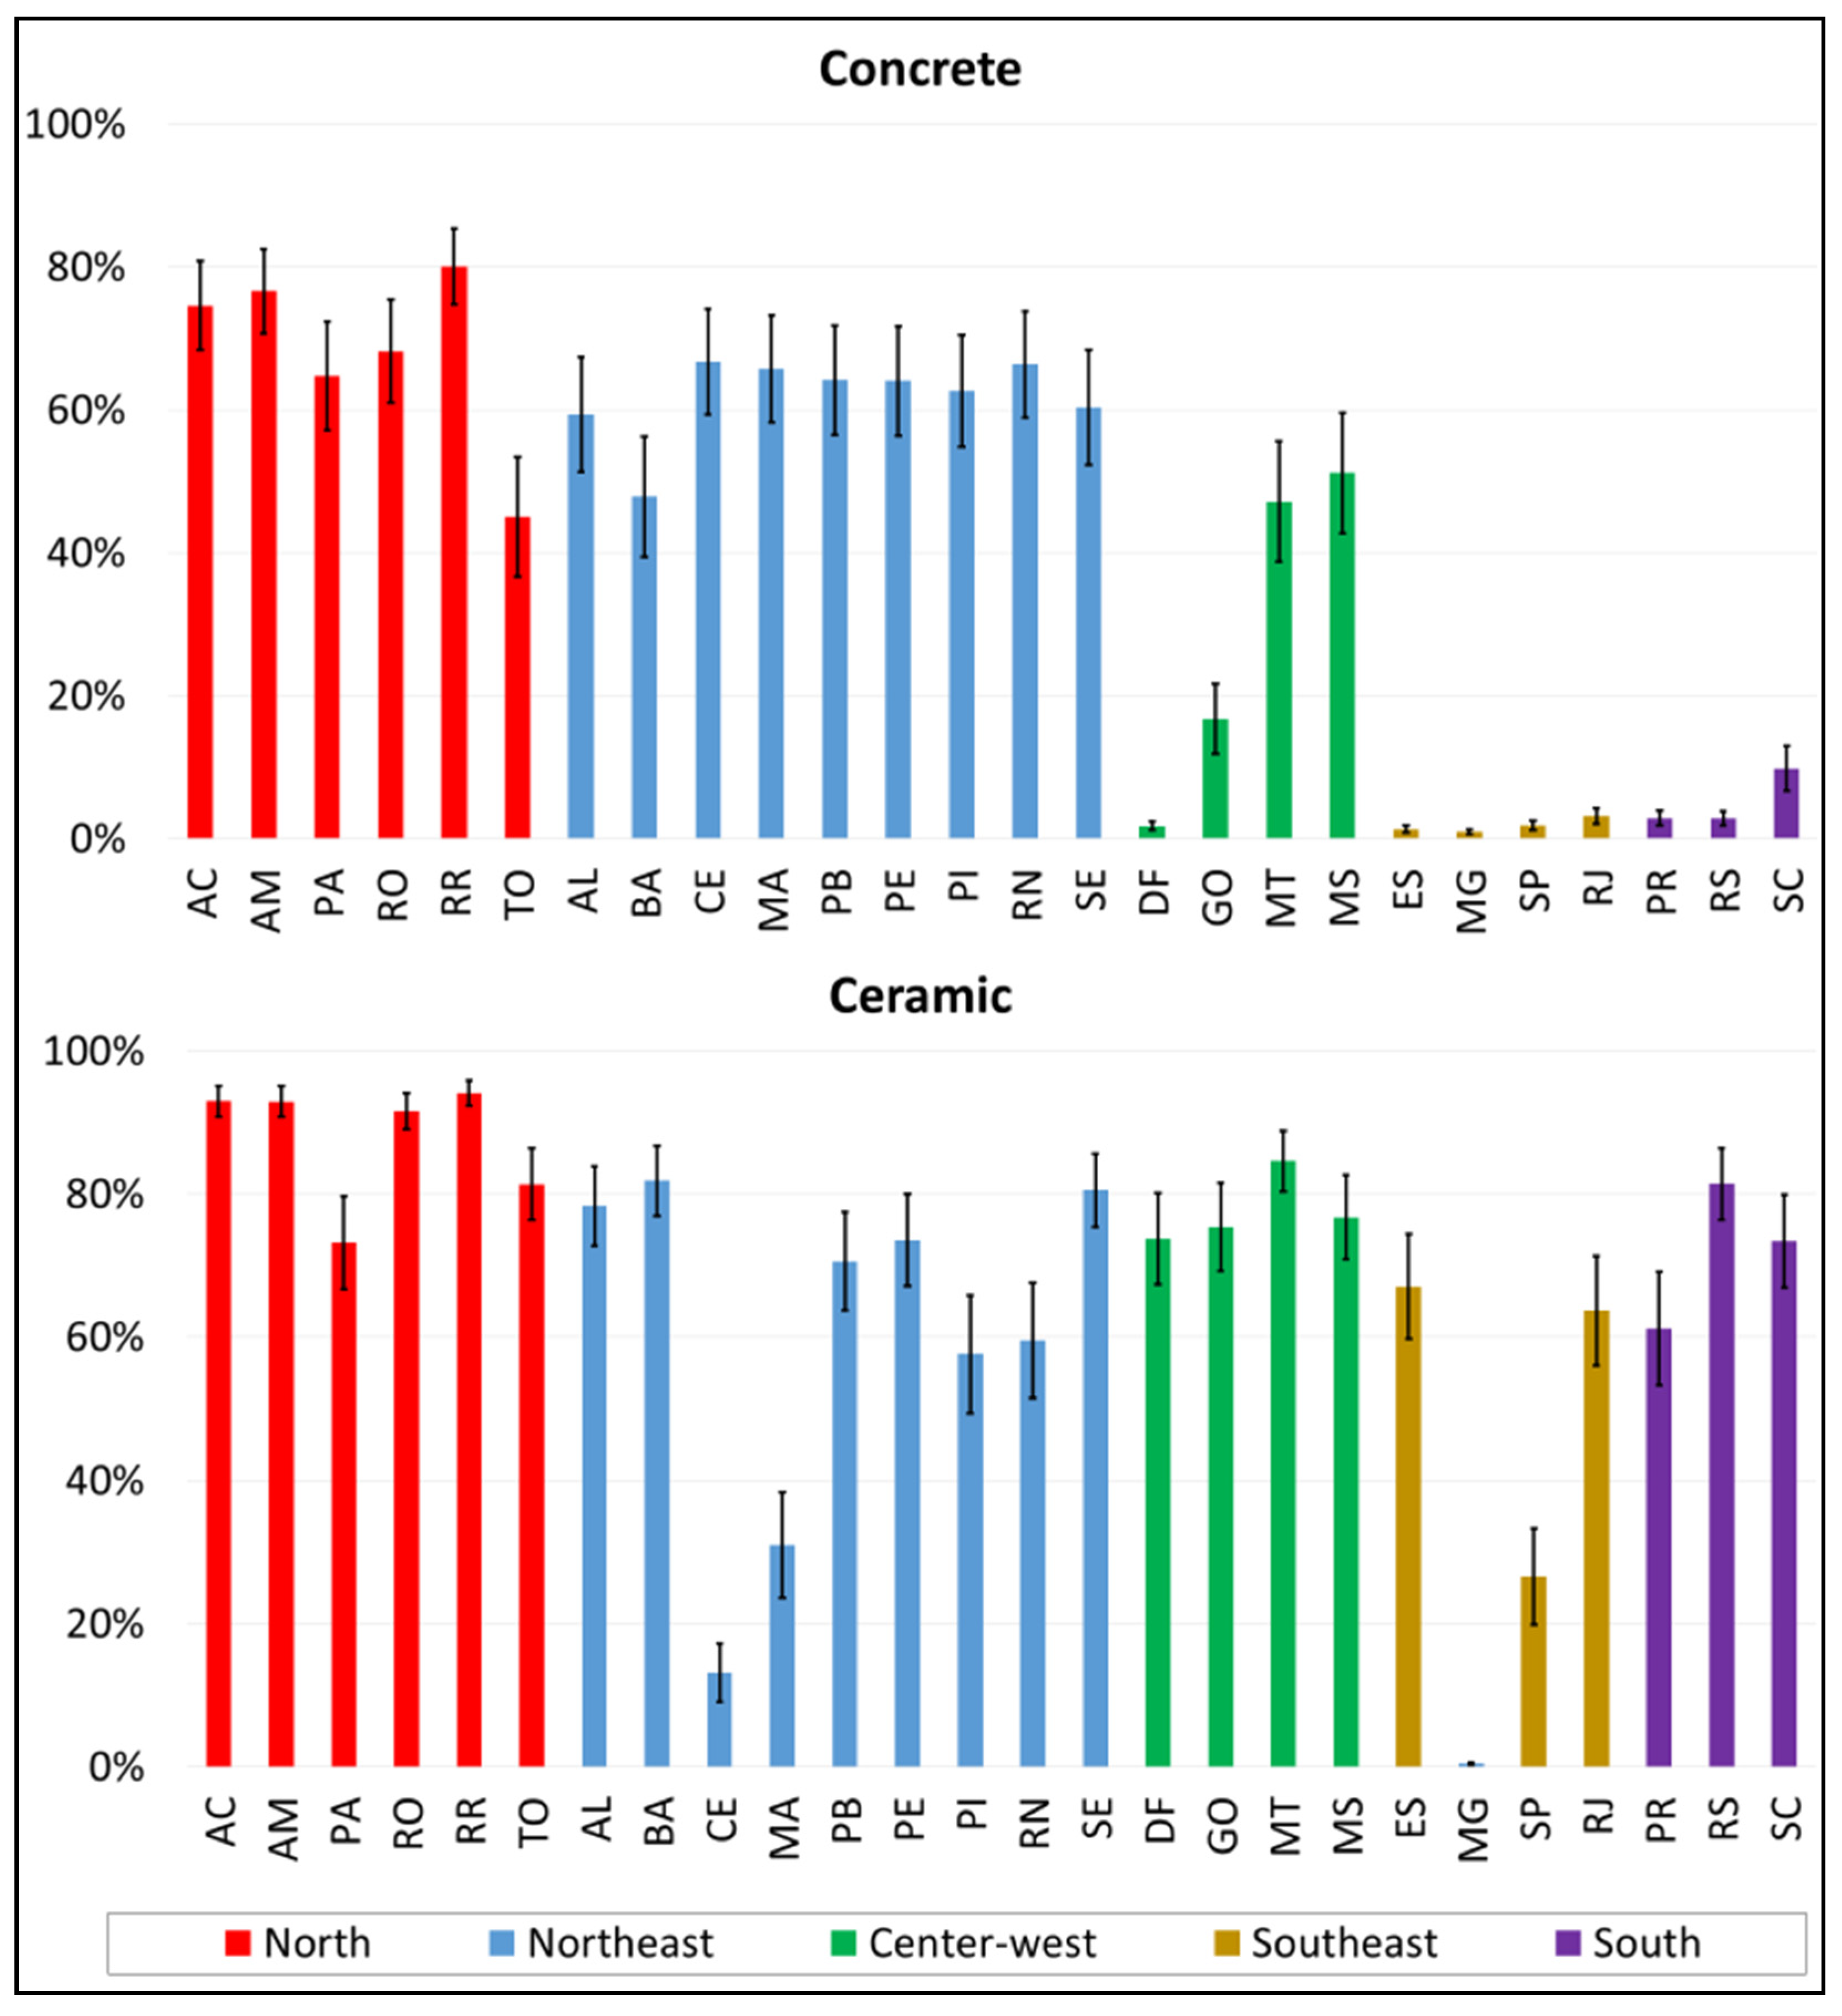
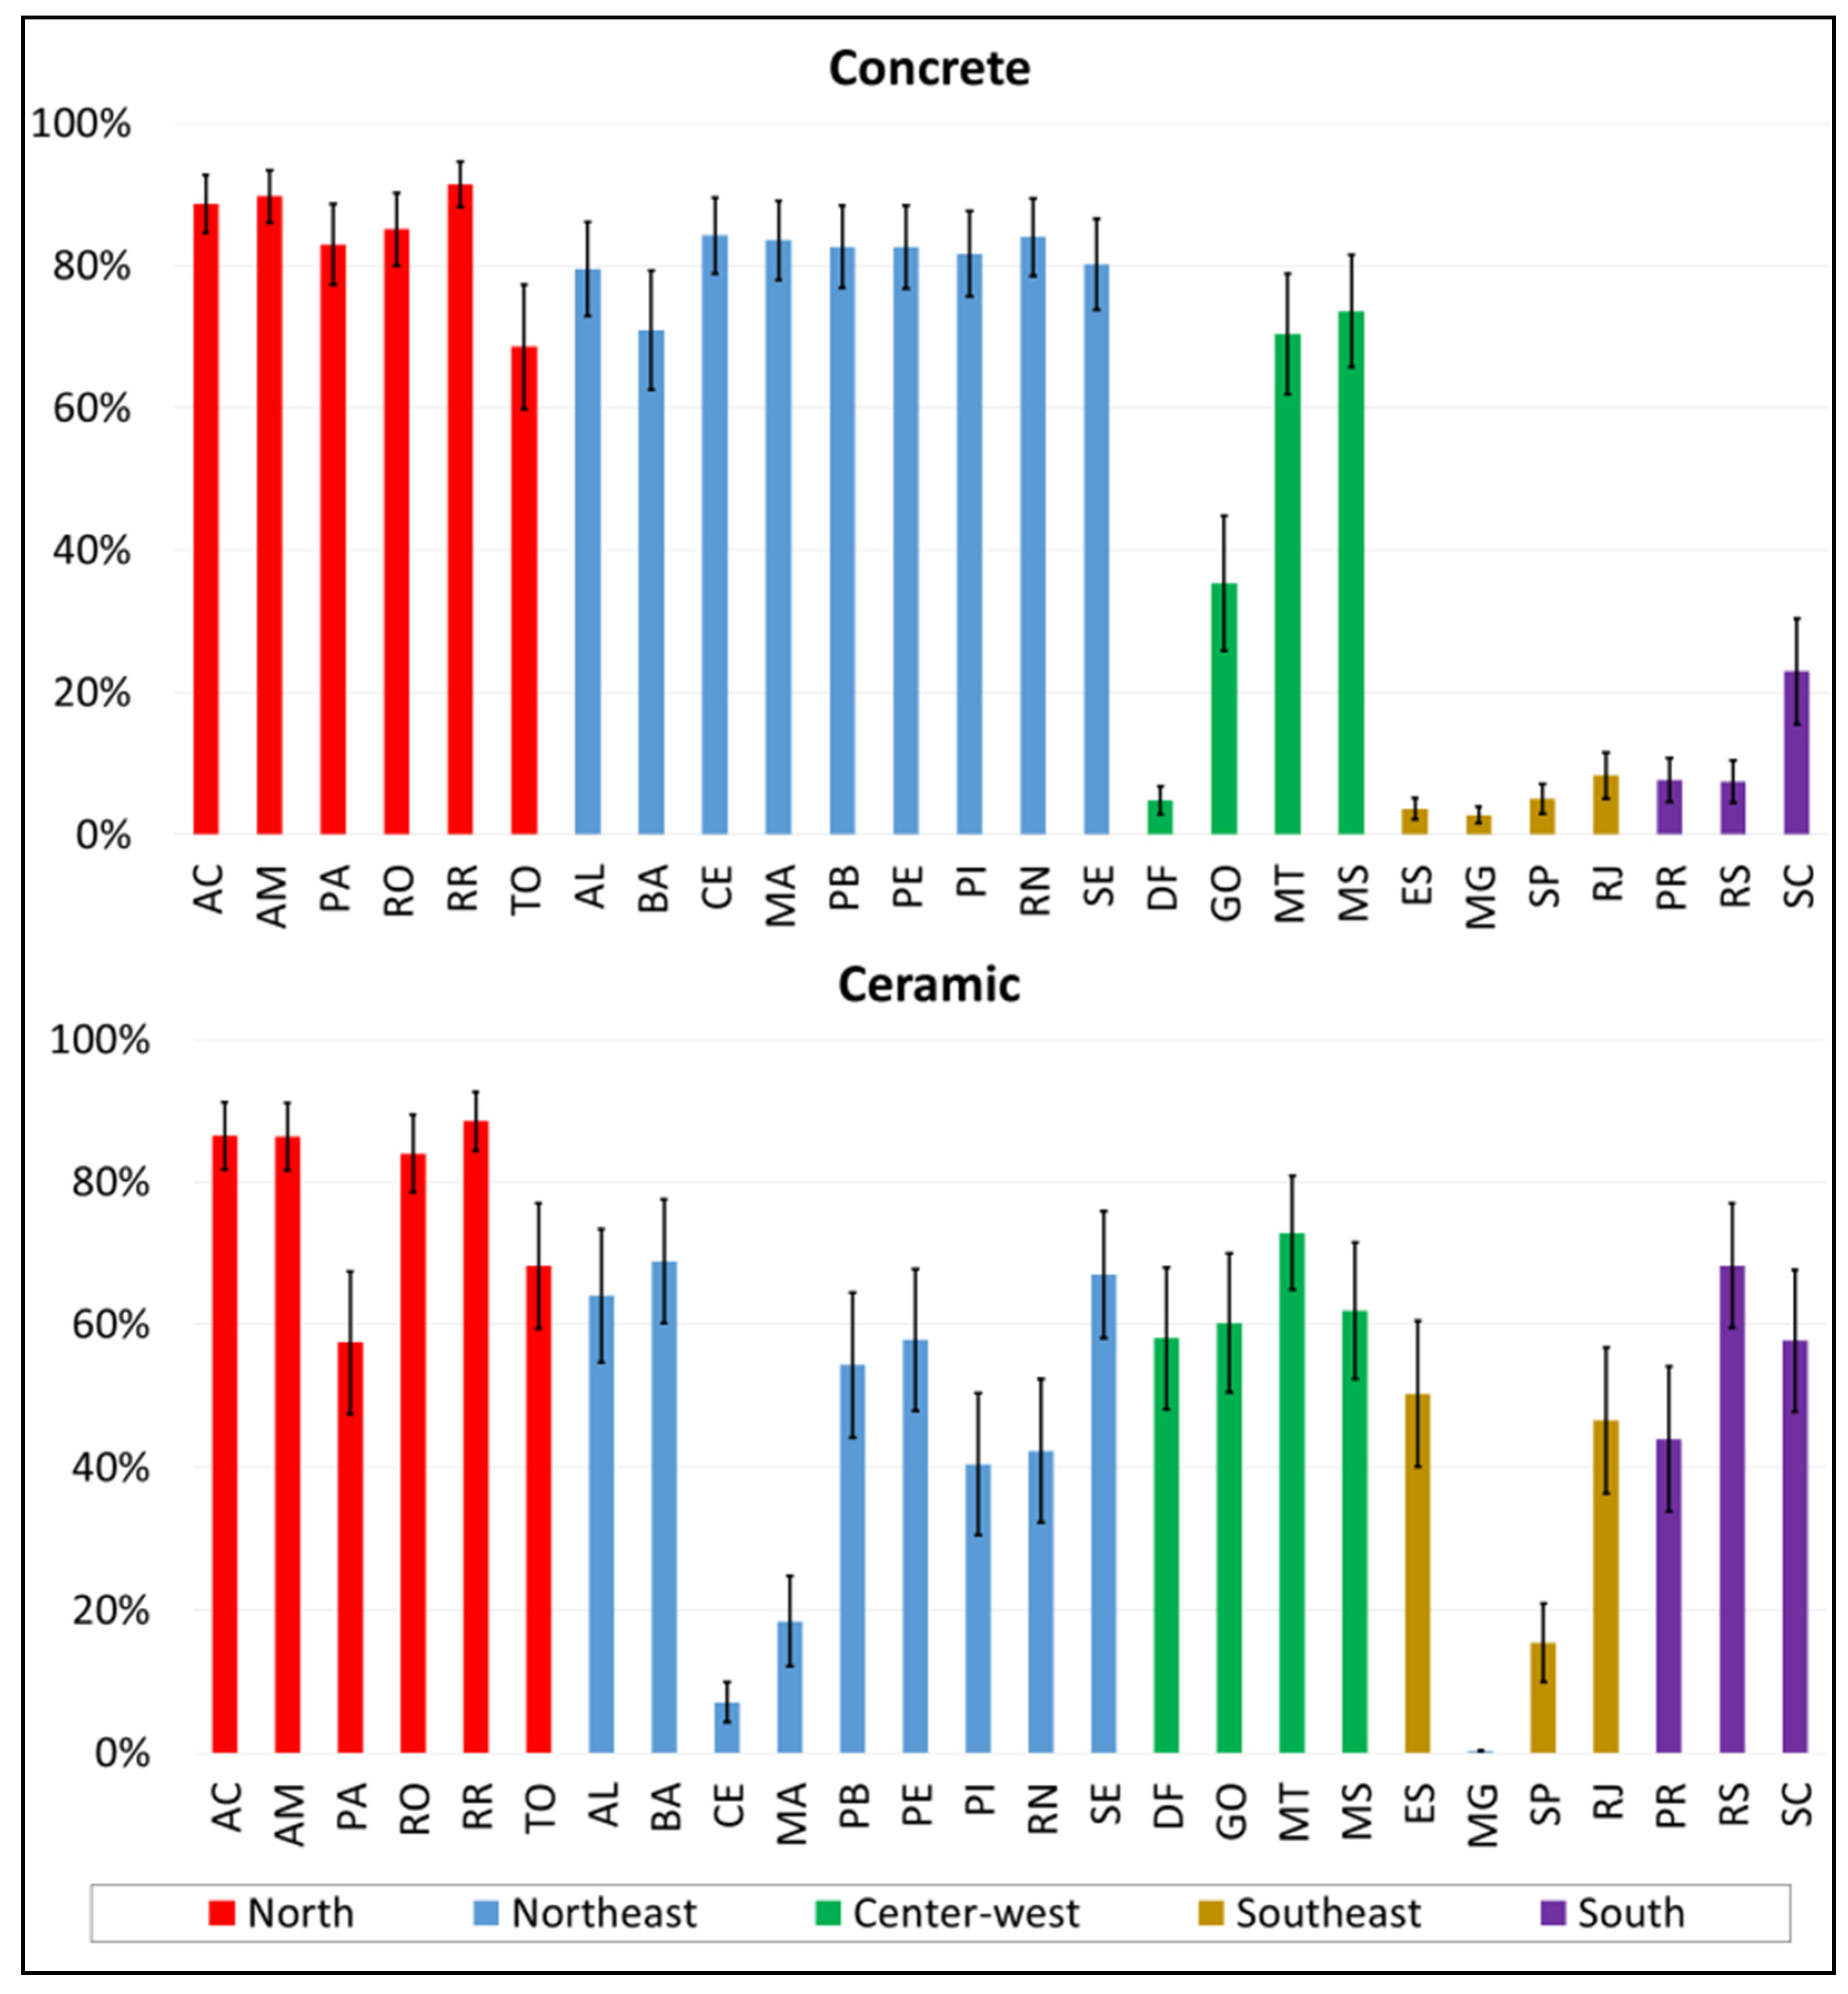
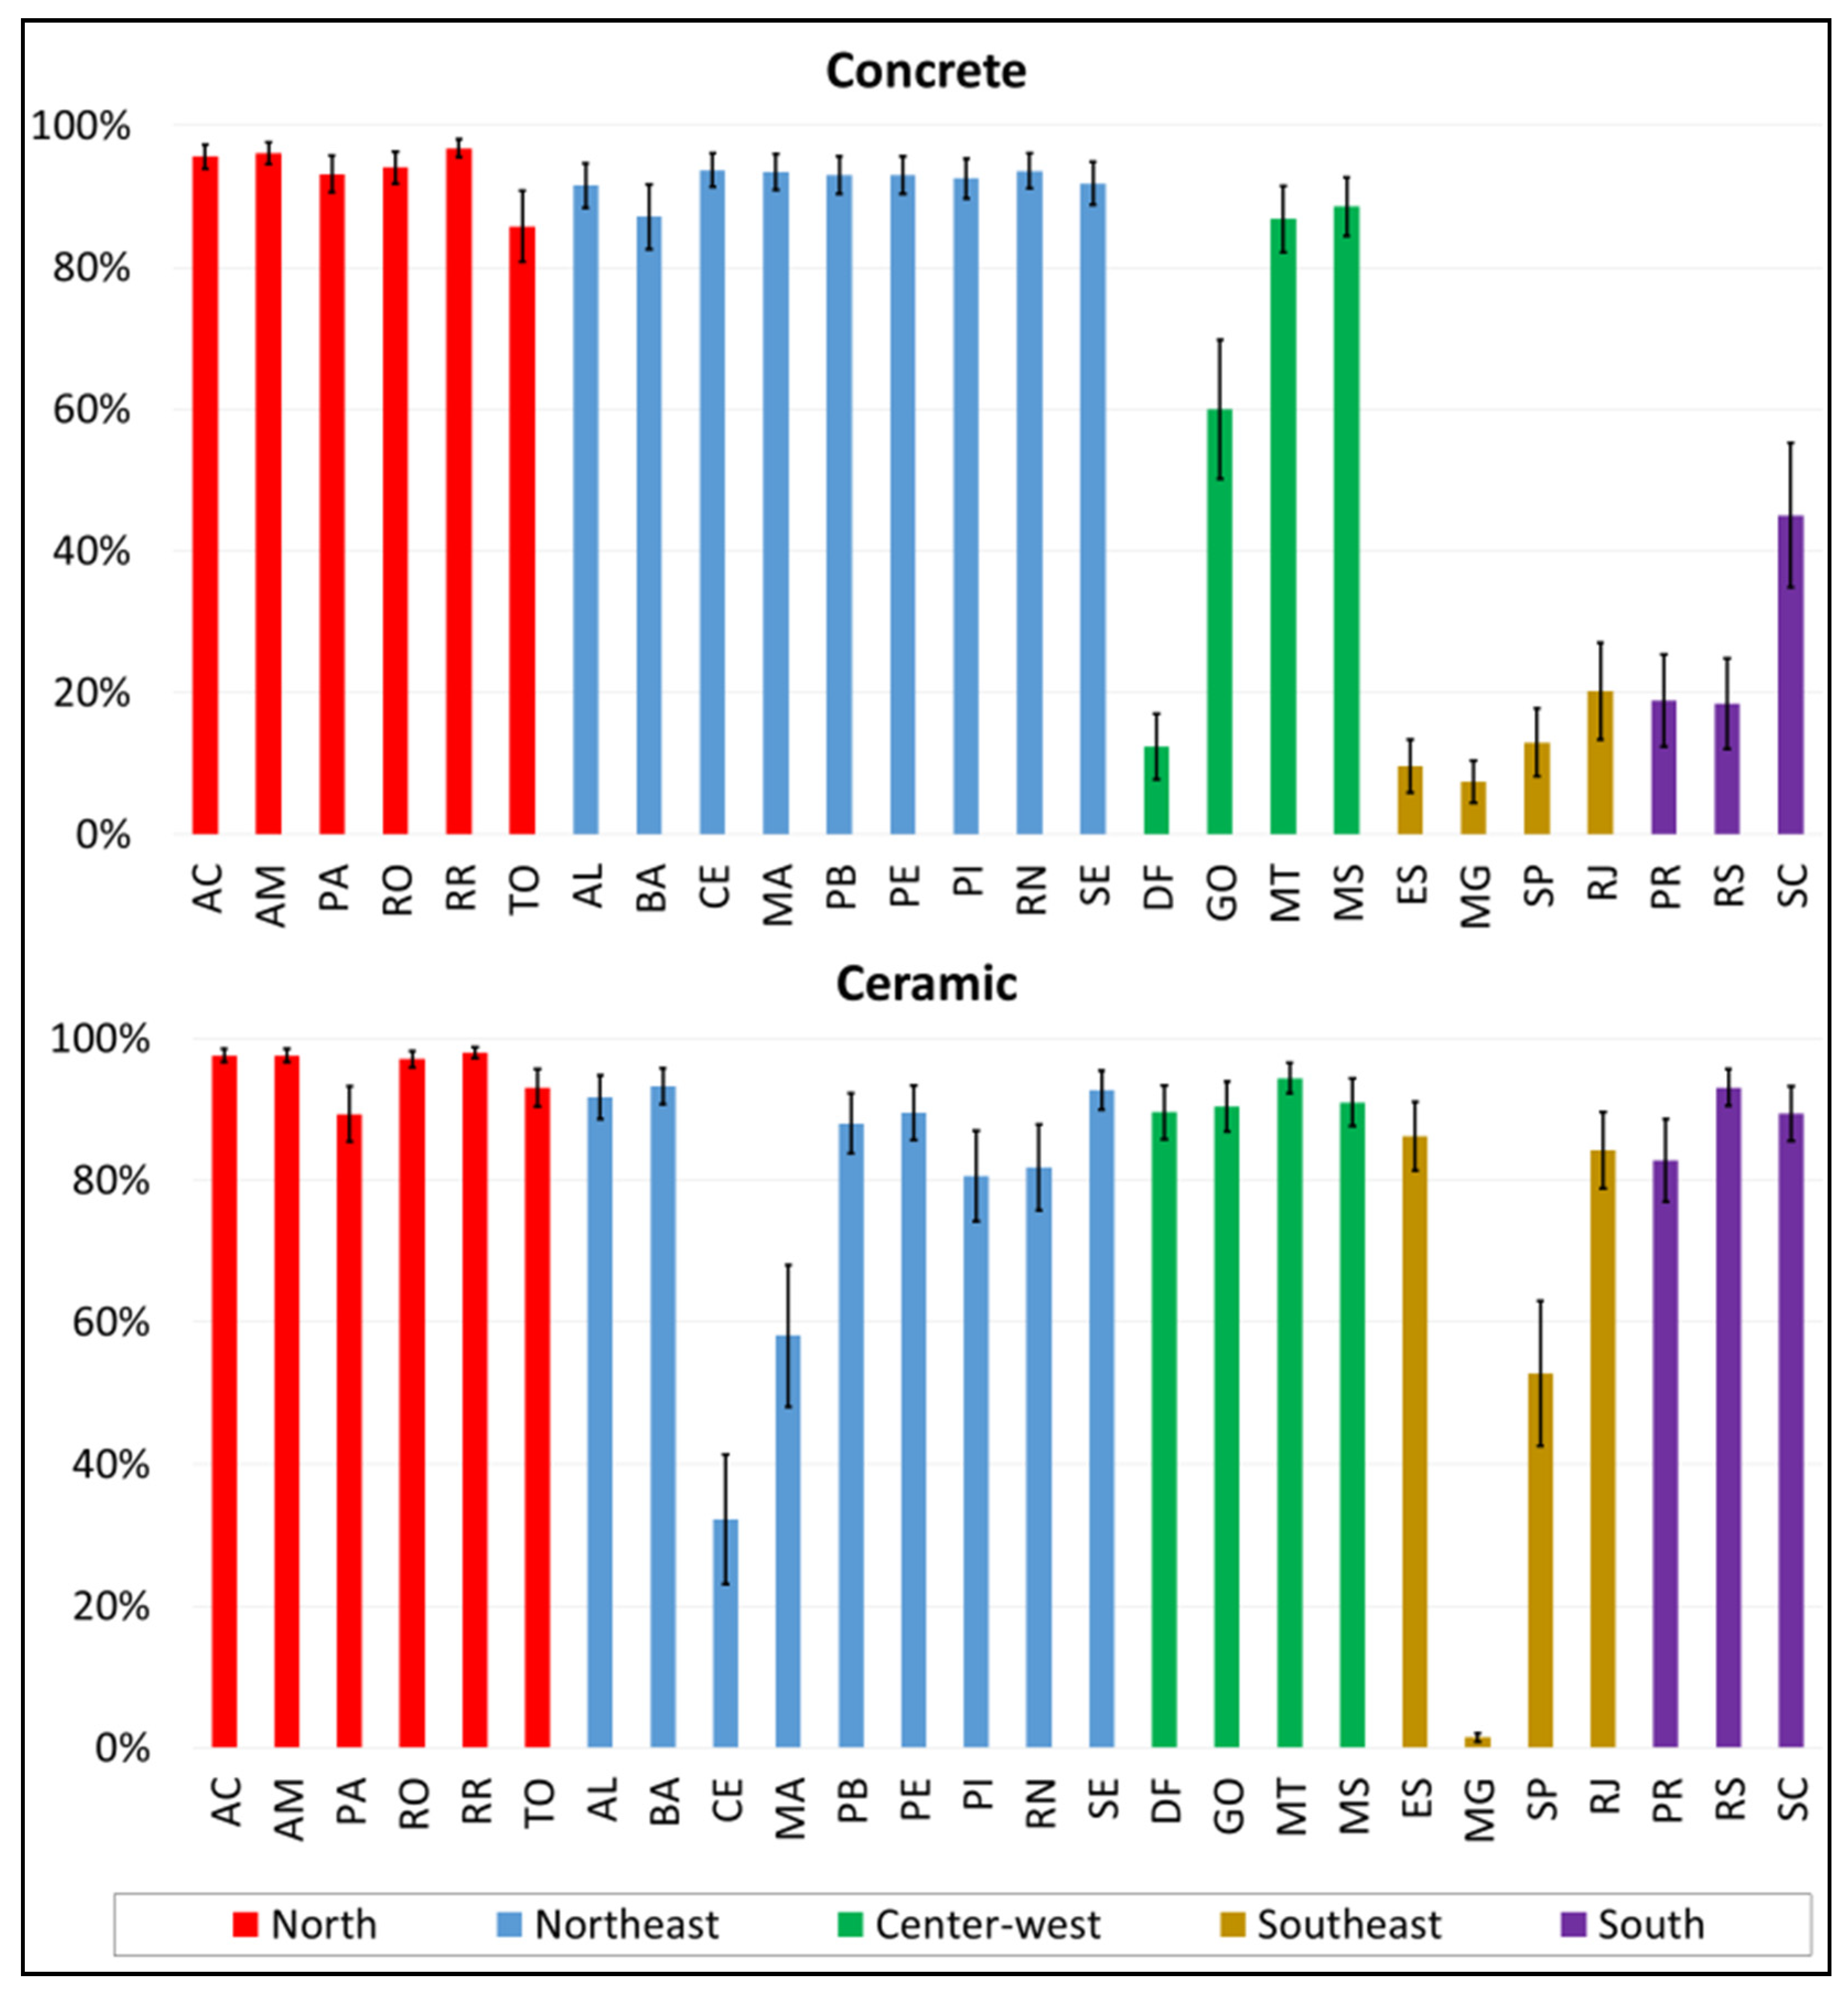
3.2. Contribution of the Transportation Stage in Relation to Total Impacts

The contribution of the transportation phase was calculated in relation to the amount of total environmental impacts for concrete and ceramic blocks, as shown in Figure 8, Figure 9, Figure 10 and Figure 11.
There were large differences between the most and least efficient transportation scenarios. This shows the importance of the application and analysis of different scenarios, since the data from the literature on industrial emissions and fuel consumption present significant variations.
For both materials, the Northern region demonstrated the largest percentage in the transportation stage (AC, AM, PA, RO, and RR), while the Southeastern region (ES, MG, SP, and RJ) presented the smallest for all environmental impacts. This applied to both types of blocks due to the difference in transportation distances between the classified factories and the hypothetical site locations. For the concrete blocks, the cities located in the Northeast also presented higher values for environmental impacts from transportation. In the ceramic block case, there was a reduction in these distances because of the classified factories located in the states of MA and CE. The concentration of concrete block factories in the Southern and the Southeastern regions led to a decrease in the environmental impacts for this material in the cities located in these regions. The Roraima (RR) location showed the greatest environmental impact due to transportation, while Minas Gerais (MG) showed the lowest. This occurred for both kinds of blocks.
It is important to highlight that, in this study, the potential feasibility of these factories is assumed to meet the demands of all regions. The higher masses of concrete blocks also influence the environmental impacts during transportation due to the increase in fuel consumption.
However, the importance of this percentage and the range among the four environmental categories draw our attention. For the Climate Change impact, the concrete blocks’ percentage reached values of up to 88%, while that of the ceramic blocks reached 97%. For the Human Health impact, the transportation percentage reached 96% and 94% for the concrete and ceramic blocks, respectively. For Ecosystem Quality, it reached 98% and 99%, and for Resource Depletion, it reached 92% and 96% respectively, making this the worst transportation scenario.

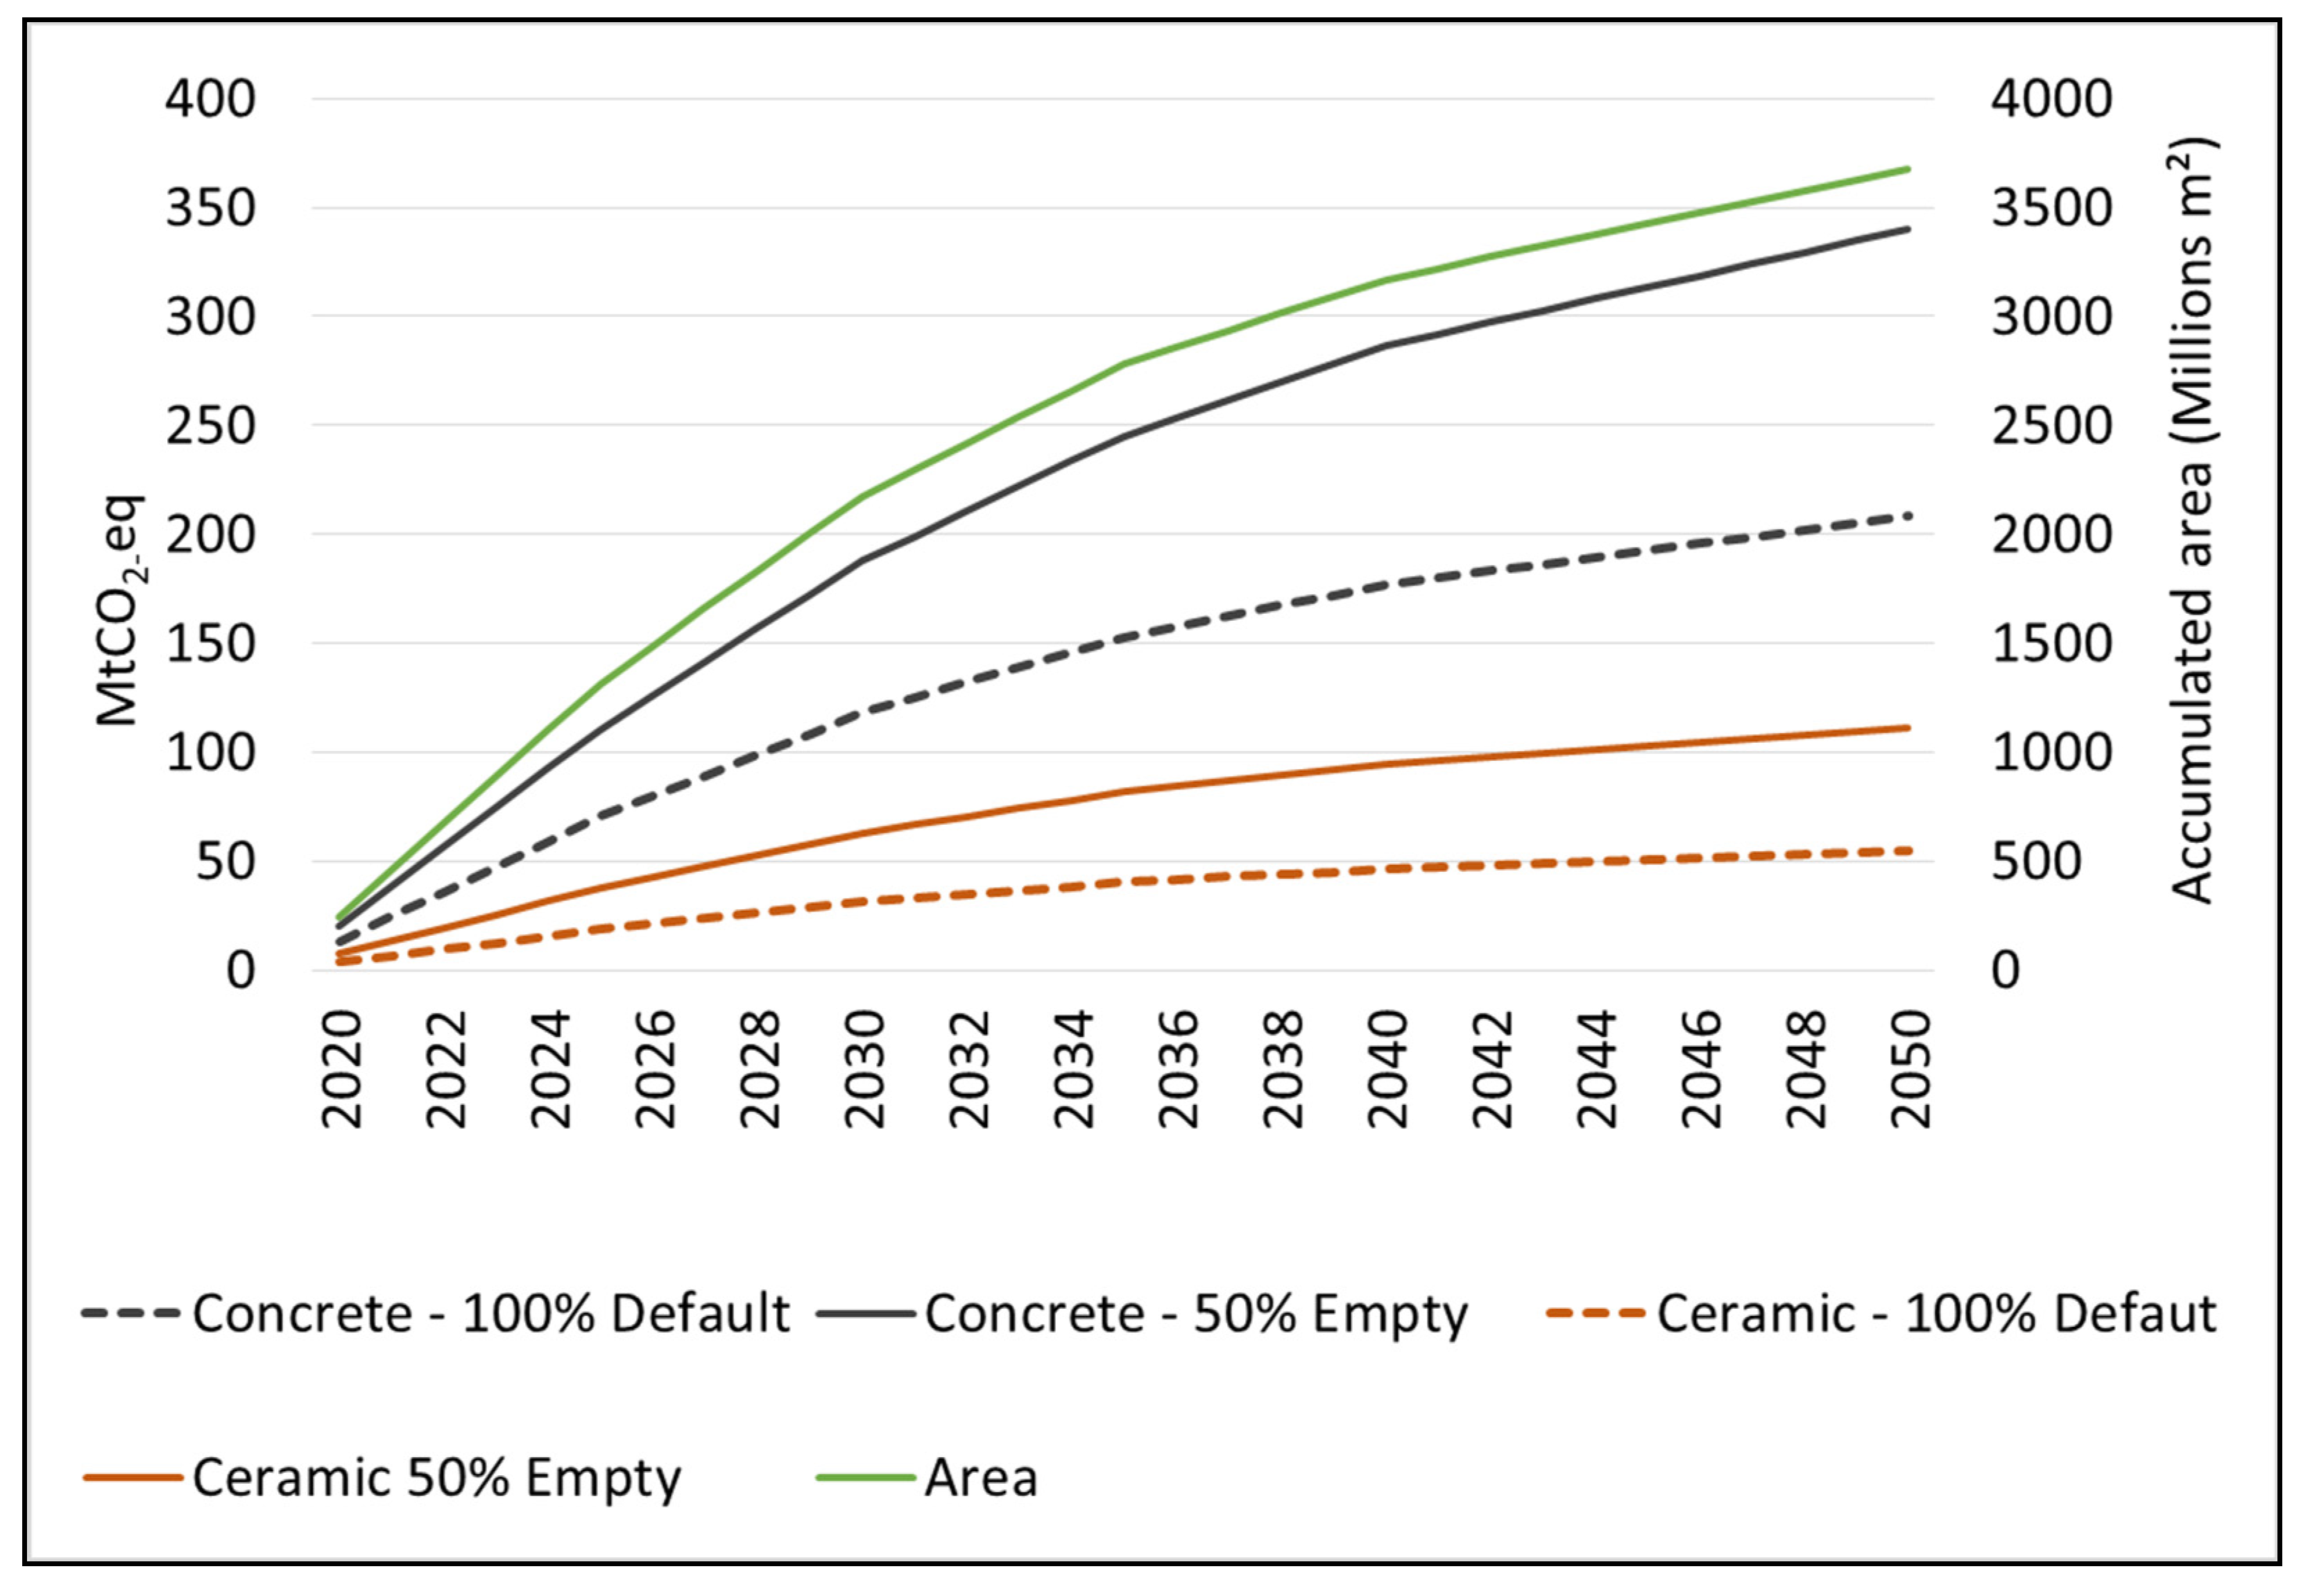
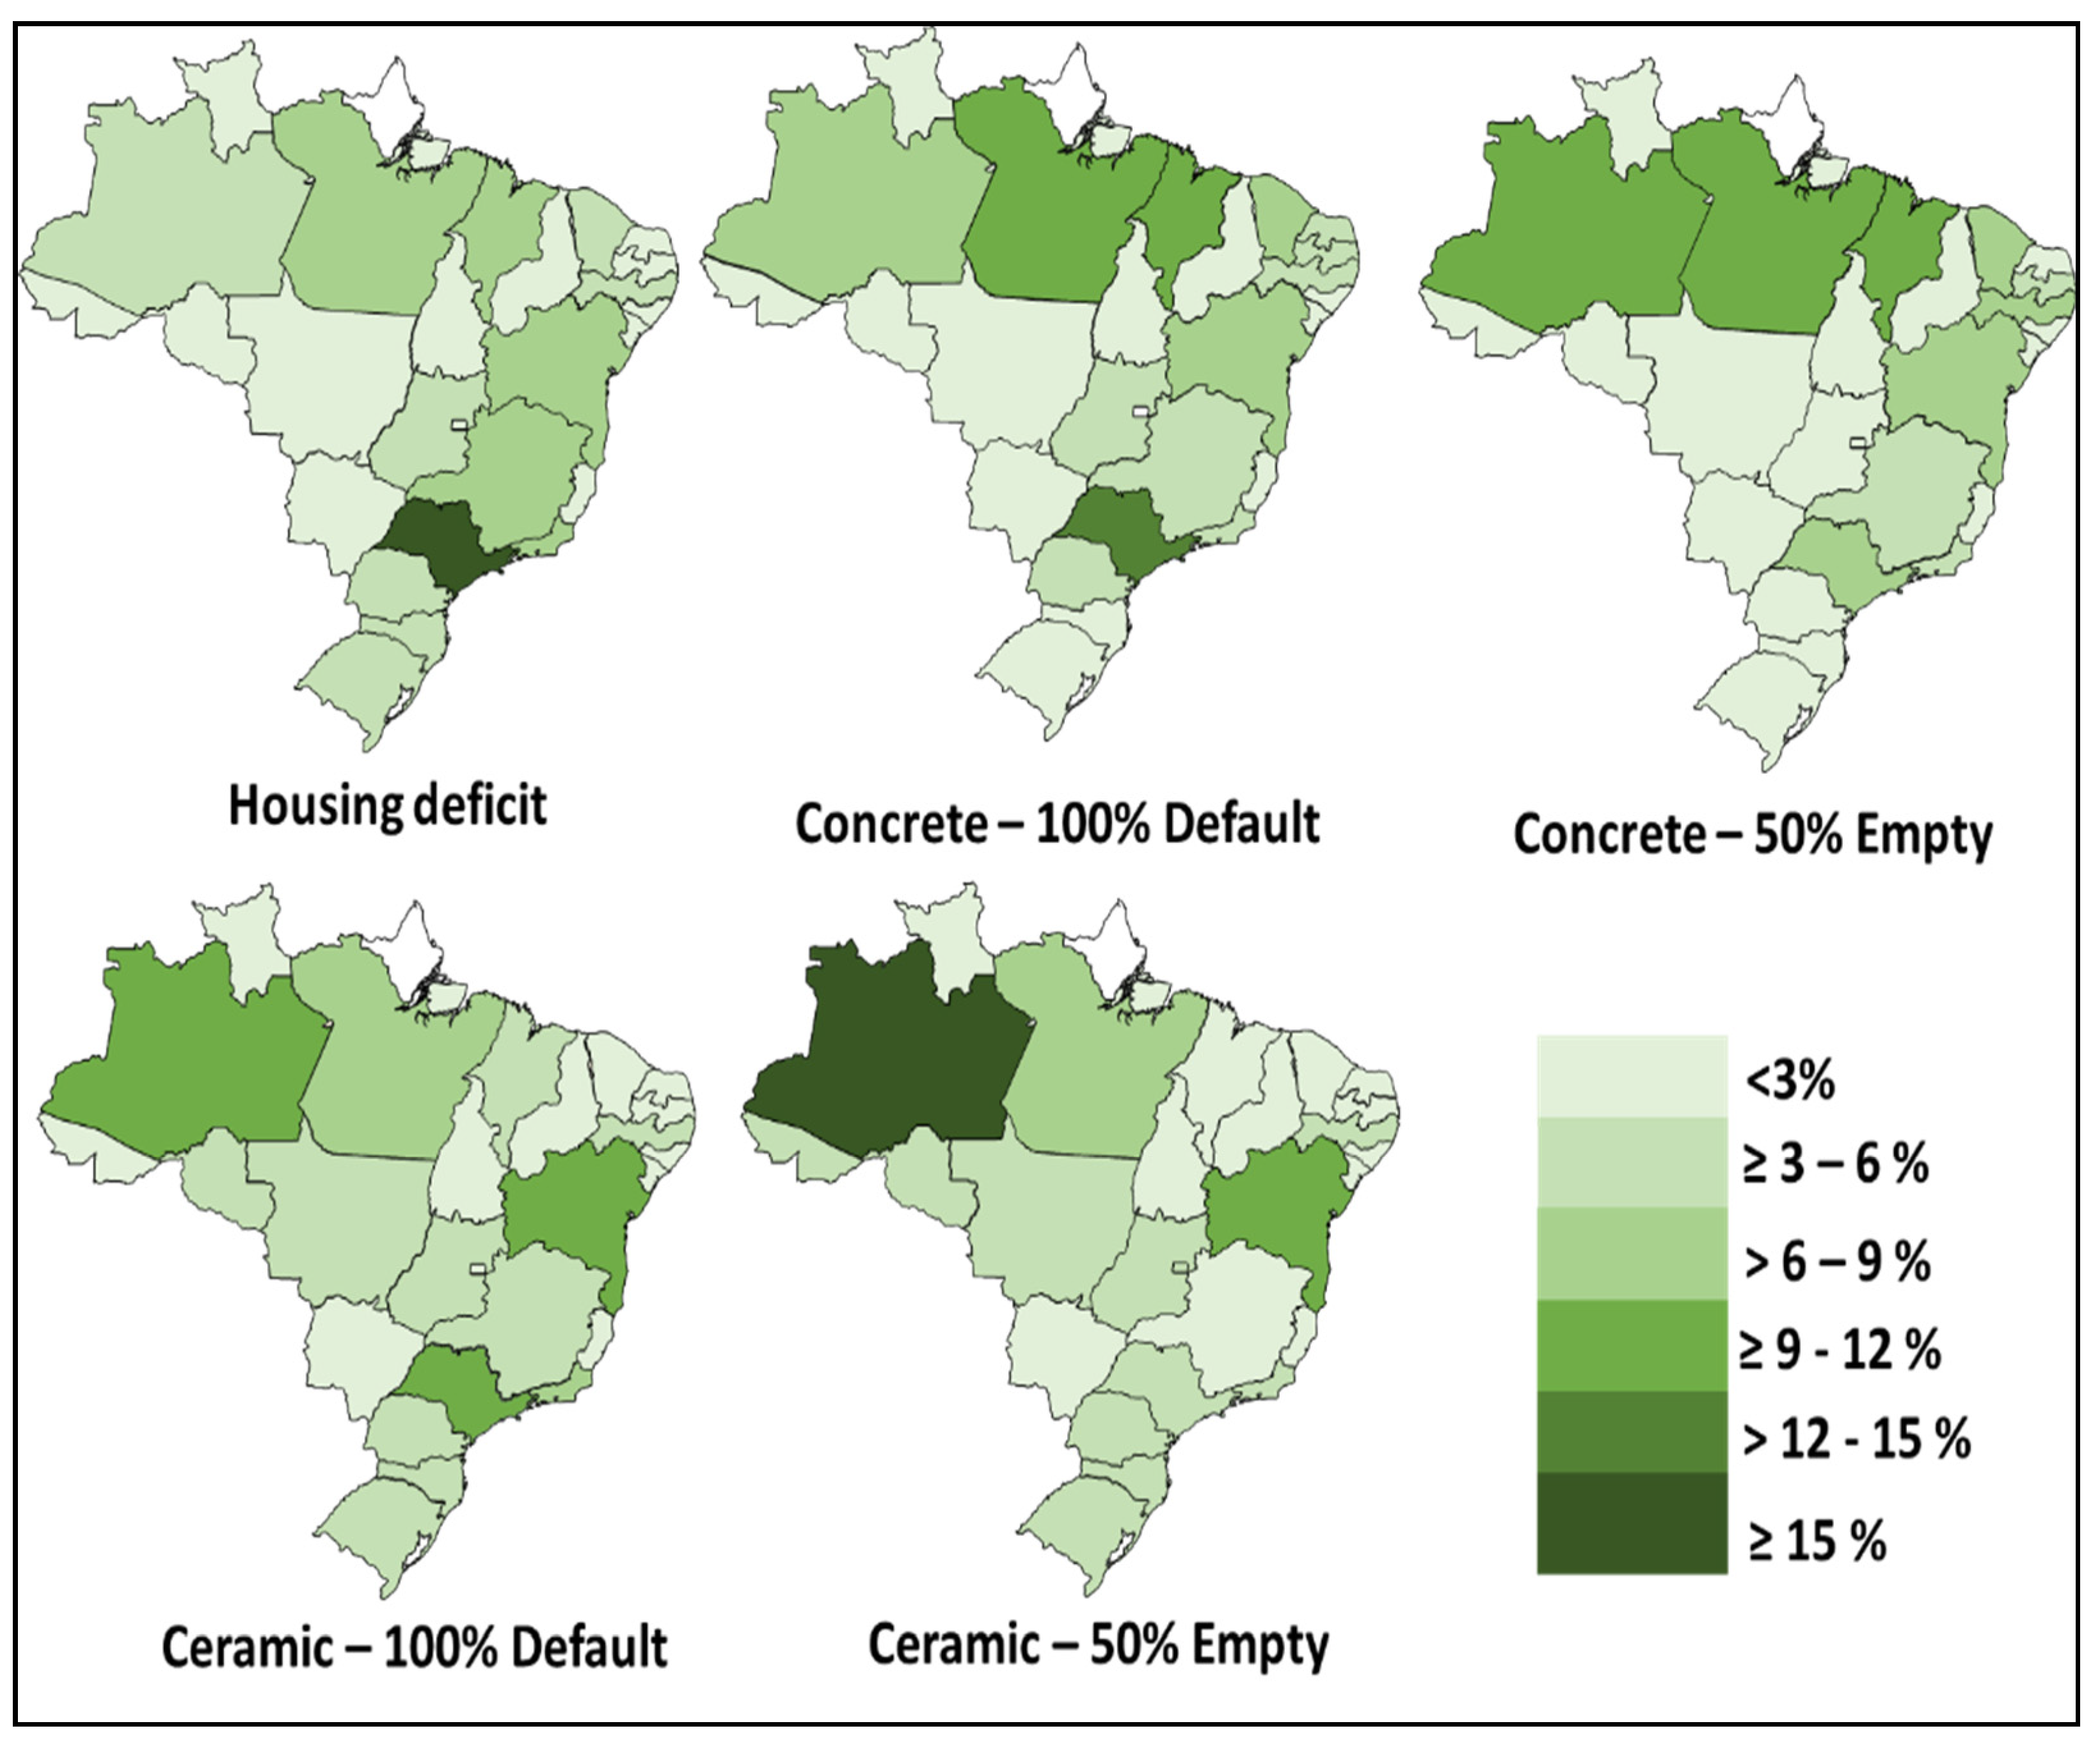
3.3. Reduction of Climate Change Potential and Housing Deficit

Figure 12 shows the amounts of CO2-eq emissions for each block type by considering the scenarios with the most efficient transportation (100% default) and the least efficient (50% empty). Figure 13 presents the total housing deficit for the 2020–2050 period and the total emissions for each state. The other environmental categories are presented in the Supplementary Material (Figures S6–S8).
When comparing the two products, the ceramic blocks were more influenced by transportation efficiency due to the higher percentage of transportation in the total Climate Change impact, with the differences reaching more than 100% in 2050 (between 100% default and 50% empty for ceramic), while for the concrete blocks, this difference would reach around 70% in the same year (between 100% default and 50% empty for concrete).
A shift in building components from concrete to ceramic blocks has the potential to mitigate between 154 and 229 Mt CO2-eq in 2050 (considering the entire country’s housing deficit). A change from the least to the most efficient transportation can reduce emissions by 57 Mt CO2-eq for ceramic blocks and 132 Mt CO2-eq for concrete blocks.
It is interesting to note that transportation efficiency can play an integral role in the mitigation of embodied CO2-eq emissions of building materials’ life cycle. So, to use materials from certified companies in terms of quality assessments, CO2-eq emissions can increase due to the greater transportation distances.
When the locations of housing deficits and CO2-eq emissions are analyzed, we can observe that they are mainly concentrated in four states: SP, AM, MA, and PA. Although SP displays the highest housing deficit by 2050, its contribution to CO2-eq emissions is close to those of MA and PA and decreases in scenarios with lower transportation efficiency. In SP, the differences between the two block types are not as great due to the small transportation impact, while in MA and PA, those differences are considerable.
A sensitivity analysis was performed while examining two aspects: (1) the fuel used during the ceramic block firing stage and (2) the emission standards of the vehicles used for the materials’ transportation.
In Brazil, according to the Brazilian Ministry of Mines and Energy [43], the ceramic sector utilizes natural gas for the ceramic blocks’ firing stage. Therefore, it is important to evaluate how the environmental impacts of the production process of ceramic blocks are affected when natural gas is used (called Ceramic—Natural Gas here) instead of wood chips (called Ceramic—Wood Chips here). A sensitivity analysis was performed by considering the process available in Ecoinvent v.3.3 for ceramic block production (clay brick {GLO}). In this dataset, natural gas was used as the main fuel, and the original electricity mix was replaced by the Brazilian electricity mix in Ecoinvent. For the vehicle emission standard, we changed EURO 3 to EURO 5 while considering the same scenarios.
Figure 14 shows the results for the assessment of multiple energy sources for the ceramic blocks’ firing, transportation efficiency, and emission standards related to the total housing deficit between 2020 and 2050. Detailed results are presented in the Supplementary Material (Figure S9).
The use of natural gas instead of wood chips mainly reduced the impacts in the cases of Climate Change and Resource Depletion. Thus, the transportation percentages for these two categories decreased considerably (reaching 20% for some cities). However, in most cases, concrete stayed less advantageous for all categories.
A change from EURO 3 to EURO 5 implies a decrease in some pollutants, especially emissions of nitrogen oxides (NOx), carbon monoxide (CO), and particulate matter (PM). The decrease in these emissions leads to considerable Human Health benefits (reaching 25%). Therefore, newer vehicles with improved emission standards can be a beneficial strategy for reducing negative health-related impacts, while the differences in terms of load capacity and type of return (full or empty) have a positive effect on the environmental impacts.

4. Discussion

The results show that transportation can be of considerable importance for the overall environmental impacts of both ceramic and concrete blocks if PSQ-rated factories are demanded in construction projects, as such factories tend to be concentrated in the more industrialized parts of the country, while the need for habitation also exists in less-developed parts. This opens a discussion about the environmental costs of certified construction products’ demand in cases where the production sites of such materials are unevenly distributed. Such impacts could easily go unnoticed, even in projects where environmental impacts of buildings are calculated, as the A4 phase (transportation from factories to building sites) is not a required item according to EN 15978 [40].
However, when quality and certification schemes are required for building materials’ acquisition, they can considerably increase the life-cycle environmental impacts, especially in continental countries, as demonstrated in this case study. Although the A4 life-cycle phase is not mandatory, it deserves to be included, at least in such specific cases. It should be highlighted that the use of quality-certified construction products can also be valid from an environmental perspective for prolonging the lifetime of constructions, decreasing maintenance, etc. Application of a more complex functional unit where such quality-related aspects are included will generate results where these aspects are acknowledged. This study used the case of Brazil, but the same situation could arise in other regions where construction material quality standards are put in use.
For the concrete blocks, a significant portion of the impacts, especially those on Climate Change and Resource Depletion, come from the consumption of fossil fuels for energy production, which is mainly related to the clinker in cement and hydrated lime production. Typically, the Brazilian Portland cement CPV-ARI (High Initial Resistance) is used. It is the Brazilian cement that has the highest clinker content (reaching 90%) and the smallest particle size [48]. On the other hand, in ceramic block production, the use of wood chips for the firing stage has zero CO2 emissions, since they are a biogenic resource, thus resulting in less resource depletion, as they are a renewable resource. However, the impact on Human Health increases because of the release of particulate matter (PM2.5) due to the combustion of wood chips [31,32].
Bueno et al. [33] also compared the production stages of Brazilian concrete and ceramic blocks using the Ecoinvent 2.01 database (without adaptation to the context of Brazil) with different LCIA methods (EDIP 1997, CML 2001, ReCiPe Midpoint, and ILCD Midpoint—Climate Change). They found greater environmental impacts for ceramic blocks, especially for Climate Change impact. This can mainly be explained due to the fuels used for ceramic block production that are present in the Ecoinvent database, which are natural gas and oil. However, if we think in the context of the Brazilian ceramic block production, the main resource used as fuel is wood chips [49].
Finally, including the building stock and housing demand in the assessment allows for efficient sectorial planning by identifying the relevant distribution of production sites. Based on the present study, the states of AM, PA, and MA should receive special attention due to the combination of rising housing demand and the lack of certified construction material sites.
One limitation is the criteria used for choosing the transportation distances. In LCA studies, the transportation distance criteria differ from study to study. Some authors use the shortest distance when a generic product is evaluated [4]; other researchers use actual distances when specific case studies are evaluated and available [50], and others prefer to use more than one value, calculating the variation with statistical methods, e.g., standard deviation [37,51]. On the market, the specification of a product is normally related to the product’s cost and logistical aspects, even if the transportation distance is greater. Therefore, we do not have a better option than the alternative that is most suitable for the objective of this research. In this study, we adopted the shortest transportation distance between factories and hypothetical sites.
Another limitation is the data used for the blocks’ production. The data can change significantly depending on the process, technology, and management employed by manufacturers. For example, it is possible to have differences in terms of CO2 emissions by a factor of 3 for the same product and resistance class when different companies are compared [48]. Then, if the impact of material production increases, the contribution of transportation decreases. When national databases start to acquire data from different factories and producers instead of sectorial or generic databases, the decision-making process will be more assertive.
Although these indicated limitations exist, they do not invalidate our findings. When LCA and transportation data become more precise, it is possible to update the approach used here. With the use of more sophisticated tools linked with GIS, it will be possible to have more realistic results. Recently, a novel term appeared—the Territorial LCA—which aims to have a more holistic evaluation of environmental impacts and land-planning policies, mixing production–consumption patterns with territorial features. The main idea is to use the same LCA concepts and requirements with the support of GIS tools [52]. This could be a good pathway for the study of building materials’ environmental impacts, especially when transportation is a required stage and when the aim is to have a more holistic and country-level approach.

5. Conclusions

This study investigated the potential environmental impacts of structural concrete and ceramic block factories that are classified in their respective Sectorial Quality Programs (PSQs) while considering the locations of factories and transportation distances in the 26 Brazilian state capitals. A cradle-to-site Life-Cycle Assessment (LCA) was accomplished, with a focus on the transportation stage. Based on our research and the premises adopted in the LCA modeling, we highlight the main findings:
  • Regarding this stage and its environmental impacts, the Northern and the Northeastern regions were the most affected, while the Southeastern region presented the lowest values.
  • When the environmental impacts from cradle to site were evaluated, we concluded that ceramic blocks are the best option for most of the cases, especially when wood chips are used in the firing process. Therefore, their use for the mitigation of global warming and other environmental impacts should be encouraged.
  • Another item evaluated in this research is the contribution of the transportation stage concerning the total environmental impacts. The Northern region presented the highest percentage (reaching 98% for the concrete block walls and 99% for the ceramic block walls for the Ecosystem Quality impact in the least efficient scenario), while the Southeastern region had the lowest percentage (less than 1% for both materials) for the most efficient scenario in terms of the Climate Change impact.
  • We recommend that the building LCA standards should highlight the importance of the consideration of this phase in evaluations, especially in cases where certification schemes are required for building materials’ acquisition.
  • We also observed that the transportation efficiency of building materials is more relevant in terms of environmental impact mitigation than emission standards.
  • Considering the growth of the housing deficit by 2050, it is possible to avoid 154 to 229 Mt CO2-eq by changing from concrete to ceramic blocks and 57 to 132 Mt CO2-eq by improving the transportation efficiency at the building-stock level.
Our research brings a valuable international contribution in terms of the methodological approach used, which combined quality certification schemes with the choice of building material manufacturers, the calculation of the influence of transportation (including efficiency aspects), and the relation with the housing deficit. The lessons are especially valuable for continental and developing countries, particularly those that are expected to have a significant future housing demand.
Future studies should attempt to obtain information directly from factories classified in the PSQs to improve the quality of data, the comparison of other Brazilian building materials or components, and the development of an integrated platform to provide information for stakeholders.

Supplementary Materials

The following are available online at https://www.mdpi.com/article/10.3390/world2040030/s1. Figure S1: Transportation distances of concrete and ceramic blocks, Figure S2: Climate Change impact—comparison between concrete and ceramic blocks, Figure S3: Human Health impact—comparison between concrete and ceramic blocks, Figure S4: Ecosystem Quality impact—comparison between concrete and ceramic blocks, Figure S5: Resource Depletion impact—comparison between concrete and ceramic blocks, Figure S6: Human Health impact considering the housing deficit projection, Figure S7: Ecosystem Quality impact considering the housing deficit projection, Figure S8: Resource Depletion impact considering the housing deficit projection, and Figure S9: Detailed results of all impact categories considering the housing deficit for different sensitivity analysis scenarios. The results were normalized with the concrete blocks—EURO 3—50% empty scenario. (A) Climate Change; (B) Human Health; (C) Ecosystem Quality; (D) Resource Depletion. Table S1: Datasets used in the life-cycle GHG emission inventory, Table S2: Input data for the housing deficit calculation.

Author Contributions

Conceptualization, L.R.C., F.P. and A.K.E.B.S.; methodology, L.R.C., F.P., R.S., A.K.E.B.S. and R.d.L.M.P.; Formal analysis, L.R.C., F.P., R.S., A.K.E.B.S. and R.d.L.M.P.; Investigation, L.R.C., F.P., R.S., A.K.E.B.S. and R.d.L.M.P.; data curation, L.R.C., F.P., R.S., A.K.E.B.S. and R.d.L.M.P.; writing—original draft preparation, L.R.C., F.P., R.S., A.K.E.B.S. and R.d.L.M.P.; writing—review and editing, L.R.C., F.P., R.S., A.K.E.B.S., R.d.L.M.P. and R.D.T.F.; visualization, L.R.C., F.P., R.S., A.K.E.B.S. and R.d.L.M.P.; supervision, R.S. and R.D.T.F.; project administration, L.R.C. and R.D.T.F.; funding acquisition, R.D.T.F. All authors have read and agreed to the published version of the manuscript.

Funding

This study was financed in part by Conselho Nacional de Desenvolvimento Científico e Tecnológico (CNPq) and by the Coordenação de Aperfeiçoamento de Pessoal de Nível Superior—Brasil (CAPES)—Finance Code 001.

Institutional Review Board Statement

Not applicable.

Informed Consent Statement

Not applicable.

Data Availability Statement

Not applicable.

Acknowledgments

It is a pleasure to acknowledge the financial support for this investigation provided by the Brazilian agencies of CNPq and CAPES. The authors also express their gratitude to the editor and anonymous reviewers for their comments and suggestions. They also would like to acknowledge Guillaume Habert from ETH Zürich, Institut für Bau- und Infrastrukturmanagement, Sustainable Construction, for the previous discussion about the theme of LCA. Finally, we want to thank Katerina Dimitrova for the language review.

Conflicts of Interest

The authors declare no conflict of interest.

References

  1. United Nations. Sustainable Development Goals. Available online: http://www.un.org/sustainabledevelopment/sustainable-development-goals (accessed on 22 May 2021).
  2. UN Environment and International Energy Agency. Towards a Zero-Emission, Efficient, and Resilient Buildings and Construction Sector; UN Environment and International Energy Agency: Paris, France, 2017. [Google Scholar]
  3. BSI. ISO 14040—Environmental Management—Life Cycle Assessment—Principles and Framework; BSI: London, UK, 2006; Volume 3. [Google Scholar]
  4. Paulsen, J.S.; Sposto, R.M. A life cycle energy analysis of social housing in Brazil: Case study for the program “MY HOUSE MY LIFE”. Energy Build. 2013, 57, 95–102. [Google Scholar] [CrossRef]
  5. Pinheiro, F.J. Déficit Habitacional No Brasil|2013–2014; Fantastic Journeys Publishing: Belo Horizonte, Brazil, 2016. [Google Scholar]
  6. Vasquez, E.M.A. Analise de Conforto Ambiental em Projetos de Habitações de Interesse Social Segundo a NBR 15575:2013, PUC-RIO. Ph.D. Thesis, Universidade Católica do Rio de Janeiro, Rio de Janeiro, Brazil, 2017. [Google Scholar]
  7. das Cidades, M. Programas Setoriais da Qualidade (PSQs); Governo do Brasil: Brasília, Brazil, 2018.
  8. Chau, C.K.; Leung, T.M.; Ng, W.Y. A review on Life Cycle Assessment, Life Cycle Energy Assessment and Life Cycle Carbon Emissions Assessment on buildings. Appl. Energy 2015, 143, 395–413. [Google Scholar] [CrossRef]
  9. Bahramian, M.; Yetilmezsoy, K. Life cycle assessment of the building industry: An overview of two decades of research (1995–2018). Energy Build. 2020, 219, 109917. [Google Scholar] [CrossRef]
  10. Çankaya, S. Investigating the environmental impacts of alternative fuel usage in cement production: A life cycle approach. Environ. Dev. Sustain. 2019, 22, 7495–7514. [Google Scholar] [CrossRef]
  11. Vogtländer, J.; van der Lugt, P.; Brezet, H. The sustainability of bamboo products for local and Western European applications. LCAs and land-use. J. Clean. Prod. 2010, 18, 1260–1269. [Google Scholar] [CrossRef]
  12. Bribián, I.Z.; Capilla, A.V.; Usón, A.A. Life cycle assessment of building materials: Comparative analysis of energy and environmental impacts and evaluation of the eco-efficiency improvement potential. Build. Environ. 2011, 46, 1133–1140. [Google Scholar] [CrossRef]
  13. Bolin, C.A.; Smith, S.T. Life cycle assessment of borate-treated lumber with comparison to galvanized steel framing. J. Clean. Prod. 2011, 19, 630–639. [Google Scholar] [CrossRef]
  14. Cobut, A.; Blanchet, P.; Beauregard, R. The environmental footprint of interior wood doors in non-residential buildings e part 1: Life cycle assessment. J. Clean. Prod. 2015, 109, 232–246. [Google Scholar] [CrossRef] [Green Version]
  15. Christoforou, E.; Kylili, A.; Fokaides, P.A.; Ioannou, I. Cradle to site Life Cycle Assessment (LCA ) of adobe bricks. J. Clean. Prod. 2016, 112, 443–452. [Google Scholar] [CrossRef]
  16. Vieira, D.R.; Calmon, J.L.; Zulcão, R.; Coelho, F.Z. Consideration of strength and service life in cradle-to-gate life cycle assessment of self-compacting concrete in a maritime area: A study in the Brazilian context. Environ. Dev. Sustain. 2018, 20, 1849–1871. [Google Scholar] [CrossRef]
  17. Celik, K.; Meral, C.; Gursel, A.P.; Mehta, P.K.; Horvath, A.; Monteiro, P.J.M. Cement & Concrete Composites Mechanical properties, durability, and life-cycle assessment of self-consolidating concrete mixtures made with blended portland cements containing fly ash and limestone powder. Cem. Concr. Compos. 2015, 56, 59–72. [Google Scholar] [CrossRef] [Green Version]
  18. Gursel, A.P.; Maryman, H.; Ostertag, C. A life-cycle approach to environmental, mechanical, and durability properties of “green” concrete mixes with rice husk ash. J. Clean. Prod. 2016, 112, 823–836. [Google Scholar] [CrossRef]
  19. Yin, S.; Tuladhar, R.; Sheehan, M.; Combe, M.; Collister, T. A life cycle assessment of recycled polypropylene fi bre in concrete footpaths. J. Clean. Prod. 2016, 112, 2231–2242. [Google Scholar] [CrossRef]
  20. Silvestre, D.; Kurda, R.; Brito, J.D. Influence of recycled aggregates and high contents of fl y ash on concrete fresh properties. Cem. Concr. Compos. 2019, 84, 198–213. [Google Scholar] [CrossRef]
  21. Serres, N.; Braymand, S.; Feugeas, F. Environmental evaluation of concrete made from recycled concrete aggregate implementing life cycle assessment. J. Build. Eng. 2016, 5, 24–33. [Google Scholar] [CrossRef]
  22. Blengini, G.A.; Garbarino, E.; Šolar, S.; Shields, D.J.; Hámor, T.; Vinai, R.; Agioutantis, Z. Life Cycle Assessment guidelines for the sustainable production and recycling of aggregates: The Sustainable Aggregates Resource Management project (SARMa). J. Clean. Prod. 2012, 27, 177–181. [Google Scholar] [CrossRef]
  23. Caldas, L.R.; Saraiva, A.B.; Lucena, A.F.P.; Da Gloria, M.Y.; Santos, A.S.; Filho, R.D.T. Building materials in a circular economy: The case of wood waste as CO2-sink in bio concrete. Resour. Conserv. Recycl. 2021, 166, 105346. [Google Scholar] [CrossRef]
  24. Utama, N.A.; Mclellan, B.C.; Gheewala, S.H.; Ishihara, K.N. Embodied impacts of traditional clay versus modern concrete houses in a tropical regime. Build. Environ. 2012, 57, 362–369. [Google Scholar] [CrossRef]
  25. Cabeza, L.F.; Rincón, L.; Vilariño, V.; Pérez, G.; Castell, A. Life cycle assessment (LCA) and life cycle energy analysis (LCEA) of buildings and the building sector: A review. Renew. Sustain. Energy Rev. 2014, 29, 394–416. [Google Scholar] [CrossRef]
  26. Salzer, C.; Wallbaum, H.; Ostermeyer, Y.; Kono, J. Environmental performance of social housing in emerging economies: Life cycle assessment of conventional and alternative construction methods in the Philippines. Int. J. Life Cycle Assess. 2017, 22, 1785–1801. [Google Scholar] [CrossRef] [Green Version]
  27. Pittau, F.; Krause, F.; Lumia, G.; Habert, G. Fast-growing bio-based materials as an opportunity for storing carbon in exterior walls. Build. Environ. 2018, 129, 117–129. [Google Scholar] [CrossRef]
  28. Morales, M.; Moraga, G.; Kirchheim, A.P.; Passuello, A. Regionalized inventory data in LCA of public housing: A comparison between two conventional typologies in southern Brazil. J. Clean. Prod. 2019, 238, 117869. [Google Scholar] [CrossRef]
  29. Göswein, V.; Gonçalves, A.B.; Dinis, J.; Freire, F.; Habert, G.; Kurda, R. Resources, Conservation & Recycling Transportation matters—Does it? GIS-based comparative environmental assessment of concrete mixes with cement, fly ash, natural and recycled aggregates. Resour. Conserv. Recycl. 2018, 137, 1–10. [Google Scholar] [CrossRef]
  30. Condeixa, K.; Haddad, A.; Boer, D. Life Cycle Impact Assessment of masonry system as inner walls: A case study in Brazil. Constr. Build. Mater. 2014, 70, 141–147. [Google Scholar] [CrossRef]
  31. de Souza, D.M.; Lafontaine, M.; Charron-Doucet, F.; Bengoa, X.; Chappert, B.; Duarte, F.; Lima, L. Comparative Life Cycle Assessment of ceramic versus concrete roof tiles in the Brazilian context. J. Clean. Prod. 2015, 89, 165–173. [Google Scholar] [CrossRef]
  32. Souza, D.M.; Lafontaine, M.; Charron-doucet, F.; Chappert, B.; Kicak, K.; Duarte, F.; Lima, L. Comparative life cycle assessment of ceramic brick, concrete brick and cast-in-place reinforced concrete exterior walls. J. Clean. Prod. 2016, 137, 70–82. [Google Scholar] [CrossRef]
  33. Bueno, C.; Zwicky, M.; Roberto, A. Sensitivity analysis of the use of Life Cycle Impact Assessment methods: A case study on building materials. J. Clean. Prod. 2016, 112, 2208–2220. [Google Scholar] [CrossRef] [Green Version]
  34. Caldas, L.R.; Sposto, R.M. Emissões de CO2 referentes ao transporte de materiais de construção no Brasil: Estudo comparativo entre blocos estruturais cerâmicos e de concreto. Ambient. Construído 2017, 17, 91–108. [Google Scholar] [CrossRef] [Green Version]
  35. Bomberg, M.; Romanska-Zapala, A.; Yarbrough, D. Towards a New Paradigm for Building Science (Building Physics). World 2021, 2, 13. [Google Scholar] [CrossRef]
  36. Weißenberger, M.; Jensch, W.; Lang, W. The convergence of life cycle assessment and nearly zero-energy buildings: The case of Germany. Energy Build. 2014, 76, 551–557. [Google Scholar] [CrossRef] [Green Version]
  37. Caldas, L.R.; Saraiva, A.B.; Andreola, V.M.; Toledo Filho, R.D. Bamboo bio-concrete as an alternative for buildings’ climate change mitigation and adaptation. Constr. Build. Mater. 2020, 263, 120652. [Google Scholar] [CrossRef]
  38. Pini. TCPO 2014: Tabelas de Composições de Preços para Orçamentos, 14th ed.; Pini, Ed.; Pini: São Paulo, Brazil, 2012. [Google Scholar]
  39. Google Developers. Google Maps Documentation. Available online: https://developers.google.com/maps/documentation/ (accessed on 22 May 2021).
  40. CEN. EN 15978:2011—Sustainability of Construction Works—Assessment of Environmental Performance of Buildings—Calculation Method; iTeh, Inc.: Newark, DE, USA, 2011. [Google Scholar]
  41. Anderson, J.; Moncaster, A. Embodied carbon of concrete in buildings, Part 1: Analysis of published EPD. Build. Cities 2020, 1, 198–217. [Google Scholar] [CrossRef]
  42. Dong, Y.; Ng, S.T.; Liu, P. A comprehensive analysis towards benchmarking of life cycle assessment of buildings based on systematic review. Build. Environ. 2021, 204, 108162. [Google Scholar] [CrossRef]
  43. Empresa de Pesquisa Energética. Brasil Balanço Energético Nacional; Empresa de Pesquisa Energética: Brasília, Brazil, 2018. [Google Scholar]
  44. Caldas, L.R.; Lira, J.S.d.M.; Sposto, R.M. Avaliação do Ciclo de Vida de habitações de alvenaria estrutural de blocos cerâmicos e painéis pré-moldados de concreto considerando diferentes zonas bioclimáticas. R. Latino-Amer. Aval. Ciclo Vida 2017, 1, 138–167. [Google Scholar] [CrossRef]
  45. Ministério das Cidades. Demanda Futura por Moradias: Demografia, Habitação e Mercado; UFF: Niterói, Brazil, 2018. [Google Scholar]
  46. ABNT. NBR 12721—Avaliação de Custos Unitários de Construção Para Incorporação Imobiliária e Outras Disposições Para Condomínios Edifícios—Procedimento; ABNT: Rio de Janeiro, Brazil, 2006. [Google Scholar]
  47. ABNT. NBR 15575. Edificações Habitacionais—Desempenho; ABNT: Rio de Janeiro, Brazil, 2013. [Google Scholar]
  48. CBCS. Projeto Avaliação de Ciclo de Vida Modular de Blocos e Pisos de Concreto; CBCS: São Paulo, Brazil, 2014. [Google Scholar]
  49. ANICER. Dados Oficiais. Associaçao Nacional da Indústria Ceramica; ANICER: Rio de Janeiro, Brazil, 2011; Document in Portuguese; p. 52. Available online: https://www.anicer.com.br/wp-content/uploads/2016/11/relatorio_2011.pdf (accessed on 22 May 2021).
  50. Barbosa, N.; Monteiro, R.; Neto, M.; Aparecida, E. Environmental assessment in concrete industries. J. Clean. Prod. 2021, 327, 129516. [Google Scholar] [CrossRef]
  51. Mahecha, R.E.G.; Caldas, L.R.; Garaffa, R.; Lucena, A.F.P.; Szklo, A.; Toledo Filho, R.D. Constructive systems for social housing deployment in developing countries: A case study using dynamic life cycle carbon assessment and cost analysis in Brazil. Energy Build. 2020, 227, 110395. [Google Scholar] [CrossRef]
  52. Loiseau, E.; Aissani, L.; Le Feon, S.; Laurent, F.; Cerceau, J.; Sala, S.; Roux, P. Territorial Life Cycle Assessment (LCA): What exactly is it about? A proposal towards using a common terminology and a research agenda. J. Clean. Prod. 2018, 176, 474–485. [Google Scholar] [CrossRef] [Green Version]
Figure 1. (a) Structural concrete block. (b) Structural ceramic block.
World 02 00030 g001
Figure 2. Brazilian map with the structural concrete and ceramic block factories. Red—northern region. Blue—northeastern region. Green—central-western region. Yellow—southeastern region. Purple—southern region.
World 02 00030 g002
Figure 3. Total Climate Change impacts. The error bars represent the standard deviation due to transportation scenarios.
World 02 00030 g003
Figure 4. Total Human Health impact. The error bars represent the standard deviation due to transportation scenarios.
World 02 00030 g004
Figure 5. Total Ecosystem Quality impact. The error bars represent the standard deviation due to transportation scenarios.
World 02 00030 g005
Figure 6. Total Resource Depletion impact. The error bars represent the standard deviation due to transportation scenarios.
World 02 00030 g006
Figure 7. Environmental impact map—comparison between concrete and ceramic blocks. Orange = ceramic blocks are the most advantageous; gray = concrete blocks are the most advantageous; yellow = less than 5% difference between the total Resource Depletion impacts from ceramic and concrete blocks; 100% Default—represents that the truck is loaded with 100% of its capacity and returns full; 50% Empty—represents that the truck is loaded with 50% of its capacity and returns empty.
World 02 00030 g007
Figure 8. Percentage of the transportation stage in the Climate Change impact. The error bars represent the standard deviation due to transportation scenarios.
World 02 00030 g008
Figure 9. Percentage of the transportation stage in the Human Health impact. The error bars represent the standard deviation due to transportation scenarios.
World 02 00030 g009
Figure 10. Percentage of the transportation stage in the Ecosystem Quality impact. The error bars represent the standard deviation due to transportation scenarios.
World 02 00030 g010
Figure 11. Percentage of the transportation stage in the Resource Depletion impact. The error bars represent the standard deviation due to transportation scenarios.
World 02 00030 g011
Figure 12. CO2-eq emissions considering the housing deficit projection; 100% Default—represents that the truck is loaded with 100% of its capacity and returns full; 50% empty—represents that the truck is loaded with 50% of its capacity and returns empty.
World 02 00030 g012
Figure 13. Percentage of the cumulative housing deficit in 2050 and CO2-eq emissions for each state considering each block type for the different transportation options; 100% Default—represents that the truck is loaded with 100% of its capacity and returns full; 50% empty—represents that the truck is loaded with 50% of its capacity and returns empty.
World 02 00030 g013
Figure 14. Results for the impact categories when considering the housing deficit for different sensitivity analysis scenarios. The results were normalized with the concrete blocks—EURO 3—50% empty scenario. (A) Climate Change; (B) Human Health; (C) Ecosystem Quality; (D) Resources depletion; 100% Default—represents that the truck is loaded with 100% of its capacity and returns full; 50% Empty—represents that the truck is loaded with 50% of its capacity and returns empty.
World 02 00030 g014
Table 1. Properties and data of the products.
Material PropertiesConcrete BlockCeramic Block
Dimensions (cm)14 × 19 × 39 14 × 19 × 39
Blocks/m²12.5 [38]12.5 [38]
kg/block11.8 [38]6.9 [38]
Waste generated in construction 13% [38]5% [38]
1 This is considered as an increase in material consumption in the production phase of both blocks.
Publisher’s Note: MDPI stays neutral with regard to jurisdictional claims in published maps and institutional affiliations.

