1. Introduction
Sustainable development (SD) has become an urgent topic in contemporary development issues [
1]. SD is the organizing principle to meet human development goals [
2,
3,
4,
5] and aims to improve the quality of life in both urban and rural areas [
6,
7]. SD has received extensive care and support from the developed countries since the Brundtland report in 1987, then it was been adopted by developing countries after the Earth Summit in Rio in 1992 [
8,
9]. Since then, SD has been at the forefront of international and national agendas [
4].
Measuring and evaluating the progress of SD is a crucial step towards its implementation [
4,
10,
11]. Evaluation of SD is a comprehensive process to measure the improvement of the indicators of the social, economic, and environmental dimensions for a specific area and then compare them with the international and national targets [
12,
13,
14]. This process is significant in the context of the development planning and supporting decision-making procedures at different spatial levels towards achieving Sustainable Development Goals (SDGs) [
1]. There is a wide diversity of approaches and tools used to measure and evaluate SD. However, indicators have become the most commonly accepted approach to assess SD, at various levels [
7,
15]. Hence, international organizations have developed sets of indicators for the measurement and evaluation of SD. For instance, the United Nations General Assembly prepared a preliminary set of 232 indicators to measure progress toward reaching SDGs [
16,
17,
18].
Sustainable development indicators (SDIs) are effective tools that allow policymakers and planners to measure the socioeconomic and environmental impacts within a specific territory [
14]. These indicators simplify measuring the progress towards achieving SD [
19] and should be valid on a broad geographical scale [
20]. SDIs aim to evaluate and benchmark SD conditions and trends across time and space and monitor progress toward SDGs and their targets [
21].
It is widely accepted that SDI should cover the three dimensions of SD; social, economic, and environmental [
20]. Nevertheless, these dimensions have been examined partially by a group of researchers such as Shaaban, who only investigated the social and environmental aspects during his study in Egypt [
22], or Diaz-Chavez, [
23] whose study in Mexico focused on economic and environmental dimensions, disregarding social features. Panda et al. have only examined features associated with social sustainability within the Indian cities [
24].
A rich body of literature and studies has addressed measuring SD in the urban area [
6,
14,
25,
26,
27,
28,
29,
30]. For instance, Tanguay et al. [
14] developed an approach for the selection of sustainable development indicators (SDI) on an urban level, based on 188 indicators retrieved from 17 relevant studies. Nagy et al. [
4] have selected 39 indicators to gauge the SD in Cluj metropolitan area in Romania. Pires et al. [
25] have localized 20 indicators to be appropriate to measure the SD in a set of cities and municipalities in Portugal. Zulaica has chosen 19 indicators to evaluate the SD of Mar del Plata city in Argentina [
20]. However, the measurement of SD outside urban areas has been addressed in only a few studies, particularly rarely in the case of peri-urban areas between urban and rural territories [
4,
7,
23,
31,
32].
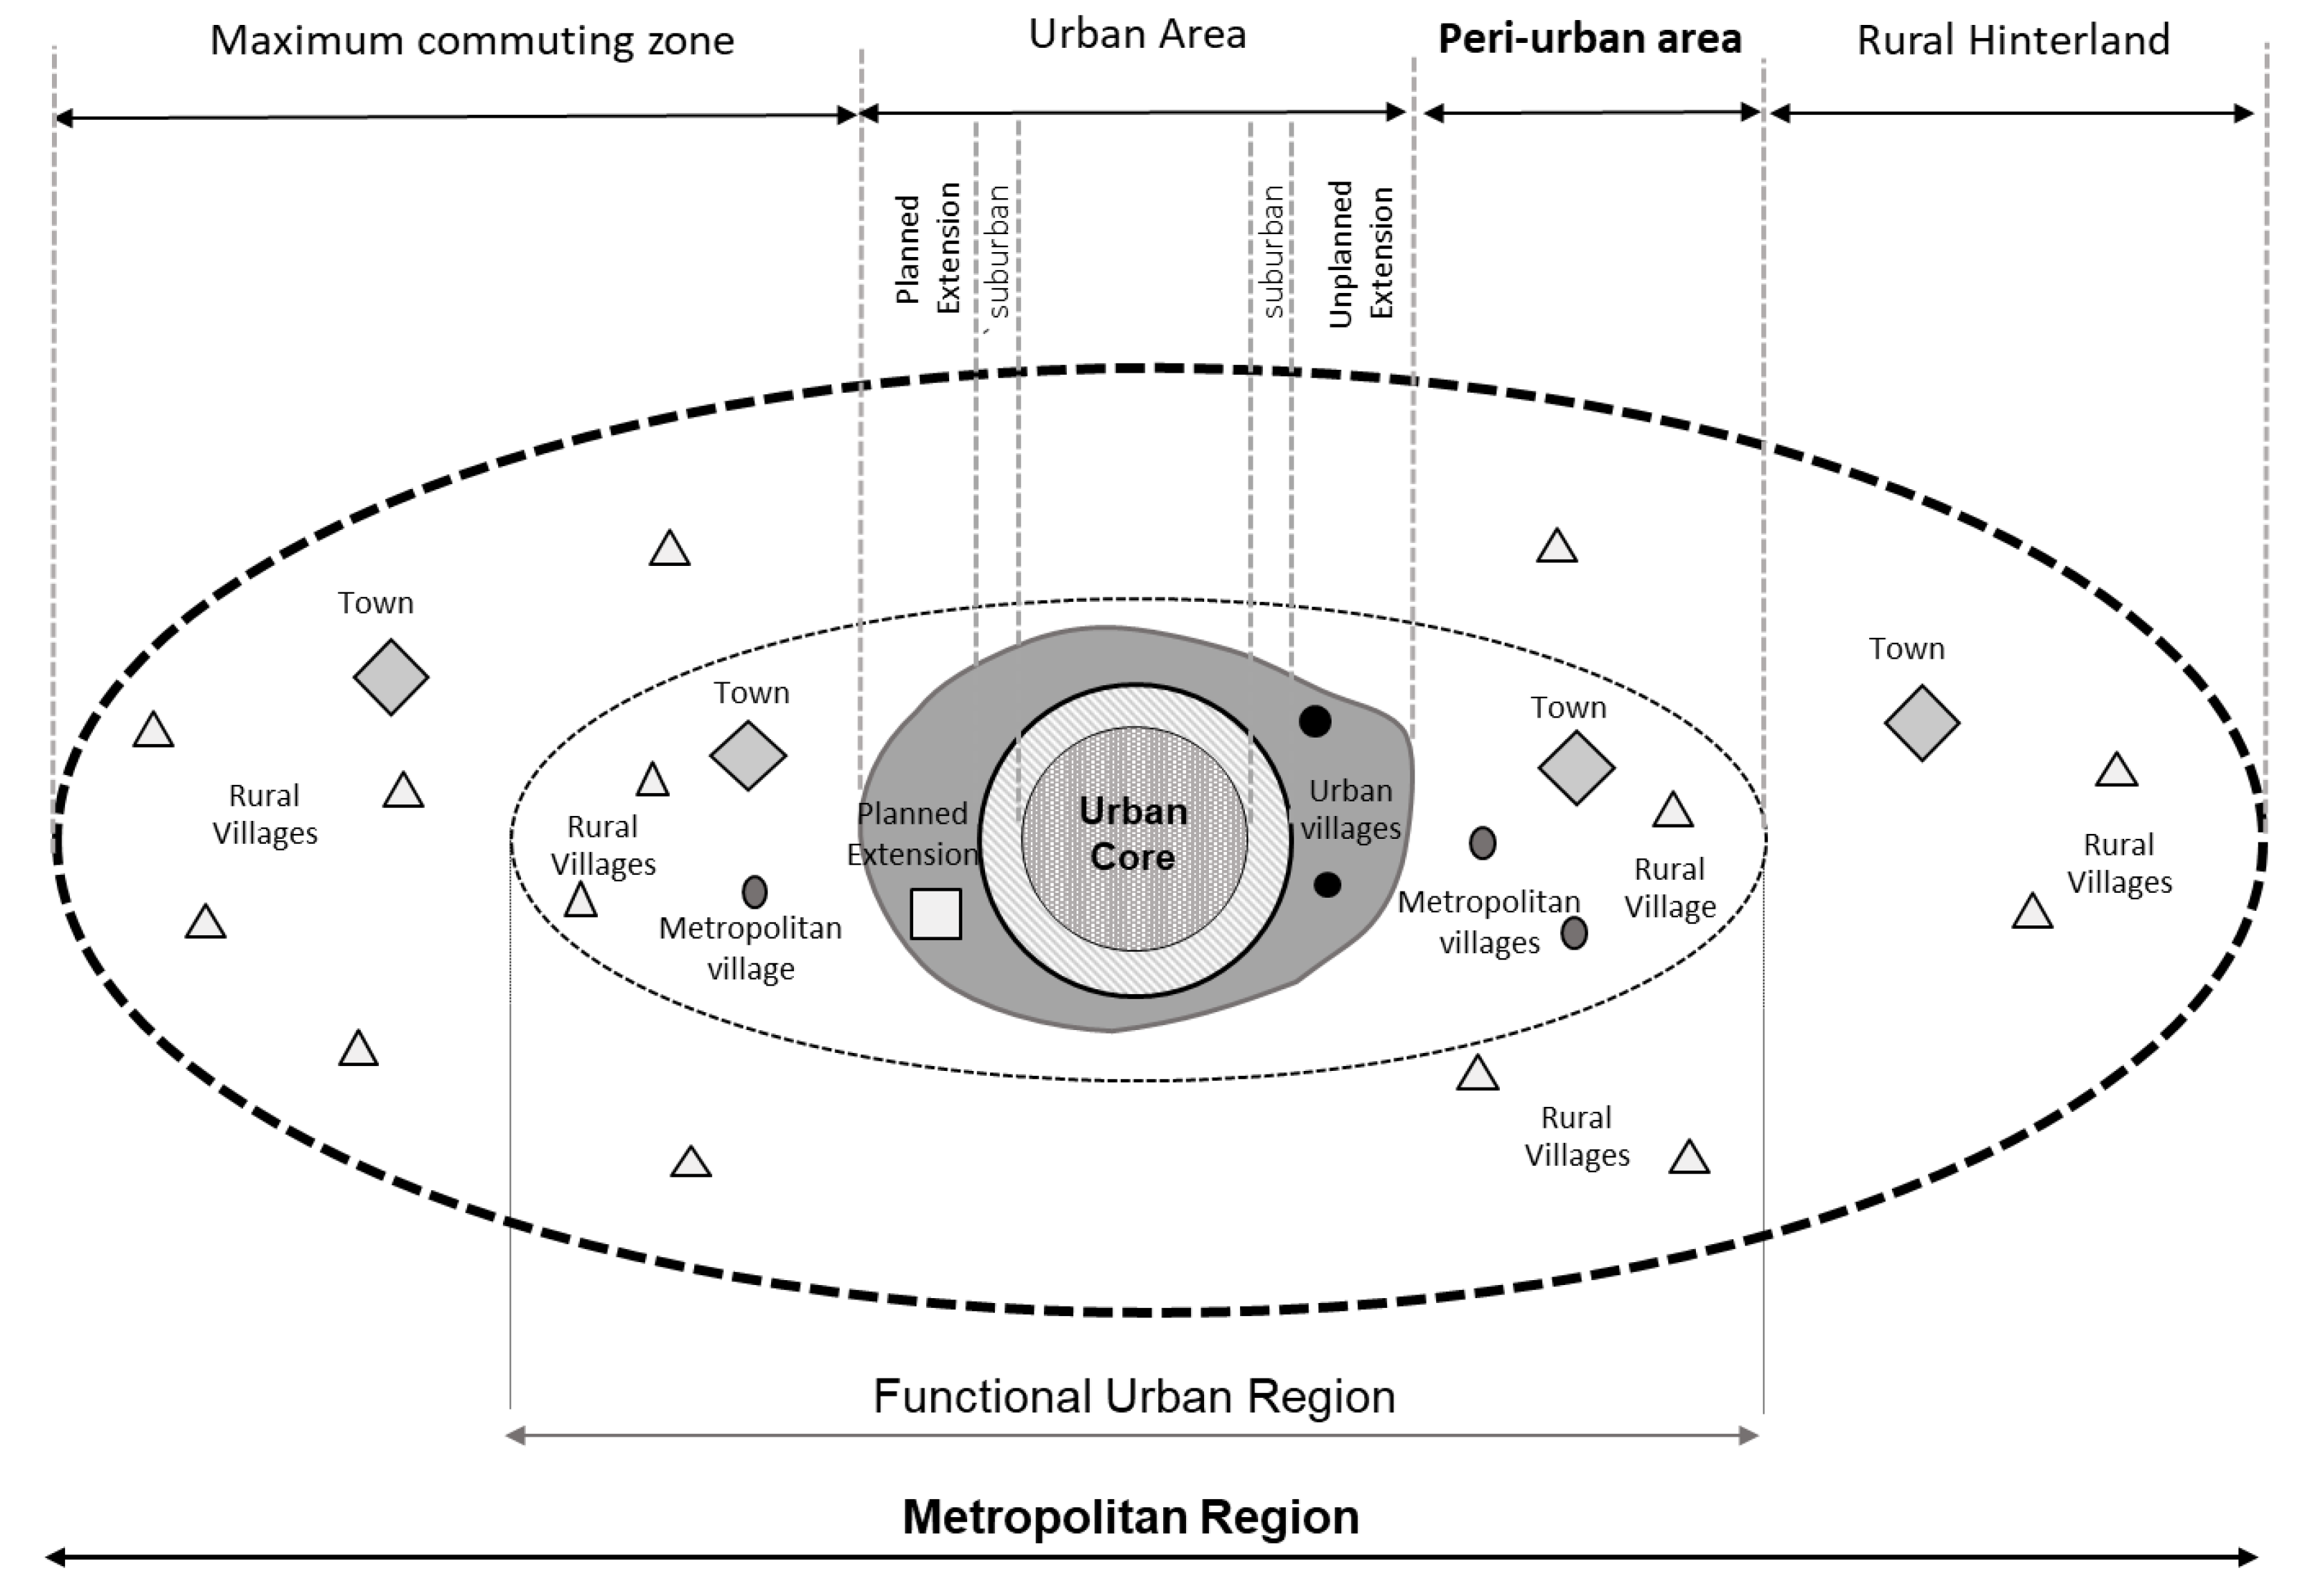
A peri-urban area (PUA) is a transitional zone between urban and rural areas [
33,
34,
35] where urban and rural characteristics are mixed [
36,
37,
38,
39,
40]. In some countries, other terms, like rural-urban fringe, rurban, and exurban, have been used when referring to PUA contexts [
33,
41]. A PUA is found at the edge of a functional urban region, and its boundary changes rapidly as the urban area expands and restructures.
Figure 1 shows the peri-urban area location within a metropolitan region.
PUAs constitute the homes of various groups of people, including lower-income classes who are vulnerable to the negative impacts of both urban and rural systems. These include lack of access to basic services, facilities, and infrastructure, and bad conditions of the built environment [
23]. Environmental changes also affect these areas and their citizens by rapid loss of agricultural land. Nevertheless, PUAs suffer from a lack of plans and studies, which has led to informal and haphazard development, which in turn ultimately threatens the sustainability of the resources in these territories [
38,
41].
This paper seeks to fill the gap in previous studies by developing a framework for monitoring and evaluating the progress of SD at PUA level, and then applying it to the PUAs of the Greater Cairo region in Egypt. PUAs of the Greater Cairo region (GCR) cover one third of the total territory area and a quarter of its population [
42,
43,
44]. Despite the spatial and functional importance of PUAs in the Greater Cairo region, no study has addressed the state of PUAs in terms of SD [
23,
45,
46,
47]. Therefore, the added value of this study mainly lies in the development of a framework to monitor and measure the progress of the SD in the PUAs of GCR. In addition to evaluation of PUA municipalities against the proposed framework, the study combines quantitative data analysis with GIS approaches and techniques to produce various maps of municipalities’ classifications, based on the outcomes of this monitoring and measuring of the SD levels.
This study is structured around three main sections after this introduction.
Section 2, Material and Methods, discusses the theoretical background of the indicators framework and explains how this framework may lead to better monitoring and evaluation of SD and its trends.
Section 3, Results and Discussion, applies this framework with reference to PUAs of GCR, discusses the outcomes of this application, and ultimately discusses the shortcomings of these results in comparison with previous findings and a few suggestions for further research. Finally,
Section 4 highlights the main implications of the study.
2. Materials and Methods
2.1. Study Area
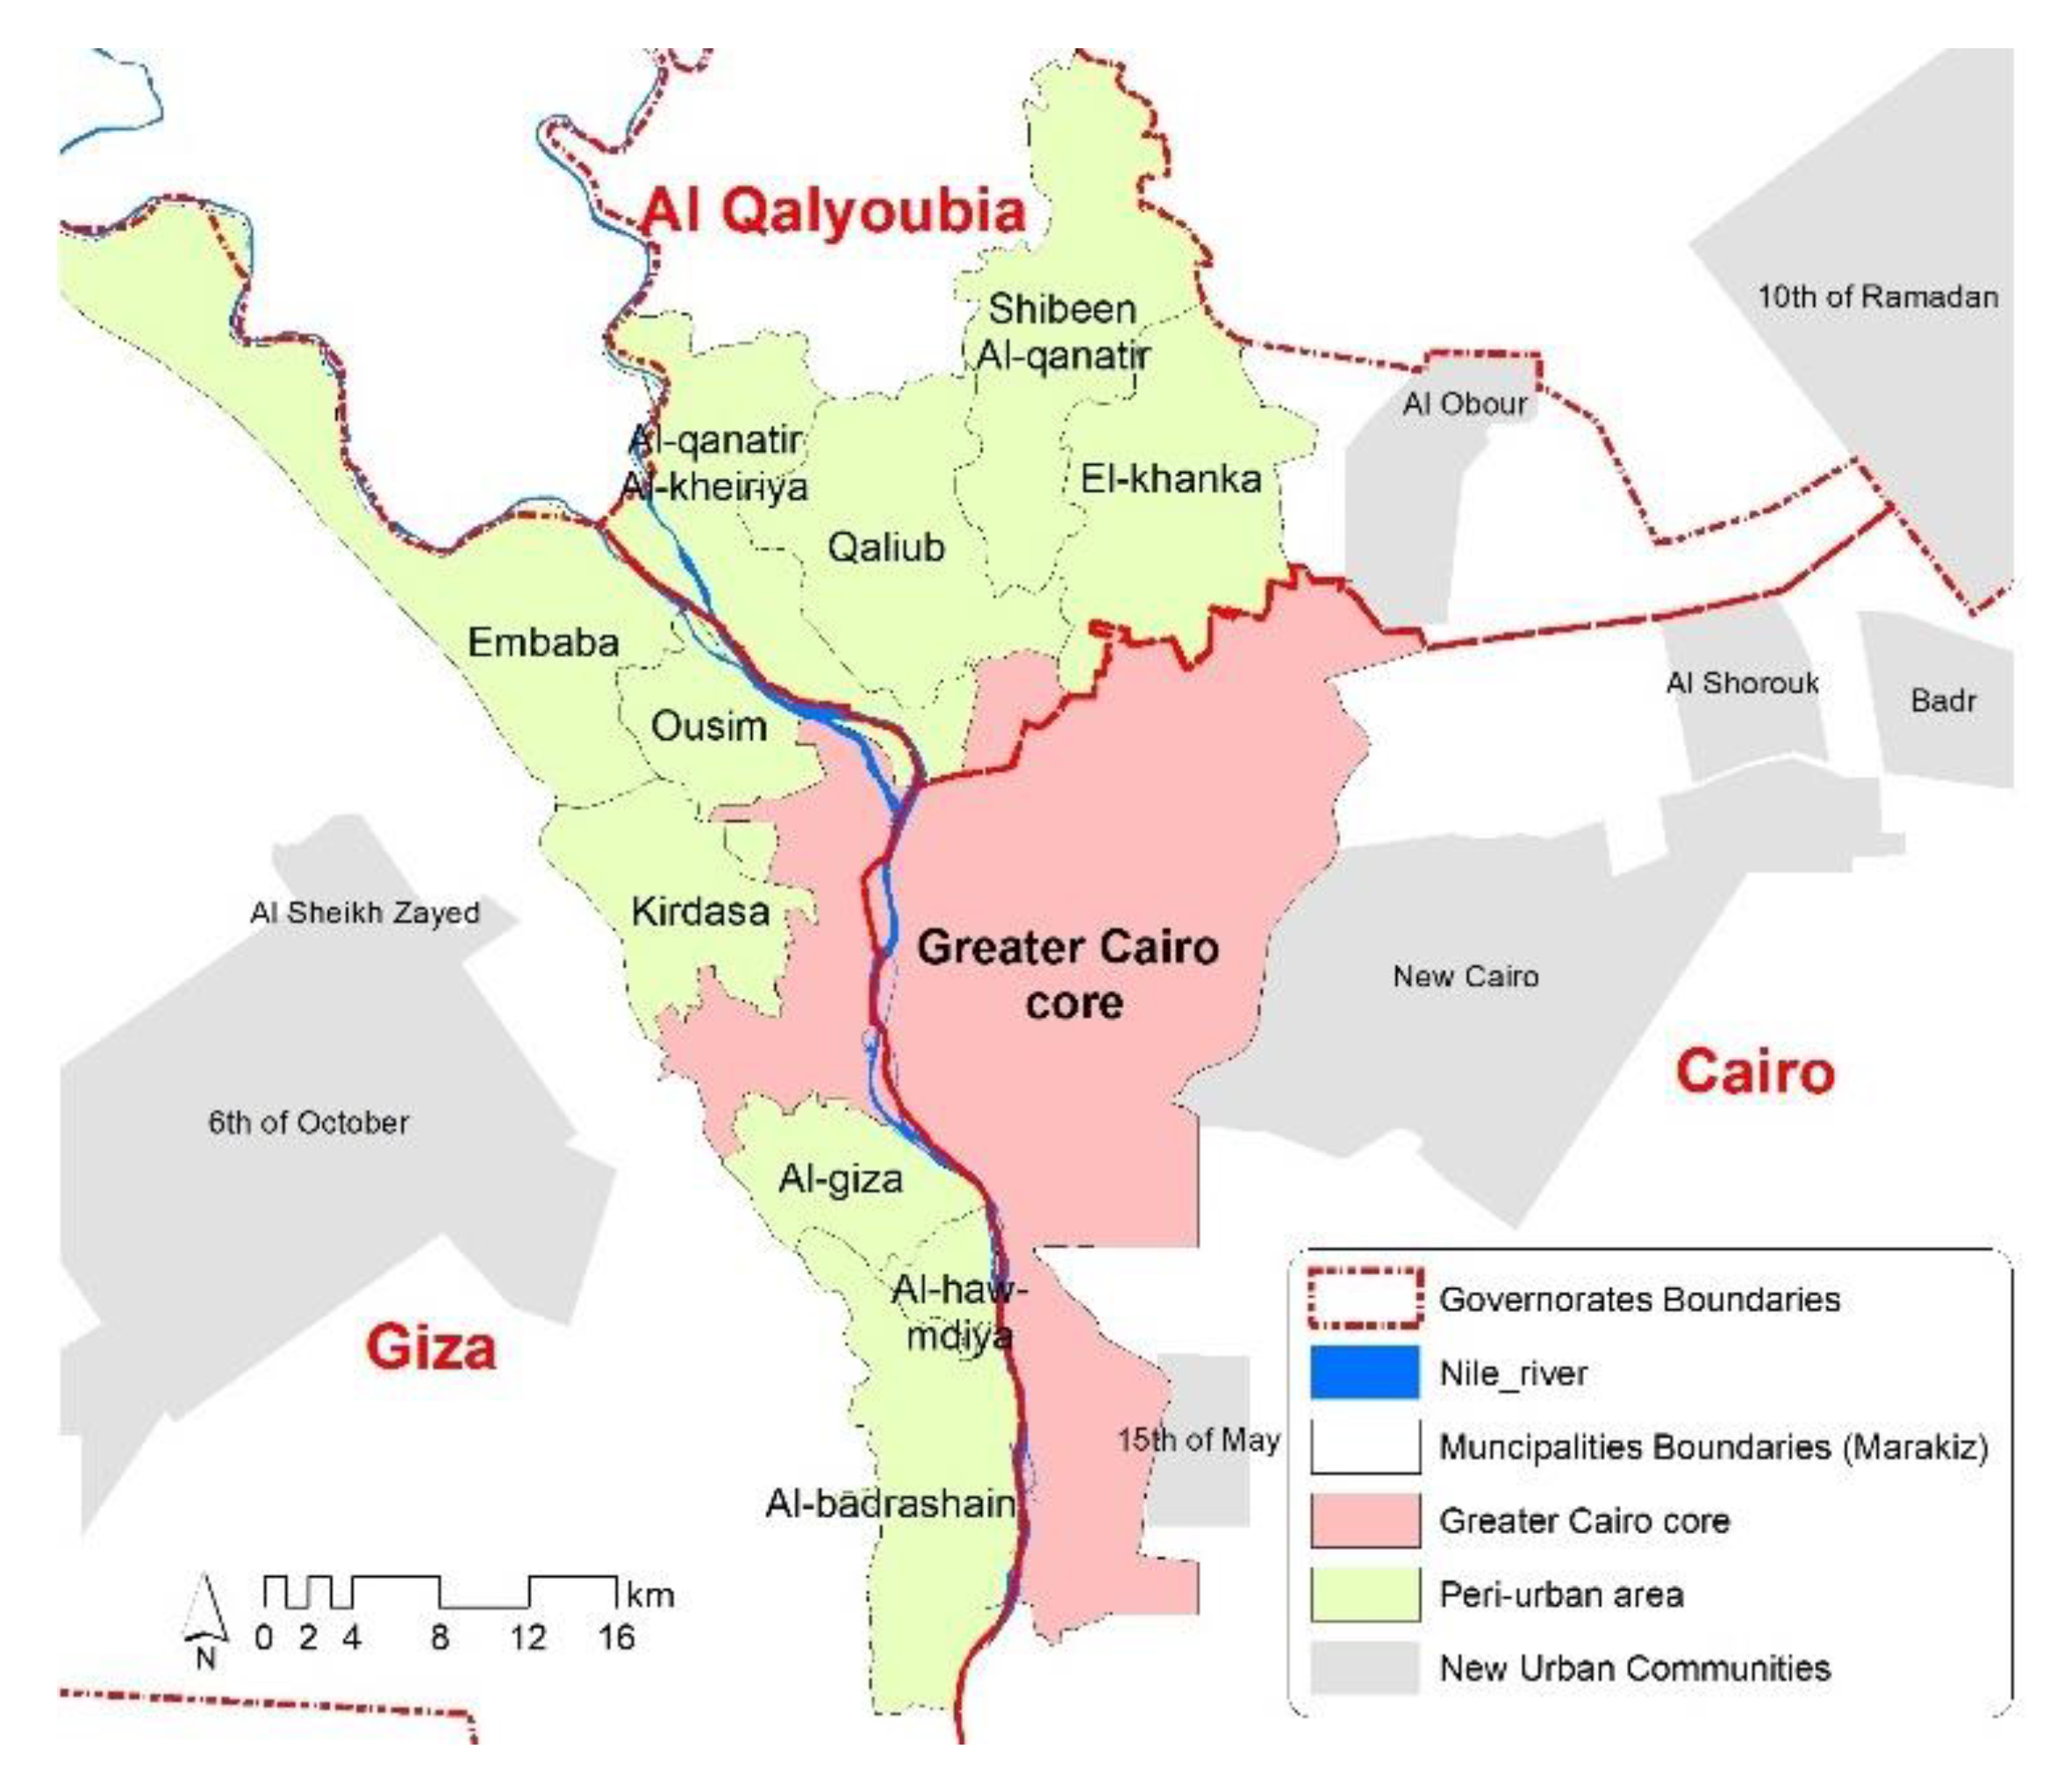
The PUA of the GCR is located around the Greater Cairo core (main agglomeration) and extended in two governorates: Giza and Qalyoubia. The boundary of the PUA around the GCR has been defined by the World Bank in 2008 and Sims in 2011 [
45,
46] where it includes 10 municipalities (Marakiz). These municipalities are: El-Khanka, Shibeen Al-qanatir, Qaliub, Al-qanatir Al-khieriya, Embaba, Ousim, Kirdasa, Al-giza, Al-hawamdiya, and Al-badrashain, as shown in
Figure 2.
The PUA represents 35% of the total area of the GCR and more than 24% of the total population, approx. 4 million inhabitants [
47,
48,
49], as shown in
Table 1.
The distances between these ten municipalities and the core of GCR range between 5 and 25 km. Agriculture and related services are the main activity in most of these municipalities, all of which are made up of dense smallholder farms which depend on fruits and vegetables, mostly targeted at Greater Cairo markets. Industry is the main activity in the municipalities of El-Khanka and Shibeen Al-qanatir, while trade is the main activity of Al-hawamdiya.
Table 2 shows the main characteristics of each municipality.
2.2. Data
This study extracted a set of indicators that have been used by international organizations, to utilize them in measuring and assessing the performance of sustainable development in the PUAs of GCR. Most indicators were derived from secondhand data, like the official censuses and international reports. A database was created based on the secondhand data and integrated in ArcGIS software to present the indicators data on a Greater Cairo map. The study used a time series over a period of 1996–2006 to explain the trend of changes. The values of the main agglomeration have been used as a benchmark for PUAs’ municipalities to investigate the development challenges in the study area.
2.3. Sustainable Development Indicators
Sustainable development indicators (SDIs) are statistics that are used to measure the progress in all the dimensions of SD; social, economic, and environmental [
25,
31]. These indicators are an increasingly important tool with which to measure the progress toward achieving the SDGs [
50,
51,
52]. SDIs aim to evaluate and benchmark SD conditions and trends across time and space, and monitor progress toward SDGs and their targets [
22]. The need for applicable indicators to guide the SD process was recognized early, since the Earth Summit in 1992 [
14]. Many international organizations, research institutes, and researchers have proposed various sets of indicators to assess the progress toward SD according to the level of study [
6,
14,
25,
26,
27,
28,
29,
30]. Nevertheless, Nagy et al. discussed the lacking of consensus regarding the optimal number of indicators needed to measure the performance of SD [
4].
Plenty of attempts have been made to standardize SDI at various levels. The UN [
53] has proposed a framework that includes 232 indicators to measure the progress toward SD, globally. The European Commission has prepared a framework of 14 indicators to assess the progress in attaining SD in European cities [
16]. Kondyli [
54] has developed a methodology to measure and evaluate SD at the regional level using 19 indicators. Tanguay et al. [
14] have developed an approach for selection SDI on city level based on 188 indicators, while Panda et al. have developed a framework to evaluate the progress of SD in the Indian cities using 37 indicators [
24]. Diaz-Chavez [
23] has proposed a list of 30 indicators for measuring SD at the local level in Mexico City [
23].
Table 3 shows a summary of previous studies.
Nevertheless, Diaz-Chavez, Zulaica, and Nallathiga emphasized that most of the SDIs at the local level are not working with PUAs, due to the unique characteristics of PUAs as a mixture zone of urban and rural features [
20,
23,
60]. In addition, Klopp, Nagy, and Arha discussed many challenges to applying these indicators in the PUAs [
4,
7,
31,
32]. Huang and Tanguay et al. also confirmed the difficulty of quantifying a group of indicators at the PUA level, due to unavailability of both information and strong data collection institutions in these areas [
14,
58]. Hence, this study developed an innovate framework of SDIs for measuring the progress towards SD in the PUAs of GCR in Egypt.
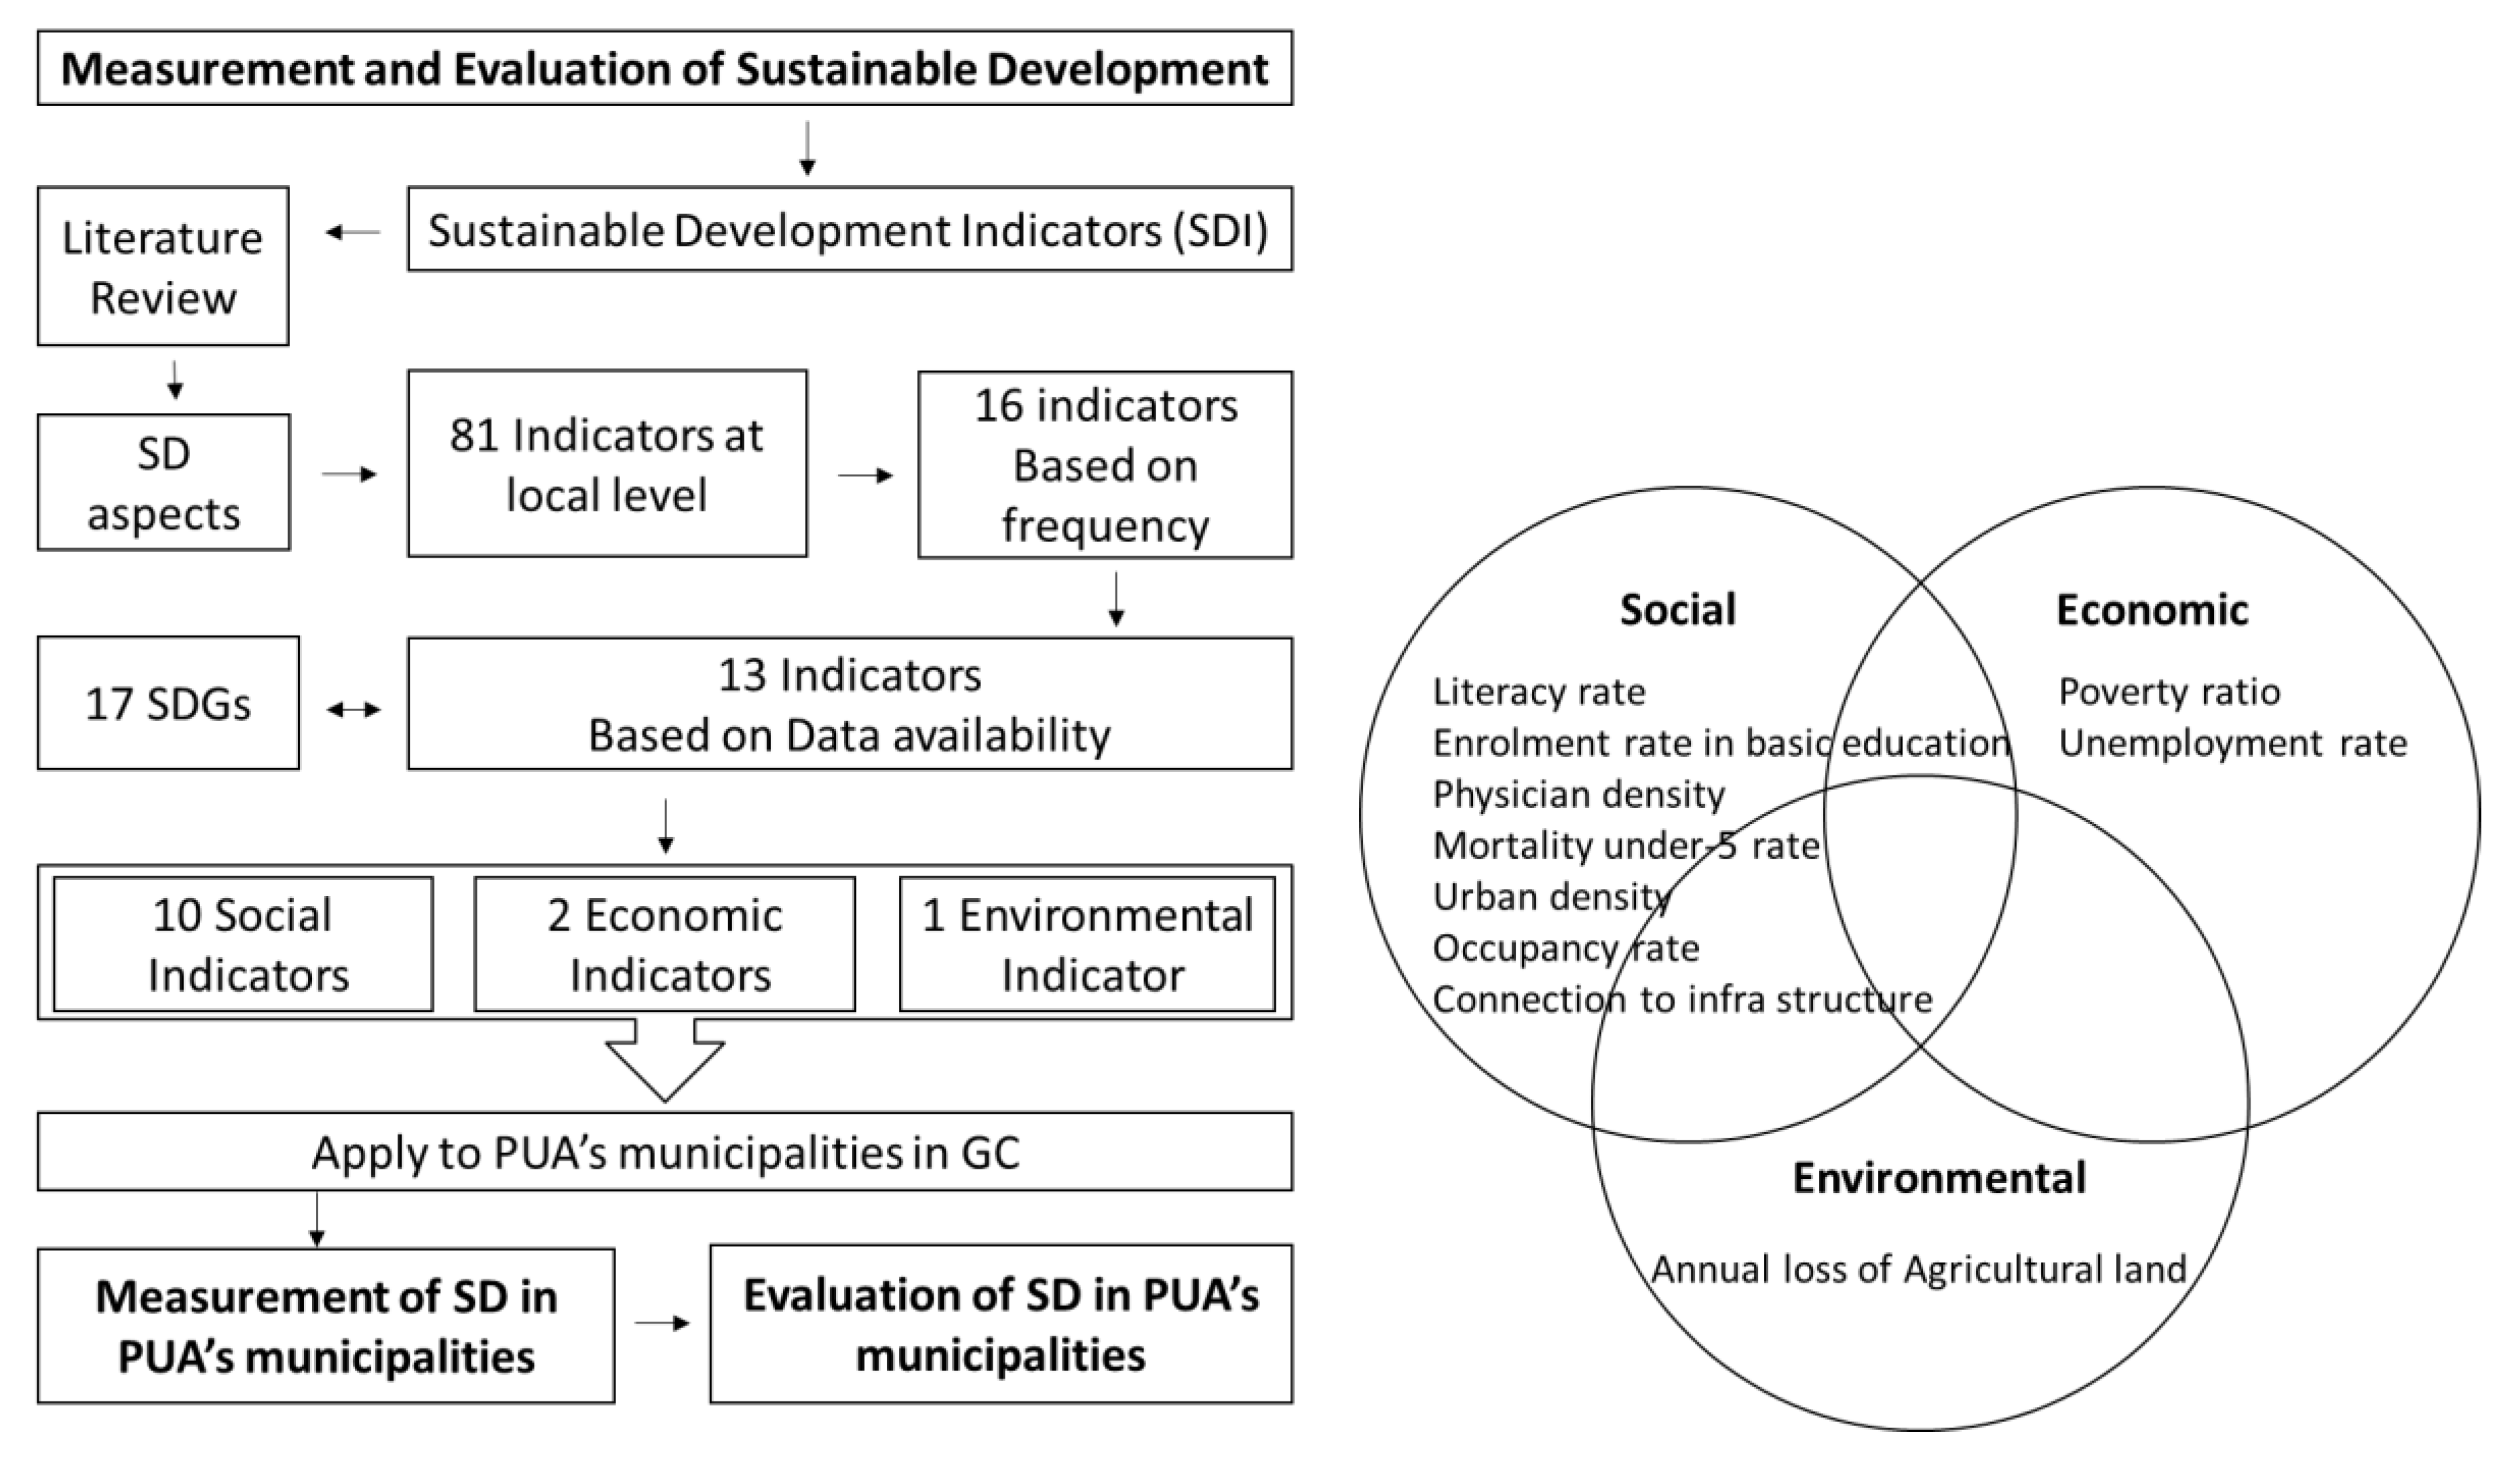
The study has defined the SDIs through four main steps. In the first step, the authors collected 81 of the indicators that have been used mainly at the local level during the previous studies and that cover the three aspects of SD. Of these indicators, 33 had been used once in a special case study. Therefore, these 33 indicators were discarded to reduce the list of indicators to 48 (second step). In addition, more than 30% (16 out of 48 indicators) of indicators had been frequently used during more than 50% of the chosen studies. However, if we had selected the indicators of frequency higher than 70% (i.e., used in more than 11 studies), we would have ended up with 7 indicators and they would not have included any of the environmental dimension. For this reason, we selected those indicators that had a frequency of more than 50% of the chosen studies which accounts for 16 indicators (third step). However, some of these indicators were not applicable to the study area, like Gini’s coefficient. Hence, the fourth step was to filter the 16 indicators (the outcomes of the prior steps) against the three following criteria:
Measurability: the indicator should be measurable at the PUA level.
Availability: the indicator should be available for PUAs’ municipalities.
Dynamics: the indicator should be available for two different years at least to detect the changes during a period.
In addition, the selected indicators had to cover the three dimensions of SD and be relevant to 17 SDGs. Consequently, the study found 13 indicators could be utilized to measure the progress towards the SD in the study area.
Figure 3 shows the methodology of study; a schematic diagram of our selection approach, which proceeded in four steps, and the distribution of the selected indicators to sustainable development aspects.
Table 4 shows the chosen indicators for this study.
We acknowledge the fact that data available on the municipality level were an issue, especially related to the SDGs 9, 10, 12, 13, 14, 16, and 17, where indicators related to these goals are only available on the higher levels or do not exist at the study area. The study used a time series throughout 1996–2006 to explain the trend of change, and to thus evaluate the sustainable development in the study area.
3. Results and Discussion
3.1. Measuring Sustainability in the PUA
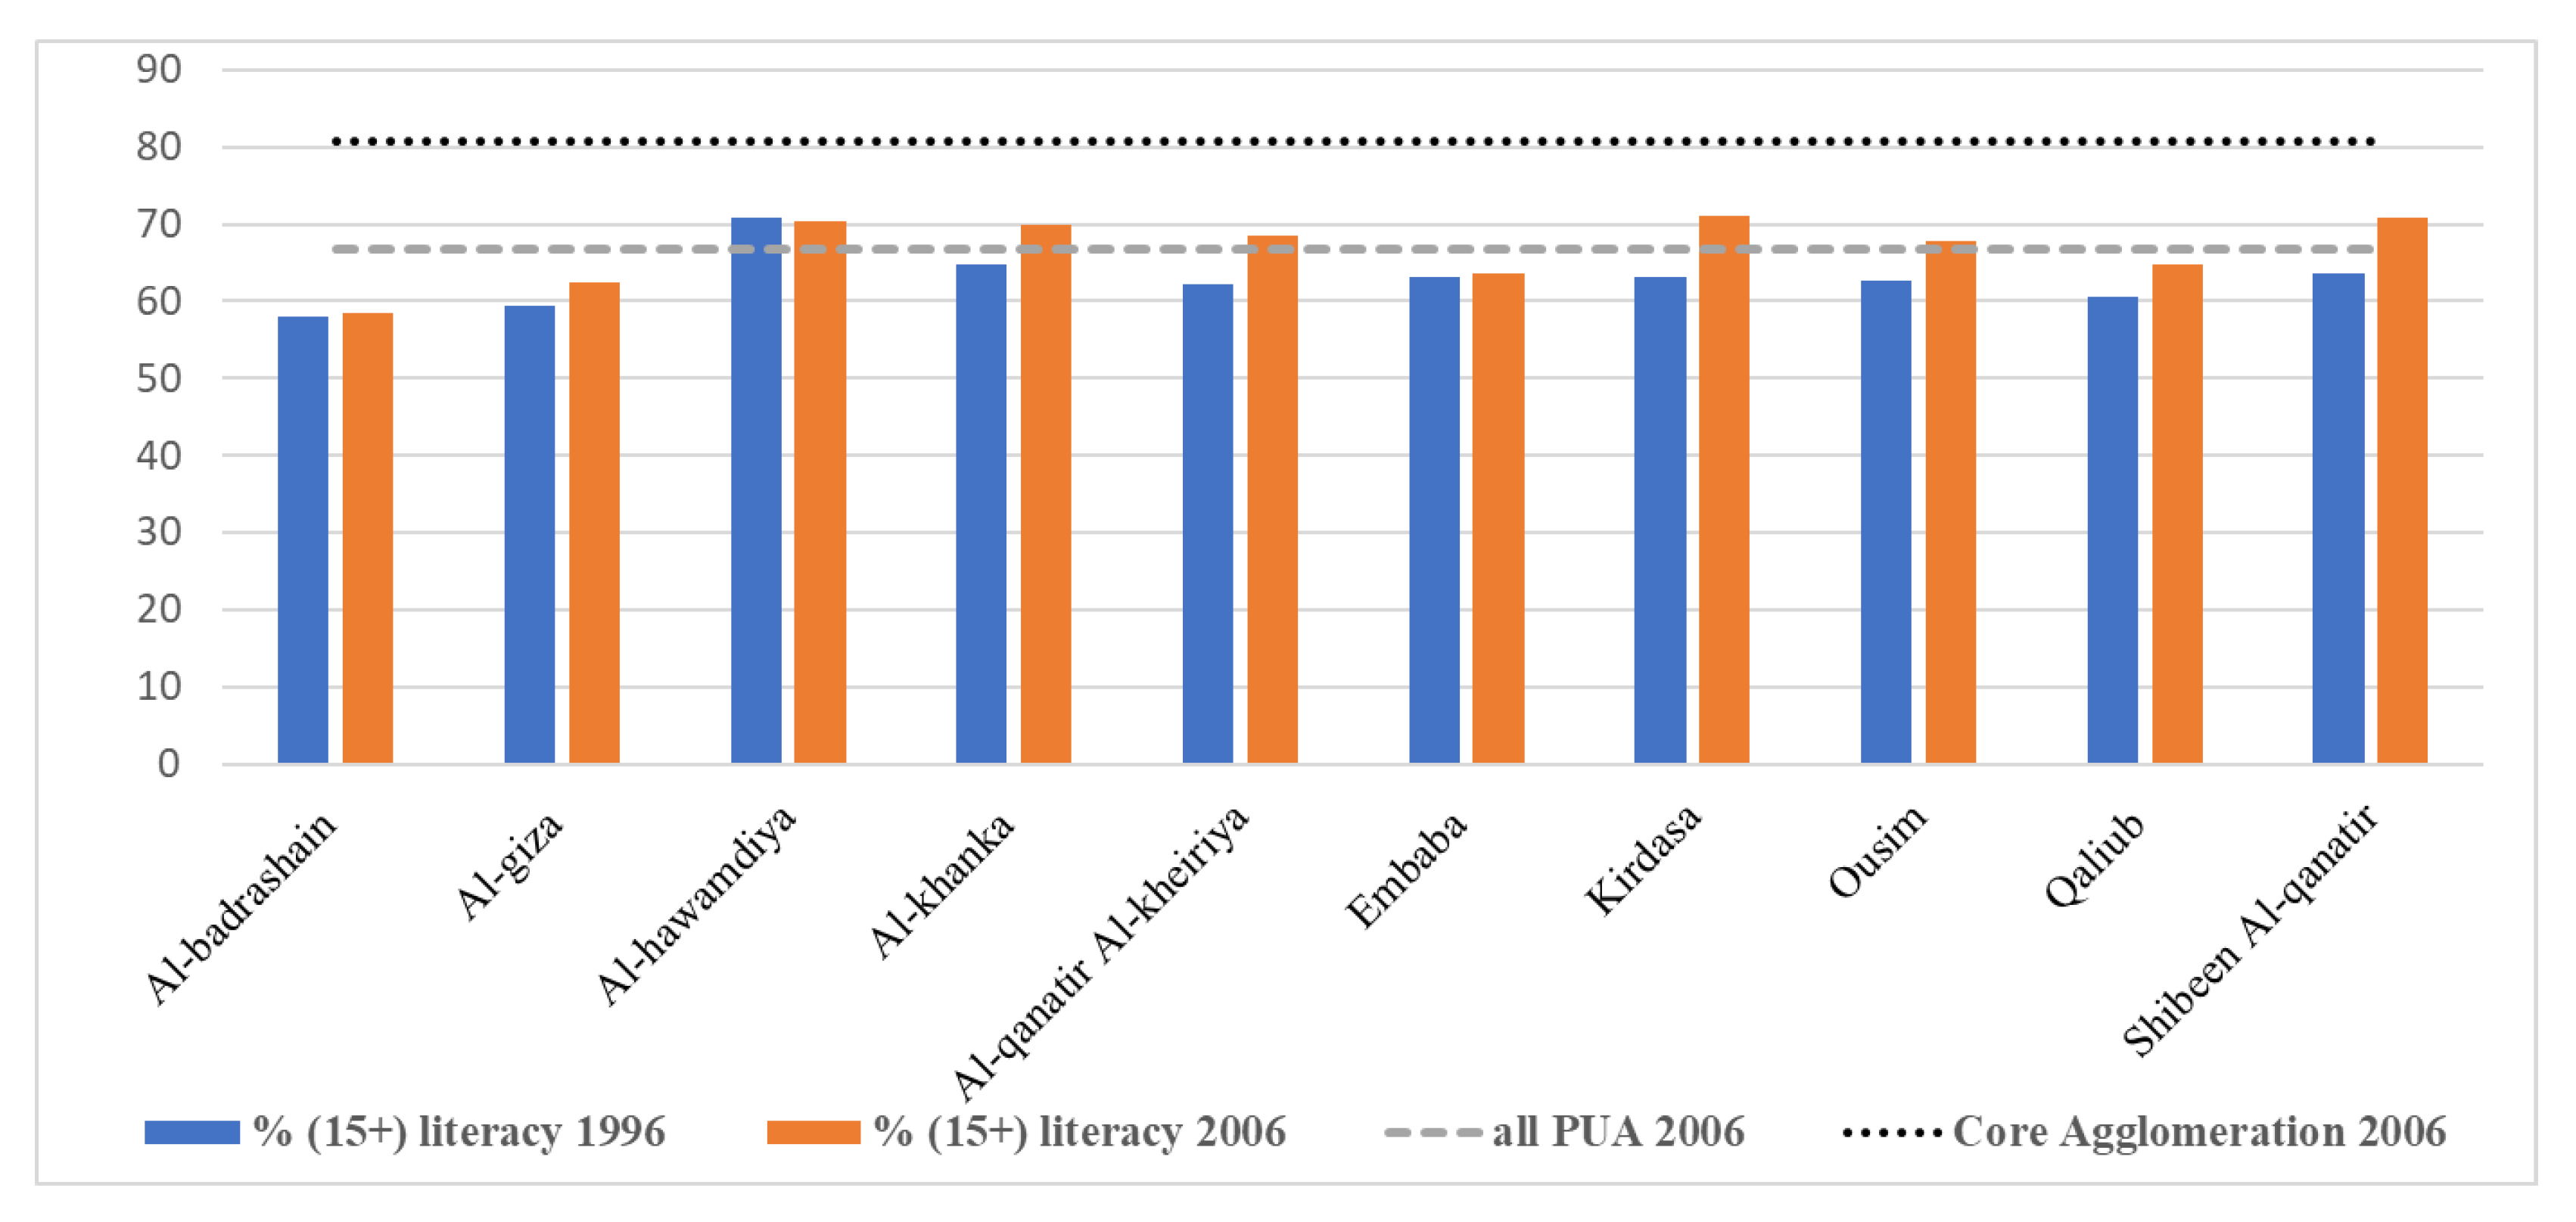
3.1.1. Literacy Rate
The study results show that the total (15 +) literacy rate in all PUAs stood at 62.8% in 1996 and increased to 66.8% in 2006. The highest rate of (15 +) literacy in 2006 was in Kerdasa municipality where it reached 71%, while the lowest rate was in Al-badrashain municipality where it reached 48.4%. On the other hand, (15 +) literacy rate in the core agglomeration reached 78.9% in 1996 and increased to 80.7% in 2006.
Table 5 and
Figure 4 show the changes in (+ 15) literacy rate in PUAs and core agglomeration from 1996 to 2006.
It is notable that most of the municipalities in which agriculture is the main activity had a high percentage of literacy. The reason for that might be the lack of interest in this issue by farmers.
3.1.2. Enrolment Rate in Basic Education
The study results show that the total enrollment rate in basic education in all PUAs stood at 76.5% in 1996 and increased to 81.2% in 2006. The highest enrollment rate in basic education in 2006 was in the Al-hawamdiya municipality, where it reached 88.9%, while the lowest rate was in Al-giza municipality where it reached 72.6%. Meanwhile, the enrollment rate in basic education in the core agglomeration reached 81.2% in 1996 and increased to 88.4% in 2006, as shown in
Table 6 and
Figure 5.
It is notable that the spreading of schools in the core agglomeration has played a clear role in increasing the enrollment rate in basic education in the city, rather than in the PUAs’ municipalities.
3.1.3. Enrollment Rate in Basic Education for Women and Girls
As for the enrollment rates in basic education for women and girls in the PUA, the rates were better than the total enrollment rates, where they reached 76.4% of the total population of women and girls in the corresponding age group in 1996 and increased to 89.6% in 2006. However, there is still a gap between PUAs and core agglomeration, where the rates in the core agglomeration reached 87.1% in 1996 and increased to 93.8% in 2006.
Table 7 and
Figure 5 show the changes in women and girls’ enrollment rates in basic education in the PUAs and in core agglomeration from 1996 to 2006.
There was a noticeable improvement in the enrollment rates for women and girls in 2006, especially in Embaba and Kirdasa municipalities, where the rates increased from 67.5% in 1996 to 93% in 2006. The main reason for this improvement might be due to the government attention to the education of women and since launching the Millennium Development Goals (MDGs). However, the level of enrollment in the city may be better than the levels in the PUAs due to increasing awareness of families in the city, as opposed to thaose in the PUAs.
3.1.4. Physician Density
The analysis outcomes show that physician density in all PUAs stood at 0.3 physicians per 1000 people in 2010. This rate is very low, especially compared to the rate in the core agglomeration where it reached 1.2 physicians per 1000 people. The highest physician density was in Al-hawamdiya municipality where it reached 0.9 physicians per 1000 people, while the lowest rate was in the Al-badrashain, Al-khanka, Embaba, and Ousim municipalities where it reached 0.2 physicians per 1000 people, as shown in
Table 6. It is noteworthy to mention that the physician density in the European countries exceeds 3 physicians per 1000 people [
61].
3.1.5. Under-5 Mortality Rate
The under-5 mortality rate underwent a remarkable decline during the period 2003–2010, especially in the Qaluib municipality, where it decreased from 50.5 deaths per 1000 live births in 2003 to 15.5 deaths per 1000 live births in 2010. In addition, the overall average of the under-5 mortality rates in all PUAs became better than the core agglomeration according to the world bank report in 2010, as shown in
Table 8.
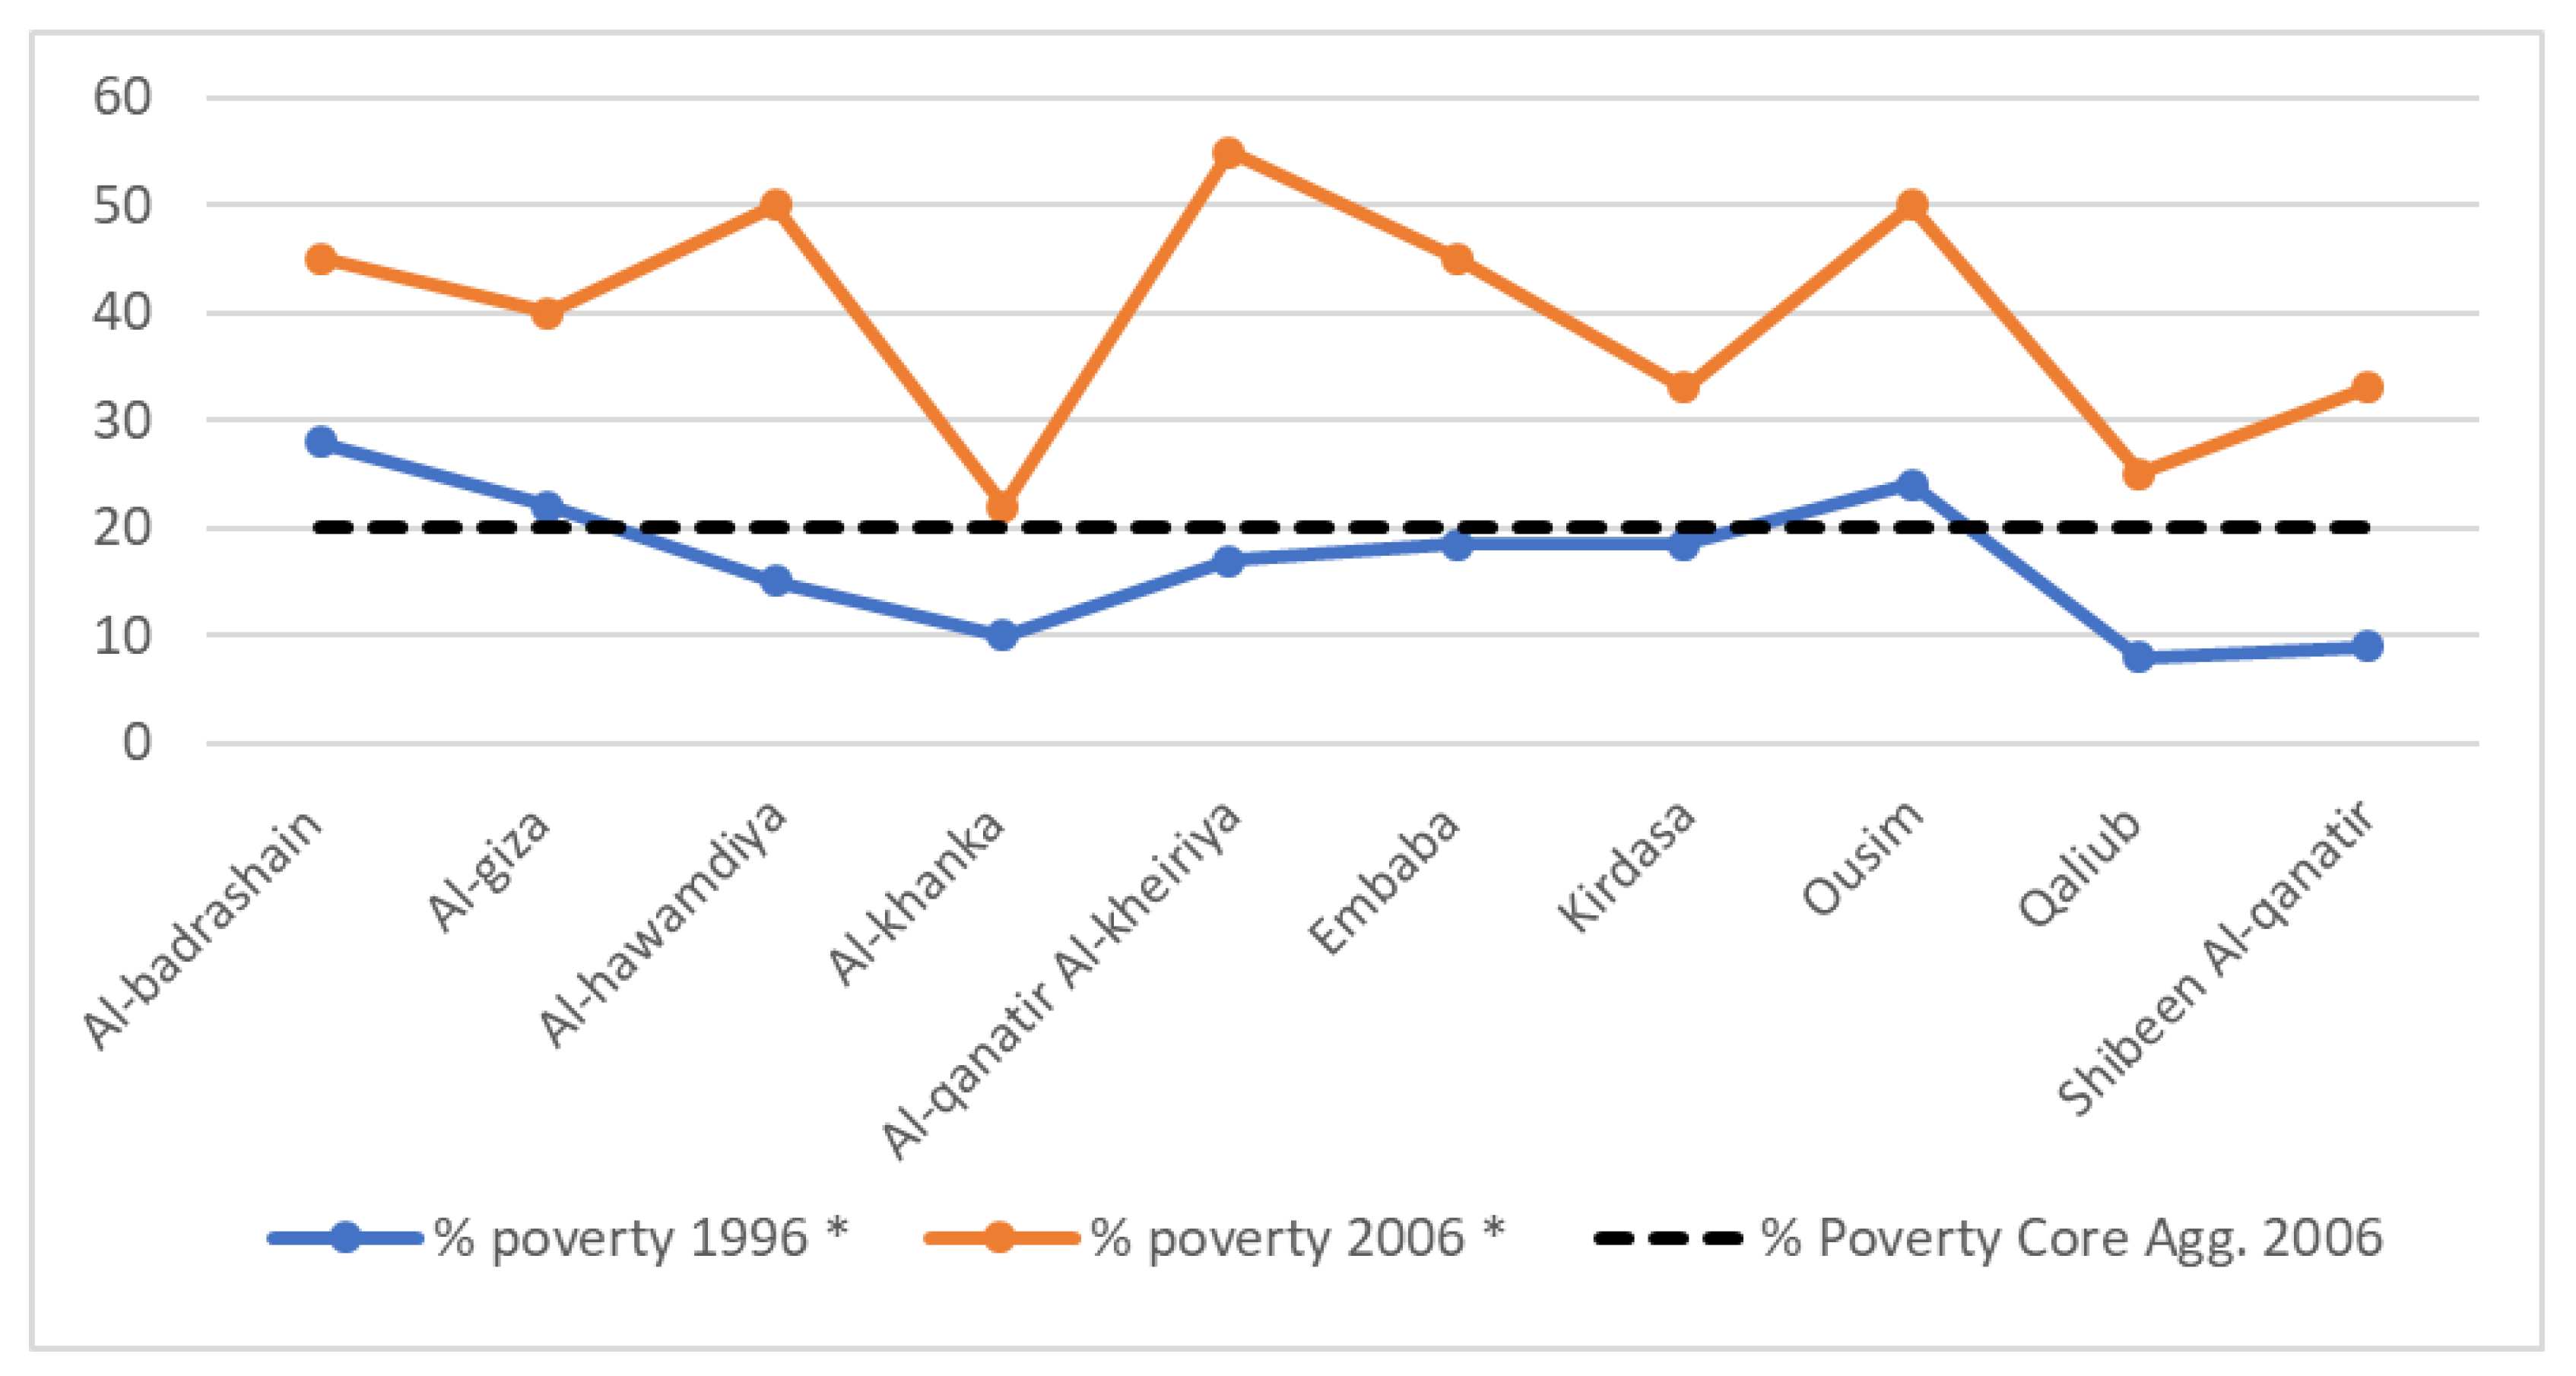
3.1.6. Poverty
As shown in
Figure 6, across the PUAs’ municipalities in general, the percentage of people living under the poverty line is very high.
Moreover, only two of the ten PUA municipalities are above the national average, and when compared to the core agglomeration, PUAs’ municipalities are significantly poorer, especially those located in the west in Giza Governorate.
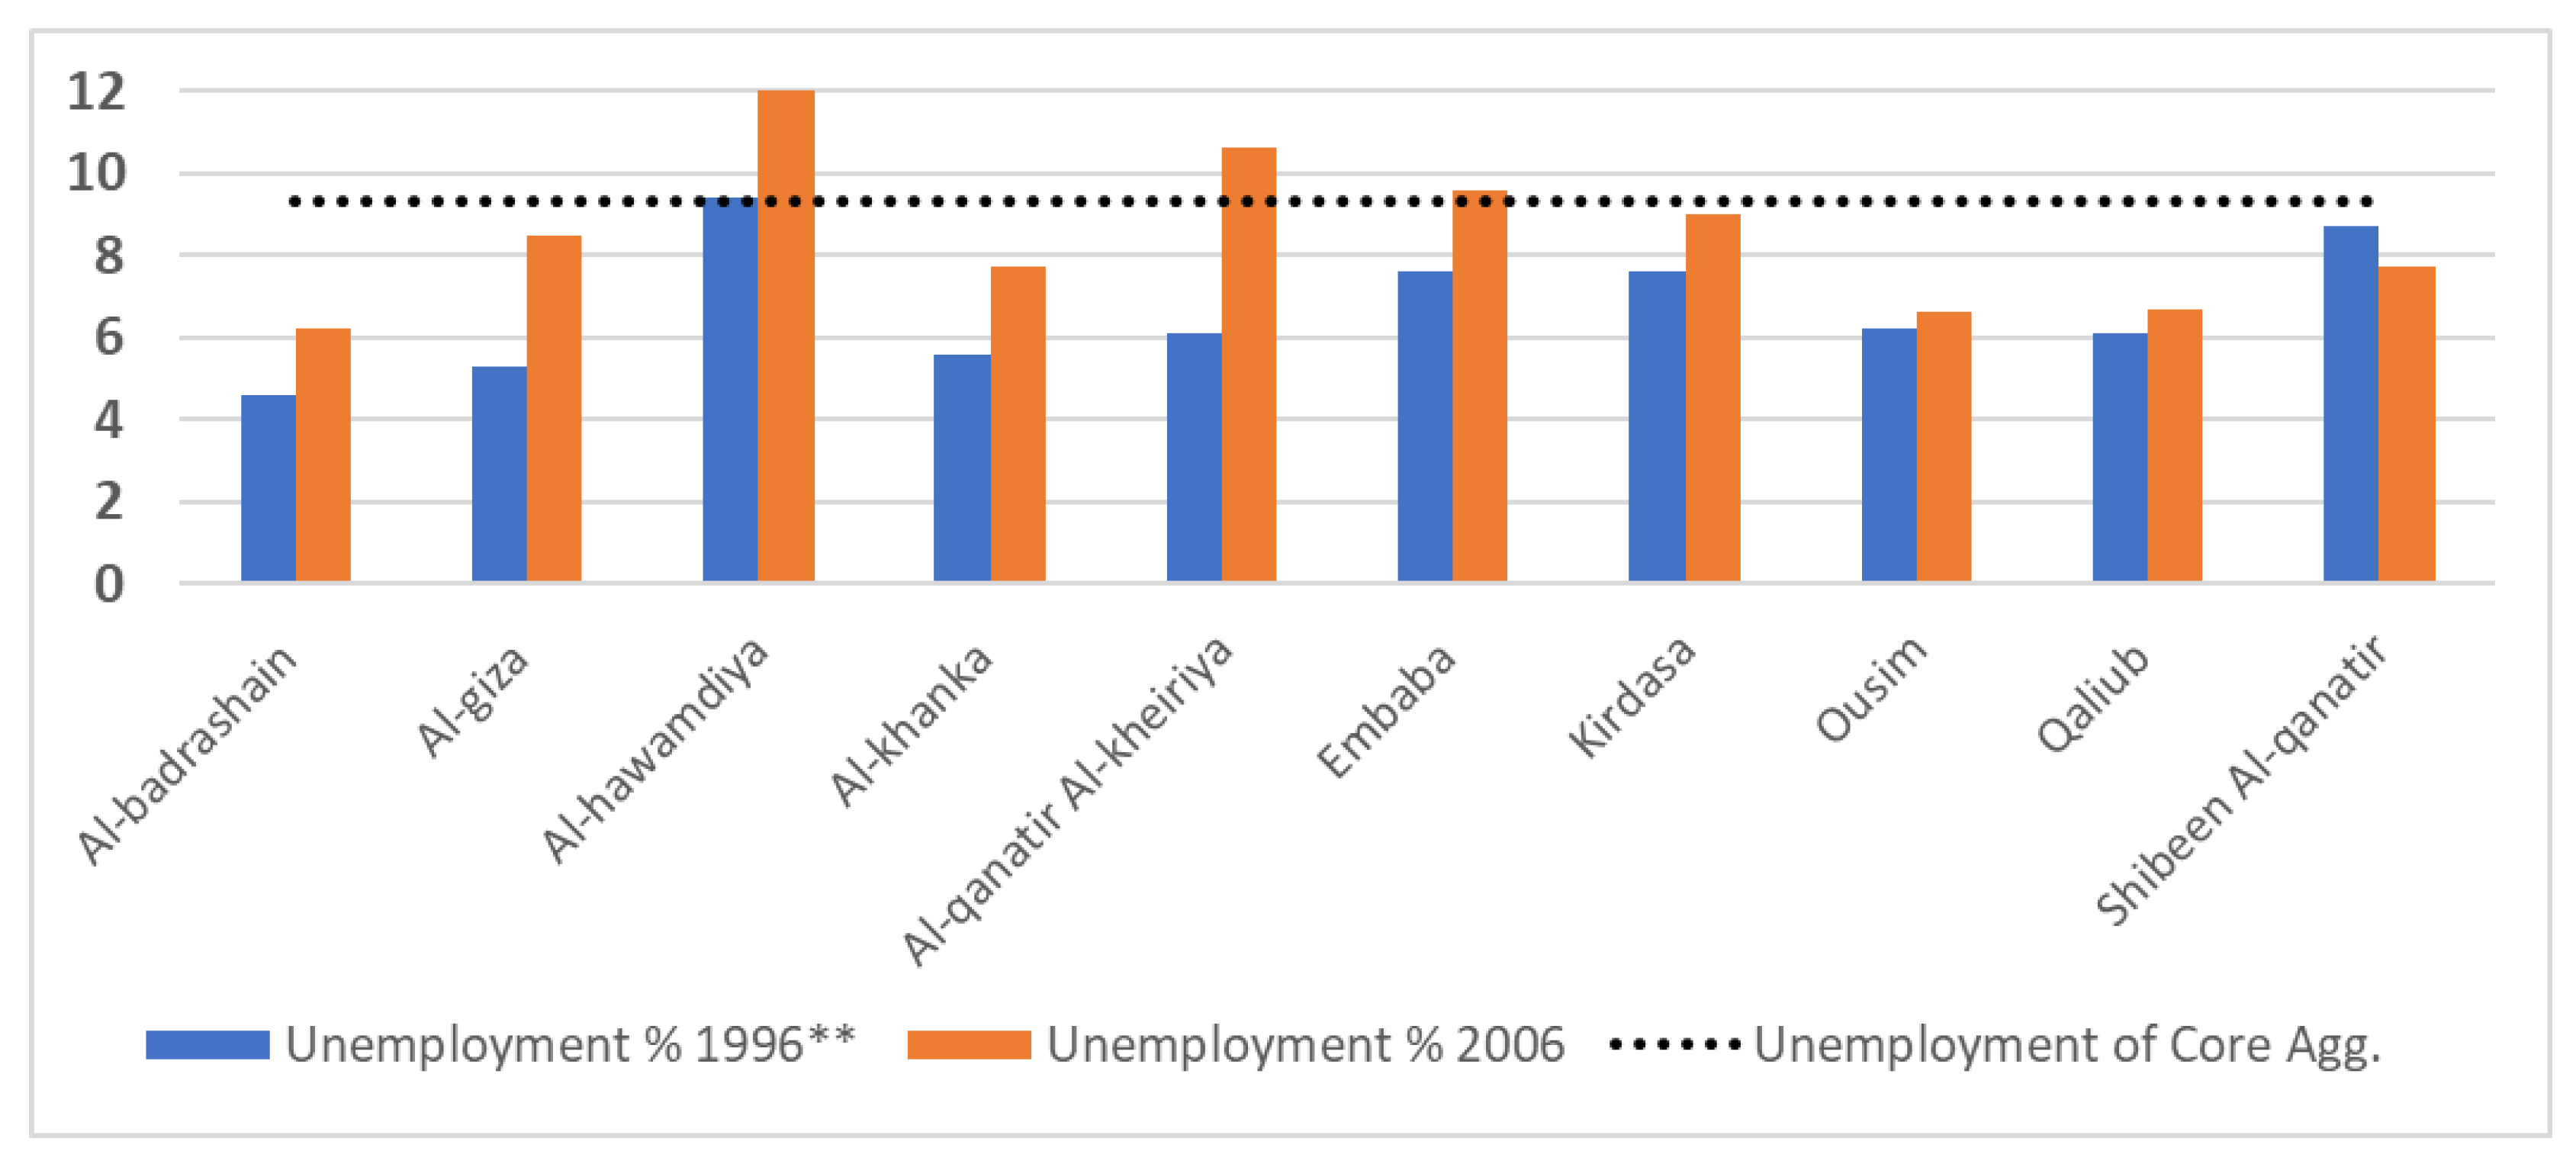
3.1.7. Unemployment Rate
The indicator of unemployment rate refers to a negative change where the percentages of unemployment had increased from 1996 to 2006 in all PUAs’ municipalities.
Figure 7 shows the change of unemployment rate from 1996-2006.
It is worth mentioning that most of the employed population in the PUAs are working in the core agglomeration, due to the concentration of job opportunities there. In this regard, Denis and Vignal estimated that 43% of public jobs and 40% of private jobs in Egypt, in 2006, were concentrated in the core agglomeration of Cairo [
62].
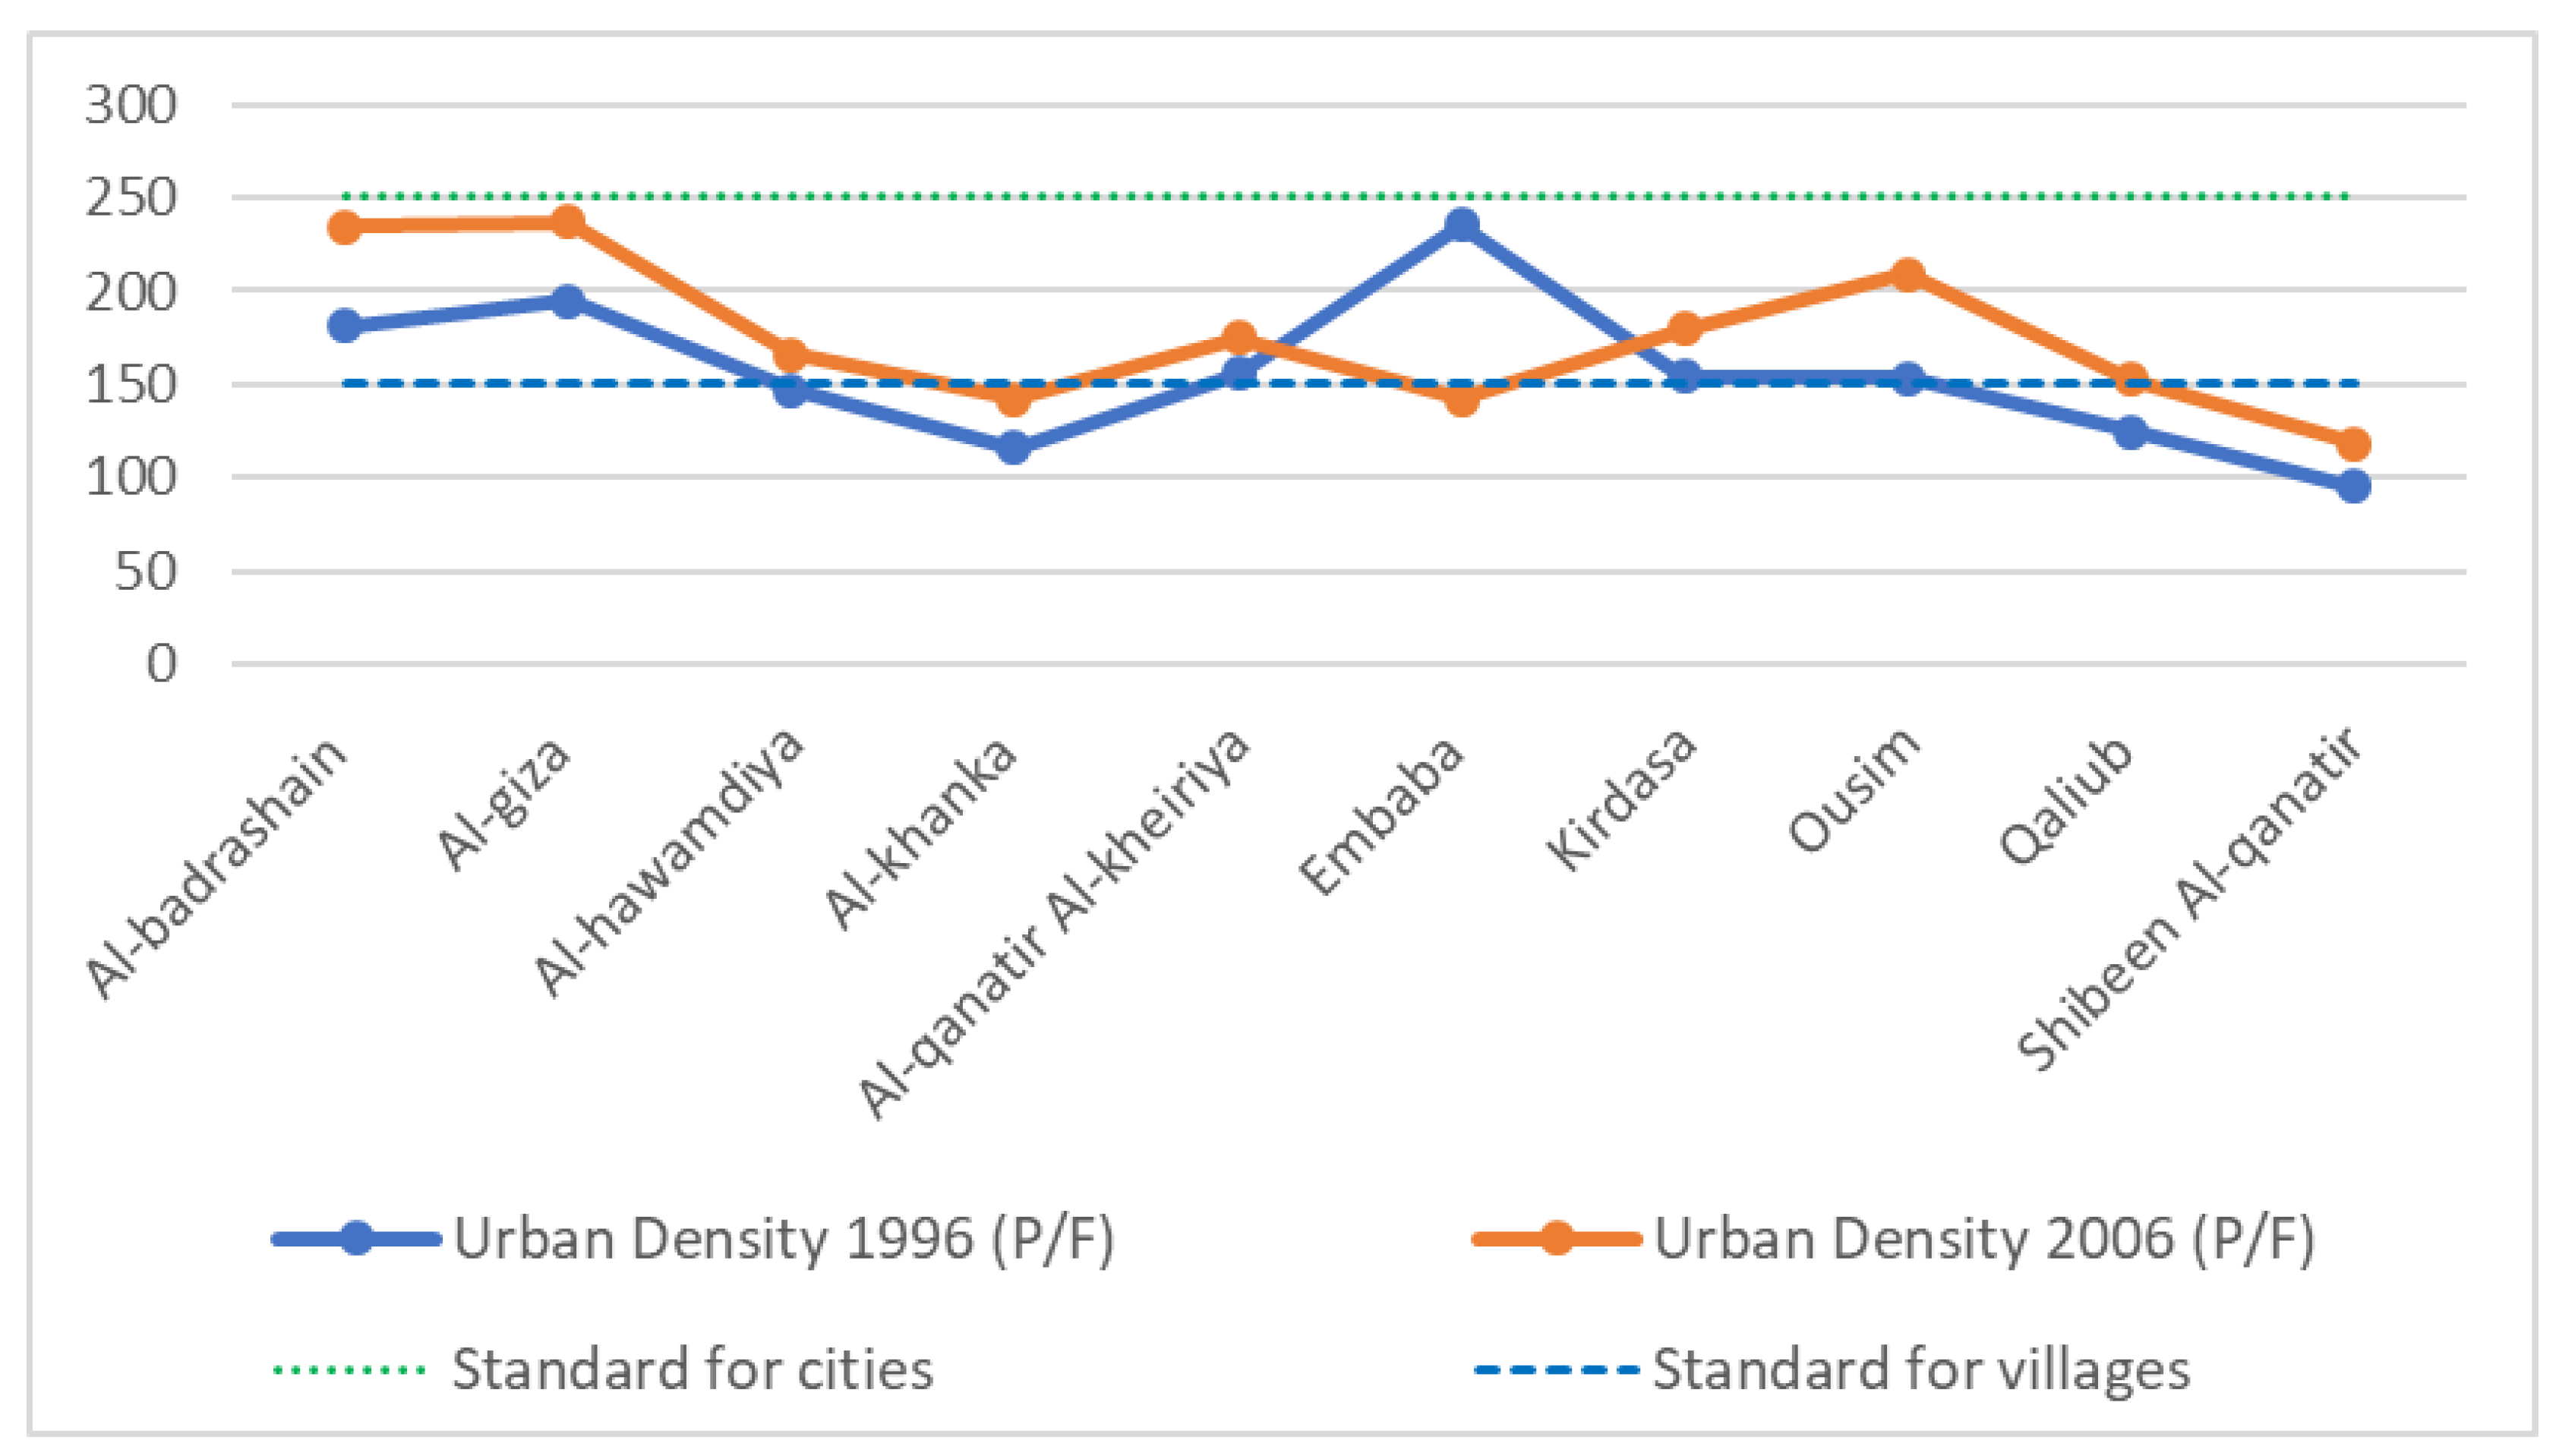
3.1.8. Urban Density
Urban density measures the number of people who are living in a specific urban area. According to planning law in Egypt (Law no.3 of 1982), the urban density should not exceed 150 people per feddan in rural villages or 250 people per feddan in urban cities. So, the urban densities in the PUAs’ municipalities are considered extremely high, except in Al-khanka and Shibeen Al-qanatir municipalities, as shown in
Figure 8.
3.1.9. Occupancy Rate
Occupancy rate is considered one of the major elements affecting human health [
63]. A high occupancy rate of persons in a small space promotes the rapid spread of infection, especially among children (WHO, 2010). Based on the quantitative analysis of the occupancy data calculated by CAPMAS in 1996 and 2006, the total occupancy rate in all PUAs decreased from 1.4 to 1.2 people per room, respectively, as shown in
Figure 9.
The reason for this decline is most probably because of the increasing numbers of vacant houses in the PUAs due to real estate speculation in these areas.
In the last census, the percentage of vacant houses 22.7% of the total number of apartments.
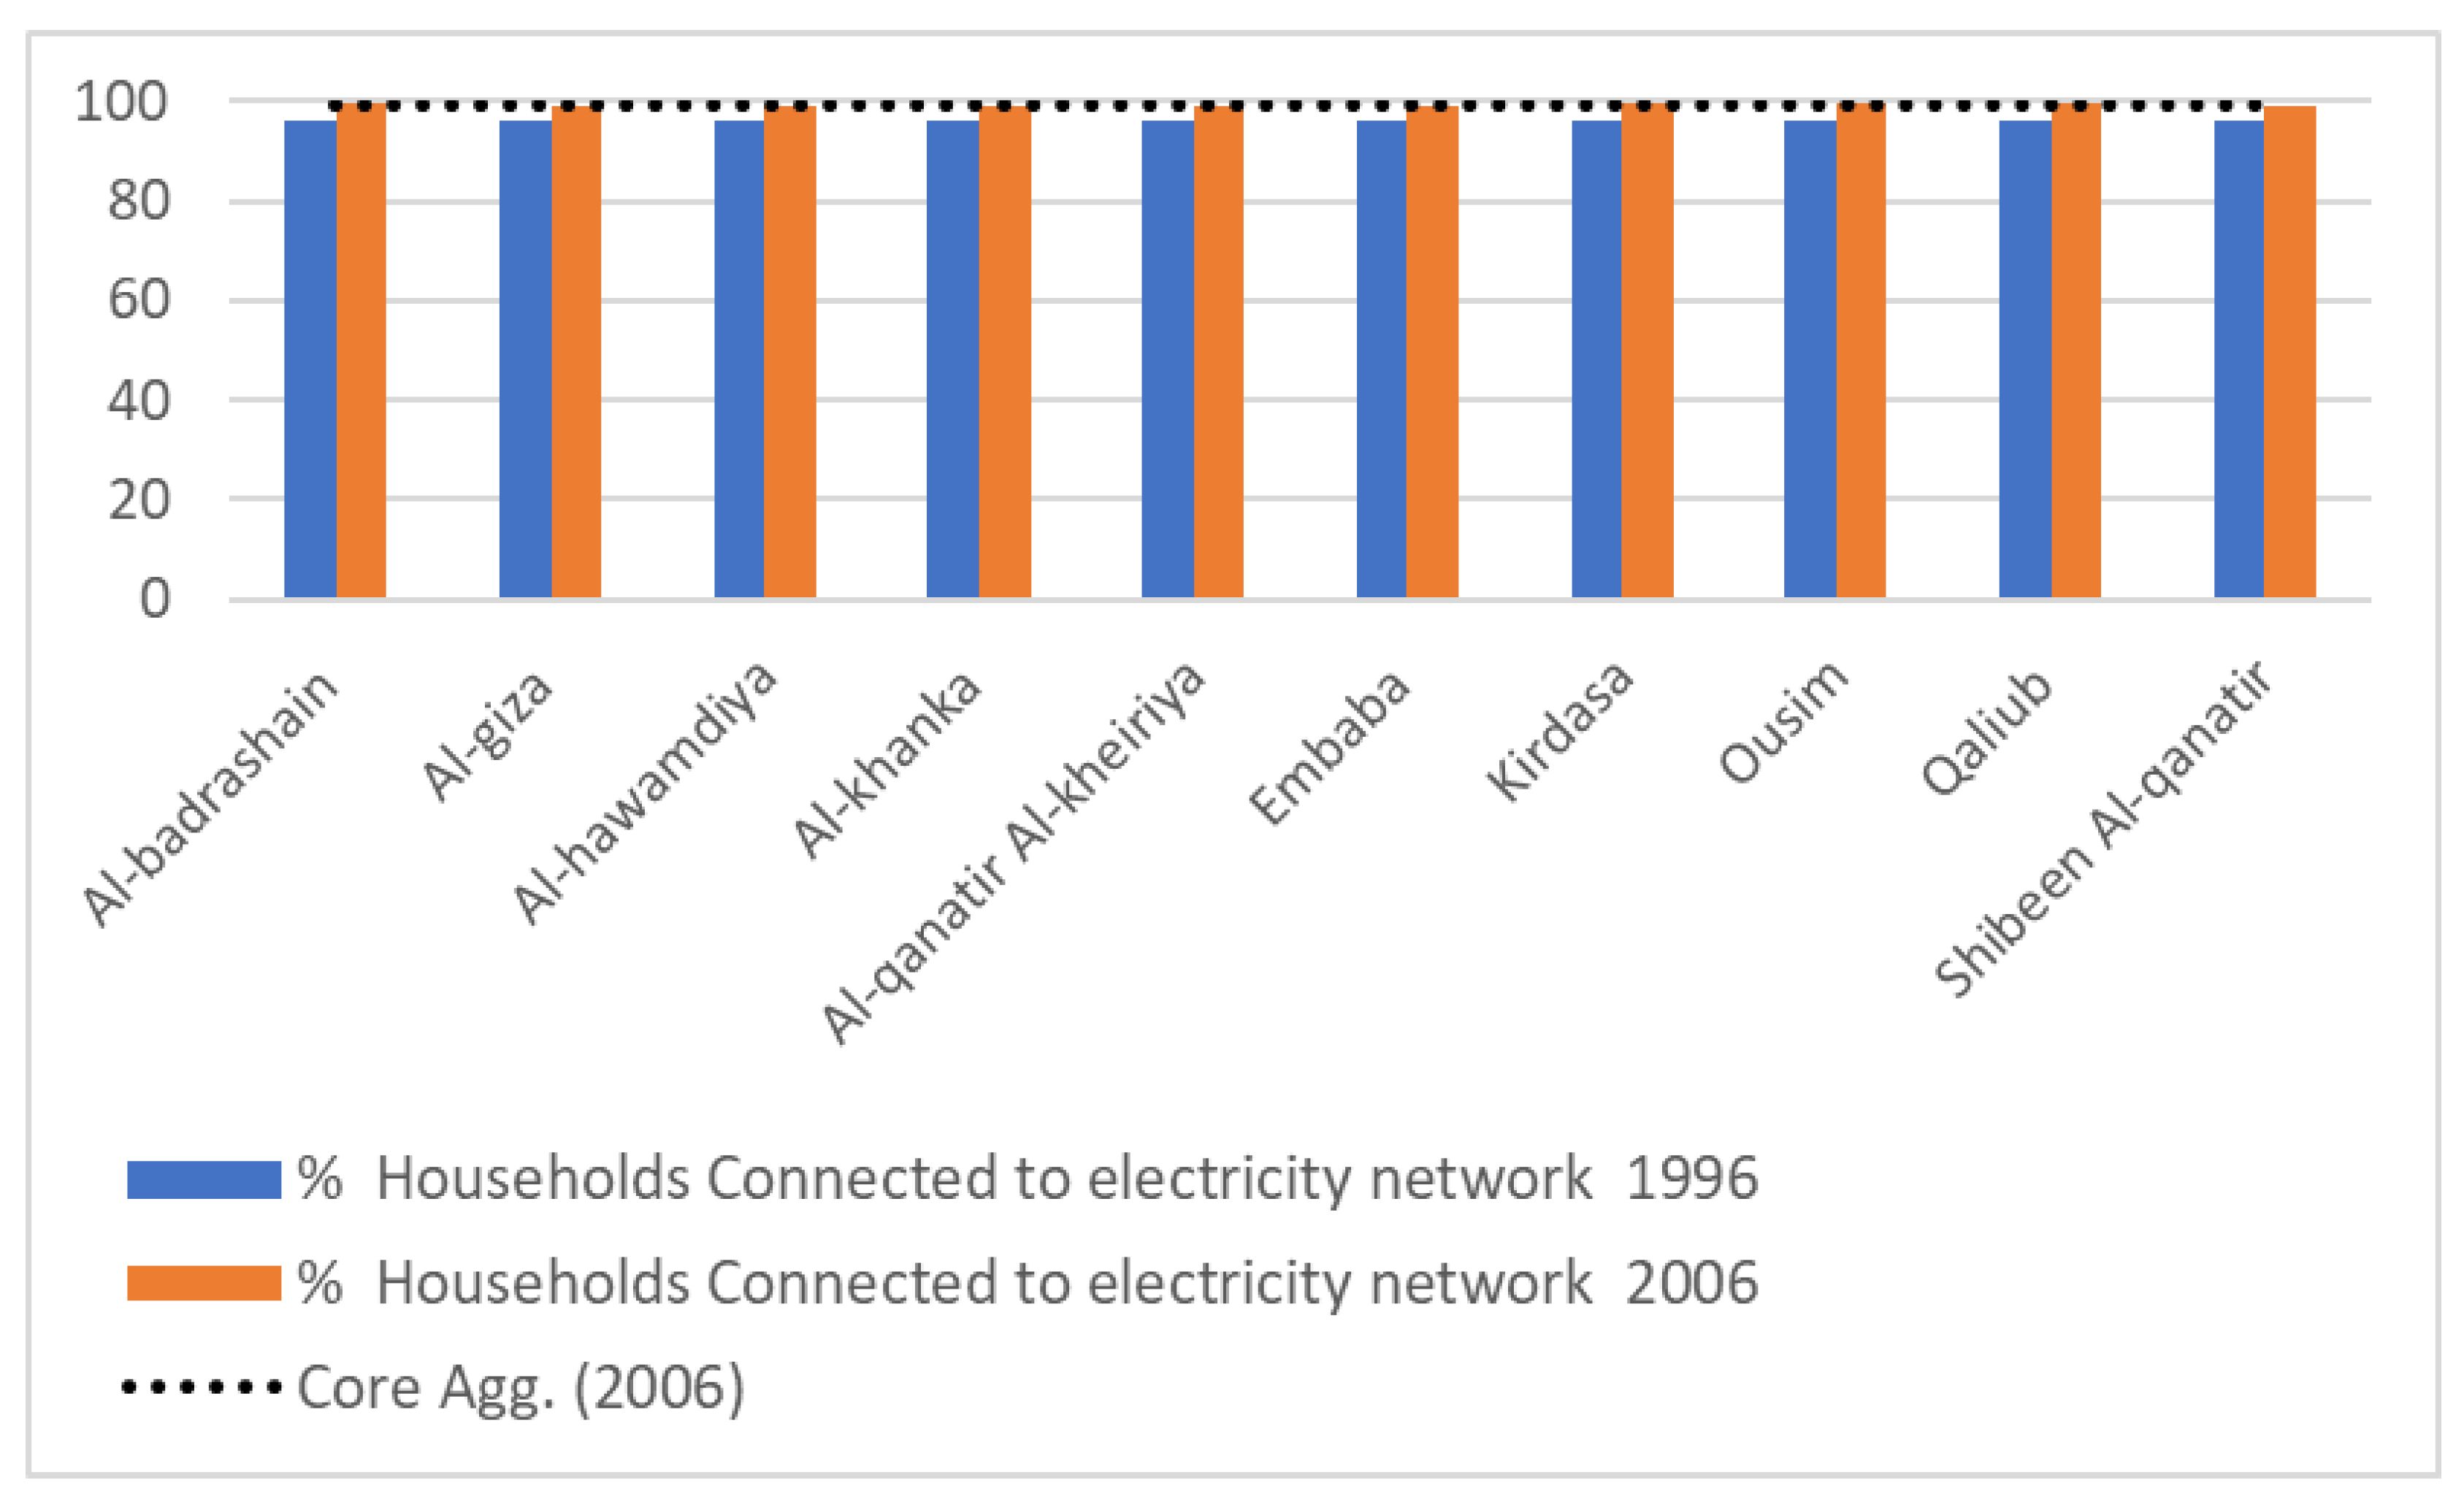
3.1.10. Electricity Access
The analysis outcomes indicate that more than 95% of households in the PUAs’ municipalities had access to the public electricity network in 1996, and that this percentage exceeded 99% in 2006; so all PUA’s municipalities recorded high scores in this indicator, as shown in
Figure 10.
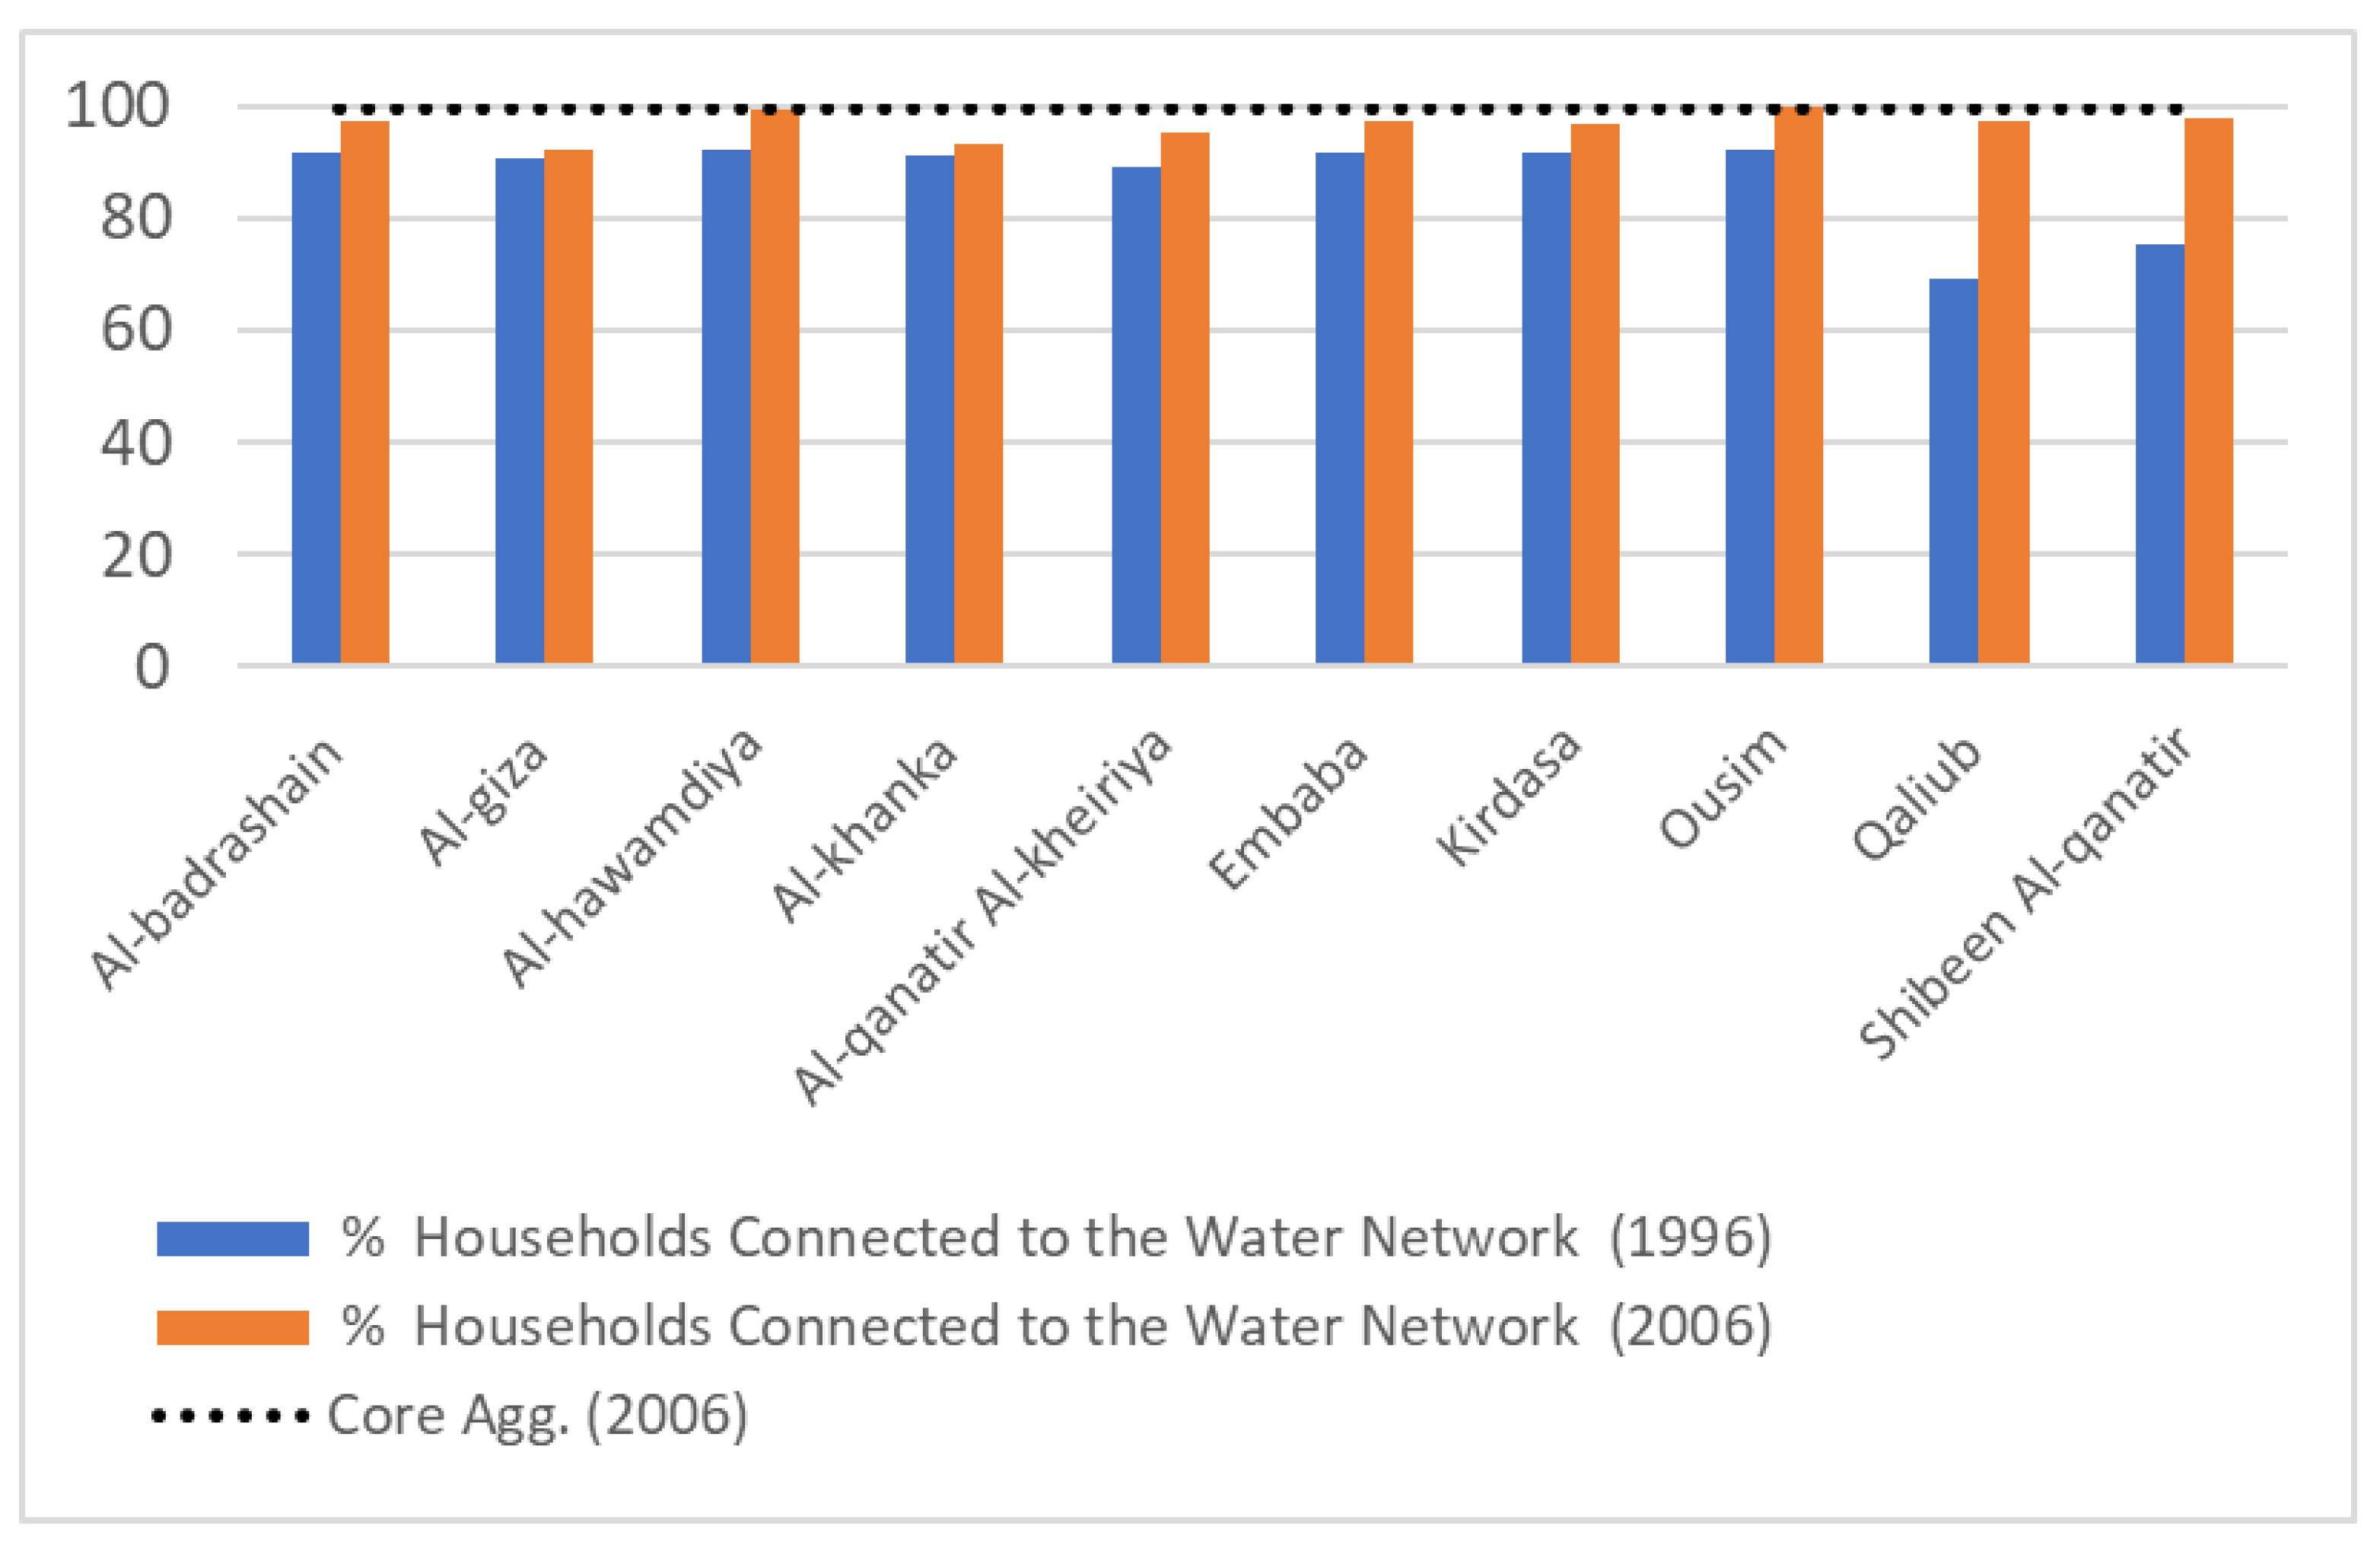
3.1.11. Water Access
According to the official census, over 68% of households in PUAs’ municipalities had access to the public water network in 1996. This figure reached 92% in 2006, as shown in
Figure 11. However, recent research argues that wide areas in PUAs’ municipalities still suffer from problems related to the quantity, quality, and accessibility of water during the daytime in particular [
64].
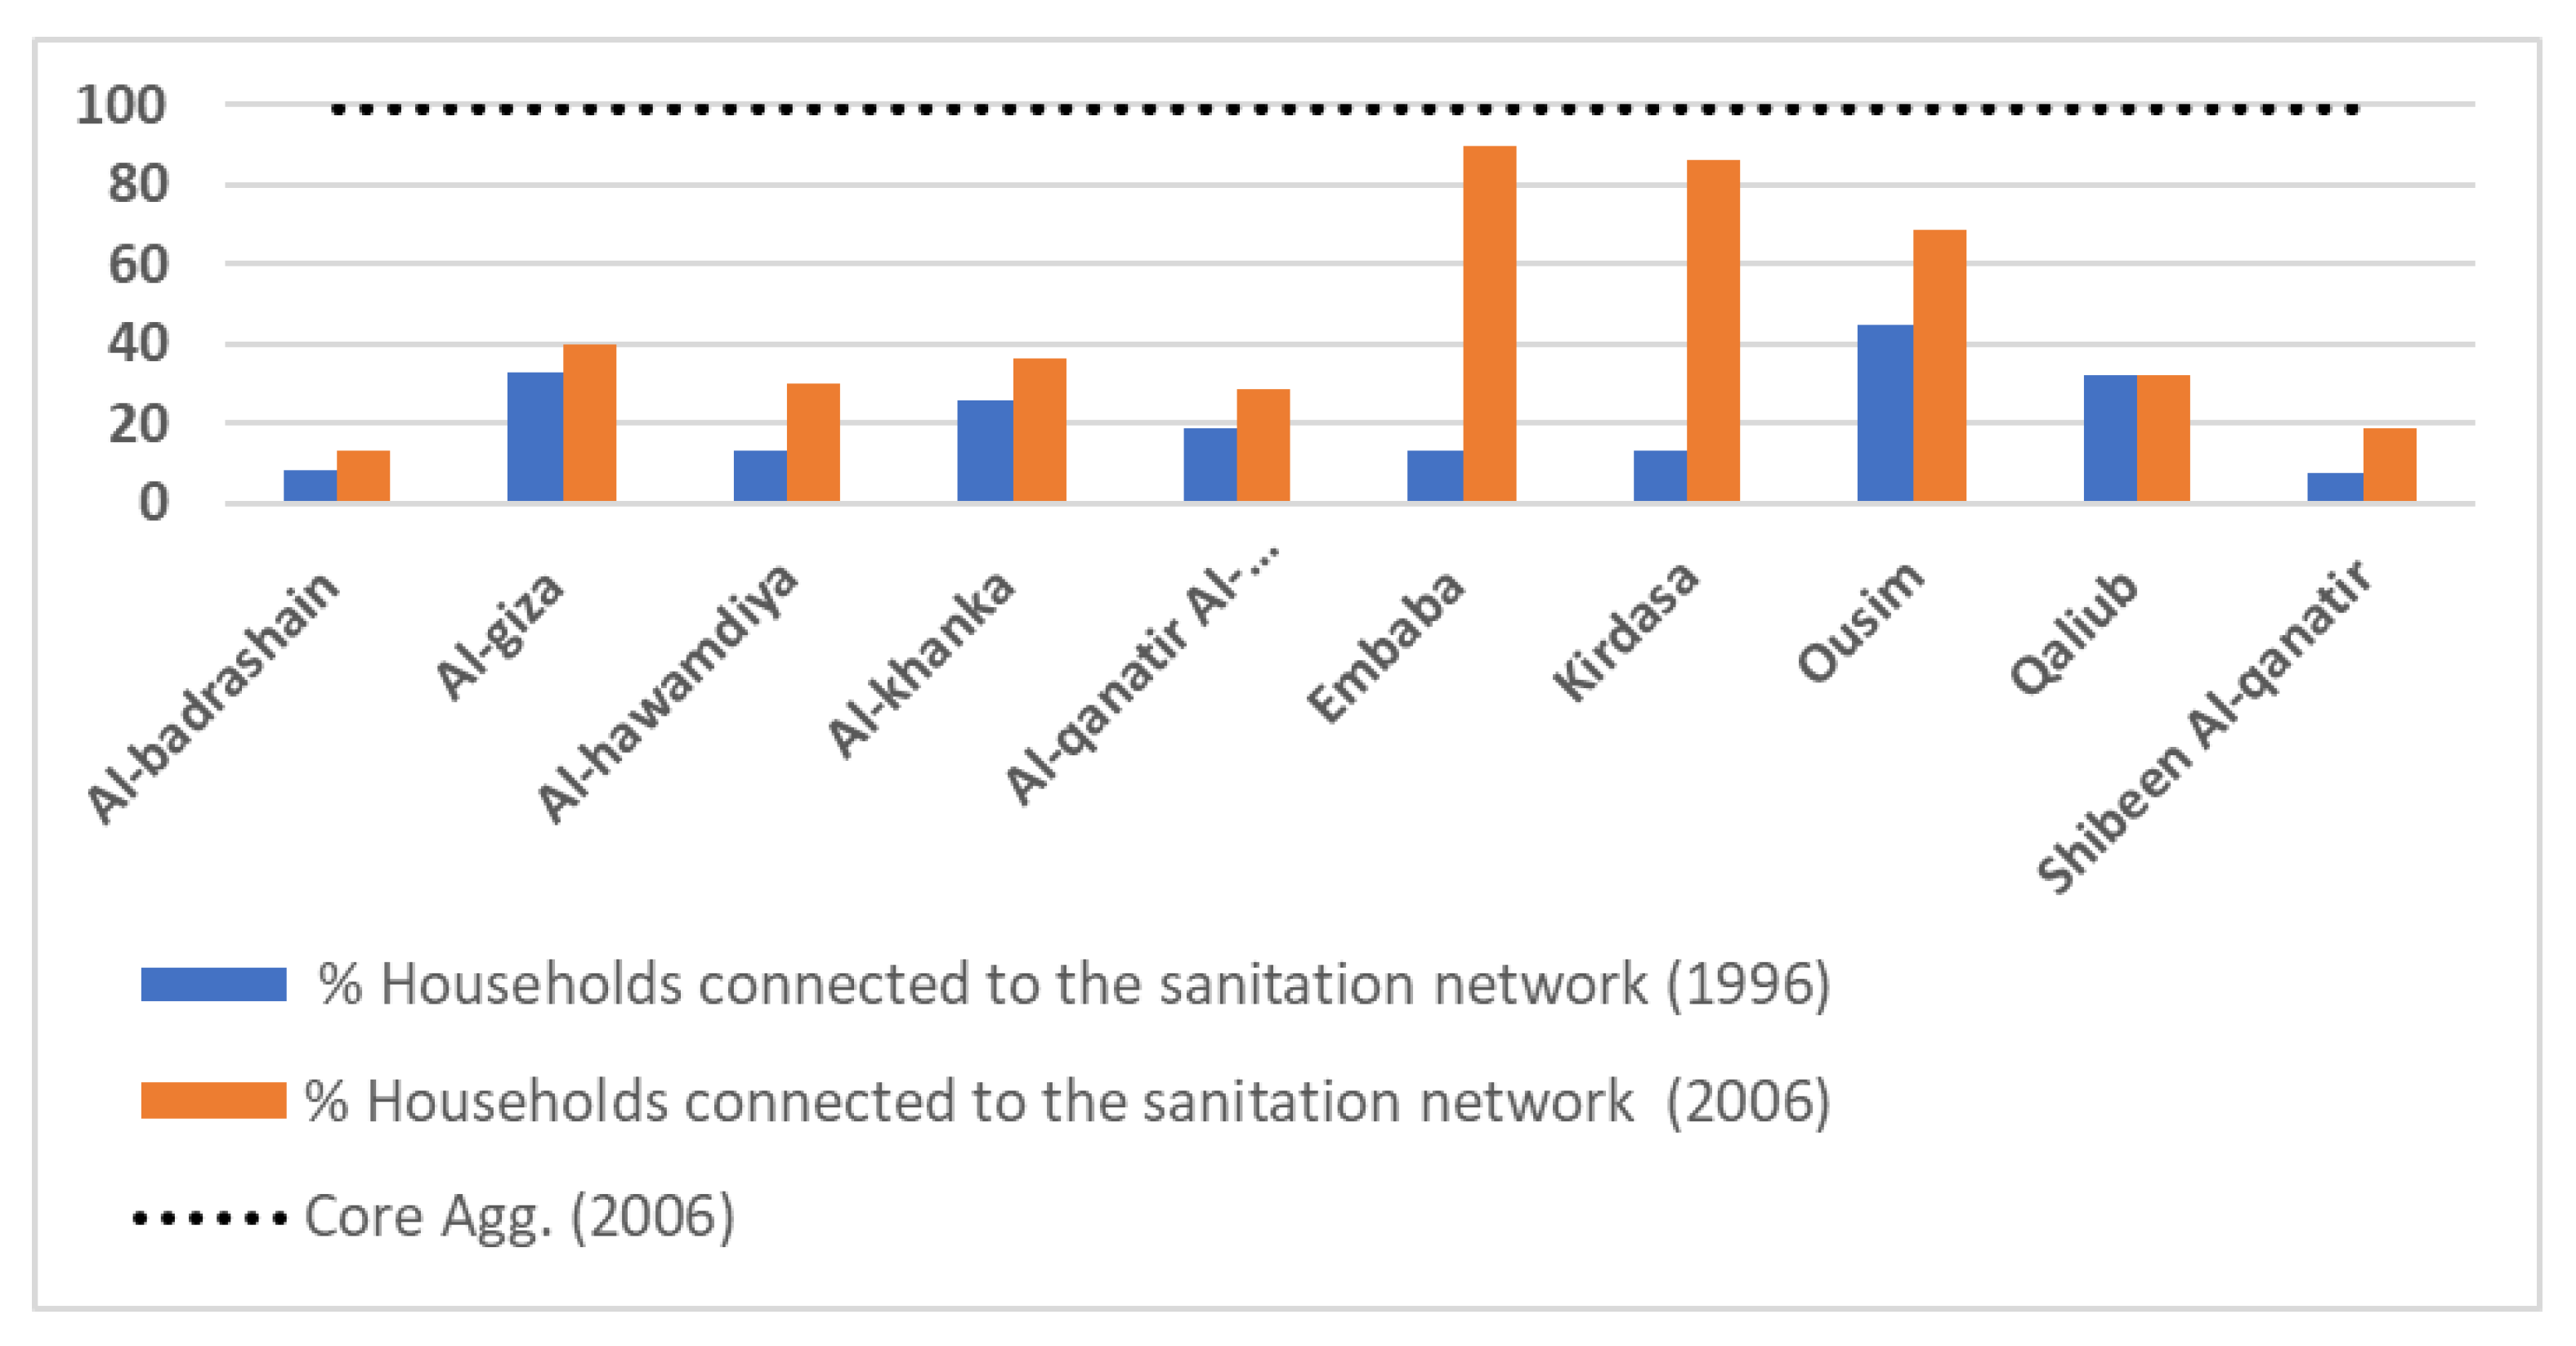
3.1.12. Sanitation Access
While access to electricity and water exceeds 95% in the PUAs, the sanitation connections are quite different. The results show that most of the households in PUAs municipalities do not have access to the public sanitation network, as shown in
Figure 12. The households in these municipalities use septic tanks as an alternative to the public network. Unfortunately, septic tanks leak sewage into the ground water, which affects the health of residents [
64]. In addition, due to the deteriorated status of pipes transporting water in these municipalities, sewage from septic tank leakage may even pollute the water supply. The leakage from septic tanks also threats the structural safety of nearby buildings, posing additional hazards to inhabitants.
Although since 2006 the government has worked to increase the number of households who have access to the public sanitation network, the percentage is still very low and the gap still very wide between the core agglomeration and PUAs’ municipalities.
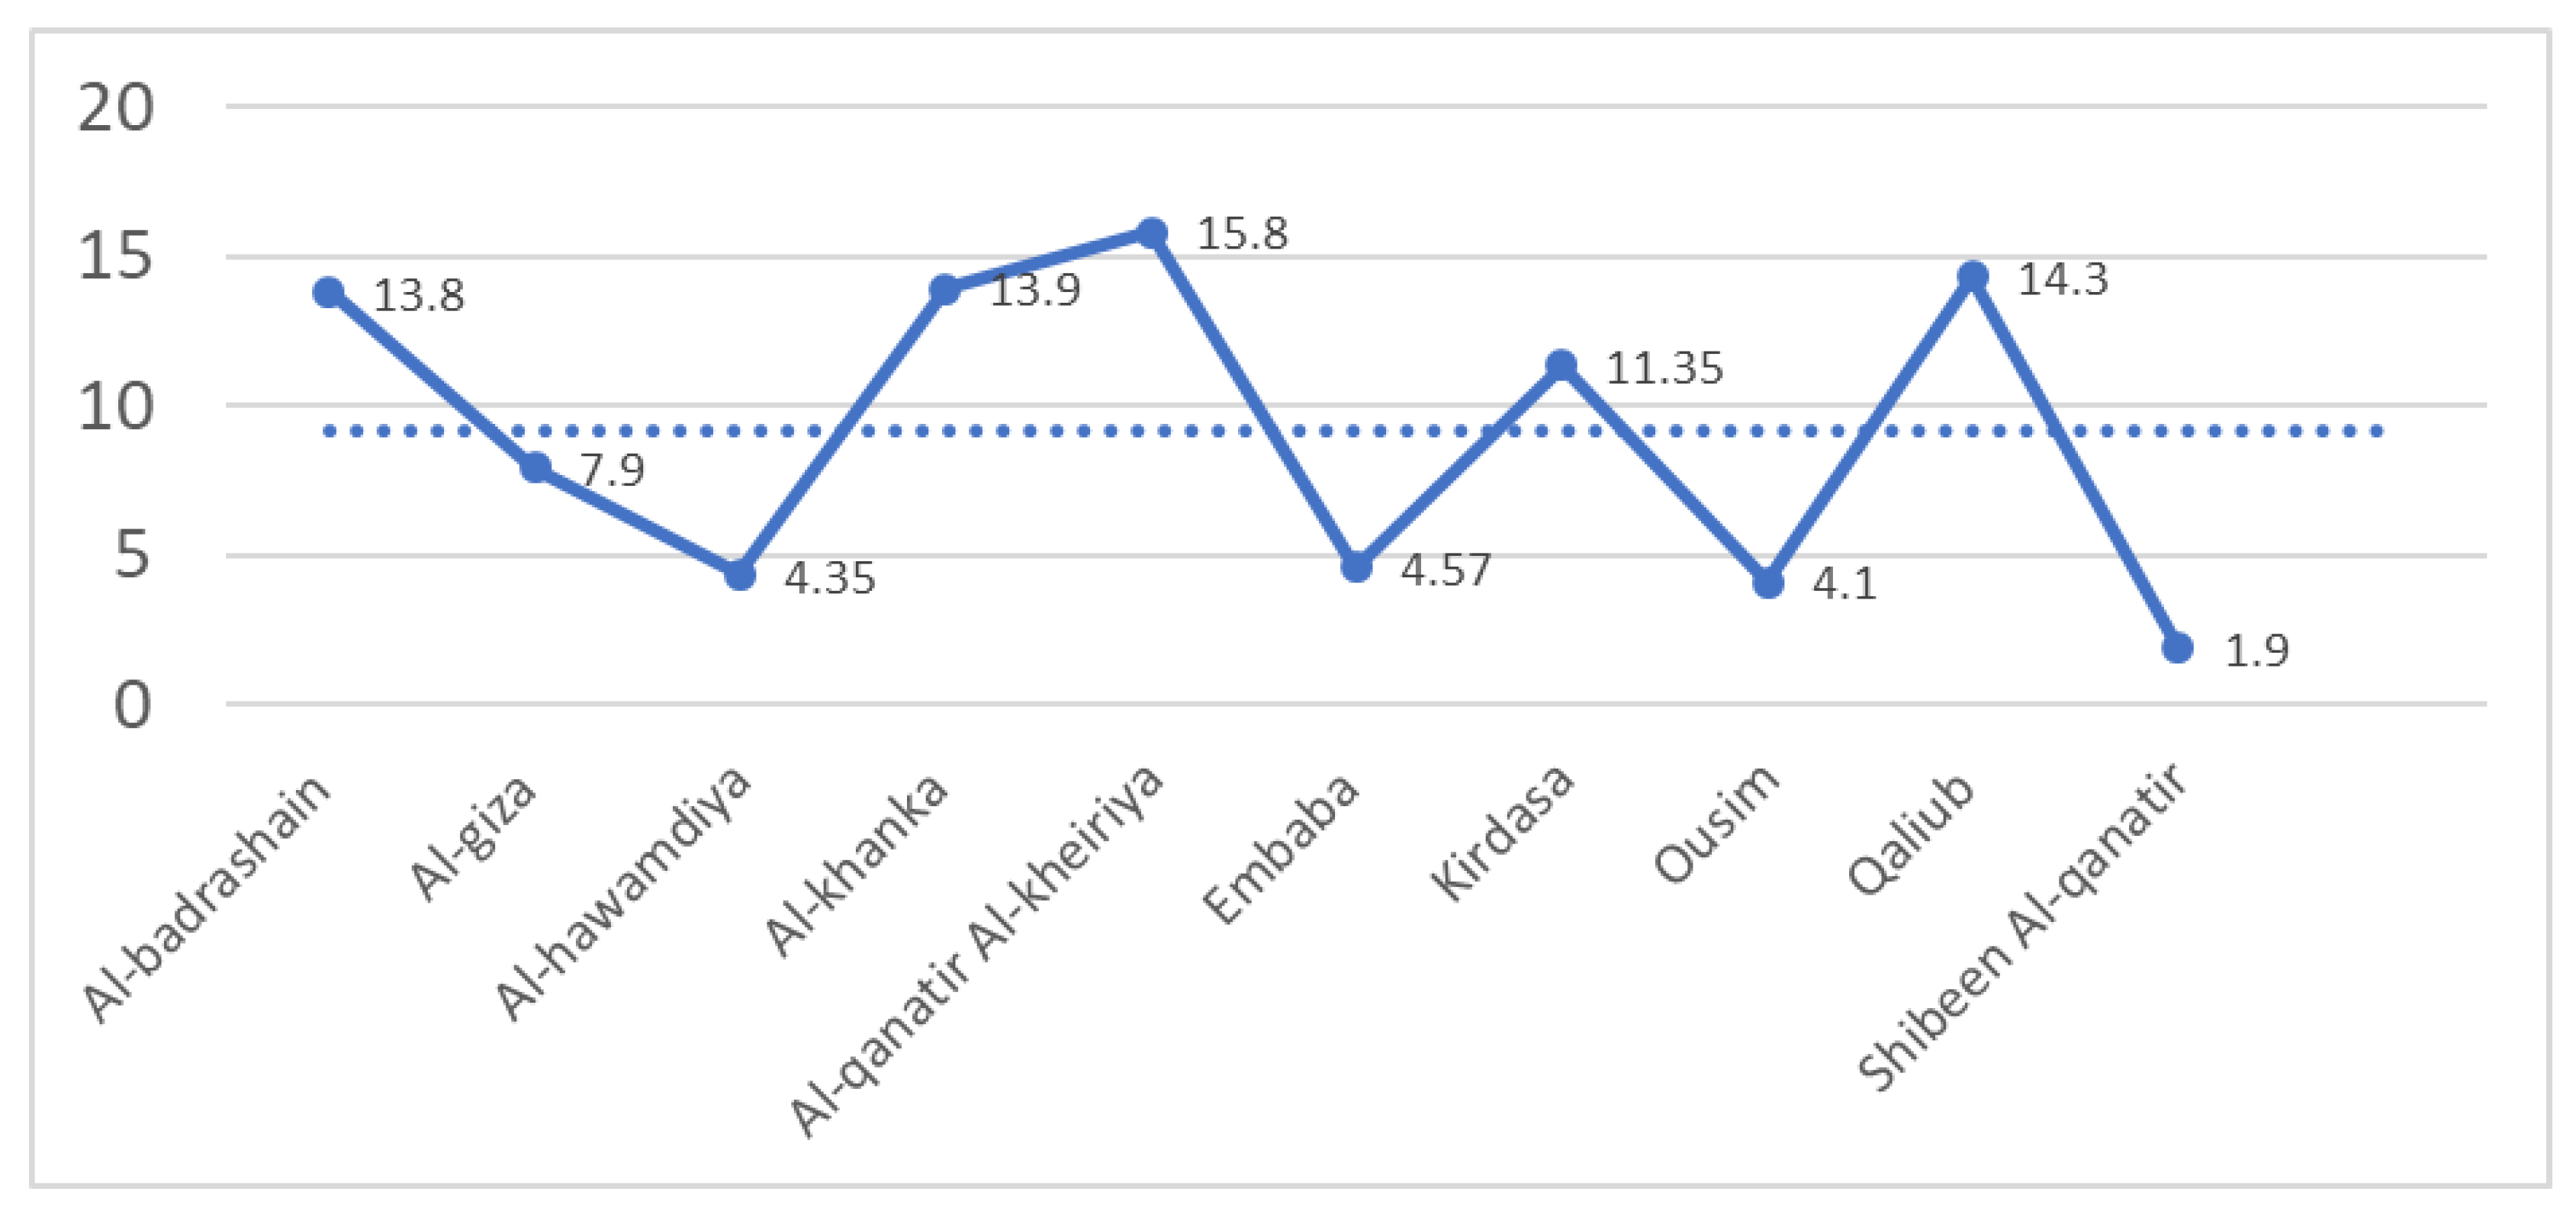
3.1.13. Annual Loss of Agricultural Land
The annual loss of agricultural land in all PUAs of GCR is considered the highest one in Egypt [
65], where the average loss exceeded 9% of the total agricultural land per year, especially in the northern parts of Al-qantir Al-kheiriya and Qaluib [
47,
66,
67].
Figure 13 shows the annual loss of agricultural land in the study area over the period 1996–2006.
3.2. Evaluation of Sustainable Development in the PUAs Municipalities
Based on the literature review and the data properties, benchmarking normalization was employed to remove the scale effects of various indicator units [
12,
24,
55]. Benchmark values for each indicator were assigned according to their minimum and maximum impacts on sustainable development, as shown in
Table 9.
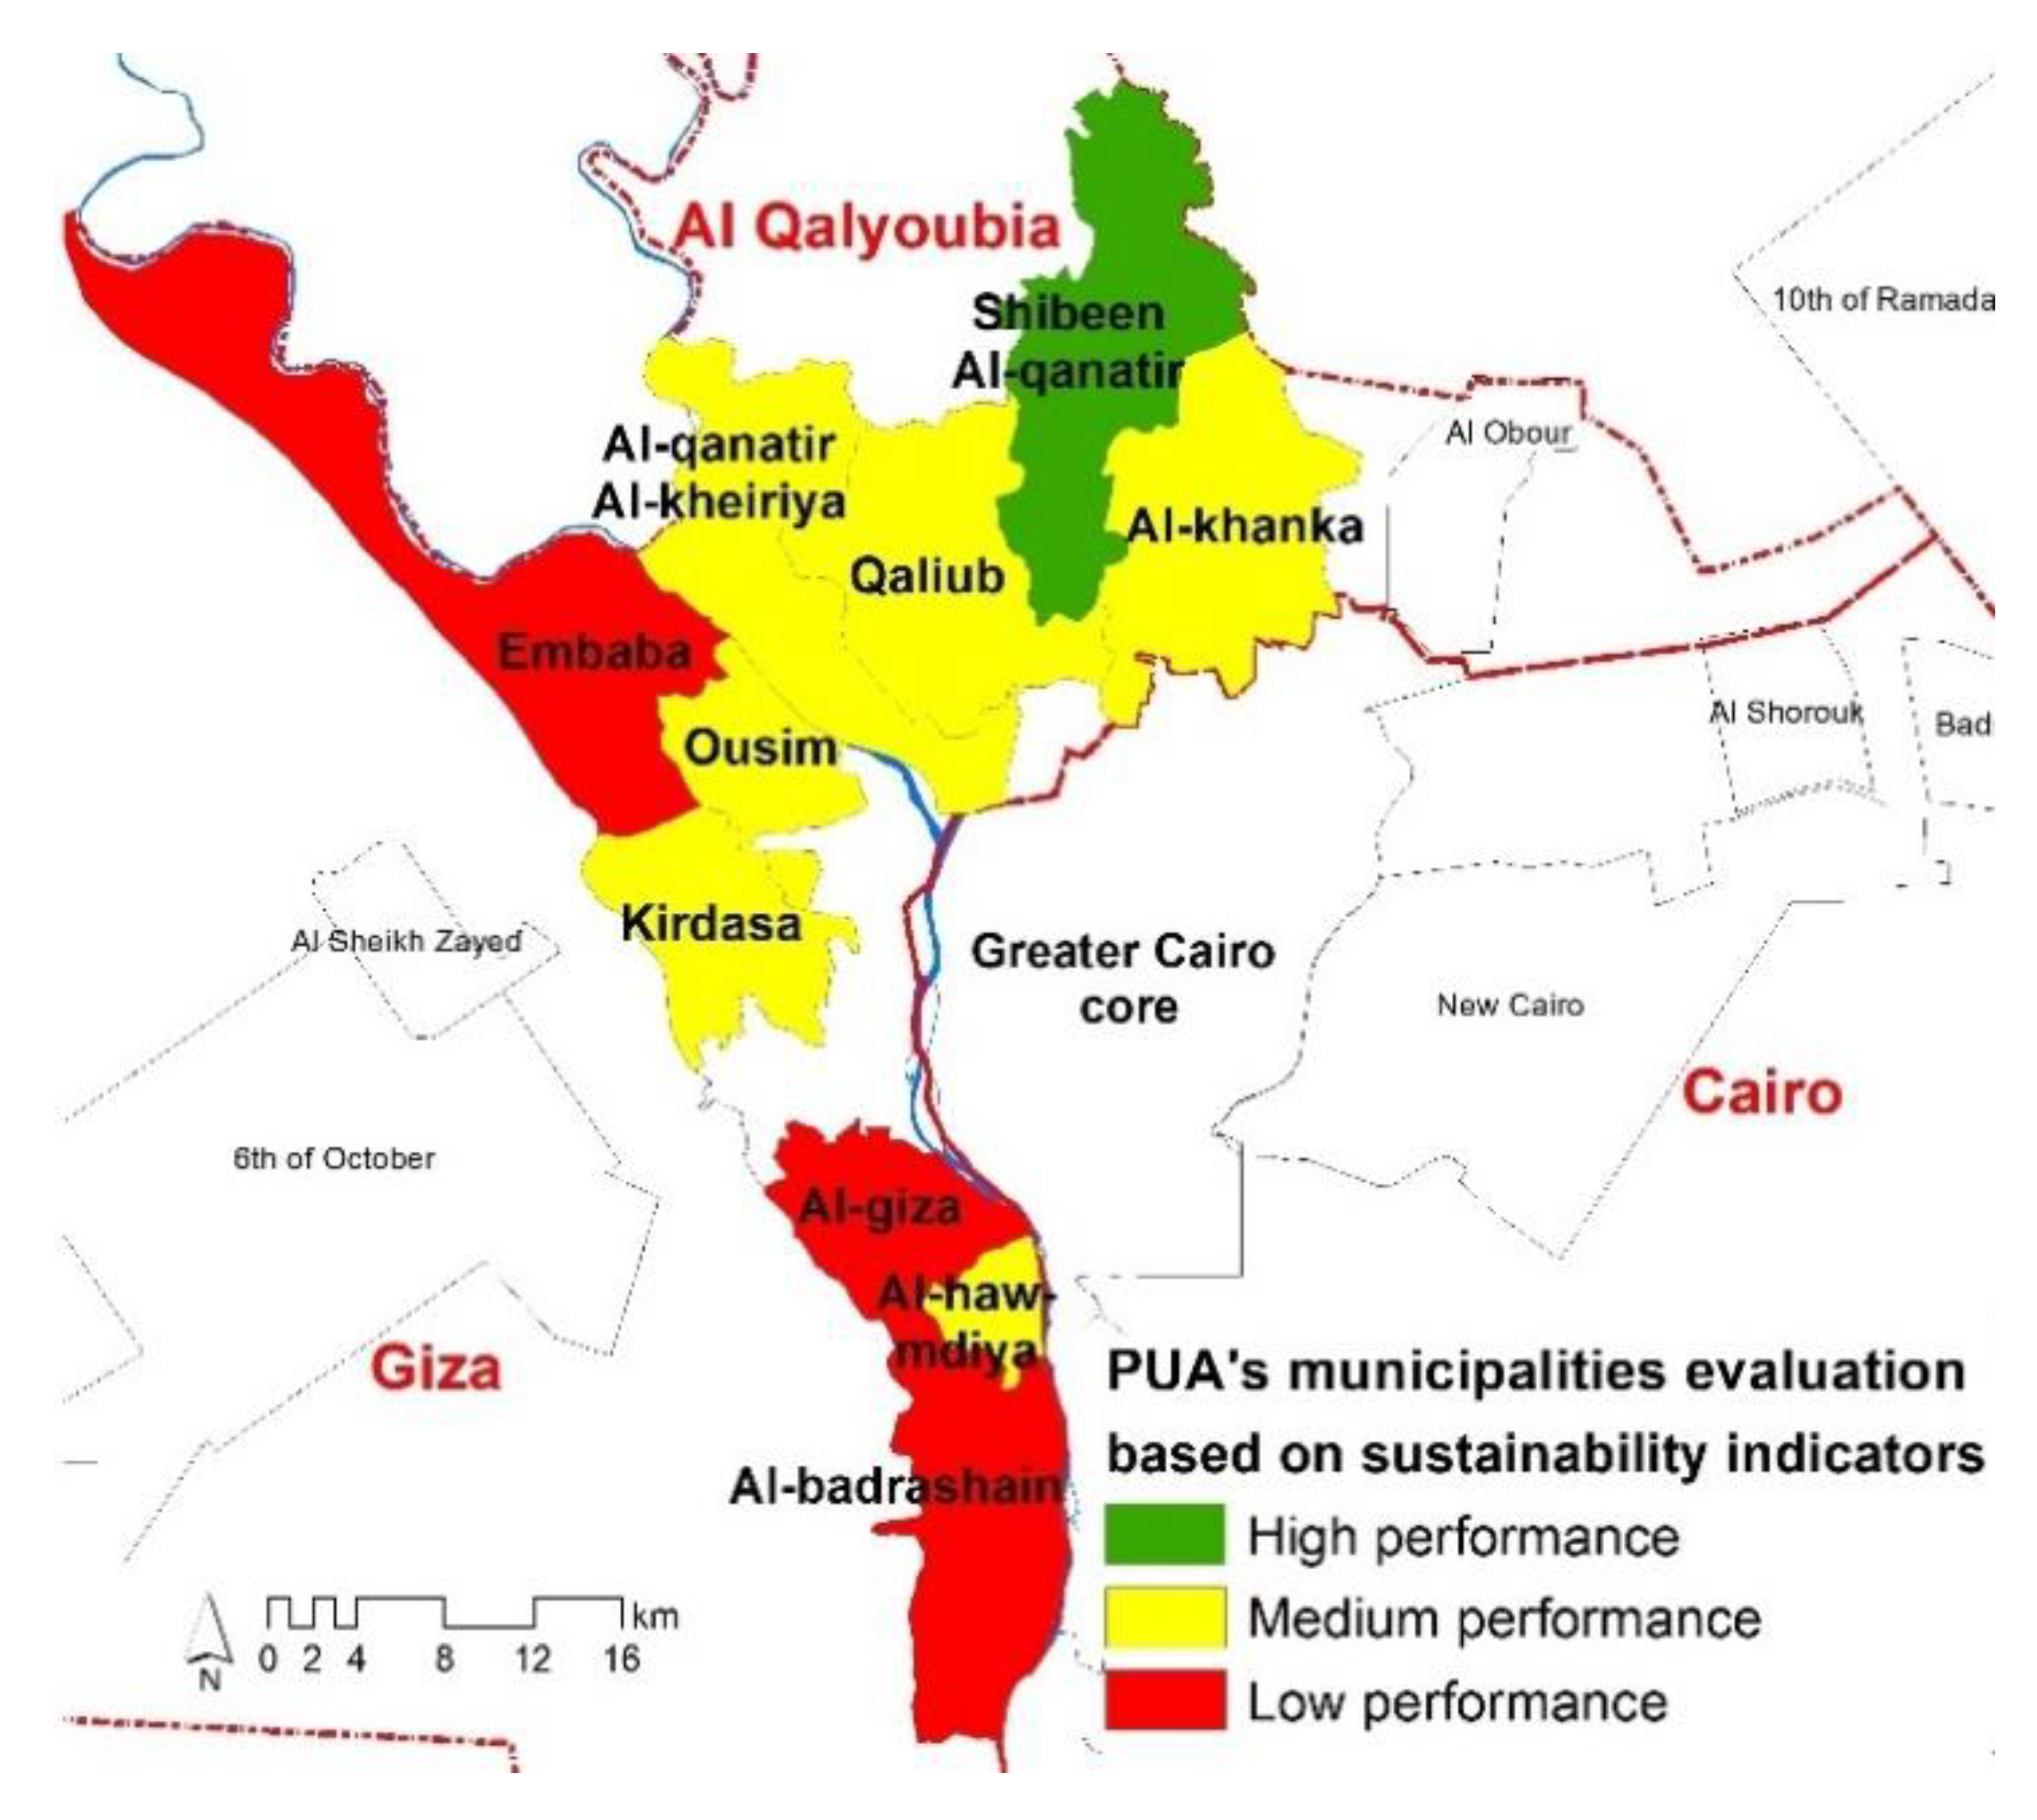
Each indicator has been expressed with a score ranging between 1 and 3: (1) indicates low performance (unsustainable condition/red color); (2) indicates medium performance (need more effort to reach satisfactory level of sustainability/yellow color); (3) indicates high performance (satisfactory level of sustainability/green color).
Figure 14 shows a classification of municipalities according to indicators of sustainability evaluation.
The evaluation outcomes show those municipalities which achieved progress towards sustainability and those which are still lagging. The Shibeen Al-qanatir municipality recorded the highest progress towards sustainability, while the municipalities of Embaba, Al-giza, and Al-badrashain recorded the lowest progress. The map shows that the farthest municipalities from core agglomeration recorded the lowest progress towards the sustainability, which proves the cruciality of the spatial dimension in the development process in the GCR.
The trend of attained development in the PUAs’ municipalities might refer to improvement in the status of SD. However, this improvement might not reflect the expected status in these areas as long the government continues focusing on the urban area only in its development plans.
The government should include PUAs in Greater Cairo in its plans and enhance the infrastructure projects in these areas to decrease the current gap between PUAs and the core agglomeration.
The methodology of this study can be utilized for evaluating the progress in SD in any PUA in other countries. According to Lu [
57], a good indicator framework can help local authorities to make significant decisions, and to assess the progress towards SDGs. In this regard, a national database including all the relevant information on PUAs municipalities in Egypt should be established.
Using the historical trend for SDIs in this study would help the local government of PUAs’ municipalities to self-check their own development pathways and identify the main aspects that impede SD. Thus, they can recognize their strengths and weaknesses and then prepare the required policies for addressing the urban challenges.
The main strength of these analyses lies in the development of a framework to monitor and measure the progress towards SD in the PUAs, which have been marginalized for a long time. Despite the functional and spatial importance of PUAs in the GCR, this study is considered one of the first initiatives to understand and measure the states of SD in those areas.
3.3. Data Limitations
Despite constant efforts to enhance the results of measuring and evaluating SD within the PUAs, several limitations have arisen. Shortages of or missing data at the PUA level have led to decreasing the number of indicators that have been used. The SDIs in this study extensively relied on the census data released every 10 years, which is a useful tool for long term evaluation only. In addition, the limited number of indicators related to some SD aspects might affect the results of the study. Moreover, the use of equal weights for all indicators could also influence the evaluation of PUA’s municipalities. Therefore, using more indicators and recent data could improve the precision of the results of this study. However, we are confident that in spite of these limitations, the research methodology can be widely applied in similar spatial contexts in other developing countries.
Comparing the results of this study with previous studies, we found that even though a few studies addressed SD at the local level in Egypt and other developing countries, this study remains one of the few studies that have assessed progress in attaining the SD on the PUAs’ municipalities. For instance, Baseera [
68] has assessed the progress toward SD at in Egyptian governorates (regional scale); therefore the PUAs’ municipalities were neglected.
In terms of other developing countries, Nallathiga et al. [
60] have discussed the progress toward SD in PUAs of Delhi, India. However, they discussed the issue in the prospective of unstainable urbanization and haphazard development without presenting comprehensive indicators for measuring municipalities there. Diaz-Chavez [
23] has proposed a list of 30 indicators for measuring SD in PUAs of Mexico City, using data from one specific date, which measure the state of SD in PUAs in that year only and do not produce an assessment for the progress toward SD in these areas.
Future work should be directed to develop this framework and discuss the best approaches to develop the current state of PUAs’ municipalities. In addition, there is a need for further research into planning mechanisms which would enhance the development in the PUAs, particularly in the municipalities that witness a weak performance toward SD.


