Article

Normative Values for Femoral Length, Tibial Length, and the Femorotibial Ratio in Adults Using Standing Full-Length Radiography

MaineGeneral Medical Center, 35 Medical Center Parkway, Augusta, ME 04330, USA
Osteology 2021, 1(2), 86-91; https://doi.org/10.3390/osteology1020009
Submission received: 27 January 2021 / Revised: 3 May 2021 / Accepted: 6 May 2021 / Published: 13 May 2021

Abstract

:
Knowledge of the normal length and skeletal proportions of the lower limb is required as part of the evaluation of limb length discrepancy. When measuring limb length, modern standing full-length digital radiographs confer a level of clinical accuracy interchangeable with that of CT imaging. This study reports a set of normative values for lower limb length using the standing full-length radiographs of 753 patients (61% male). Lower limb length, femoral length, tibial length, and the femorotibial ratio were measured in 1077 limbs. The reliability of the measurement method was tested using the intra-class correlation (ICC) of agreement between three observers. The mean length of 1077 lower limbs was 89.0 cm (range 70.2 to 103.9 cm). Mean femoral length was 50.0 cm (39.3 to 58.4 cm) and tibial length was 39.0 cm (30.8 to 46.5 cm). The median side-to-side difference was 0.4 cm (0.2 to 0.7, max 1.8 cm) between 324 paired limbs. The mean ratio of femoral length to tibial length for the study population was 1.28:1 (range 1.16 to 1.39). A moderately strong inverse linear relationship (r = −0.35, p < 0.001, Pearson’s) was identified between tibial length and the corresponding femorotibial ratio. The PACS-based length measurement method used in this study displayed excellent inter-observer reliability (ICC of 0.99). This study presents a normal range of values for lower limb length in adults and is the first to identify a linear relationship between tibial length and the femorotibial ratio.

1. Introduction

Lower limb length discrepancy can cause pelvic tilt, lower-back pain and spinal deformity, and mechanical and functional changes in gait. Knowledge of the normal length and proportions of the lower limb is required prior to undertaking limb reconstruction for post-traumatic, congenital, or pathological deformities. The preoperative assessment of limb length discrepancy may involve the use of supine CT imaging; Strecker et al. have presented normative values for limb length using this method [1]. Recent work has suggested that length measurements obtained from standing full-length digital radiography can be considered interchangeable with those derived from supine CT, potentially obviating the requirement for CT in patients without additional angular or rotational deformity [2]. The aim of this study was therefore to present a set of normative values for lower limb length using standing full-length radiography. The research proposal was submitted to, and approved by, the Institutional Review Board at MaineGeneral Medical Center. It was deemed exempt from full review, because it involved the study of pre-existing radiographic data obtained as part of routine patient care, and examined in such a way that study subjects could not be identified.

2. Materials and Methods

The picture archiving and communication system (PACS; IntelliSpace Enterprise Version 4, Koninklijke Philips, Amsterdam, The Netherlands) was used to identify all standing full-length radiographs performed at MaineGeneral Medical Center between January 2013 and December 2015. Images of limbs affected by trauma, tumor, congenital disorder, moderate to severe knee arthritis (Kellgren and Lawrence [3] grade 3 or 4), and those with open physes were excluded. Using standard digital PACS software, limb length was measured on each radiographic image.

2.1. Patients

After exclusions, 1077 limbs in 753 patients were suitable for measurement (Table 1). There were 459 men (mean 51.1 years; range 16 to 82) and 294 women (mean 51.4 years; range 15 to 83). In 324 patients, both limbs were suitable for measurement. In the remaining 429 patients, a single limb was used. The most frequent reason to exclude a limb from analysis was the presence of knee arthritis.

2.2. Radiographic Protocol

The radiographs were obtained using a standardized radiographic protocol. Patients were positioned standing on a marked footplate, at a consistent measured distance from the digital flat-panel X-ray detector, with their feet and knees facing forwards towards the X-ray source. The X-ray source was housed within a gantry that moved on a pre-determined arc. The top, middle, and bottom of the desired image were pre-programmed by the radiographer, according to patient height, to obtain a true anteroposterior image at the level of the hips, knees, and ankles, respectively. During image capture, the X-ray gantry moved smoothly from top to bottom to minimize the effects of beam parallax. The resultant images were digitally processed and stitched to obtain the full-length radiograph displayed in Figure 1. The pixel size of the flat-panel X-ray detector used was 160 microns.

2.3. Limb Measurement

Measurements were made on a 20 inch monitor with 1.92-megapixel (1600 × 1200) screen resolution. The PACS image was magnified until the entire segment being measured filled the screen. Measurement calipers were then placed using standard PACS software. Anatomical reference points that have been used previously [4] were chosen for radiographic measurement (Figure 1). Limb length was measured from the top of the femoral head (FH) to the center of the tibial plafond (TP). Femoral length was measured from the FH to the center of the medial femoral condyle (MC). Tibial length was measured from the center of the medial tibial plateau (MP) to the TP. All measurements were carried out and recorded in centimeters, to the nearest millimeter.

2.4. Statistical Analysis

Analysis was performed using SPSS version 22 (SPSS Inc., Chicago, IL, USA). Normally distributed measurement data are presented in terms of the mean, two standard deviations (2SD), and the range (R). For asymmetric data, the median, interquartile range (IQr) and 95th percentile are used. An unpaired t-test was used to compare differences between groups. The radiographic measurement method was assessed for reliability by selecting a set of standing full-length radiographs distinct from those included in the study. The limbs on these 21 test images were independently measured by three orthopedic surgeons, and the intra-class correlation (ICC) of absolute agreement was calculated for each possible pair of observations, (along with 95% CIs). The overall mean ICC value was then calculated and interpreted according to the guidelines described by Cicchetti [5]: a value of 0.75 to 1.00 indicated excellent agreement; 0.60 to 0.74, good; 0.40 to 0.59, fair; and <0.40, poor. Statistical significance was set as p ≤ 0.05.

3. Results

3.1. Measurement Method Reliability

The mean ICC of absolute agreement was 0.99 (CI 0.98 to 1.00) for femoral length measurements and 0.98 (CI 0.97 to 0.99) for measurements of the tibia, indicating excellent inter-observer reliability.

3.2. Limb Length

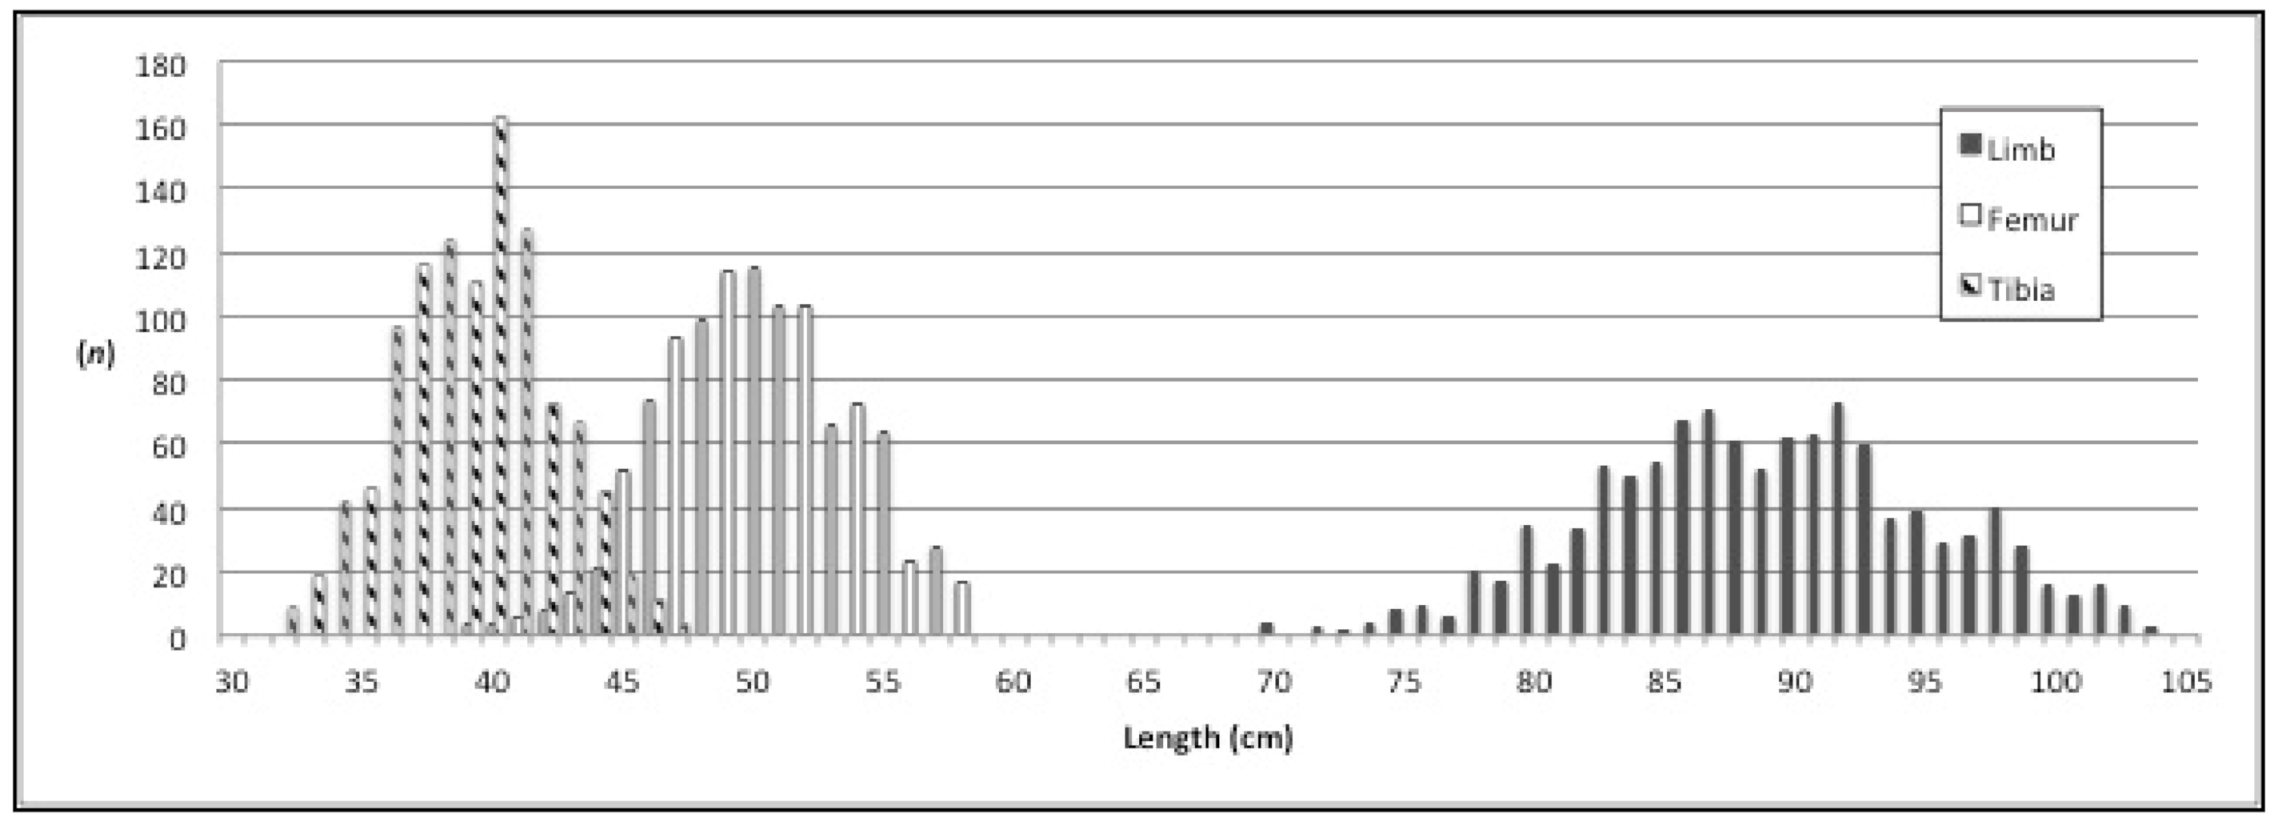
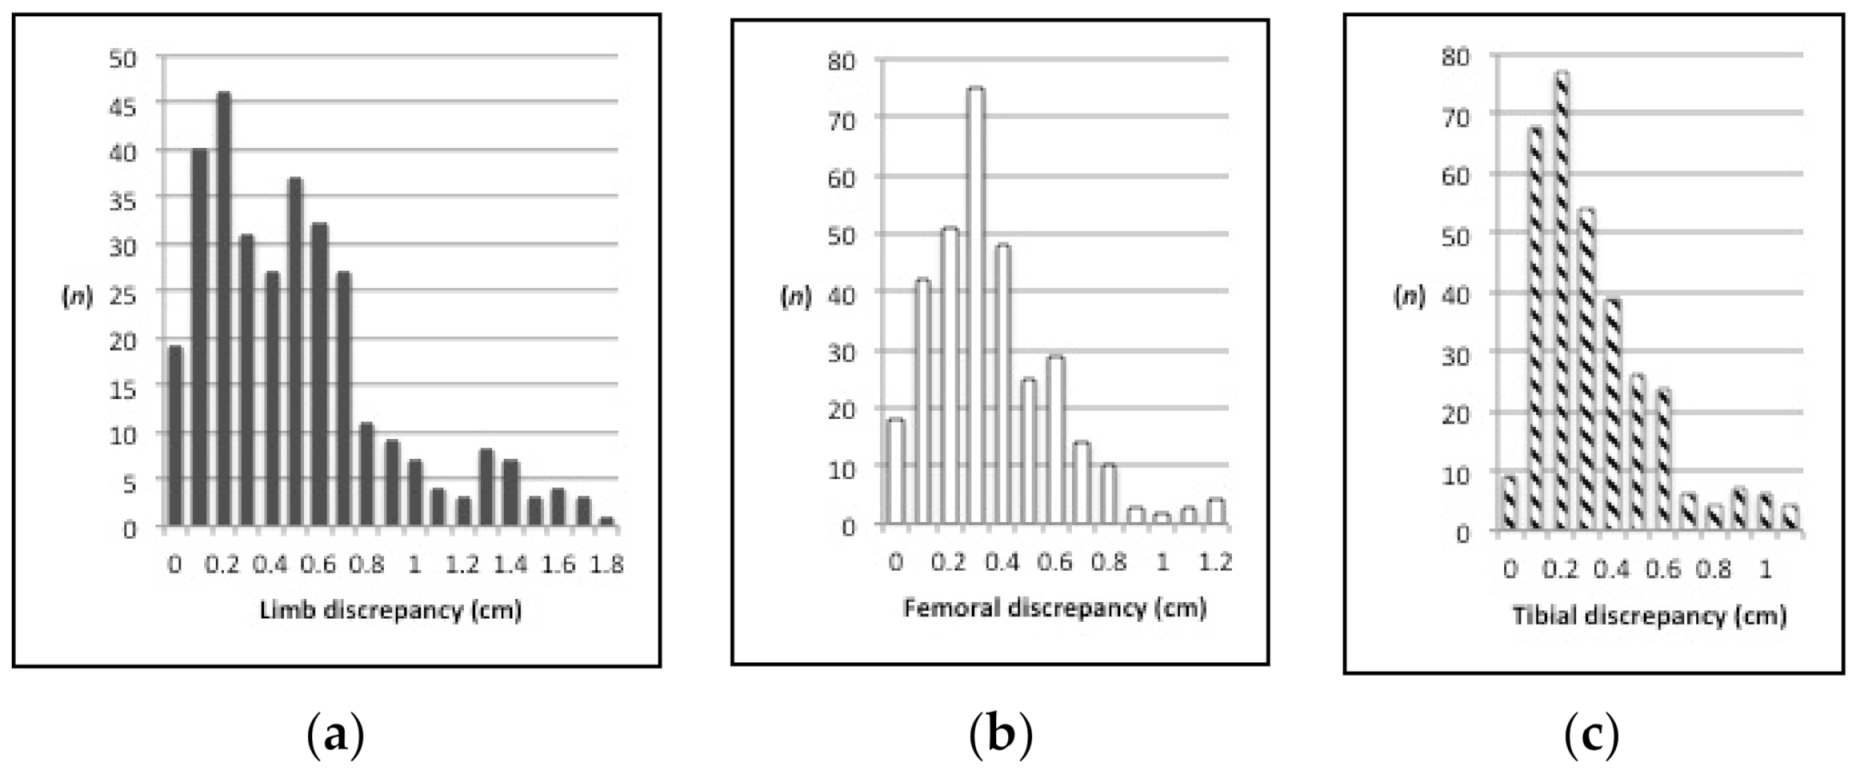
The mean length of 1077 lower limbs was 89.0 cm (2SD ±12.8, R 70.2 to 103.9) with a normal distribution (Figure 2). In 324 paired limbs, equal length was seen in 19 cases, left measured longer in 182 and right was longer in 123. The median side-to-side difference between left and right limbs was 0.4 cm (IQr 0.2 to 0.7, 95th 1.4), with a maximum observed difference of 1.8 cm in our population (Figure 3a).

3.3. Femoral Length

Mean femoral length was 50.0cm (2SD ±7.2, R 39.3 to 58.4). In the paired cases, equal length was noted on 18 occasions, 169 were longer on the left, and 137 were longer on the right. The median difference between paired left and right femora was 0.3 cm (IQr 0.2 to 0.5, 95th 0.8), with 1.2 cm being the maximum difference detected (Figure 3b).

3.4. Tibial Length

Mean tibial length was 39.0 cm (2SD ±6.0, R 30.8 to 46.5). Equal length was found in nine of the paired tibiae, with the left measuring longer in 184 cases, and the right longer in the remaining 131. The median side-to-side difference was 0.3 cm (IQr 0.2 to 0.4, 95th 0.9), with a maximum difference of 1.1 cm (Figure 3c).

3.5. Femorotibial Ratio

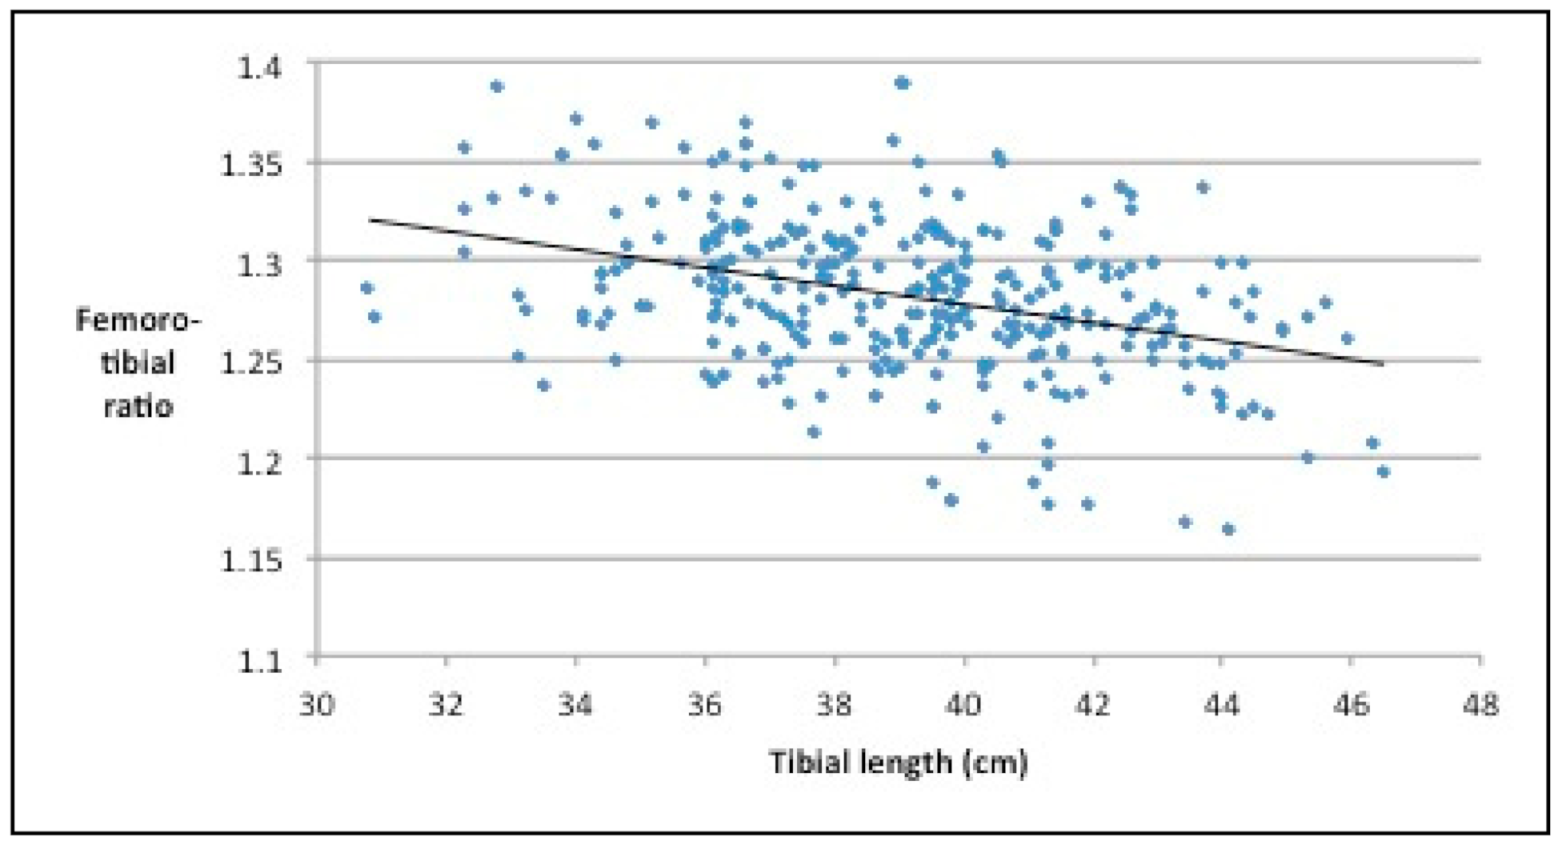
The overall ratio of femoral length to tibial length was 1.28:1 (2SD ± 0.08) with a normal distribution. The calculated ratio for patients with shorter-than-average tibiae (length < 39 cm) was 1.29 (2SD ± 0.07), which was the same for men and women. This differed significantly from the ratio of 1.27 (2SD ± 0.08) found in both men and women with longer tibiae (length > 39 cm), (p < 0.001, t-test). Further assessment of the relationship between tibial length and the femorotibial ratio revealed a moderately strong inverse linear correlation (r = −0.35, p < 0.001, Pearson’s), as illustrated in Figure 4.

4. Discussion

This study adds clinical value to the existing literature on lower limb length and proportions. A set of normative values for lower limb length, using standing full-length digital radiography, has until now not been reported. According to the results of this study, 75% of adults have a physiologic lower limb length discrepancy of 0.7 cm or less. In only 10% of individuals, the difference exceeds 1 cm. In 5%, the difference will be 1.4 cm or more. In terms of the side-to-side difference expected physiologically in femora and tibiae, this will measure 0.9 cm or less in 95% of adults. Knowledge of the extent of this physiologic variation is paramount, especially in the assessment of post-traumatic cases, where a proportion of any calculated length discrepancy may have been present prior to the inciting event.
The results of this study will strengthen the reporting of lower limb length discrepancy. Knowing what represents ‘normal’ (traditionally, 2SDs from the mean in symmetrically distributed data, or the 95th percentile for asymmetric data) serves as a guide for authors seeking to report ‘abnormal’ results. For example, in reporting side-to-side femoral length discrepancy after antegrade nailing of comminuted femoral shaft fractures, Herscovici and Scaduto found that 7% of cases were nailed in a position of shortening of 1.25 cm or greater [6]. Vaidya et al. used a stricter threshold of 1 cm to evaluate the same research question, and found shortening in 36% [7]. According to the results presented in this manuscript, the 95th percentile for physiologic femoral length discrepancy is 0.8 cm, and it is Vaidya et al. who have more accurately estimated the true frequency of ‘abnormal’ femoral shortening. Of course, ‘abnormal’ results do not necessarily equate to ‘clinically important’ results. Nonetheless, continuing with the femoral shortening example, most experienced authors consider a discrepancy of 1 cm to 1.25 cm or greater as being clinically important [6,8,9].
Knowledge of the normal proportions of the lower limb is clinically relevant when treating patients with bilateral lower limb trauma or deformity. The mean femorotibial ratio for the study population was 1.28, using the top of the femoral head as a proximal reference point. This result agrees with that of Strecker et al., who stated the ratio of femoral length to tibial length was 1.26 (using the center of the femoral head as the reference) [1]. The observation that this ratio varies according to tibial length is a new finding, but might be considered intuitive. Men and women with short tibiae have proportionately longer femora than those with long tibiae. This finding also suggests that in men and women with longer-than-average limbs, it is tibial growth that has outperformed femoral growth prior to physeal closure.
With the routine use of digital radiography, the addition of CT imaging may not be necessary in the evaluation of limb length discrepancy without associated severe rotational or angular deformity [2,8]. Guggenberger et al. measured lower limb lengths for 51 pre-operative patients scheduled for knee arthroplasty [2]. Using supine CT and standing full-length radiography, they found no difference between imaging modalities, reporting a difference in mean limb length measurements of only 0.2 cm. The authors concluded that for clinical purposes, the two sets of measurements, obtained from two different imaging methods, are essentially interchangeable.
In cases where standing full-length radiography is the chosen imaging modality for evaluating lower limb length discrepancy, the results of this study may be used as a normative reference for limb length and proportions in adults.

Funding

This research received no external funding.

Institutional Review Board Statement

Ethical review and approval were waived for this study, due to the use of anonymized patient data collected as part of routine care for separate purposes.

Informed Consent Statement

Not applicable.

Conflicts of Interest

The author declares no conflict of interest.

References

  1. Strecker, W.; Keppler, P.; Gebhard, F.; Kinzl, L. Length and torsion of the lower limb. J. Bone Jt. Surg. Br. 1997, 79, 1019–1023. [Google Scholar] [CrossRef]
  2. Guggenberger, R.; Pfirrmann, C.W.; Koch, P.P.; Buck, F.M. Assessment of lower limb length and alignment by biplanar linear radiography: Comparison with supine CT and upright full-length radiography. Am. J. Roentgenol. 2014, 202, W161–W167. [Google Scholar] [CrossRef] [PubMed]
  3. Kellgren, J.H.; Lawrence, J.S. Radiological assessment of osteo-arthrosis. Ann. Rheum. Dis. 1957, 16, 494–502. [Google Scholar] [CrossRef] [PubMed] [Green Version]
  4. Sabharwal, S.; Zhao, C.; McKeon, J.; Melaghari, T.; Blacksin, M.; Wenekor, C. Reliability analysis for radiographic measurement of limb length discrepancy: Full-length standing anteroposterior radiograph versus scanogram. J. Pediatric Orthop. 2007, 27, 46–50. [Google Scholar] [CrossRef] [PubMed]
  5. Cicchetti, D.V. Guidelines, criteria, and rules of thumb for evaluating normed and standardized assessment instruments in psychology. Psychol. Assess. 1994, 6, 284–290. [Google Scholar] [CrossRef]
  6. Herscovici, D., Jr.; Scaduto, J.M. Assessing leg length after fixation of comminuted femur fractures. Clin. Orthop. Relat. Res. 2014, 472, 2745–2750. [Google Scholar] [CrossRef] [PubMed] [Green Version]
  7. Vaidya, R.; Anderson, B.; Elbanna, A.; Colen, R.; Hoard, D.; Sethi, A. CT scanogram for limb length discrepancy in comminuted femoral shaft fractures following IM nailing. Injury 2012, 43, 1176–1181. [Google Scholar] [CrossRef] [PubMed]
  8. Ng, V.Y.; Kean, J.R.; Glassman, A.H. Limb-length discrepancy after hip arthroplasty. J. Bone Jt. Surg. Am. Vol. 2013, 95, 1426–1436. [Google Scholar] [CrossRef] [PubMed]
  9. O’Brien, S.; Kernohan, G.; Fitzpatrick, C.; Hill, J.; Beverland, D. Perception of imposed leg length inequality in normal subjects. Hip. Int. 2010, 20, 505–511. [Google Scholar] [CrossRef] [PubMed]
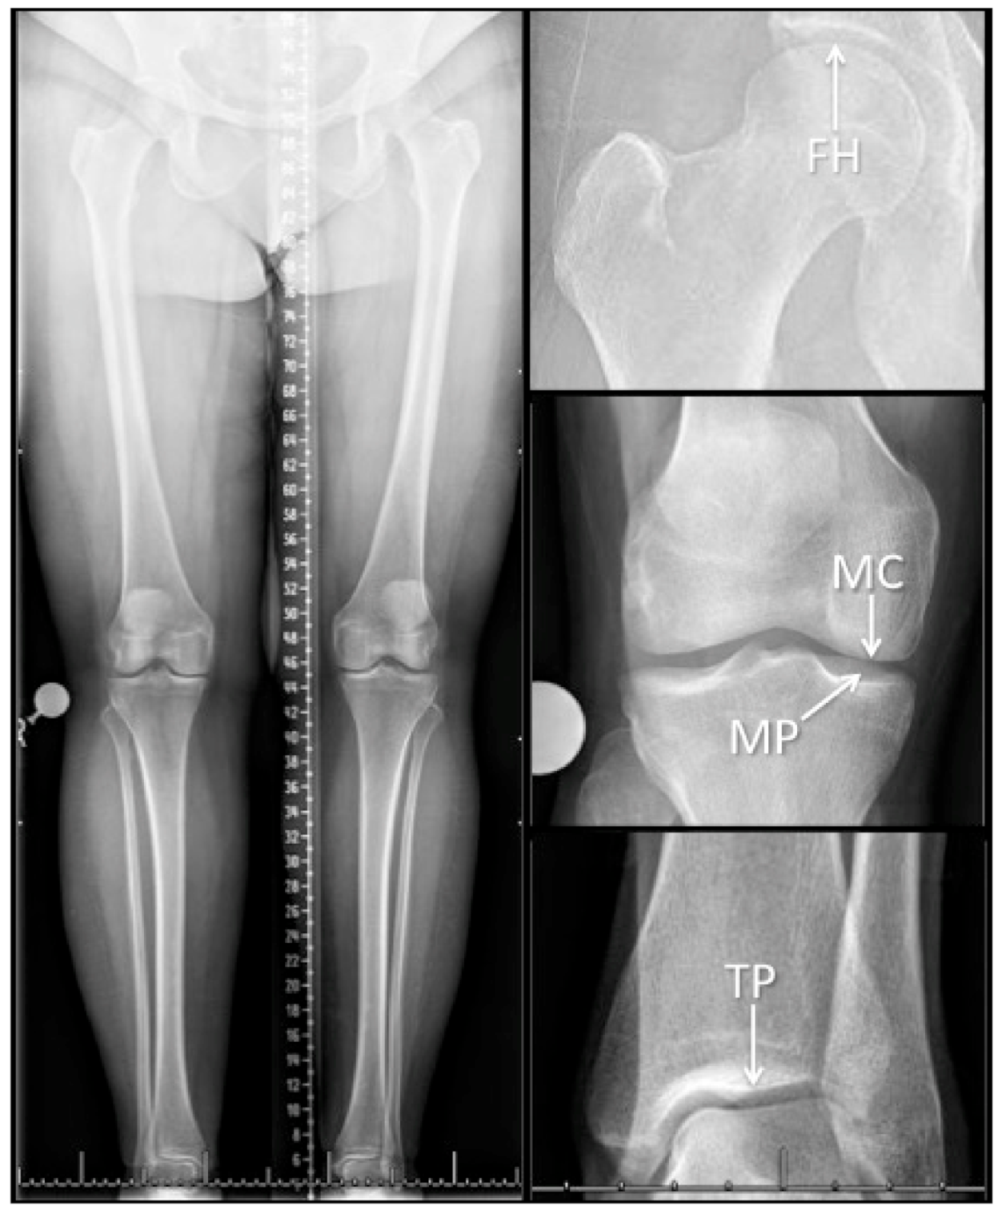
Figure 1. An example of a standing full-length radiograph, and the radiographic measurement reference points employed for this study. FH, top of femoral head; MC, center of medial femoral condyle; MP, center of medial tibial plateau; TP, center of tibial plafond.
Osteology 01 00009 g001
Figure 2. The distribution of limb length, femoral length, and tibial length in 1077 adult limbs.
Osteology 01 00009 g002
Figure 3. The distribution of the differences in limb length (a), femoral length (b), and tibial length (c) in 324 paired adult limbs.
Osteology 01 00009 g003
Figure 4. The relationship between tibial length and the femorotibial ratio in 1077 adult limbs.
Osteology 01 00009 g004
Table 1. The details of patients and lower limbs included in the analysis.
Men (n = 459)Women (n = 294)
Age group (n, %)
15–29 years61 (13)44 (15)
30–49 years153 (33)77 (26)
50–69 years163 (36)99 (34)
70+ years82 (18)74 (25)
Both limbs183 (40)141 (48)
measured (n, %)
Excluded limbs (n, %)
Open physes9 (3)3 (2)
Congenital/tumor2 (1)2 (1)
Previous fracture31 (11)15 (10)
Knee arthritis234 (85)133 (87)
Total276 (100)153 (100)
Publisher’s Note: MDPI stays neutral with regard to jurisdictional claims in published maps and institutional affiliations.