1. Introduction
1.1. Policy Failure: Road Transport
Transport needs to be decarbonised, but progress has been slow. Transport is on its way to becoming the single largest sectoral source of carbon emissions in major economies, with road transport being the key problem. If road transport does not deliver greenhouse gas (GHG) emission reductions, other sectors will face a higher burden of enabling the 2-degree target to be met, let alone the 1.5-degree target aspired to in the Paris Agreement.
Electrifying road transport arguably seems to be the future, but the existing vehicle fleet will also need to be decarbonised. Most vehicles on the road until 2030 and well beyond will run on liquid fuels, and solutions will need to be found for their fossil fuel consumption. It is projected that oil will continue to dominate transport fuel use in 2030—even in the ambitious Net Zero Emissions Scenario by the IEA, a share of around 75% is projected [
1]. Oil use in road transport will need to be replaced, and alternative fuels have been put forward as a solution. The most prominent alternative fuel has been biofuel, and conventional ethanol in particular [
2,
3,
4].
1.2. Cost Matters
A range of decarbonisation technologies are available in transport, but few offer competitive costs. Some technologies come with high carbon abatement costs, and therefore, their prospects are limited. Mature and inexpensive technologies are in short supply. The carbon abatement cost of transport decarbonisation is a key metric for gauging whether or not a policy is cost-effective [
5].
History shows that the transparency of policy tools on cost to society matters. In 2018, the gilet jaunes (yellow vest) movement protested against France’s climate-appropriate fuel taxes, a recent example of climate plans being derailed by public protests. This shows that societal support for the chosen measures is key to achieving climate targets. It appears that for a policy measure to gain public support, society needs to have an understanding of what to expect in the future.
1.3. Policy-Making Process
Policies are generally based on modelling. The aim of econometric modelling is to advise and support policy-making. PRIMES is a key policy assessment tool for the European Union (EU). It is an energy system model with a modular structure that includes the PRIMES-TREMOVE transport model and the PRIMES Biomass supply model.
PRIMES is a private econometric model, meaning the general public and stakeholders, including researchers, have no access to it. Therefore, the scope for conducting a critical review of the modelling and the impact assessments based on the PRIMES modelling results is limited.
The European Commission (EC) relies on the PRIMES econometric model for much of its EU energy and climate legislation. The model has been used extensively in impact assessments supporting key transport policies at the EU level, including:
The 2011 White Paper on Transport;
The Low-Carbon Economy and Energy 2050 Roadmaps;
The 2030 policy framework for climate and energy;
The recast of the Renewables Energy Directive (RED II);
The European Strategy on Low-Emission Mobility;
The proposal for the post-2020 CO2 emission standards for cars and vans and for the implementation of CO2 standards on truck manufacturers in the EU;
The “Clean Planet for All” Communication;
The scenarios elaborated as part of the EU Climate Target Plan (CTP).
The EC presented the European Green Deal as its strategic plan to achieve climate neutrality by the middle of the century [
6]. In 2020, with the 2030 Climate Target Plan (CTP) [
7], the EC proposed raising the EU’s goal to reduce GHG emissions to at least 55% below 1990 levels by 2030. The aim of the CTP was to set a more ambitious and cost-effective path to achieving climate neutrality by 2050.
The impact assessment accompanying the CTP proposal prepared the ground for adapting climate and energy policies to help decarbonise the European economy (CTP IA) [
8]. Accordingly, the aim of the CTP IA was to show how all sectors of the economy and society can contribute and to set out the policy actions required to achieve this goal. In 2021, partly based on the findings of the CTP IA, the EC adopted a series of legislative proposals under the European Green Deal, including a proposal for revising the RED II.
The Energy Governance Regulation [
9] states that “cost-effective deployment of renewable energy is one of the key objective criteria for assessing Member States’ contributions”. The Energy Governance Regulation requires all EU Member States to generate integrated National Energy and Climate Plans (NECPs), which need to lay out what they will do until 2030. The EC is meant to evaluate the plans presented in each NECP to determine whether these plans comply with EU regulations and the Paris Agreement. In this respect, NECPs are illustrative in terms of outlining actionable progress towards meeting climate and energy targets, including transport decarbonisation.
With the European Green Deal as a blueprint, in July 2021, the EU presented its climate package called Fit for 55, including a proposal for revising the RED II [
10], which contains a carbon abatement cost calculation for some transport fuels. The figures presented, partly based on PRIMES, show that the carbon abatement cost of ethanol is in the range of about 220–390 EUR/tCO2eq, while that of biodiesel is about 190–420 EUR/tCO2eq. Cellulosic ethanol is shown to have a carbon abatement cost of about 320–490 EUR/tCO2eq, and advanced liquid biofuels are in the range of about 270–520 EUR/tCO2eq (see Figure 25 [
10]). Electromobility and biomethane were notable omissions. Importantly, the figures are not referred to in the text, and conclusions were not drawn. The background document concludes that “advanced biofuels, based on their higher GHG savings compared to conventional biofuels, have lower GHG reduction costs than food and feed crop-based conventional biofuels. This provides a major motivation for providing policy support to these fuels” [
11].
1.4. Inadequate Transparency in EU Background Modelling
PRIMES is frequently updated to include the latest information on technical and economic parameters. Being a private model, the PRIMES database and technical/economic assumptions, as well as the detailed methodology applied in the modelling, are not made public.
The EC states that PRIMES previously underwent a peer review and refers to a 2011 Commission staff working paper (SEC(2011)1569) [
12]. In the subsequent decade, however, to the best of our knowledge, PRIMES has not been scrutinised by the EC.
1.5. Literature Review on Cost
A scientific literature review yields only a limited number of publications. As far as we are aware, no peer-reviewed paper has estimated the carbon abatement cost of mitigation options in transport in the EU.
The IPCC is a generic scientific body that tends to base its findings on literature reviews. The IPCC shows that a range of options are available in the transport sector with substantial potential to reduce GHG emissions by 2030. Mitigation cost estimates vary, and for biofuels, they are below 100 USD/tCO2eq, with some options for as low as 0–20 USD/tCO2eq [
13].
In terms of grey literature, there have been a few reports on the cost of transport decarbonisation. In 2017, McKinsey updated its global greenhouse gas abatement cost curve and estimated that both first- and second-generation biofuels come with a negative cost, along with full hybrid cars [
14]. Roland Berger assessed the well-to-wheel GHG abatement costs for a range of transport options in 2030 and found that blending E10 (a fuel containing up to 10% ethanol) into petrol has a carbon abatement cost below 100 EUR/tCO2eq, and battery electric vehicles have costs above 200 EUR/tCO2eq [
15]. Ecofys found that in Central and Eastern Europe, the carbon abatement cost of electric vehicles is expected to fall below 200 EUR/tCO2 by 2030, and the cost of conventional biofuels to around 20 EUR/tCO2 [
16].
2. Materials and Methods
This paper presents a substantial revision of the PRIMES model concerning the methodology used for the treatment of biofuel production. The model revision includes updates on the characterisation of biofuels in terms of production costs and emissions, and in particular, on the techno-economic data of starch-based bioethanol production.
Crucially, as we learned during our research, PRIMES modelling does not take co-product credits into account. The production of biofuels is considered in the model without any of its co-products.
The revised model, the results of which are presented herein, reflects the realities of biofuels and the modern ethanol industry in particular, and therefore, the impacts are allocated to all the co-products, not just to biofuels.
The EC has used the PRIMES model for more than a decade to back up its policy proposals. The CTP IA reviews all the policy options to decarbonise transport.
Our modelling follows the CTP IA and its reference scenarios. The CTP IA had a central scenario called MIX (Part 2 in [
8]). In our research project, the modellers used the PRIMES model to assess a scenario called
Counterfactual built on the policy setup and climate ambition scope of the MIX scenario (
MIX CTP) [
17]. To ensure comparability, the counterfactual scenario was designed to remain identical to MIX except for the data updates and methodological corrections to better reflect biofuel market realities.
Our initial objective was to ensure that inputs to the PRIMES model were based on up-to-date market, industrial, and agricultural data. It needs to be emphasised that the author was not granted access to the detailed workings of the PRIMES model. Rather, some insights were gradually gained in an iterative process. The inner workings of PRIMES were never completely revealed. The model largely remains a “black box”, yet important methodological details, including the data inputs and assumptions used, were uncovered during the iterative process. As more and more data exchanges took place, some methodological issues surfaced. It turns out that the assumptions used in PRIMES were also important to review along with the quality of the data input.
Given that some limited overview of the PRIMES model was gradually revealed, the following areas were identified as being of key importance:
Production pathways (starch-based ethanol);
Production cost of biofuels, and ethanol in particular;
Yields (efficiency of conversion processes);
Treatment of co-products (allocation of impacts);
Choices of co-product allocation (no allocation, energy-based and replacement-cost-based allocation);
Emission factors.
The latest available market and industry data were sought and subsequently entered into the revised PRIMES model. Input prices, such as feedstocks, were updated. Production cost estimates and process yields were contrasted with the industry data. The pre-processing costs of primary biomass from farm to biofuel plant were updated. The cost structure of the production process and yields of conversion were revised to reflect the latest industrial realities, including recent improvements in industrial efficiency.
Table 1 shows the biofuel production costs as inputs to the revised PRIMES.
The PRIMES model assumes the production of biofuels without co-products. “As PRIMES Biomass supply operates in a broader modelling context, and to avoid double-counting of elements addressed by other models, co-products related with markets outside the energy system are typically not accounted for” [
17].
Given the realities of biofuel production, our modelling assumes the production of co-products. Accordingly, a co-product credit based on DDGS and corn oil production was introduced for corn ethanol (starch-based ethanol). Likewise, the co-products of sugar-based ethanol (sugar beet) and oil-based biodiesel (rapeseed) were also accounted for. The model was thus revised to include co-production and allocate part of the emissions from each pathway between biofuels and co-products.
For the treatment of co-products, the revised PRIMES model uses the replacement cost method. There is a valid choice between the energy-based and replacement-cost-based allocation of impacts to co-products, with the former having the advantage of conforming with EU regulations in general (see RED II), while the latter is deemed more appropriate to better represent market realities. The replacement cost method is defined as seeking the most appropriate substitute of the given product available on the market and taking its price as a proxy. Our choice for the replacement cost method is justified by the nature of co-products, including animal feed (DDGS) and oils, as they are marketed and priced based not on their energy content but on their protein content and other components. In general, the co-products of ethanol production do not belong to the category of energy commodities.
Allocation between primary product and co-products led to about 40% of emissions shifting to co-products for starch-based ethanol. In the case of biodiesel, the shift was similarly large, about 30–40%, while for sugar-based ethanol, a modest 10% (see
Table 2).
Lastly, the emission factors were reviewed. Emission factors are a function of feedstock cultivation emissions, including from fertiliser application, and process or conversion emissions, such as from the energy used at the plant.
PRIMES may include indirect land use change (ILUC) impacts as exogenous inputs. Given the “black box” nature of PRIMES and lack of access to programming, our revision could not go as far as including ILUC impacts in PRIMES model runs.
PRIMES uses wheat as the reference pathway for bioethanol. Given that corn ethanol is the main crop-based ethanol in Europe, the updated model was shifted from wheat to corn. All techno-economic parameters of corn-based ethanol production were updated, including capital costs, fixed costs, process efficiency, energy inputs, and fertiliser input for corn production.
Despite the updates on the data and assumptions being significant and wide-ranging (see
Table 2), the updated modelling is still the result of PRIMES model runs. It must be noted that modellers found the “data and assumptions provided as well-grounded” [
17].
3. Results
3.1. National Energy and Climate Plans
NECPs set out how EU countries will contribute to the EU-wide climate and energy targets from 2021 to 2030. The EC published its assessment of the cumulative impact of the 27 NECPs in September 2020, in parallel with the proposals for CTP. The EC found that the NECPs provide “a clear signal from Member States that they back a … cost-effective transition to a resilient carbon neutral economy” [
18]. It is unclear what the basis of such a finding was, given that the cost of transport decarbonisation is not mentioned in the document, and it also does not include any reference to cost calculations or their necessity.
We examined the plans, targets, policy tools, and initiatives for the transport sector in each NECP. Based on our analysis, the NECPs submitted to the Commission in 2019 and 2020 [
19] were found to be weak in their cost assessment. The cost of transport decarbonisation was only discussed in three NECPs in some detail (Finland, Italy, and Spain). No NECPs contained a ranking based on the costs of the transport decarbonisation options.
One of the most useful metrics of cost-effectiveness is the carbon abatement cost. All NECPs were found to lack a carbon abatement cost calculation. We found no evidence of efforts to calculate, in a systematic way, the cost of CO2 abated in the transport sector until 2030. We believe that in the absence of such estimates, it is difficult to compare the merits of transport decarbonisation technologies and assess the cost-effectiveness of transport plans at the EU level.
3.2. Impact Assessment for CTP
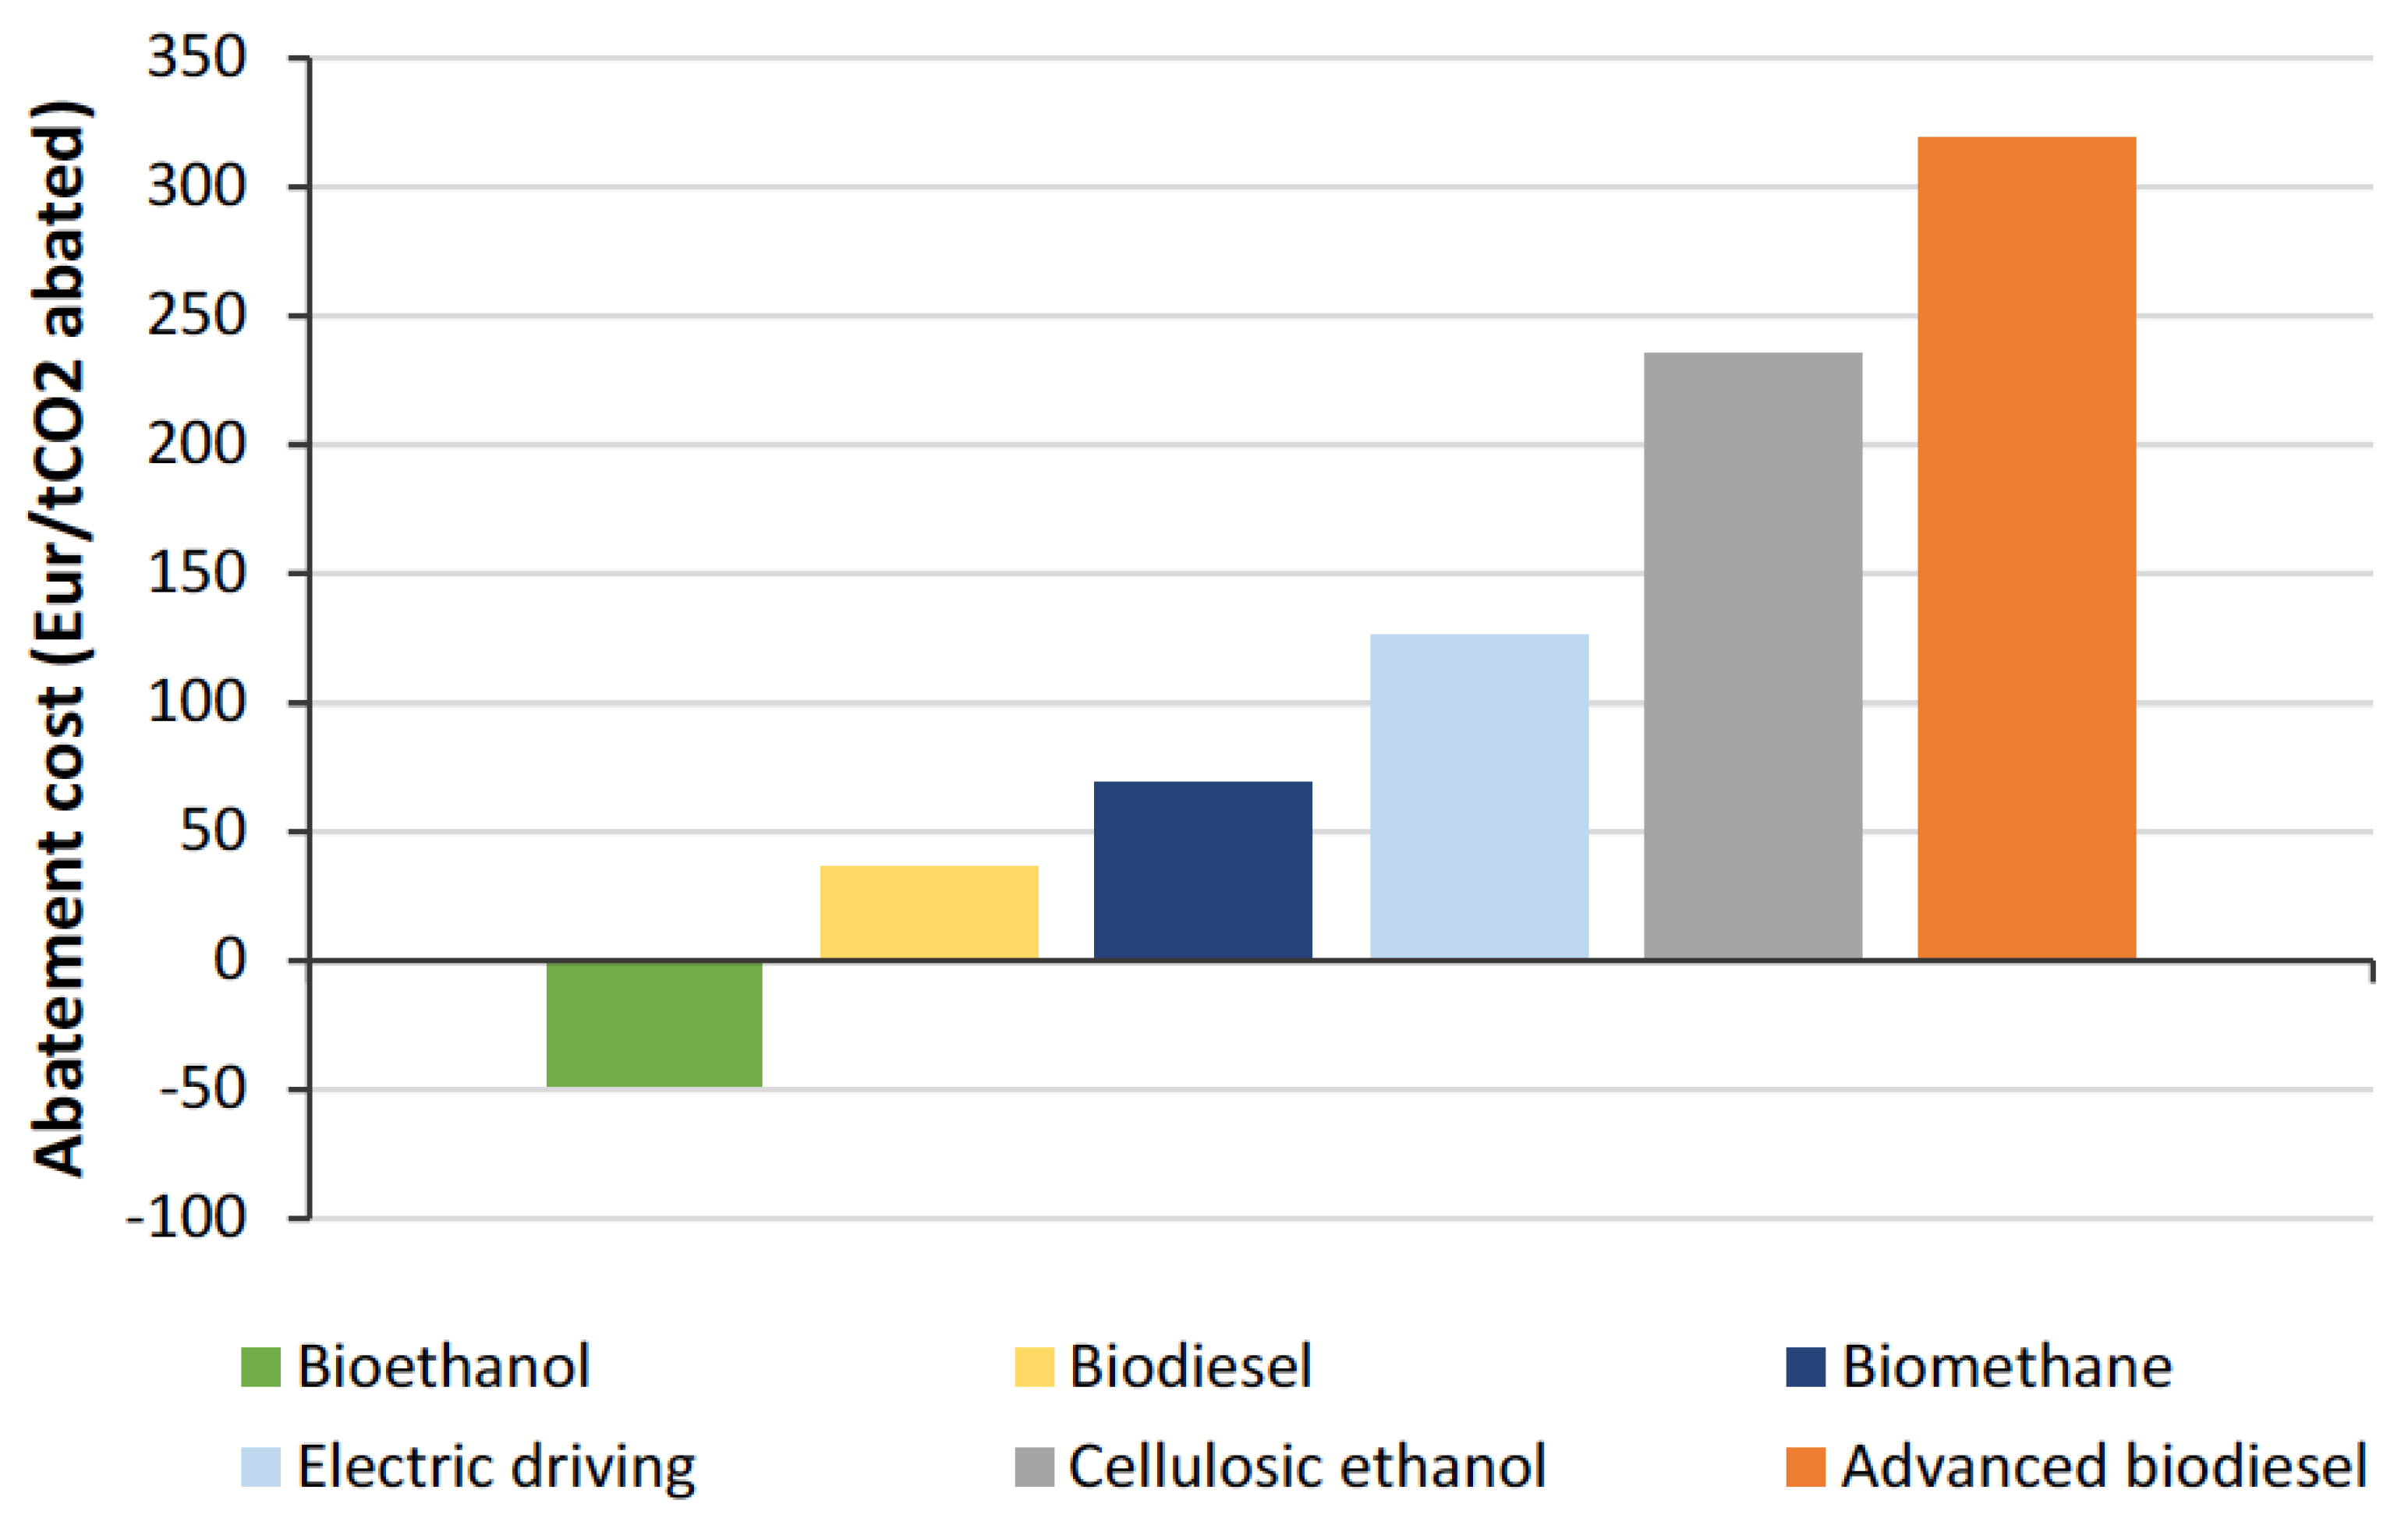
The revised PRIMES model offers information on the carbon abatement cost of road transport calculated for the EU-27. The results are broken down by major technologies (crop ethanol, biodiesel, biomethane, advanced biofuels, electricity; see
Figure 1).
The modelling found that crop-based bioethanol has negative abatement costs. Biodiesel and biomethane were found to have costs below 100 EUR/tCO2eq, electromobility is in the range of 100–150 EUR/tCO2eq, while cellulosic ethanol has costs above 200 EUR/tCO2eq, and advanced biodiesel is above 300 EUR/tCO2eq.
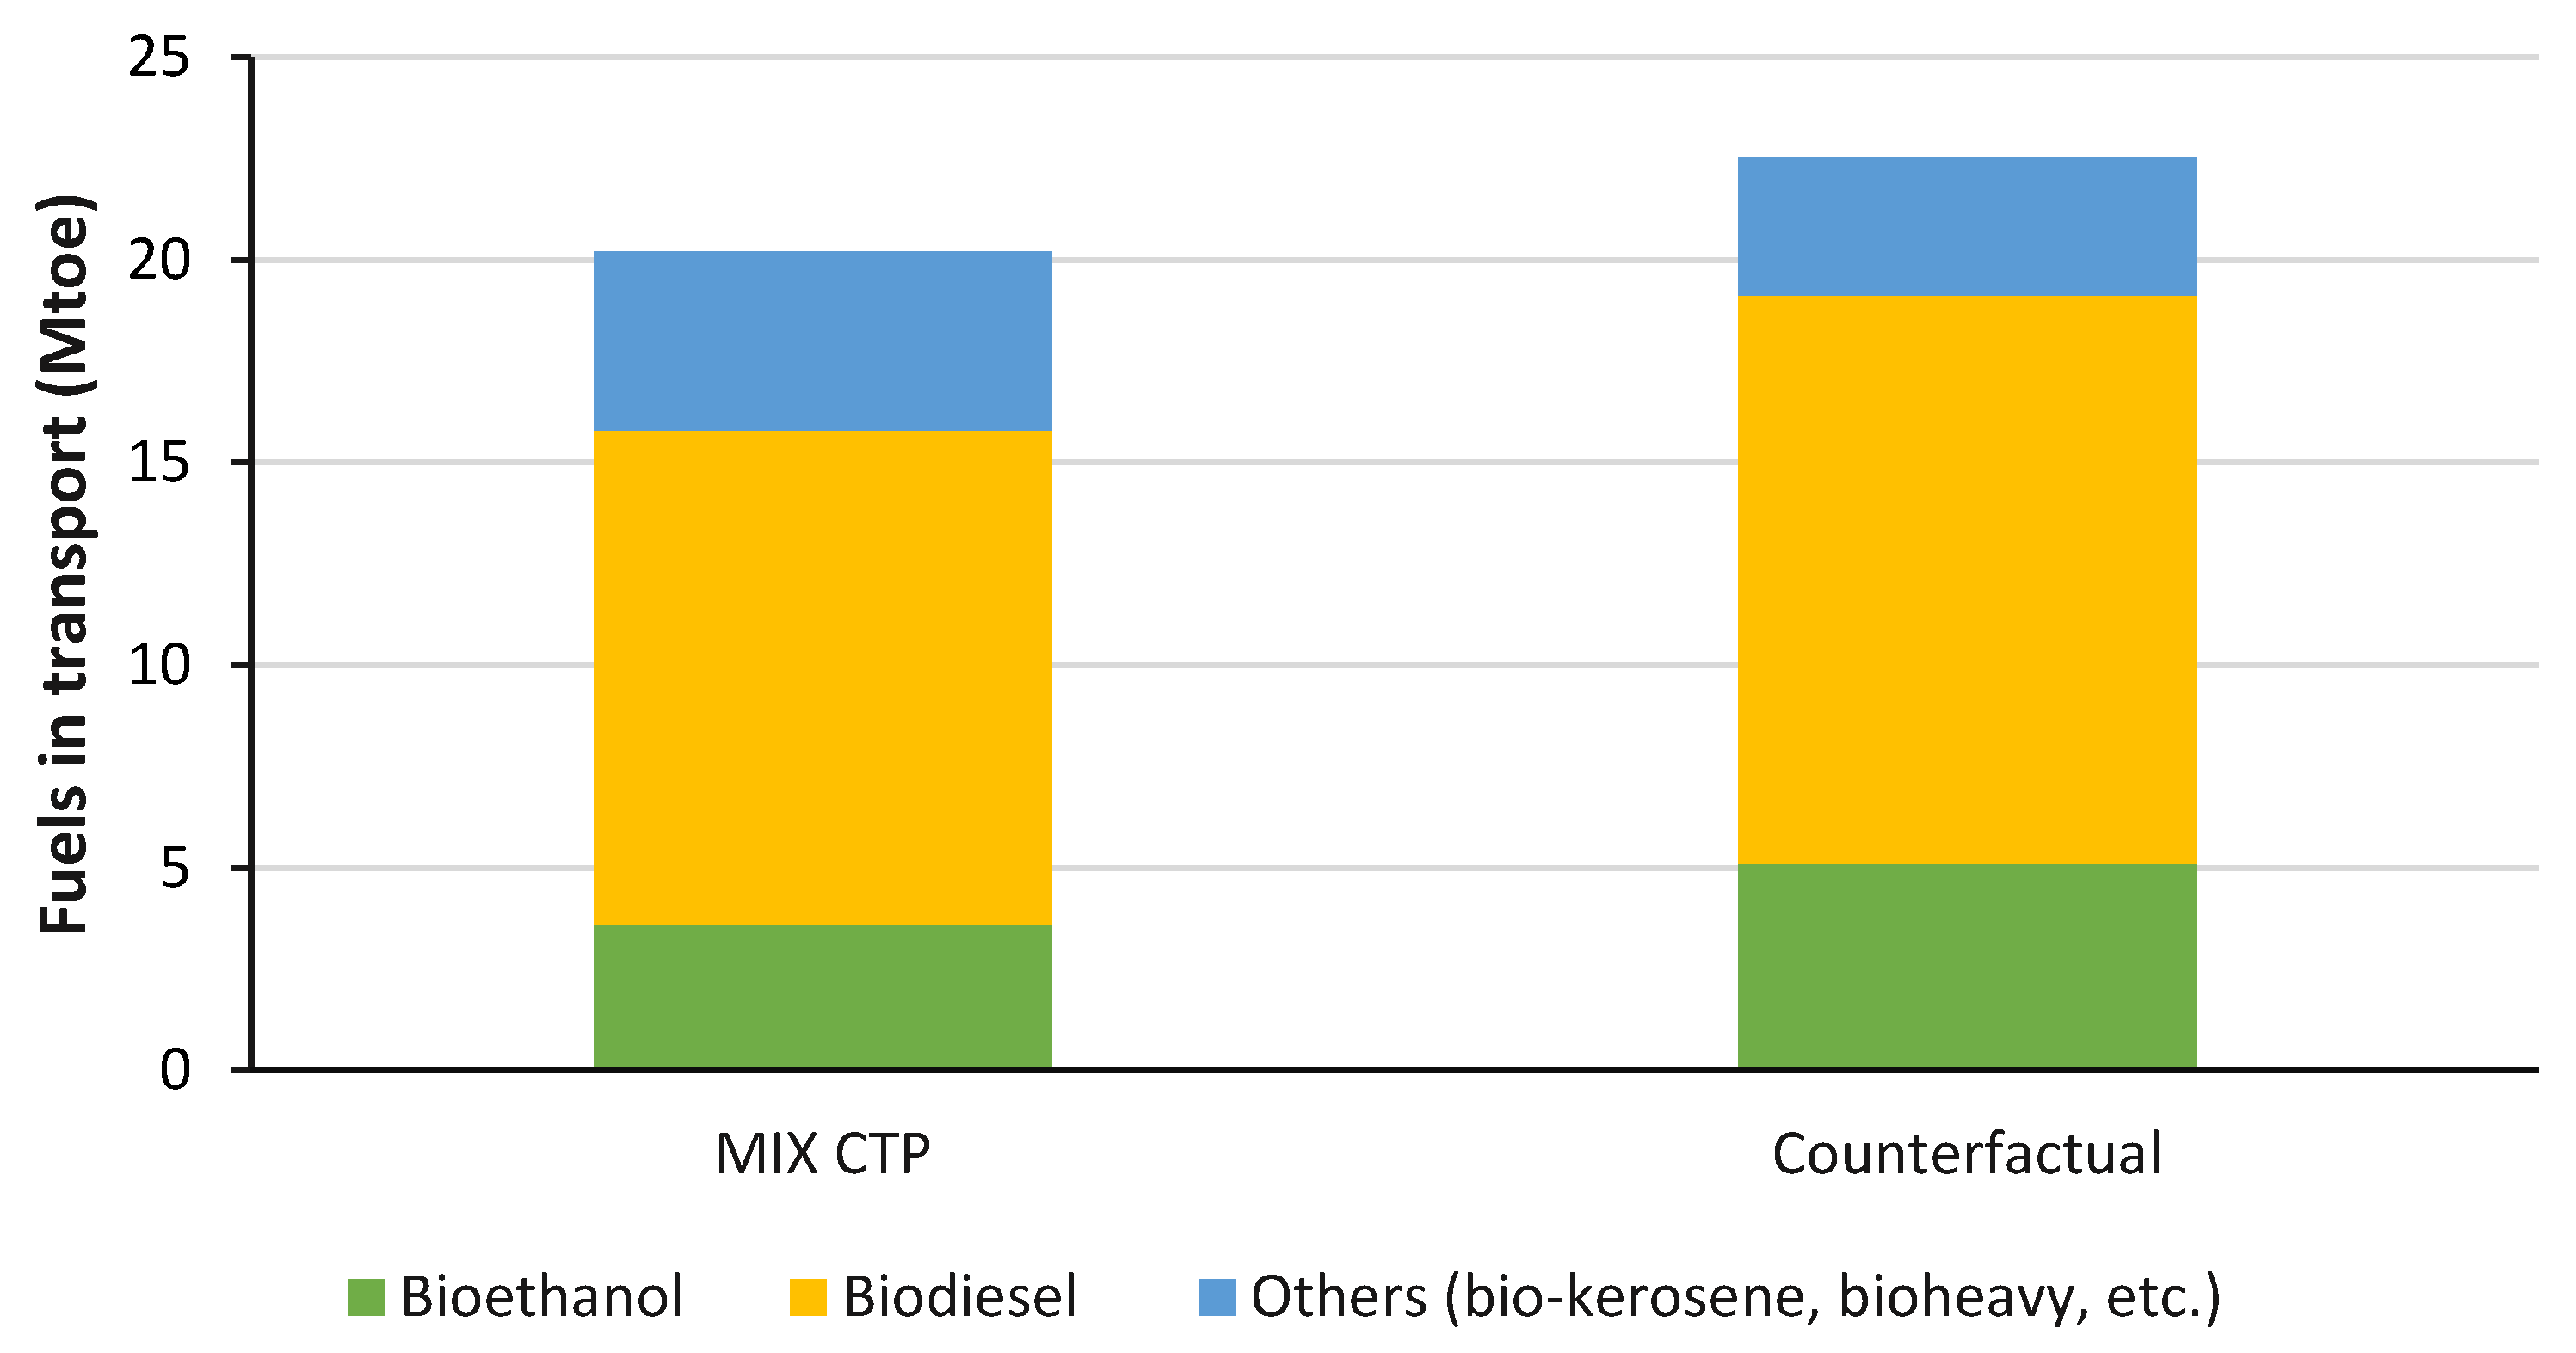
Below, the MIX CTP scenario is compared with a Counterfactual scenario, which is identical to MIX CTP but updated regarding biofuels in terms of their production costs and emissions, and in particular, in terms of the techno-economic data of starch-based bioethanol production. The results of the comparison are shown below (see
Table 3 and
Figure 2).
When the MIX CTP is revised, ethanol is shown to have a 42% increase in use in the EU by 2030, amounting to 1.5 Mtoe of extra consumption, while biodiesel consumption is increased by 15% (1.8 Mtoe).
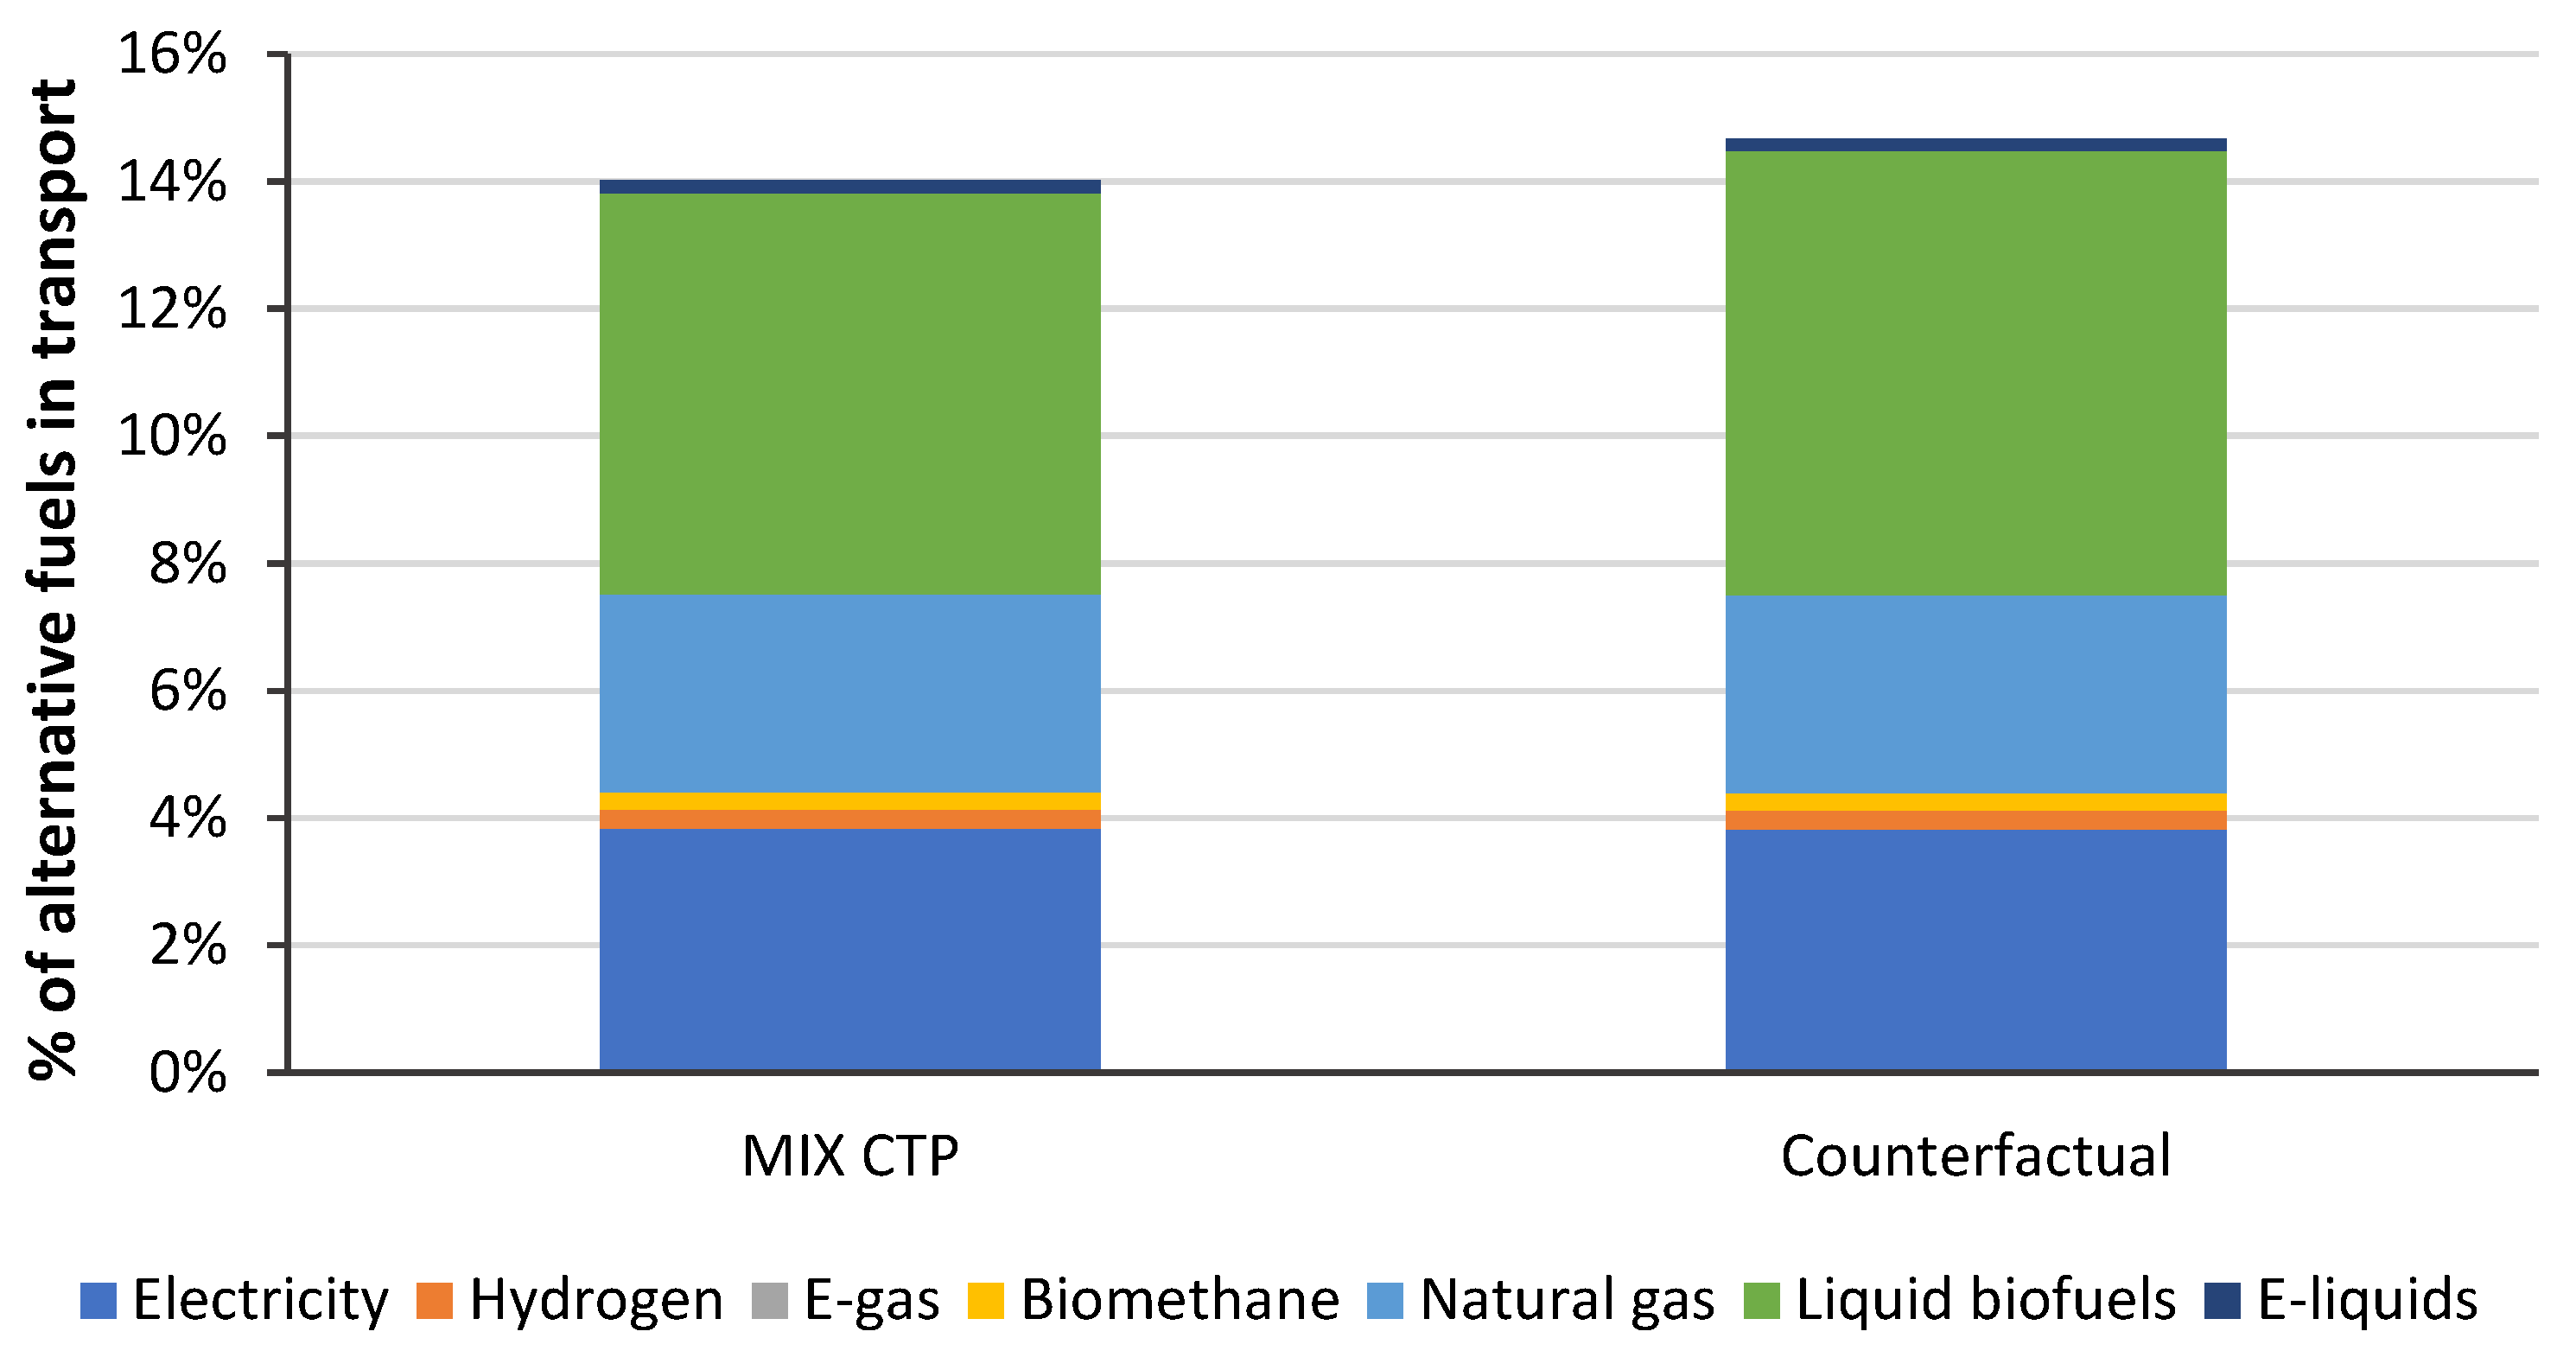
Overall, the share of alternative fuels in EU transport was found to increase from 14 to 14.7% in 2030 (
Figure 3).
4. Conclusions and Discussion
It may be concluded that the cost to society of transport plans in the EU is neglected at the policy level, and it appears that transport plans presented to the EC were not backed by underlying cost assessments. Despite cost-effectiveness being an expressed priority in energy and climate policies in the EU, in its assessment of NECPs, the EC did not explicitly request that this be included. Without cost assessments, the risk is that transport decarbonisation efforts in the EU may become unnecessarily costly.
There is poor transparency with respect to the inputs to PRIMES and the underlying assumptions, as well as on exactly how the PRIMES model derives its outputs. To avoid PRIMES modelling being seen as a “black box”, more transparency is needed.
Exchanges with the modellers and model-run iterations revealed deficiencies concerning biofuels in the PRIMES model, one of which was the treatment of biofuels considered without co-products. When corrected, we believe the results provide a more realistic picture.
Crucially, except for the updates in data and the revision of assumptions, our results are based on the very model used by the EC in impact assessments. Therefore, our findings may be considered illustrative for the current and upcoming policy proposals in the EU. To the best of our knowledge, our paper is one of the first comprehensive attempts to estimate the cost of transport decarbonisation options in the EU.
Comparing the CTP IA published by the EC (MIX CTP) with updated data and methodology (Counterfactual) shows a significant change in the results. The results are substantially different; in the case of the bioethanol market share in 2030, the discrepancy amounts to 42%.
Given the significant discrepancy in the results, it is reasonable to suggest that the impact assessment process in the European Union needs to be revised. Policy implications span various energy and climate areas, including:
EU flagship policies and strategies: CTP, Green Deal, Fit for 55;
EU directives: RED II and its revision, Effort Sharing Regulation, Energy Taxation (revision of ETD) and the proposed Carbon Border Adjustment Mechanism;
EU member states’ transport policies.
Our findings shed light on the varying cost levels associated with different decarbonisation options in the road transportation sector.
In the Fit for 55 and related directives, such as the RED II under revision, the EC proposed to limit the contribution of crop-based biofuels, increase the share of advanced biofuels, and emphasise electric vehicles. In contrast, our results suggest that the most cost-effective approach would be to rely more on crop biofuels (in particular, ethanol, given its lowest calculated carbon abatement cost), recognise biomethane as the most cost-effective advanced biofuel, and emphasise electric vehicles.
The limitations of our efforts to revise the PRIMES model range from the inability to include ILUC impacts to potential hidden methodological issues. PRIMES may contain further methodological deficiencies beyond those identified in our research. Other fuel pathways, such as hydrogen, could also be considered. Further research is needed to provide a more complete picture.
The calculation of marginal emission savings per fuel type does not include the well-to-tank aspects in the PRIMES model. Therefore, our paper does not discuss changes in GHG emissions as a result of the model revision. By including full life-cycle aspects, the findings could be informative as to the scale of expected changes in transport-related GHG emissions.
Since the start of the war in Ukraine in early 2022, the price environment has changed radically in Europe. Key inputs to biofuel productions, such as natural gas used for process energy or grains such as corn, have seen a sharp increase in prices. Also, the price of electricity has increased in various EU countries. The former has made biofuel production more costly, while the latter may have made electromobility less cost-competitive; however, the picture is murky, as many governments have attempted to shield households and/or businesses from the impact of higher prices. All the while, the price of oil, the benchmark fuel in transport, has increased less in comparison. It must be noted that prices of commodities were already volatile in 2021, and 2022 saw the price volatility of most relevant inputs to transport fuels at a level not seen for more than a decade. These changes are not reflected in our paper.
The markedly changed price environment necessitates a re-evaluation of the cost of transport decarbonisation options. Our paper suggests that the cost of transport decarbonisation options warrants the attention of policy-makers.


