

Long-Term Care Home Size Association with COVID-19 Infection and Mortality in Catalonia in March and April 2020


Abstract
:1. Introduction
2. Materials and Methods
Statistical Analyses
3. Results
3.1. Bivariate Analyses: COVID-19 Infection as an Outcome
3.2. Bivariate Analyses: COVID-19 Mortality as an Outcome
3.3. Multivariate Analyses: COVID-19 Infection as an Outcome
3.4. Multivariate Analyses: Proportion of LTCHs with COVID-19 Mortality
3.5. Multivariate Analyses: Number of COVID-19 Deaths in LTCHs
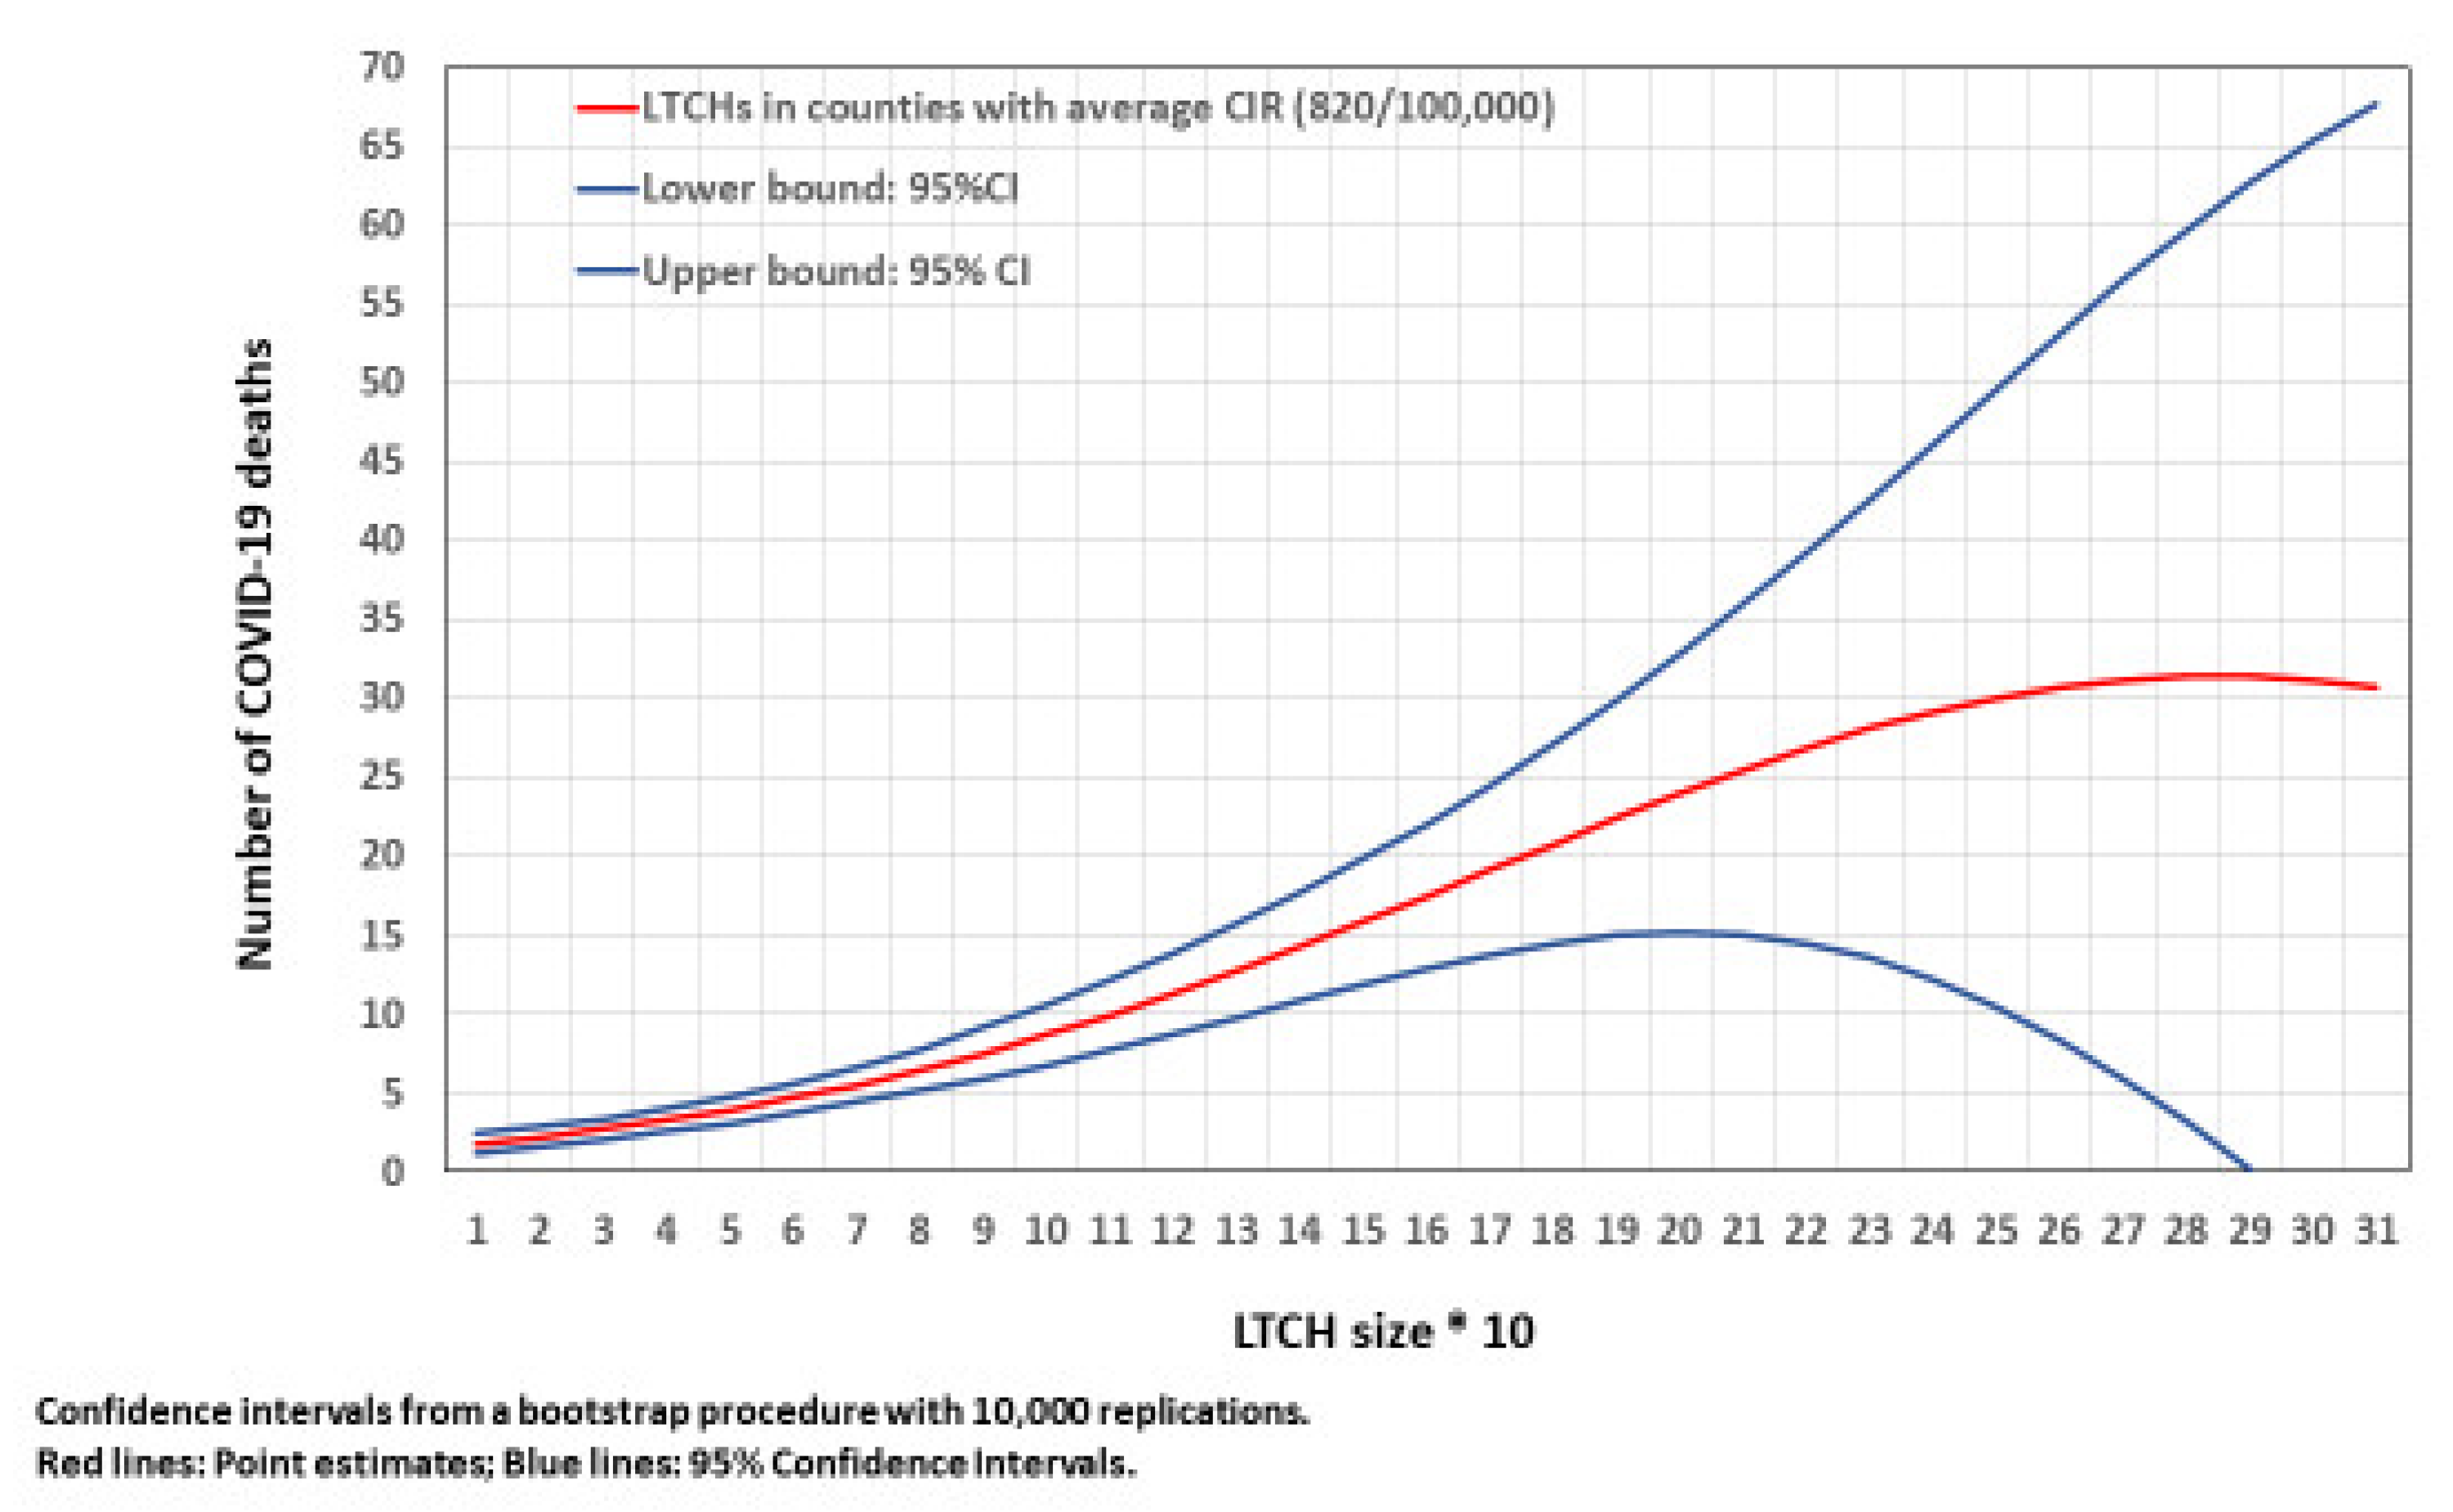
3.6. Number of COVID-19 Deaths in an LTCH by LTCH Size at the Average County COVID-19 CIR
3.7. Number of COVID-19 Deaths in an LTCHs by LTCH Size Differed with County COVID-19 CIR Levels
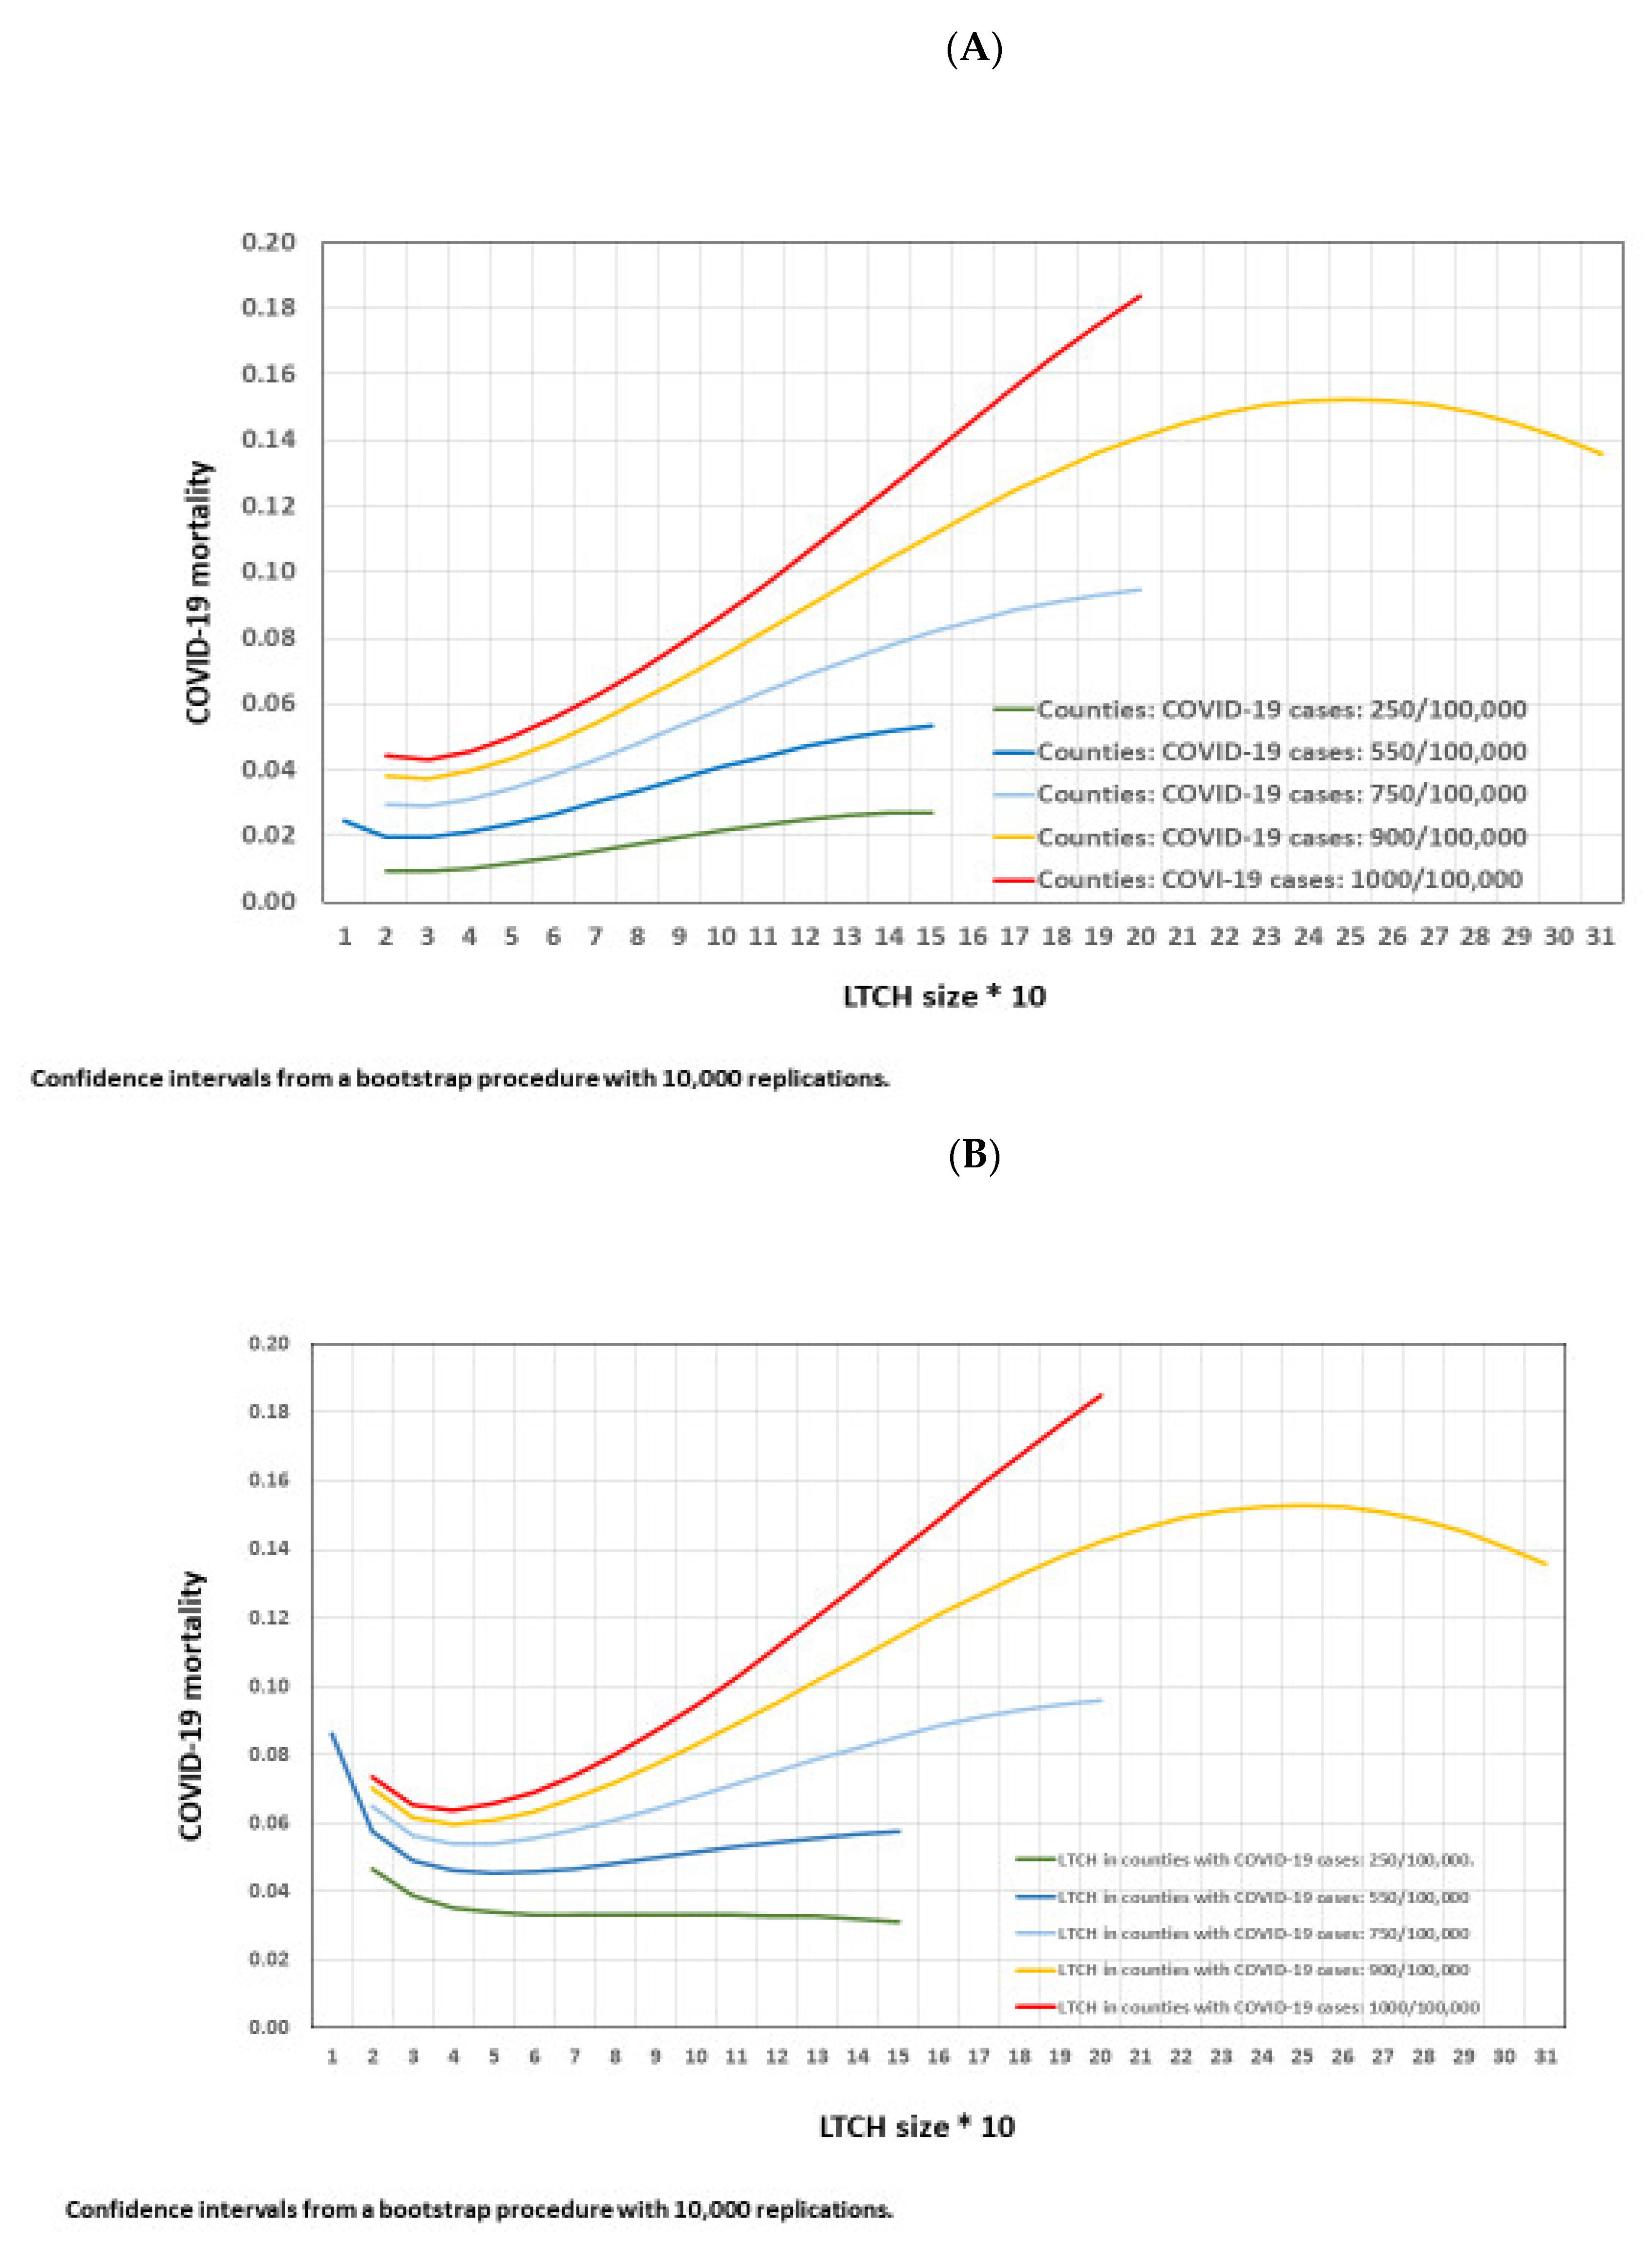
3.8. COVID-19 Mortality at an LTCH by LTCH Size According to Five Levels of County COVID-19 CIR
4. Discussion
4.1. Summary of Results
4.2. Interpretation of Results Based on Available Literature
4.3. Study Limitations
5. Conclusions
Author Contributions
Funding
Institutional Review Board Statement
Informed Consent Statement
Data Availability Statement
Acknowledgments
Conflicts of Interest
Appendix A

| Unadjusted | Adjusted-I | Adjusted-II | ||||
|---|---|---|---|---|---|---|
| Coeff. | 95% CI | Coeff. | 95% CI | Coeff. | 95% CI | |
| Intercept | −0.324 | −0.721–0.181 | −2.965 | −3.768–2.362 | −2.853 | −3.581–−2.244 |
| LTCH size | 0.158 | −0.039–0.284 | 0.237 | 0.186–0.305 | 0.241 | 0.164–0.330 |
| LTCH size 2 | 0.002 | −0.006–0.018 | n.s. | n.s. | n.s. | n.s. |
| LTCH type | ||||||
| For profit, completely privately administered | -- | -- | Ref. | Ref. | Ref. | Ref. |
| Generalitat, publicly administered | -- | -- | 0.156 | −0.981–1.702 | n.s. | n.s. |
| Generalitat, indirectly administered | -- | -- | 0.684 | −0.146–1.783 | n.s. | n.s. |
| Other public institutions, publicly administered | -- | -- | 0.359 | −0.312–1.053 | n.s. | n.s. |
| Other institutions, indirectly administered | -- | -- | 0.424 | −0.555–2.615 | n.s. | n.s. |
| For-profit, with rented places | -- | -- | 0.282 | −0.293–0.942 | n.s. | n.s. |
| Nonprofit, with rented places | -- | -- | 0.445 | −0.317–1.428 | n.s. | n.s. |
| Nonprofit, completely privately administered | -- | -- | 0.202 | −0.211–0.626 | n.s. | n.s. |
| County population | -- | -- | 0.035 | 0.011–0.058 | 0.033 | 0.010–0.056 |
| County CIR/100,000 | -- | -- | 0.250 | 0.173–−0.347 | 0.241 | 0.178–0.330 |
| Goodness of fit | Test-1 (1) | Test-2 (2) | ||||
| −2 * Log Likelihood | 1177.6 | 1056.7 | 1061.3 | |||
| Degrees of freedom | 3 | 11 | 4 | |||
| Chi square difference of −2 * log likelihoods | 120.9 * | 4.6 | ||||
| Degrees of freedom difference | 8 | 7 |
| Part 1. Logistic Regression: Absence of COVID-19 Infection by LTCH Size | ||||||||
|---|---|---|---|---|---|---|---|---|
| Unadjusted | Adjusted-I | Adjusted-II | Significant Interactions | |||||
| Coeff. | 95% CI | Coeff. | 95% CI | Coeff. | 95% CI | Coeff. | 95% CI | |
| Intercept | −0.643 | −1.402–−0.153 | 0.897 | 0.034–1.995 | 1.097 | 0.196–1.954 | 1.097 | 0.196–2.121 |
| LTCH size | −0.138 | −0.277–0.141 | −0.165 | −0.263–−0.097 | −0.159 | −0.239–−0.107 | −0.159 | −0.239–−0.096 |
| LTCH size 2 | −0.021–0.008 | n.s. | n.s. | n.s. | n.s. | n.s. | n.s. | |
| LTCH type | ||||||||
| For profit, completely privately administered | - | - | Ref. | Ref. | Ref. | Ref. | Ref. | Ref. |
| Generalitat, publicly administered | - | - | −0.727 | −12.627–0.799 | n.s. | n.s. | n.s. | n.s. |
| Generalitat, indirectly administered | - | - | 0.018 | −1.322–0.780 | n.s. | n.s. | n.s. | n.s. |
| Other public institutions, publicly administered | - | - | 0.278 | −0.656–1.064 | n.s. | n.s. | n.s. | n.s. |
| Other public institutions, indirectly administered | - | - | 0.499 | −9.201–2.096 | n.s. | n.s. | n.s. | n.s. |
| For profit, with rented places | - | - | 0.197 | −0.631–0.918 | n.s. | n.s. | n.s. | n.s. |
| Nonprofit, with rented places | - | - | −0.277 | −2.044–0.774 | n.s. | n.s. | n.s. | n.s. |
| Nonprofit, completely privately administered | - | - | 0.188 | −0.465–0.804 | n.s. | n.s. | n.s. | n.s. |
| County population | - | - | −0.027 | −0.061–0.007 | n.s. | n.s. | n.s. | n.s. |
| County CIR/100,000 | - | - | −0.144 | −0.275–−0.040 | −0.2 | −0.302–−0.110 | −0.200 | −0.302–−0.110 |
| Part 2: Hurdle negative binomial: Number of COVID-19 deaths by LTCH size | ||||||||
| Intercept | 0.271 | −0.118–0.562 | −0.301 | −1.003–0.295 | −0.369 | −1.076–0.102 | 0.626 | −0.475–1.696 |
| LTCH size | 0.229 | 0.175–0.313 | 0.208 | 0.148–0.296 | 0.228 | 0.175–0.299 | 0.099 | −0.038–0.227 |
| LTCH size 2 | −0.004 | −0.009–−0.002 | −0.003 | −0.008–−0.001 | −0.004 | −0.009–−0.003 | −0.004 | −0.009–0.001 |
| LTCH Type | ||||||||
| For profit, completely privately administered | - | - | Ref. | Ref. | Ref. | Ref. | Ref. | Ref. |
| Generalitat, publicly administered | - | - | 0.422 | −0.202–0.877 | n.s. | n.s. | n.s. | n.s. |
| Generalitat, indirectly administered | - | - | 0.23 | −0.122–0.528 | n.s. | n.s. | n.s. | n.s. |
| Other public institutions, publicly administered | - | - | 0.085 | −0.358–0.465 | n.s. | n.s. | n.s. | n.s. |
| Other public institutions, indirectly administered | - | - | 0.048 | −0.664–0.542 | n.s. | n.s. | n.s. | n.s. |
| For profit, with rented places | - | - | −0.236 | −0.626–0.086 | n.s. | n.s. | n.s. | n.s. |
| Nonprofit, with rented places | - | - | 0.315 | −0.059–0.617 | n.s. | n.s. | n.s. | n.s. |
| Nonprofit, completely privately administered | - | - | 0.119 | −0.259–0.434 | n.s. | n.s. | n.s. | n.s. |
| County population | - | - | −0.001 | −0.014–0.013 | n.s. | n.s. | n.s. | n.s. |
| County CIR/100,000 | - | - | 0.075 | 0.005–0.149 | 0.078 | 0.019–0.142 | −0.035 | −0.158–0.078 |
| Interactions LTCH size | ||||||||
| County Population by LTCH size | - | - | - | - | - | - | - | - |
| County CIR by LTCH size | - | - | - | - | - | - | 0.014 | 0.004–0.030 |
| Interactions LTCH size 2 | ||||||||
| Population by LTCH size 2 | - | - | - | - | - | - | - | - |
| CIR by LTCH size 2 | - | - | - | - | - | - | - | - |
| Dispersion | 1.386 | 1.030–1.877 | 1.228 | 0.884–1.578 | 1.291 | 0.960–1.719 | 1252,000 | 0.927–1.642 |
| Goodness of fit | Test-1 (1) | Test-2 (2) | Test-3 (3) | |||||
| −2 * Log Likelihood | 3382.1 | 3338.3 | 3352.8 | 3345.2 | ||||
| Degrees of freedom | 7 | 24 | 8 | 9 | ||||
| Chi squared difference of −2 * log likelihoods | 43.8 * | 14.5 | 7.5 * | |||||
| Degrees of freedom difference | 17 | 16 | 1 | |||||
References
- Zunzunegui, M. COVID-19 in Care Homes: Equity Will Be Needed to Avoid New Catastrophes. Gac. Sanit. 2022, 36, 3–5. Available online: https://pubmed.ncbi.nlm.nih.gov/34400008/ (accessed on 8 May 2022). [CrossRef] [PubMed]
- Imserso. Actualización no 72. Enfermedad por Coronavirus (COVID-19) en Centros Residenciales. 2022. Available online: https://www.imserso.es/InterPresent2/groups/imserso/documents/binario/inf_resid_20220710.pdf (accessed on 22 July 2022).
- Secretaria de Estado Derechos Sociales. Informe del Grupo de Trabajo COVID-19 y Residencias. Madrid. 2020. Available online: https://www.matiainstituto.net/es/publicaciones/informe-final-del-grupo-de-trabajo-covid-19-y-residencias (accessed on 8 May 2022).
- IMSERSO. Gobierno de España. Informe_Semanal_Residencias_20210302. Madrid. 2021. Available online: https://www.sanidad.gob.es/profesionales/saludPublica/ccayes/alertasActual/nCov/documentos/Informe_Semanal_Residencias_20210302.PDF (accessed on 28 April 2022).
- Rico, M. Verguenza: El Escándalo de las Residencias; Planeta: Barcelona, Spain, 2021. [Google Scholar]
- Abellán, A.; Aceituno, P.; Ramiro, D.; Castillo, A.; Informes Estadísticas Sobre Residencias. Distribución de Centros y Plazas Residenciales por Provincia. Datos de Septiembre de 2020. 2020. Available online: http://envejecimiento.csic.es/documentos/documentos/enred-estadisticasresidencias2020.pdf (accessed on 31 August 2022).
- Frazer, K.; Mitchell, L.; Stokes, D.; Lacey, E.; Crowley, E.; Kelleher, C.C. A rapid systematic review of measures to protect older people in long-term care facilities from COVID-19. BMJ Open 2021, 11, e047012. [Google Scholar] [CrossRef] [PubMed]
- Konetzka, R.T.; White, E.M.; Pralea, A.; Grabowski, D.C.; Mor, V. A systematic review of long-term care facility characteristics associated with COVID-19 outcomes. J. Am. Geriatr. Soc. 2021, 69, 2766–2777. [Google Scholar] [CrossRef]
- Morciano, M.; Stokes, J.; Kontopantelis, E.; Hall, I.; Turner, A.J. Excess mortality for care home residents during the first 23 weeks of the COVID-19 pandemic in England: A national cohort study. BMC Med. 2021, 19, 71. [Google Scholar] [CrossRef] [PubMed]
- Costa, A.P.; Manis, D.R.; Jones, A.; Stall, N.M.; Brown, K.A.; Boscart, V.; Castellino, A.; Heckman, G.A.; Hillmer, M.P.; Ma, C.; et al. Risk factors for outbreaks of SARS-CoV-2 infection at retirement homes in Ontario, Canada: A population-level cohort study. Can. Med. Assoc. J. 2021, 193, E672–E680. [Google Scholar] [CrossRef] [PubMed]
- Zhu, X.; Lee, H.; Sang, H.; Muller, J.; Yang, H.; Lee, C.; Ory, M. Nursing Home Design and COVID-19: Implications for Guidelines and Regulation. J. Am. Med. Dir. Assoc. 2022, 23, 272–279.e1. [Google Scholar] [CrossRef]
- Burton, J.K.; Bayne, G.; Evans, C.; Drmed, F.G.; Gorman, D.; Honhold, N.; McCormick, D.; Othieno, R.; Stevenson, J.E.S.; Swietlik, S.; et al. Evolution and Effects of COVID-19 Outbreaks in Care Homes: A Population Analysis in 189 Care Homes in One Geographical Region of the UK. Lancet Healthy Longev. 2020, 1, e21–e31. Available online: www.thelancet.com/healthy-longevity (accessed on 31 August 2022). [CrossRef]
- Emmerson, C.; Adamson, J.P.; Turner, D.; Gravenor, M.B.; Salmon, J.; Cottrell, S.; Middleton, V.; Thomas, B.; Mason, B.W.; Williams, C.J. Risk factors for outbreaks of COVID-19 in care homes following hospital discharge: A national cohort analysis. Influenza Other Respir. Viruses 2021, 15, 371–380. [Google Scholar] [CrossRef]
- Gobierno de Navarra. Observatorio de la Realidad Social. Auditoría de los Centros Residenciales en Navarra Ante la Crisis de la COVID-19. Pamplona. 2020. Available online: https://www.navarra.es/documents/48192/5050746/Auditoria-Covid-Navarra-Residencias.pdf/203c9382-cb09-afe8-f790-0a6f47a3f70e?t=1600765656950 (accessed on 7 May 2022).
- Junta de Castilla y León. Servicios Sociales de Castilla y León. El Impacto del COVID19 en las Residencias de Personas Mayores de Castilla y León y Medidas Adoptadas. 2020. Available online: https://serviciossociales.jcyl.es/web/jcyl/binarios/941/542/DEF%20INFORME%20IMPACTO%20COVID19%20%20RESIDENCIAS%20CYL%20Firmado.pdf?blobheader=application%2Fpdf%3Bcharset%3DUTF-8&blobnocache=true (accessed on 7 May 2022).
- Soldevila, L.; Prat, N.; Mas, M.A.; Massot, M.; Miralles, R.; Bonet-Simó, J.M.; Isnard, M.; Exposito-Izquierdo, M.; Garcia-Sanchez, I.; Rodoreda-Noguerola, S.; et al. The interplay between infection risk factors of SARS-CoV-2 and mortality: A cross-sectional study from a cohort of long-term care nursing home residents. BMC Geriatr. 2022, 22, 123. [Google Scholar] [CrossRef]
- Mas Romero, M.; Céspedes, A.A.; Sahuquillo, M.T.T.; Zamora, E.B.C.; Ballesteros, C.G.; Alfaro, V.S.-F.; Bru, R.L.; Utiel, M.L.; Cifuentes, S.C.; Longobardo, L.M.P.; et al. COVID-19 outbreak in long-term care facilities from Spain. Many lessons to learn. PLoS ONE 2020, 15, e0241030. [Google Scholar] [CrossRef]
- Barrera-Algarín, E.; Estepa-Maestre, F.; Sarasola-Sánchez-Serrano, J.L.; Malagón-Siria, J.C. COVID-19 and elderly people in nursing homes: Impact according to the modality of residence. Rev. Esp. Geriatr. Gerontol. 2021, 56, 208–217. [Google Scholar] [CrossRef] [PubMed]
- Ararteko. El Impacto de la Pandemia del COVID-19 en los Centros Residenciales para Personas Mayores en Euskadi. Vitoria. 2021. Available online: https://www.ararteko.eus/es/el-impacto-de-la-pandemia-del-covid-19-en-los-centros-residenciales-para-personas-mayores-en-euskadi-0 (accessed on 26 July 2022).
- Brown, K.A.; Jones, A.; Daneman, N.; Chan, A.K.; Schwartz, K.L.; Garber, G.E.; Costa, A.P.; Stall, N.M. Association Between Nursing Home Crowding and COVID-19 Infection and Mortality in Ontario, Canada. JAMA Intern. Med. 2021, 181, 229. [Google Scholar] [CrossRef]
- Agoües, A.B.; Gallego, M.S.; Resa, R.H.; Llorente, B.J.; Arabi, M.L.; Rodriguez, J.O.; Acebal, H.P.; Hernandez, M.C.; Ayala, I.C.; Calero, P.P.; et al. Risk Factors for COVID-19 Morbidity and Mortality in Institutionalised Elderly People. Int. J. Environ. Res. Public Health 2021, 18, 10221. [Google Scholar] [CrossRef] [PubMed]
- Arnedo-Pena, A.; Romeu-Garcia, M.A.; Gascó-Laborda, J.C.; Meseguer-Ferrer, N.; Safont-Adsuara, L.; Prades-Vila, L.; Flores-Medina, M.; Rusen, V.; Tirado-Balaguer, M.D.; Sabater-Vidal, S.; et al. Incidence, Mortality, and Risk Factors of COVID-19 in Nursing Homes. Epidemiologia 2022, 3, 179–190. [Google Scholar] [CrossRef]
- Suñer, C.; Ouchi, D.; Mas, M.À.; Alarcon, R.L.; Mesquida, M.M.; Prat, N.; Bonet-Simo, J.M.; Izquierdo, M.E.; Sancehz, I.G.; Noguerola, S.R.; et al. A retrospective cohort study of risk factors for mortality among nursing homes exposed to COVID-19 in Spain. Nat. Aging 2021, 1, 579–584. [Google Scholar] [CrossRef]
- Unruh, M.A.; Yun, H.; Zhang, Y.; Braun, R.T.; Jung, H.Y. Nursing Home Characteristics Associated With COVID-19 Deaths in Connecticut, New Jersey, and New York. J. Am. Med. Dir. Assoc. 2020, 21, 1001–1003. [Google Scholar] [CrossRef] [PubMed]
- Stall, N.M.; Jones, A.; Brown, K.A.; Rochon, P.A.; Costa, A.P. For-profit long-term care homes and the risk of COVID-19 outbreaks and resident deaths. Can. Med. Assoc. J. 2020, 192, E946–E955. [Google Scholar] [CrossRef]
- Koleva, G.; Rico, M.; García López, F.J.; Figuera, D.; Padilla, J.; García, M. The impact of COVID-19 in nursing homes in Madrid, Spain: A need for assessment. In The Lancet Regional Health—Europe; Elsevier Ltd.: London, UK, 2021; Volume 11. [Google Scholar]
- Médecins Sans Frontières. Too Little, Too Late. The Unacceptable Neglect of the Elderly in Care Homes during the COVID-19 Pandemic in Spain; MSF: Barcelona, Spain, 2020. [Google Scholar]
- Rada, A.G. COVID-19: The precarious position of Spain’s nursing homes. BMJ Publ. Group 2020, 369, m1554. [Google Scholar] [CrossRef]
- Mas, M.À.; Mesquida, M.M.; Miralles, R.; Soldevila, L.; Prat, N.; Bonet-Simó, J.M.; Isnard, M.; Exposito-Izquierdo, M.; Garcia-Sanches, I.; Rodoreda-Noguerola, S.; et al. Clinical Factors Related to COVID-19 Outcomes in Institutionalized Older Adults: Cross-sectional Analysis from a Cohort in Catalonia. J. Am. Med. Dir. Assoc. 2021, 22, 1857–1859. [Google Scholar] [CrossRef]
- Liu, M.; Maxwell, C.J.; Armstrong, P.; Schwandt, M.; Moser, A.; McGregor, M.J.; Bronskill, S.E.; Dhalia, I.A. COVID-19 in long-term care homes in Ontario and British Columbia. Can. Med. Assoc. J. 2020, 192, E1540–E1546. [Google Scholar] [CrossRef]
- Pue, K.; Westlake, D.; Jansen, A. Does the profit motive matter? COVID-19 prevention and management in Ontario Long-term Care Homes. Can. Public Policy 2021, 47, 421–438. [Google Scholar] [CrossRef] [PubMed]
- Government of Catalonia. GENCAT. Statistical Institute of Catalonia. Population. 2020. Available online: https://www.idescat.cat/tema/xifpo?lang=en (accessed on 7 May 2022).
- Şentürk, D.; Dalrymple, L.S.; Nguyen, D.V. Functional linear models for zero-inflated count data with application to modeling hospitalizations in patients on dialysis. Stat. Med. 2014, 33, 4825–4840. [Google Scholar] [CrossRef] [PubMed]
- Neelon, B.; O’Malley, A.J.; Smith, V.A. Modeling zero-modified count and semicontinuous data in health services research Part 1: Background and overview. Stat. Med. 2016, 35, 5070–5093. [Google Scholar] [CrossRef] [PubMed]
- Min, Y.; Agresti, A. Random effect models for repeated measures of zero-inflated count data. Stat. Model. 2005, 5, 1–19. [Google Scholar] [CrossRef]
- Lambert, D. Zero-Inflated Poisson Regression, with an application to Defects in Manufacturing. Technometrics 1992, 34, 1–14. [Google Scholar] [CrossRef]
- Cawthon, P.M.; Lui, L.Y.; McCulloch, C.E.; Cauley, J.A.; Paudel, M.L.; Taylor, B.; Schousboe, J.T.; Ensrud, K.E. Sarcopenia and Health Care Utilization in Older Women. J. Gerontol. Ser. A Biol. Sci. Med. Sci. 2017, 72, 95–101. [Google Scholar] [CrossRef]
- Motzek, T.; Werblow, A.; Tesch, F.; Marquardt, G.; Schmitt, J. Determinants of hospitalization and length of stay among people with dementia—An analysis of statutory health insurance claims data. Arch. Gerontol. Geriatr. 2018, 76, 227–233. [Google Scholar] [CrossRef]
- Abellán, A.; Aceituno, P.; Castillo, A.; Ramiro, D. Estimación de la Ocupación en Residencias de Personas Mayores, por Comunidad Autónoma, 2020. Envejecimiento en Red. 2021. Available online: https://envejecimientoenred.es/estimacion-de-la-ocupacion-en-residencias-de-personas-mayores-por-comunidad-autonoma-2020/ (accessed on 8 May 2022).
- Abrams, H.R.; Loomer, L.; Gandhi, A.; Grabowski, D.C.; Abrams, H.R. Characteristics of U.S. Nursing Homes with COVID-19 Cases. J. Am. Geriatr. Soc. 2022, 68, 1653–1656. [Google Scholar] [CrossRef]
- Shen, K. Relationship between nursing home COVID-19 outbreaks and staff neighborhood characteristics. PLoS ONE 2022, 17, e0267377. [Google Scholar] [CrossRef]


| LTCHs | Number of Residents | |||
|---|---|---|---|---|
| N | % | N | % | |
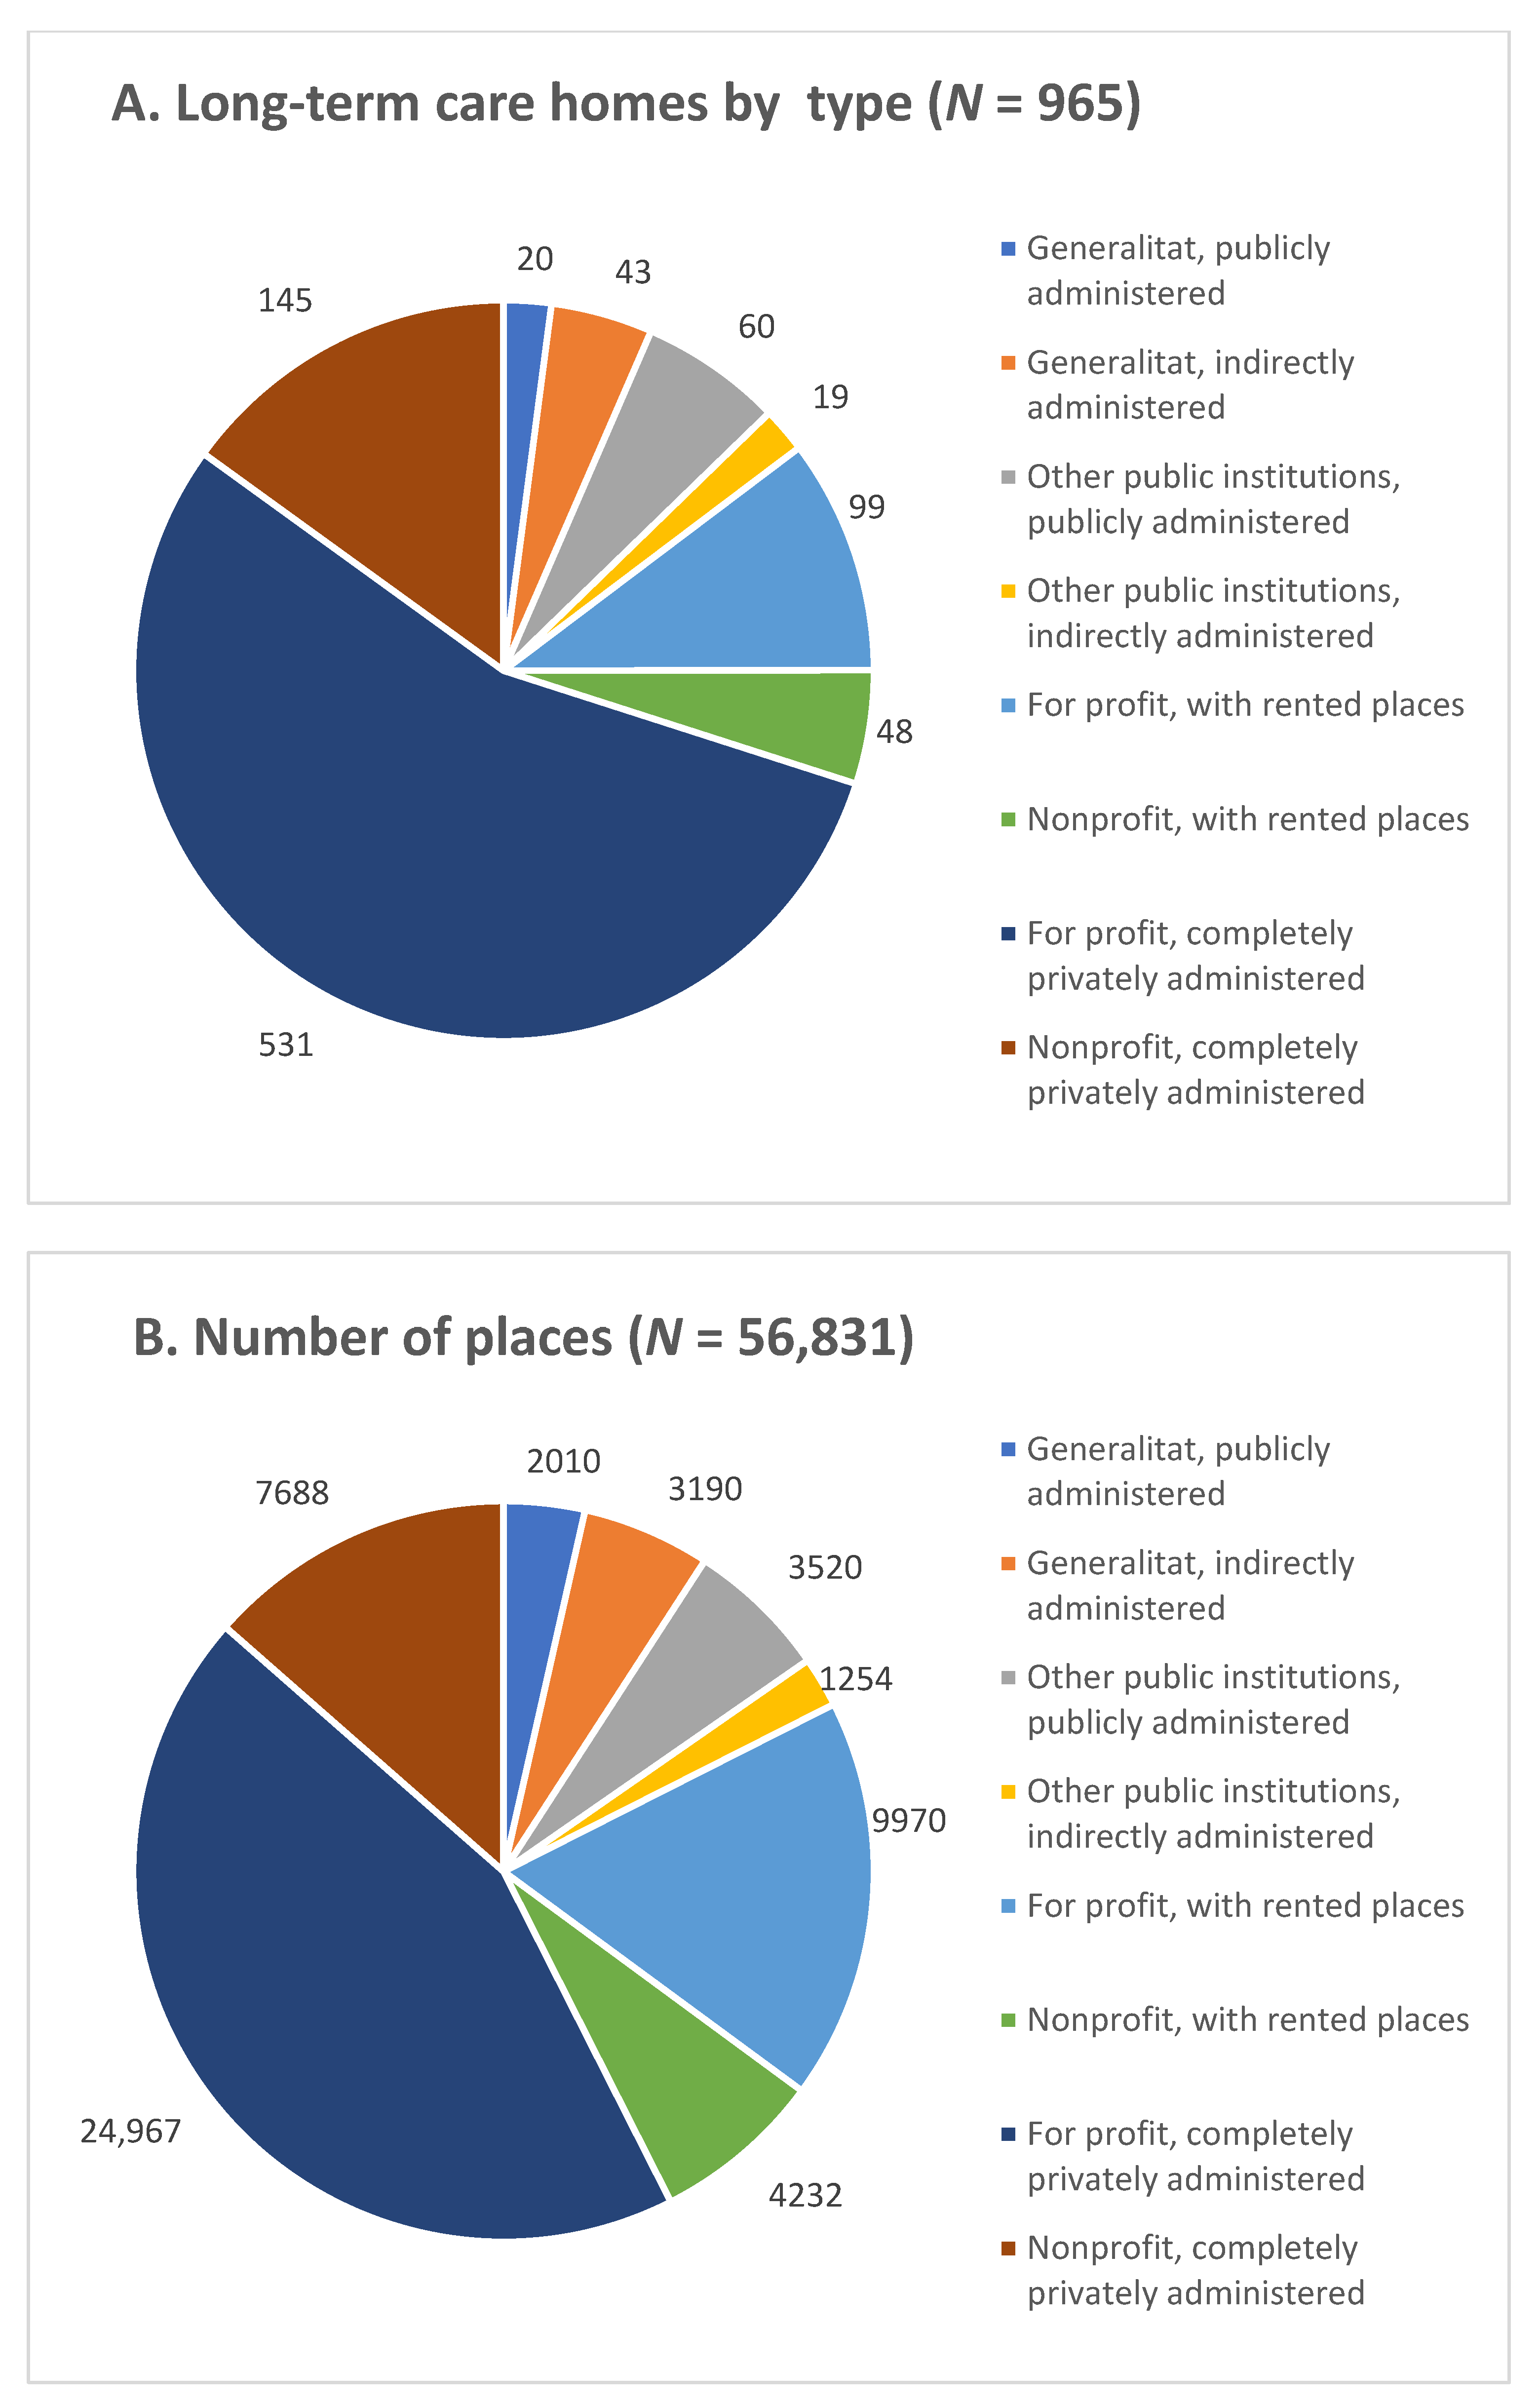
| Total | 965 | 100% | 56,831 | 100% |
| LTCH size | ||||
| <30 | 298 | 31% | 6544 | 12% |
| 30–49 | 201 | 21% | 23,212 | 41% |
| 50–99 | 329 | 34% | 7665 | 13% |
| 100–149 | 86 | 9% | 10,198 | 18% |
| 150–199 | 42 | 4% | 7048 | 12% |
| 200 and more | 9 | 1% | 2164 | 4% |
| County population | ||||
| Barcelona | 274 | 28% | 15,477 | 27% |
| Between 700,000 and 1,000,000 | 213 | 22% | 11,644 | 20% |
| Between 200,000 and 700,000 | 181 | 19% | 11,353 | 20% |
| Between 100,000 and 200,000 | 180 | 19% | 11,280 | 20% |
| Less than 100,000 inhabitants | 117 | 12% | 7077 | 12% |
| County COVID-19 CIR | ||||
| Less than 500/100,000 | 214 | 22% | 13,640 | 24% |
| Between 500 and 750/100,000 | 154 | 16% | 9386 | 17% |
| Between 750 and 900/100,000 | 263 | 27% | 14,639 | 26% |
| Between 900 and 1000/100,000 | 283 | 30% | 16,005 | 28% |
| More than 1000/1,000,000 | 51 | 5% | 3161 | 6% |
| COVID-19 Infection in LTCH | Number of LTCH and % with at Least One COVID-19 Death | COVID-19 Deaths (SD) | |||
|---|---|---|---|---|---|
| N | % | N | % | Mean (SD) | |
| Total | 627 | 65 | 505 | 52 | 7.7 (8.9) |
| LTCH size | |||||
| <30 | 156 | 52 | 114 | 38 | 3.2 (3.1) |
| 30–49 | 115 | 57 | 87 | 43 | 4.1 (3.6) |
| 50–99 | 236 | 72 | 193 | 59 | 7.7 (7.0) |
| 100–149 | 72 | 84 | 66 | 77 | 11.0 (9.5) |
| 150–199 | 40 | 95 | 38 | 90 | 19.3 (13.3) |
| 200 and more | 8 | 89 | 7 | 78 | 30.3 (23.8) |
| County population | |||||
| Barcelona | 218 | 80 | 31 | 69 | 8.2 (9.5) |
| Between 700,000 and 1,000,000 | 153 | 72 | 83 | 59 | 7.4 (7.6) |
| Between 200,000 and 700,000 | 90 | 50 | 77 | 42 | 7.5 (9.1) |
| Between 100,000 and 200,000 | 118 | 66 | 126 | 46 | 8.1 (9.9) |
| Less than 100,000 inhabitants | 48 | 41 | 188 | 26 | 4.9 (6.8) |
| County COVID-19 CIR | |||||
| Less than 500/100,000 | 94 | 44 | 56 | 26 | 6.6 (8.3) |
| Between 500 and 750/100,000 | 83 | 54 | 73 | 46 | 7.1 (8.4) |
| Between 750 and 900/100,000 | 182 | 69 | 148 | 56 | 7.2 (7.4) |
| Between 900 and 1000/100,000 | 225 | 79 | 192 | 68 | 8.2 (9.5) |
| More than 1000/100,000 | 43 | 84 | 36 | 71 | 9.8 (12.5) |
| LTCH Type | |||||
| Generalitat, publicly administered | 15 | 75 | 14 | 70 | 14.4 (10.9) |
| Generalitat, indirectly administered | 33 | 77 | 28 | 65 | 10.0 (6.6) |
| Other public institutions, publicly administered | 35 | 58 | 25 | 42 | 8.8 (10.5) |
| Other public institutions, indirectly administered | 15 | 79 | 11 | 58 | 7.4 (6.4) |
| For-profit, with rented places | 75 | 76 | 63 | 64 | 9.9 (11.8) |
| Nonprofit, with rented places | 39 | 81 | 35 | 73 | 11.4 (10.0) |
| For-profit, completely privately administered | 322 | 61 | 258 | 49 | 6.2 (7.9) |
| Nonprofit, completely privately administered | 93 | 64 | 71 | 49 | 6.6 (7.6) |
Publisher’s Note: MDPI stays neutral with regard to jurisdictional claims in published maps and institutional affiliations. |
© 2022 by the authors. Licensee MDPI, Basel, Switzerland. This article is an open access article distributed under the terms and conditions of the Creative Commons Attribution (CC BY) license (https://creativecommons.org/licenses/by/4.0/).
Share and Cite
Zunzunegui, M.V.; Béland, F.; Rico, M.; López, F.J.G. Long-Term Care Home Size Association with COVID-19 Infection and Mortality in Catalonia in March and April 2020. Epidemiologia 2022, 3, 369-390. https://doi.org/10.3390/epidemiologia3030029
Zunzunegui MV, Béland F, Rico M, López FJG. Long-Term Care Home Size Association with COVID-19 Infection and Mortality in Catalonia in March and April 2020. Epidemiologia. 2022; 3(3):369-390. https://doi.org/10.3390/epidemiologia3030029
Chicago/Turabian StyleZunzunegui, Maria Victoria, François Béland, Manuel Rico, and Fernando J. García López. 2022. "Long-Term Care Home Size Association with COVID-19 Infection and Mortality in Catalonia in March and April 2020" Epidemiologia 3, no. 3: 369-390. https://doi.org/10.3390/epidemiologia3030029
APA StyleZunzunegui, M. V., Béland, F., Rico, M., & López, F. J. G. (2022). Long-Term Care Home Size Association with COVID-19 Infection and Mortality in Catalonia in March and April 2020. Epidemiologia, 3(3), 369-390. https://doi.org/10.3390/epidemiologia3030029