


Current and Emerging Treatments for Metabolic Associated Steatotic Liver Disease and Diabetes: A Narrative Review

 ,
,
Abstract
1. Introduction
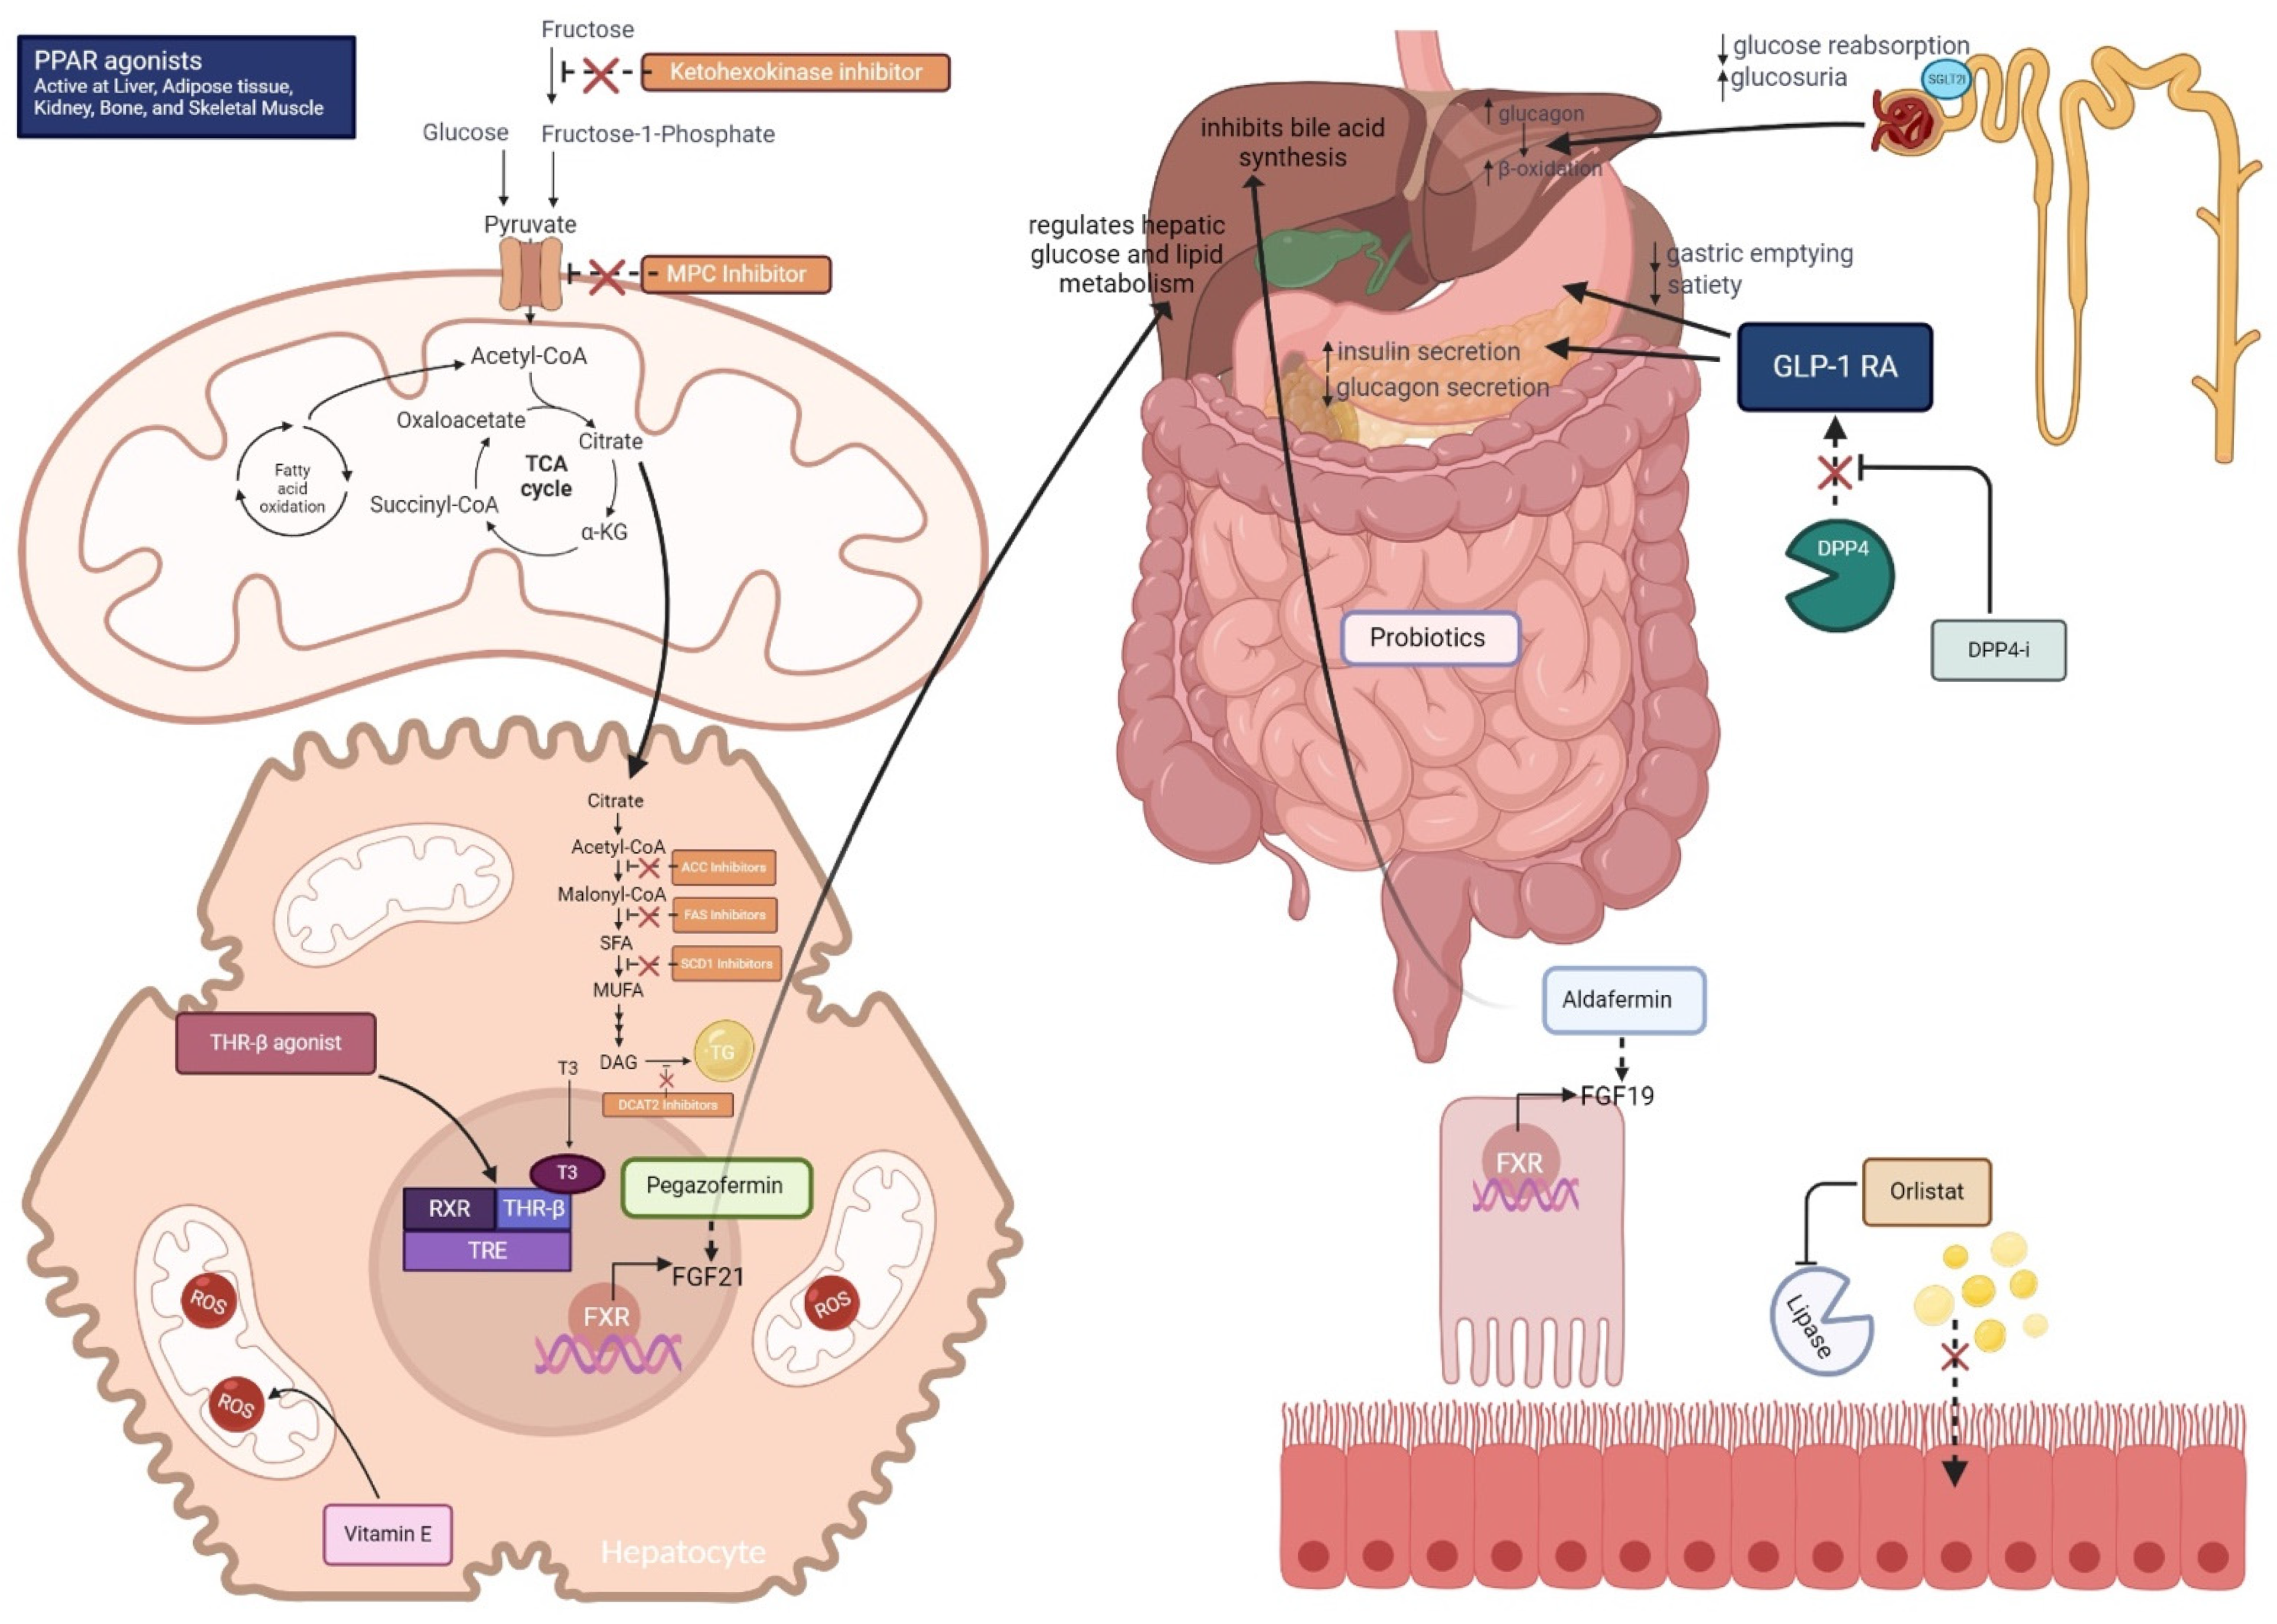
2. Pathophysiology of MASLD/MASH
3. Therapeutic Options for MASLD/MASH Under Investigation
3.1. Glucose Lowering Medications
3.1.1. Peroxisome Proliferator-Activated Receptors (PPAR) Agonists
Pioglitazone
Saroglitazar
Lanifibranor
Other PPAR Agonists
3.1.2. Sodium Glucose Transport 2 Inhibitors (SGLT2i)
Dapagliflozin
Empagliflozin
Canagliflozin
Other SGLT2 Inhibitors
SGLT2 Inhibitor Meta-Analysis
3.1.3. Dipeptidyl Peptidase-4 (DPP-4) Inhibitors—Sitagliptin
3.2. Drugs Promoting Glucose-Lowering and Weight Loss
3.2.1. Glucagon-like Peptide-1 (GLP-1) Receptor Agonists
Semaglutide
Liraglutide
Dulaglutide
Exenatide
GLP-1 Receptor Agonist Meta-Analysis
3.2.2. Dual Glucose-Dependent Insulinotropic Polypeptide (GIP) and GLP-1 Receptor Agonist: Tirzepatide
3.2.3. Dual Glucagon and GLP-1 Receptor Agonist: Cotadutide
3.3. Drugs Promoting Weight Loss: Lipase Inhibitor: Orlistat
3.4. Drugs Affecting Intermediary Metabolism
Antioxidants: Vitamin E
3.5. Nuclear Receptor Modulators
3.5.1. Thyroid Hormone Receptor Beta (THRβ) Agonists: Resmetirom
3.5.2. Farnesoid X Receptor (FXR) Agonists, Bile Acids, and Synthetic Bile Acids
Obeticholic Acid
3.6. De Novo Lipogenesis Inhibitors
3.6.1. Acetyl-CoA Carboxylase (ACC) Inhibitors:
3.6.2. Fatty Acid Synthase (FAS) Inhibitors
3.6.3. Stearoyl-CoA Desaturase 1 (SCD1) Inhibitors
3.6.4. Diacylglycerol Acyltransferase (DGAT) Inhibitors
3.6.5. Ketohexokinase Inhibitors
3.7. Gut-Liver Axis
Probiotics, Symbiotics
3.8. Fibroblast Growth Factors
3.8.1. Pegozafermin
3.8.2. Aldafermin
3.9. Other Pathways
4. Conclusions
Author Contributions
Funding
Data Availability Statement
Conflicts of Interest
Abbreviations
| ACC | Acetyl-CoA Carboxylase |
| ALT | Alanine Aminotransferase |
| ASK1 | Apoptosis Signal-Regulating Kinase 1 |
| AST | Aspartate Aminotransferase |
| BAR | Bile Acid Receptor |
| BID | Twice Daily Dosing |
| BMI | Body Mass Index |
| CAP | Controlled Attenuation Parameter |
| CI | Confidence Interval |
| CRN | Clinical Research Network |
| CRP | C-Reactive Protein |
| DCAT | Diacylglycerol Acyltransferase |
| DNL | De Novo Lipogenesis |
| DPP-4 | Dipeptidyl Peptidase-4 |
| EMA | European Medicines Agency |
| ETR | Estimated Treatment Ratios |
| FAS | Fatty Acid Synthase |
| FDA | Food and Drug Administration |
| FFA | Free Fatty Acids |
| FIB-4 | Fibrosis-4 Index |
| FGF | Fibroblast Growth Factor |
| FPG | Fasting Plasma Glucose |
| FXR | Farnesoid X Receptor |
| GIP | Glucose-Dependent Insulinotropic Polypeptide |
| GLIM | Glimepiride |
| GLP-1 RA | Glucagon-Like Peptide-1 Receptor Agonist |
| HbA1c | Hemoglobin A1c |
| HDL | High-Density Lipoprotein |
| HOMA-IR | Homeostatic Model Assessment for Insulin Resistance |
| HSD17B13 | 17β-hydroxysteroid Dehydrogenase Type 13 |
| IGT | Impaired Glucose Tolerance |
| IL-6 | Interleukin 6 |
| IHTG | Intrahepatic Triglyceride |
| JNK | Jun N-terminal Kinase |
| KHK | Ketohexokinase |
| LDL | Low-Density Lipoprotein |
| LFC | Liver Fat Content |
| LOXL | Lysyl Oxidase Like 1 |
| LSM | Liver Stiffness Measurement |
| MAPK | Mitogen-Activated Protein Kinase |
| MASH | Metabolic Dysfunction-Associated Steatohepatitis |
| MASLD | Metabolic Dysfunction-Associated Steatotic Liver Disease |
| MBOAT7 | Membrane-Bound O-Acyltransferase Domain-Containing 7 |
| MRE | Magnetic Resonance Elastography |
| MRI-PDFF | Magnetic Resonance Imaging - Proton Density Fat Fraction |
| NAS | Non-Alcoholic Fatty Liver Disease Activity Score |
| NAFLD | Non-Alcoholic Fatty Liver Disease |
| NASH | Non-Alcoholic Steatohepatitis |
| NNT | Number Needed to Treat |
| OCA | Obeticholic Acid |
| OR | Odds Ratio |
| PNPLA3 | Patatin-Like Phospholipase Domain-Containing Protein 3 |
| PPAR | Peroxisome Proliferator-Activated Receptor |
| QUICKI | Quantitative Insulin Sensitivity Check Index |
| RDBPCT | Randomized Double-Blind Placebo-Controlled Trial |
| RCTs | Randomized Controlled Trials |
| ROS | Reactive Oxygen Species |
| RXR | Retinoid X Receptor |
| SAF | Steatosis, Activity, Fibrosis |
| SAT | Subcutaneous Adipose Tissue |
| SCD1 | Stearoyl-CoA Desaturase-1 |
| SFA | Subcutaneous Fat Area |
| SGLT2i | Sodium-Glucose Co-Transporter 2 Inhibitors |
| T2DM | Type 2 Diabetes Mellitus |
| TC | Total Cholesterol |
| TG | Triglycerides |
| THR-β | Thyroid Hormone Receptor β |
| TM6SF2 | Transmembrane 6 Superfamily Member 2 |
| TRE | Thyroid Hormone Response Element |
| TZD | Thiazolidinediones |
| VAT | Visceral Adipose Tissue |
| VCTE | Vibration-Controlled Transient Elastography |
| VFA | Visceral Fat Area |
| VLDL | Very Low-Density Lipoprotein |
References
- Rinella, M.E.; Neuschwander-Tetri, B.A.; Siddiqui, M.S.; Abdelmalek, M.F.; Caldwell, S.; Barb, D.; Kleiner, D.E.; Loomba, R. AASLD Practice Guidance on the Clinical Assessment and Management of Nonalcoholic Fatty Liver Disease. Hepatology 2023, 77, 1797. [Google Scholar] [CrossRef] [PubMed]
- Lekakis, V.; Papatheodoridis, G.V. Natural History of Metabolic Dysfunction-Associated Steatotic Liver Disease. Eur. J. Intern. Med. 2024, 122, 3–10. [Google Scholar] [CrossRef]
- Riazi, K.; Azhari, H.; Charette, J.H.; Underwood, F.E.; King, J.A.; Afshar, E.E.; Swain, M.G.; Congly, S.E.; Kaplan, G.G.; Shaheen, A.-A. The Prevalence and Incidence of NAFLD Worldwide: A Systematic Review and Meta-Analysis. Lancet Gastroenterol. Hepatol. 2022, 7, 851–861. [Google Scholar] [CrossRef]
- Younossi, Z.M.; Golabi, P.; Paik, J.M.; Henry, A.; Van Dongen, C.; Henry, L. The Global Epidemiology of Nonalcoholic Fatty Liver Disease (NAFLD) and Nonalcoholic Steatohepatitis (NASH): A Systematic Review. Hepatology 2023, 77, 1335–1347. [Google Scholar] [CrossRef] [PubMed]
- Le, M.H.; Le, D.M.; Baez, T.C.; Wu, Y.; Ito, T.; Lee, E.Y.; Lee, K.; Stave, C.D.; Henry, L.; Barnett, S.D.; et al. Global Incidence of Non-Alcoholic Fatty Liver Disease: A Systematic Review and Meta-Analysis of 63 Studies and 1,201,807 Persons. J. Hepatol. 2023, 79, 287–295. [Google Scholar] [CrossRef]
- Quek, J.; Ng, C.H.; Tang, A.S.P.; Chew, N.; Chan, M.; Khoo, C.M.; Wei, C.P.; Chin, Y.H.; Tay, P.; Lim, G.; et al. Metabolic Associated Fatty Liver Disease Increases the Risk of Systemic Complications and Mortality. A Meta-Analysis and Systematic Review of 12,620,736 Individuals. Endocr. Pract. 2022, 28, 667–672. [Google Scholar] [CrossRef]
- Younossi, Z.M.; Corey, K.E.; Lim, J.K. AGA Clinical Practice Update on Lifestyle Modification Using Diet and Exercise to Achieve Weight Loss in the Management of Nonalcoholic Fatty Liver Disease: Expert Review. Gastroenterology 2021, 160, 912–918. [Google Scholar] [CrossRef] [PubMed]
- Browning, J.D.; Horton, J.D. Molecular Mediators of Hepatic Steatosis and Liver Injury. J. Clin. Investig. 2004, 114, 147–152. [Google Scholar] [CrossRef]
- Nassir, F.; Ibdah, J.A. Role of Mitochondria in Nonalcoholic Fatty Liver Disease. Int. J. Mol. Sci. 2014, 15, 8713–8742. [Google Scholar] [CrossRef]
- Alves-Bezerra, M.; Cohen, D.E. Triglyceride Metabolism in the Liver. Compr. Physiol. 2017, 8, 1–8. [Google Scholar] [CrossRef]
- Jelenik, T.; Kaul, K.; Séquaris, G.; Flögel, U.; Phielix, E.; Kotzka, J.; Knebel, B.; Fahlbusch, P.; Hörbelt, T.; Lehr, S.; et al. Mechanisms of Insulin Resistance in Primary and Secondary Nonalcoholic Fatty Liver. Diabetes 2017, 66, 2241–2253. [Google Scholar] [CrossRef]
- Bence, K.K.; Birnbaum, M.J. Metabolic Drivers of Non-Alcoholic Fatty Liver Disease. Mol. Metab. 2021, 50, 101143. [Google Scholar] [CrossRef] [PubMed]
- Lambert, J.E.; Ramos-Roman, M.A.; Browning, J.D.; Parks, E.J. Increased de Novo Lipogenesis Is a Distinct Characteristic of Individuals with Nonalcoholic Fatty Liver Disease. Gastroenterology 2014, 146, 726–735. [Google Scholar] [CrossRef]
- Begriche, K.; Igoudjil, A.; Pessayre, D.; Fromenty, B. Mitochondrial Dysfunction in NASH: Causes, Consequences and Possible Means to Prevent It. Mitochondrion 2006, 6, 1–28. [Google Scholar] [CrossRef] [PubMed]
- Sunny, N.E.; Bril, F.; Cusi, K. Mitochondrial Adaptation in Nonalcoholic Fatty Liver Disease: Novel Mechanisms and Treatment Strategies. Trends Endocrinol. Metab. TEM 2017, 28, 250–260. [Google Scholar] [CrossRef]
- Chen, J.; Deng, X.; Liu, Y.; Tan, Q.; Huang, G.; Che, Q.; Guo, J.; Su, Z. Kupffer Cells in Non-Alcoholic Fatty Liver Disease: Friend or Foe? Int. J. Biol. Sci. 2020, 16, 2367–2378. [Google Scholar] [CrossRef] [PubMed]
- Khomich, O.; Ivanov, A.V.; Bartosch, B. Metabolic Hallmarks of Hepatic Stellate Cells in Liver Fibrosis. Cells 2019, 9, 24. [Google Scholar] [CrossRef]
- Polyzos, S.A.; Toulis, K.A.; Goulis, D.G.; Zavos, C.; Kountouras, J. Serum Total Adiponectin in Nonalcoholic Fatty Liver Disease: A Systematic Review and Meta-Analysis. Metabolism 2011, 60, 313–326. [Google Scholar] [CrossRef]
- Koliaki, C.; Szendroedi, J.; Kaul, K.; Jelenik, T.; Nowotny, P.; Jankowiak, F.; Herder, C.; Carstensen, M.; Krausch, M.; Knoefel, W.T.; et al. Adaptation of Hepatic Mitochondrial Function in Humans with Non-Alcoholic Fatty Liver Is Lost in Steatohepatitis. Cell Metab. 2015, 21, 739–746. [Google Scholar] [CrossRef]
- Polyzos, S.A.; Kountouras, J.; Mantzoros, C.S. Adipokines in Nonalcoholic Fatty Liver Disease. Metabolism 2016, 65, 1062–1079. [Google Scholar] [CrossRef]
- Abul-Husn, N.S.; Cheng, X.; Li, A.H.; Xin, Y.; Schurmann, C.; Stevis, P.; Liu, Y.; Kozlitina, J.; Stender, S.; Wood, G.C.; et al. A Protein-Truncating HSD17B13 Variant and Protection from Chronic Liver Disease. N. Engl. J. Med. 2018, 378, 1096–1106. [Google Scholar] [CrossRef] [PubMed]
- Luo, F.; Oldoni, F.; Das, A. TM6SF2: A Novel Genetic Player in Nonalcoholic Fatty Liver and Cardiovascular Disease. Hepatol. Commun. 2022, 6, 448–460. [Google Scholar] [CrossRef]
- Meroni, M.; Longo, M.; Fracanzani, A.L.; Dongiovanni, P. MBOAT7 Down-Regulation by Genetic and Environmental Factors Predisposes to MAFLD. EBioMedicine 2020, 57, 102866. [Google Scholar] [CrossRef]
- Wang, Y.; Kory, N.; BasuRay, S.; Cohen, J.C.; Hobbs, H.H. PNPLA3, CGI-58, and Inhibition of Hepatic Triglyceride Hydrolysis in Mice. Hepatology 2019, 69, 2427–2441. [Google Scholar] [CrossRef]
- Hrncir, T.; Hrncirova, L.; Kverka, M.; Hromadka, R.; Machova, V.; Trckova, E.; Kostovcikova, K.; Kralickova, P.; Krejsek, J.; Tlaskalova-Hogenova, H. Gut Microbiota and NAFLD: Pathogenetic Mechanisms, Microbiota Signatures, and Therapeutic Interventions. Microorganisms 2021, 9, 957. [Google Scholar] [CrossRef]
- Wang, J.; Du, M.-M.; Du, Y.; Li, J.-X. HA-20 Prevents Hepatocyte Steatosis in Metabolic-Associated Fatty Liver Disease via Regulating Ca2+ Relative Signalling Pathways. Eur. J. Pharmacol. 2022, 921, 174838. [Google Scholar] [CrossRef] [PubMed]
- Kleiner, D.E.; Brunt, E.M.; Van Natta, M.; Behling, C.; Contos, M.J.; Cummings, O.W.; Ferrell, L.D.; Liu, Y.-C.; Torbenson, M.S.; Unalp-Arida, A.; et al. Nonalcoholic Steatohepatitis Clinical Research Network. Design and Validation of a Histological Scoring System for Nonalcoholic Fatty Liver Disease. Hepatology 2005, 41, 1313–1321. [Google Scholar] [CrossRef] [PubMed]
- Bedossa, P.; Poitou, C.; Veyrie, N.; Bouillot, J.-L.; Basdevant, A.; Paradis, V.; Tordjman, J.; Clement, K. Histopathological Algorithm and Scoring System for Evaluation of Liver Lesions in Morbidly Obese Patients. Hepatology 2012, 56, 1751–1759. [Google Scholar] [CrossRef]
- Younossi, Z.M.; Loomba, R.; Anstee, Q.M.; Rinella, M.E.; Bugianesi, E.; Marchesini, G.; Neuschwander-Tetri, B.A.; Serfaty, L.; Negro, F.; Caldwell, S.H.; et al. Diagnostic Modalities for Nonalcoholic Fatty Liver Disease, Nonalcoholic Steatohepatitis, and Associated Fibrosis. Hepatology 2018, 68, 349–360. [Google Scholar] [CrossRef]
- Issemann, I.; Green, S. Activation of a Member of the Steroid Hormone Receptor Superfamily by Peroxisome Proliferators. Nature 1990, 347, 645–650. [Google Scholar] [CrossRef]
- Feige, J.N.; Gelman, L.; Michalik, L.; Desvergne, B.; Wahli, W. From Molecular Action to Physiological Outputs: Peroxisome Proliferator-Activated Receptors Are Nuclear Receptors at the Crossroads of Key Cellular Functions. Prog. Lipid Res. 2006, 45, 120–159. [Google Scholar] [CrossRef] [PubMed]
- Pawlak, M.; Lefebvre, P.; Staels, B. Molecular Mechanism of PPARα Action and Its Impact on Lipid Metabolism, Inflammation and Fibrosis in Non-Alcoholic Fatty Liver Disease. J. Hepatol. 2015, 62, 720–733. [Google Scholar] [CrossRef] [PubMed]
- Zambon, A.; Gervois, P.; Pauletto, P.; Fruchart, J.-C.; Staels, B. Modulation of Hepatic Inflammatory Risk Markers of Cardiovascular Diseases by PPAR-Alpha Activators: Clinical and Experimental Evidence. Arterioscler. Thromb. Vasc. Biol. 2006, 26, 977–986. [Google Scholar] [CrossRef] [PubMed]
- Boubia, B.; Poupardin, O.; Barth, M.; Binet, J.; Peralba, P.; Mounier, L.; Jacquier, E.; Gauthier, E.; Lepais, V.; Chatar, M.; et al. Design, Synthesis, and Evaluation of a Novel Series of Indole Sulfonamide Peroxisome Proliferator Activated Receptor (PPAR) α/γ/δ Triple Activators: Discovery of Lanifibranor, a New Antifibrotic Clinical Candidate. J. Med. Chem. 2018, 61, 2246–2265. [Google Scholar] [CrossRef]
- Belfort, R.; Harrison, S.A.; Brown, K.; Darland, C.; Finch, J.; Hardies, J.; Balas, B.; Gastaldelli, A.; Tio, F.; Pulcini, J.; et al. A Placebo-Controlled Trial of Pioglitazone in Subjects with Nonalcoholic Steatohepatitis. N. Engl. J. Med. 2006, 355, 2297–2307. [Google Scholar] [CrossRef]
- Cusi, K.; Orsak, B.; Bril, F.; Lomonaco, R.; Hecht, J.; Ortiz-Lopez, C.; Tio, F.; Hardies, J.; Darland, C.; Musi, N.; et al. Long-Term Pioglitazone Treatment for Patients with Nonalcoholic Steatohepatitis and Prediabetes or Type 2 Diabetes Mellitus: A Randomized Trial. Ann. Intern. Med. 2016, 165, 305. [Google Scholar] [CrossRef]
- Bril, F.; Kalavalapalli, S.; Clark, V.C.; Lomonaco, R.; Soldevila-Pico, C.; Liu, I.-C.; Orsak, B.; Tio, F.; Cusi, K. Response to Pioglitazone in Patients with Nonalcoholic Steatohepatitis with vs Without Type 2 Diabetes. Clin. Gastroenterol. Hepatol. 2018, 16, 558–566.e2. [Google Scholar] [CrossRef]
- Huang, J.-F.; Dai, C.-Y.; Huang, C.-F.; Tsai, P.-C.; Yeh, M.-L.; Hsu, P.-Y.; Huang, S.-F.; Bair, M.-J.; Hou, N.-J.; Huang, C.-I.; et al. First-in-Asian Double-Blind Randomized Trial to Assess the Efficacy and Safety of Insulin Sensitizer in Nonalcoholic Steatohepatitis Patients. Hepatol. Int. 2021, 15, 1136–1147. [Google Scholar] [CrossRef]
- Pai, V.; Paneerselvam, A.; Mukhopadhyay, S.; Bhansali, A.; Kamath, D.; Shankar, V.; Gambhire, D.; Jani, R.H.; Joshi, S.; Patel, P. A Multicenter, Prospective, Randomized, Double-Blind Study to Evaluate the Safety and Efficacy of Saroglitazar 2 and 4 Mg Compared to Pioglitazone 45 Mg in Diabetic Dyslipidemia (PRESS V). J. Diabetes Sci. Technol. 2014, 8, 132–141. [Google Scholar] [CrossRef]
- Jain, M.R.; Giri, S.R.; Bhoi, B.; Trivedi, C.; Rath, A.; Rathod, R.; Ranvir, R.; Kadam, S.; Patel, H.; Swain, P.; et al. Dual PPARα/γ Agonist Saroglitazar Improves Liver Histopathology and Biochemistry in Experimental NASH Models. Liver Int. 2018, 38, 1084–1094. [Google Scholar] [CrossRef]
- Siddiqui, M.S.; Parmar, D.; Shaikh, F.; Forsgren, M.; Patel, S.; Bui, A.T.; Boyett, S.; Patel, V.; Sanyal, A.J. Saroglitazar Improves Nonalcoholic Fatty Liver Disease and Metabolic Health in Liver Transplant Recipients. Liver Transplant. 2023, 29, 979–986. [Google Scholar] [CrossRef] [PubMed]
- Kaul, U.; Parmar, D.; Manjunath, K.; Shah, M.; Parmar, K.; Patil, K.P.; Jaiswal, A. New Dual Peroxisome Proliferator Activated Receptor Agonist-Saroglitazar in Diabetic Dyslipidemia and Non-Alcoholic Fatty Liver Disease: Integrated Analysis of the Real World Evidence. Cardiovasc. Diabetol. 2019, 18, 80. [Google Scholar] [CrossRef] [PubMed]
- Siddiqui, M.S.; Idowu, M.O.; Parmar, D.; Borg, B.B.; Denham, D.; Loo, N.M.; Lazas, D.; Younes, Z.; Sanyal, A.J. A Phase 2 Double Blinded, Randomized Controlled Trial of Saroglitazar in Patients with Nonalcoholic Steatohepatitis. Clin. Gastroenterol. Hepatol. 2021, 19, 2670–2672. [Google Scholar] [CrossRef]
- Gawrieh, S.; Noureddin, M.; Loo, N.; Mohseni, R.; Awasty, V.; Cusi, K.; Kowdley, K.V.; Lai, M.; Schiff, E.; Parmar, D.; et al. Saroglitazar, a PPAR-α/γ Agonist, for Treatment of NAFLD: A Randomized Controlled Double-Blind Phase 2 Trial. Hepatology 2021, 74, 1809–1824. [Google Scholar] [CrossRef] [PubMed]
- Chaudhuri, S.; Dutta, A.; Chakraborty, S.B.D. Efficacy and Safety of Saroglitazar in Real-World Patients of Non-Alcoholic Fatty Liver Disease with or without Diabetes Including Compensated Cirrhosis: A Tertiary Care Center Experience. JGH Open Open Access J. Gastroenterol. Hepatol. 2023, 7, 215–220. [Google Scholar] [CrossRef]
- Francque, S.M.; Bedossa, P.; Ratziu, V.; Anstee, Q.M.; Bugianesi, E.; Sanyal, A.J.; Loomba, R.; Harrison, S.A.; Balabanska, R.; Mateva, L.; et al. A Randomized, Controlled Trial of the Pan-PPAR Agonist Lanifibranor in NASH. N. Engl. J. Med. 2021, 385, 1547–1558. [Google Scholar] [CrossRef] [PubMed]
- Lee, Y.H.; Kim, J.H.; Kim, S.R.; Jin, H.Y.; Rhee, E.J.; Cho, Y.M.; Lee, B.W. Lobeglitazone, a Novel Thiazolidinedione, Improves Non-Alcoholic Fatty Liver Disease in Type 2 Diabetes: Its Efficacy and Predictive Factors Related to Responsiveness. J. Korean Med. Sci. 2017, 32, 60–69. [Google Scholar] [CrossRef]
- Wu, J.H.Y.; Foote, C.; Blomster, J.; Toyama, T.; Perkovic, V.; Sundström, J.; Neal, B. Effects of Sodium-Glucose Cotransporter-2 Inhibitors on Cardiovascular Events, Death, and Major Safety Outcomes in Adults with Type 2 Diabetes: A Systematic Review and Meta-Analysis. Lancet Diabetes Endocrinol. 2016, 4, 411–419. [Google Scholar] [CrossRef]
- Bonner, C.; Kerr-Conte, J.; Gmyr, V.; Queniat, G.; Moerman, E.; Thévenet, J.; Beaucamps, C.; Delalleau, N.; Popescu, I.; Malaisse, W.J.; et al. Inhibition of the Glucose Transporter SGLT2 with Dapagliflozin in Pancreatic Alpha Cells Triggers Glucagon Secretion. Nat. Med. 2015, 21, 512–517. [Google Scholar] [CrossRef]
- Daniele, G.; Xiong, J.; Solis-Herrera, C.; Merovci, A.; Eldor, R.; Tripathy, D.; DeFronzo, R.A.; Norton, L.; Abdul-Ghani, M. Dapagliflozin Enhances Fat Oxidation and Ketone Production in Patients with Type 2 Diabetes. Diabetes Care 2016, 39, 2036–2041. [Google Scholar] [CrossRef]
- Yokono, M.; Takasu, T.; Hayashizaki, Y.; Mitsuoka, K.; Kihara, R.; Muramatsu, Y.; Miyoshi, S.; Tahara, A.; Kurosaki, E.; Li, Q.; et al. SGLT2 Selective Inhibitor Ipragliflozin Reduces Body Fat Mass by Increasing Fatty Acid Oxidation in High-Fat Diet-Induced Obese Rats. Eur. J. Pharmacol. 2014, 727, 66–74. [Google Scholar] [CrossRef] [PubMed]
- Shimizu, M.; Suzuki, K.; Kato, K.; Jojima, T.; Iijima, T.; Murohisa, T.; Iijima, M.; Takekawa, H.; Usui, I.; Hiraishi, H.; et al. Evaluation of the Effects of Dapagliflozin, a Sodium-Glucose Co-Transporter-2 Inhibitor, on Hepatic Steatosis and Fibrosis Using Transient Elastography in Patients with Type 2 Diabetes and Non-Alcoholic Fatty Liver Disease. Diabetes Obes. Metab. 2019, 21, 285–292. [Google Scholar] [CrossRef]
- Latva-Rasku, A.; Honka, M.-J.; Kullberg, J.; Mononen, N.; Lehtimäki, T.; Saltevo, J.; Kirjavainen, A.K.; Saunavaara, V.; Iozzo, P.; Johansson, L.; et al. The SGLT2 Inhibitor Dapagliflozin Reduces Liver Fat but Does Not Affect Tissue Insulin Sensitivity: A Randomized, Double-Blind, Placebo-Controlled Study with 8-Week Treatment in Type 2 Diabetes Patients. Diabetes Care 2019, 42, 931–937. [Google Scholar] [CrossRef] [PubMed]
- Eriksson, J.W.; Lundkvist, P.; Jansson, P.-A.; Johansson, L.; Kvarnström, M.; Moris, L.; Miliotis, T.; Forsberg, G.-B.; Risérus, U.; Lind, L.; et al. Effects of Dapagliflozin and N-3 Carboxylic Acids on Non-Alcoholic Fatty Liver Disease in People with Type 2 Diabetes: A Double-Blind Randomised Placebo-Controlled Study. Diabetologia 2018, 61, 1923–1934. [Google Scholar] [CrossRef] [PubMed]
- Johansson, L.; Hockings, P.D.; Johnsson, E.; Dronamraju, N.; Maaske, J.; Garcia-Sanchez, R.; Wilding, J.P.H. Dapagliflozin plus Saxagliptin Add-on to Metformin Reduces Liver Fat and Adipose Tissue Volume in Patients with Type 2 Diabetes. Diabetes Obes. Metab. 2020, 22, 1094–1101. [Google Scholar] [CrossRef]
- Frías, J.P.; Maaske, J.; Suchower, L.; Johansson, L.; Hockings, P.D.; Iqbal, N.; Wilding, J.P.H. Long-Term Effects of Dapagliflozin plus Saxagliptin versus Glimepiride on a Background of Metformin in Patients with Type 2 Diabetes: Results of a 104-Week Extension to a 52-Week Randomized, Phase 3 Study and Liver Fat MRI Substudy. Diabetes Obes. Metab. 2022, 24, 61–71. [Google Scholar] [CrossRef]
- Harreiter, J.; Just, I.; Leutner, M.; Bastian, M.; Brath, H.; Schelkshorn, C.; Klepochova, R.; Krššák, M.; Kautzky-Willer, A. Combined Exenatide and Dapagliflozin Has No Additive Effects on Reduction of Hepatocellular Lipids despite Better Glycaemic Control in Patients with Type 2 Diabetes Mellitus Treated with Metformin: EXENDA, a 24-Week, Prospective, Randomized, Placebo-Controlled Pilot Trial. Diabetes Obes. Metab. 2021, 23, 1129–1139. [Google Scholar] [CrossRef]
- Kuchay, M.S.; Krishan, S.; Mishra, S.K.; Farooqui, K.J.; Singh, M.K.; Wasir, J.S.; Bansal, B.; Kaur, P.; Jevalikar, G.; Gill, H.K.; et al. Effect of Empagliflozin on Liver Fat in Patients with Type 2 Diabetes and Nonalcoholic Fatty Liver Disease: A Randomized Controlled Trial (E-LIFT Trial). Diabetes Care 2018, 41, 1801–1808. [Google Scholar] [CrossRef]
- Lai, L.-L.; Vethakkan, S.R.; Nik Mustapha, N.R.; Mahadeva, S.; Chan, W.-K. Empagliflozin for the Treatment of Nonalcoholic Steatohepatitis in Patients with Type 2 Diabetes Mellitus. Dig. Dis. Sci. 2020, 65, 623–631. [Google Scholar] [CrossRef]
- Kahl, S.; Gancheva, S.; Straßburger, K.; Herder, C.; Machann, J.; Katsuyama, H.; Kabisch, S.; Henkel, E.; Kopf, S.; Lagerpusch, M.; et al. Empagliflozin Effectively Lowers Liver Fat Content in Well-Controlled Type 2 Diabetes: A Randomized, Double-Blind, Phase 4, Placebo-Controlled Trial. Diabetes Care 2020, 43, 298–305. [Google Scholar] [CrossRef]
- Gaborit, B.; Ancel, P.; Abdullah, A.E.; Maurice, F.; Abdesselam, I.; Calen, A.; Soghomonian, A.; Houssays, M.; Varlet, I.; Eisinger, M.; et al. Effect of Empagliflozin on Ectopic Fat Stores and Myocardial Energetics in Type 2 Diabetes: The EMPACEF Study. Cardiovasc. Diabetol. 2021, 20, 57. [Google Scholar] [CrossRef] [PubMed]
- Chehrehgosha, H.; Sohrabi, M.R.; Ismail-Beigi, F.; Malek, M.; Reza Babaei, M.; Zamani, F.; Ajdarkosh, H.; Khoonsari, M.; Fallah, A.E.; Khamseh, M.E. Empagliflozin Improves Liver Steatosis and Fibrosis in Patients with Non-Alcoholic Fatty Liver Disease and Type 2 Diabetes: A Randomized, Double-Blind, Placebo-Controlled Clinical Trial. Diabetes Ther. Res. Treat. Educ. Diabetes Relat. Disord. 2021, 12, 843–861. [Google Scholar] [CrossRef] [PubMed]
- Hooshmand Gharabagh, L.; Shargh, A.; Mohammad Hosseini Azar, M.R.; Esmaeili, A. Comparison between the Effect of Empagliflozin and Pioglitazone Added to Metformin in Patients with Type 2 Diabetes and Nonalcoholic Fatty Liver Disease. Clin. Res. Hepatol. Gastroenterol. 2024, 48, 102279. [Google Scholar] [CrossRef]
- Cusi, K.; Bril, F.; Barb, D.; Polidori, D.; Sha, S.; Ghosh, A.; Farrell, K.; Sunny, N.E.; Kalavalapalli, S.; Pettus, J.; et al. Effect of Canagliflozin Treatment on Hepatic Triglyceride Content and Glucose Metabolism in Patients with Type 2 Diabetes. Diabetes Obes. Metab. 2019, 21, 812–821. [Google Scholar] [CrossRef]
- Shibuya, T.; Fushimi, N.; Kawai, M.; Yoshida, Y.; Hachiya, H.; Ito, S.; Kawai, H.; Ohashi, N.; Mori, A. Luseogliflozin Improves Liver Fat Deposition Compared to Metformin in Type 2 Diabetes Patients with Non-Alcoholic Fatty Liver Disease: A Prospective Randomized Controlled Pilot Study. Diabetes Obes. Metab. 2018, 20, 438–442. [Google Scholar] [CrossRef]
- Han, E.; Lee, Y.-H.; Lee, B.-W.; Kang, E.S.; Cha, B.-S. Ipragliflozin Additively Ameliorates Non-Alcoholic Fatty Liver Disease in Patients with Type 2 Diabetes Controlled with Metformin and Pioglitazone: A 24-Week Randomized Controlled Trial. J. Clin. Med. 2020, 9, 259. [Google Scholar] [CrossRef]
- Takahashi, H.; Kessoku, T.; Kawanaka, M.; Nonaka, M.; Hyogo, H.; Fujii, H.; Nakajima, T.; Imajo, K.; Tanaka, K.; Kubotsu, Y.; et al. Ipragliflozin Improves the Hepatic Outcomes of Patients with Diabetes with NAFLD. Hepatol. Commun. 2022, 6, 120–132. [Google Scholar] [CrossRef] [PubMed]
- Yoneda, M.; Kobayashi, T.; Asako, N.; Iwaki, M.; Saito, S.; Nakajima, A. Pan-Peroxisome Proliferator-Activated Receptor Agonist Lanifibranor as a Dominant Candidate Pharmacological Therapy for Nonalcoholic Fatty Liver Disease. Hepatobiliary Surg. Nutr. 2022, 11, 433–435. [Google Scholar] [CrossRef]
- Yoneda, M.; Honda, Y.; Ogawa, Y.; Kessoku, T.; Kobayashi, T.; Imajo, K.; Ozaki, A.; Nogami, A.; Taguri, M.; Yamanaka, T.; et al. Comparing the Effects of Tofogliflozin and Pioglitazone in Non-Alcoholic Fatty Liver Disease Patients with Type 2 Diabetes Mellitus (ToPiND Study): A Randomized Prospective Open-Label Controlled Trial. BMJ Open Diabetes Res. Care 2021, 9, e001990. [Google Scholar] [CrossRef]
- Takeshita, Y.; Honda, M.; Harada, K.; Kita, Y.; Takata, N.; Tsujiguchi, H.; Tanaka, T.; Goto, H.; Nakano, Y.; Iida, N.; et al. Comparison of Tofogliflozin and Glimepiride Effects on Nonalcoholic Fatty Liver Disease in Participants with Type 2 Diabetes: A Randomized, 48-Week, Open-Label, Active-Controlled Trial. Diabetes Care 2022, 45, 2064–2075. [Google Scholar] [CrossRef]
- Wong, C.; Yaow, C.Y.L.; Ng, C.H.; Chin, Y.H.; Low, Y.F.; Lim, A.Y.L.; Muthiah, M.D.; Khoo, C.M. Sodium-Glucose Co-Transporter 2 Inhibitors for Non-Alcoholic Fatty Liver Disease in Asian Patients with Type 2 Diabetes: A Meta-Analysis. Front. Endocrinol. 2020, 11, 609135. [Google Scholar] [CrossRef]
- Sinha, B.; Datta, D.; Ghosal, S. Meta-analysis of the Effects of Sodium Glucose Cotransporter 2 Inhibitors in Non-alcoholic Fatty Liver Disease Patients with Type 2 Diabetes. JGH Open 2021, 5, 219–227. [Google Scholar] [CrossRef] [PubMed]
- Coelho, F.D.S.; Borges-Canha, M.; von Hafe, M.; Neves, J.S.; Vale, C.; Leite, A.R.; Carvalho, D.; Leite-Moreira, A. Effects of Sodium-Glucose Co-Transporter 2 Inhibitors on Liver Parameters and Steatosis: A Meta-Analysis of Randomized Clinical Trials. Diabetes Metab. Res. Rev. 2021, 37, e3413. [Google Scholar] [CrossRef] [PubMed]
- Wei, Q.; Xu, X.; Guo, L.; Li, J.; Li, L. Effect of SGLT2 Inhibitors on Type 2 Diabetes Mellitus with Non-Alcoholic Fatty Liver Disease: A Meta-Analysis of Randomized Controlled Trials. Front. Endocrinol. 2021, 12, 635556. [Google Scholar] [CrossRef] [PubMed]
- Jin, Z.; Yuan, Y.; Zheng, C.; Liu, S.; Weng, H. Effects of Sodium-Glucose Co-Transporter 2 Inhibitors on Liver Fibrosis in Non-Alcoholic Fatty Liver Disease Patients with Type 2 Diabetes Mellitus: An Updated Meta-Analysis of Randomized Controlled Trials. J. Diabetes Complicat. 2023, 37, 108558. [Google Scholar] [CrossRef]
- Hameed, I.; Hayat, J.; Marsia, S.; Samad, S.A.; Khan, R.; Siddiqui, O.M.; Khan, M.O.; Malik, S.; Fatima, K.; Fudim, M.; et al. Comparison of Sodium-Glucose Cotransporter-2 Inhibitors and Thiazolidinediones for Management of Non-Alcoholic Fatty Liver Disease: A Systematic Review and Meta-Analysis. Clin. Res. Hepatol. Gastroenterol. 2023, 47, 102111. [Google Scholar] [CrossRef]
- Cui, J.; Philo, L.; Nguyen, P.; Hofflich, H.; Hernandez, C.; Bettencourt, R.; Richards, L.; Salotti, J.; Bhatt, A.; Hooker, J.; et al. Sitagliptin vs. Placebo for Non-Alcoholic Fatty Liver Disease: A Randomized Controlled Trial. J. Hepatol. 2016, 65, 369–376. [Google Scholar] [CrossRef] [PubMed]
- Joy, T.R.; McKenzie, C.A.; Tirona, R.G.; Summers, K.; Seney, S.; Chakrabarti, S.; Malhotra, N.; Beaton, M.D. Sitagliptin in Patients with Non-Alcoholic Steatohepatitis: A Randomized, Placebo-Controlled Trial. World J. Gastroenterol. 2017, 23, 141–150. [Google Scholar] [CrossRef]
- Nauck, M.A.; Kleine, N.; Orskov, C.; Holst, J.J.; Willms, B.; Creutzfeldt, W. Normalization of Fasting Hyperglycaemia by Exogenous Glucagon-like Peptide 1 (7-36 Amide) in Type 2 (Non-Insulin-Dependent) Diabetic Patients. Diabetologia 1993, 36, 741–744. [Google Scholar] [CrossRef]
- Vilsbøll, T.; Krarup, T.; Deacon, C.F.; Madsbad, S.; Holst, J.J. Reduced Postprandial Concentrations of Intact Biologically Active Glucagon-like Peptide 1 in Type 2 Diabetic Patients. Diabetes 2001, 50, 609–613. [Google Scholar] [CrossRef]
- Newsome, P.N.; Buchholtz, K.; Cusi, K.; Linder, M.; Okanoue, T.; Ratziu, V.; Sanyal, A.J.; Sejling, A.-S.; Harrison, S.A.; NN9931-4296 Investigators. A Placebo-Controlled Trial of Subcutaneous Semaglutide in Nonalcoholic Steatohepatitis. N. Engl. J. Med. 2021, 384, 1113–1124. [Google Scholar] [CrossRef] [PubMed]
- Nagendra, L.; Bg, H.; Sharma, M.; Dutta, D. Semaglutide and Cancer: A Systematic Review and Meta-Analysis. Diabetes Metab. Syndr. 2023, 17, 102834. [Google Scholar] [CrossRef] [PubMed]
- Flint, A.; Andersen, G.; Hockings, P.; Johansson, L.; Morsing, A.; Sundby Palle, M.; Vogl, T.; Loomba, R.; Plum-Mörschel, L. Randomised Clinical Trial: Semaglutide versus Placebo Reduced Liver Steatosis but Not Liver Stiffness in Subjects with Non-Alcoholic Fatty Liver Disease Assessed by Magnetic Resonance Imaging. Aliment. Pharmacol. Ther. 2021, 54, 1150–1161. [Google Scholar] [CrossRef]
- Loomba, R.; Abdelmalek, M.F.; Armstrong, M.J.; Jara, M.; Kjær, M.S.; Krarup, N.; Lawitz, E.; Ratziu, V.; Sanyal, A.J.; Schattenberg, J.M.; et al. Semaglutide 2·4 Mg Once Weekly in Patients with Non-Alcoholic Steatohepatitis-Related Cirrhosis: A Randomised, Placebo-Controlled Phase 2 Trial. Lancet Gastroenterol. Hepatol. 2023, 8, 511–522. [Google Scholar] [CrossRef]
- Armstrong, M.J.; Gaunt, P.; Aithal, G.P.; Barton, D.; Hull, D.; Parker, R.; Hazlehurst, J.M.; Guo, K.; Abouda, G.; Aldersley, M.A.; et al. Liraglutide Safety and Efficacy in Patients with Non-Alcoholic Steatohepatitis (LEAN): A Multicentre, Double-Blind, Randomised, Placebo-Controlled Phase 2 Study. Lancet 2016, 387, 679–690. [Google Scholar] [CrossRef]
- Eguchi, Y.; Kitajima, Y.; Hyogo, H.; Takahashi, H.; Kojima, M.; Ono, M.; Araki, N.; Tanaka, K.; Yamaguchi, M.; Matsuda, Y.; et al. Pilot Study of Liraglutide Effects in Non-Alcoholic Steatohepatitis and Non-Alcoholic Fatty Liver Disease with Glucose Intolerance in Japanese Patients (LEAN-J). Hepatol. Res. 2015, 45, 269–278. [Google Scholar] [CrossRef]
- Tang, A.; Rabasa-Lhoret, R.; Castel, H.; Wartelle-Bladou, C.; Gilbert, G.; Massicotte-Tisluck, K.; Chartrand, G.; Olivié, D.; Julien, A.-S.; de Guise, J.; et al. Effects of Insulin Glargine and Liraglutide Therapy on Liver Fat as Measured by Magnetic Resonance in Patients with Type 2 Diabetes: A Randomized Trial. Diabetes Care 2015, 38, 1339–1346. [Google Scholar] [CrossRef] [PubMed]
- Smits, M.M.; Tonneijck, L.; Muskiet, M.H.A.; Kramer, M.H.H.; Pouwels, P.J.W.; Pieters-van den Bos, I.C.; Hoekstra, T.; Diamant, M.; van Raalte, D.H.; Cahen, D.L. Twelve Week Liraglutide or Sitagliptin Does Not Affect Hepatic Fat in Type 2 Diabetes: A Randomised Placebo-Controlled Trial. Diabetologia 2016, 59, 2588–2593. [Google Scholar] [CrossRef] [PubMed]
- Petit, J.-M.; Cercueil, J.-P.; Loffroy, R.; Denimal, D.; Bouillet, B.; Fourmont, C.; Chevallier, O.; Duvillard, L.; Vergès, B. Effect of Liraglutide Therapy on Liver Fat Content in Patients with Inadequately Controlled Type 2 Diabetes. The Lira-NAFLD Study. J. Clin. Endocrinol. Metab. 2016, 102, 407–415. [Google Scholar] [CrossRef]
- Yan, J.; Yao, B.; Kuang, H.; Yang, X.; Huang, Q.; Hong, T.; Li, Y.; Dou, J.; Yang, W.; Qin, G.; et al. Liraglutide, Sitagliptin, and Insulin Glargine Added to Metformin: The Effect on Body Weight and Intrahepatic Lipid in Patients with Type 2 Diabetes Mellitus and Nonalcoholic Fatty Liver Disease. Hepatology 2019, 69, 2414–2426. [Google Scholar] [CrossRef]
- Guo, W.; Tian, W.; Lin, L.; Xu, X. Liraglutide or Insulin Glargine Treatments Improves Hepatic Fat in Obese Patients with Type 2 Diabetes and Nonalcoholic Fatty Liver Disease in Twenty-Six Weeks: A Randomized Placebo-Controlled Trial. Diabetes Res. Clin. Pract. 2020, 170, 108487. [Google Scholar] [CrossRef] [PubMed]
- Bizino, M.B.; Jazet, I.M.; de Heer, P.; van Eyk, H.J.; Dekkers, I.A.; Rensen, P.C.N.; Paiman, E.H.M.; Lamb, H.J.; Smit, J.W. Placebo-Controlled Randomised Trial with Liraglutide on Magnetic Resonance Endpoints in Individuals with Type 2 Diabetes: A Pre-Specified Secondary Study on Ectopic Fat Accumulation. Diabetologia 2020, 63, 65–74. [Google Scholar] [CrossRef]
- Tian, F.; Zheng, Z.; Zhang, D.; He, S.; Shen, J. Efficacy of Liraglutide in Treating Type 2 Diabetes Mellitus Complicated with Non-Alcoholic Fatty Liver Disease. Biosci. Rep. 2018, 38, BSR20181304. [Google Scholar] [CrossRef] [PubMed]
- Song, T.; Jia, Y.; Li, Z.; Wang, F.; Ren, L.; Chen, S. Effects of Liraglutide on Nonalcoholic Fatty Liver Disease in Patients with Type 2 Diabetes Mellitus: A Systematic Review and Meta-Analysis. Diabetes Ther. Res. Treat. Educ. Diabetes Relat. Disord. 2021, 12, 1735–1749. [Google Scholar] [CrossRef] [PubMed]
- Kuchay, M.S.; Krishan, S.; Mishra, S.K.; Choudhary, N.S.; Singh, M.K.; Wasir, J.S.; Kaur, P.; Gill, H.K.; Bano, T.; Farooqui, K.J.; et al. Effect of Dulaglutide on Liver Fat in Patients with Type 2 Diabetes and NAFLD: Randomised Controlled Trial (D-LIFT Trial). Diabetologia 2020, 63, 2434–2445. [Google Scholar] [CrossRef]
- Sathyanarayana, P.; Jogi, M.; Muthupillai, R.; Krishnamurthy, R.; Samson, S.L.; Bajaj, M. Effects of Combined Exenatide and Pioglitazone Therapy on Hepatic Fat Content in Type 2 Diabetes. Obesity 2011, 19, 2310–2315. [Google Scholar] [CrossRef]
- Dutour, A.; Abdesselam, I.; Ancel, P.; Kober, F.; Mrad, G.; Darmon, P.; Ronsin, O.; Pradel, V.; Lesavre, N.; Martin, J.C.; et al. Exenatide Decreases Liver Fat Content and Epicardial Adipose Tissue in Patients with Obesity and Type 2 Diabetes: A Prospective Randomized Clinical Trial Using Magnetic Resonance Imaging and Spectroscopy. Diabetes Obes. Metab. 2016, 18, 882–891. [Google Scholar] [CrossRef]
- Liu, L.; Yan, H.; Xia, M.; Zhao, L.; Lv, M.; Zhao, N.; Rao, S.; Yao, X.; Wu, W.; Pan, B.; et al. Efficacy of Exenatide and Insulin Glargine on Nonalcoholic Fatty Liver Disease in Patients with Type 2 Diabetes. Diabetes Metab. Res. Rev. 2020, 36, e3292. [Google Scholar] [CrossRef]
- Mantovani, A.; Petracca, G.; Beatrice, G.; Csermely, A.; Lonardo, A.; Targher, G. Glucagon-Like Peptide-1 Receptor Agonists for Treatment of Nonalcoholic Fatty Liver Disease and Nonalcoholic Steatohepatitis: An Updated Meta-Analysis of Randomized Controlled Trials. Metabolites 2021, 11, 73. [Google Scholar] [CrossRef]
- Fang, L.; Li, J.; Zeng, H.; Liu, J. Effects of GLP-1 Receptor Agonists on the Degree of Liver Fibrosis and CRP in Non-Alcoholic Fatty Liver Disease and Non-Alcoholic Steatohepatitis: A Systematic Review and Meta-Analysis. Prim. Care Diabetes 2024, 18, 268–276. [Google Scholar] [CrossRef]
- Gastaldelli, A.; Cusi, K.; Fernández Landó, L.; Bray, R.; Brouwers, B.; Rodríguez, Á. Effect of Tirzepatide versus Insulin Degludec on Liver Fat Content and Abdominal Adipose Tissue in People with Type 2 Diabetes (SURPASS-3 MRI): A Substudy of the Randomised, Open-Label, Parallel-Group, Phase 3 SURPASS-3 Trial. Lancet Diabetes Endocrinol. 2022, 10, 393–406. [Google Scholar] [CrossRef] [PubMed]
- Loomba, R.; Hartman, M.L.; Lawitz, E.J.; Vuppalanchi, R.; Boursier, J.; Bugianesi, E.; Yoneda, M.; Behling, C.; Cummings, O.W.; Tang, Y.; et al. Tirzepatide for Metabolic Dysfunction-Associated Steatohepatitis with Liver Fibrosis. N. Engl. J. Med. 2024, 391, 299–310. [Google Scholar] [CrossRef] [PubMed]
- Boland, M.L.; Laker, R.C.; Mather, K.; Nawrocki, A.; Oldham, S.; Boland, B.B.; Lewis, H.; Conway, J.; Naylor, J.; Guionaud, S.; et al. Resolution of NASH and Hepatic Fibrosis by the GLP-1R/GcgR Dual-Agonist Cotadutide via Modulating Mitochondrial Function and Lipogenesis. Nat. Metab. 2020, 2, 413–431. [Google Scholar] [CrossRef]
- Parker, V.E.R.; Robertson, D.; Erazo-Tapia, E.; Havekes, B.; Phielix, E.; de Ligt, M.; Roumans, K.H.M.; Mevenkamp, J.; Sjoberg, F.; Schrauwen-Hinderling, V.B.; et al. Cotadutide Promotes Glycogenolysis in People with Overweight or Obesity Diagnosed with Type 2 Diabetes. Nat. Metab. 2023, 5, 2086–2093. [Google Scholar] [CrossRef]
- Harrison, S.A.; Fecht, W.; Brunt, E.M.; Neuschwander-Tetri, B.A. Orlistat for Overweight Subjects with Nonalcoholic Steatohepatitis: A Randomized, Prospective Trial. Hepatology 2009, 49, 80–86. [Google Scholar] [CrossRef]
- Sanyal, A.J.; Chalasani, N.; Kowdley, K.V.; McCullough, A.; Diehl, A.M.; Bass, N.M.; Neuschwander-Tetri, B.A.; Lavine, J.E.; Tonascia, J.; Unalp, A.; et al. Pioglitazone, Vitamin E, or Placebo for Nonalcoholic Steatohepatitis. N. Engl. J. Med. 2010, 362, 1675–1685. [Google Scholar] [CrossRef]
- Bril, F.; Biernacki, D.M.; Kalavalapalli, S.; Lomonaco, R.; Subbarayan, S.K.; Lai, J.; Tio, F.; Suman, A.; Orsak, B.K.; Hecht, J.; et al. Role of Vitamin E for Nonalcoholic Steatohepatitis in Patients with Type 2 Diabetes: A Randomized Controlled Trial. Diabetes Care 2019, 42, 1481–1488. [Google Scholar] [CrossRef] [PubMed]
- Hatziagelaki, E.; Paschou, S.A.; Schön, M.; Psaltopoulou, T.; Roden, M. NAFLD and Thyroid Function: Pathophysiological and Therapeutic Considerations. Trends Endocrinol. Metab. TEM 2022, 33, 755–768. [Google Scholar] [CrossRef]
- Karim, G.; Bansal, M.B. Resmetirom: An Orally Administered, Smallmolecule, Liver-Directed, β-Selective THR Agonist for the Treatment of Non-Alcoholic Fatty Liver Disease and Non-Alcoholic Steatohepatitis. TouchREVIEWS Endocrinol. 2023, 19, 60–70. [Google Scholar] [CrossRef]
- Sinha, R.A.; Singh, B.K.; Yen, P.M. Thyroid Hormone Regulation of Hepatic Lipid and Carbohydrate Metabolism. Trends Endocrinol. Metab. TEM 2014, 25, 538–545. [Google Scholar] [CrossRef]
- Sinha, R.A.; You, S.-H.; Zhou, J.; Siddique, M.M.; Bay, B.-H.; Zhu, X.; Privalsky, M.L.; Cheng, S.-Y.; Stevens, R.D.; Summers, S.A.; et al. Thyroid Hormone Stimulates Hepatic Lipid Catabolism via Activation of Autophagy. J. Clin. Investig. 2012, 122, 2428–2438. [Google Scholar] [CrossRef] [PubMed]
- Sinha, R.A.; Singh, B.K.; Zhou, J.; Wu, Y.; Farah, B.L.; Ohba, K.; Lesmana, R.; Gooding, J.; Bay, B.-H.; Yen, P.M. Thyroid Hormone Induction of Mitochondrial Activity Is Coupled to Mitophagy via ROS-AMPK-ULK1 Signaling. Autophagy 2015, 11, 1341–1357. [Google Scholar] [CrossRef] [PubMed]
- Kannt, A.; Wohlfart, P.; Madsen, A.N.; Veidal, S.S.; Feigh, M.; Schmoll, D. Activation of Thyroid Hormone Receptor-β Improved Disease Activity and Metabolism Independent of Body Weight in a Mouse Model of Non-Alcoholic Steatohepatitis and Fibrosis. Br. J. Pharmacol. 2021, 178, 2412–2423. [Google Scholar] [CrossRef]
- Marschner, R.A.; Arenhardt, F.; Ribeiro, R.T.; Wajner, S.M. Influence of Altered Thyroid Hormone Mechanisms in the Progression of Metabolic Dysfunction Associated with Fatty Liver Disease (MAFLD): A Systematic Review. Metabolites 2022, 12, 675. [Google Scholar] [CrossRef]
- Harrison, S.A.; Bashir, M.; Moussa, S.E.; McCarty, K.; Pablo Frias, J.; Taub, R.; Alkhouri, N. Effects of Resmetirom on Noninvasive Endpoints in a 36-Week Phase 2 Active Treatment Extension Study in Patients with NASH. Hepatol. Commun. 2021, 5, 573–588. [Google Scholar] [CrossRef] [PubMed]
- Harrison, S.A.; Bedossa, P.; Guy, C.D.; Schattenberg, J.M.; Loomba, R.; Taub, R.; Labriola, D.; Moussa, S.E.; Neff, G.W.; Rinella, M.E.; et al. A Phase 3, Randomized, Controlled Trial of Resmetirom in NASH with Liver Fibrosis. N. Engl. J. Med. 2024, 390, 497–509. [Google Scholar] [CrossRef]
- Neuschwander-Tetri, B.A.; Loomba, R.; Sanyal, A.J.; Lavine, J.E.; Van Natta, M.L.; Abdelmalek, M.F.; Chalasani, N.; Dasarathy, S.; Diehl, A.M.; Hameed, B.; et al. Farnesoid X Nuclear Receptor Ligand Obeticholic Acid for Non-Cirrhotic, Non-Alcoholic Steatohepatitis (FLINT): A Multicentre, Randomised, Placebo-Controlled Trial. Lancet 2015, 385, 956–965. [Google Scholar] [CrossRef]
- Sanyal, A.J.; Ratziu, V.; Loomba, R.; Anstee, Q.M.; Kowdley, K.V.; Rinella, M.E.; Sheikh, M.Y.; Trotter, J.F.; Knapple, W.; Lawitz, E.J.; et al. Results from a New Efficacy and Safety Analysis of the REGENERATE Trial of Obeticholic Acid for Treatment of Pre-Cirrhotic Fibrosis Due to Non-Alcoholic Steatohepatitis. J. Hepatol. 2023, 79, 1110–1120. [Google Scholar] [CrossRef]
- Sinal, C.J.; Tohkin, M.; Miyata, M.; Ward, J.M.; Lambert, G.; Gonzalez, F.J. Targeted Disruption of the Nuclear Receptor FXR/BAR Impairs Bile Acid and Lipid Homeostasis. Cell 2000, 102, 731–744. [Google Scholar] [CrossRef]
- Calle, R.A.; Amin, N.B.; Carvajal-Gonzalez, S.; Ross, T.T.; Bergman, A.; Aggarwal, S.; Crowley, C.; Rinaldi, A.; Mancuso, J.; Aggarwal, N.; et al. ACC Inhibitor Alone or Co-Administered with a DGAT2 Inhibitor in Patients with Non-Alcoholic Fatty Liver Disease: Two Parallel, Placebo-Controlled, Randomized Phase 2a Trials. Nat. Med. 2021, 27, 1836–1848. [Google Scholar] [CrossRef]
- Imai, N.; Cohen, D.E. Trimming the Fat: Acetyl-CoA Carboxylase Inhibition for the Management of NAFLD. Hepatology 2018, 68, 2062–2065. [Google Scholar] [CrossRef]
- Loomba, R.; Kayali, Z.; Noureddin, M.; Ruane, P.; Lawitz, E.J.; Bennett, M.; Wang, L.; Harting, E.; Tarrant, J.M.; McColgan, B.J.; et al. GS-0976 Reduces Hepatic Steatosis and Fibrosis Markers in Patients with Nonalcoholic Fatty Liver Disease. Gastroenterology 2018, 155, 1463–1473.e6. [Google Scholar] [CrossRef] [PubMed]
- Beysen, C.; Schroeder, P.; Wu, E.; Brevard, J.; Ribadeneira, M.; Lu, W.; Dole, K.; O’Reilly, T.; Morrow, L.; Hompesch, M.; et al. Inhibition of Fatty Acid Synthase with FT-4101 Safely Reduces Hepatic de Novo Lipogenesis and Steatosis in Obese Subjects with Non-Alcoholic Fatty Liver Disease: Results from Two Early-Phase Randomized Trials. Diabetes Obes. Metab. 2021, 23, 700–710. [Google Scholar] [CrossRef] [PubMed]
- Brown, J.M.; Rudel, L.L. Stearoyl-Coenzyme A Desaturase 1 Inhibition and the Metabolic Syndrome: Considerations for Future Drug Discovery. Curr. Opin. Lipidol. 2010, 21, 192–197. [Google Scholar] [CrossRef]
- Jeyakumar, S.M.; Vajreswari, A. Stearoyl-CoA Desaturase 1: A Potential Target for Non-Alcoholic Fatty Liver Disease?-Perspective on Emerging Experimental Evidence. World J. Hepatol. 2022, 14, 168–179. [Google Scholar] [CrossRef]
- Ratziu, V.; de Guevara, L.; Safadi, R.; Poordad, F.; Fuster, F.; Flores-Figueroa, J.; Arrese, M.; Fracanzani, A.L.; Ben Bashat, D.; Lackner, K.; et al. Aramchol in Patients with Nonalcoholic Steatohepatitis: A Randomized, Double-Blind, Placebo-Controlled Phase 2b Trial. Nat. Med. 2021, 27, 1825–1835. [Google Scholar] [CrossRef] [PubMed]
- Loomba, R.; Morgan, E.; Watts, L.; Xia, S.; Hannan, L.A.; Geary, R.S.; Baker, B.F.; Bhanot, S. Novel Antisense Inhibition of Diacylglycerol O-Acyltransferase 2 for Treatment of Non-Alcoholic Fatty Liver Disease: A Multicentre, Double-Blind, Randomised, Placebo-Controlled Phase 2 Trial. Lancet Gastroenterol. Hepatol. 2020, 5, 829–838. [Google Scholar] [CrossRef] [PubMed]
- Kazierad, D.J.; Chidsey, K.; Somayaji, V.R.; Bergman, A.J.; Birnbaum, M.J.; Calle, R.A. Inhibition of Ketohexokinase in Adults with NAFLD Reduces Liver Fat and Inflammatory Markers: A Randomized Phase 2 Trial. Med 2021, 2, 800–813.e3. [Google Scholar] [CrossRef]
- Perumpail, B.J.; Li, A.A.; John, N.; Sallam, S.; Shah, N.D.; Kwong, W.; Cholankeril, G.; Kim, D.; Ahmed, A. The Therapeutic Implications of the Gut Microbiome and Probiotics in Patients with NAFLD. Diseases 2019, 7, 27. [Google Scholar] [CrossRef]
- Mohamad Nor, M.H.; Ayob, N.; Mokhtar, N.M.; Raja Ali, R.A.; Tan, G.C.; Wong, Z.; Shafiee, N.H.; Wong, Y.P.; Mustangin, M.; Nawawi, K.N.M. The Effect of Probiotics (MCP® BCMC® Strains) on Hepatic Steatosis, Small Intestinal Mucosal Immune Function, and Intestinal Barrier in Patients with Non-Alcoholic Fatty Liver Disease. Nutrients 2021, 13, 3192. [Google Scholar] [CrossRef]
- Loomba, R.; Sanyal, A.J.; Kowdley, K.V.; Bhatt, D.L.; Alkhouri, N.; Frias, J.P.; Bedossa, P.; Harrison, S.A.; Lazas, D.; Barish, R.; et al. Randomized, Controlled Trial of the FGF21 Analogue Pegozafermin in NASH. N. Engl. J. Med. 2023, 389, 998–1008. [Google Scholar] [CrossRef] [PubMed]
- Harrison, S.A.; Abdelmalek, M.F.; Neff, G.; Gunn, N.; Guy, C.D.; Alkhouri, N.; Bashir, M.R.; Freilich, B.; Kohli, A.; Khazanchi, A.; et al. Aldafermin in Patients with Non-Alcoholic Steatohepatitis (ALPINE 2/3): A Randomised, Double-Blind, Placebo-Controlled, Phase 2b Trial. Lancet Gastroenterol. Hepatol. 2022, 7, 603–616. [Google Scholar] [CrossRef] [PubMed]
- Ratziu, V.; Sanyal, A.; Harrison, S.A.; Wong, V.W.-S.; Francque, S.; Goodman, Z.; Aithal, G.P.; Kowdley, K.V.; Seyedkazemi, S.; Fischer, L.; et al. Cenicriviroc Treatment for Adults with Nonalcoholic Steatohepatitis and Fibrosis: Final Analysis of the Phase 2b CENTAUR Study. Hepatology 2020, 72, 892–905. [Google Scholar] [CrossRef] [PubMed]
- Anstee, Q.M.; Neuschwander-Tetri, B.A.; Wai-Sun Wong, V.; Abdelmalek, M.F.; Rodriguez-Araujo, G.; Landgren, H.; Park, G.S.; Bedossa, P.; Alkhouri, N.; Tacke, F.; et al. Cenicriviroc Lacked Efficacy to Treat Liver Fibrosis in Nonalcoholic Steatohepatitis: AURORA Phase III Randomized Study. Clin. Gastroenterol. Hepatol. 2024, 22, 124–134.e1. [Google Scholar] [CrossRef]
- Harrison, S.A.; Wong, V.W.-S.; Okanoue, T.; Bzowej, N.; Vuppalanchi, R.; Younes, Z.; Kohli, A.; Sarin, S.; Caldwell, S.H.; Alkhouri, N.; et al. Selonsertib for Patients with Bridging Fibrosis or Compensated Cirrhosis Due to NASH: Results from Randomized Phase III STELLAR Trials. J. Hepatol. 2020, 73, 26–39. [Google Scholar] [CrossRef]
- Chalasani, N.; Abdelmalek, M.F.; Garcia-Tsao, G.; Vuppalanchi, R.; Alkhouri, N.; Rinella, M.; Noureddin, M.; Pyko, M.; Shiffman, M.; Sanyal, A.; et al. Effects of Belapectin, an Inhibitor of Galectin-3, in Patients with Nonalcoholic Steatohepatitis with Cirrhosis and Portal Hypertension. Gastroenterology 2020, 158, 1334–1345.e5. [Google Scholar] [CrossRef]
- Harrison, S.A.; Abdelmalek, M.F.; Caldwell, S.; Shiffman, M.L.; Diehl, A.M.; Ghalib, R.; Lawitz, E.J.; Rockey, D.C.; Schall, R.A.; Jia, C.; et al. Simtuzumab Is Ineffective for Patients with Bridging Fibrosis or Compensated Cirrhosis Caused by Nonalcoholic Steatohepatitis. Gastroenterology 2018, 155, 1140–1153. [Google Scholar] [CrossRef]

| Study (year) | Study Population | Duration | Intervention | Liver Outcomes | Metabolic Outcomes |
|---|---|---|---|---|---|
| PPAR Agonists and experimental PPAR agonists | |||||
| Pioglitazone [35] | 55 patients with T2DM/impaired glucose tolerance (IGT) + liver biopsy confirmed NASH | 24 weeks | Hypocaloric diet + pioglitazone (45 mg daily) vs. hypocaloric diet + placebo | Hepatic fat content (MRS): significant reduction from baseline compared to placebo (54% vs. unchanged, p < 0.001) Steatosis: significant improvement in pioglitazone group compared to placebo (65% vs. 38%; p = 0.003) Ballooning necrosis: significant improvement in pioglitazone group compared to placebo (54% vs. 24%; p = 0.02), Lobular inflammation: significant improvement in pioglitazone group compared to placebo (65% vs. 29%; p = 0.008). Necroinflammation: significantly greater reduction in pioglitazone group (85% vs. 35%; p = 0.001) Fibrosis: no significant difference between groups (46% vs. 33%; p = 0.08) | Pioglitazone group showed significantly greater improvement in HbA1c (p = 0.008), FPG (p = 0.011), and fasting plasma insulin (p < 0.001) compared to placebo. Significant weight gain was seen in the pioglitazone group (p = 0.003). Plasma adiponectin increased 2.3-fold in pioglitazone group vs. unchanged in placebo (p < 0.001). |
| Pioglitazone [36] | 101 patients with prediabetes or T2DM and biopsy-proven NASH | 36 months total (18 months intervention, 18 month open-label pioglitazone treatment phase) | Hypocaloric diet + pioglitazone 45 mg/day vs. placebo | ≥2 point reduction in NAFLD activity score (NAS) in 2 histologic categories without worsening of fibrosis: significantly higher in pioglitazone group than placebo (58% vs. 17%; p < 0.001) NASH resolution: significantly higher in pioglitazone group than placebo (51% vs. 19%; p < 0.001) Steatosis: significant improvement in pioglitazone group compared to placebo (71% vs. 26%; p < 0.001) Hepatocellular ballooning: significant improvement in pioglitazone group compared to placebo (51% vs. 24%; p = 0.004) Lobular inflammation: significant improvement in pioglitazone group compared to placebo (49% vs. 22%; p = 0.004) Fibrosis: no significant difference between groups NAS improvement: significantly higher in pioglitazone group than placebo (66% vs. 21%; p < 0.001) Progression of fibrosis: significantly fewer in pioglitazone group compared to placebo (12% vs. 28%; p = 0.039) Hepatic triglyceride content: significant reduction in pioglitazone (19% to 7%) compared to placebo (15% to 11%); p < 0.001 | Pioglitazone group showed significant improvement in hepatic (p = 0.002), muscle (p < 0.001), and adipose tissue insulin sensitivity (p < 0.001) compared to placebo. Plasma adiponectin significantly increased (p < 0.001). In T2DM patients, pioglitazone significantly reduced HbA1c (p = 0.009), FPG (p = 0.020), and fasting plasma insulin (p = 0.041) compared to placebo. |
| Pioglitazone [37] | 101 patients with biopsy-proven NASH and T2DM (n = 52) or prediabetes (n = 49) | 18 months | Pioglitazone 30–45 mg po daily vs. placebo | ≥2 point reduction in NAFLD activity score without worsening fibrosis: Achieved by 60% of T2DM and 70% of prediabetes groups (p = 0.51). NASH resolution: Significant in T2DM group only compared to placebo (60% vs. 16%, p = 0.002). Histologic scores: Similar response in both groups (T2DM −1.3 ± 1.8 vs. prediabetes −1.2 ± 1.9) Histologic improvements: Both groups improved in steatosis; only T2DM showed significant improvements in inflammation (p = 0.013) and ballooning (p = 0.006). Fibrosis: Similar reduction in both groups; significant in T2DM compared to placebo (p = 0.042). Intrahepatic triglyceride content (MRS): Similar reduction in both groups. | Hepatic and muscle insulin sensitivity: Similar response in both T2DM and prediabetes groups. Adipose insulin sensitivity: Significantly higher in T2DM patients. HbA1c: Significant reduction in T2DM group (p = 0.017); interaction with pioglitazone not significant (p = 0.09). Fasting plasma insulin (FPI): Significant reduction in prediabetes group only (p < 0.001). Adiponectin: Significant increase in both T2DM and prediabetes groups (p < 0.001). |
| Pioglitazone [38] | 90 patients in Taiwan with biopsy-proven NASH with (23%) and without T2DM | 24 weeks | Pioglitazone 30 mg po daily vs. placebo | NAFLD activity score: Significant decrease in pioglitazone group (4.27 to 2.53, p < 0.0001). Steatosis: Significant decrease in pioglitazone group (p < 0.0001). Lobular inflammation: Significant decrease in pioglitazone group (p = 0.002). Ballooning: No significant change in either group. Fibrosis reduction ≥1 score: No significant difference between groups. NAS fibrosis score: Increase in placebo group (0.75 to 1.11, p = 0.007). Fibrosis progression: 6.7% (pioglitazone) vs. 33.3% (placebo); p = 0.02. NASH improvement without worsening fibrosis: Greater in pioglitazone group (46.7% vs. 11.1%, p = 0.002). NASH resolution: No significant difference (pioglitazone 26.7%, placebo 11.1%; p = 0.103). Liver fat content (MRI-PDFF): Significant reduction in pioglitazone group (20.2% to 14.3%, p < 0.0001). | HbA1c: significant reduction from baseline in pioglitazone group (p = 0.003) FPG: significant decrease from baseline in pioglitazone group (p = 0.02) |
| Saroglitazar [43] | 16 patients with biopsy-proven NASH and NAS ≥4 with 1 point in each NAS component | 24 weeks | Placebo vs saroglitazar 2 mg vs. 4 mg | NAS decrease from baseline: No significant difference in saroglitazar 2 mg (42.9%), 4 mg (66.7%), or placebo (33.3%). NASH resolution: Saroglitazar 2 mg (42.9%), 4 mg (66.7%), placebo (0%). Liver fibrosis improvement: Saroglitazar 2 mg (33.3%), 4 mg (57.1%), placebo (0%). Steatosis: Significant improvement in both saroglitazar groups. Hepatocellular ballooning: Significant improvement in both saroglitazar groups. | |
| Saroglitazar [44] | 103 patients with NAFLD (diagnosed by imaging) or NASH (diagnosed by biopsy) with ALT ≥ 50 U/L | 16 weeks | Placebo vs saroglitazar 1 mg, 2 mg, and 4 mg | LFC (MRI-PDFF): Significant reduction in saroglitazar 4 mg group (−19.7% vs. +4.1%, p = 0.004). LFC (CAP) and liver stiffness (kPa): No significant difference from baseline at any dose. | Body weight: Non-significant dose-dependent increase. FPG, insulin, HbA1c: No significant difference from baseline at any dose. HOMA-IR: Significant improvement with saroglitazar 4 mg only (p = 0.047). Adiponectin: Significant increase with saroglitazar 1 mg (p = 0.007) and 4 mg (p < 0.001). Lipids: Significant reduction in triglycerides (TG) (p < 0.001) and VLDL (p = 0.017) at saroglitazar 4 mg; in TG (p = 0.001) and VLDL (p = 0.009) at saroglitazar 1 mg |
| Saroglitazar [45] | 63 patients with NAFLD/NASH (diagnosed by imaging or histology) with (n = 29) and without T2DM | 24 weeks, 52 weeks | Saroglitazar 4 mg once daily | CAP (VCTE): Significant improvement at 24 and 52 weeks (p < 0.001 both) with a 14% reduction (p < 0.001). LSM (VCTE): Significant improvement at 24 and 52 weeks (p < 0.001 both) with a 17% and 22% reduction in F4 fibrosis (p < 0.001). | Body weight: Nonsignificant increase at 24 and 52 weeks. Cholesterol: −16.5% reduction at 24 weeks, −24.1% at 52 weeks (p < 0.001 for both). Triglycerides: −29.6% reduction at 24 weeks, −40.6% at 52 weeks (p < 0.001 for both). LDL-C: −15.9% reduction at 24 weeks, −25.6% at 52 weeks (p < 0.001 for both). |
| Lanifibranor [46] | 247 patients with noncirrhotic (<stage F4) highly active NASH and with (n = 103) and without T2DM | 24 weeks | Placebo vs. Lanifibranor 800 mg vs. Lanifibranor 1200 mg daily | SAF-A score decrease ≥2 points without worsening fibrosis: Significantly higher in Lanifibranor 1200 mg group vs. placebo (55% vs. 33%; RR 1.7; 95% CI 1.2–2.3; p = 0.007); not significant in Lanifibranor 800 mg group vs. placebo (48% vs. 33%; RR 1.5; 95% CI 1.0–2.1; p = 0.07). Improvement in fibrosis stage ≥1 with no worsening of NASH: Higher in Lanifibranor 1200 mg (48%; RR 1.68; 95% CI 1.15–2.46) vs. placebo (29%); not significant in Lanifibranor 800 mg (38%; RR 1.15; 95% CI 0.72–1.85). NASH resolution: Greater in Lanifibranor 1200 mg (49%; RR 2.20; 95% CI 1.49–3.26) and Lanifibranor 800 mg (RR 1.70; 95% CI 1.07–2.71). NASH resolution with fibrosis stage ≥1 improvement: Greater in Lanifibranor 1200 mg (35%; RR 3.95; 95% CI 2.03–7.66) and Lanifibranor 800 mg (25%; RR 2.57; 95% CI 1.20–5.51). | FPG (mmol/l): Lanifibranor 1200 mg (−0.60) vs. 800 mg (−0.78) vs. placebo (0.24) HbA1c (%): Lanifibranor 1200 mg (−0.41%) vs. 800 mg (−0.38%) vs. placebo (0.11%) HOMA-IR: Lanifibranor 1200 mg (−5.46) vs. 800 mg (−5.79) vs. placebo (−1.47) Adiponectin (ug/mL): Lanifibranor 1200 mg (17.12) vs. 800 mg (11.95) vs. placebo (−0.35) |
| SGLT2 Inhibitors | |||||
| Dapagliflozin [52] | 57 patients with T2DM and NAFLD | 24 weeks | Dapagliflozin 5 mg/day | LSM was positively correlated with markers of liver fibrosis including decrease in CAP from 314 ± 61 to 290 ± 73 dB/m (p = 0.0424). LSM also decreased significantly from 14.7 ± 5.7 to 11.0 ± 7.3 kPa (p = 0.0158). | Alanine aminotransferase, gamma-glutalytranspeptidase, and visceral fat mass also decreased in the experimental group |
| Dapagliflozin [53] | 32 patients with T2DM with A1c 6.5–10.5 and >3 months stable of metformin, dipeptidyl peptidase 4 inhibitor, or their combination | 8 weeks | Dapagliflozin 10 mg or placebo daily for 8 weeks | Significant placebo-corrected decrease in liver PDFF (−3.74%, p < 0.01), liver volume (−0.10 L, p < 0.05) Tissue specific insulin stimulated glucose uptake was unchanged in the liver. | Significant reductions were also seen in visceral adipose tissue volume (−0.35 L, p < 0.01), IL-6 (−1.87 pg/mL, p < 0.05), and N-terminal prohormone of BNP (−96 ng/L, p = 0.03). |
| Dapagliflozin and N-3 carboxylic acids [54] | 84 participants with T2DM and NAFLD | 12 weeks | Dapagliflozin 10 mg vs. OM-3CA 4 g vs. combination of both vs. placebo | All treatments reduced liver PDFF: OM-3CA −15%; dapagliflozin −13%; OM-3CA + dapagliflozin −21%. Combination therapy reduced liver PDFF (p = 0.046). Total liver fat was reduced by −24%, p = 0.037. | Dapagliflozin monotherapy and combination therapy with OM-3CA showed improvements with glucose control, reduction in body weight, and abdominal fat. |
| Dapagliflozin plus saxagliptin add on to Metformin [55] | 82 patients with T2DM (HbA1c 7.5–10.5%) on >1500 mg/day | 52 weeks | Dapagliflozin 10 mg/day plus saxagliptin 5 mg/day vs. titrated glimepiride 1–6 mg | >30% reduction in liver fat by MRI-PDFF from baseline (p = 0.007) was seen with dapagliflozin plus saxagliptin plus metformin at week 52 | >10% reduction in adipose tissue volumes (p < 0.01), as well as reduction in body weight, serum ALT and ALT with dapagliflozin plus saxagliptin plus metformin at 52 weeks |
| Combined exenatide (EXE) and dapagliflozin (DAPA) [57] | 30 patients age 18–75 with BMI > 25 kg/m2 and metformin > 1000 mg | 24 weeks | Weekly EXE and daily DAPA versus weekly placebo and daily DAPA | HCLs reduced by −35.6% in EXE-DAPA group and −32.5% in PLAC + DAPA group. Subcutaneous adipose tissue (SAT) and visceral adipose tissue (VAT) mean differences: −0.66 (CI −1.02 to 0.82) and −0.10 (−2.53 to 1.21), respectively. | Subcutaneous and visceral adipose tissue were reduced in both treatment groups. HbA1c and fasting glucose were reduced in the EXE + DAPA group. Body weight was reduced in both therapy groups. |
| Dapagliflozin (DAPA) plus saxagliptin (SAXA) vs. glimepiride (GLIM) [56] | 338 patients with T2DM on background metformin (MET)therapy | 156 weeks | DAPA + SAXA 10/5 mg plus placebo versus GLIM (1–6 mg) plus placebo once daily | DAPA + SAXA + MET reduced baseline liver fat, VAT by −4.89%, −0.41 L, and SAT by −0.44 L compared to GLIM + MET at week 122. | VAT and SAT reduced with DAPA + SAXA + MET at week 122. Therapeutic glycemic control was achieved by 21.4% of DAPA + SAXA + MET versus 11.7% of GLIM + MET at week 156. |
| Empagliflozin [58] | 50 patients with T2DM (HbA1c 7.0–10.0%) and NAFLD by MRI-PDFF > 6%) | 20 weeks | Empagliflozin 10 mg daily + standard T2DM treatment vs. standard treatment only | Liver fat by MRI-PDFF: significant reduction in empagliflozin group compared to control (mean difference –4.0%, p < 0.0001) and compared to baseline (16.2% to 11.3%, p < 0.0001) | FPG: both groups had significant decrease from baseline (p < 0.0001 for both), no significant between groups HbA1c: both groups had significant decrease from baseline (p < 0.0001), no significant between groups |
| Empagliflozin [60] | 84 patients with T2DM (HbA1c 6.0–8.0%) not on current antihyperglycemic management with (79%) and without NAFLD by MRS | 24 weeks | Empagliflozin 25 mg daily vs. placebo | LFC (MRS): significant reduction in empagliflozin group compared to placebo (placebo-corrected absolute reduction –1.8%, p = 0.02; placebo-corrected relative reduction –22%, p = 0.009) | Weight loss: empagliflozin group had placebo-corrected reduction (−2.5 kg, p < 0.001) Tissue-specific insulin sensitivity: no placebo-corrected change in skeletal muscle and hepatic insulin sensitivity FPG: significant placebo-corrected reduction in empagliflozin group (p = 0.01) HbA1c: no significant placebo-corrected change |
| Empagliflozin [59] | 9 patients with T2DM and biopsy-proven NASH | 24 weeks | Empagliflozin 25 mg daily (single arm) | Liver fat fraction (MRI): significant median reduction (−7.8%; p = 0.017). Steatosis grade: significant median reduction (p = 0.014). Ballooning grade: significant median reduction (p = 0.034). Inflammation grade: nonsignificant trend toward reduction (p = 0.157). Fibrosis stage: significant median reduction (p = 0.046). NASH resolution without worsening fibrosis: 44% of patients. Progression to cirrhosis: none. | FPG: significant median reduction from baseline (p = 0.008) HbA1c: no significant median reduction from baseline |
| Empagliflozin [61] | 56 patients with T2DM (HbA1c 7–10%) with (96%) or without NAFLD by imaging | 12 weeks | Empagliflozin 10 mg daily vs. placebo | Liver fat content by MRS: significant reduction in empagliflozin group compared to placebo (27% vs. 2%, p = 0.0005). Significant reduction from baseline in empagliflozin group only (p < 0.0001) | VAT: significant reduction from baseline in empagliflozin group (p = 0.04) and compared to placebo (p = 0.04) SAT: significant reduction from baseline in empagliflozin group (p < 0.001), but not compared to placebo Epicardial fat volume, myocardial fat content and pancreatic fat content: no significant change from baseline in either group and no difference between groups Weight loss: significant reduction in empagliflozin group compared to placebo (p = 0.0047) and compared to baseline (p < 0.0001) FPG: significant reduction in empagliflozin group compared to placebo (p = 0.0063) HbA1c: significant reduction compared to placebo (p = 0.0033) |
| Empagliflozin [62] | 106 patients with T2DM (HbA1c 7–10%) and NAFLD by CAP ≥ 238 dB/m | 24 weeks | Empagliflozin 10 mg daily vs. pioglitazone 30 mg daily vs. placebo | LFC (CAP): Empagliflozin showed borderline significant improvement vs. placebo (mean difference: −29.6 dB/m vs. −16.4 dB/m, p = 0.05); pioglitazone did not (p = 0.08). LSM (VCTE): Empagliflozin significantly reduced LSM (−0.77 kPa, p = 0.02); pioglitazone did not (0.01 kPa, p = 0.98); between groups p = 0.03. NAFLD fibrosis score, FIB-4 index: No significant changes | HbA1c: Significant decrease in empagliflozin (p = 0.001) and pioglitazone (p < 0.001); greater decrease in pioglitazone vs. empagliflozin (p = 0.01). FPG: Significant decrease in pioglitazone group (p < 0.001). Fasting insulin: Significant decrease in pioglitazone group (p = 0.008). HOMA-IR: Significant decrease in pioglitazone group (p < 0.001). HOMA2-IR: Significant decrease in pioglitazone group (p < 0.001). Body weight: Significant reduction in empagliflozin group (p < 0.001); significant increase in pioglitazone group (p = 0.007). VAT: Significant increase in pioglitazone (p = 0.006) and placebo (p = 0.005); significant difference in empagliflozin vs. pioglitazone (p = 0.01). |
| Empagliflozin and pioglitazone [63] | 60 patients with T2DM (HbA1c 7.0–10.0%) and NAFLD (≥F1 on VCTE with CAP > 238) | 24 weeks | Metformin + empagliflozin 10 mg daily vs. metformin + pioglitazone 30 mg daily | NAFLD grade (US): Significant reduction in both groups (p < 0.001), no significant difference between groups (p = 0.34). Liver fibrosis grade (VCTE): Significant reduction in both groups (p < 0.001), no significant difference between groups (p = 0.48). LSM (kPa): Significant reduction in both groups (p < 0.001), no significant difference between groups (p = 0.14). | HbA1c: Significant reduction in both groups (p < 0.001), no significant difference between groups. FPG: Significant reduction in both groups (p < 0.001), no significant difference between groups. Weight: Significant reduction in empagliflozin group (p < 0.001); significant increase in pioglitazone group (p = 0.01); significant difference between groups (p < 0.001). |
| Canagliflozin [64] | 56 patients with T2DM (HbA1c 7.0–9.5%) with (n = 37) and without NALFD | 24 weeks | Canagliflozin 300 mg once daily vs. placebo | Intrahepatic triglyceride content (IHTG): Significant reduction from baseline in canagliflozin group (−4.6%, p = 0.05); greater but not statistically significant reduction compared to placebo (−38% vs. −20%, p = 0.09). For baseline IHTG ≥10%, reduction was greater in canagliflozin group (−39% vs. −20%, p = 0.08). Relative decrease in IHTG correlated significantly with body weight % decrease (r = 0.58, p < 0.001); for NAFLD patients (r = 0.69, p < 0.001). Weight loss ≥5% with ≥30% relative reduction in IHTG was significantly greater in canagliflozin group (38%) vs. placebo (7%), p = 0.009. Hepatic insulin sensitivity: Significant improvement in canagliflozin compared with placebo (p < 0.01). | Body weight: Significant reduction in canagliflozin group (−5.5%) vs. placebo (−2.1%), p = 0.001. FPG: Significant reduction in canagliflozin group (−26) vs. placebo (4), p = 0.002. HbA1c: Significant reduction in canagliflozin group (−0.7%) vs. placebo (0.1%), p < 0.001. Fasting plasma insulin: Significant reduction in canagliflozin group (−4) vs. placebo (0.1), p < 0.001. Fasting FFA: Significant increase in canagliflozin group (0.07) vs. placebo (−0.04), p = 0.04. Insulin secretion rate: Significant increase in canagliflozin vs. placebo, p = 0.005. Beta-cell glucose sensitivity: Significant increase in canagliflozin vs. placebo, p = 0.04. Insulin clearance: Significant increase in canagliflozin vs. placebo, p < 0.001. |
| Meta-analysis of SGLT2i [71] | 10 studies (n = 555), patients with T2DM and NAFLD | 24 weeks to 3+ years | SGLT2i (canagliflozin, dapagliflozin, empagliflozin, ipragliflozin, luseogliflozin) vs. TZD/incretins/metformin/non-SGLT2i | Hepatic fat content: MRI-PDFF: Significant reduction with SGLT2i (SMD: −0.789, CI: −1.404 to −0.175, p = 0.012) vs. control (standardized mean difference (SMD): −0.923, CI: −1.562 to −0.285, p = 0.005) L/S attenuation ratio (CT): Significant improvement with SGLT2i (SMD: 0.456, CI: 0.142 to 0.771, p = 0.004) vs. insulin (SMD: 0.614, CI: 0.116 to 1.112, p = 0.016) or metformin (SMD: 1.957, CI: 1.105 to 2.809, p < 0.001) CAP scores: Significant reduction with SGLT2i (SMD: −1.376, CI: −2.540 to −0.213, p = 0.02) vs. control FIB-4, liver stiffness (transient elastography), NAFLD fibrosis score: Nonsignificant change. NAFIC score: Significant reduction from baseline (SMD: −0.569, CI: −1.062 to −0.077, p = 0.023). | Weight: Significant reduction with SGLT2i vs. control (SMD: −2.317, CI: −3.576 to −1.057, p < 0.001), TZD (SMD: −4.817, CI: −9.201 to −0.433, p = 0.031), incretins (SMD: −0.589, CI: −0.986 to −0.192, p = 0.004), and insulin therapies (SMD: −2.074, CI: −2.681 to −1.468, p < 0.001). BMI: Significant reduction with SGLT2i vs. control (SMD: −1.092, CI: −2.032 to −0.153, p = 0.023) and vs. metformin (SMD: −1.120, CI: −1.869 to −0.371, p = 0.003). VAT: Significant reduction with SGLT2i vs. control (SMD: −2.247, CI: −3.586 to −0.907, p = 0.001), vs. insulin therapies (SMD: −1.179, CI: −1.707 to −0.651, p < 0.001), and vs. metformin (SMD: −1.145, CI: −1.896 to −0.394, p = 0.003). SAT: Significant reduction with SGLT2i vs. TZDs (SMD: −6.347, CI: −7.547 to −5.146, p < 0.001). FPG: Significant reduction with SGLT2i vs. incretins (SMD: −0.841, CI: −1.321 to −0.360, p = 0.001). HbA1c: Significant reduction with SGLT2i vs. metformin (SMD: −0.825, CI: −1.548 to −0.101, p = 0.026). Triglycerides: Significant reduction with SGLT2i vs. control (SMD: −0.336, CI: −0.597 to −0.076, p = 0.011). Total cholesterol: Significant reduction with SGLT2i vs. TZD (SMD: −1.545, CI: −2.096 to −0.993, p < 0.001). HDL: Significantly higher with SGLT2i vs. insulin (SMD: 0.861, CI: 0.352 to 1.370, p = 0.001). Fasting insulin, HOMA-IR, CPR, adipo-IR, CPR index, HOMA-B, LDL: Non-significant compared to other glucose-lowering agents. Adiponectin: Increase with SGLT2i treatment (SMD: 0.301, CI: 0.005 to 0.596, p = 0.046); no differences compared to incretins or insulin. |
| Meta-analysis of SGLT2i [72] | 9 studies (n = 11,369 patients with T2DM and NAFLD) | 12 to 28 weeks | SGLT2i vs. control arm (agent not documented to influence hepatic outcomes) | Liver fat (MRI-PDFF): significant reduction with SGLT2i (SDM, −0.98, 95% CI, −1.53 to −0.44, p < 0.01) | HbA1c: significant change from baseline with SGLT2i vs. control (SDM, −0.37, 95% CI, −0.60 to −0.14, p <0.01) Weight: significant change from baseline with SGLT2i (SDM, −0.58, 95% CI, −0.93 to −0.23, p < 0.01) |
| Meta-analysis of SGLT2i [73] | 20 studies (n = 3850 patients with T2DM and with or without NAFLD) | 8 weeks to 52 weeks | SGLT2i (canagliflozin, dapagliflozin, empagliflozin, ipragliflozin, luseogliflozin) vs. control | Hepatic steatosis (MRI-PDFF): significant improvement with SGLT2i vs. placebo (−3.39% [ 6.01, 0.77], p < 0.0.1, I2 = 89%) | Significantly lower HbA1c, triglyceride levels in SGLT2i compared to control Significantly greater HDL with SGLT2i compared to control No significant difference in LDL, total cholesterol |
| Meta-analysis of SGLT2i [74] | 10 studies (n = 573 patients with T2DM and NAFLD) | 12 weeks to 52 weeks | SGLT2i (empagliflozin, dapagliflozin, ipragliflozin, luseogliflozin) vs. control (metformin, pioglitazone, sitagliptin, glimepiride) | FIB-4: significant reduction with SGLT2i compared to controls (weighted mean difference (WMD) −0.06 [95% CI: −0.10, −0.02], p = 0.0010). No heterogeneity (p = 0.88, I2 = 0%) Hepatic steatosis (MRI-PDFF): significant reduction with SGLT2i compared to controls (WMD −2.20 [95% CI: −3.67, −0.74], p = 0.003). No heterogeneity (p = 0.44, I2 = 0%) | HbA1c: nonsignificant reduction with SGLT2i compared to controls FPG: nonsignificant reduction with SGLT2i compared to controls HOMA-IR: no significant reduction with SGLT2i compared with controls VFA: significant reduction with SGLT2i vs. controls (WMD −23.83 [95% CI: −28.72, −18.95], p < 0.00001). Significant heterogeneity (p < 0.0001, I2 = 82%) SFA: significant reduction with SGLT2i vs. control (WMD −14.68 [95% CI: −26.96, −2.40], p = 0.02). Significant heterogeneity (p < 0.00001, I2 = 95%) Body weight: significant reduction with SGLT2i vs. controls (WMD −3.02 [95% CI: −4.57, −1.47], p = 0.0001). Significant heterogeneity (p < 0.00001, I2 = 98%) |
| Meta-analysis of SGLT2i [75] | 16 studies (patients with T2DM and NAFLD) | 12 weeks to 48 weeks | SGLT2i (empagliflozin, dapagliflozin, ipragliflozin, tofogliflozin) vs. control (standard treatment, placebo, pioglitazone, glimepiride, teneligliptin, metformin + pioglitazone) | LSM: significant reduction with SGLT2i compared to control (SMD = 0.50, 95% CI [0.99, 0.01], p = 0.002) CAP: significant reduction with SGLT2i compared to control (SMD = 0.74, 95% CI [1.21, 0.27], p = 0.005) FIB-4 index: significant reduction with SGLT2i compared to control (SMD = 0.37, 95% CI [0. 74, 0.01], p = 0.03) | Triglycerides: significant reduction with SGLT2i (SMD = 0.81, 95% CI [1.49, 0.12], p < 0.00001) HOMA-IR: significant reduction with SGLT2i (SMD = 0.70, 95% CI [1.36, 0.04], p < 0.00001) BMI: significant reduction with SGLT2i compared to control (SMD = 1.42, 95% CI [2.21, 0.62], p < 0.00001) VAT area: significant reduction with SGLT2i compared to control (SMD = 2.90, 95% CI [4.65, 1.16], p < 0.00001) |
| Meta-analysis: SGLT2i vs. TZD [76] | 5 studies (n = 311 patients with NAFLD and with or without T2DM) | 24 weeks to 28 weeks | SGLT2i (dapagliflozin, empagliflozin, ipragliflozin, tofogliflozin) vs. TZD | LSM: no significant difference in degree of reduction in SGLT2i vs. TZD (n = 2 RCTs; pooled WMD: 0.17 kPa, 95% CI 0.75 to 1.08 kPa; I2 = 71%, p = 0.72) L/S ratio: no significant difference in degree of reduction in SGLT2i vs. TZD (n = 2 RCTs; pooled WMD: −0.01; 95%CI −0.04 to 0.03; I2 = 11%, p = 0.72) | Body weight: significant reduction in SGLT2i vs. TZD (n = 4 RCTs; pooled WMD: 4.22 kg, 95% CI 2.47 to 5.98 kg; I2 = 83%, p < 0.00001) HbA1c, FPG, HOMA-IR: decrease from baseline in both TZD and SGLT2i but no significant difference between groups LDL, total cholesterol, triglycerides: no significant difference between TZD and SGLT2i |
| DPP-4 Inhibitors | |||||
| Sitagliptin [77] | 50 patients with pre-diabetes or controlled T2DM (HbA1c 5.7–8.0%) and NAFLD ( ≥ 5% on MRI-PDFF) | 24 weeks | Sitagliptin po 100 mg daily vs. placebo | Liver fat (MRI-PDFF): No significant difference between sitagliptin and placebo group (mean difference −1.3%, p = 0.4096) or compared to baseline in each group MRE for hepatic fibrosis: no significant difference between groups (mean difference –0.2, p = 0.2631) or compared to baseline in each group FIBROSpect for hepatic fibrosis: no significant difference between groups (p = 0.3057); significant increase from baseline in score (p = 0.0306) in control only | HOMA-IR: no significant difference between groups (difference 0.8; p = 0.5560) LDL: no significant difference between groups (difference 0.0; p = 0.7984) |
| Sitagliptin [78] | 12 patients with T2DM (HbA1c 7.1–8.9%) and biopsy-confirmed NASH | 24 weeks | Sitagliptin po 100 mg daily vs. placebo | Liver fibrosis: no significant difference between groups (mean difference 0.40, 95% CI −0.98 to 1.78, p = 0.82) NAS: no significant difference between groups (mean difference 0.2, p = 1.00); steatosis (mean difference 0, p = 0.91); hepatocyte ballooning (mean difference 0.40, p = 0.23); lobular inflammation (mean difference 0.60, p = 0.12). Hepatic fat % by MRI IDEAL technique: no significant difference between groups | HbA1c: no significant difference between groups (mean difference –0.7, p = 0.19) Adiponectin: nonsignificant trend toward improvement (p = 0.06) |
| Study (year) | Study Population | Duration | Intervention | Liver Outcomes | Metabolic Outcomes |
|---|---|---|---|---|---|
| Orlistat | |||||
| Orlistat [105] | 50 patients with (n = 4) and without diabetes and NASH diagnosis | 36 weeks | Orlistat 120 mg TID + vitamin E 800 IU daily vs. vitamin E 800 IU daily | NAFLD activity score: no significant difference between groups Fibrosis score: no significant difference between groups | FPG, insulin, quantitative insulin sensitivity check index (QUICKI): no significant difference from baseline in either group or between groups Adiponectin: significant increase in orlistat (p = 0.04); no significant difference between groups Body weight: significant loss in orlistat (8.3%, p < 0.001) and control (6.0%, p = 0.01); no significant difference between groups |
| GLP-1 Receptor Agonists | |||||
| Semaglutide [81] | 320 patients with (62%) and without T2DM with biopsy-confirmed NASH and fibrosis (stage F1, F2, or F3) | 72 weeks | Semaglutide 0.1 mg, 0.2 mg, or 0.4 mg once daily subcutaneous injection vs. placebo | NASH resolution without worsening of fibrosis: significantly higher in semaglutide 0.4 mg group (59% vs. 17% placebo; OR 6.87 [95% CI 2.60 to 17.63], p < 0.001). Improvement of at least one fibrosis stage without worsening of NASH: no significant difference between semaglutide 0.4 mg and placebo (43% vs. 33%; OR 1.42 [95% CI 0.62 to 3.28], p = 0.48). | Body weight: semaglutide 0.4 mg group (mean percent loss −12.51% in 0.4 mg group) vs. placebo (–0.61%) HbA1c (mean % change): semaglutide 0.4 mg group (−1.15%) vs. placebo (–0.01%) |
| Semaglutide [83] | 67 patients with (73%) or without T2DM and NAFLD (MRI-PDFF ≥10) | 72 weeks | Semaglutide once daily subcutaneous injection 0.4 mg vs. placebo | Significant reduction in liver steatosis by MRI-PDFF (estimated treatment ratios (ETR): 24 weeks, 0.70 [95% CI 0.59, 0.84], p = 0.0002; 48 weeks 0.47 [95% CI 0.36, 0.60], p < 0.0001; and 72 weeks 0.50 [95% CI 0.39, 0.66], p < 0.0001) No significant difference in liver stiffness by MRE (24 weeks ETR 1.02 (0.95, 1.10); p = 0.5406, 48 weeks ETR 0.96 (0.89, 1.03); p = 0.2798, 72 weeks ETR 0.96 (0.89, 1.03); p = 0.2437) Significant difference in reduction in ≥30% of liver steatosis in the semaglutide group compared to placebo (week 24 64.7 vs. 21.2; p = 0.0006; week 48 76.5 vs. 30.3; p = 0.0001; week 72 73.5 vs. 33.3; p = 0.0006) | Semaglutide group: significant reduction in body weight (at week 72 ETD –9.68%, p < 0.0001) |
| Semaglutide [84] | 71 patients with (75%) and without T2DM and biopsy-confirmed NASH-related cirrhosis | 48 weeks | Semaglutide 2.4 mg once weekly subcutaneous injection vs. placebo | Liver fibrosis improvement (≥1 stage) without worsening of NASH: no significant difference between semaglutide and placebo (11% vs. 29%, OR 0.28; 95% CI 0.06–1.24; p = 0.087) NASH resolution: no significant difference (34% vs. 21%; OR 1.97 [95% CI 0.56–7.91]; p = 0.29) Liver stiffness (MRE): no significant difference (ETR 0.93 [95% CI 0.80–1.07]; p = 0.30) Liver steatosis (MRI-PDFF): significant improvement with semaglutide (ETR 0.67; p = 0.0042) 30% reduction in steatosis: significantly greater in semaglutide group (49% vs. 13%, OR 6.58; p = 0.0037) NAS: no significant difference | Body weight: Significant reduction from baseline in body weight in semaglutide group compared to placebo (−8.83% vs. −0.09%) with significant difference between the two (ETD: –8.75; p < 0.0001) HbA1c (in T2DM): significant reduction in semaglutide group compared to placebo group (ETD: −1.63, p < 0.0001) |
| Liraglutide [85] | 26 patients with (65%) and without T2DM and NASH | 48 weeks | Liraglutide 1.8 mg once daily subcutaneous injection vs. placebo | NASH resolution without worsening of fibrosis: significantly greater in the liraglutide group (39% vs. 9%, RR 4.3 [95% CI 1.0–17.7], p = 0.019); similar outcomes in T2DM (38%) and non-T2DM patients (40%) Worsening liver fibrosis: fewer cases in the liraglutide group (9% vs. 36%; RR 0.2 [95% CI 0.1–1.0], p = 0.04) Total NAFLD activity score: no significant changes (RR −0.5 [95% CI −1.3 to 0.3], p = 0.24) | HbA1c: significant improvement in liraglutide group (mean change −5.18 [95% CI −9.91 to −0.44], p = 0.03) Weight reduction: significant in liraglutide group (mean change −4.24 [95% CI −6.9 to −1.53], p = 0.003) BMI: significant decrease in liraglutide group (mean change −1.59 [95% CI −2.66 to −0.51], p = 0.005) HOMA-IR, ADIPO-IR, insulin, waist circumference: no significant improvement (HOMA-IR, p = 0.23; ADIPO-IR, p = 0.15; insulin, p = 0.91; waist circumference, p = 0.29) |
| Liraglutide [86] | 27 patients with T2DM and biopsy-proven NAFLD/NASH; 19 patients in liraglutide group | 24 weeks, 96 weeks | Liraglutide 0.9 mg daily vs. lifestyle modification | Liraglutide group had significantly greater reductions in AST (p < 0.01), ALT (p < 0.01), and L/S ratio (p < 0.01). In the group that continued therapy for 96 weeks, 7/10 patients had improvement histologic inflammation, 6/10 had improvement in liver fibrosis, and 8/10 had improved NAS. | Significant reduction in BMI (p < 0.001), visceral fat accumulation (p < 0.05), HbA1c (p < 0.001), FPG (p < 0.001) No significant difference in total cholesterol, triglycerides, HDL, LDL, insulin, HOMA-IR, QUICKI, platelet count, ferritin, or FIB-4 index |
| Liraglutide [87] | 35 patients with T2DM | 12 weeks | Liraglutide 1.8 mg daily vs. insulin glargine | Liver fat content (MRS): nonsignificant reduction from baseline in insulin glargine group only (12.6% to 9.9%; p = 0.06), no significant difference between groups Liver fat content (MRI-PDFF): significant reduction from baseline in insulin glargine group only (13.8% to 10.6%; p = 0.005); no significant difference between groups Liver volume: significant reduction in insulin glargine group (p = 0.01); no significant difference between groups. | HbA1c: significant reduction from baseline in insulin glargine group (p = 0.001) and liraglutide group (p < 0.001); however no significant difference between groups FPG: significant improvement in insulin glargine group (p = 0.001) and liraglutide group (p < 0.001) Weight: significant reduction from baseline in liraglutide group only (p = 0.005); liraglutide had significantly greater changes from baseline compared to insulin glargine (p = 0.03) |
| Liraglutide [88] | 52 patients with T2DM (HbA1c 7.5–9%) with (n = 46) and without NAFLD | 12 weeks | Liraglutide 1.8 mg daily vs. sitagliptin 100 mg daily vs. placebo | Hepatic fat content (MRS): no significant difference between liraglutide and placebo (−10% vs. −9.5%; p = 0.98) or sitagliptin and placebo (−12.1% vs. −9.5%; p = 0.98) NAFLD fibrosis score: no significant difference in both liraglutide and sitagliptin when compared with placebo FIB-4 score: no significant difference with liraglutide or sitagliptin compared to placebo. | HbA1c: significant reduction in both liraglutide and sitagliptin groups when compared to placebo (p < 0.001 both) FPG: significant reduction in both liraglutide and sitagliptin groups when compared to placebo (p < 0.001 both) Weight: nonsignificant reduction in liraglutide group compared to placebo (p = 0.06) |
| Liraglutide [89] | 68 patients with uncontrolled T2DM with (n = 57) NAFLD (LFC ≥ 5.5%) and without NAFLD | 6 months | Liraglutide 1.2 mg daily | Liver fat content (proton spectroscopy): significant reduction from baseline (17.3% to 11.9%; p < 0.0001) Patients with NAFLD at baseline: significant reduction from baseline (20.1% to 13.5%, p < 0.0001); relative reduction of 33% Multivariate analysis: LFC reduction significantly associated with body weight (p < 0.0001), NAFLD at baseline (p = 0.009), reduction in plasma TG level (p = 0.003), and reduction in HbA1c (p = 0.048). | Visceral fat area (VFA) (MRI): significant reduction from baseline (p = 0.005). Subcutaneous fat area (SFA) (MRI): significant reduction from baseline (p = 0.009). HbA1c: significant reduction from baseline (p < 0.0001). Adiponectin: significant increase from baseline (p < 0.0001). Body weight: significant reduction from baseline (p < 0.0001); significant correlation between body weight and reduction in LFC (r = 0.490; p < 0.0001). |
| Liraglutide [90] | 75 patients with T2DM (HbA1c 6.5–10%) inadequately controlled on metformin and NAFLD (MRI-PDFF > 10%) | 26 weeks | Add-on to metformin with subcutaneous liraglutide 1.8 mg daily vs. sitagliptin 100 mg daily vs. insulin glargine | Intrahepatic lipid content change (by MRI-PDFF): significant reduction from baseline in both liraglutide (−2.9%, p < 0.001) and sitagliptin (−3.8%, p = 0.001) only; no significant difference between liraglutide and sitagliptin groups. Significantly greater reduction in liraglutide compared to insulin glargine (p = 0.039) and sitagliptin compared to insulin glargine (p = 0.043); remained significant after adjusting for changes in weight | VAT: significant reduction from baseline in liraglutide (p = 0.003) and sitagliptin (p = 0.027); greater change in liraglutide compared to insulin glargine (p = 0.020). SAT: significant decrease from baseline in liraglutide (p = 0.020); greater change in liraglutide compared to insulin glargine (p = 0.003). HbA1c: significant reduction from baseline in all groups; no significant difference between groups. FPG: significant reduction from baseline in liraglutide only (p = 0.001); no significant difference between groups. PPG: significant reduction from baseline in liraglutide (p = 0.001) and sitagliptin (p = 0.005); greater change in liraglutide (p = 0.005) and sitagliptin (p = 0.029) compared to insulin glargine. Weight: significant reduction from baseline in liraglutide (p = 0.005) and sitagliptin (p = 0.005); greater change in liraglutide compared to insulin glargine. |
| Liraglutide [91] | 96 patients with T2DM uncontrolled on metformin and NAFLD | 26 weeks | Insulin glargine vs. liraglutide 1.8 mg daily vs. placebo | Intrahepatic content of lipid (MRS): significant reduction from baseline in the liraglutide group (p < 0.05) and compared to placebo (p < 0.05); no significant difference in change compared to insulin group | SAT: significant reduction from baseline in liraglutide group (p < 0.05) and compared to placebo (p < 0.05); significant reduction from baseline in insulin group (p < 0.05) but not compared to placebo; greater change in liraglutide group compared to insulin (p < 0.05) and in insulin group compared to placebo (p < 0.05). VAT: significant reduction from baseline in liraglutide group (p < 0.05) and compared to placebo (p < 0.05); significant reduction from baseline in insulin group (p < 0.05) but not compared to placebo; greater change in liraglutide group compared to insulin (p < 0.05) and in insulin group compared to placebo (p < 0.05). HbA1c: significant reduction from baseline in all groups (p < 0.05 all); no significant difference in change between groups. HOMA-IR: significant reduction from baseline in liraglutide group (p < 0.05); greater improvement compared to insulin or placebo (p < 0.05 for both). Body weight: significant reduction from baseline in liraglutide group only (p < 0.05); greater change compared to insulin and placebo groups (p < 0.05 for both). |
| Liraglutide [92] | Pre-specified sub-analysis from MAGNA VICTORIA study 49 patients with T2DM (HbA1c 7.0–10.0%) | 26 weeks | Liraglutide 1.8 mg daily vs. placebo | Hepatic triacylglycerol content (MRS): no significant difference between liraglutide and placebo (estimated treatment effect: −2.1%, p = 0.17) AST: no significant difference between liraglutide and placebo ALT: no significant difference between liraglutide and placebo | SAT: significant reduction in liraglutide group compared to placebo (estimated treatment effect: −29; p = 0.007) VAT: no significant difference between liraglutide and placebo Epicardial fat, myocardial triacylglycerol content, HbA1c: no significant difference between liraglutide and placebo Body weight (kg): significant reduction in liraglutide group compared with placebo (estimated treatment effect: −4.5 kg; p < 0.001) |
| Meta-analysis of liraglutide [94] | 11 RCTs | 12 weeks to 24 months | Liraglutide vs. placebo/pioglitazone/insulin/metformin | Liver fat: decreased compared to pioglitazone group (1 trial, n = 60 patients; MD −2.50; 95% CI −4.30 to −0.70; p = 0.006) AST, ALT: no improvement compared to placebo, pioglitazone, metformin, insulin | BMI: decreased compared to placebo, pioglitazone, metformin, insulin Total cholesterol: decreased compared to placebo, metformin Triglycerides: decreased compared to placebo, insulin Lipoproteins: decreased compared to insulin HbA1c: decreased compared to placebo, insulin |
| Dulaglutide [95] | 64 patients with poorly controlled T2DM (HbA1c >7.0%) and MRI-PDFF based LFC ≥6.0% | 24 weeks | Dulaglutide subcutaneous injection 1.5 mg once weekly vs. usual care | LFC: significant reduction in the dulaglutide group (mean difference −26.4%; 95% CI −44.2 to −8.6; p = 0.004). Significant reduction from baseline in dulaglutide group only (17.9% to 12.0%, p < 0.0001) LSM (VCTE): no significant difference between groups. Significant reduction from baseline in dulaglutide group (10.8 kPa to 9.3 kPa, p = 0.016) | Pancreatic fat content: no significant difference between groups. Significant reduction from baseline in dulaglutide group only (9.3% to 7.2%, p = 0.006) Body weight: significant reduction in dulaglutide group compared to placebo (mean difference −2.3 kg; 95% CI −4.1, −0.6; p = 0.01). Significant reduction from baseline in both groups (p < 0.0001) FPG: significant reduction from baseline in both groups (p < 0.0001), no significant difference between groups HbA1c: significant reduction from baseline in both groups (p < 0.0001), no significant difference between groups |
| Exenatide [96] | 21 patients with T2DM on diet/metformin therapy | 12 months | Pioglitazone monotherapy 45 mg once daily vs. pioglitazone 45 mg once daily + exenatide 10 ug subcutaneous injection twice daily | LFC (MRS): significant reduction in pioglitazone group (11.0% to 6.5%, p < 0.05) and in pioglitazone + exenatide group (12.1% to 4.7%, p < 0.001). Significant difference between groups (61% change combination group vs. 41% pioglitazone only group, p < 0.05) | Pioglitazone group: significant increase in body weight and BMI (p < 0.05), reduction in HbA1c (p < 0.01), significant reduction in FPG, fasting plasma insulin, fasting plasma FFA, and triglycerides (p < 0.05 all) Pioglitazone + exenatide group: significant reduction in HbA1c, FPG, fasting plasma FFA, and triglycerides (p < 0.01 all), significant reduction in fasting plasma insulin (p < 0.05) Significant difference between groups in triglycerides (p < 0.01) and body weight (p < 0.05) Adiponectin: significant increase in pioglitazone group (86%, p < 0.001) and combination group (193%, p < 0.001), with a significantly greater increase in combination group (p < 0.001 between groups) Body weight: significant increase in pioglitazone monotherapy (+3.7 kg, p < 0.05), no significant increase in combination therapy; significant difference between groups |
| Exenatide [97] | 44 patients with obesity and T2DM | 26 weeks | Reference therapy (oral hypoglycemics other than DPP-4 inhibitors and thiazolidinediones, with or without insulin glargine) vs. exenatide 10 ug twice daily subcutaneous injection | Hepatic triglyceride content (HTGC) (MRS): significant reduction in exenatide group (exenatide: −23.8 ± 9.5%, reference treatment: +12.5 ± 9.6%; p = 0.007) Significant association between weight and HTGC (r = 0.47, p = 0.03) | HOMA-IR, fasting plasma glucose, fasting plasma insulin: no significant difference between groups, though these trended down in the exenatide group Weight loss: significant difference in reduction in weight (exenatide: −5.3 ± 1.0% vs. reference treatment: −0.2 ± 0.8%; p = 0.0004) |
| Exenatide [98] | 76 patients with newly diagnosed T2DM with NAFLD and LFC > 10% by MRS | 24 weeks | Insulin glargine vs. exenatide 10 ug twice daily subcutaneous injection | LFC: significant reduction from baseline in both groups (exenatide, 42.21% to 24.66%, p < 0.0001 vs. insulin glargine, 35.47% to 24.98%, p < 0.0001), no difference between groups (p = 0.1248) FIB-4: significant reduction from baseline in exenatide group (0.98 ± 0.47 to 0.89 ± 0.39; p = 0.0448), but no difference in change compared to insulin group (p = 0.2149) Independent association with ΔTC (β = 6.059, p = 0.0036) and ΔBMI (β = 3.454, p = 0.0013) with ΔLFC in exenatide group; ΔTG and ΔFFA independently associated with ΔLFC in insulin group | VAT: significant reduction in exenatide group (236.94 cm2 to 193.36 cm2, p < 0.0001) SAT: significant reduction in exenatide group (302.41 cm2 to 273.97 cm2, p = 0.0006) HbA1c: significantly greater reduction in exenatide group (p = 0.0006) Body weight: significantly greater loss in exenatide group compared to insulin (mean difference: −3.75 kg, 95% CI: −5.56 to −1.94, p = 0.0001) |
| Tirzepatide [101] | 296 patients with T2DM (HbA1c 7.0–10.5%) on treatment with metformin/SGLT2i or combination and with fatty liver index ≥ 60 | 52 weeks | Tirzepatide 5 mg, 10 mg, or 15 mg subcutaneous injection weekly vs. titrated insulin degludec subcutaneous injection daily | LFC (MRI-PDFF): significant reduction from baseline in pooled tirzepatide 10 mg and 15 mg and insulin degludec (p < 0.0001); greater reduction in tirzepatide (−8.09% vs. −3.38%, p < 0.0001) LFC ≤ 10%: significantly greater proportion in tirzepatide group than insulin (60–78% vs. 35%) LFC ≤ 6%: significantly greater proportion in tirzepatide 10 mg group than insulin (48% vs. 21%; p = 0.015) 30% relative decrease in LFC: significantly greater proportion in tirzepatide group than insulin (67–81% vs. 32%) | VAT: significant reduction from baseline in all tirzepatide doses (p < 0.0001), significant increase in insulin group (p = 0.040) Abdominal subcutaneous adipose tissue (ASAT): significant reduction from baseline in all tirzepatide doses (p < 0.0001), significant increase in insulin group (p = 0.0092) VAT:ASAT: significant reduction from baseline in all tirzepatide doses; significant difference between tirzepatide doses and insulin Body weight: significant reduction in all tirzepatide doses HbA1c: significant reduction from baseline in all groups (p < 0.0001); significantly greater reduction in tirzepatide groups compared to insulin (p < 0.0001) |
| Tirzepatide [102] | 190 patients with biopsy-confirmed MASH and stage F2/F3 fibrosis | 52 weeks | Tirzepatide 5 mg, 10 mg, 15 mg, or placebo | MASH resolution without worsening of fibrosis: placebo group 10%; 5 mg group 44%, p < 0.001 compared to placebo; 10 mg group 56%, p < 0.001 compared to placebo; 15 mg group 62%, p < 0.001 compared to placebo) Improvement of at least one fibrosis stage without worsening of MASH: placebo group—30%; 5 mg —55%; 10 mg group—51%; 15 mg group—51% | N/A |
| Cotadutide [104] | 30 patients with T2DM and overweight/obesity | 35 days (liver steatosis imaging endpoint) | Cotadutide vs. liraglutide vs. placebo | Hepatic steatosis (MRI-PDFF): significant absolute reduction in cotadutide vs. placebo (LS mean absolute change from baseline, −4.1% [90% CI = −6.0 to −2.3]; p = 0.002); and vs. liraglutide (LS mean absolute change from baseline, −1.8% [90% CI = −3.1 to −0.4]; p = 0.044). Relative reduction: 35.1% compared to placebo, 11.7% compared to liraglutide | Weight: no significant difference in weight loss between cotadutide (−2.50 kg (90% CI = −3.34 to −1.66) vs. liraglutide (−2.80 kg (−3.91 to −1.69); p = 0.749) |
| Meta-analysis (liraglutide, exenatide, dulaglutide, semaglutide) [99] | 11 studies (n = 935 overweight/obese patients with NAFLD/NASH, with (72.4%) or without T2DM) | Median 26 weeks | GLP-1 RA (liraglutide, exenatide, dulaglutide, semaglutide) vs. placebo or reference therapy | Absolute % liver fat content (MRI-PDFF): significant reduction with GLP-1 RA compared to controls (pooled WMD: −3.92%, 95% CI −6.27% to −1.56%) Histological resolution of NASH without worsening of fibrosis: significant reduction with GLP-1 RA (liraglutide or semaglutide) vs. placebo (n = 2 RCTs; pooled random-effects OR 4.06, 95% CI 2.52–6.55) % patients with improvement of fibrosis stage without worsening of NASH: no significant difference with liraglutide or semaglutide vs. placebo (pooled random-effects OR 1.50, 95% CI 0.98–2.28; p = 0.06) | Body weight: significant reduction with GLP-1 RA (n = 11 RCTs; pooled WMD: −4.06 kg, 95% CI −5.44 to −2.68 kg; Z-test = −5.76, p < 0.0001) HbA1c: significant reduction with GLP-1 RA (n = 9 RCTs; pooled WMD: −0.45%, 95% CI −0.79 to −0.12; Z-test = −2.65, p = 0.01) |
| Meta-analysis (liraglutide, exenatide, dulaglutide, semaglutide) [100] | 16 RCTs, 2178 patients with NAFLD/NASH | Variable | Variable | Histologic resolution of NASH without worsening of liver fibrosis with once daily liraglutide or semaglutide, n = 2 (pooled random-effects odds ratio 4.08, 95% CI 22.54–6.56; Z-test = 5.82; p < 0.0001; I2 = 0%) No significant improvement in liver fibrosis stage without worsening of NASH (pooled random-effects odds ratio 1.50, 95% CI 0.98 –2.28; Z-test = 1.88, p = 0.06) | Significant reduction in body weight (n = 15 RCTs; WMD: 1.93, 95% CI 3.01 to 0.85; p = 0.0005) Significant reduction in CRP (n = 7 RCTs; WMD: −0.41, 95% CI −0.78 to −0.04, p = 0.002) |
| Study (year) | Study Population | Duration | Intervention | Liver Outcomes | Metabolic Outcomes |
|---|---|---|---|---|---|
| Vitamin E | |||||
| Vitamin E and pioglitazone [106] | 247 patients with NASH without diabetes | 96 weeks | Vitamin E 800 IU daily vs. pioglitazone 30 mg daily vs. placebo | NASH histology (% subjects): Significant improvement with vitamin E therapy only compared to placebo (43% vs. 19%; p = 0.001; NNT 4.2). Pioglitazone compared to placebo did not reach pre-specified significance level of 0.025 (35% vs. 19%, p = 0.04) Hepatic steatosis (% subjects): significant improvement in both groups (vitamin E p = 0.005; pioglitazone p < 0.001) Lobular inflammation (% subjects): significant improvement in both groups (vitamin E p = 0.02; pioglitazone p = 0.004) Fibrosis scores (% subjects): no significant difference compared to placebo in either vitamin E (p = 0.24) or pioglitazone (p = 0.12) Total NAFLD activity score: significant reduction in both groups (p < 0.001 for both) Resolution of NASH (% subjects): significant in pioglitazone only (p = 0.001) Hepatocellular ballooning (%subjects): significant improvement only in vitamin E group (p = 0.01) | Insulin resistance improved only in pioglitazone group compared to placebo (p = 0.03), as did fasting serum glucose (p = 0.006) Weight: significant weight gain in pioglitazone group (p < 0.001) BMI: significant increase in pioglitazone group (p < 0.001), Body composition of % fat: significant increase in pioglitazone group (p < 0.001) |
| Vitamin E + pioglitazone [107] | 105 patients with T2DM and biopsy-proven NASH | 18 months | Placebo vs vitamin E 400 IU/day vs. vitamin E 400 IU/day + pioglitazone | Improvement in NAS ≥2 without worsening of fibrosis: significant improvement in combination group only (subjects with improvement 54% vs. 19% in placebo, p = 0.003) NASH resolution: more subjects with improvement in the combination therapy group (43% vs. 12%, p = 0.005) vs. vitamin E monotherapy (33% vs. 12%; p = 0.04) Mean change in score-steatosis: both groups (combination, p < 0.001; vitamin E, p = 0.018), inflammation: combination only (p = 0.018); hepatocellular ballooning: combination only (p = 0.022) SAF score: improved only with combination group (p = 0.011) Fibrosis: No significant changes in fibrosis in either group IHTG: reduction in both groups (combination, p < 0.001; vitamin E, p = 0.03) | HbA1c: significant improvement in combination group only (p = 0.002) FPG: no significant change in either group not in fasting glucose. Fasting plasma insulin: reduction in both groups (combination, p < 0.001; vitamin E, p = 0.03) Weight: significant increase in combination group (p < 0.001) |
| Study | Study Population | Duration | Intervention | Liver Outcomes | Metabolic Outcomes |
|---|---|---|---|---|---|
| Thyroid hormone receptor beta agonists | |||||
| Resmetirom [115] | 125 patients with biopsy-confirmed NASH with fibrosis stage 1–3 and hepatic steatosis ≥10% (MRI-PDFF) with (n = 49) or without T2DM | 36 weeks | Resmetirom 80 mg daily vs. placebo | Hepatic fat fraction (MRI-PDFF): significant reduction compared to placebo at week 12 (LSM difference: −23.1%; 95% CI −33.5 to −12.7; p < 0.0001) ≥30% hepatic fat reduction: significantly greater proportion in the resmetirom group than placebo at 12 weeks (60% vs. 18%, p < 0.0001) and 36 weeks (68% vs. 30%, p = 0.0006) 2-point reduction in NAS with at least 1-point reduction in ballooning or inflammation: significantly greater in the resmetirom group than placebo (46% vs. 19%; p = 0.017) at 36 weeks NASH resolution without worsening of fibrosis in patients with <9.5% weight loss: significantly greater proportion in the resmetirom group than placebo (27% vs. 6%, p = 0.018) Liver enzymes: no difference in AST and ALT between groups at 12 weeks; significant difference between groups at 36 weeks (ALT p = 0.0019; AST p = 0.0035) | Body weight: no significant effect from resmetirom Fibrosis biomarkers: significant changes in resmetirom compared to placebo–decreases at 12 and 36 weeks in enhanced liver fibrosis, N-terminal type III, cytokeratin-18, reverse triiodothyronine; increase in adiponectin Lipids: significant reduction in resmetirom compared to placebo in LDL, apolipoprotein B, TG, lipoprotein(a), apolipoprotein CIII |
| Resmetirom [116] | 966 patients with biopsy-confirmed NASH with fibrosis stage F1B to F3 and NAS ≥4, with T2DM (67%) or without T2DM (33%) | 52 weeks | Resmetirom 80 mg once daily vs. 100 mg once daily vs. placebo | NASH resolution with no worsening of fibrosis: resmetirom 80 mg (25.9%), 100 mg (29.9%) vs. placebo (9.7%); p < 0.001 for both doses Fibrosis improvement ≥1 stage without worsening of NAFLD activity score: resmetirom 80 mg (24.2%), 100 mg (25.9%) vs. placebo (14.2%); p < 0.001 for both doses Hepatic steatosis (MRI-PDFF): 16 weeks: improvement with resmetirom groups 52 weeks: resmetirom 80 mg vs. placebo (treatment difference −26.7%; 95% CI −32.9 to −20.6); resmetirom 100 mg vs. placebo (treatment difference −37.9%; 95% CI −44.2 to −31.7) Hepatic steatosis (CAP): improvement at 52 weeks with resmetirom groups Liver stiffness (VCTE): greater decrease from baseline in resmetirom groups vs. placebo Liver stiffness (MRE): greater decrease from baseline in resmetirom groups vs. placebo | LDL-c: significant change from baseline at both doses compared to placebo (−13.6% (80 mg resmetirom), −16.3% (100 mg resmetirom), 0.1% (placebo); p < 0.001 for both comparisons) Triglycerides, non-HDL cholesterol, apolipoprotein B, apolipoprotein C-III, lipoprotein(a): greater decrease from baseline in resmetirom vs. placebo at 24 and 52 weeks |
| Farsenoid X receptor agonists, bile acids and synthetic bile acids | |||||
| Obeticholic acid [117] | 283 participants with histologically proven non-alcoholic steatohepatitis | 72 weeks | Obeticholic acid 25 mg once daily versus placebo | 45% patients in the Obeticholic acid group had improvement in liver histology vs. 21% in the placebo group (p = 0.0002). | Treatment with Obeticholic acid compared to placebo was associated with weight loss (mean change −2.2, p = 0.008), greater hepatic insulin resistance based on HOMA-IR scores (mean change 13 p = 0.01), higher glycated HbA1c (mean change 0.4, p = 0.71). |
| Obeticholic acid [118] | 931 participants with biopsy-confirmed NASH and NAS ≥ 4, with fibrosis stage 1, 2, or 3, per NASH CRN criteria. Excluded patients with hemoglobin A1c > 9.5%. | >4 years | Placebo, OCA 10 mg, or OCA 25 mg once daily | Improvement in fibrosis was seen in 9.6% in the placebo group versus 14.1% in the OCA 10 mg group versus 22.4% in the OCA 25 mg group. NASH resolution was seen in 3.5% in the placebo group versus 6.1% in the OCA 10 mg group versus 6.5% in the OCA 25 mg group. | Relative risk of hyperglycemia/new onset diabetes mellitus for OCA 25 mg daily compared to placebo was 1.08 (CI 0.91–1.29) |
| Study | Study Population | Duration | Intervention | Liver Outcomes | Metabolic Outcomes |
|---|---|---|---|---|---|
| De novo lipogenesis inhibitors | |||||
| ACC Inhibitors [122] | 126 patients with hepatic steatosis of 8% or greater, and liver stiffness of 2.5 kPa | 12 weeks | GS-0976 at doses of 20 mg, 5 mg, or placebo | Trial indicated that there was a 30% or greater decrease in MRI-PDFF in 48% of patients given 20 mg dosage, 28% decrease given 5 mg, and 15% decrease with placebo therapy | No additional metabolic endpoints were reported in this investigation. |
| FAS Inhibitors [123] | Study Arm 1: 10 male patients/cohort with a total of 3 sequential cohorts Study Arm 2: 14 male and female patients | 12 weeks | Arm 1: single dose of FT-4101 (n = 5/cohort) or placebo (n = 5/cohort) followed by crossover dosing after 7 days Arm 2: intermittent once daily variable dosing or placebo medication | Outcomes showed inhibition of hepatic DNL with single and repeat dosing of agent with a dose dependent relationship 3 mg dosing produced a statistically significant reduction in hepatic steatosis on MRI-PDFF from a baseline of 20.1 ± 7.0 to 16.7 ± 7.0 at week 12 and hepatic DNL | Biomarkers of glucose and lipid metabolism were unchanged with interventions |
| Aramchol (SCD1 Inhibitor) [126] | 247 patients with known NASH | 52 weeks | Randomly assigned to received either 400 mg, 600 mg, or placebo medication | Resolution of NASH was seen in 16.7% of patients receiving 600 mg group in comparison to 5% of the placebo arm ALT was reduced by a placebo corrected −29.1 IU l-1 (95% CI = −41.6 to −16.5) | 600 mg trial group produced a reduction in liver triglycerides |
| DGAT Inhibitors [127] | 44 patients between 18 and 75 with a BMI between 27 and 19 kg/m2, and HbA1c from 7.3 to 9.5% | 13 weeks | Stratified based on liver fat content greater than or less than 20% and then randomized to receive either placebo or 250 mg of the experimental agent | Mean reduction in liver fat from baseline was −5.2% compared to −0.6% in the placebo group. | No changes to plasma glucose, bodyweight, or GI side-effects were observed in comparison to the placebo agent. |
| DGAT Inhibitors [120] | Patients with NAFLD | Variable in 2 parallel reported studies | First study focused on evaluating monotherapy with variable doses of ACC inhibitor Second study followed effects of 15 mg BID ACC inhibitor in combination with 300 mg DGAT2 inhibitor BID | First study found that there was a dose dependent reduction in the liver fat with monotherapy doses of >10 mg The second study found that combination therapy lowered liver fat by −44.5% and −35.4% at 6 weeks of therapy | No additional metabolic endpoints were reported in this investigation. |
| Ketohexokinase Inhibitor [128] | 158 patients screened and narrowed to 53 patients, 48 of which completed the trial | 6 weeks | 75 mg or 300 mg of KHK inhibitor in comparison to a placebo trial group | Therapy produced a significant reduction in whole liver fat at the 300 mg dosing (−18.73%; p = 0.04) but not with the 75 mg dosing | Significant reduction in overall inflammatory markers in patients with the use of these inhibitors |
| Study | Study Population | Duration | Intervention | Liver Outcomes | Metabolic Outcomes |
|---|---|---|---|---|---|
| Fibroblast growth factors | |||||
| Pegozafermin [131] | 222 patients with biopsy-confirmed NASH and stage F2 or F3 (moderate or severe) fibrosis | 24 weeks | Pegozafermin 15 mg or 30 mg weekly or 44 mg once every 2 weeks or placebo weekly or every 2 weeks | Fibrosis improvement was 7% in the pooled placebo group, 22% in the 15 mg pegozafermin group, 26% in the 30 mg pegozafermin group, 27% in the 44 mg pegozafermin group. NASH resolution was seen in 2% in the placebo group, 37% in the 15-mg pegozafermin group, 23% in the 30-mg pegozafermin group, 26% in the 44-mg pegozafermin group. | Treatment with pegozafermin compared to placebo was not associated with significant changes in glycated hemoglobin A1c and body weight. |
| Aldafermin [132] | 171 patients with (49%) and without T2DM with biopsy-proven NASH with F2 or F3 fibrosis | 24 weeks | Aldafermin 0.3 mg or 1 mg or 3 mg or placebo | Fibrosis improvement by at least one stage without worsening of steatohepatitis: no significant difference compared to placebo for all doses Liver fat content (MRI-PDFF): significant reduction in absolute change with aldafermin 1 mg (−3.9% (1.4), p = 0.0031) and aldafermin 3 mg (−7.9% (1.4), p < 0.0001) | HbA1c, glucose, insulin: no significant change in any group compared to placebo Weight: significant reduction in the aldafermin 3 mg group compared to placebo only (−2.8 kg, p = 0.0054) |
Disclaimer/Publisher’s Note: The statements, opinions and data contained in all publications are solely those of the individual author(s) and contributor(s) and not of MDPI and/or the editor(s). MDPI and/or the editor(s) disclaim responsibility for any injury to people or property resulting from any ideas, methods, instructions or products referred to in the content. |
© 2025 by the authors. Licensee MDPI, Basel, Switzerland. This article is an open access article distributed under the terms and conditions of the Creative Commons Attribution (CC BY) license (https://creativecommons.org/licenses/by/4.0/).
Share and Cite
Choi, R.; Vemuri, J.; Poloju, A.; Raj, R.; Mehta, A.; Asgharpour, A.; Siddiqui, M.S.; Majety, P. Current and Emerging Treatments for Metabolic Associated Steatotic Liver Disease and Diabetes: A Narrative Review. Endocrines 2025, 6, 27. https://doi.org/10.3390/endocrines6020027
Choi R, Vemuri J, Poloju A, Raj R, Mehta A, Asgharpour A, Siddiqui MS, Majety P. Current and Emerging Treatments for Metabolic Associated Steatotic Liver Disease and Diabetes: A Narrative Review. Endocrines. 2025; 6(2):27. https://doi.org/10.3390/endocrines6020027
Chicago/Turabian StyleChoi, Rachelle, Jatin Vemuri, Alekya Poloju, Rishi Raj, Anurag Mehta, Amon Asgharpour, Mohammad S. Siddiqui, and Priyanka Majety. 2025. "Current and Emerging Treatments for Metabolic Associated Steatotic Liver Disease and Diabetes: A Narrative Review" Endocrines 6, no. 2: 27. https://doi.org/10.3390/endocrines6020027
APA StyleChoi, R., Vemuri, J., Poloju, A., Raj, R., Mehta, A., Asgharpour, A., Siddiqui, M. S., & Majety, P. (2025). Current and Emerging Treatments for Metabolic Associated Steatotic Liver Disease and Diabetes: A Narrative Review. Endocrines, 6(2), 27. https://doi.org/10.3390/endocrines6020027