Article

Investigation of Mixing of Solid Particles in a Plowshare Mixer Using Discrete Element Method (DEM)

1
Jiangsu Automation Research Institute (Shanghai), Block C, No. 666 Shengxia Road, Pudong District, Shanghai 222006, China
2
College of Mechanical and Electrical Engineering, Central South University, Changsha 410083, China
*
Author to whom correspondence should be addressed.
Modelling 2025, 6(3), 111; https://doi.org/10.3390/modelling6030111
Submission received: 4 August 2025 / Revised: 11 September 2025 / Accepted: 15 September 2025 / Published: 22 September 2025

Abstract

The mixing process of powder materials determines the final quality of industrial products. This study employs the Discrete Element Method (DEM) to numerically characterize the effects of particle shape and mixer structure on mixing performance. Using the superquadratic equation, nine types of particles with regular shape variations are constructed, and mixing models are further simulated. The feasibility of superquadratic-generated particles is validated through a classic drum calibration experiment. To investigate the intrinsic mechanisms of particle shape effects, the motion and contact behaviors of particles are quantified by the diffusion index, proportion of rotational kinetic energy, interparticle compressive force, and contact number. Meanwhile, to examine geometry effects, three supplementary mixing simulations are conducted by varying the plow angle and deactivating the choppers. The results show that Cubic particles exhibited poor mixing performance, while disk-shaped particles outperformed cylindrical ones; Increasing the plow blade inclination angle enhanced particle convection and diffusion, whereas excessively small angles may fail to achieve homogeneous mixing; The auxiliary shear of chopper blades promoted particle diffusion, effectively overcoming dead zones between plow blade intervals.

1. Introduction

Powder mixers are widely applied in various industries, such as the pharmaceutical industry, agriculture, and chemical engineering. Uniform mixing of solids is essential for the mixer’s performance, which directly affects the quality of products. Semi-products, such as food, are often made from powdered raw materials; the quality of the final product hinges on the high-quality mixing process [1,2]. Researchers have developed numerous quantitative indicators to evaluate the mixing degree of mixers, such as the particle-scale index [3], Lacey index [4], and nearest neighbor mixing index [5]. However, due to the mixing inside the shell being complex, it is challenging to capture the experimental behaviors of individual particles, such as the contact force between particles and the velocity of every single particle. Thus, developing reliable numerical methods is a commonly used alternative approach.
The discrete element method (DEM) is a pivotal tool commonly used for mechanistic analysis of powder at macroscopic and microscopic scales. This method calculates the motion of individual particles to approximate the overall behavior of the powder [6,7,8,9]. Originally developed by Cundall and Strack [10] to simulate slope stability problems. Recently, DEM has been employed to study mixing mechanisms: Wang et al. [11] investigated the effects of sphericity, shape parameters, and rotational speed on the mixing patterns in a rotating drum. The results are in good agreement with the historical data of Leacy index and drum experiments provided in reference [12]; By setting simulations with different impeller types, Bao et al. [13] monitored the performance of the blade mixer, and a top-surface particle distribution experiment was conducted to confirm the simulated particle motion; Based on the wall boundary model of the Signed Distance Function (SDF), Basinskas and Sakai [14] simulated the particle flow in a ribbon mixer. The simulated and experimental velocity distributions and average particle speeds agreed well for all the analyzed mixing speeds. Therefore, these studies demonstrate that the DEM is reliable for simulating the powder mixing behavior.
Recently, various factors affecting mixing behavior have been a hot topic. For blade mixers, numerous studies have shown that the rotational speed can improve particle flow [15,16,17], resulting in higher efficiency of the mixer. Meanwhile, the optimization of blade structures, such as increasing the number of blades [18], modifying the blade angles [13], and changing blade sizes [19], can accelerate the movement of particles. In addition, the performance of the mixer also largely depends on particle factors. Particles with lower sphericity are more prone to interlock, which restricts the trajectories and thus reduces the degree of mixing [20]. Mixing at a high filling level results in less space for particle movement [21]. Emmerink et al. [22] investigate the effects of several factors, including three material properties (particle size, particle density, and composition), three operational conditions (initial filling pattern, fill level, and impeller rotational speed), and three geometric parameters (paddle size, paddle angle, and paddle number). Jin et al. [23] studied the different particle mixing behaviors in three different impeller designs in terms of mixing status, particle path line, velocity distribution, and forces. As for particle shapes, research based on the superquadratic equation has been developed. Zhao [24] presents a new poly-superquadratic-based approach for three-dimensional discrete element method (DEM) modeling of non-spherical convex particles. Wu et al. [25] studied the influence of particle shape on the shear strength of superquadratical particles by Discrete Element Method (DEM) simulations of triaxial tests in 3D. You and Zhao [12] investigate the packing and flow behavior of superquadratical particles by simulation and experiment. So far, classified as agitated mixers, several studies on plowshare mixers have been published. Laurent and Bridgwater [26] verified that the increasing of rotational speed can linearly improve the particles dispersibility, and demonstrated that six-blade mixers are superior to single-blade mixers. Jones et al. [27] found that the optimal fill level in batch processes and continuous processes is different. The research of Cleary [28] shows that using the actual non-spherical particle shapes can make the simulation results more accurate. In summary, scientists are researching intensively to consider the effects, such as rotational speed, particle filling rate, and simple non-spherical particles. However, ellipsoidal particles can only be regarded as a substitute for rice, and no research focuses on complex shapes such as pharmaceutical tablets, fertilizer mixtures, and plastic components. In addition, plowshare mixers are often combined with choppers, with no potential mixing mechanism clarified, which hinders further performance improvement.
Several studies have been completed on the plowshare mixer previously. The flow and movement of particles are captured to study the mixing effect of the plow blade [29,30,31]; The plowshare are subjected to DEM simulation in different arrangements to optimize the mixing performance [32]; As for the particles properties, the influence of dry/wet [31] and filling rate [27] on the mixing efficiency is studied. However, the effects of particle shape in the plowshare mixer and the corresponding mechanism have not yet been clarified. The effects caused by the change in the plow angle cannot be ignored. Most of the existing plowshare mixers are equipped with choppers as auxiliary mixers, but their functions are unknown. Therefore, this study investigates the research gap through the following approach: Firstly, nine types of regularly shaped particles are constructed using the superquadratic equation, and the mixing process of particles in the plowshare mixer is simulated via the discrete element method (DEM). Meanwhile, the dynamic angle of repose in a classical rotating drum experiment is measured and captured to quantitatively and qualitatively validate the reliability of the superquadratic equation. Subsequently, in the post-processing stage of the mixing simulation, the relative standard deviation (RSD) of the nine particle types is calculated to evaluate mixing performance. The shape factors are examined through particle motion behavior and interparticle contact behavior, during which the diffusion coefficient, rotational kinetic energy ratio, interparticle compressive force, and contact number are computed and statistically analyzed. Finally, three additional sets of simulation experiments were conducted to study the geometry effects of the plowshare tilt angle and fly knives. The probability density function (PDF) of particle velocity and the continuous velocity field are analyzed. Section 2 elaborates on the superquadratic equation, DEM theory, and an introduction to the plowshare mixer. Section 3 describes all simulation experiments in this study, including 12 mixing experiments and parameter calibration experiments. Section 4 discusses the results of the simulations.

2. Method Description

2.1. Particle Shape

To build the regular shape change, the superquadratic equation is a convenient choice to construct particles, as given in Equation (1):
f x = x a n 2 + y b n 2 n 1 / n 2 + z c n 1 1 = 0
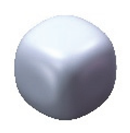
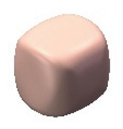
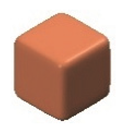
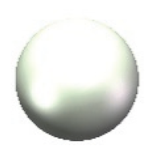
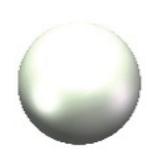
where a, b and c are particle size parameters in x, y and z directions, respectively; n1 and n2 are block parameters with n1, n2 ∈ {2,4,10}, which determine the particles shape. As shown in Figure 1, spherical, cylindrical, and cubical particles are constructed by changing block parameters, particle shapes are colored differently to distinguish.

2.2. Discrete Element Method Theory

DEM solves the motion parameters (linear velocity and angular velocity) of a single soil particle and iterates over time, with iteration steps typically sharp time steps. Macro liquidity is the result of solving N (number of particles) dimensional equations using DEM; therefore, the number and diameter of particles affect the computational complexity of DEM. After determining the particle shape and force, the motion of the particles at each moment is solved by the following equation:
m i d v i d t = j = 1 N F i j n + F i j t + m i g I i d ω i d t = j = 1 N R i × F i j t μ F i j n R i ω i
In the above equation, vi, ωi, mi, Ii, and Ri are the linear velocity, angular velocity, mass, moment of inertia, and radius of the particle i, and μ is the rolling friction coefficient. F i j n and F i j t are the normal and tangential forces of particle i, resulting from Hertzt-Middlin contact theory. The force of the basic Hertzt-Middlin model is no sliding state expressed by the following equation:
F n = 4 3 E R δ n 3 2 F t = S t δ t
where δn and δt are the normal overlap and tangential overlap, and St is the tangential stiffness, R* and E* are equivalent Radius and equivalent Young’s modulus defined as:
1 R = 1 R i + 1 E j 1 E = 1 υ i 2 E i + 1 υ j 2 E j
where υ is the Poisson ratio. Additionally, there are normal and tangential damping forces, F n d and F t d , given by:
F n d = 2 5 6 β S n m v n r e l F t d = 2 5 6 β S t m v t r e l
where β = −lne/(ln2e + π2)1/2. Normal stiffness Sn and tangential stiffness St are given by:
S n = 2 E R δ n S t = 8 G R δ n
Among them, G* is the equivalent shear modulus determined from Poisson’s ratio and equivalent Young’s modulus.

2.3. Geometry of Plowshare Mixer with Fly Cutting

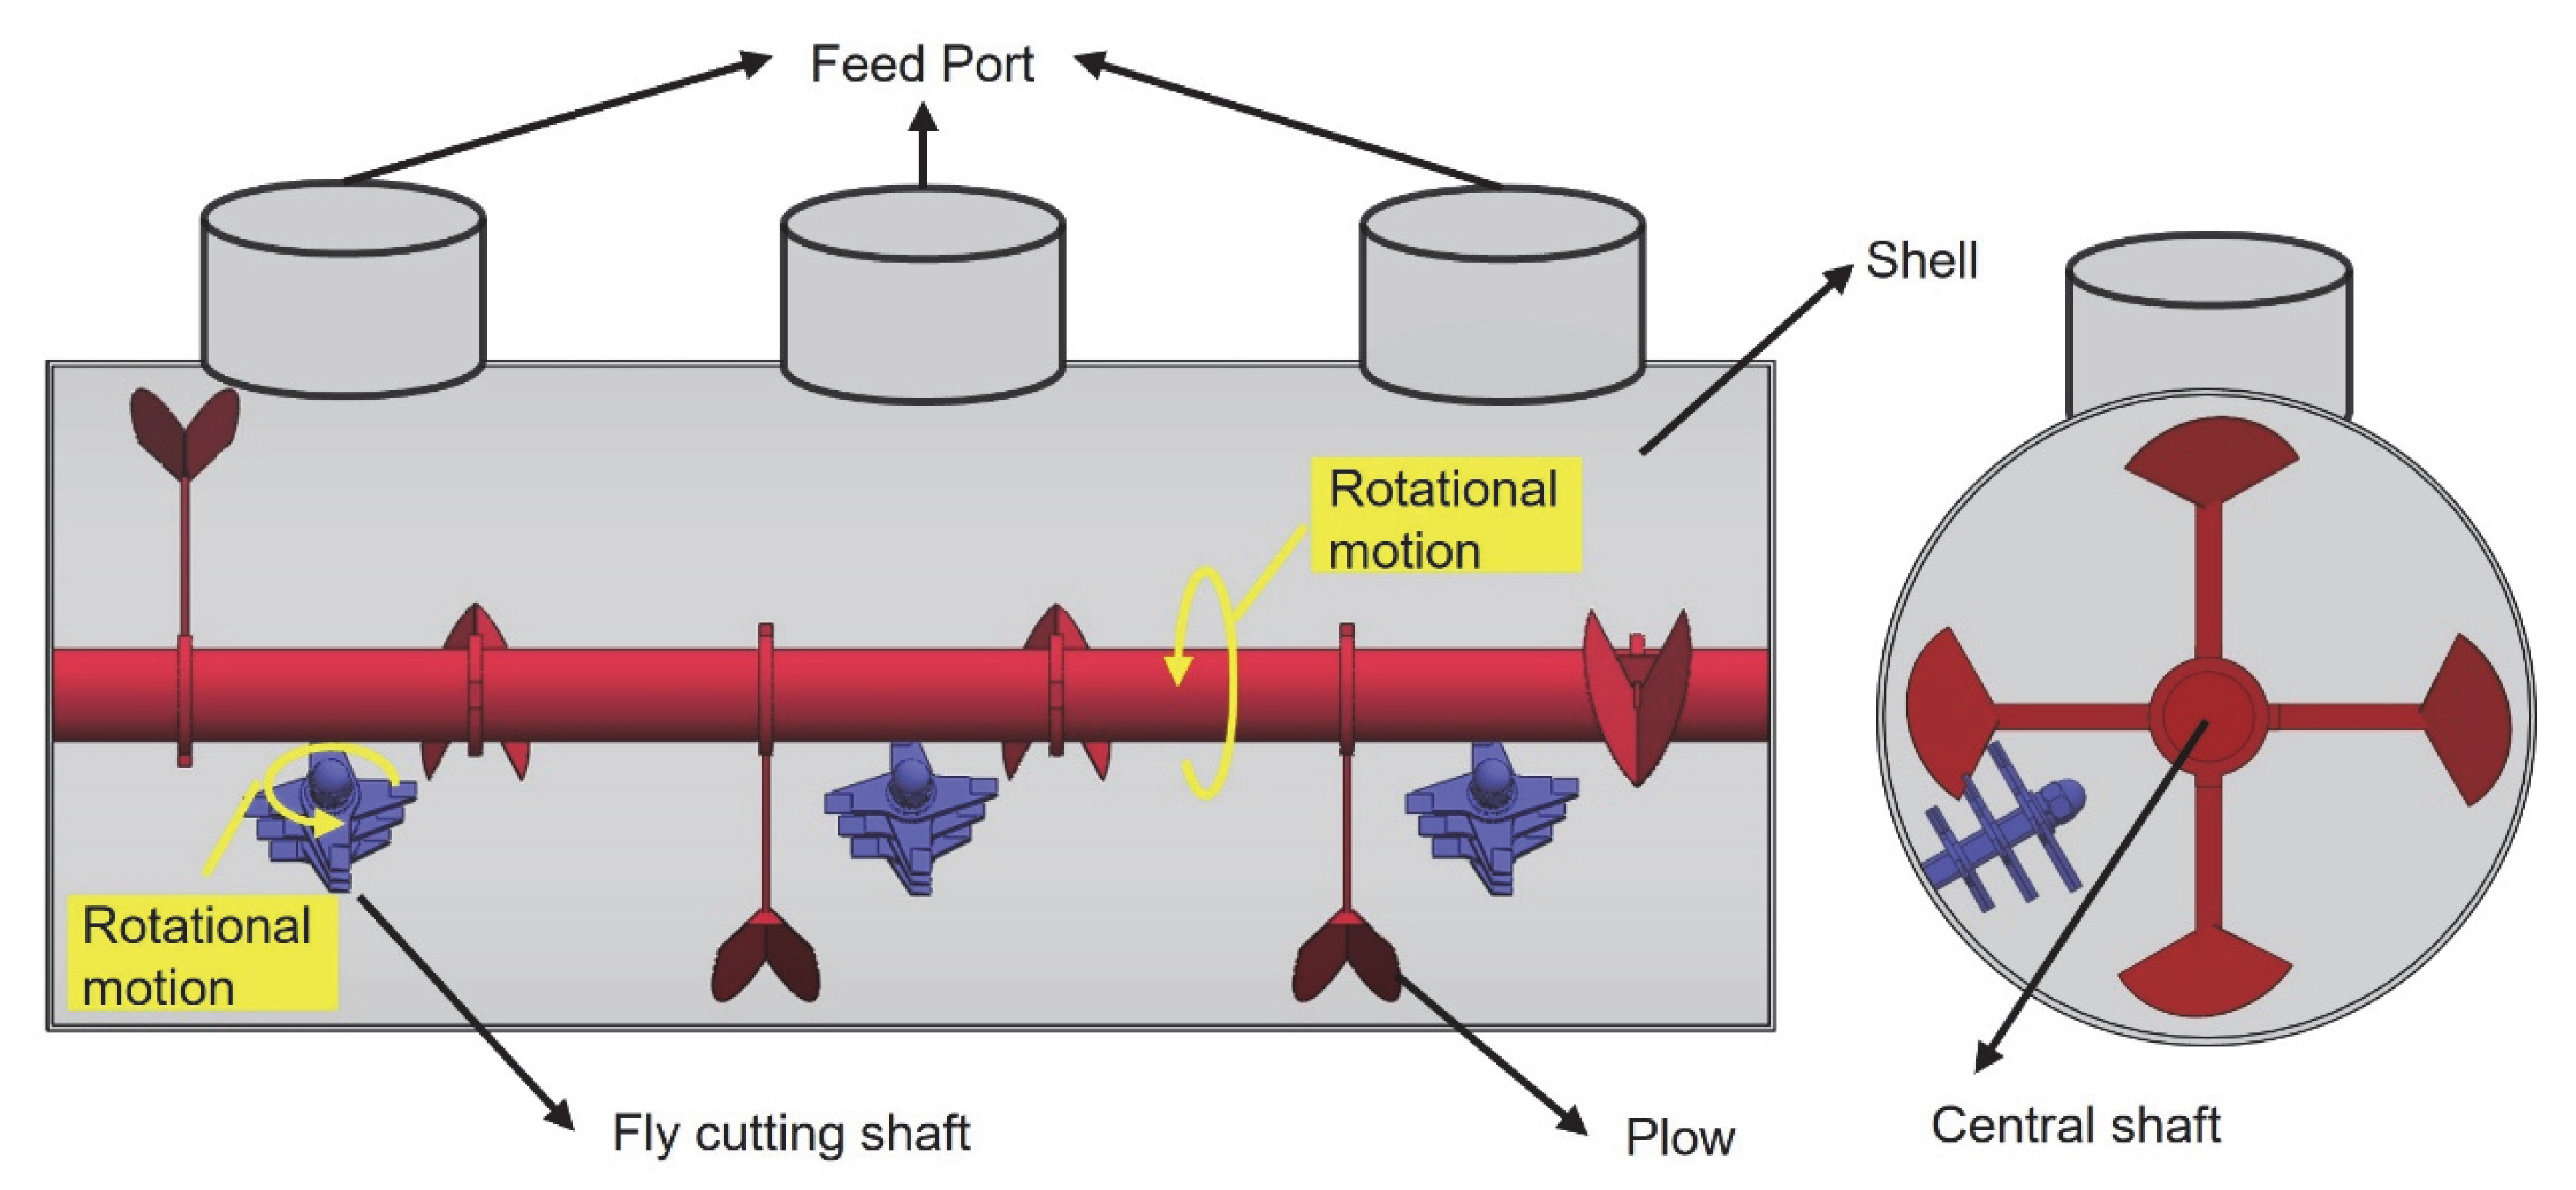
Figure 2 is a simplified 3D model of the mixer: the cylindrical shell is utilized as the particle container; the plow installed on the central shaft is the main mechanism for mixing; the chopper shafts are the auxiliary mechanism for mixing. This mixer consisted of six plows, adjusted on a central shaft with a diameter of 30 mm, to support the plows (see Figure 2). The side diameter of the shell was 270 mm with a length of 650 mm. The space and angle between the adjacent plows were 105 mm and 90°, respectively. Three chopper shafts are installed on the inner shell; each chopper shaft is a three-layer structure with six blades. For the mixing process, the particles are first poured into the shell from the feed ports. Then, the central shaft and chopper are driven by the motor to rotate, and the plow cuts the particle pile. Meanwhile, the particles move circumferentially along the cell inner wall because of the plow rotating, and the high-speed rotating chopper increases the laminar flow of particles.

3. Simulation Conditions

3.1. Model for Calibration

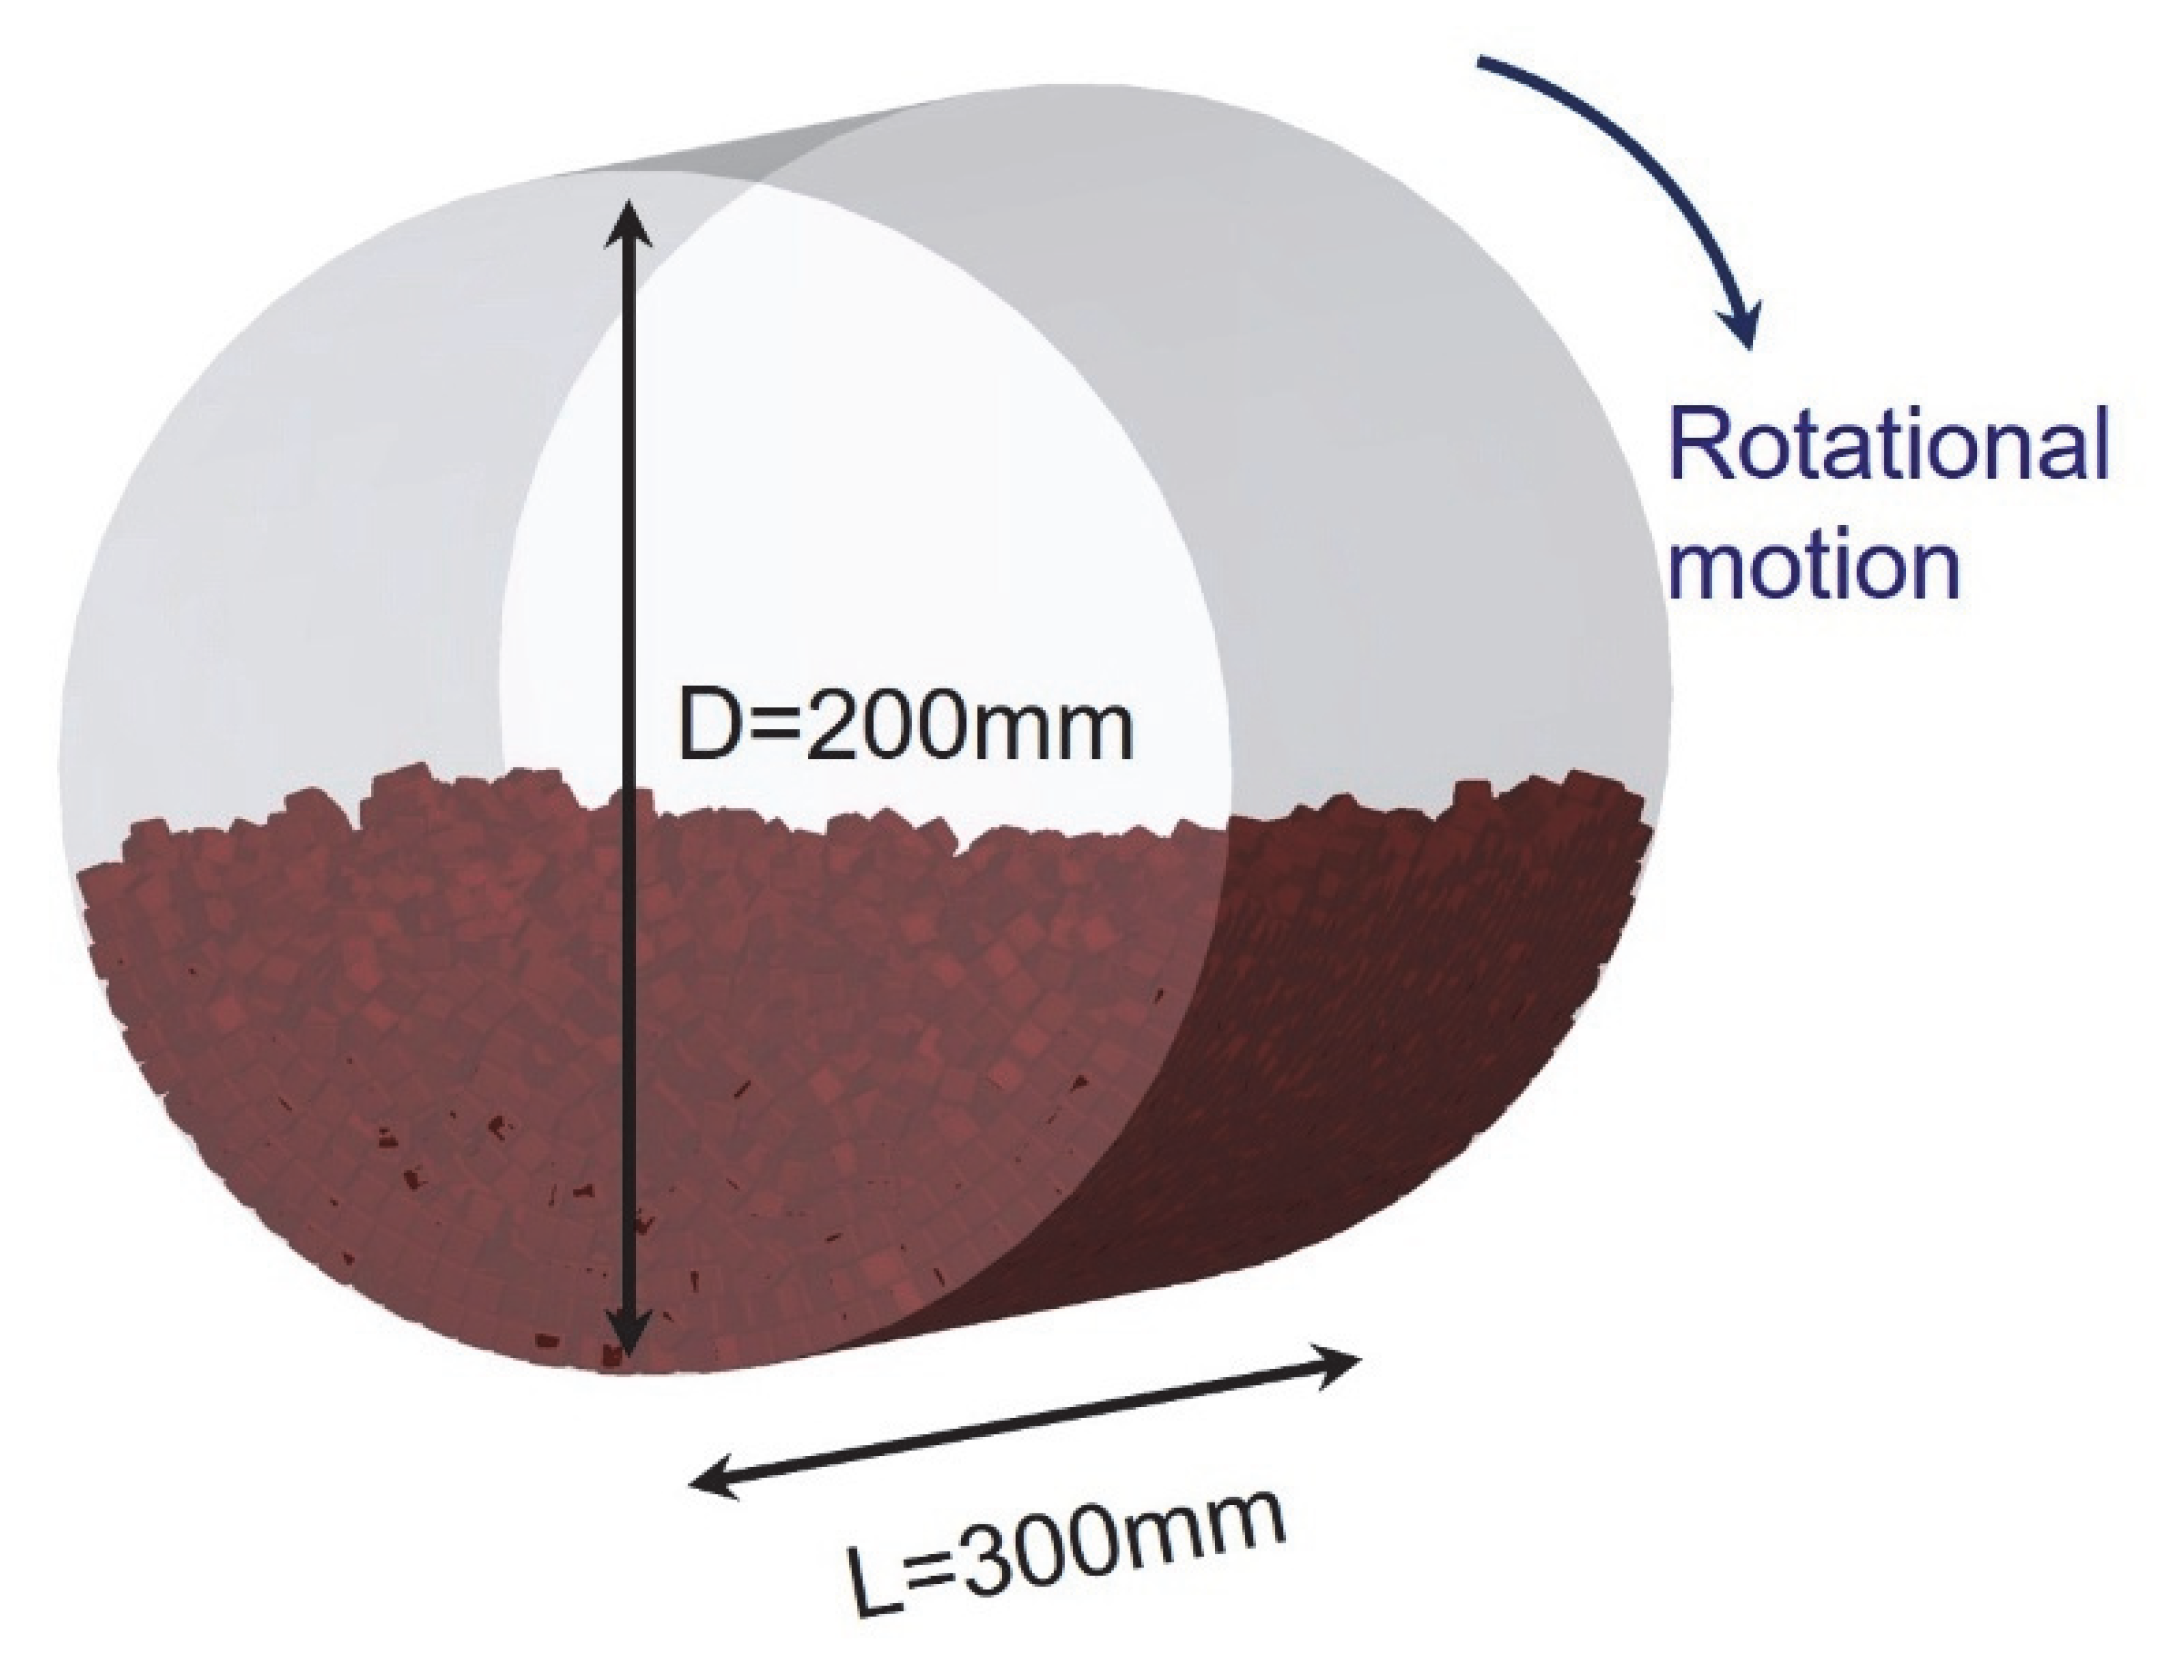
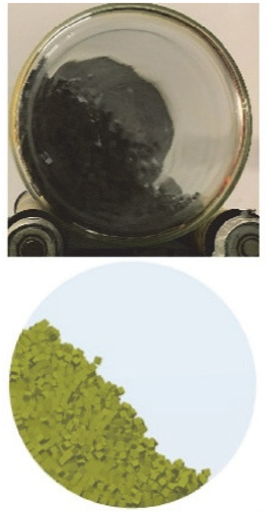
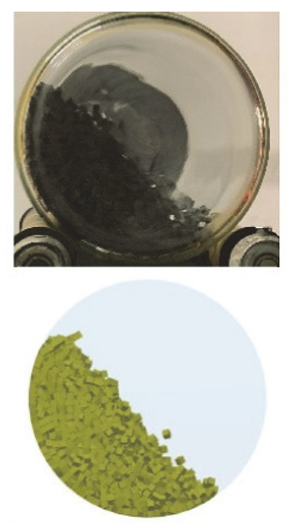
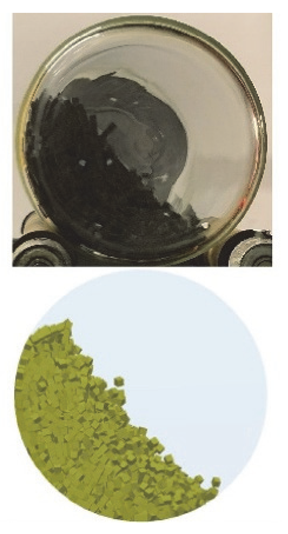
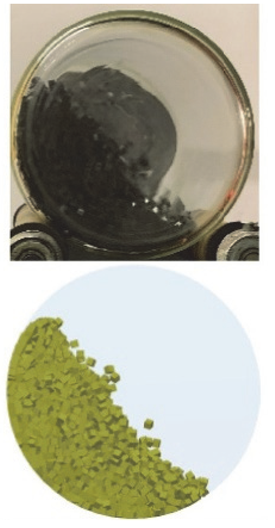
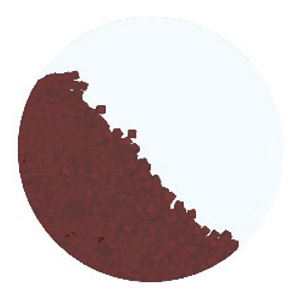
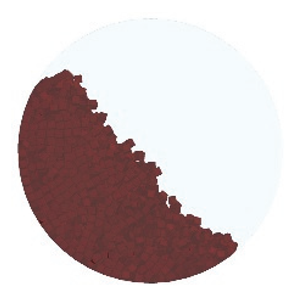
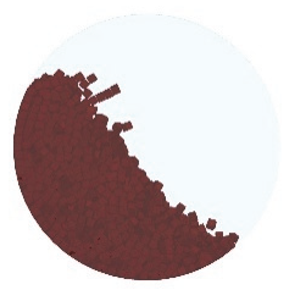
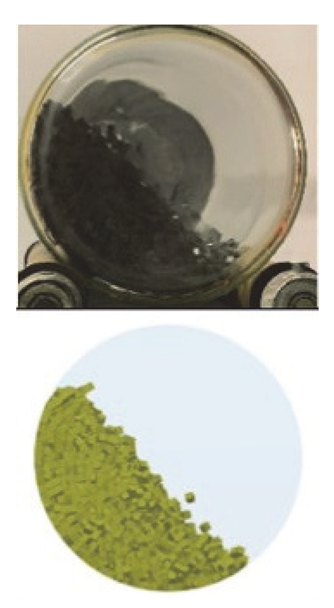
To verify the feasibility of superquadric particles in the Discrete Element Method (DEM), the classic rotating drum simulation [33,34,35] is employed and compared with the experimental results of the dynamic AOR obtained by Jadidi et al. [36]. As shown in Figure 3, the inner diameter of the classic rotating drum is 0.2 m, the thickness is 0.02 m, and the inner length is 0.3 m. Utilizing the superquadric equation, cubic particles are constructed, which are similar to the experiment, with n1 = n2 = 10. The initial DEM parameters, including particle density and size, are similar to those used in Jadidi’s study [36]. Considering the slight differences between the cubic particles constructed by the superquadric equation and those in the experiment (the constructed cubes have slightly smoother edges), a detailed calibration step for the DEM parameters is performed. We have two comparisons: (1) The experimental and DEM simulation results of the dynamic AOR at different times under a constant rotational speed (40 RPM); (2) The experimental and DEM simulation results of the dynamic AOR at different rotational speeds (40 RPM and 70 RPM) at t = 10 s. There are slight differences between the numerical results and the experimental results, indicating that the calibrated parameters are applicable in this study. The DEM input parameters are summarized in Table 1.

3.2. Simulation Experiments

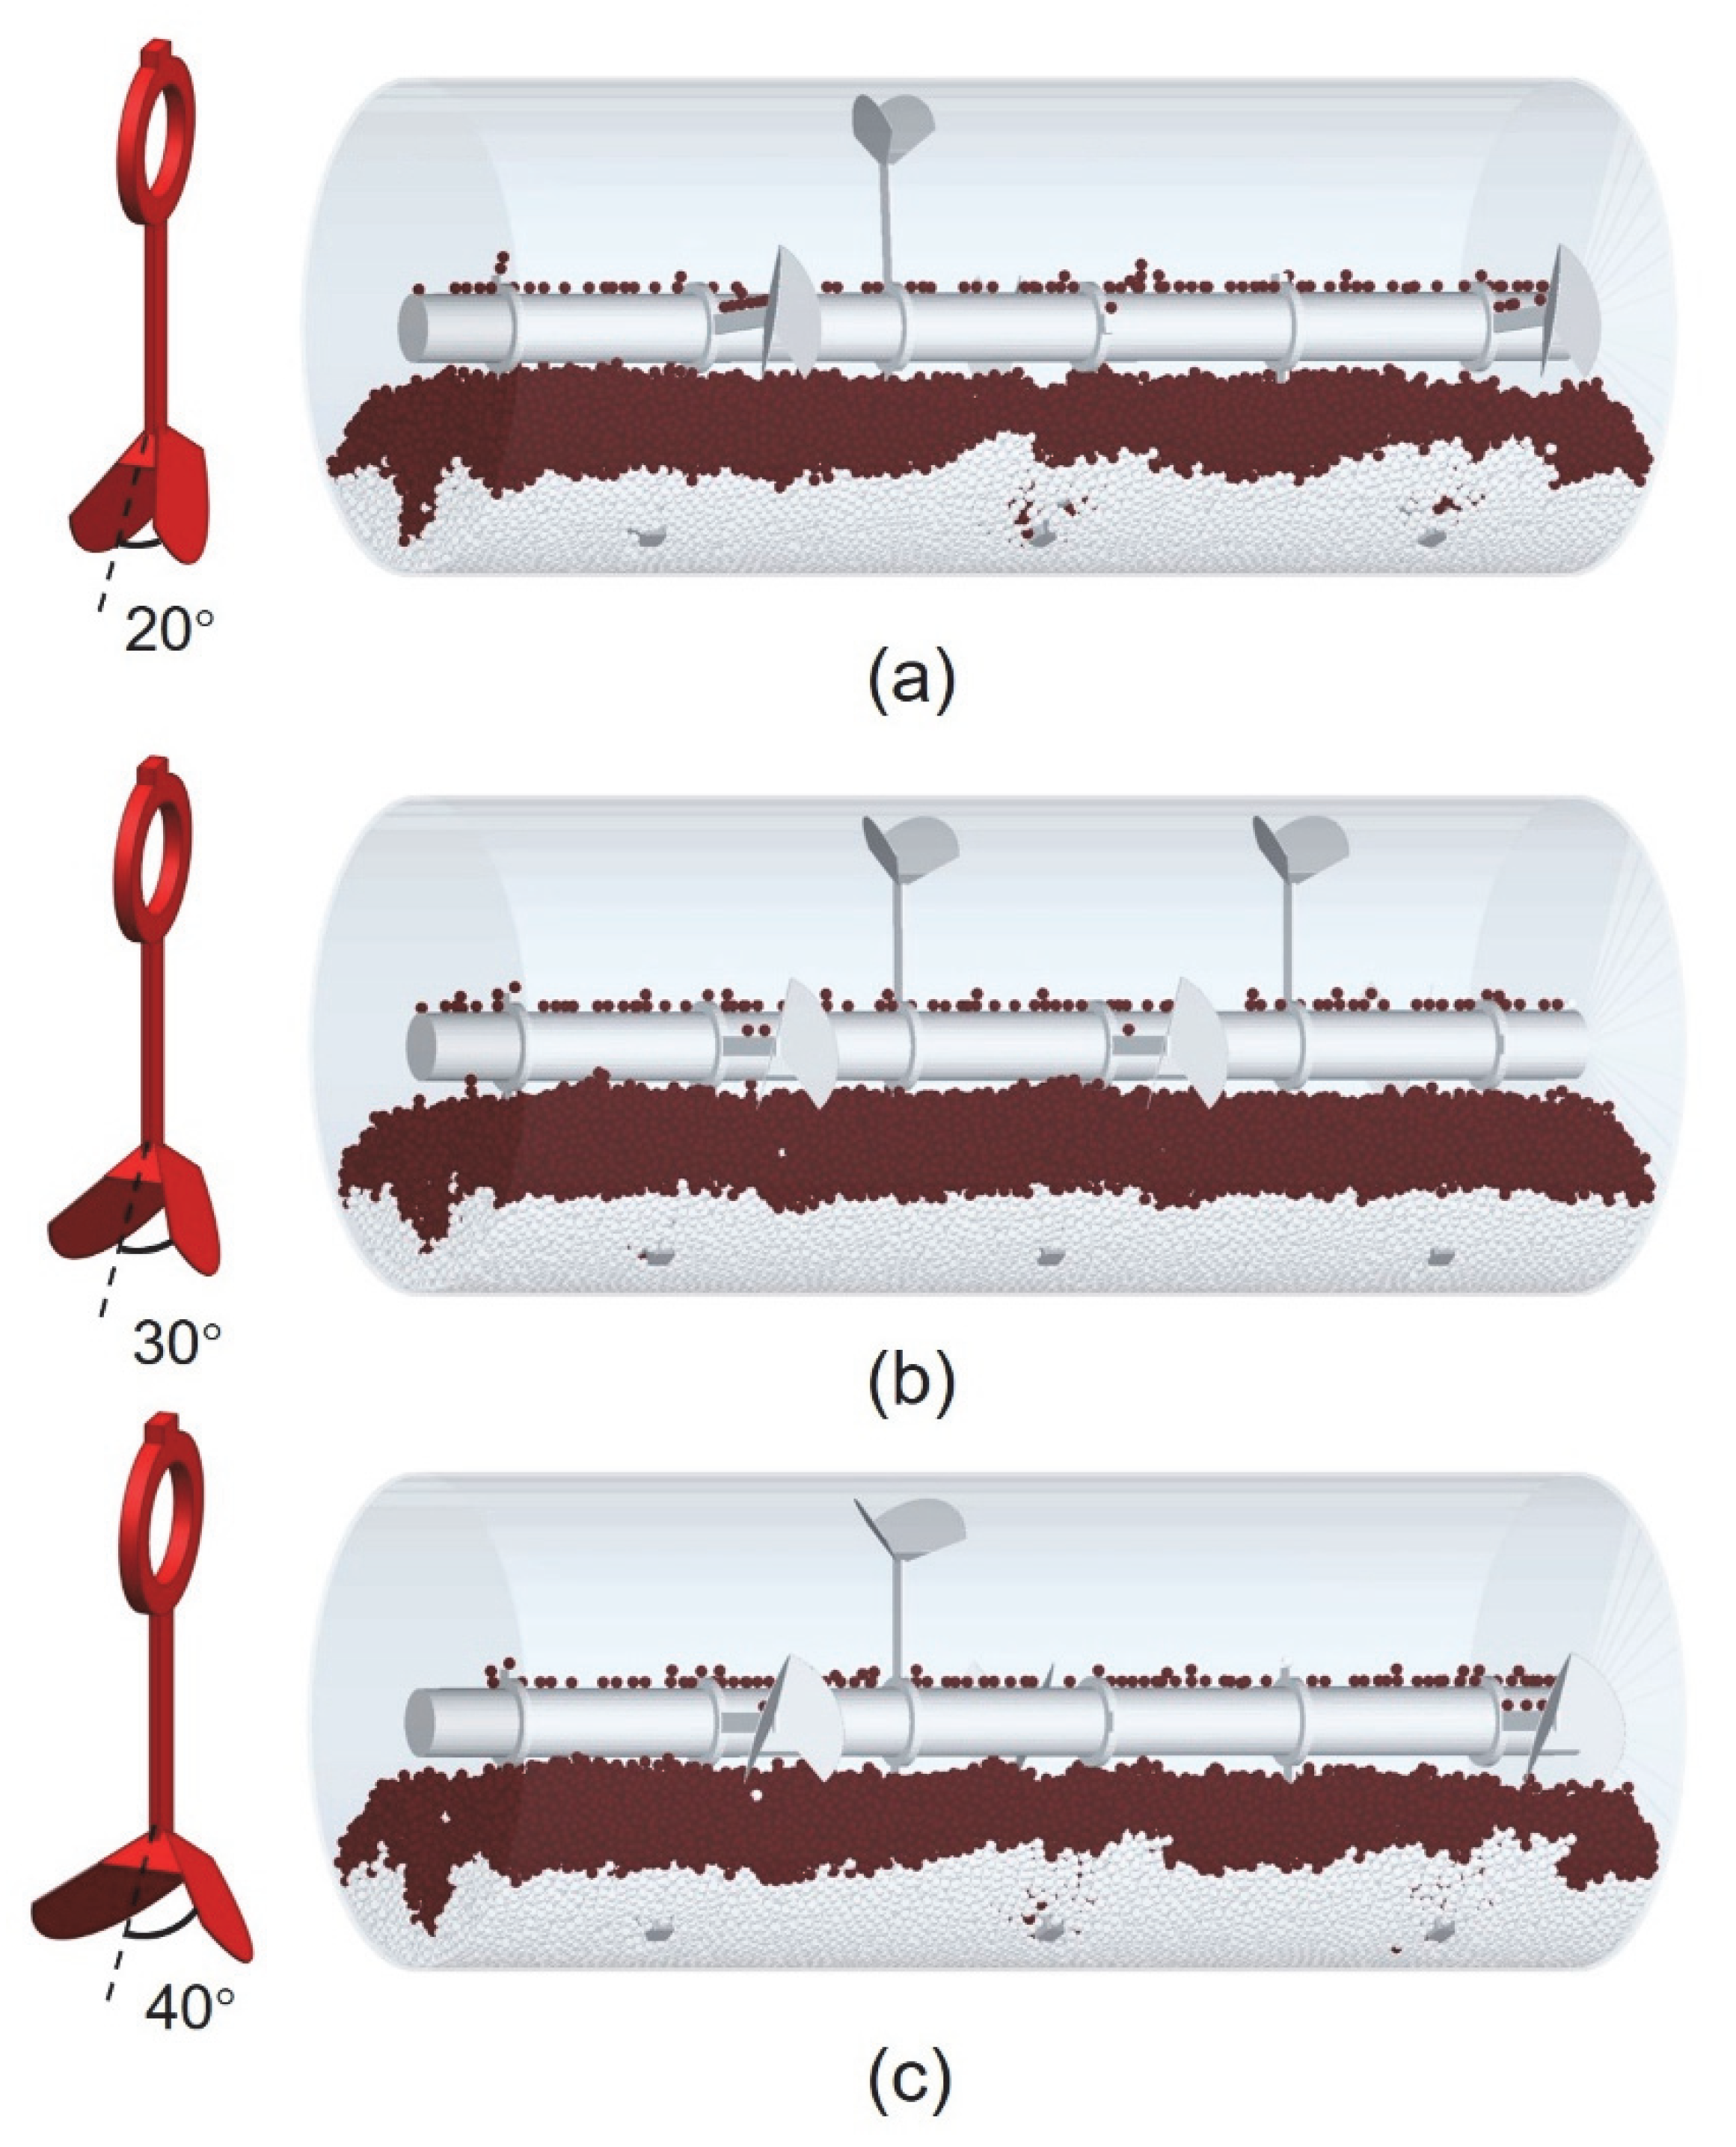
In this work, to study the mixing mechanism of plowshare, 12 simulation experiments are divided into three comparison groups: (1) Comparative experiments under different particle shape sets, including P1–P9, see Table 1; (2) Comparative experiments under different plowshare structures, as shown in Figure 4, including P1, G1, and G2; (3) The influence of particle flow generated by the choppers, with P1 and C1 for comparison, Table 1 shows the whole simulation experiments of this work. Non-spherical particles are constructed through 3D software SOLIDWORKS 2020 version through the Sketch function. Before being imported into DEM software (Altair. EDEM 2022 edition), faces of non-spherical particles are reduced in MESHLAB 2022.02 software to improve computational efficiency. The DEM simulation experiments are run in the commercial software EDEM 2025.

4. Results and Discussions

4.1. Model Calibration

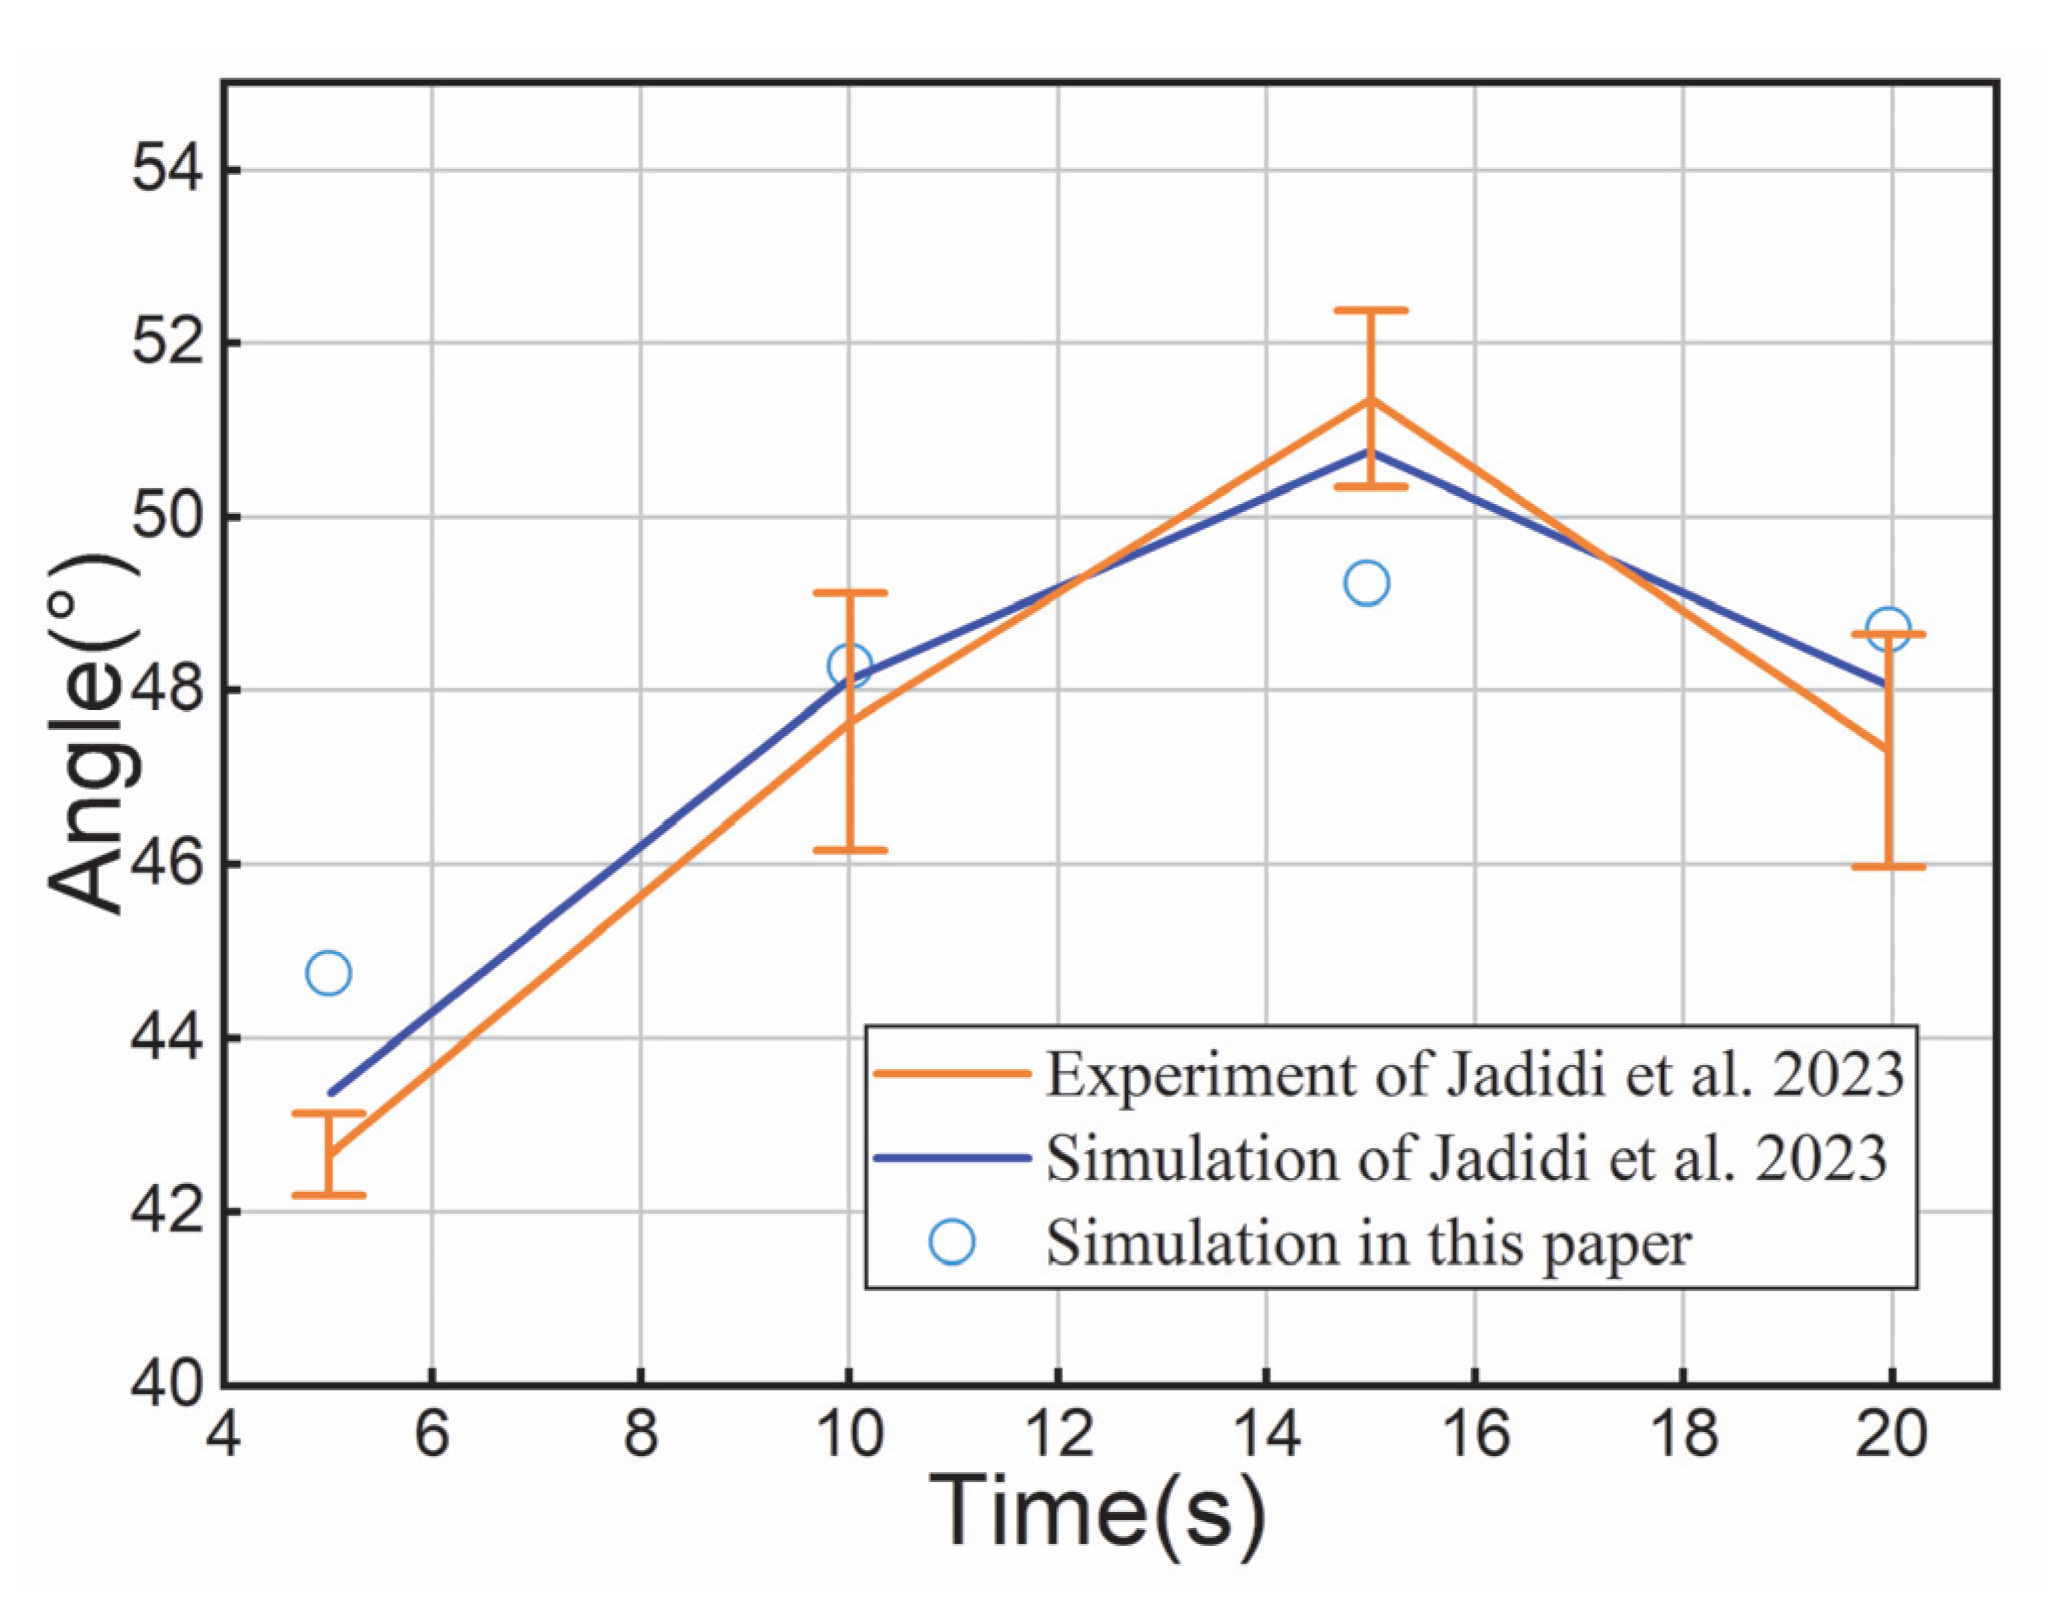
The dynamic AOR of near-cubic particles is captured in the rotating drum, as shown in Table 2. The simulated snapshots at each time step align well with experimental observations from literature [34]. A quantitative comparison of dynamic AOR is presented in Figure 5. Comparison of the time-varying AOR with the results from Ref. [36], where values from this study, experiments [36], and simulations [36] are plotted. Compared to experimental data, the simulated results from [36] show a marginally higher angle, likely due to the idealized cubic particle approximation adopted here. Nevertheless, the error range of dynamic AOR in this work (10–15%) remains acceptable. Table 3 further compares the dynamic AOR under two rotational speeds. The results exhibit minimal deviation and agree closely with prior data. In conclusion, both qualitative and quantitative analyses across varying rotational speeds confirm the reliability of particles modeled via the Superquadratic equation.

4.2. Effects of Particles’ Shape

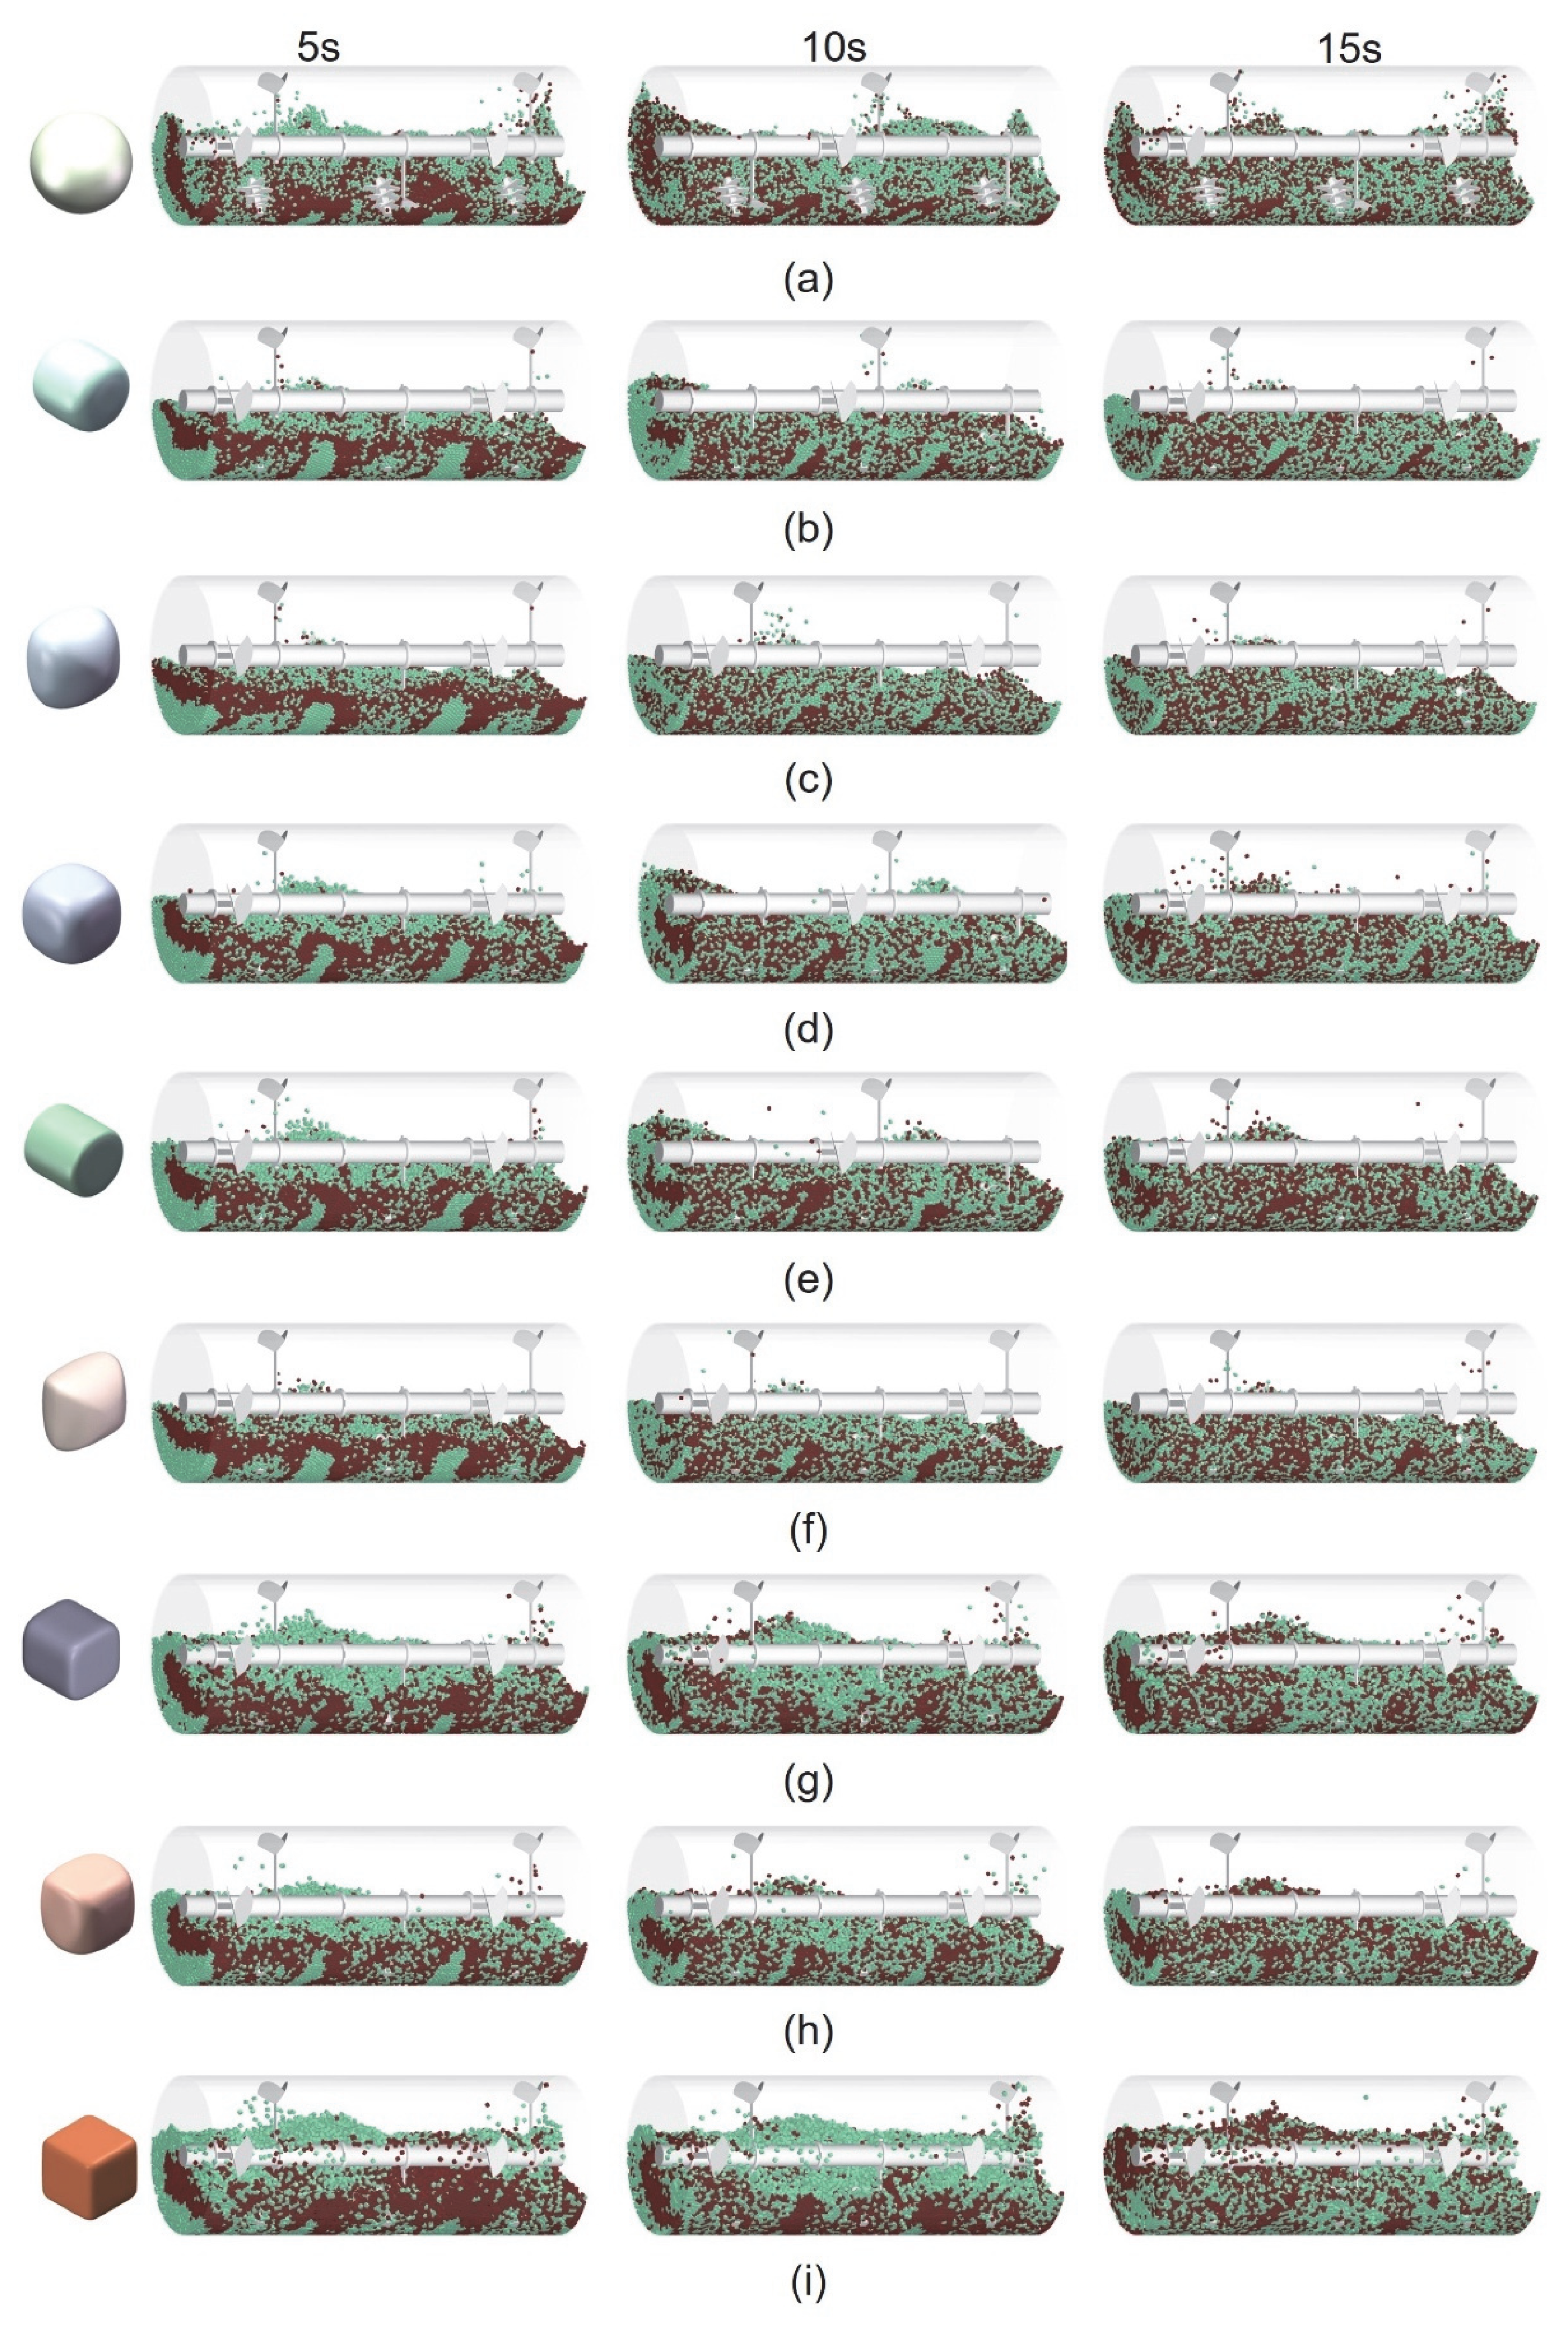
All simulations in this study are conducted using the following method: Particles are randomly generated above the shell interior and allowed to fall along the y-axis at an initial velocity of −10 m/s, which creates a top-bottom particle initial loading, a configuration previously reported in the literature [21]. Particles are color-coded based on initial position: Top particles are red; bottom particles are green. The total number of particles is 40,000 for all shapes; the number of red and green particles is the same. The contact and material parameters of particles are assigned using calibrated values. The rotational speed of the plowshare blades is 90 RPM, while that of the choppers is 120 RPM. Figure 6 illustrates the mixing states of nine particle types over time, demonstrating interlayer flow along the y-direction primarily induced by plowshare blades. During the initial 5 s mixing, a notably low degree of mixing homogeneity is observed. Spherical particles exhibited superior mixing performance, and all particle types achieved homogeneous mixing within 15 s. The Relative Standard Deviation (RSD) index is employed for quantitative comparison of mixing performance across particle shapes. Prior studies established the feasibility of utilizing the RSD index for evaluating shape effect [37,38,39]. The RSD index is determined by the following equation:
RSD = σ x ¯ × 100 %
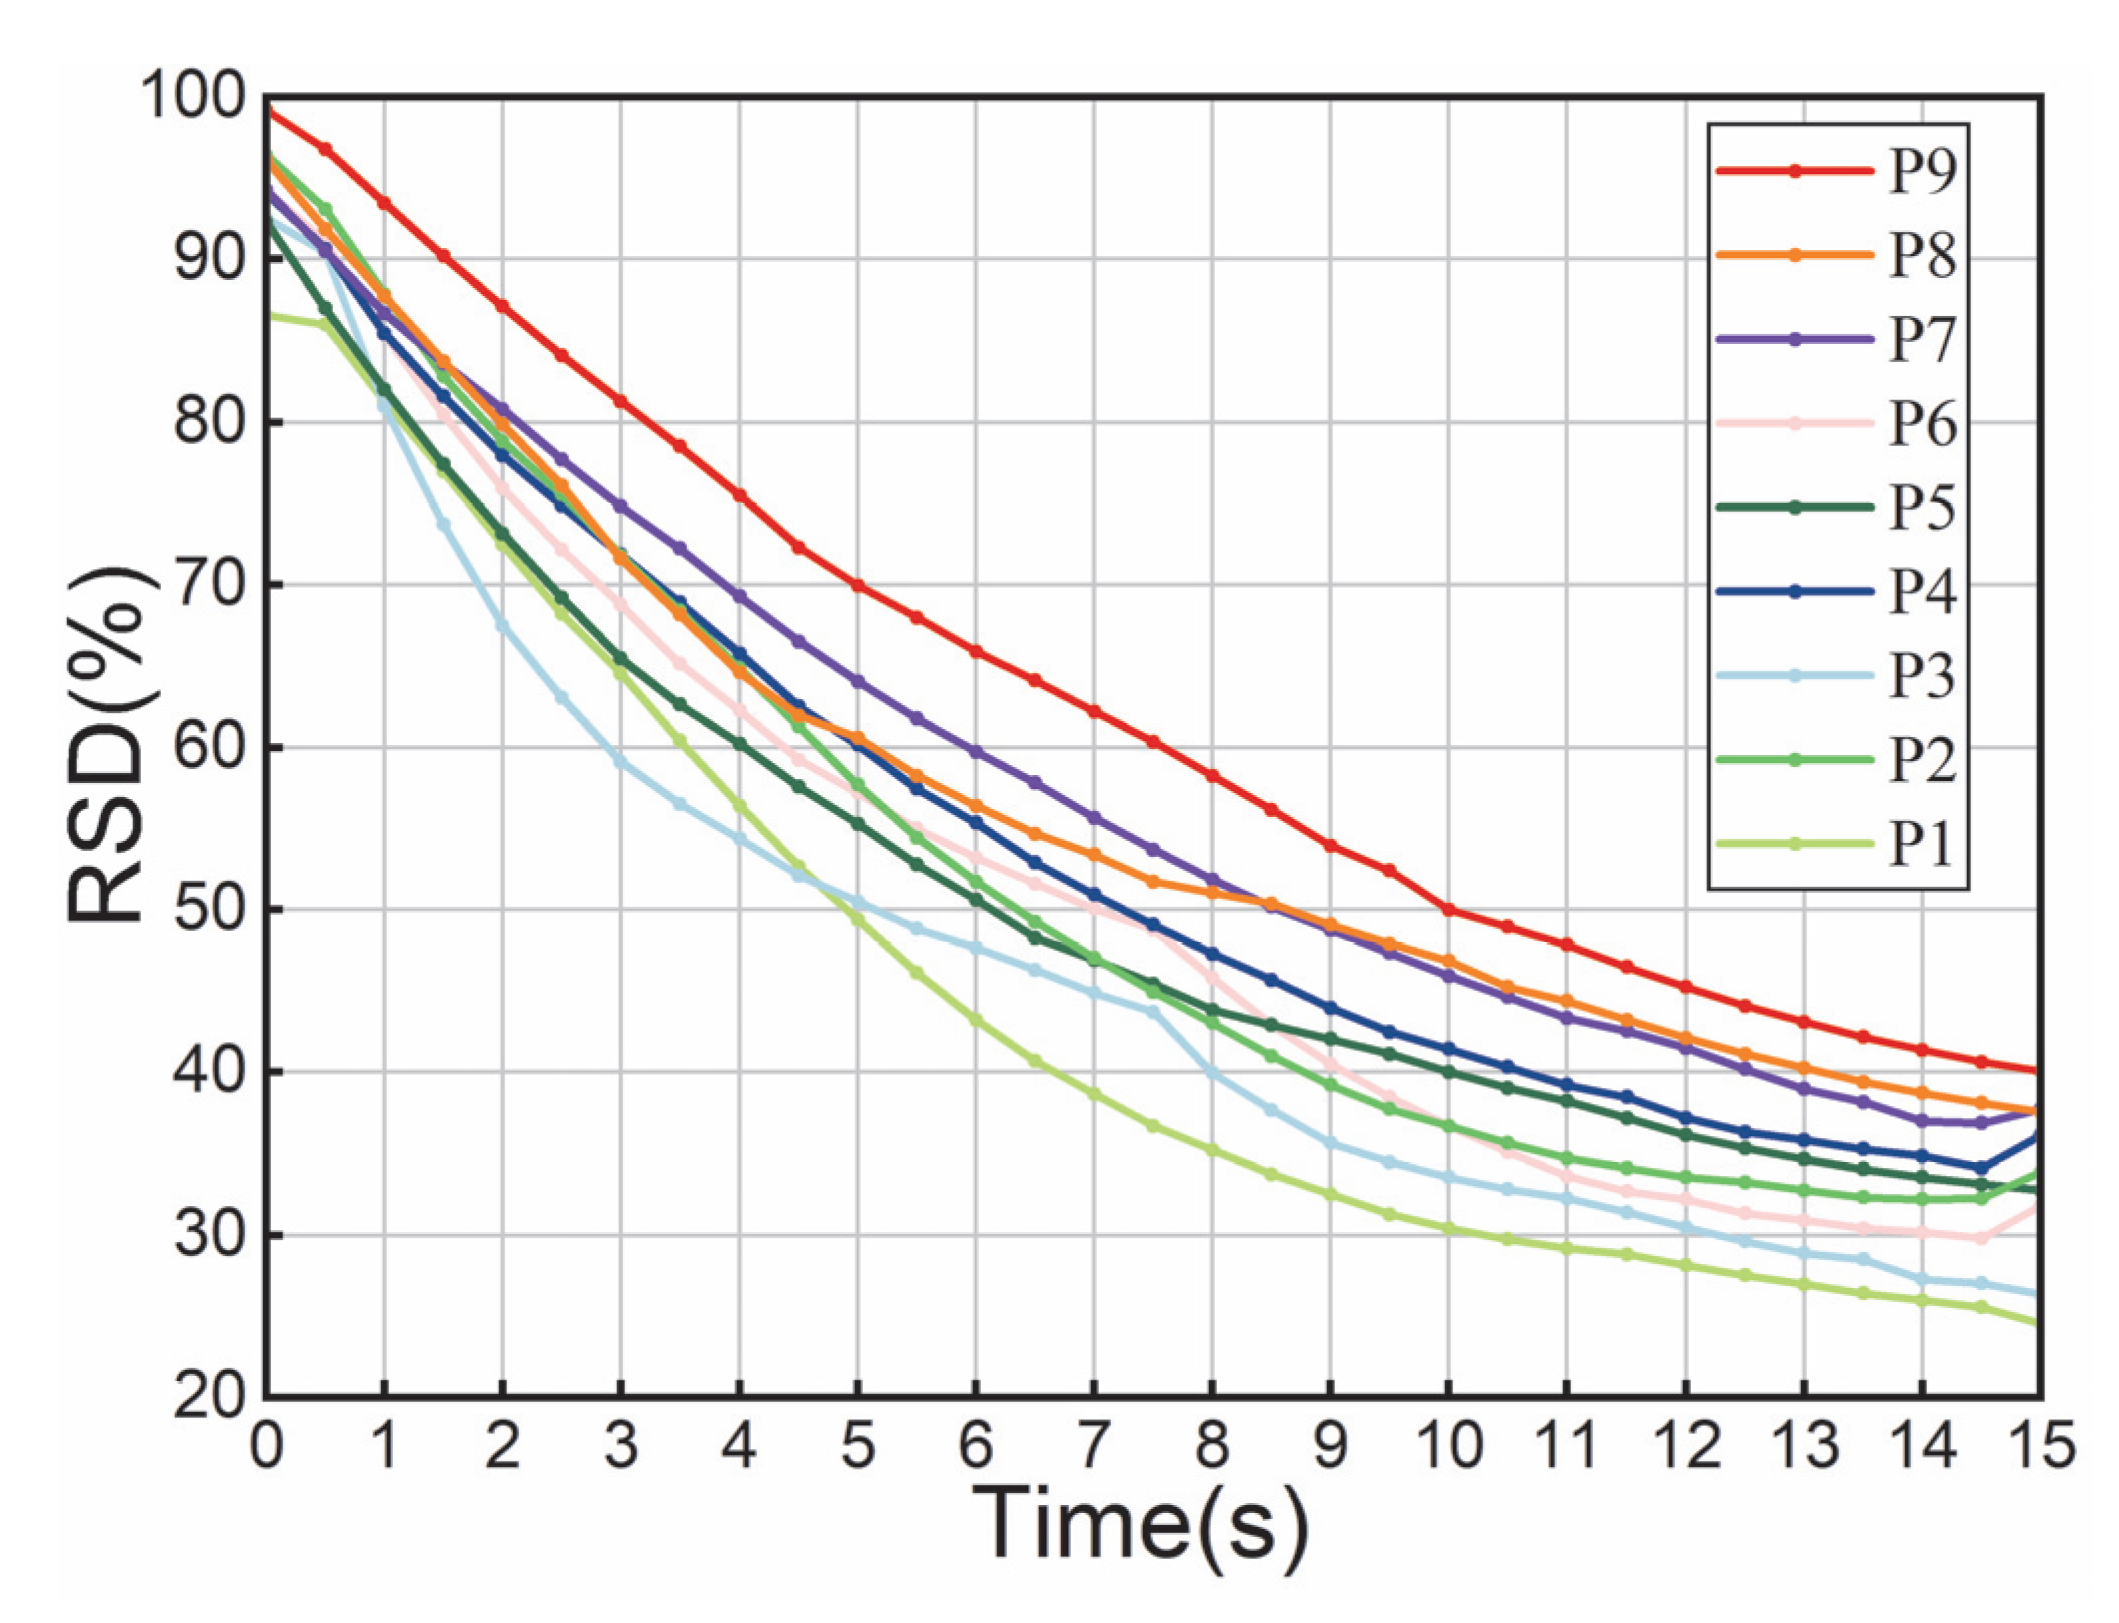
where σ is the standard deviation of particle concentration and x ¯ is the mean concentration in all grids. The grid division significantly influenced the RSD results. In this study, the computational domain is divided into 15, 10, and 10 bins along the x, y, and z directions, respectively, consistent with the methodology reported in [21]. Further reduction in this grid size demonstrated a negligible impact on RSD values. Figure 7 plots the time-dependent RSD functions for all nine particle types. Generally, increasing shape indices n1 and n2 leads to more angular geometries, resulting in progressively degraded mixing performance. The particles can be categorized as follows: cylindrical particles P2 and P5, disk-like particles P3 and P6, rounded cuboid particles P4, P7, and P8, sharp-edged cuboid particles P9, and sphere particles P1. Notably, particles approaching cubic shapes exhibited poorer mixing performance, while disk-like particles outperformed cylindrical ones. Spherical particles (P1) demonstrated optimal mixing performance. Three key dimensions are analyzed to investigate shape-dependent mixing disparities: Particle dynamics behavior, interparticle contact properties, and shape-derived properties.
The primary mechanisms in mixers are particle diffusion and convection. Therefore, the shape effect on motion behavior is discussed from the following perspectives: Firstly, for microscopic motion, the diffusion coefficients for each particle type during mixing are calculated, as presented in Table 4, and both x, y, and z directions are statistically analyzed. The diffusion coefficient reflects the mobility of particles; a higher value indicates lower systemic resistance subjected by particles of that shape, facilitating more uniform mixing while reducing segregation and dead zones. The equation for the diffusion coefficient is as follows:
D ij = Δ μ i Δ μ i ¯ Δ μ j Δ μ j ¯ 2 Δ t
where Dij is the diffusion coefficient in the i direction due to a concentration gradient in the j direction; Δμi and Δ μ i ¯ represent the particle displacement and mean displacement over the time interval (Δt = 0.5 s), respectively. Angle bracket, < >, denotes the time averaging over all the particles. As shown in Table 4, spherical particles (P1) exhibit higher diffusion coefficients compared to other shapes, while sharp-edged cuboids (P9) and rounded cuboids (P7, P8, and P4) generally have lower values. Cylindrical particles (P2) display smaller diffusion coefficients than disk-shaped particles (P3), and a similar trend is observed between P5 and P6. These findings suggest that particles with sharper edges experience greater systemic resistance, and cylindrical particles have more orientation-dependent motion compared to disk-shaped particles. Additionally, the diffusion coefficient in the z-direction differs by an order of magnitude from other directions, indicating particle diffusion predominantly along the x- and y-directions.
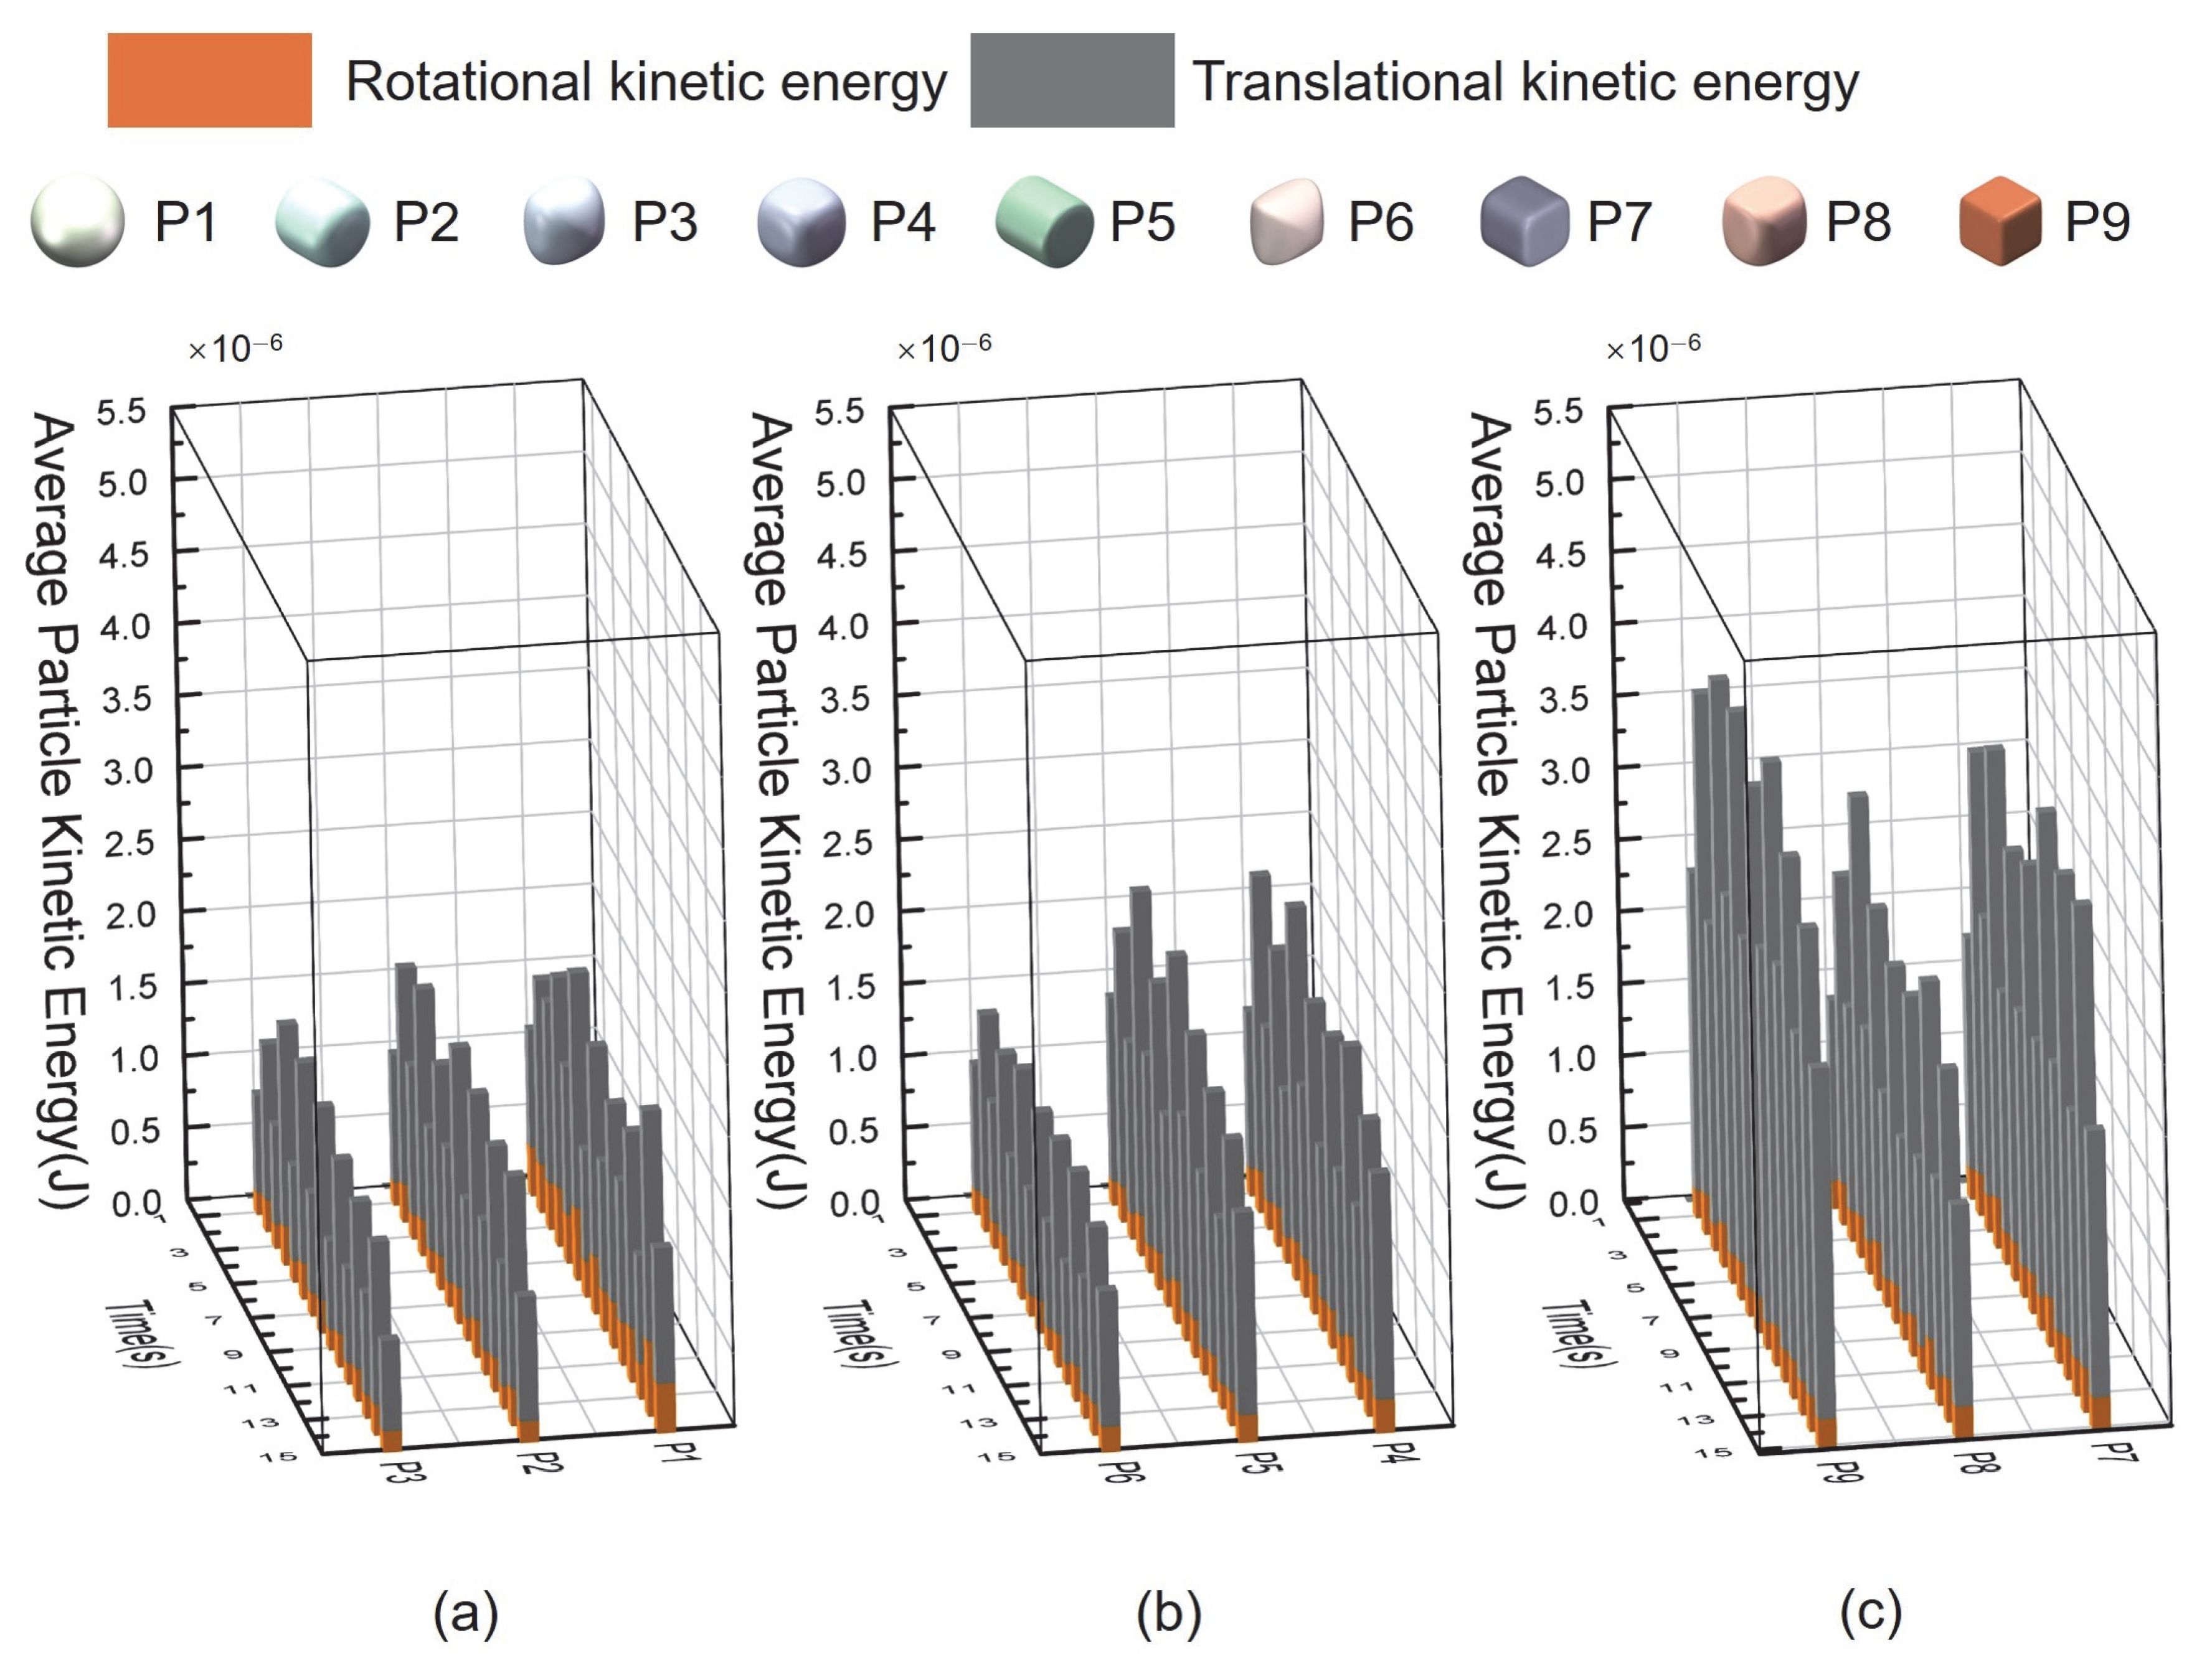
On the other hand, for macroscopic motion, Figure 8 compares rotational kinetic energy with translational kinetic energy. Intuitively, the spherical particle (P1) exhibits the highest proportion of rotational kinetic energy, indicating highly isotropic motion. The sharp-edged cubic particle (P9) has the smallest time-averaged rotational kinetic energy proportion (10.98%) relative to its total kinetic energy. Furthermore, the rotational energy proportions for P3 (17.72–23.93%) versus P2 (15.85–18.33%), and P5 (12.46–15.18%) versus P6 (16.59–21.81%), further demonstrate that disk-like particles experience less hindrance in motion.
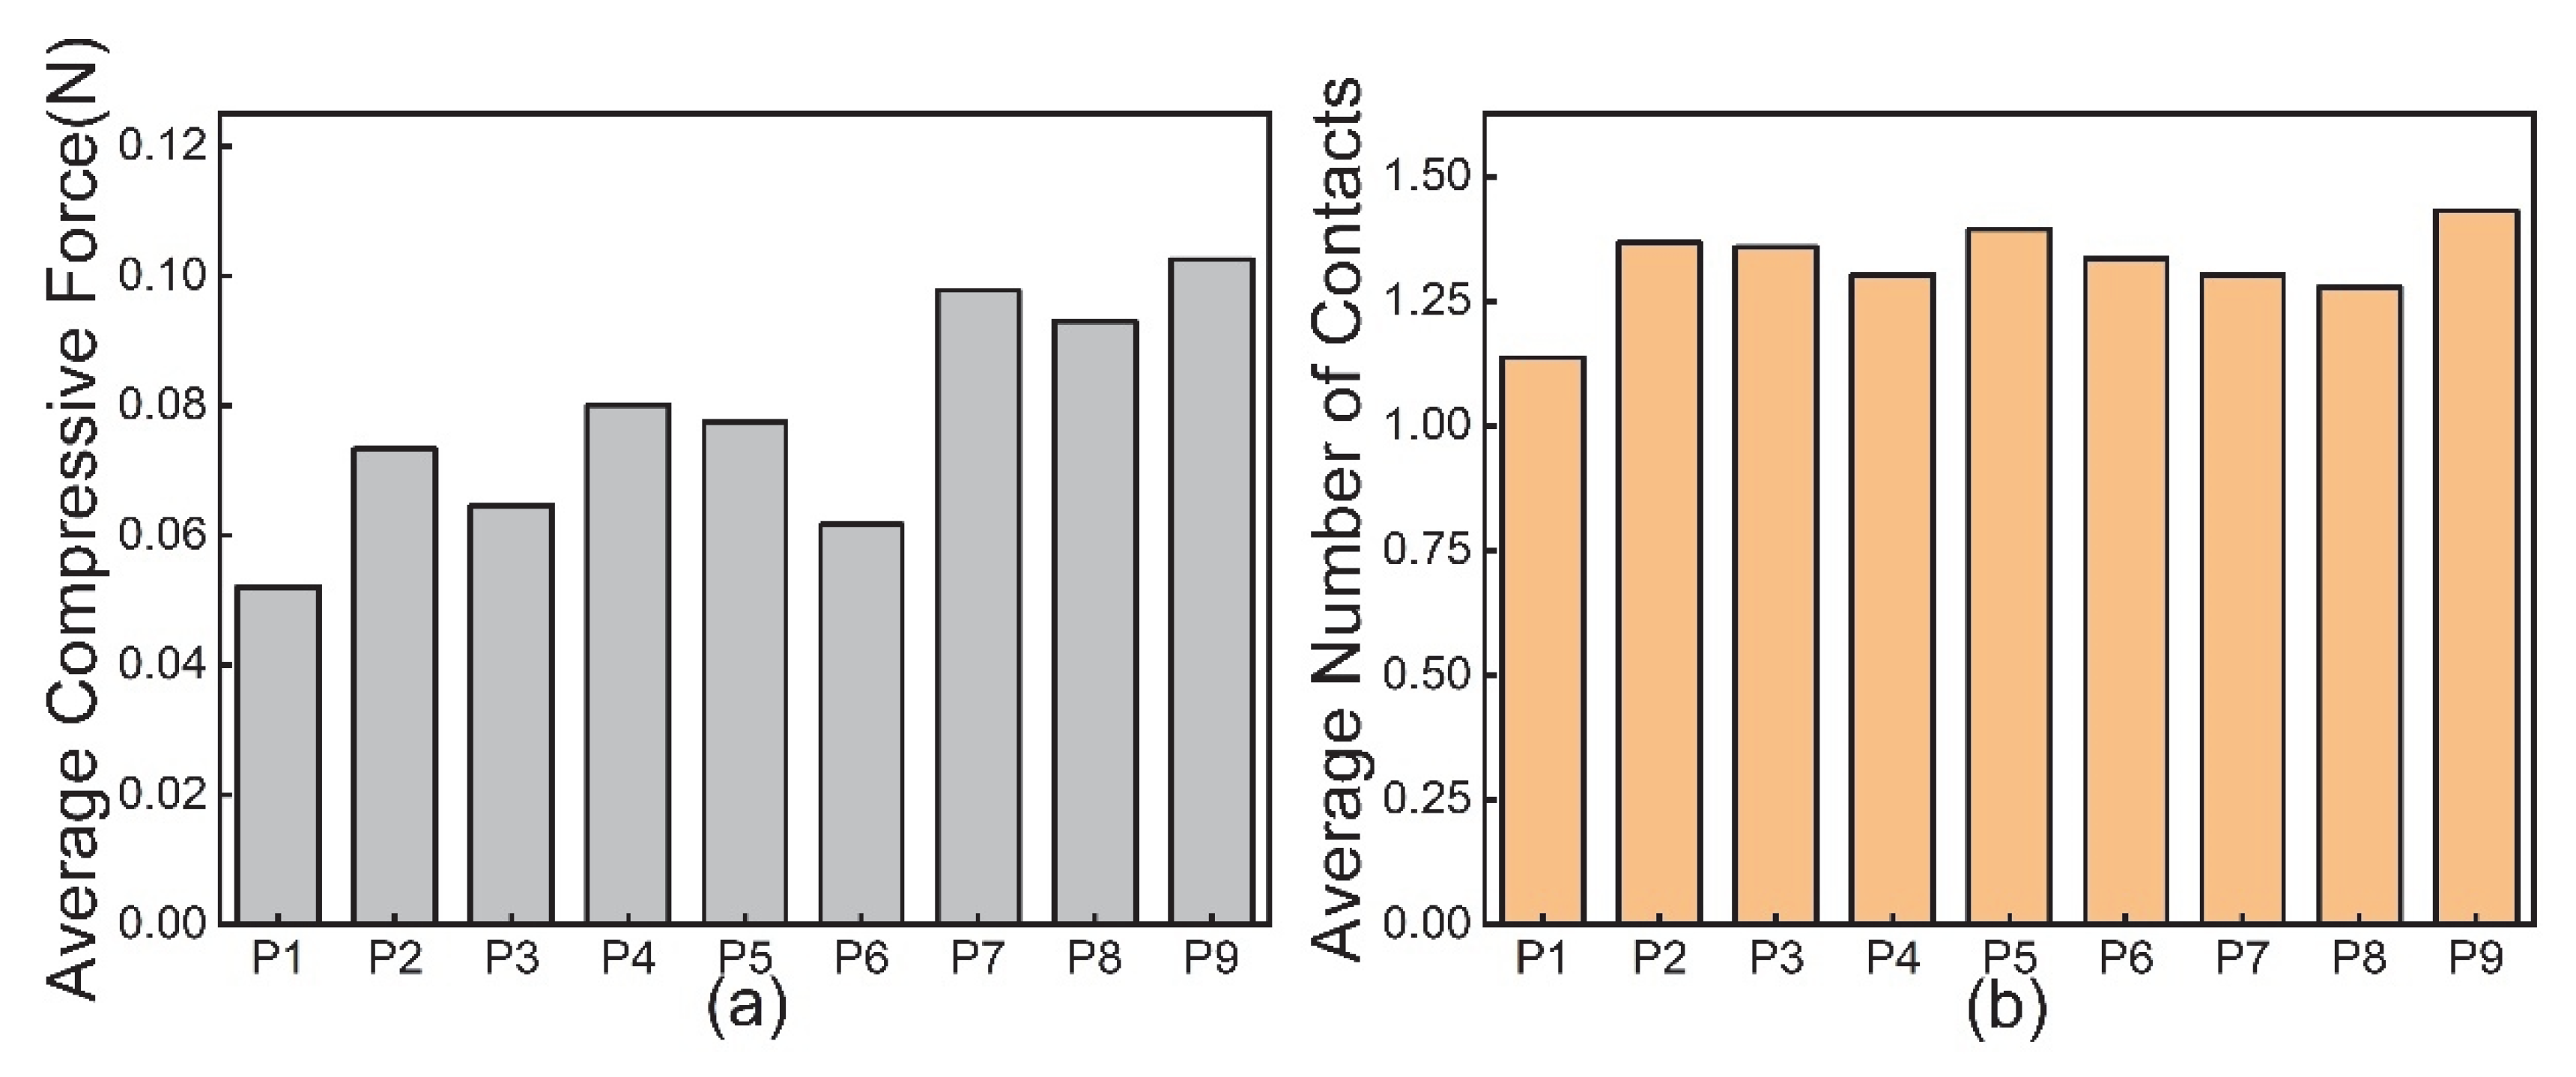
To further investigate the motion hindrance induced by particle shape, Figure 9 presents the compressive force acting on individual particles (Figure 9a) and the number of contacts per particle (Figure 9b). Non-spherical particles have higher compressive forces due to localized contact points, leading to energy dissipation (e.g., through friction or fragmentation) and consequently reducing their mixing performance. Combined with the kinetic energy statistics in Figure 8, although the kinetic energy of non-spherical particles (P2–P9) increases sequentially, their mixing efficiency decreases due to higher energy dissipation. Meanwhile, the compressive force of each particle shape correlates with their mixing performances, such as sharp-edged cubic particles subjected to greater compressive forces than cylindrical particles, which are subjected to greater compressive forces than disk-shaped particles. Particles with higher contact numbers tend to form mechanical interlocking, suppressing shear band formation and delaying mixing, whereas spherical particles with fewer contacts achieve rapid rearrangement through rolling. As shown in Figure 9b, spherical particles have the fewest contacts, while sharp cubic particles exhibit the highest. Other shapes (P2–P8) show only minor differences in contact numbers, all exceeding those of spherical particles. Cylindrical particles P2 and P5 have slightly more contacts than P3 and P6, forming more stable force chain networks that ultimately reduce flowability. Void, a frequently overlooked parameter in studies on particle shape effects, affects internal particle mobility. We measured the void of nine particle types in densely packed regions, as listed in Table 5. The calculation for void fraction φ is as follows: Fill a box with the particles, φ = volume of the particles/volume of the box. Spherical particles exhibit higher void than non-spherical ones, further confirming the lower internal frictional resistance and enhanced flowability of spherical particles, stable for convection-dominated rapid mixing. In summary, compressive forces reflect energy dissipation among non-spherical particles, while interparticle contact numbers characterize mechanical interlocking effects. These two parameters elucidate the intrinsic mechanisms behind mixing disparities induced by particle shape.

4.3. Effects of Geometry

4.3.1. Effects of Plow Angle

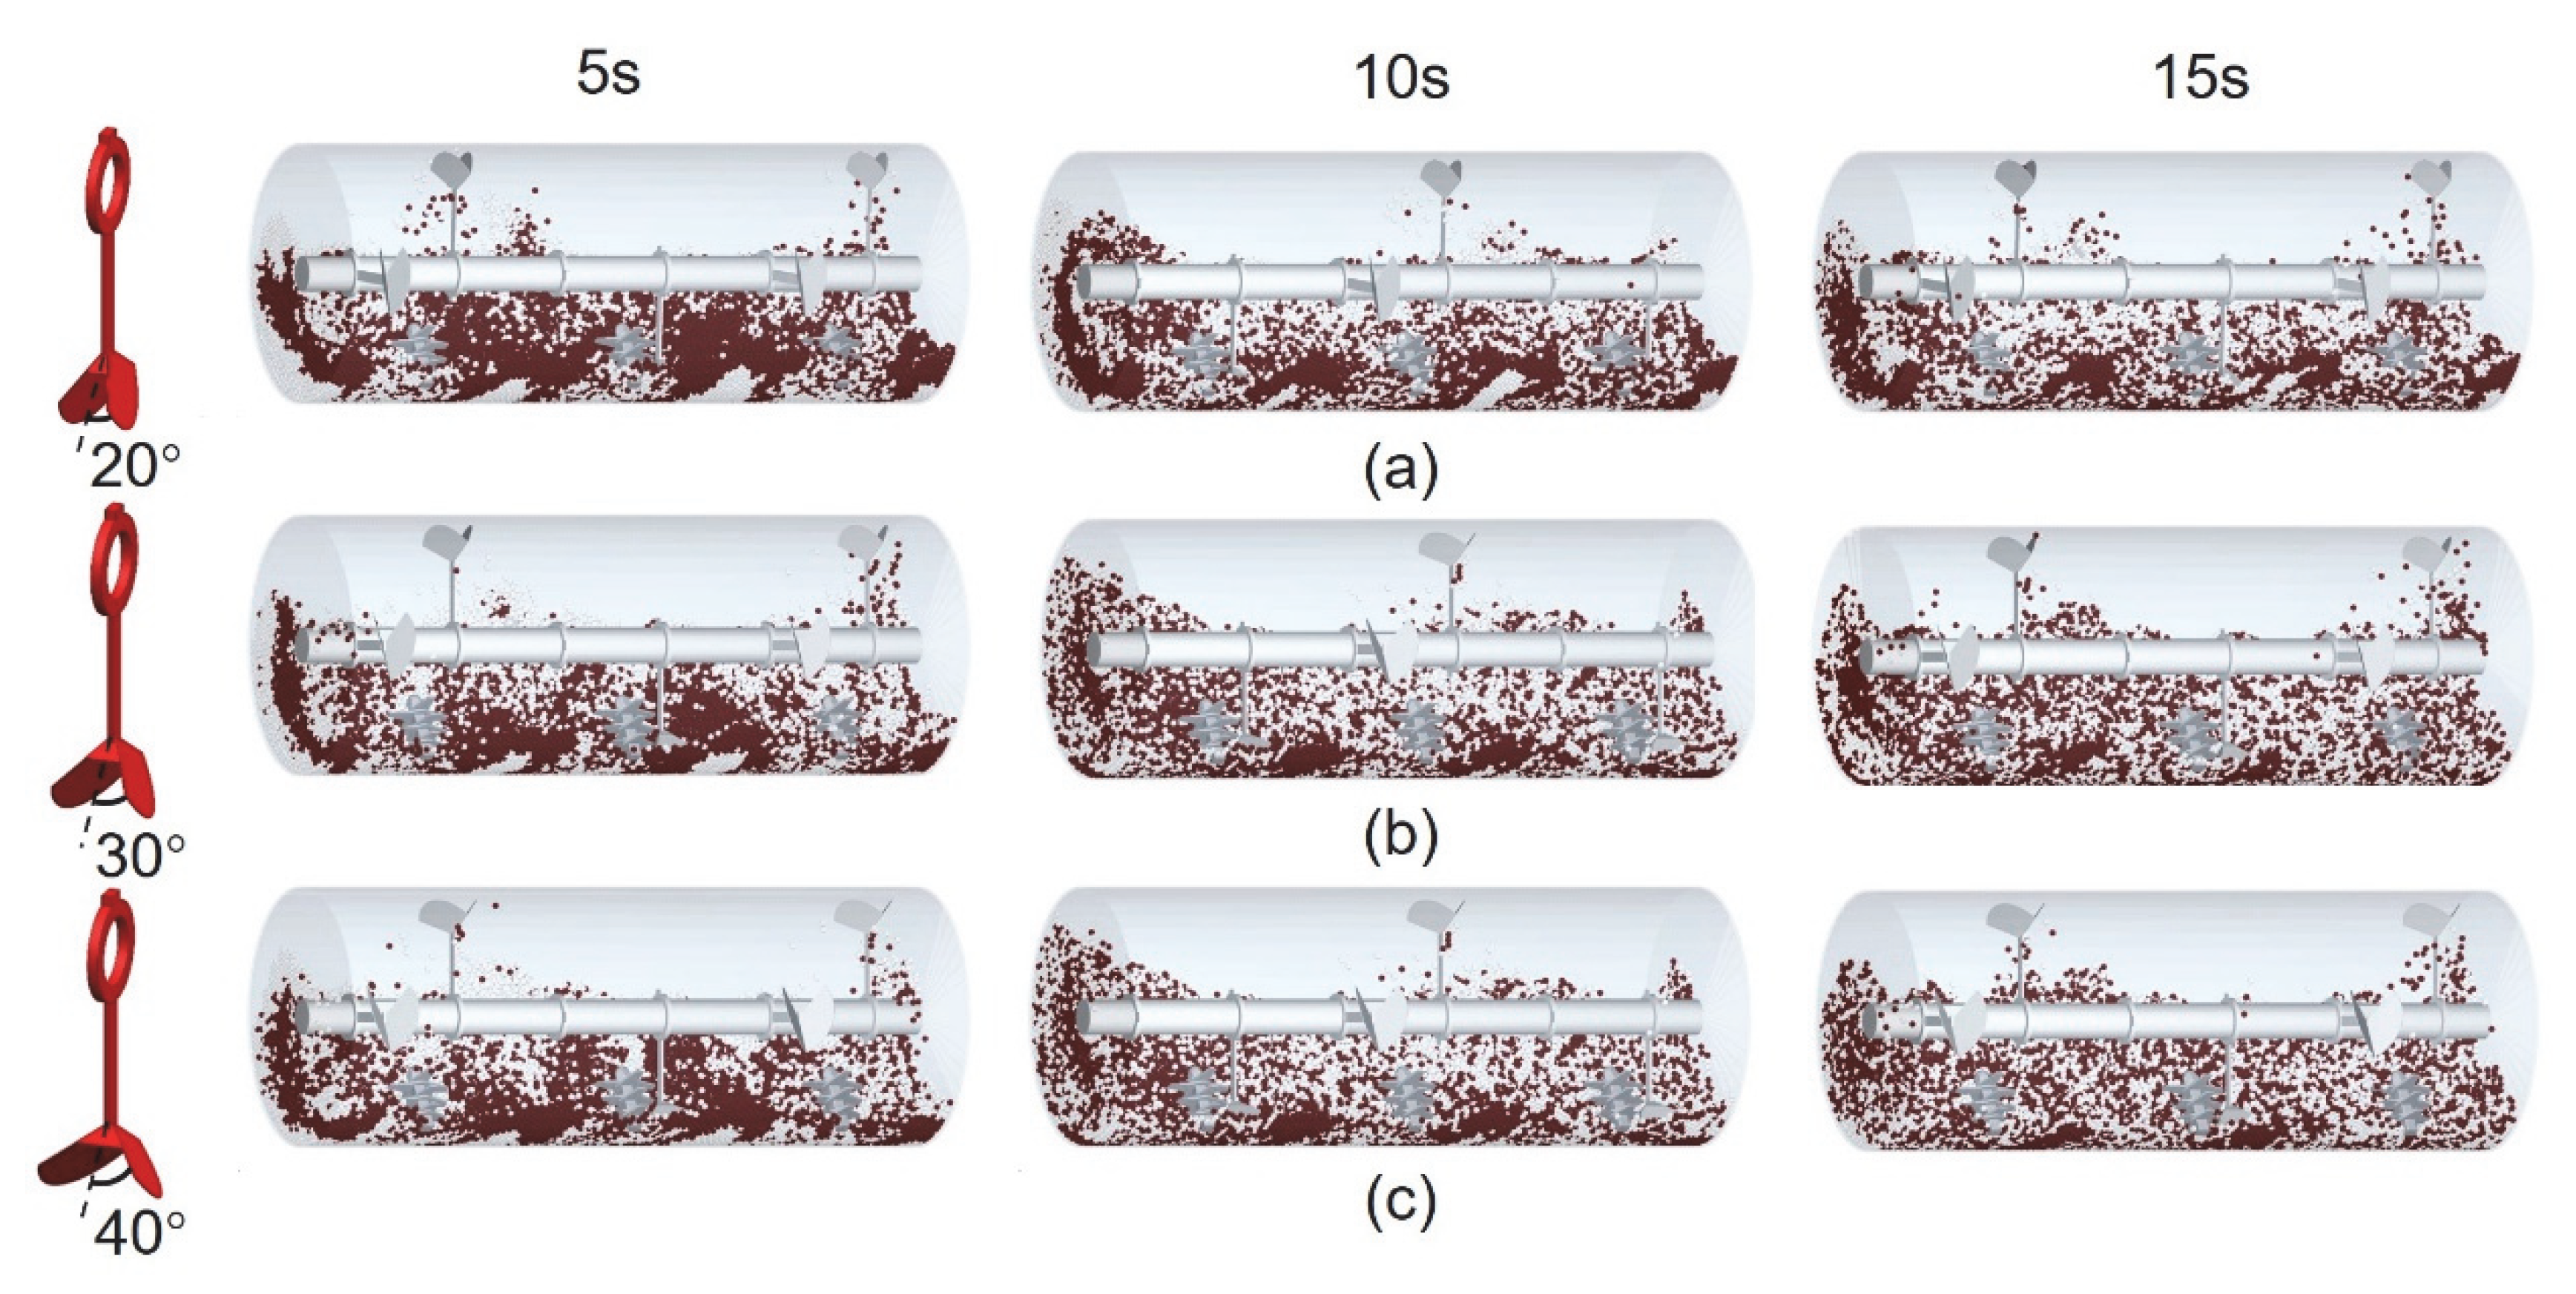
Due to the flow advantages of spherical particles, the influence of plow angle on mixing is investigated in this section. To control variables in the simulation experiments, all DEM parameters remain consistent in the plow angle 30°, 20°, and 40° simulation cases. Two types of particles are loaded in top-bottom, same as Section 4.1, each type has 20,000 particles. Figure 10 depicts the particle distribution during the mixing from 5 s to 15 s, while the plow blade angle in Figure 10a–c progressively increases. Watching the final mixed state, whenever in front-view and side-view, the shell equipped with a 40° plow angle achieves uniform mixing. In the shell equipped with a 30° plow angle, the particles exhibit uniform mixing on the front-view, but accumulation of white particles appears obviously on the side-view. The 20° plowshare has inferior mixing efficacy: At the 15 s mixing time, particle aggregation is observed in both front-view and side-view, with red particles accumulating between adjacent plowshares; From side-view, red particulates form cylindrical striated patterns. On the other side, the initial upper-layer red particles are pushed downward by the plowshare blades with increasing mixing time; similarly, white particles are displaced upward. Comparing mixing snapshots at 5 s and 10 s, the limited particle mixing by 20° blades results in localized accumulation of red particles. Consequently, larger plow angles enhance particle movement to mix more uniformly.
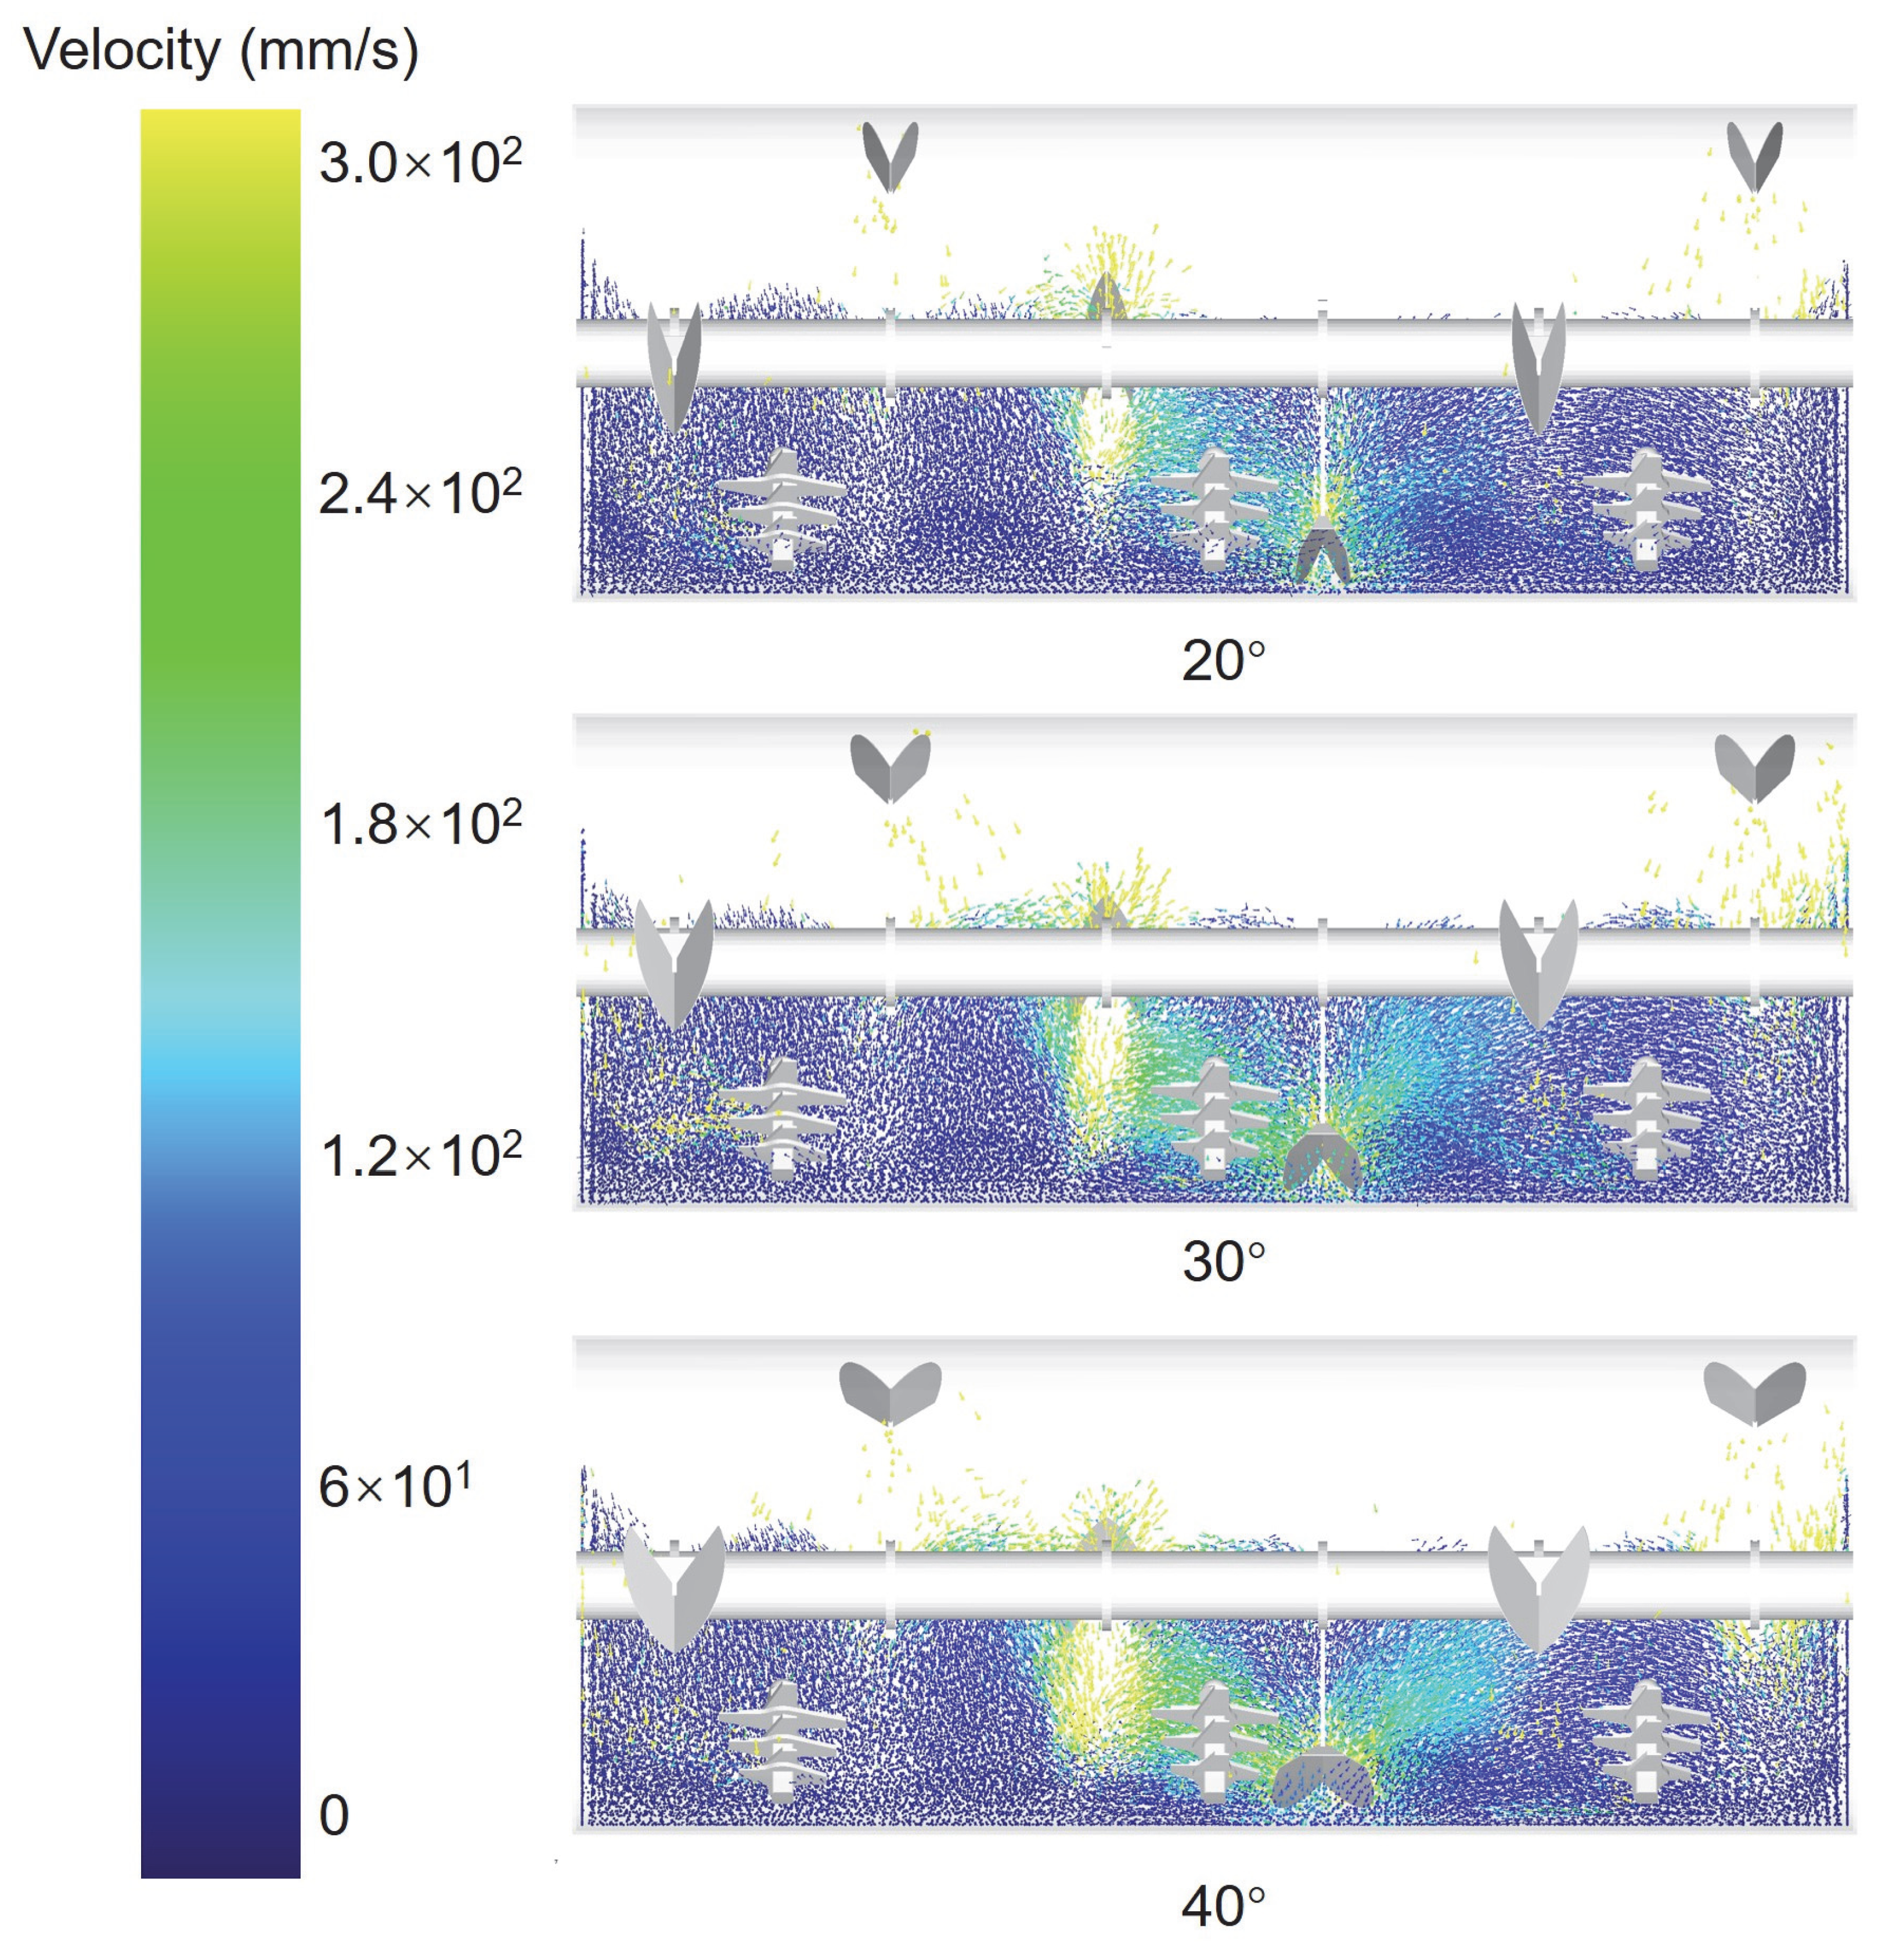
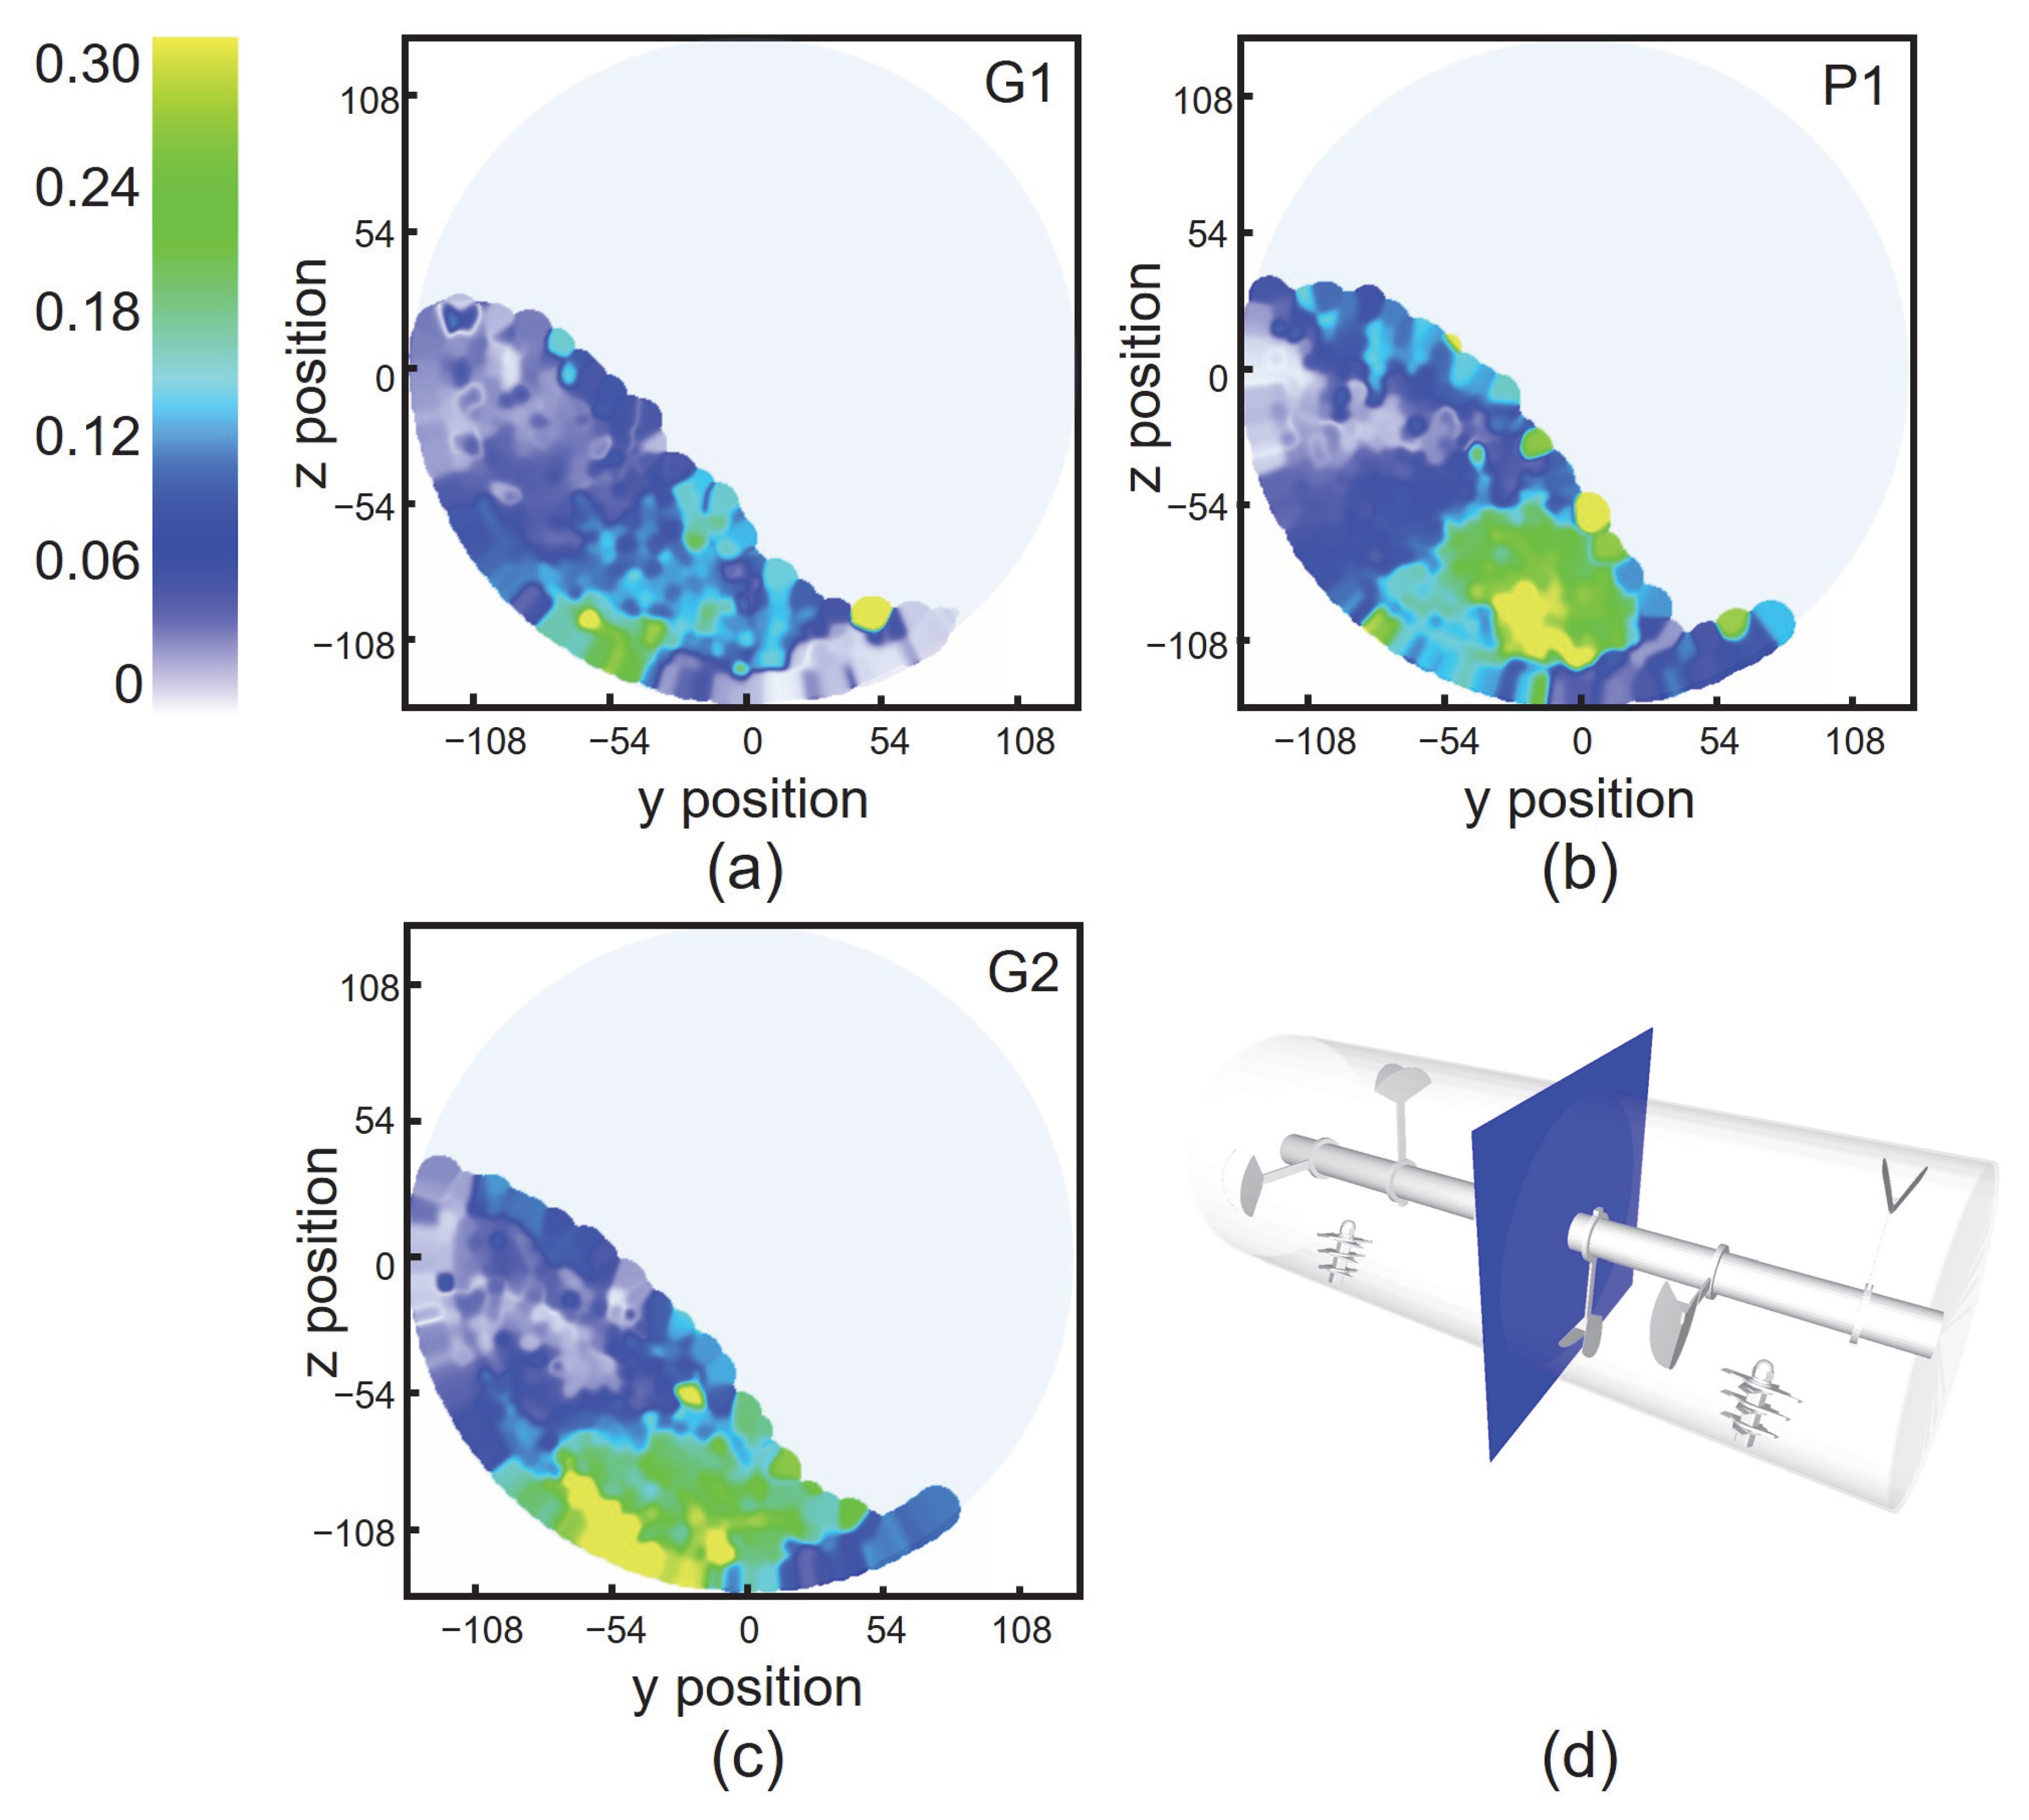
To further investigate the mixing mechanism of plowshares, particles are treated as vectors with velocity-magnitude coloring, as shown in Figure 11. Observing the central region of the shell, two adjacent plowshares simultaneously enter and exit the particle bed, and significant particles are pushed and scattered. Increasing the plow angle notably expands the light-colored region, indicating greater kinetic energy transfer to the surrounding particles. The particles marked in yellow experience direct contact with the plowshare, which has high speed, and subsequently transfer kinetic energy to surrounding particles through collisions. Consequently, mixing uniformity is governed by the particles’ mobility—a property significantly enhanced by larger plowshare angles. According to Figure 12, a plane is created 2 mm from the plowshare for continuum analysis to investigate the mechanical behavior of the granular system at the macroscopic scale. The continuum analysis transforms discrete particle velocity data into a continuous velocity field, facilitating the analysis of localized particle flow patterns influenced by geometry modifications of the plowshare. Notably, continuum analysis introduces a smoothing effect, where the results represent the “bulk flow velocity” of the region; its maximum value is lower than the peak instantaneous velocity of individual particles. Due to the unidirectional mixing action of plowshares, particle accumulation occurs on one side, forming a peak. The particle velocities adjacent to the plowshare reach their maximum value in all cases. As shown in Figure 12a–c, the expansion of the yellow area indicates that increasing the plow angle imparts greater kinetic energy to the particles, thereby enhancing their flow mobility.
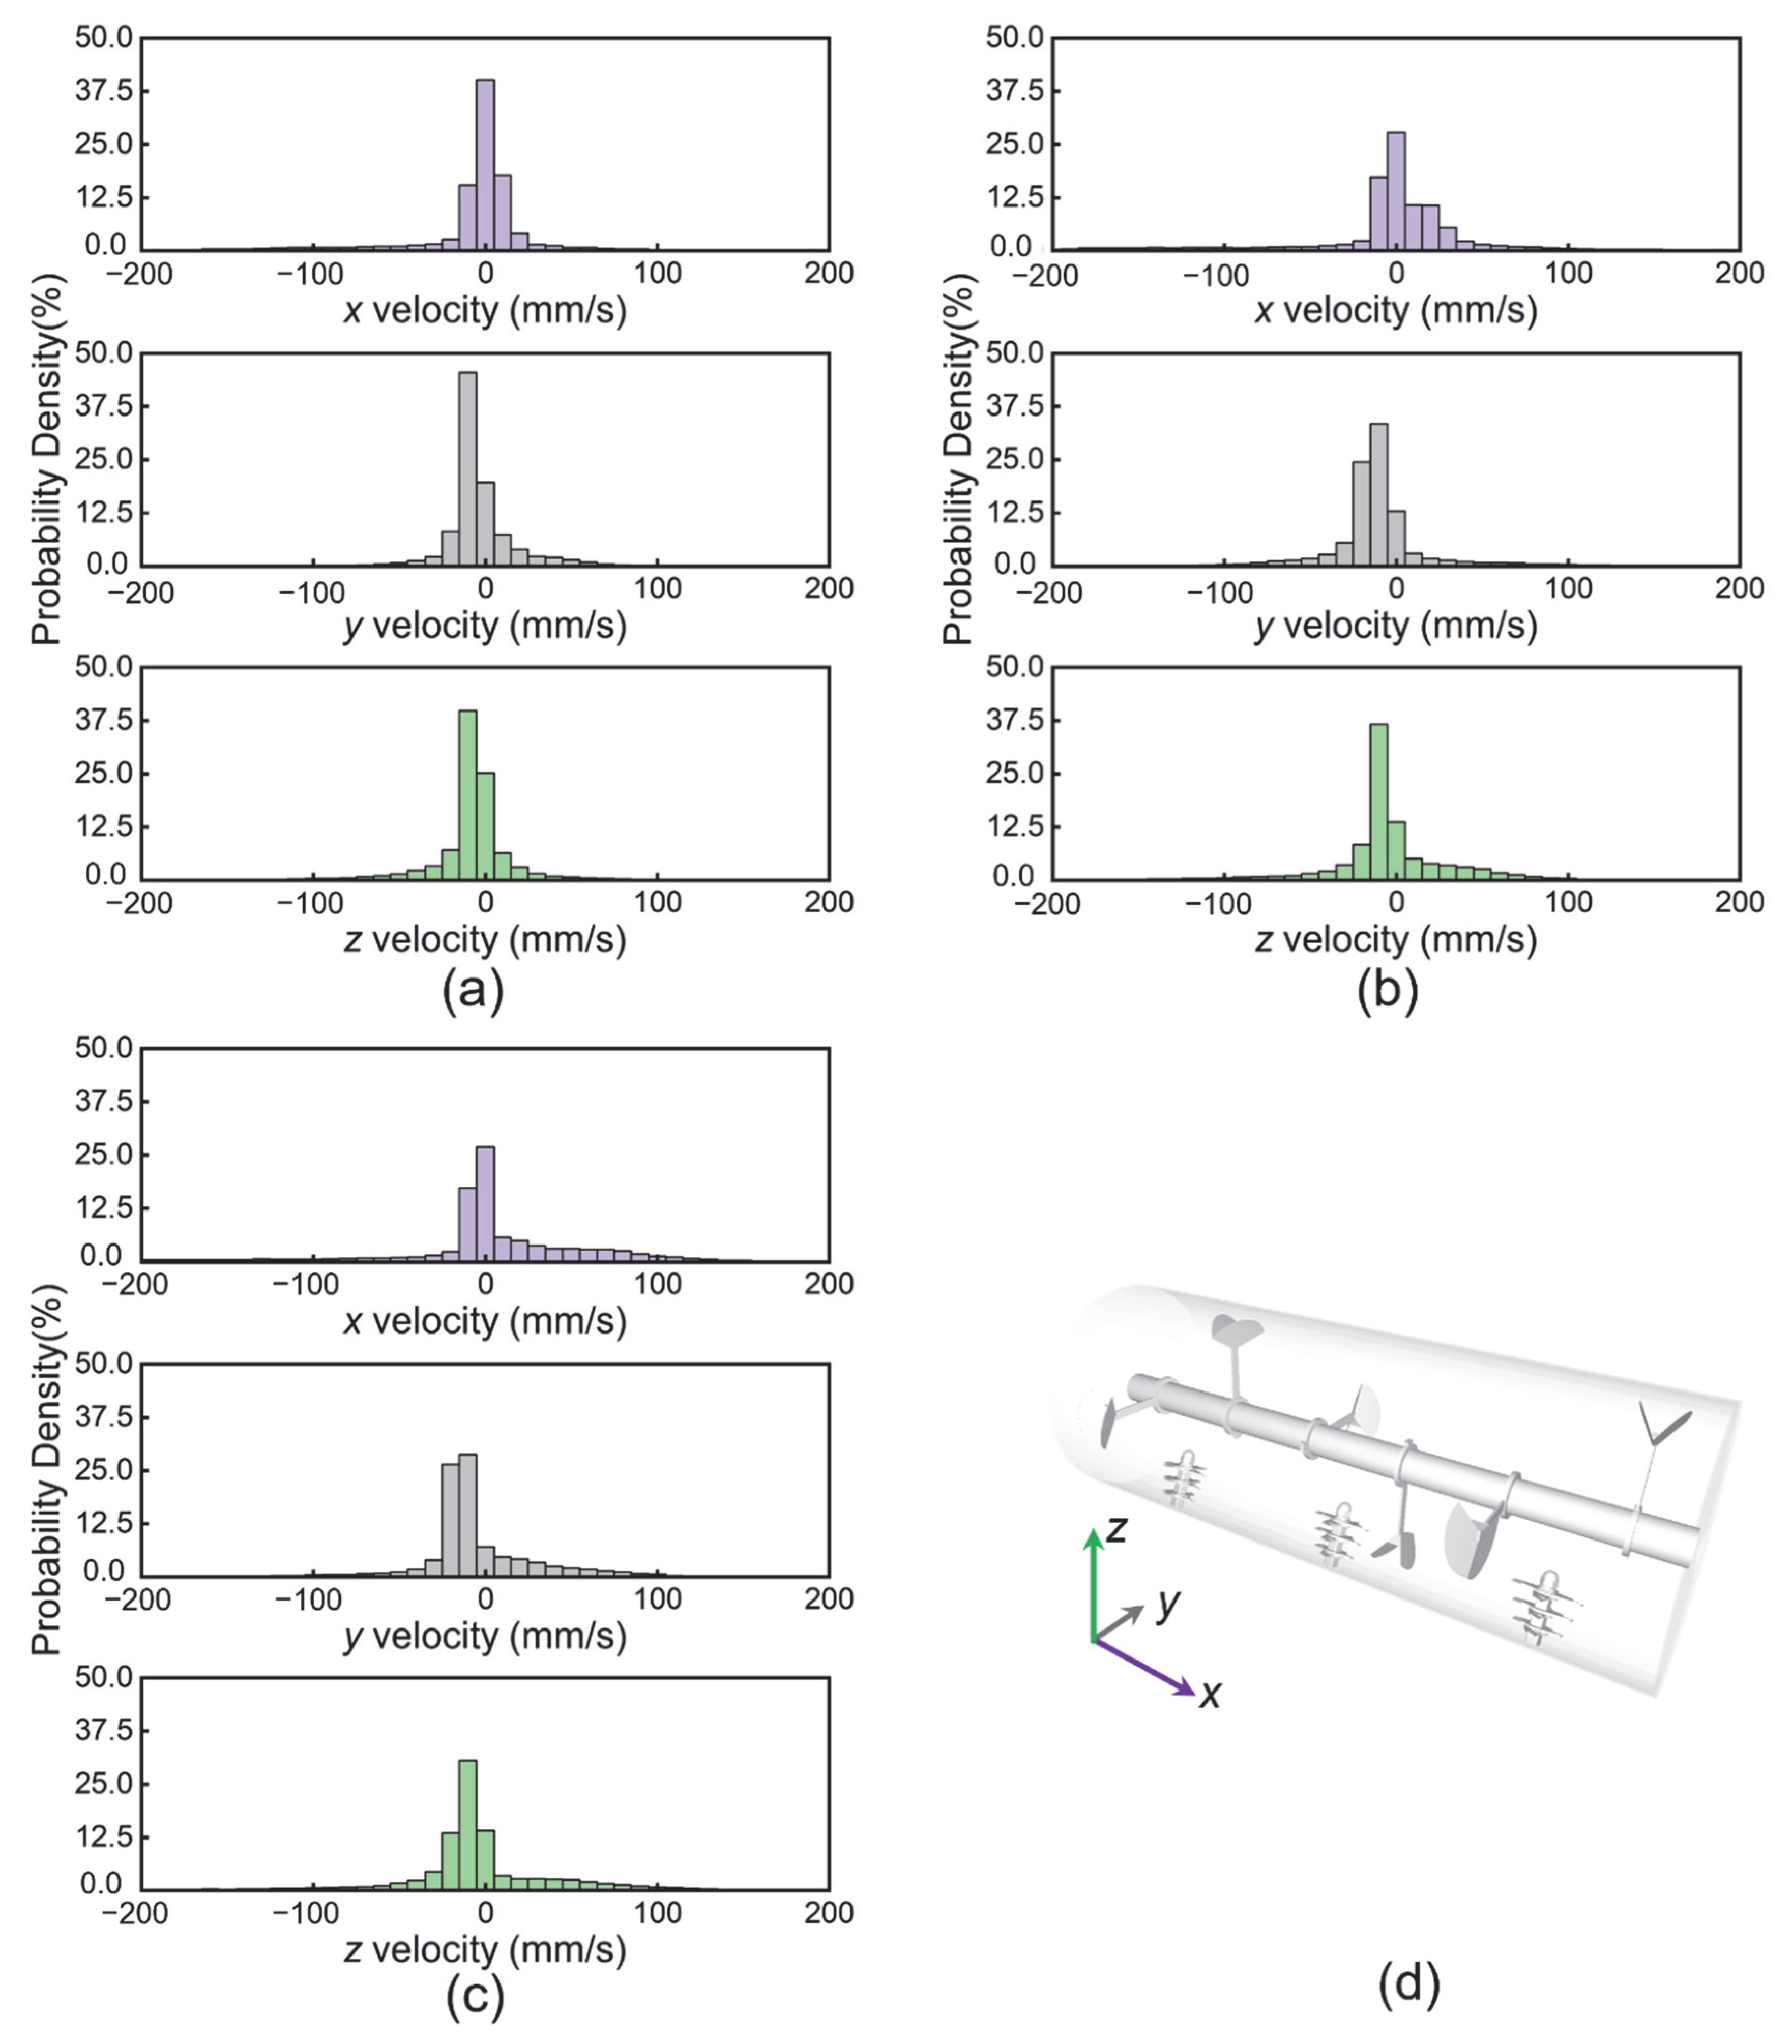
The velocity components (x, y, z) of all particles are statistically analyzed as probability density functions (PDFs), as shown in Figure 13, which enables quantitative characterization of particle motion. Comparing three components of velocity of particles within individual experiments, consistent trends are observed: Most proportions of particles have zero velocity in the x-component, 40.13%, 27.87%, and 26.95% in plow angle 20°, 30° and 40°, respectively; In y and z-component, particle velocity predominantly clustered between −10 mm/s and 0, most particles have mobility. Based on the above analysis, we can infer that the mixing mechanism relies on interlayer convection of particles driven by the plowshares. A comparison of the three simulation experiments reveals the influence of plow angle factors: In x-component, the number of particles with zero velocity follows the order plow angle 20° > 30° > 40°; the above number trend is reversed, in y and z-component, showing plow angle 20° < 30° < 40°; Notably, the plow angle 20° and 30° groups have a higher population particles with >50 mm/s velocity in both y- and z-components.
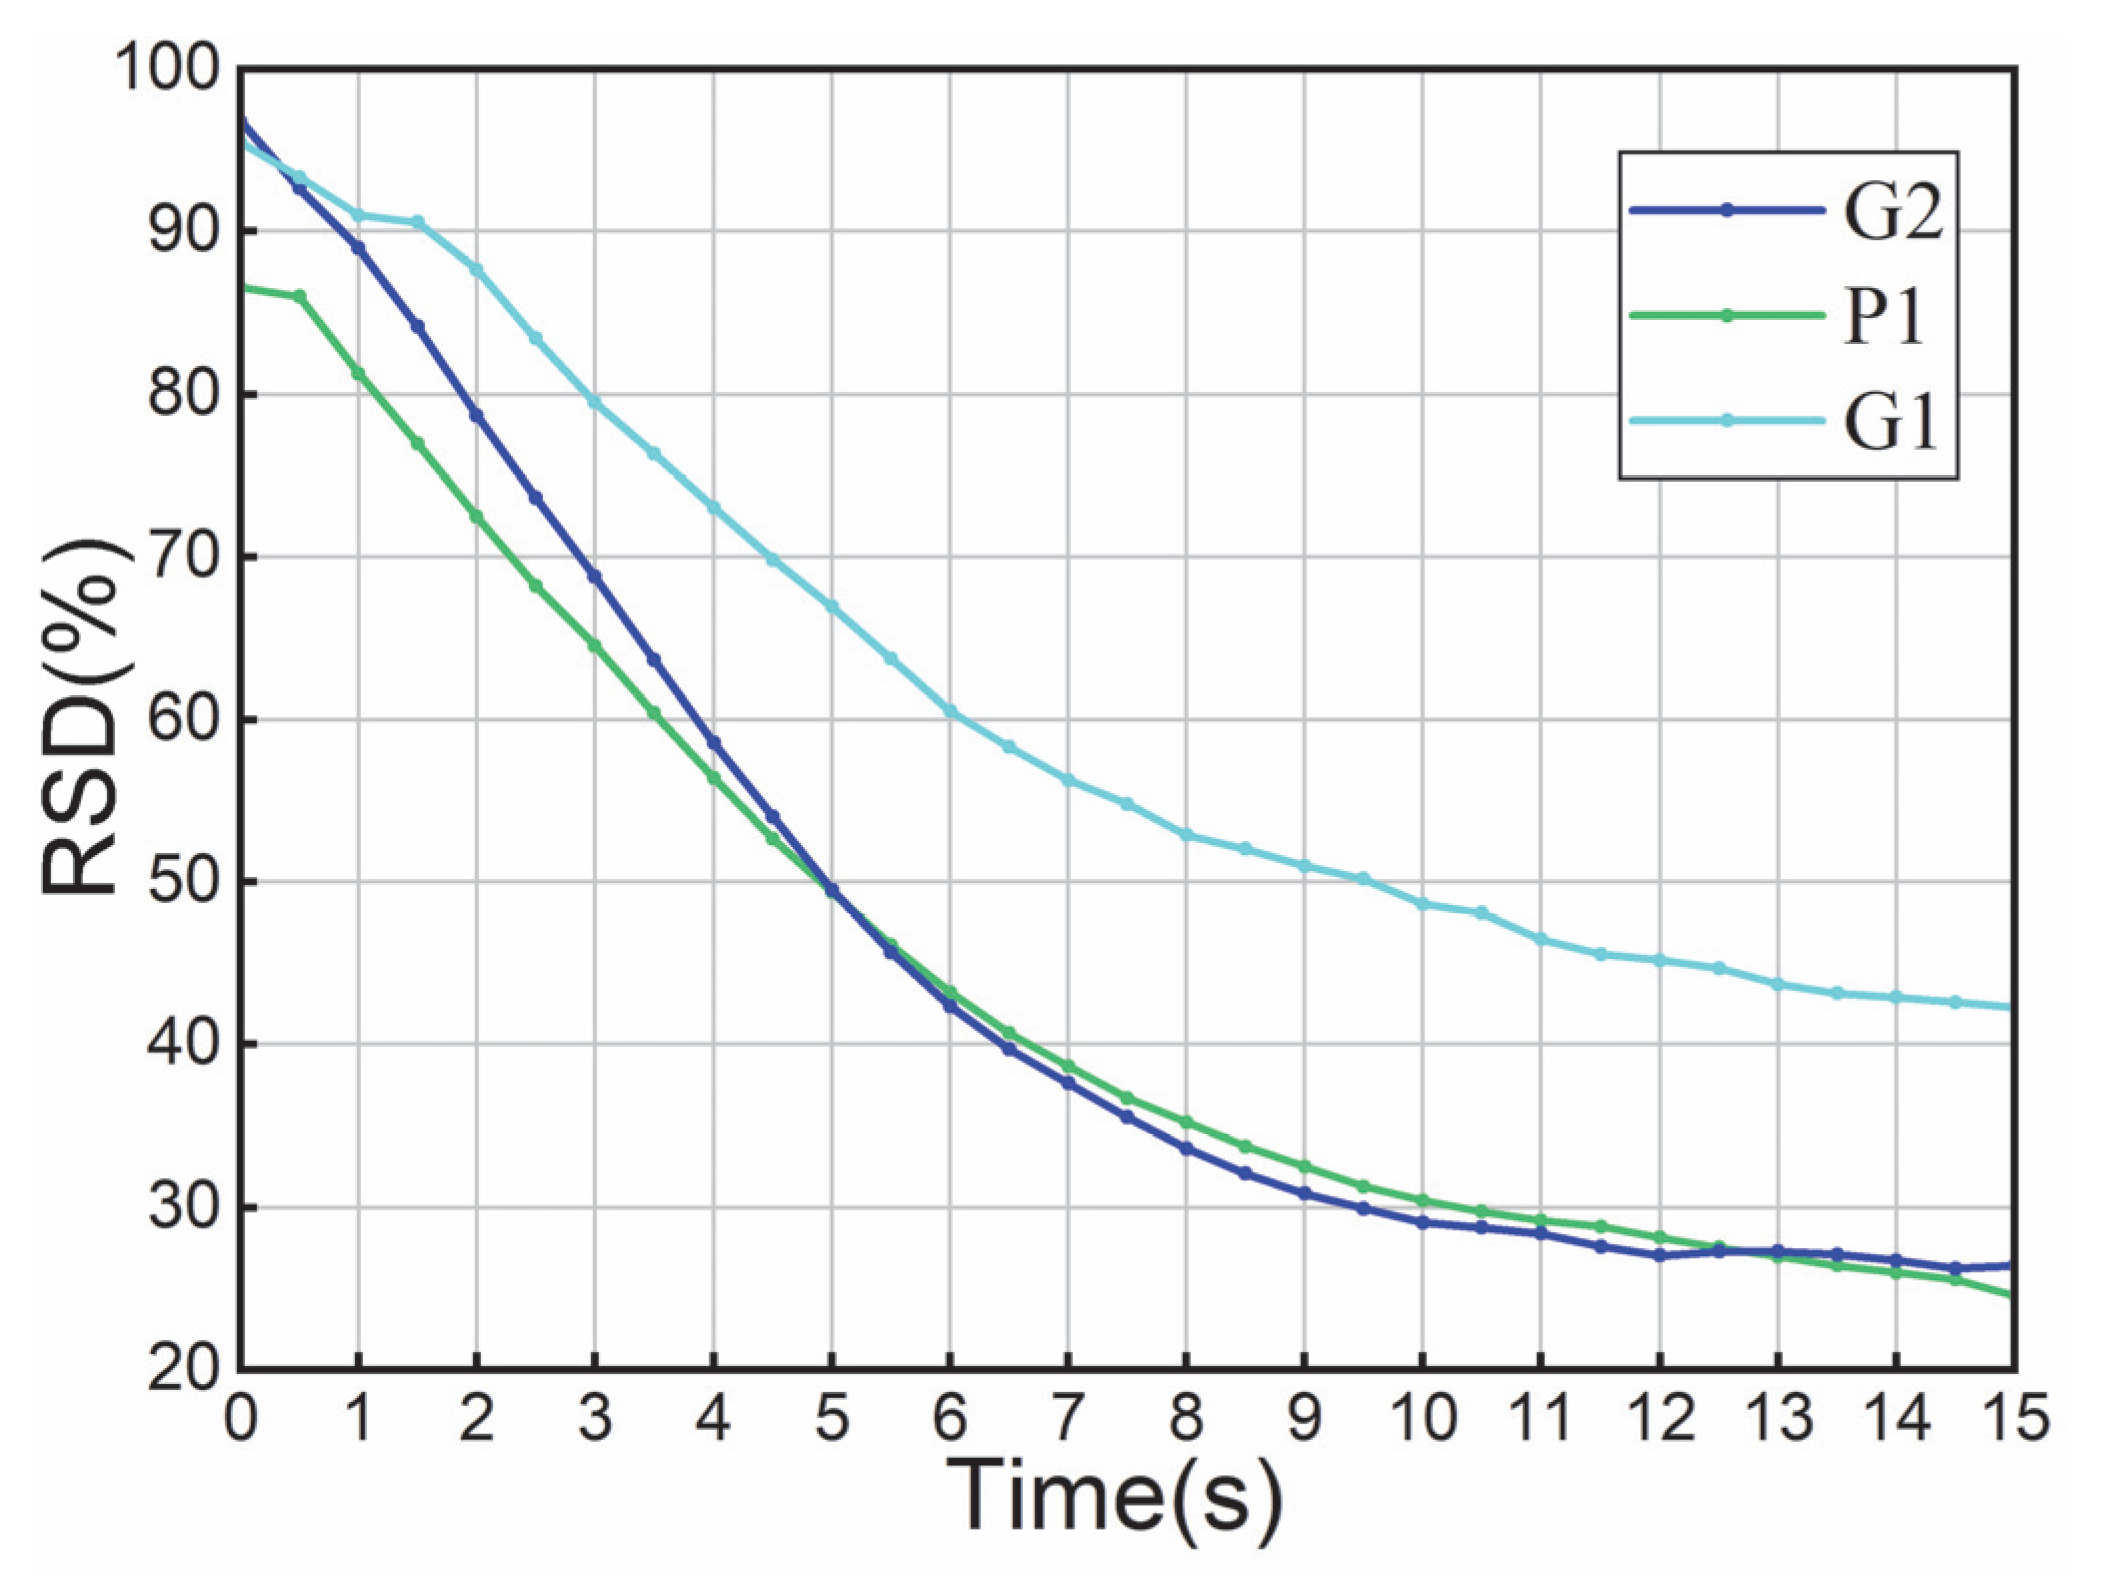
Because of the comparable variations in each experiment, a significant portion of particles have zero velocity in the x-component, whereas most particles have non-zero velocities in the y- and z-components. Cross-comparison of experiments revealed that the plow angle determines the interlayer convective of particles; The velocity distribution in the x-direction confirmed that the plow blades influence the axial diffusion. Consistent with the bin setting used in the earlier section, Figure 14 presents the evolution curves of the RSD over time for experimental groups. After mixing for 15 s, the RSD for plow angle 30°, plow angle 20°, and plow angle 40° groups are 26.39%, 42.29% and 24.55%, respectively. In all three experiments, the RSD initially increased and reached a plateau after 10 s. Furthermore, a significant disparity in mixing performance is observed between the 20° and 30° plow angles, whereas the difference between 30° and 40° is minimal; 20° plowshares fail to achieve uniform mixing. In conclusion, increasing the plow angle enhances mixing efficiency; an insufficient angle (e.g., 20°) may result in incomplete mixing.

4.3.2. Effects of Chopper

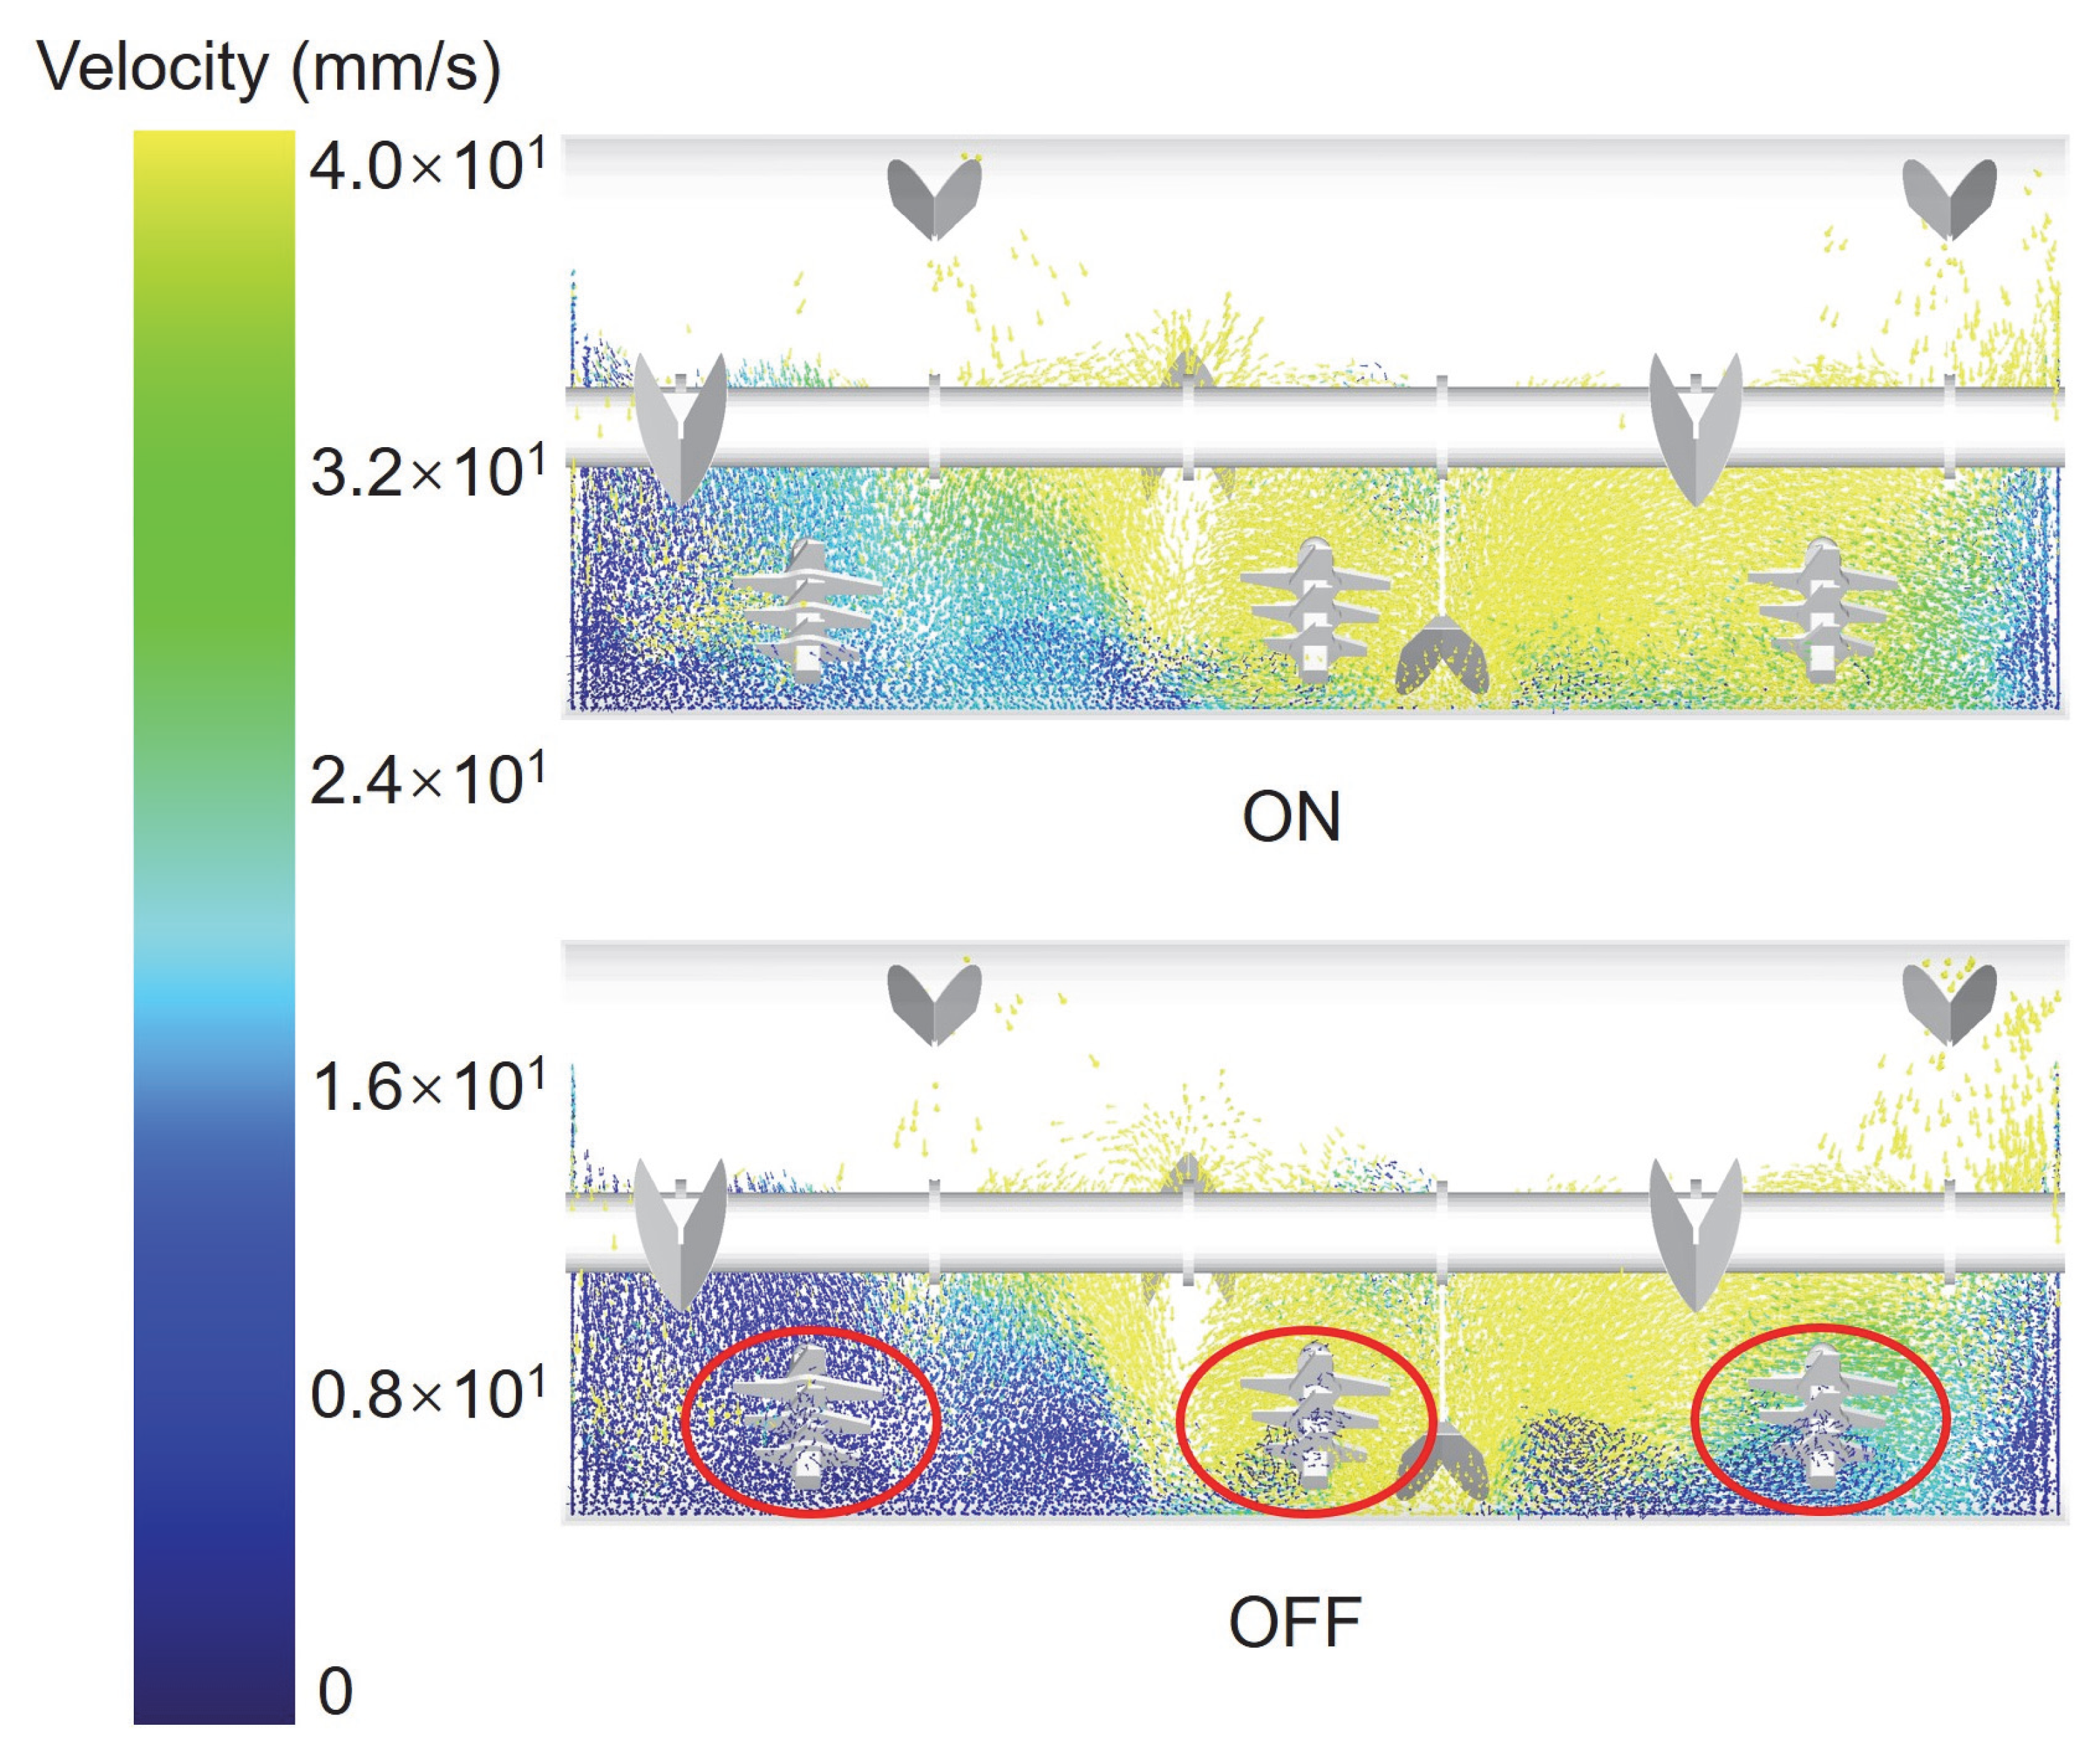
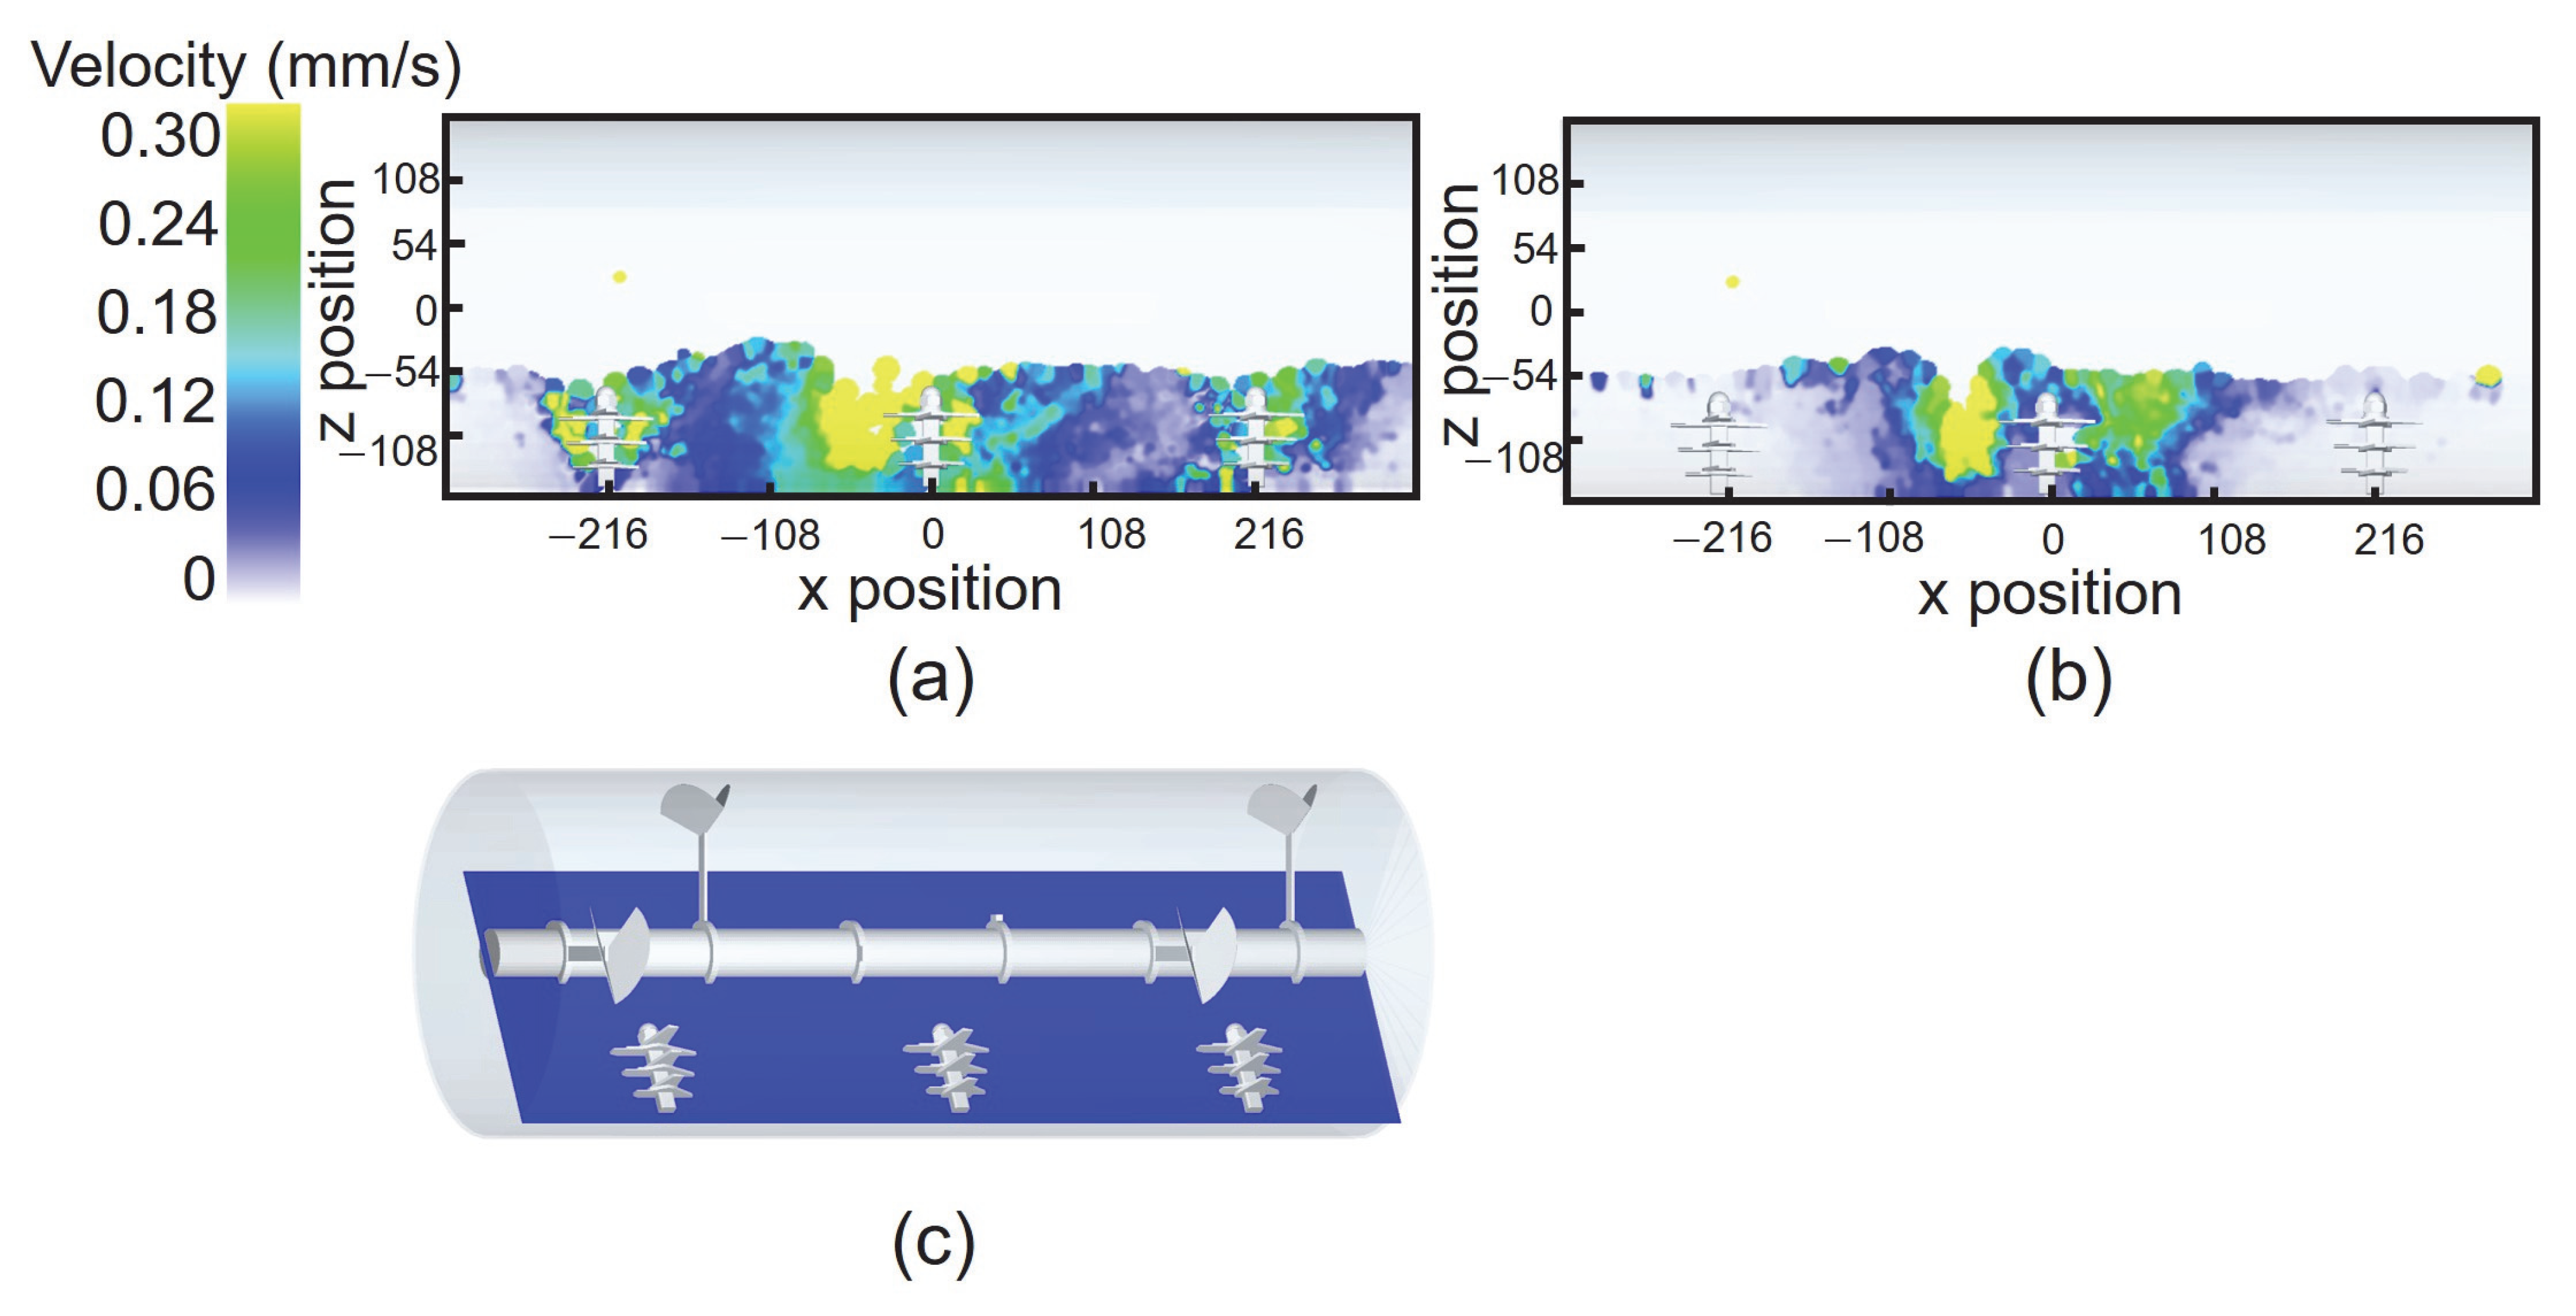
The shearing effect of choppers is a critical factor in mixing, but no previous research has systematically studied it. Many types of plowshare mixers incorporate auxiliary choppers, such as the GBM model mixer from Gericke Company (Rielasingen-Worblingen, Germany) and the LDH model mixer from Shanghai Pudong Chemical Machinery Factory Co., Ltd. (Shanghai, China). Figure 15 compares the particle distribution with choppers activated versus deactivated, where the plowshare angle is fixed at 30° for both groups to isolate the choppers’ effect. The impact of deactivating the flying knives is evident: as shown in the red box in Figure 15b, a mixing dead zone appears at the mixer’s front side, located between adjacent plowshares. Moreover, the choppers in the dead zone are buried under the particle bed (Figure 15b), whereas most choppers remain exposed outside the particle bed when activated (Figure 15a). In the red-circled area where choppers are inactive, particles accumulate densely, whereas activated choppers shear particles, imparting velocity. To investigate the dead zone, velocity contour maps of particles (C1 and P1) at 15 s are plotted, as shown in Figure 16. Comparing the chopper off and on, the yellow-highlighted area (representing particle movement) of the chopper on is larger than in the chopper off, confirming that shear forces enhanced convective and diffusive mixing. A continuum analysis is performed on a plane crossing the choppers’ position at 15 s, the Figure 17c shows the direction of continuous field analysis.. Results show that with flying knives activated (Figure 17a compared with Figure 17b), the colored area (indicating particle activity) expanded, and particles near the blade tips exhibited higher velocities. Clearly, the cutting action of choppers mobilized surrounding particles, mitigating dead zones.
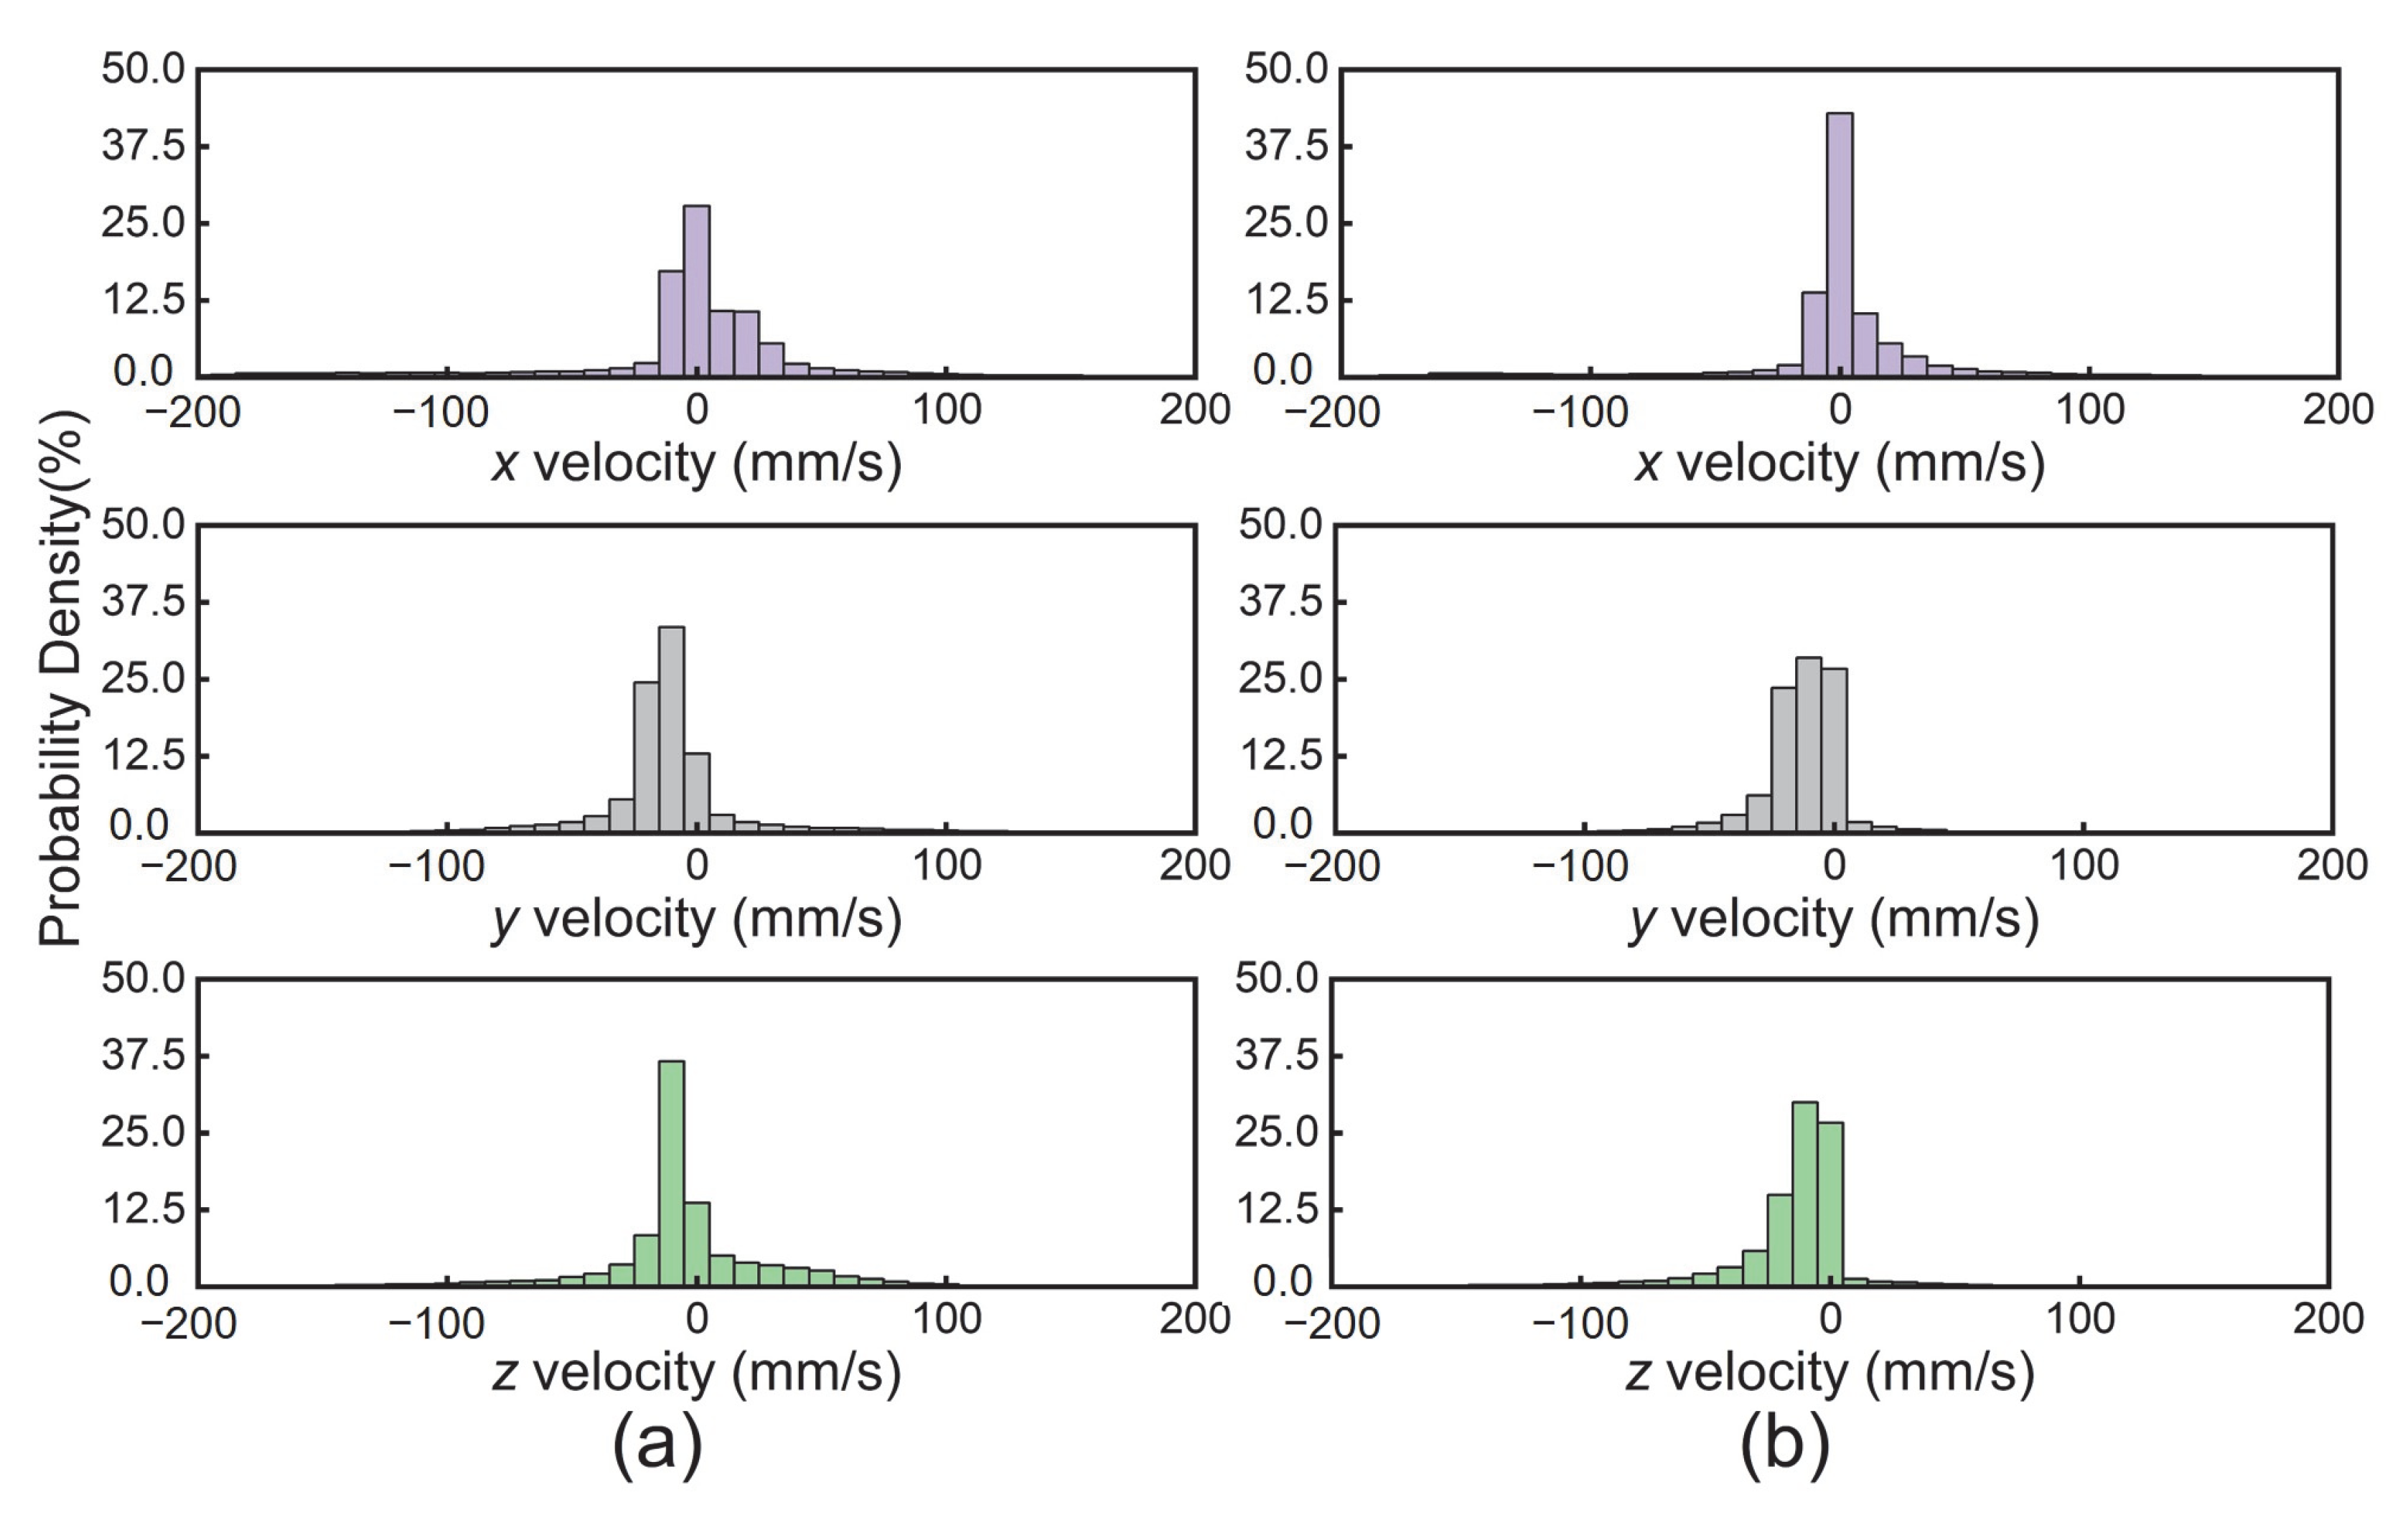
Figure 18 compares the probability density functions (PDFs) of particle velocities between the two experiments. Figure 18a (choppers activated) and Figure 18b (deactivated) reveal that more particles have zero velocity in x, y, and z directions when choppers are off, validating choppers’ role in promoting flow. Notably, the PDF peak at zero x-velocity is highest, suggesting interlayer diffusion dominates mixing. In Figure 18b, the left-skewed PDFs in the y and z directions indicate unidirectional mixing driven by plowshares alone.
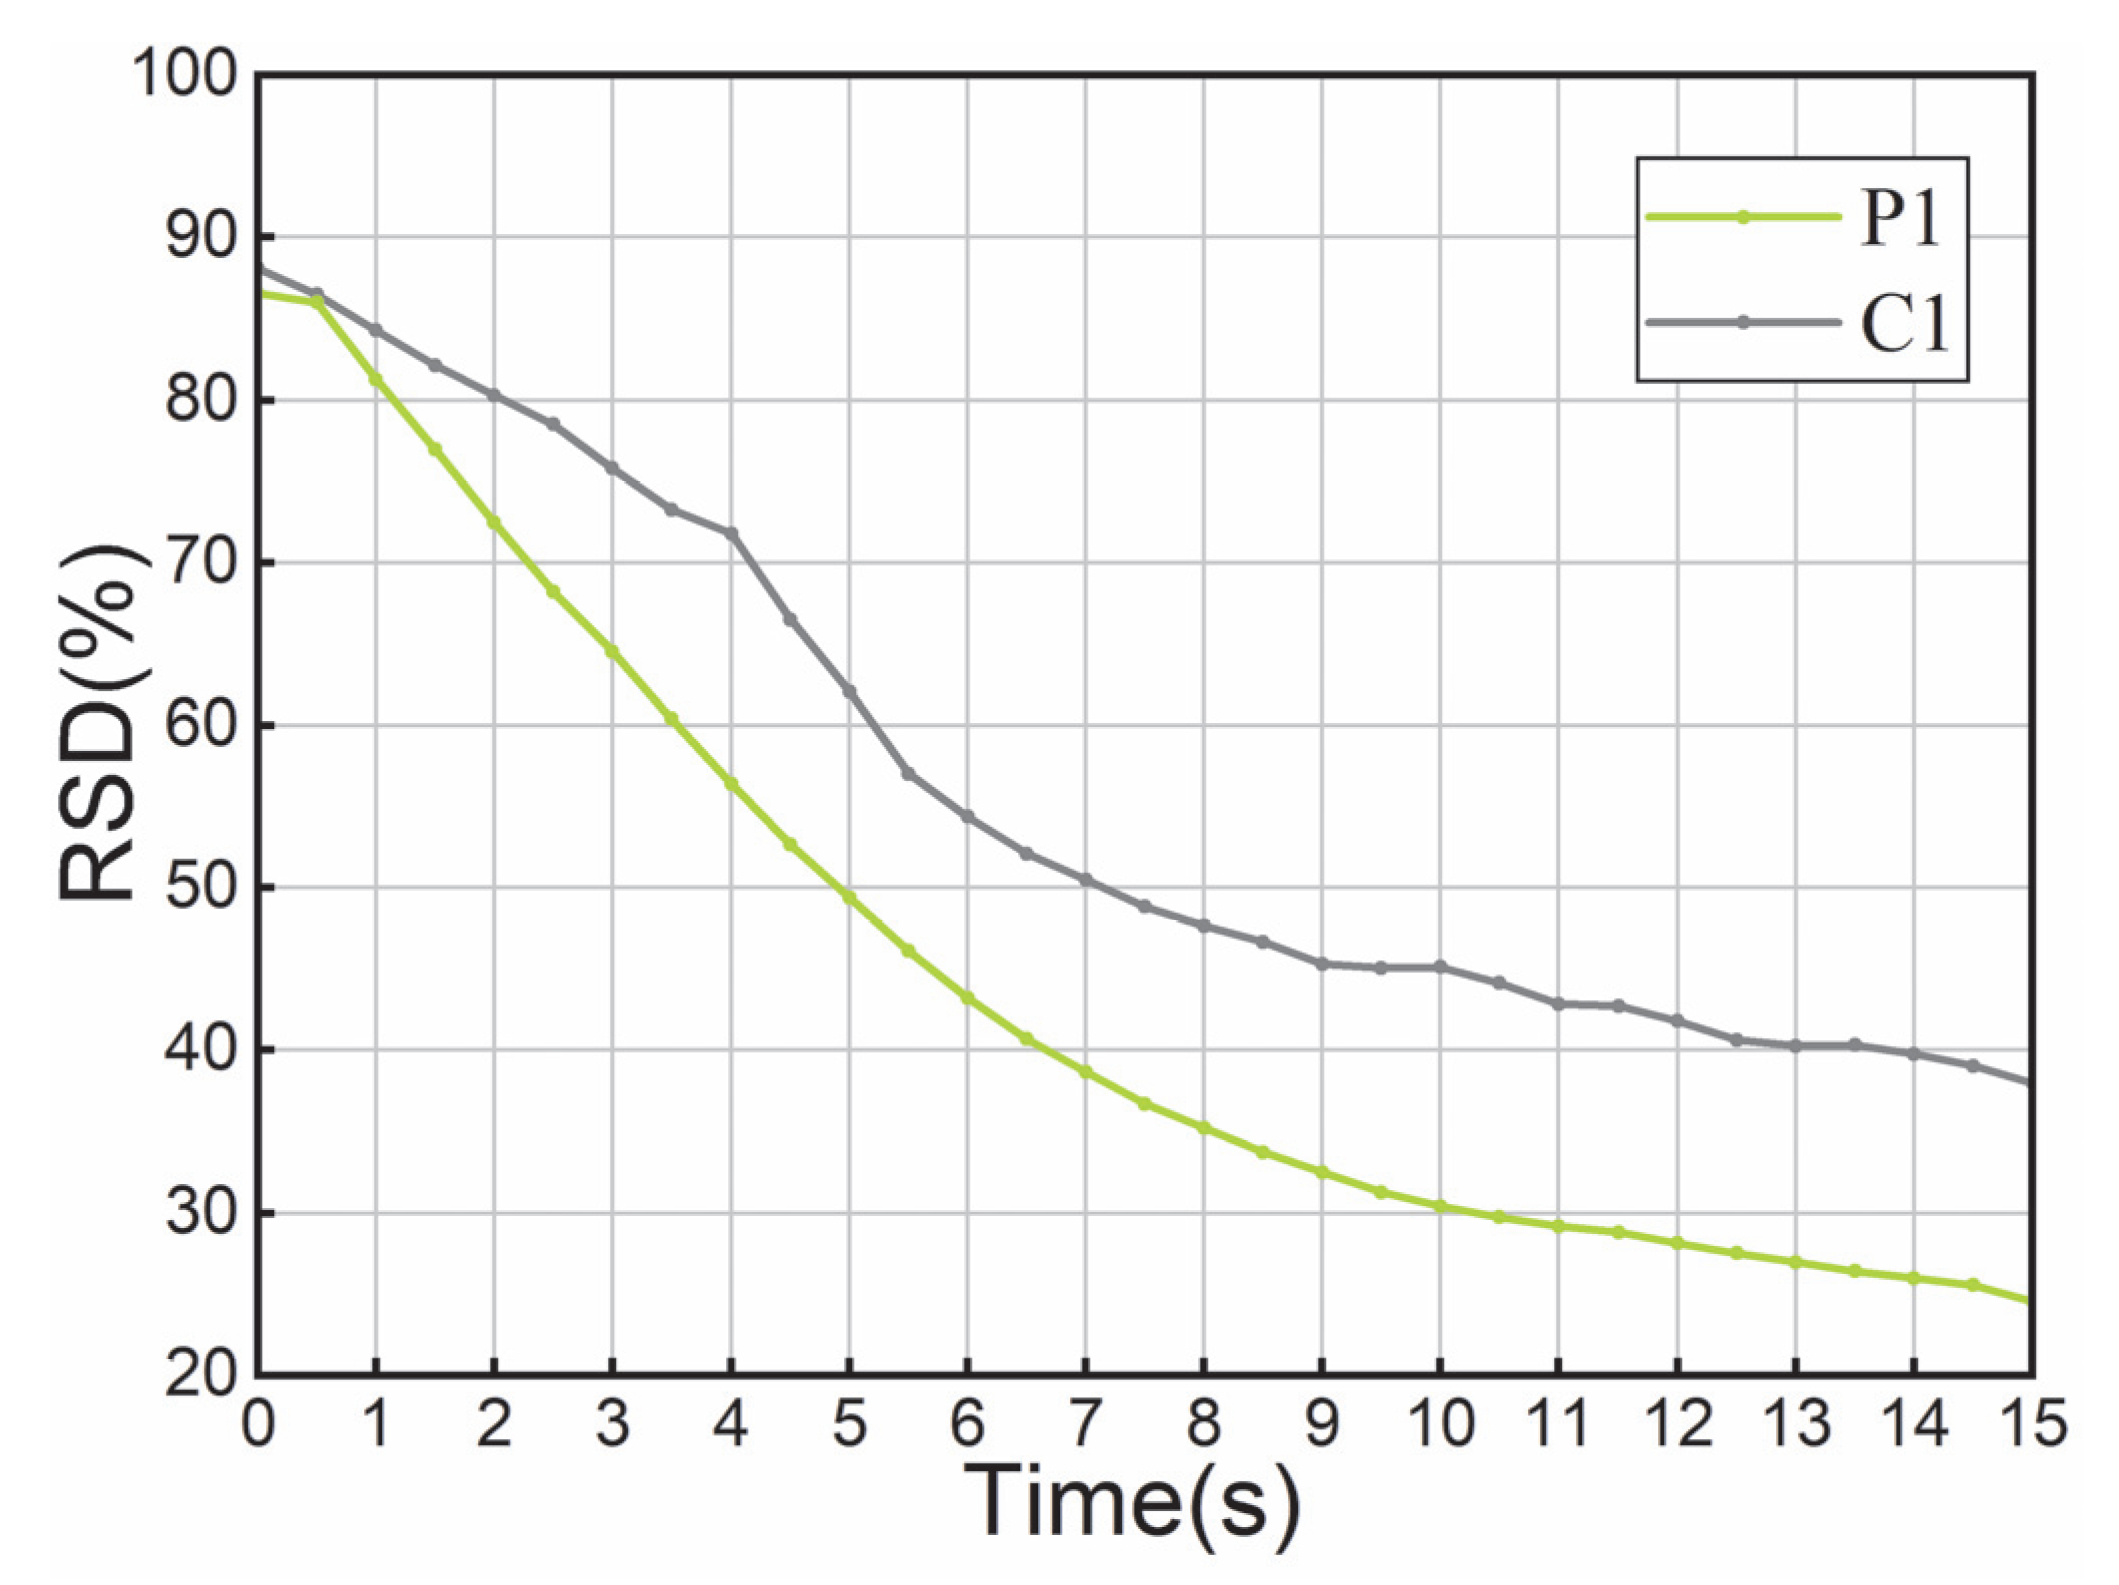
Figure 19 plots the mixing index RSD over time for chopper off and on experiments. After 15 s, the index reached 24.55% with choppers deactivated versus 38.00% activated, both stabilizing at plateaus. Thus, qualitative and quantitative analyses demonstrate that flying knives enhance interlayers and axial diffusion in dead zones.

5. Conclusions

In this study, the discrete element method (DEM), a numerical simulation approach for capturing particle motion, is employed to systematically investigate the particle shape and geometry factors on the mixing performance of a plowshare mixer. The main conclusions are as follows:
(1)
To validate the feasibility of the superquadratic equation, a classic rotating drum model is used for parameter calibration. Comparisons with previous studies, both qualitatively and quantitatively, showed good agreement in the dynamic angle of repose.
(2)
The simulation results indicate that sharper particle shapes (rounded cubes and sharp-edged cubes) exhibit poorer mixing performance, while disc-shaped particles demonstrate better mixing than cylindrical ones. This is attributed to shape-induced differences in system resistance. Additionally, sharper shapes lead to a higher number of interparticle contacts and greater compressive forces, resulting in increased energy dissipation. Combined with stable mechanical interlocking, ultimately leads to inferior mixing performance. In actual mixing, sharper particles require more operating parameters, such as rotational speed, to enhance the mixing quality.
(3)
Increasing the plowshare angle enhances interlayer convection and axial diffusion of particles, further improving mixing efficiency. Excessively small plowshare angles may fail to achieve homogeneous mixing. The results show that optimizing the plow Angle can improve the mixing efficiency.
(4)
The auxiliary shearing effect of fly knives enables high-speed flow of particles in dead zones, strengthening convection and diffusion, which overcomes mixing dead zones between plowshares. The installation of the flying knife mechanism can effectively overcome the mixing dead zone.
This study provides valuable insights for optimizing powder mixing processes, improving the efficiency of plowshare mixers, and mitigating mixing dead zones. Using dynamic AOR certainly has limitations to verify models, which need the development of new characterization and simulation methods. In addition, the effects of cohesive wet particles are a future research direction.

Author Contributions

Conceptualization, W.L. and X.L.; methodology, W.L.; software, J.Z.; validation, X.L.; formal analysis, J.Z.; investigation, X.L.; re-sources, X.L.; data curation, X.L.; writing—original draft preparation, W.L.; writing—review and editing, X.L.; visu-alization, X.L.; supervision, X.L.; project administration, Y.L.; funding acquisition, Y.L. All authors have read and agreed to the published version of the manuscript.

Funding

This research received no external funding.

Data Availability Statement

The datasets generated and/or analyzed during the current study are available from the corresponding author on reasonable request.

Conflicts of Interest

The authors declare no conflicts of interest.

References

  1. Jin, X.; Chandratilleke, G.R.; Wang, S.; Shen, Y.S. DEM investigation of mixing indices in a ribbon mixer. Particuology 2022, 60, 37–47. [Google Scholar] [CrossRef]
  2. Yang, W.J.; Neoh, K.G.; Kang, E.T.; Teo, S.L.M.; Rittschof, D. Polymer brush coatings for combating marine biofouling. Prog. Polym. Sci. 2014, 39, 1017–1042. [Google Scholar] [CrossRef]
  3. Chandratilleke, G.R.; Yu, A.B.; Bridgwater, J.; Shinohara, K. A particle-scale index in the quantification of mixing of particles. AIChE J. 2012, 58, 1099–1118. [Google Scholar] [CrossRef]
  4. Rhodes, M.J.; Wang, X.S.; Nguyen, M.; Stewart, P.; Liffman, K. Study of mixing in gas-fluidized beds using a DEM model. Chem. Eng. Sci. 2001, 56, 2859–2866. [Google Scholar] [CrossRef]
  5. Nadeem, H.; Subramaniam, S.; Nere, N.K.; Heindel, T.J. A particle scale mixing measurement method using a generalized nearest neighbor mixing index. Adv. Powder Technol. 2023, 34, 103933. [Google Scholar] [CrossRef]
  6. Fry, A.M.; Umbanhowar, P.B.; Ottino, J.M.; Lueptow, R.M. Diffusion, mixing, and segregation in confined granular flows. AIChE J. 2019, 65, 875–881. [Google Scholar] [CrossRef]
  7. Deng, X.L.; Zheng, K.; Davé, R.N. Discrete element method based analysis of mixing and collision dynamics in adhesive mixing process. Chem. Eng. Sci. 2018, 190, 220–231. [Google Scholar] [CrossRef]
  8. Fan, H.J.; Guo, D.C.; Dong, J.C.; Cui, X.; Zhang, M.C.; Zhang, Z.X. Discrete element method simulation of the mixing process of particles with and without cohesive interparticle forces in a fluidized bed. Powder Technol. 2018, 327, 223–231. [Google Scholar] [CrossRef]
  9. Escotet-Espinoza, M.S.; Foster, C.J.; Ierapetritou, M. Discrete Element Modeling (DEM) for mixing of cohesive solids in rotating cylinders. Powder Technol. 2018, 335, 124–136. [Google Scholar] [CrossRef]
  10. Cundall, P.A.; Strack, O.D.L. A discrete numerical model for granular assemblies. Géotechnique 1979, 29, 47–65. [Google Scholar] [CrossRef]
  11. Wang, S.Q.; Liang, D.F.; Ji, S.Y. DEM study on mixing behaviors of concave-shaped particles in rotating drum based on level-set method. Powder Technol. 2023, 430, 118961. [Google Scholar] [CrossRef]
  12. You, Y.; Zhao, Y.Z. Discrete element modelling of ellipsoidal particles using super-ellipsoids and multi-spheres: A comparative study. Powder Technol. 2018, 331, 179–191. [Google Scholar] [CrossRef]
  13. Bao, Y.Y.; Li, T.C.; Wang, D.F.; Cai, Z.Q.; Gao, Z.M. Discrete element method study of effects of the impeller configuration and operating conditions on particle mixing in a cylindrical mixer. Particuology 2020, 49, 146–158. [Google Scholar] [CrossRef]
  14. Basinskas, G.; Sakai, M. Numerical study of the mixing efficiency of a ribbon mixer using the discrete element method. Powder Technol. 2016, 287, 380–394. [Google Scholar] [CrossRef]
  15. Hu, Z.; Liu, X.Y. A novel Markov chain method for predicting granular mixing process in rotary drums under different rotation speeds. Powder Technol. 2021, 386, 40–50. [Google Scholar] [CrossRef]
  16. Gui, N.; Yan, J.; Xu, W.K.; Ge, L.; Wu, D.L.; Ji, Z.L.; Gao, J.S.; Jiang, S.Y.; Yang, X.T. DEM simulation and analysis of particle mixing and heat conduction in a rotating drum. Chem. Eng. Sci. 2013, 97, 225–234. [Google Scholar] [CrossRef]
  17. Ma, H.Q.; Zhao, Y.Z. Modelling of the flow of ellipsoidal particles in a horizontal rotating drum based on DEM simulation. Chem. Eng. Sci. 2017, 172, 636–651. [Google Scholar] [CrossRef]
  18. Cleary, P.W. Large scale industrial DEM modelling. Eng. Comput. 2004, 21, 169–204. [Google Scholar] [CrossRef]
  19. Lin, J.M.; Bao, M.; Zhang, F.; Yang, J.H.; Li, H.Z. Mixing simulation of cohesive particles in a soil mixer. Powder Technol. 2022, 399, 117218. [Google Scholar] [CrossRef]
  20. Hoorijani, H.; Esgandari, B.; Zarghami, R.; Sotudeh-Gharebagh, R.; Mostoufi, N. Predictive modeling of mixing time for super-ellipsoid particles in a four-bladed mixer: A DEM-based approach. Powder Technol. 2023, 430, 119009. [Google Scholar] [CrossRef]
  21. Alian, M.; Ein-Mozaffari, F.; Upreti, S.R. Analysis of the mixing of solid particles in a plowshare mixer via discrete element method (DEM). Powder Technol. 2015, 274, 77–87. [Google Scholar] [CrossRef]
  22. Emmerink, J.; Hadi, A.; Jovanova, J.; Cleven, C.; Schott, D.L. Parametric Analysis of a Double Shaft, Batch-Type Paddle Mixer Using the Discrete Element Method (DEM). Processes 2023, 11, 738. [Google Scholar] [CrossRef]
  23. Jin, X.; Wang, S.; Shen, Y.S. DEM study of the effect of impeller design on mixing performance in a U-shape ribbon mixer. Adv. Powder Technol. 2022, 33, 103334. [Google Scholar] [CrossRef]
  24. Zhao, S.W.; Zhao, J.D. A poly-superquadratic-based approach on particle morphology for DEM modeling of granular media. Int. J. Numer. Anal. Met. 2019, 43, 2147–2169. [Google Scholar] [CrossRef]
  25. Wu, K.; Sun, W.C.; Liu, S.Y.; Cai, G.J. Influence of particle shape on the shear behavior of superquadratics by discrete element method in 3D. Adv. Powder Technol. 2021, 32, 4017–4029. [Google Scholar] [CrossRef]
  26. Laurent, B.F.C.; Bridgwater, J. Performance of single and six-bladed powder mixers. Chem. Eng. Sci. 2002, 57, 1695–1709. [Google Scholar] [CrossRef]
  27. Jones, J.R.; Parker, D.J.; Bridgwater, J. Axial mixing in a ploughshare mixer. Powder Technol. 2007, 178, 73–86. [Google Scholar] [CrossRef]
  28. Cleary, P.W. Particulate mixing in a plough share mixer using DEM with realistic shaped particles. Powder Technol. 2013, 248, 103–120. [Google Scholar] [CrossRef]
  29. Domian, E.; Cenkier, J. Flowability and Homogeneity of Food Powders with Plated Oil Ingredient. J. Food Process Eng. 2013, 36, 626–633. [Google Scholar] [CrossRef]
  30. Laurent, B.F.C. Scaling factors in granular flow—Analysis of experimental and simulations results. Chem. Eng. Sci. 2006, 61, 4138–4146. [Google Scholar] [CrossRef]
  31. Forrest, S.; Bridgwater, J.; Mort, P.R.; Litster, J.; Parker, D.J. Flow patterns in granulating systems. Powder Technol. 2003, 130, 91–96. [Google Scholar] [CrossRef]
  32. Fang, Z.Q.; Peng, S.L.; Yi, J.G.; Du, J. Structure optimization of plough blades in a ploughshare mixer using the DEM simulations. Eng. Comput. 2020, 37, 3455–3475. [Google Scholar] [CrossRef]
  33. Patil, A.V.; Hofsteenge, J.; Bujalski, J.M.; Johansen, S.T. DPM model segregation validation and scaling effect in a rotary drum. Comput. Part. Mech. 2022, 9, 693–707. [Google Scholar] [CrossRef]
  34. Wu, W.C.; Chen, K.C.; Tsotsas, E. Prediction of particle mixing in rotary drums by a DEM data-driven PSO-SVR model. Powder Technol. 2024, 434, 119365. [Google Scholar] [CrossRef]
  35. Lange, A.; Meitzner, C.; Specht, E.; Kruggel-Emden, H. Exploring transverse particle motion in rotary drums: DEM analysis of the influence of cross-shaped internals on material transport. Powder Technol. 2024, 443, 119907. [Google Scholar] [CrossRef]
  36. Jadidi, B.; Ebrahimi, M.; Ein-Mozaffari, F.; Lohi, A. Investigation of impacts of particle shape on mixing in a twin paddle blender using GPU-based DEM and experiments. Powder Technol. 2023, 417, 118259. [Google Scholar] [CrossRef]
  37. Jadidi, B.; Ebrahimi, M.; Ein-Mozaffari, F.; Lohi, A. A comprehensive review of the application of DEM in the investigation of batch solid mixers. Rev. Chem. Eng. 2023, 39, 729–764. [Google Scholar] [CrossRef]
  38. Jadidi, B.; Ebrahimi, M.; Ein-Mozaffari, F.; Lohi, A. Mixing performance analysis of non-cohesive particles in a double paddle blender using DEM and experiments. Powder Technol. 2022, 397, 117122. [Google Scholar] [CrossRef]
  39. Shi, Q.; Sakai, M. Recent progress on the discrete element method simulations for powder transport systems: A review. Adv. Powder Technol. 2022, 33, 103664. [Google Scholar] [CrossRef]
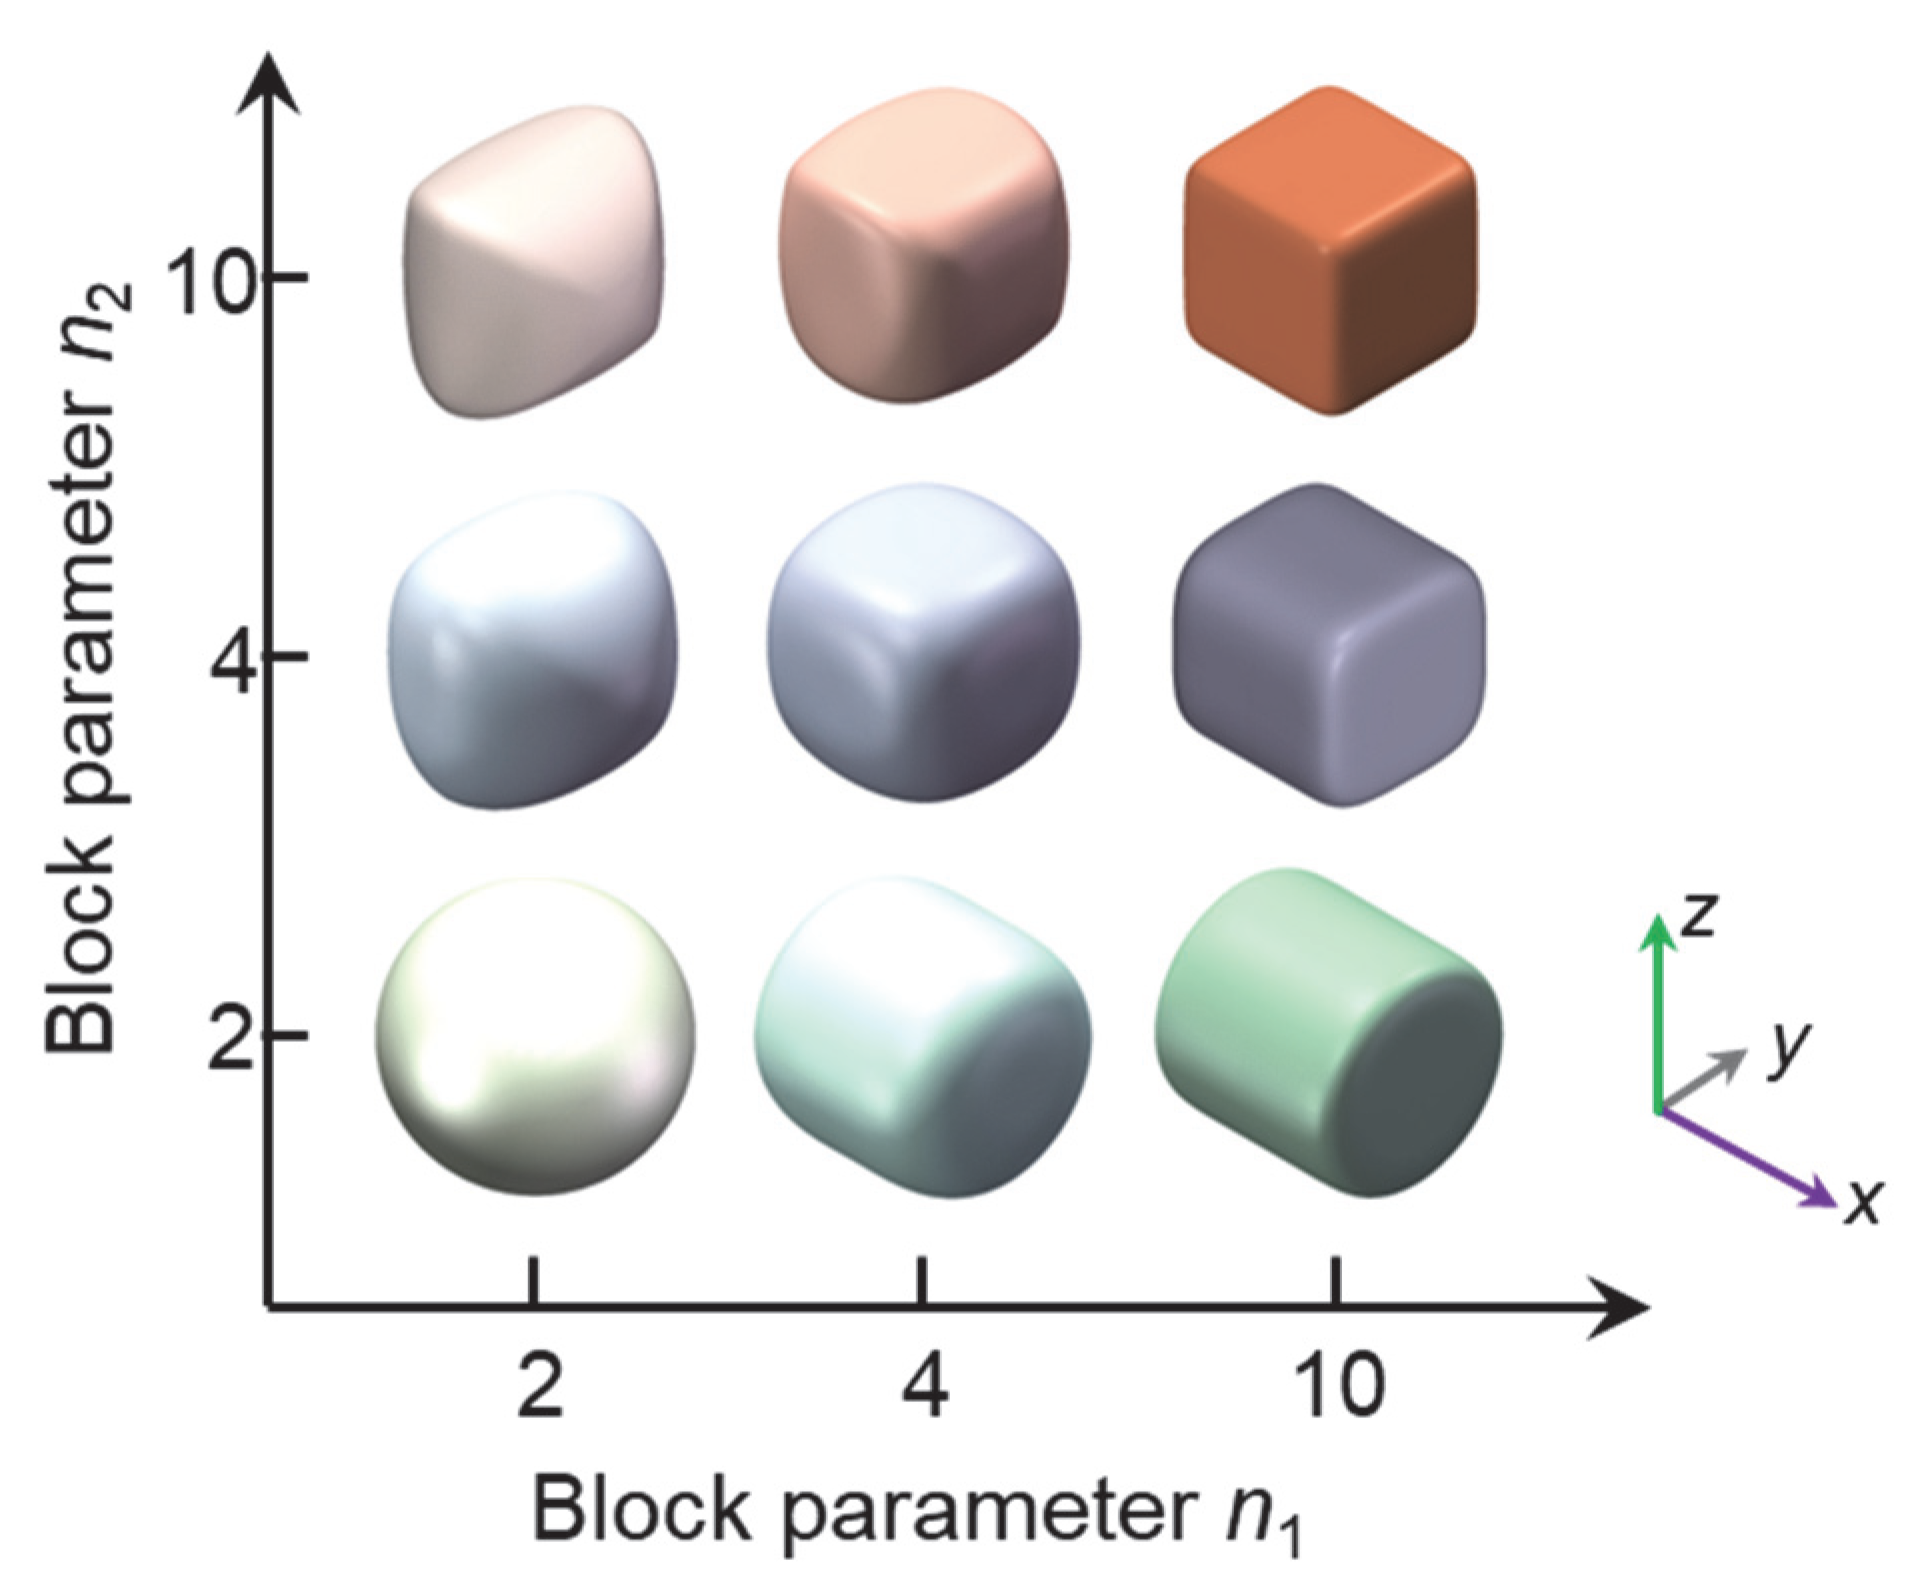
Figure 1. The shapes of the superquadratic particle.
Modelling 06 00111 g001
Figure 2. Schematic of plowshare mixer with chopper.
Modelling 06 00111 g002
Figure 3. Schematic diagram of a rotating drum simulated using superquadric cubic particles.
Modelling 06 00111 g003
Figure 4. Simulation schematics of different plow angles with white and red particles (a) 20°, (b) 30°, (c) 40°.
Modelling 06 00111 g004
Figure 5. Comparison of the time-varying AOR with the results from Ref. [36].
Modelling 06 00111 g005
Figure 6. Snapshot of numerical simulation results for different particle shapes. (ai) P1–P9.
Modelling 06 00111 g006
Figure 7. Time variation in mixing index for different particle shapes.
Modelling 06 00111 g007
Figure 8. Comparison of average kinetic energy of particles: (a) P1–P3, (b) P4–P6, (c) P7–P9.
Modelling 06 00111 g008
Figure 9. Interparticle contact parameters: (a) average compressive force, (b) average contact number.
Modelling 06 00111 g009
Figure 10. Snapshot of numerical simulation results for different plow angles. (a) 20°, (b) 30°, (c) 40°.
Modelling 06 00111 g010
Figure 11. Vector plot of particle velocity distribution influenced by plow angles at t = 15 s.
Modelling 06 00111 g011
Figure 12. Continuum analysis for the (a) G1 simulation, (b) P1 simulation, (c) G2 simulation, and (d) contour plane position.
Modelling 06 00111 g012
Figure 13. The probability density distributions of the x, y, and z-axis velocity components at t = 15 s for the (a) 20° plow angle, (b) 30° plow angle, (c) 40° plow angle, and (d) x, y, and z-axis of the mixer.
Modelling 06 00111 g013
Figure 14. Mixing index versus time at different plow angles.
Modelling 06 00111 g014
Figure 15. Snapshot of numerical simulation results for chopper influence. (a) on, (b) off.
Modelling 06 00111 g015
Figure 16. Vector plot of particle velocity distribution influenced by the chopper (red circle for choppers) at t = 15 s.
Modelling 06 00111 g016
Figure 17. Continuum analysis for the (a) P1 simulation, (b) C1 simulation, (c) direction of continuous field.
Modelling 06 00111 g017
Figure 18. The probability density distributions of the x, y, and z-axis velocity components at t = 15 s for the (a) chopper on, (b) chopper off.
Modelling 06 00111 g018
Figure 19. Time variation in mixing index with chopper on/off.
Modelling 06 00111 g019
Table 1. Particle and geometry properties of simulation group.
SimulationParticleGeometry
Shapen1n2a/cb/cPlow Angle (°)Chopper Motion
P1Modelling 06 00111 i001221130ON
P2Modelling 06 00111 i002421130ON
P3Modelling 06 00111 i003241130ON
P4Modelling 06 00111 i004441130ON
P5Modelling 06 00111 i0051021130ON
P6Modelling 06 00111 i0062101130ON
P7Modelling 06 00111 i0071041130ON
P8Modelling 06 00111 i0084101130ON
P9Modelling 06 00111 i00910101130ON
G1Modelling 06 00111 i010221120ON
G2Modelling 06 00111 i011221140ON
C1Modelling 06 00111 i012221130OFF
Table 2. Comparison with experimental and simulation results from Ref. [36].
Time (s)5101520
Results in Ref. [36]Modelling 06 00111 i013Modelling 06 00111 i014Modelling 06 00111 i015Modelling 06 00111 i016
Simulation in this paperModelling 06 00111 i017Modelling 06 00111 i018Modelling 06 00111 i019Modelling 06 00111 i020
Table 3. Comparison with results from Ref. [36]: Two rotational speeds at 10 s.
40 RPM Dynamic Angle
of Repose (°)
70 RPMDynamic Angle
of Repose (°)
Results in Ref. [36]Modelling 06 00111 i02147Modelling 06 00111 i02250
4851
Simulation in this paperModelling 06 00111 i02348.54Modelling 06 00111 i02452.53
Table 4. Diffusivity coefficient for different particle shapes.
ShapeShape Index n1Shape Index n2Diffusion Coefficient
DxxDyyDzz
Modelling 06 00111 i025222.35 × 10−42.83 × 10−45.45 × 10−5
Modelling 06 00111 i026421.69 × 10−41.86 × 10−43.92 × 10−5
Modelling 06 00111 i027241.79 × 10−41.89 × 10−44.20 × 10−5
Modelling 06 00111 i028441.48 × 10−41.50 × 10−42.81 × 10−5
Modelling 06 00111 i0291021.59 × 10−41.49 × 10−42.80 × 10−5
Modelling 06 00111 i0302101.80 × 10−41.92 × 10−44.45 × 10−5
Modelling 06 00111 i0311041.45 × 10−41.03 × 10−41.27 × 10−5
Modelling 06 00111 i0324101.45 × 10−41.37 × 10−42.43 × 10−5
Modelling 06 00111 i03310101.54 × 10−48.38 × 10−55.06 × 10−6
Table 5. Differences caused by particle shapes.
Particle TypesParticle Voidage Φ
P149.05%
P239.12%
P338.36%
P437.07%
P538.32%
P639.12%
P736.68%
P837.08%
P939.56%
Disclaimer/Publisher’s Note: The statements, opinions and data contained in all publications are solely those of the individual author(s) and contributor(s) and not of MDPI and/or the editor(s). MDPI and/or the editor(s) disclaim responsibility for any injury to people or property resulting from any ideas, methods, instructions or products referred to in the content.