Article

Numerical Evaluation of Hydroformed Tubular Adhesive Joints under Tensile Loads

by
André Lima Faria
1,* and
Raul Duarte Salgueiral Gomes Campilho
1,2,*
1
CIDEM, ISEP—School of Engineering, Polytechnic of Porto, R. Dr. António Bernardino de Almeida, 431, 4200-072 Porto, Portugal
2
INEGI—Pólo FEUP, Rua Dr. Roberto Frias, 400, 4200-465 Porto, Portugal
*
Authors to whom correspondence should be addressed.
Modelling 2024, 5(3), 990-1008; https://doi.org/10.3390/modelling5030052
Submission received: 24 July 2024 / Revised: 12 August 2024 / Accepted: 18 August 2024 / Published: 22 August 2024

Abstract

:
Adhesive joints are widespread in the aerospace, aeronautics, and automotive industries. When compared to conventional mechanical joints, adhesive joints involve a smaller number of components, reduce the final weight of the structure, enable joining dissimilar materials, and resist the applied loadings with a more uniform stress state distribution compared to conventional joining methods. Hydroformed tubular adhesive joints are a suitable solution to join tubes with identical cross-sections, i.e., tubes with the same dimensions, although this solution is seldom addressed in the literature regarding implementation feasibility. This work aims to numerically analyze, by cohesive zone modelling (CZM), hydroformed tubular adhesive joints between aluminum adherends subjected to tensile loads, considering the variation of material parameters (type of adhesive) and geometrical parameters. Initially, a validation of the proposed CZM approach is carried out against experimental data. Next, the aim is to numerically evaluate the tensile characteristics of the joints, measured by the maximum load (Pm) and energy of rupture (ER), considering the main geometrical parameters (outer tube diameter of the non-hydroformed adherend or dENHA, overlap length or LO, tube thickness or tAd, and joggle angle or q). CZM validation was successfully performed. The numerical study determined that the optimal geometry uses the adhesive Araldite® AV138, higher dENHA and LO highly benefit the joint behavior, tAd has a moderate effect, and q has negligible influence on the results.

1. Introduction

Adhesive joints are widespread in the aerospace, aeronautics, maritime, and automotive industries [1,2]. Adhesive joints involve technologies, sciences, and research areas such as physics, chemistry, and mechanics. Adhesive bonds have a wide range of applications and have been used for centuries. However, they have only evolved significantly in recent decades [3]. This type of bond allows for a more uniform distribution of stresses over the total bonded area, a reduction in the concentration of stresses, better resistance to bond fatigue, a high capacity for damping vibrations, sealing of bonds and acoustic insulation, and allows for a reduction in the weight of the structure. Oppositely, adhesive joints have poor resistance to crack propagation, pull-out and cleavage stresses, weakness when exposed continuously to high temperatures, a limited lifespan, and the need for environmental and public health precautions due to the toxicity of some adhesives [4]. Tubular joints, either bonded by adhesives or other methods, find industrial application in the structural, automotive, aerospace, and piping industries, for instance [5]. Different methods of manufacturing tubular joints are available in the literature, including welding techniques, metal sheet forming, and adhesive joining. To assemble distinct frame structures from tubular joints, welding is usually incorporated as a joining method to provide a permanent connection between different members. Stainless steels usually ensure good weldability, although in dynamically loaded structures, such as mobile and transport equipment, the fatigue resistance capacity of welded joints is a major factor to be considered in project design and analysis. Particular attention must be given to the fatigue properties of welded tubular joints in the case of high-strength steels, because of the increased stress levels, while fatigue resistance is generally similar for soft and high-strength steels in the as-welded (AW) state [6,7]. A crucial aspect of manufacturing is to ensure adequate conditions (air space and process techniques) to obtain high-quality welds with full penetration [8]. Sheet metal forming is widely implemented in industry. Generally, the use of patchwork blanks enables the production of a more uniform thickness of formed parts. In such cases, distortions and localised metallurgical modifications can negatively affect the mechanical performance. In addition, it is not possible to weld very thin parts. In this way, thinner patches can be used, which eliminates the problems caused by the welding process. Experimental tests have shown the potential of using adhesives in forming processes to influence thickness distribution [9]. The choice of tubular adhesive joints can be based on the impossibility of welding the components, such as in the case of very thin sheets/adherends, the need to reduce the final weight of the structure, the ability to withstand demanding requests and loads, and the homogeneity of the distribution of the stress field, since the load transfer is carried out through substantially larger areas, which avoids the concentration of singular stresses resulting from the drilling of the adherends to fix the screws [10,11].
The industrial affirmation of adhesive joints has only been possible due to the development of predicting methodologies that allow validating their use. As a result, it is possible to minimize costs and speed up the manufacturing process [12]. Overall, two different methodologies can be used to analyze adhesive joints, namely closed-form analysis (analytical) and numerical methods. Analytical studies date back to the 1930s with the Volkersen model [13]. These formulations become complex when the adhesive deforms plastically, when adhesives based on composite materials are used, and when dissimilar materials are joined. The finite element method (FEM) [14] is the most widely used technique for analyzing adhesive joints and was first applied by Harris and Adams [15]. FEM can be combined with the assumptions of fracture mechanics to predict strength, either through the stress intensity factor or through energetic approaches such as the Virtual Crack Closure Technique (VCCT). If a crack propagates, it is necessary to re-mesh the model, which increases the computational effort [16]. Numerical modelling has undergone great development and includes, among other methods, CZM modelling [17]. This technique applies conventional FEM modelling to regions where fracture mechanics does not predict damage and uses cohesive elements to promote crack propagation. The eXtended Finite Element Method (XFEM) finds application in modelling crack growth and uses enriched shape functions to represent a continuous displacement (δ) field. Different works were recently published on the application of these various techniques: Stein, et al. [18] and Razavi, et al. [19] for analytical modelling, Dionísio, et al. [20] for fracture mechanics, Zhang, et al. [21] for damage mechanics, Huang, et al. [22] and Sun, et al. [23] for CZM modelling, and Ahmad, et al. [24] and Ma, et al. [25] for XFEM modelling, which carefully evaluate the potential and limitations of each method.
Some studies have been relevant to the evolution and improvement of tubular adhesive joints. Kwon and Lee [26] assessed the influence of surface roughness on the strength of tubular adhesive joints by analyzing the stiffness of an interfacial layer between the adherend and adhesive, according to a normal statistical distribution of the surface roughness of the adherends. The authors concluded that the ideal surface roughness depended on the load applied and the thickness of the adhesive bond. Albiez, et al. [27] experimentally studied the influence of geometric parameters on the strength of pre-treated tubular steel joints using polyurethane and epoxy adhesives. The authors concluded that the analyzed adhesives gave different Pm values. Pm increased with LO, although not proportionally. The influence of the adhesive thickness (tA) was also assessed, and the experimental results revealed that increasing tA negatively affects Pm. Nguyen and Kedward [28] proposed an analytical model to determine the stress distribution field in a tubular adhesive joint with aluminum adherends. The model was validated by FEM after positive agreement between the two analyses. Tubular joints with adherends having a 10° chamfer showed advantages when compared to tubular joints without chamfers, since the stress fields are more uniform and the magnitude of stresses is lower. Lavalette, et al. [11] carried out a study to assess the influence of geometric parameters, such as LO, internal and external diameter of aluminum, and carbon fiber reinforced polymer (CFRP) adherends, on an adhesive tubular joint subjected to tensile stress. Experimental tests and numerical simulations (CZM) were carried out. The numerical results showed consistency and agreement with the experimental data. The joint strength increased with LO and the internal diameter, and tA and the chamfer length highly affected shear stress distributions. Esmaeel and Taheri [29] assessed delamination in the adherends of a hybrid tubular adhesive joint subjected to torsional stresses and determined its influence on the adhesive layer stresses. Two sets of materials were used, a glass/epoxy composite and a graphite/epoxy composite. Using FEM, a comprehensive parametric analysis was carried out on the effect of geometric parameters on peel and shear stresses. The location and length of the delamination, the mechanical properties of the composite material and the orientation of the adherend fibers were the tested effects. The trend in the stress distributions were comparable between the two systems, even though the magnitude of the installed stresses was significantly different. The experimental and numerical study carried out by Hosseinzadeh, et al. [30] aimed to characterize, in a simplified way, the performance of tubular metal joints bonded by a structural adhesive when subjected to torsional stresses for different LO. The limit corresponding to the failure of the adhesive, for different LO, was characterized by the Ramberg–Osgood plasticity model, which was adjusted by comparison with the FEM simulation results by applying a limited number of known parameters. These data show that the mechanical strength of the adhesive joint is highly dependent on the deformation energy absorbed. Oh [31] published a numerical study of tubular adhesive joints with composite adherends subjected to torsion, combining thermal and mechanical analyses. Three failure modes were considered, namely adhesive failure, cohesive failure in the adhesive, and cohesive failure in the adherend. The results were compared with the data available by Choi and Lee [32] and it was concluded that, for low stacking angles, the failure is cohesive in the adhesive or in the adherend, while for high stacking angles the failure is adhesive at the interface between adhesive and adherend due to residual thermal stresses.
The hydroforming of tubular adherends, or Tubular Hydroforming (THF), which is seldom studied in the literature, is widespread in the automotive industry, particularly in the process of manufacturing tubular adherends with external rebound or joggled geometry [33]. Today, the THF technique is widely used in the automotive, aeronautical, aerospace, and sanitary industries, among others. Within the automotive industry, this technique is applied to exhaust system components (most of which are made of stainless steel), transmission and propulsion components, and dashboards, among others [34]. The process guarantees the consolidation of the final part, an increase in strength and torsional stiffness, a reduction in the final weight of the joint, and even greater efficiency than similar processes, since it guarantees a better surface finish, with an unequivocal reduction in finishing operations [35,36]. This method involves less investment on the part of companies to obtain complex geometries, includes a smaller number of components, and does not require secondary finishing operations. THF also has some disadvantages compared to conventional bonding processes, largely because it is emerging and is constantly being developed. In the case of mass production, this process can become more time-consuming when compared to others, implying a high investment. There is still little literature associated with the design of ideal tools for carrying out the work. These factors justify careful design and planning for implementation in the industry, involving the use of numerical analysis models that assure the reliability of the obtained results, such as, for example, CZM analysis. Faria and Campilho [37] used CZM to evaluate the possible advantage of applying bi-adhesive techniques in hydroformed tubular adhesive joints between composite (carbon-epoxy) adherends. The evaluation was based on Pm and δ at Pm. Depending on the bi-adhesive conditions, namely a 50% ratio between ductile adhesive at the overlap edges and brittle adhesive at the middle, advantages were found over single-adhesive joints.
This work aims to numerically analyze, by CZM, hydroformed tubular adhesive joints between aluminum adherends subjected to tensile loads, considering the variation of material parameters (type of adhesive) and geometrical parameters. Initially, a validation of the proposed CZM approach is carried out against experimental data. Next, the aim is to numerically evaluate the tensile characteristics of the joints, measured by Pm and ER, considering the main geometrical parameters (dENHA, LO, tAd, and q).

2. Materials and Methods

2.1. Materials

The adherends that make up the tubular joint joints are made from the AW6082-T651 aluminum alloy. This aluminum alloy is particularly suitable for the tubular geometry proposals studied in this work because of its mechanical properties and plastic conformability, and because it is widely used in the structural applications market in rolled or extruded form. Obtaining this metal alloy involves heat treatment at 180°, known as artificial ageing. Table 1 illustrates the mechanical properties estimated from experimental tests carried out in accordance with the ASTM-E8M-04 standard. Figure 1 shows the engineering stress–tensile strain curves (σ-ε) obtained for the aluminum adherends as well as the numerical approximation applied to the CZM simulations [38].
Three adhesives used to predict the strength and tensile behavior of the tubular adhesive joints. The choice of adhesives covers a wider range of characteristics, including ductile and brittle adhesives, which allows the study to have a broader scope and a more detailed analysis of the results. In view of this purpose, the Araldite® AV138 (epoxy-based and brittle), the Araldite® 2015 (epoxy-based and with some ductility), and the Sikaforce® 7752 (polyurethane-based and ductile, although less strong), were chosen for the analysis. These adhesives were experimentally tested by different setups, leading to the data in Table 2 [39,40,41], which represent, by excess, the mechanical and fracture properties that serve as inputs in the CZM simulations.
The tensile mechanical properties (E, σe, σf, and εf) were taken from bulk testing of dogbone-shaped specimens. The shear mechanical properties (shear modulus or G, shear yield stress or τe, shear strength or τf, and shear failure strain or γf) resulted from Thick Adherend Shear Tests (TASTs) in specimens with steel adherends. σe and τe were estimated by the intersection between the respective stress–strain curves and a parallel line with an offset of 0.2%. Dedicated fracture tests were also executed to obtain the mode I tensile fracture toughness or GIC (by the Double-Cantilever Beam or DCB test) and the mode II shear fracture toughness or GIIC (by the End-Notched Flexure or ENF test).

2.2. Joint Geometries

The base geometry proposed for the hydroformed tubular joint is illustrated in Figure 2. This geometry consists of an overlap tubular adhesive joint with an external joggle, with AW6082-T651 aluminum alloy adherends. The geometric parameters that completely define the base joint geometry consist of LO, dEANH, tAd, and θ. Different configurations of tubular adhesive joints were analyzed according to these geometric parameters, with the following variations: LO = 5, 10, 15, and 20 mm; dEANH = 5, 10, 15, and 20 mm; tAd = 1, 2, 3, and 4 mm; and θ = 0, 15, 30, 45, and 60°. The base parameters of the joints, used when varying specific parameters, were LO = 10 mm; dEANH = 20 mm; tAd = 2 mm; and θ = 45°. It should be noted that only one geometric parameter was altered per analysis, and in none of the cases was the effect of varying more than one geometric factor reconciled.
The other parameters in Figure 2 are as follows: adhesive thickness tA = 0.2 mm; total length of the tubular adhesive joint (LT) = 80 mm; inner joggle radius (RIR) = 1 mm; and outer joggle radius (RER) = 3 mm. The length of hydroformed adherend (LAH); inner diameter of non-hydroformed adherend (dIANH); outer diameter of hydroformed adherend (dEAH); and inner diameter of hydroformed adherend (dIAH) are dependent on the quantified variables.

2.3. Numerical Modelling

The static numerical analysis, based on FEM, was carried out on Abaqus® considering geometrical non-linearities. In view of the different available design techniques, and respective particularities described in the Section 1, the CZM technique with triangular law was selected due to showing the best balance between accuracy, availability in commercial software, and design computational effort in modelling the static fracture process of adhesive joints [42,43]. Actually, the cohesive laws used in predefined fracture paths in the models take advantage of mixed-mode stress criteria to determine the onset of damage propagation as well as energetic failure criteria for damage propagation. CZM excels in mesh-independent strength predictions, since crack growth is triggered by an energy criterion calculated over an area rather than stress-based concepts [44]. Parameter calibration tools are also widespread with standardized tests that facilitate their application in industry [45].
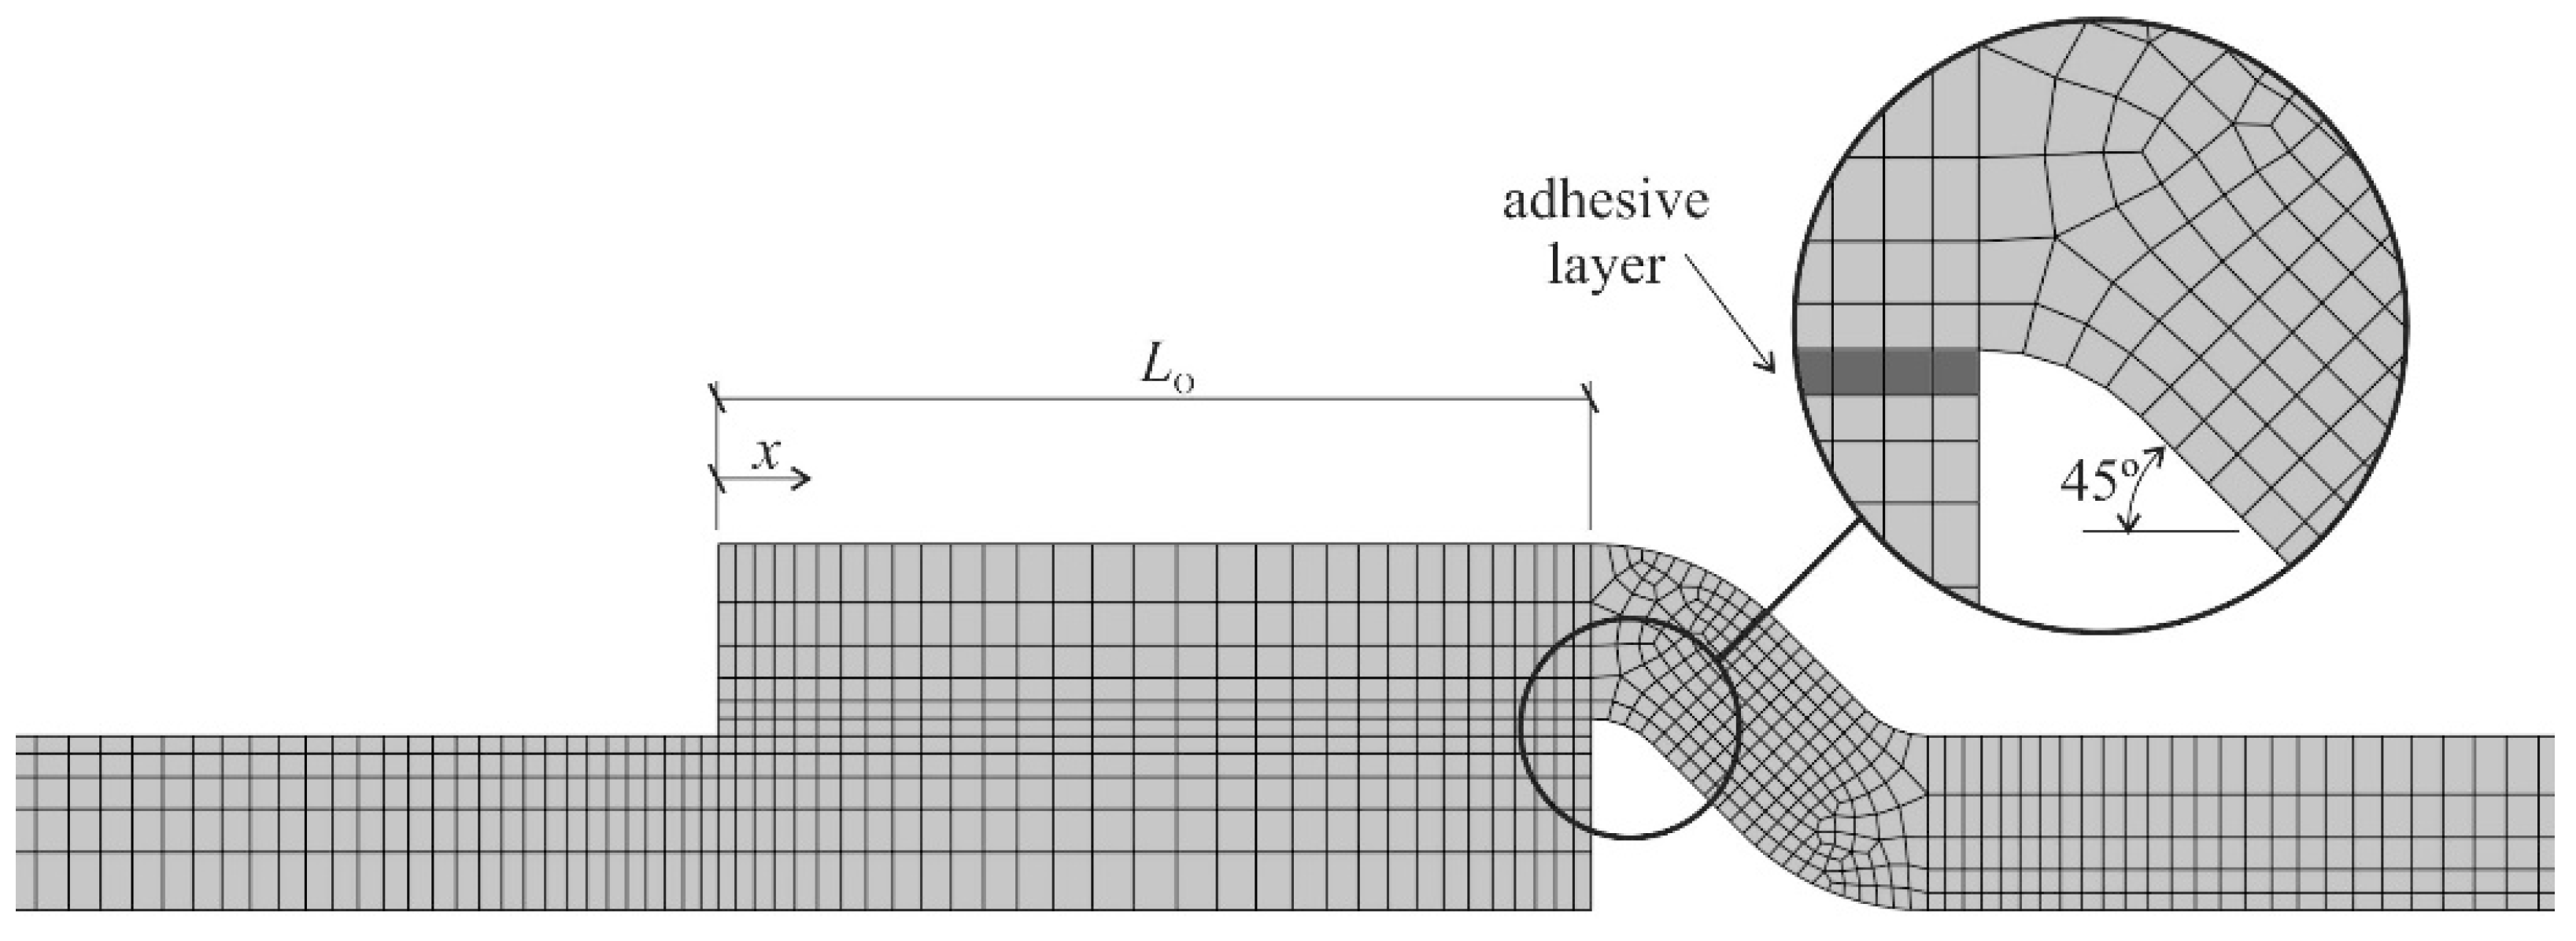
The joint was defined as an axisymmetric deformable solid, constructed from a two-dimensional sketch revolved around an axis. A single solid body was constructed, which was then partitioned to divide the model into adherends and adhesive layer. Additional partitions enabled generating a free mesh in the curved portions of the model and a structured mesh formed by quadrilaterals in the non-curved portions. The adherends were modelled as isotropic solids with the aluminum properties, considering an elastic–plastic representation of the experimental data, as shown in Section 2.1 (Figure 1). Each model was assigned to an adhesive type, with the properties defined in Table 2. The adhesive layer was represented by a single row of CZM elements with the corresponding nodes linked with a triangular CZM law. The cohesive laws of the adhesive were created from the data from Table 2. Failure criteria were assigned for the CZM elements. The quadratic stress (QUADS) damage initiation criterion requires σf and τf. A linear energetic (power-law) failure criterion, depending on GIC and GIIC, was considered with a stabilization parameter or viscous damage being used to assist in model convergence during crack propagation. The detailed description of this model is presented in a previous reference [46]. The boundary conditions were defined to replicate the tensile loading of the tubular joints. A longitudinal displacement δ was imposed at one end of the joint and a clamped condition at the opposite end. Mesh controls were defined: structured mesh for the aluminum partitions without curvature, free mesh for the aluminum partitions with curvature, and sweep mesh for the adhesive layer, to account for CZM crack propagation. The adherends are meshed with 4-node axisymmetric solid elements (with reference CAX4). The adhesive layer is meshed with 4-node axisymmetric cohesive elements (with reference COHAX4). Mesh bias effects were extensively used in the models to increase the computational efficiency, due to higher refinement at stress critical regions. Along the adhesive length, a double bias was used with a maximum size of 0.5 mm and a minimum of 0.2 mm, obtaining greater refinement at the overlap ends. A single bias was applied in the adherends thickness direction to increase the mesh density near the adhesive layer and longitudinally in the adherends towards the overlap. Figure 3 depicts the mesh obtained for the geometry with LO = 10 mm, tAd = 2 mm, and θ = 45°, made up of 1218 elements (x is the adhesive longitudinal coordinate). The higher refinement given to the most critical regions, corresponding to the start of damage propagation, is highlighted in the figure. It should be emphasized that, provided that a minimum refinement is present in crack propagation regions, namely with cohesive elements in the adhesive layer equal to the adhesive thickness, this technique ensures that the results are mesh independent [39], which was confirmed in the present analysis.

3. Results and Discussion

3.1. Validation with Experiments

This section outlines the validation process of the axisymmetric CZM approach against experimental data, aimed at confirming its validity and adhesive properties for subsequent parametric analysis. The adhesives utilized in the validation study correspond to those described in Section 2.1. The selected tubular joint configuration parameters are LO-variable between 20 and 40 mm dEANH = 20 mm, tAd = 2 mm, and θ = 0°. The adherends for the joints were fabricated by turning, using a carbide insert end mill, and the end holes were drilled with a carbide drill mounted on the lathe’s tailstock. A 1 mm diameter hole was manually drilled perpendicular to the unbonded region of the outer adherends using a vertical drill press, allowing air to escape during bonding since the holes drilled to form the tube interiors are not through-holes. Post-machining, surface preparation for bonding involved roughening the surfaces by grit blasting with corundum sand followed by degreasing. The adhesive was then applied to both bonding surfaces, and the tubes were carefully aligned without rotation to avoid adhesive displacement and potential bonding issues, with final positioning confirmed using a digital caliper to maintain the specified overlap length. After adhesive curing, the excess adhesive was removed through additional milling. Specimen testing was conducted using a Shimadzu-Autograph AG-X tester (Shimadzu, Kyoto, Japan) equipped with a 100 kN load cell. The tests were performed at room temperature with a loading rate of 1 mm/min. Five specimens were tested for each joint configuration. The simulations were performed following the tasks/procedure of Section 2.3, employing the same triangular law CZM approach. Experimental Pm values (average and deviation) plotted against LO are depicted in Figure 4 alongside corresponding numerical predictions. Failures were cohesive in the adhesive layer for both analyses. Table 3 presents the resulting comparative analysis for the three adhesives investigated (average experimental and numerical Pm).
The obtained data revealed accurate CZM predictions for the tubular joints employing the AV138 and 2015. The AV138 exhibited the smallest relative deviations between experimental and numerical results (2.4% for LO = 20 mm, and 4.7% for LO = 40 mm; always higher for the CZM data). Similarly, for the 2015, the percentile deviation is 6.1% for LO = 20 mm, which reduces to 2.9% for LO = 40 mm (always higher numerically). Thus, CZM predictions remain accurate, akin to the behavior observed with the AV138 adhesive. In contrast, tubular joints employing the 7752 adhesive exhibit numerically lower Pm values by a notable margin. In simulations involving ductile adhesives and triangular CZM laws, predictions may tend to underestimate Pm due to the immediate stress depreciation upon reaching the material cohesive strengths. Despite the observed difference between experimental and CZM Pm values for the 7752, which amounts to 18.4% (LO = 20 mm) and 14.3% (LO = 40 mm), with experimental values consistently exceeding numerical ones, the numerically obtained values are deemed acceptable for design purposes, accounting for the associated factors and dispersion of values. The decision to use the triangular CZM was based on its availability in commercial software like Abaqus®, which facilitates the design of bonded structures for designers with limited resources, such as those without access to user-defined CZM formulations, provided that the resulting errors are within acceptable limits. Overall, the numerical results are deemed satisfactory for comparative purposes in the subsequent parametric study.

3.2. Effect of the Outer Diameter

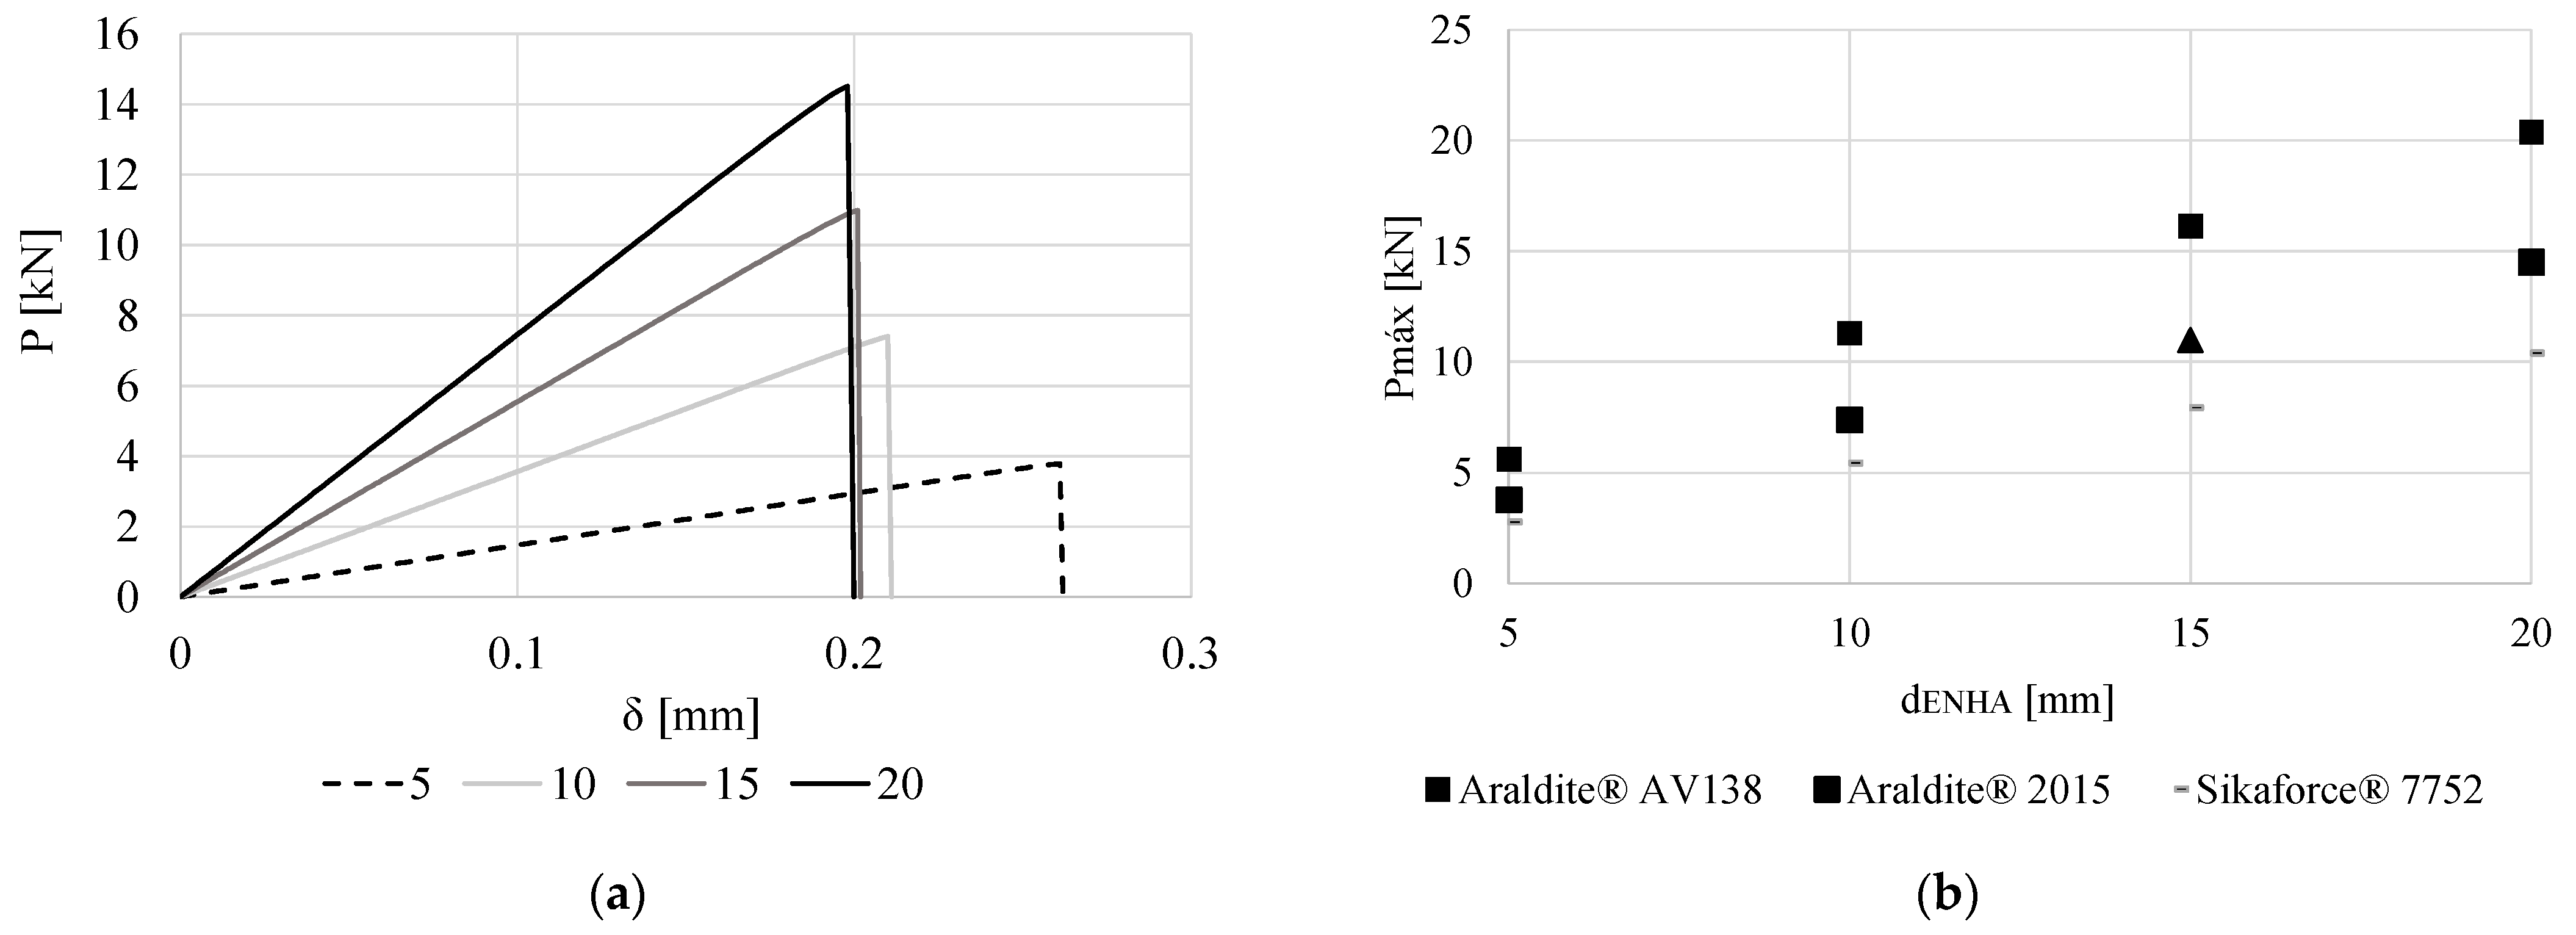
Figure 5a illustrates the load (P)-δ curves as a function of dENHA for the 2015 sample case. The Pm results are summarized in Figure 5b for all adhesives. The P-δ curves show a marked variation in stiffness and strength by varying dENHA, which is transversal to all adhesives. Higher dENHA leads to a corresponding increase of stiffness and Pm. While the stiffness tends to a constant value when approaching dENHA = 20 mm, Pm increases nearly proportionally, which is due to the corresponding bonded area, given by the adhesive layer perimeter × LO (in this case constant and equal to 10 mm). The Pm evolution with dENHA reveals a steady increase for all adhesives. The strongest joints are bonded with the AV138, followed by the 2015, and finally the 7752. Over the 7752, the improvements for the limit dENHA were 103.20% and 37.00% for dENHA = 5 mm (AV138 and 2015, respectively) and 96.00% and 39.50% for dENHA = 20 mm (in the same order). These differences arise from the strength and ductility characteristics of the adhesives. The AV138 is the strongest adhesive, since for the relatively small stress gradients for these LO values, the strength is preponderant for Pm rather than the ductility, which is expected for higher LO, in which case the stress gradients increase [47]. The Pm evolution with dENHA is highest and nearly linear for the 2015 (283.20% Pm improvement between dENHA = 5 and 20 mm), and gradually reduces for the 7752 (276.40% Pm improvement) and for the AV138 (263.10% Pm improvement). These differences arise from the aforementioned ductility differences between adhesives and increase of peak stresses with dENHA, which are not efficiently absorbed with brittle adhesives such as the AV138.
Figure 6 shows the ER evolution as a function of dENHA and the adhesive used. ER increased with dENHA for all studied adhesives. Since ER is measured by the area beneath the P-δ curves, there is a close relation between ER and Pm. Thus, the best performance was found for the joints bonded with AV138 followed by 2015, and the lowest ER related to the 7752. Compared against the 7752, 186.10% and 46.50% ER improvements were attained for dENHA = 5 mm (AV138 and 2015, respectively), values decreased to 140.90% and 43.40% for dENHA = 20 mm (in the same order of adhesives). The discrepancies are justified by the Pm differences between adhesives, although more compliant and ductile adhesives such as the 7752 tend to have higher failure δ, which also contribute to ER. Identically to Pm, ER varies mostly linearly with dENHA for the 7752 (related to a 199.60% ER increase between limit values), while it becomes smaller for the 2015 (193.20% ER increase), and is the lowest for the AV138 (152.30% ER increase). The main justification for these differences is the Pm tendency, which is directly followed by ER.
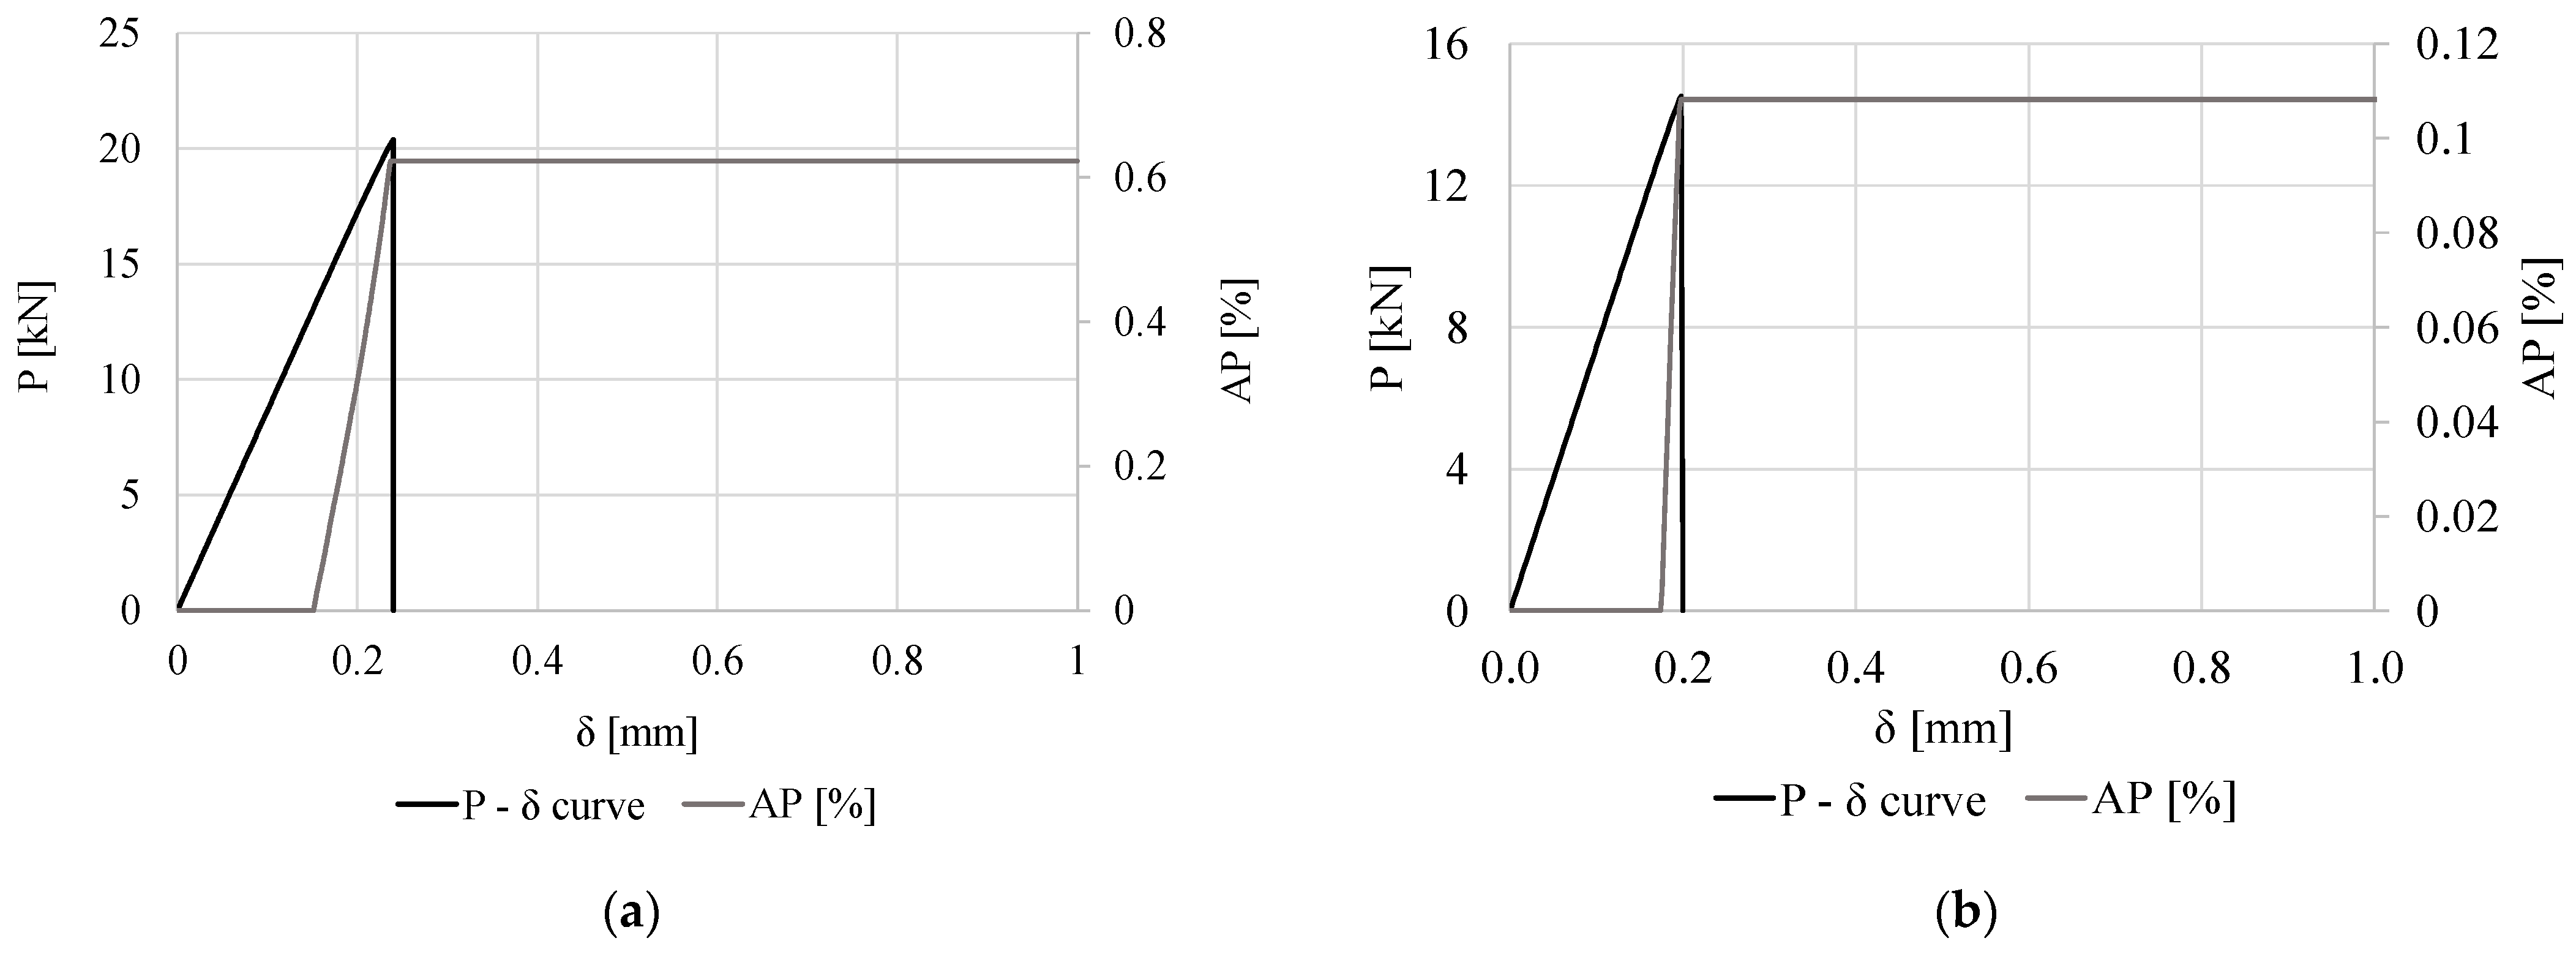
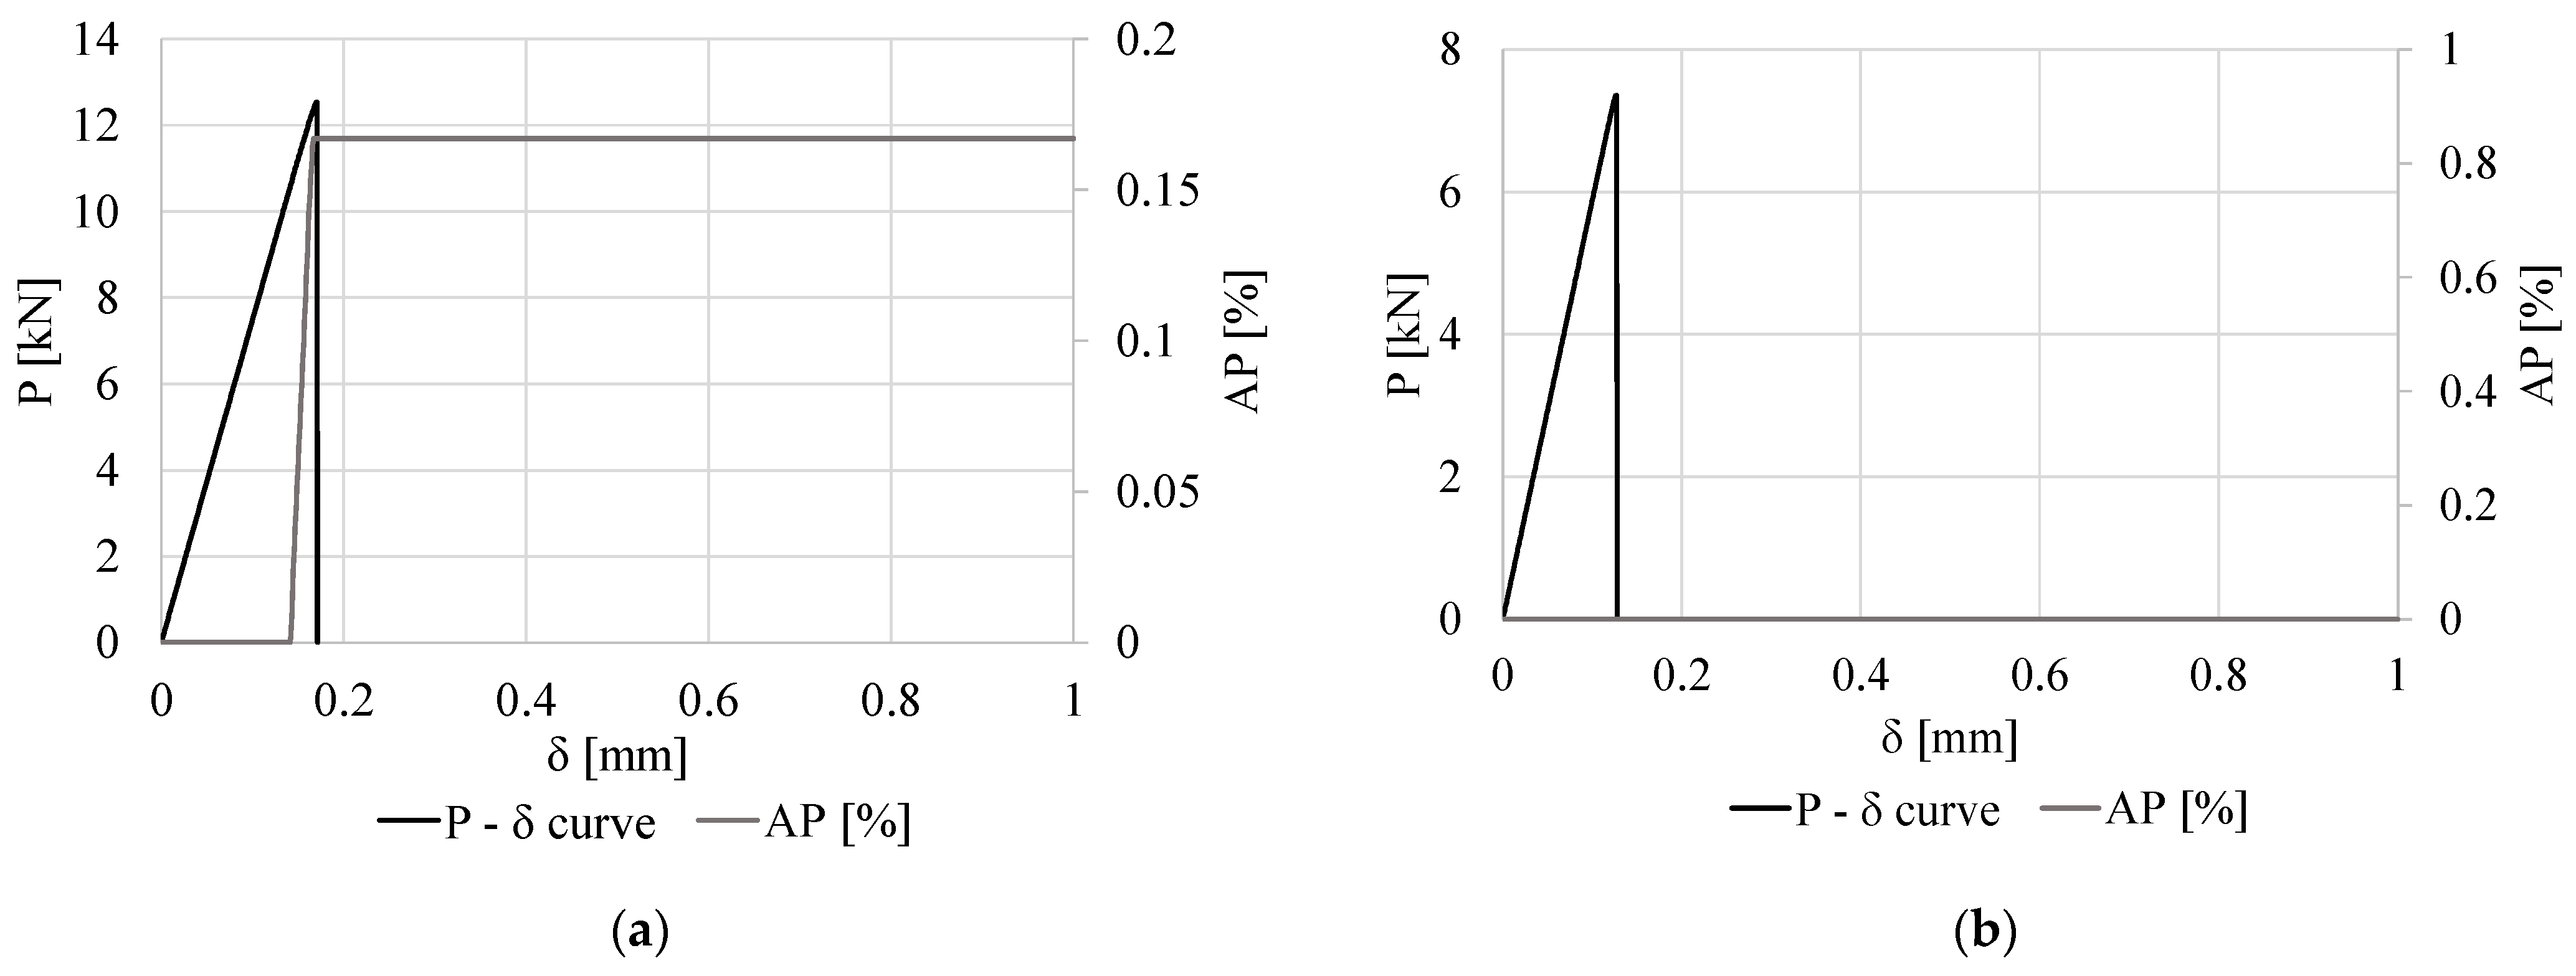
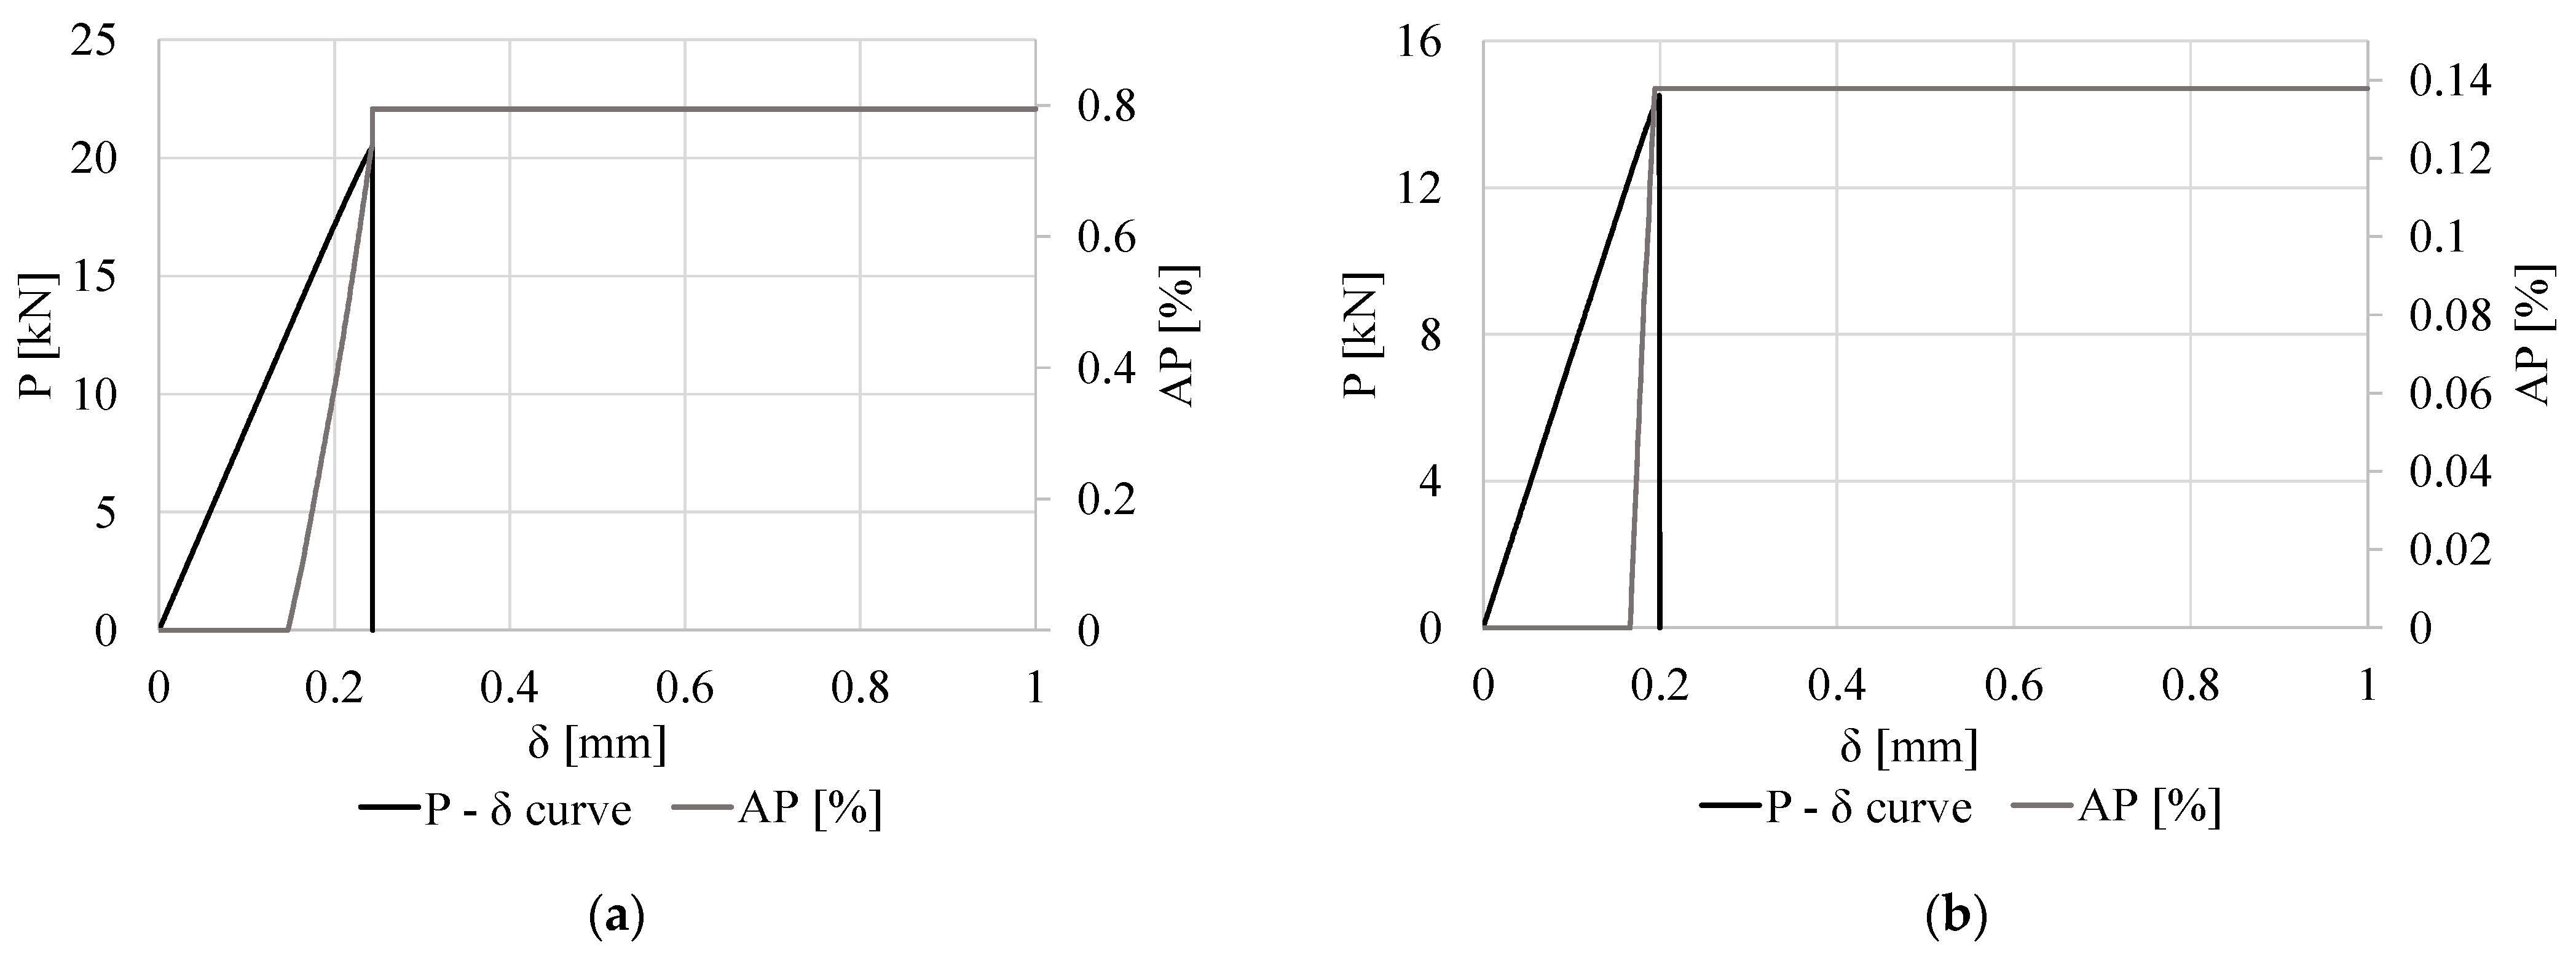
Figure 7 illustrates the evolution of P and adherend plasticization (AP) at the critical node as a function of δ, for all adhesives, for the joint example with dENHA of 20 mm (a, b, and c), and the maximum AP for each adhesive/dENHA configuration (d). The results are next divided into adhesive type:
  • AV138: Joint failure was cohesive in the adhesive for all geometries using the AV138. For the AV138, there was a relative decrease in P at AP onset (PSAP) in relation to the corresponding Pm value as dENHA values increased. There was a proportional increase in δ at AP onset (δSAP) in relation to δ at failure (δf) for the two lowest dENHA values analyzed and a decrease in this parameter for the others.
  • 2015: Joint failure was cohesive in the adhesive for all joints analyzed. For the 2015, null PSAP and δSAP values were recorded for dENHA ≤ 10 mm. For dENHA = 10 mm, AP occurred, although both geometries showed PSAP and δSAP values very close to Pm and δf, respectively.
  • 7752: For all analyzed joint geometries, there was no AP in any case, and the joint failure was always cohesive in the adhesive.

3.3. Effect of the Overlap Length

Figure 8a illustrates the P-δ curves as a function of LO for the 2015 sample case. The Pm results are summarized in Figure 8b for all adhesives. The P-δ curves reveal a pronounced variation in stiffness and strength when varying LO, which is transversal to all adhesives. Higher LO values lead to a corresponding increase in stiffness and Pm. While stiffness tends towards a constant value when approaching LO = 20 mm, Pm increases almost proportionally with LO. The strongest joints are those bonded with the AV138, followed by the 2015, and finally the 7752. Compared to the 7752, the improvements for the limit LO values were 126.60% and 32.90% for LO = 5 mm (AV138 and 2015, respectively) and 66.40% and 48.40% for LO = 20 mm (in the same order). The Pm evolution with LO is higher and nearly linear for the 2015 (290.50% Pm improvement between LO = 5 and 20 mm) and gradually reduces for the 7752 (249.60% Pm increase between limit values) and for the AV138 (156.80% Pm improvement).
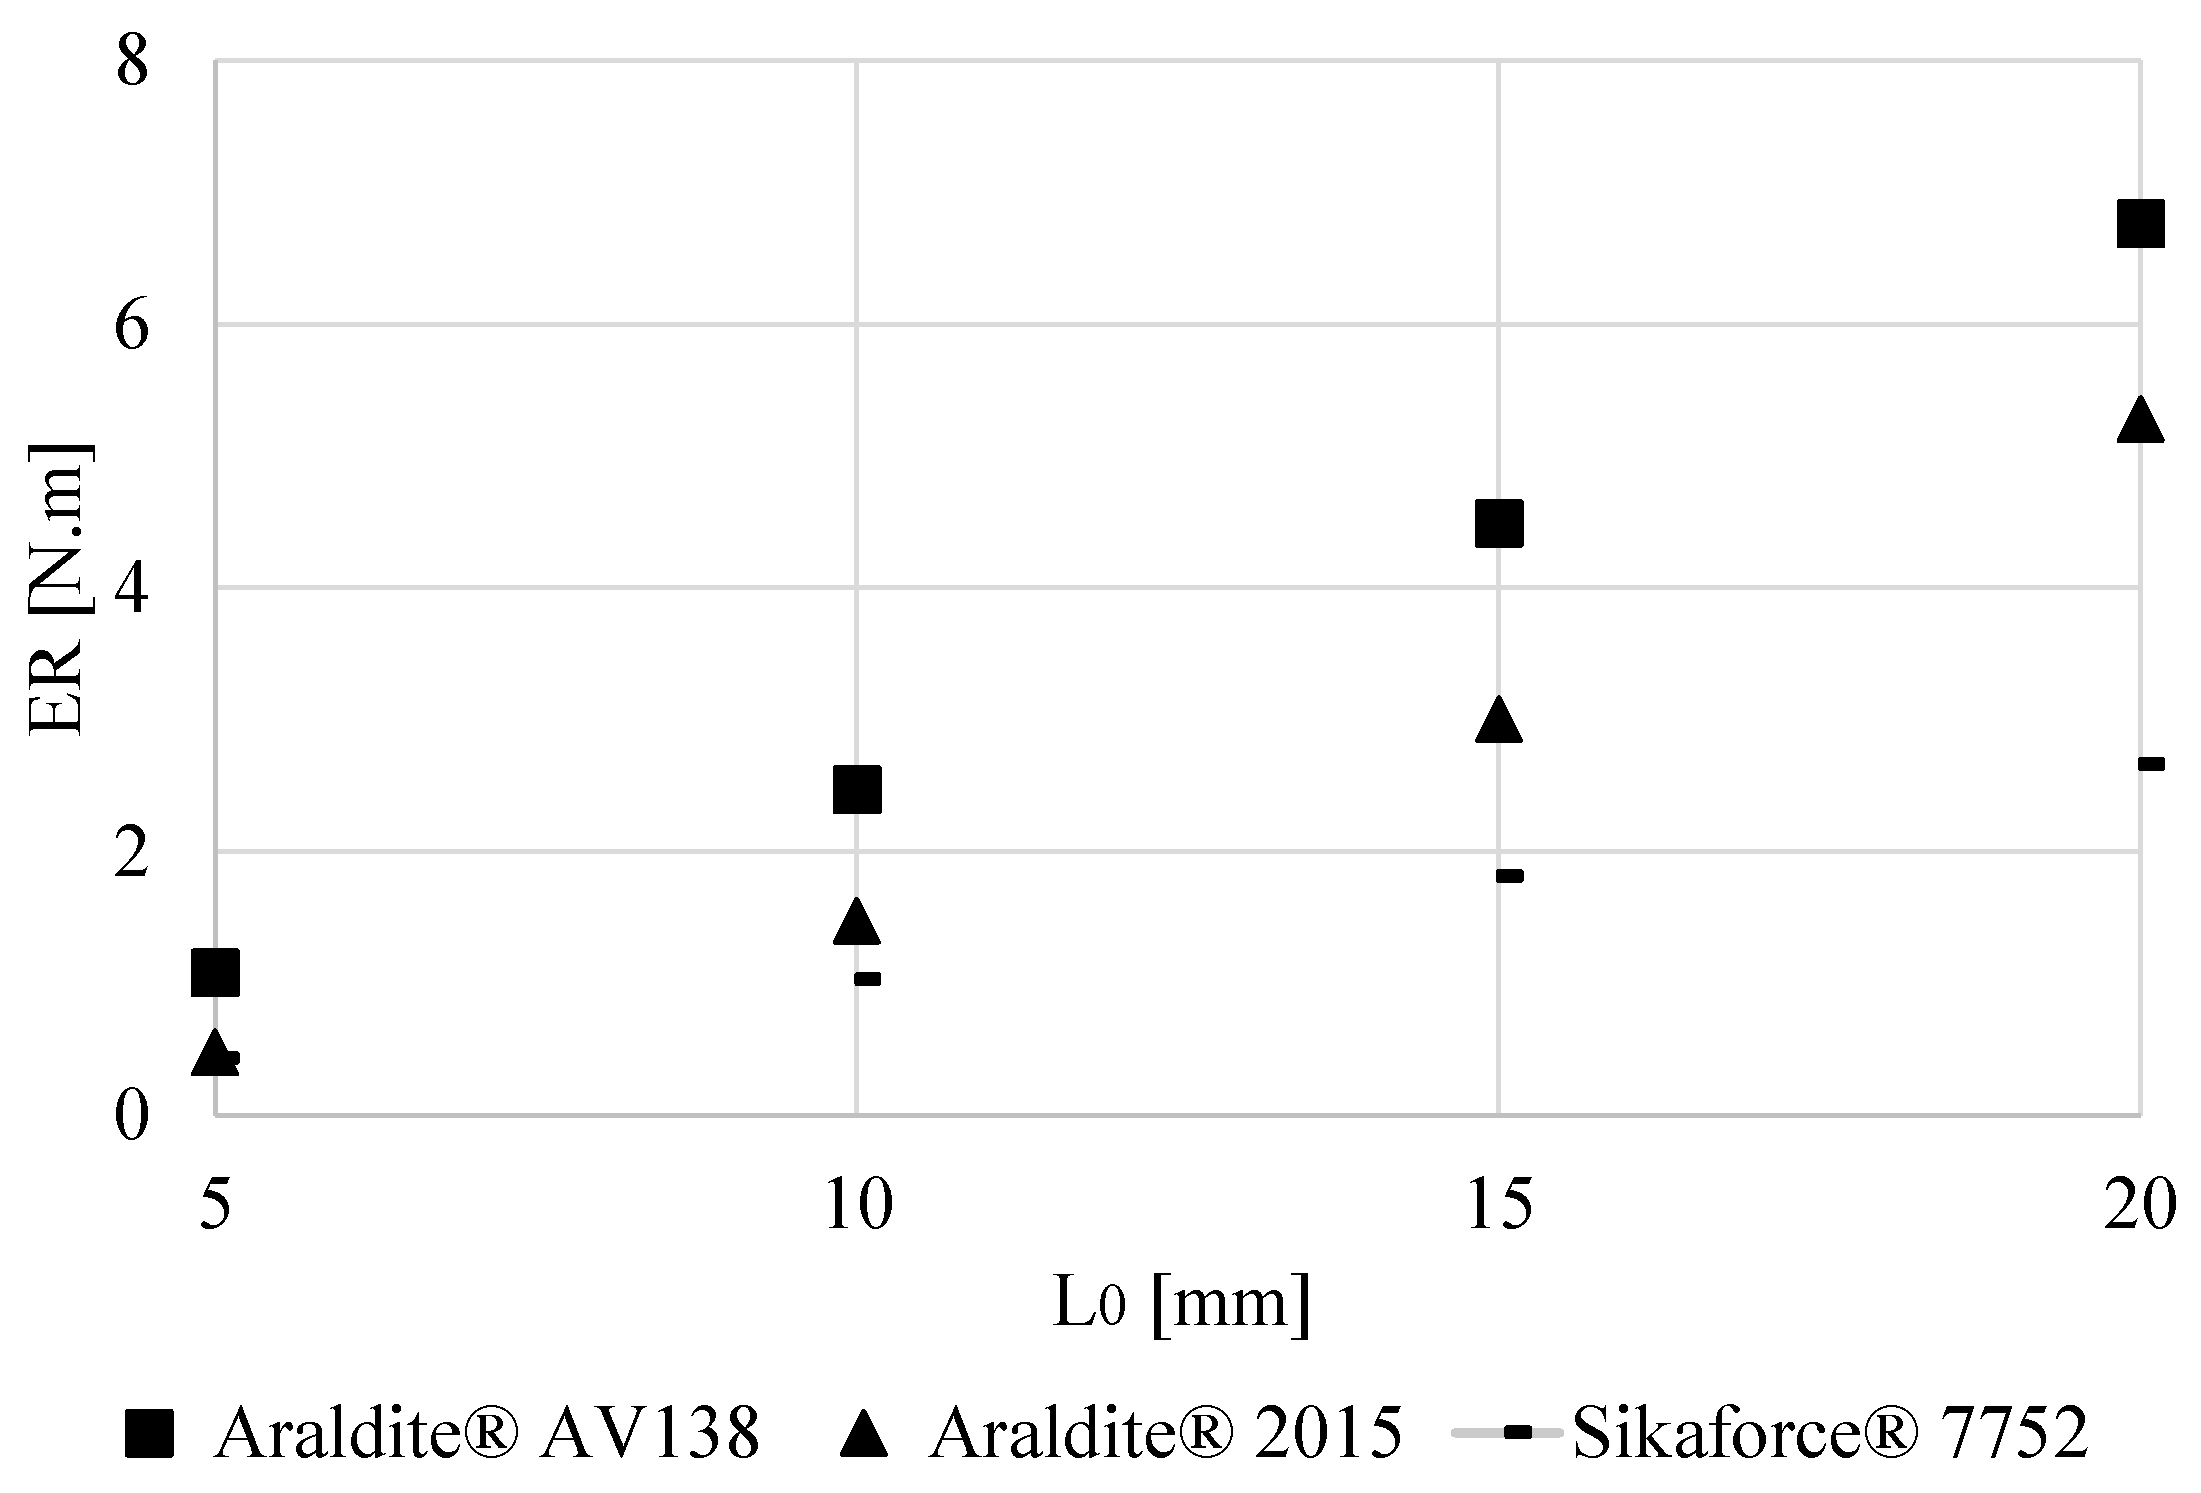
Figure 9 illustrates the ER evolution as a function of LO and the adhesives analyzed. ER increased with LO for all adhesives. Therefore, the best performance was found for the joints bonded with the AV138, to be followed by the 2015, and the lowest ER related to the 7752. Compared to the 7752, 151.50% and 10.60% improvements in ER were obtained for LO = 5 mm (AV138 and 2015, respectively), which increased to 154.30% and 98.50% for LO = 20 mm (in the same order of adhesives). Similarly to Pm, and with an identical trend to dENHA, ER varies mostly linearly with LO for the 7752 (though it still registered an increase in ER of 516.10% between limit values), while it becomes slightly higher for the AV138 (526.00% ER increase), and highest for the 2015 (1005.90% ER increase).
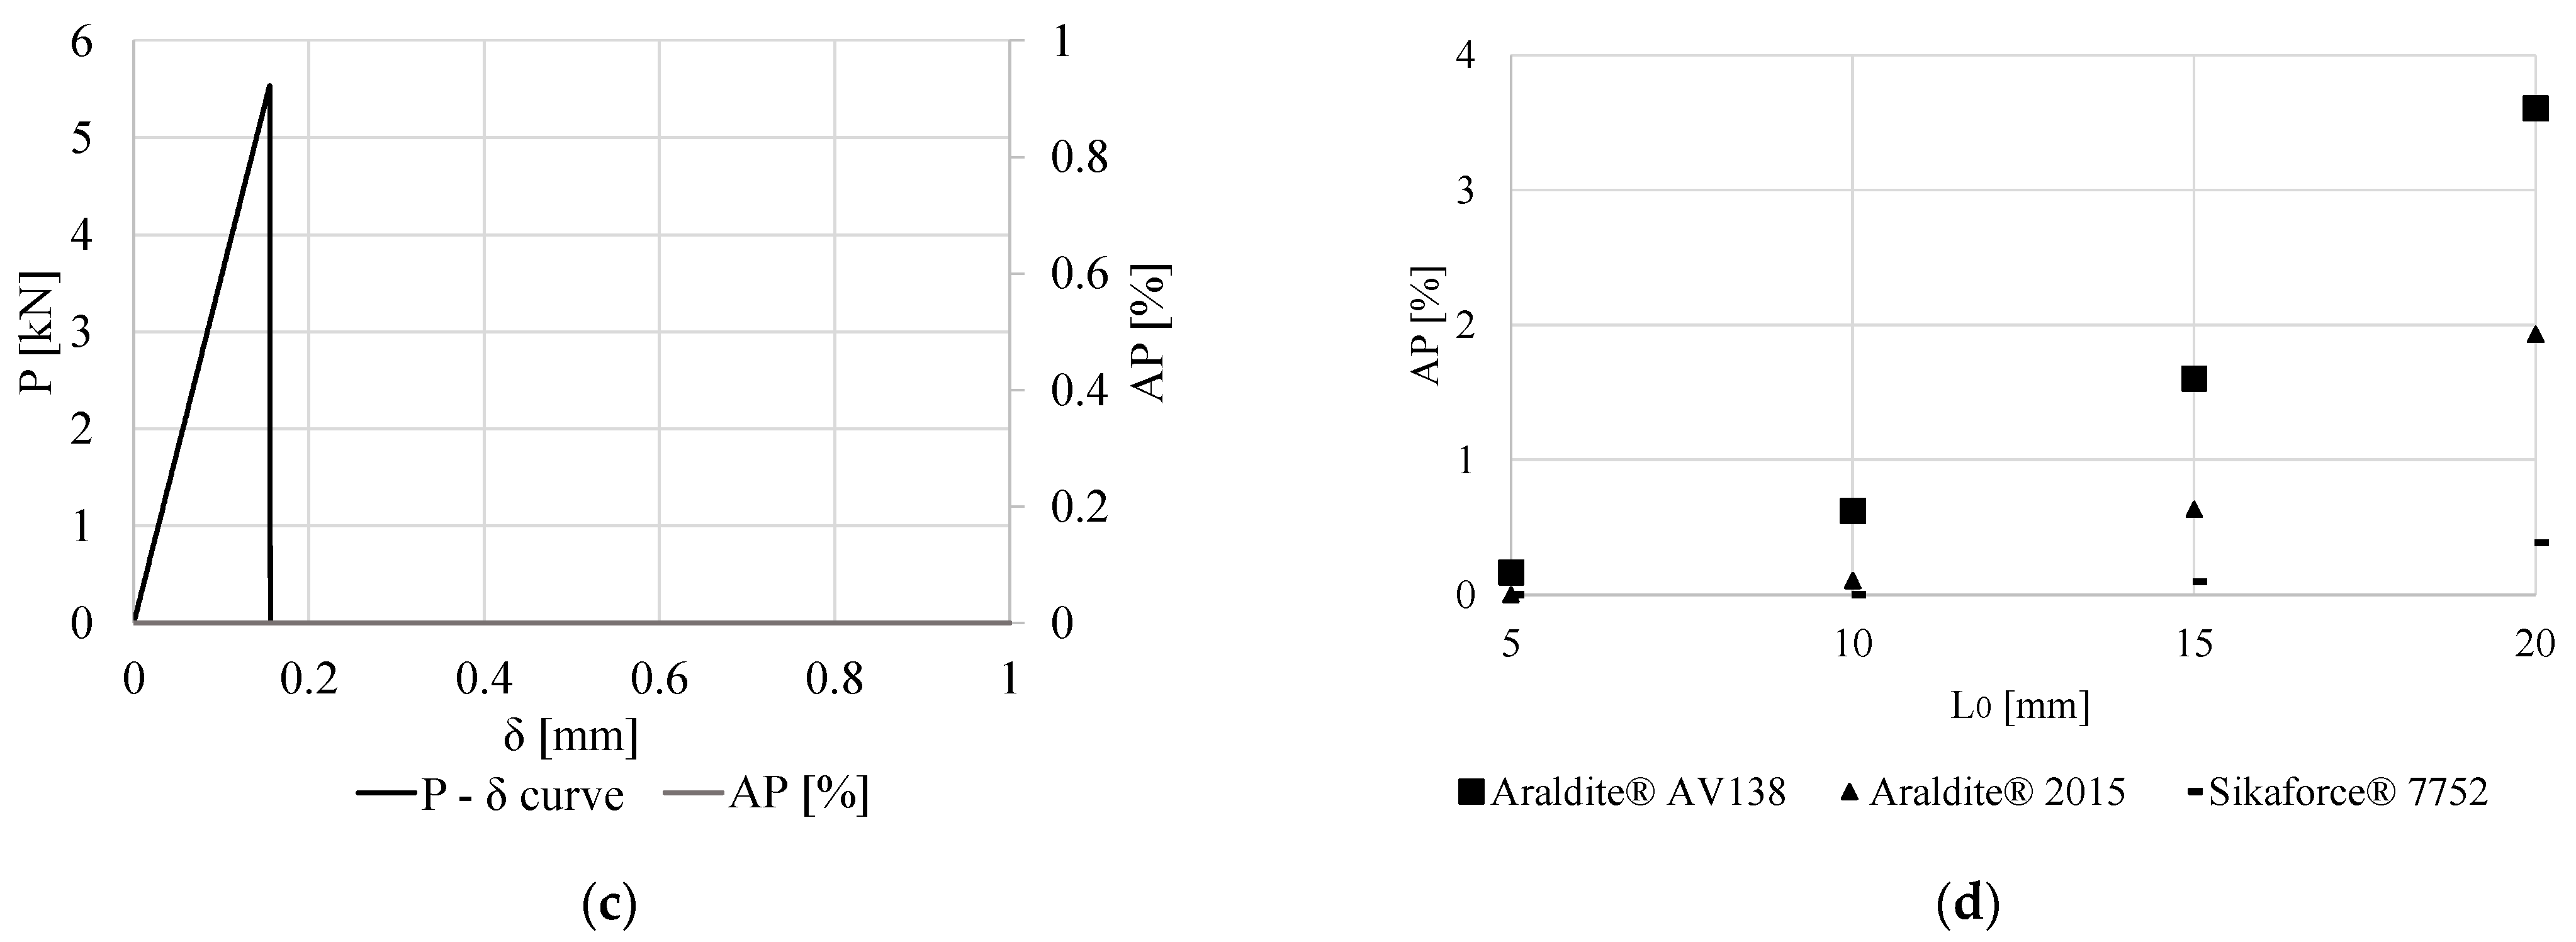
Figure 10 illustrates the evolution of P and AP at the critical node as a function of δ, for all adhesives and LO = 20 mm (a, b, and c), and the maximum AP for each adhesive/LO configuration (d). The results are next divided into adhesive type:
  • AV138: Joint failure was cohesive in the adhesive for all geometry of joints. For higher LO values, the δSAP value tends to decrease in relation to δf. The percentile increase in δSAP maximizes the strength of the adhesive layer elements.
  • 2015: Joint failure was cohesive in the adhesive for all geometries using the 2015. For LO = 5 mm, no AP occurred. For higher LO values, the δSAP value tends to decrease in relation to δf.
  • 7752: Joint failure was cohesive in the adhesive for all geometries analyzed. The δSAP value tends to decrease in relation to the δf for higher LO values.

3.4. Effect of the Tube Thickness

Figure 11a shows the P-δ curves as a function of tAd for the AV138 joints. The Pm results are summarized in Figure 11b for all the adhesives. The P-δ curves reveal a marked variation in stiffness and strength when tAd is varied, which is transversal to all adhesives. Higher tAd values lead to a corresponding increase in stiffness and Pm. While stiffness tends towards a constant value when approaching tAd = 4 mm, Pm increases almost proportionally. The Pm evolution with tAd shows a constant increase for all adhesives. The strongest joints are those bonded with the AV138, followed by the 2015, and finally the 7752. Compared to the 7752, the improvements for the limit tAd values were 64.70% and 13.70% for tAd = 1 mm (AV138 and 2015, respectively) and 107.20% and 35.40% for tAd = 20 mm (in the same order of adhesives). The Pm evolution with tAd is higher for the AV138 (35.20% Pm improvement between tAd = 1 and 4 mm) and gradually reduces for the 2015 (28.00% Pm increase between limit values) and for the 7752 (7.50% Pm improvement).
Figure 12 shows the ER evolution as a function of tAd and the adhesives under study. ER decreased with tAd for all adhesives. The best performance was found for the joints bonded with the AV138, followed by the 2015, and finally, the 7752 showed the worst results. Compared to the 7752, ER improvements of 175.10% and 9.60% were obtained for tAd = 1 mm (AV138 and 2015, respectively), which decreased to 116.60% (AV138) and increased to 16.70% (2015) for tAd = 4 mm. Unlike the previous geometric parameter analyzed, ER varies mostly linearly with tAd for the 2015 (related to an ER decrease of only 33.90% between limit values), while it becomes higher for the 7752 (37.90% ER increase), and further increases for the AV138 (51.10% ER increase).
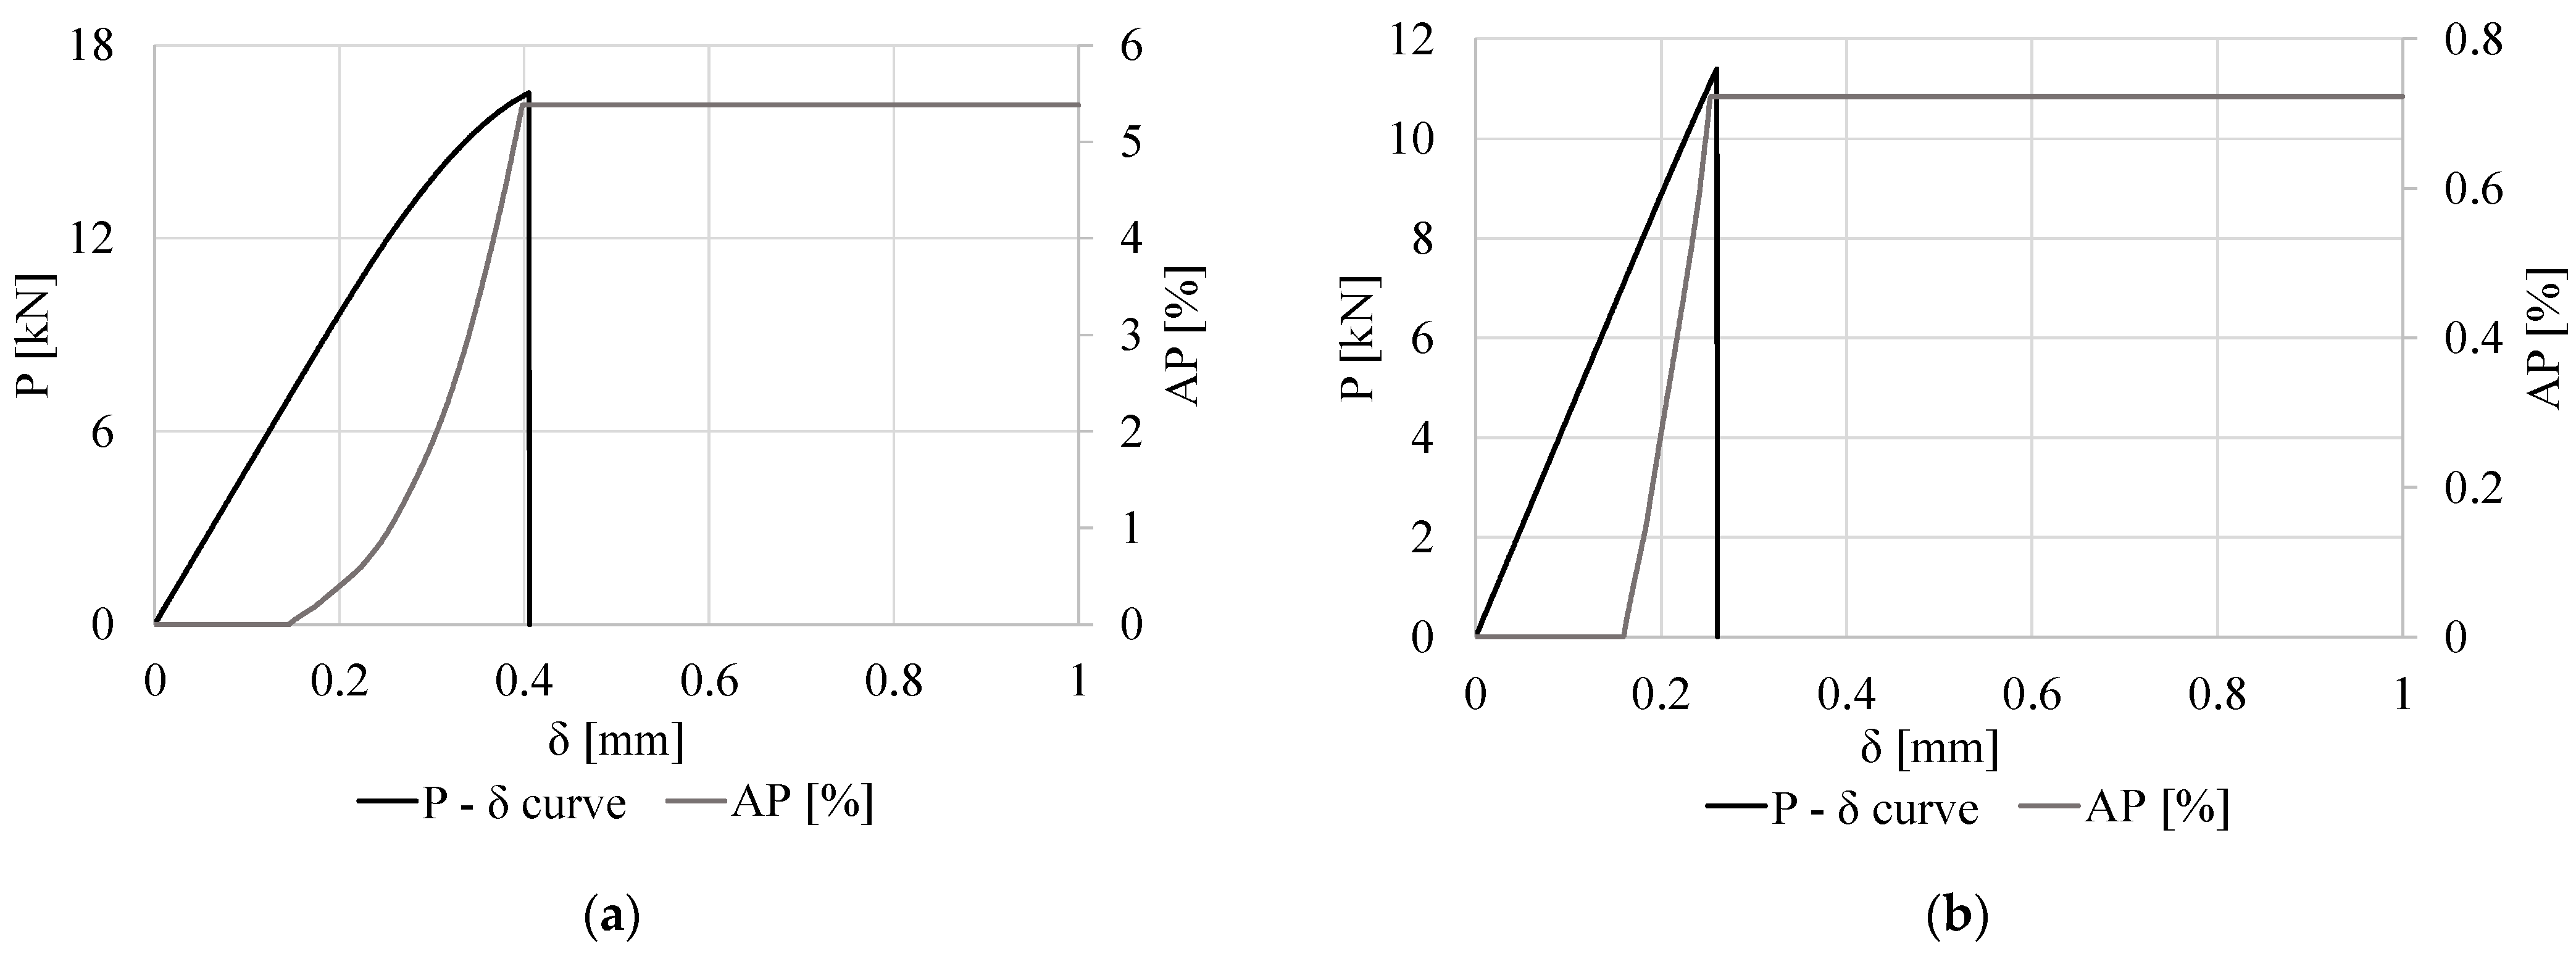
Figure 13 illustrates the evolution of P and AP at the critical node as a function of δ, for all adhesives, for the joint example with tAd = 1 mm (a, b, and c), and the maximum AP for each adhesive/tAd configuration (d). The results are next divided into adhesive type:
  • AV138: Joint failure was cohesive in the adhesive, for all geometries. For lower tAd values, δSAP tends to decrease in relation to δf. When varying tAd and the adhesive under study, the joint bonded with the AV138 registered the highest AP, with tAd = 1 mm.
  • 2015: Joint failure was cohesive in the adhesive for all geometries using the 2015, and for higher tAd values, δSAP tends to approach δf.
  • 7752: For tAd = 2, 3, and 4 mm, there was no AP, and joint failure was cohesive in the adhesive.

3.5. Effect of the Joggle Angle

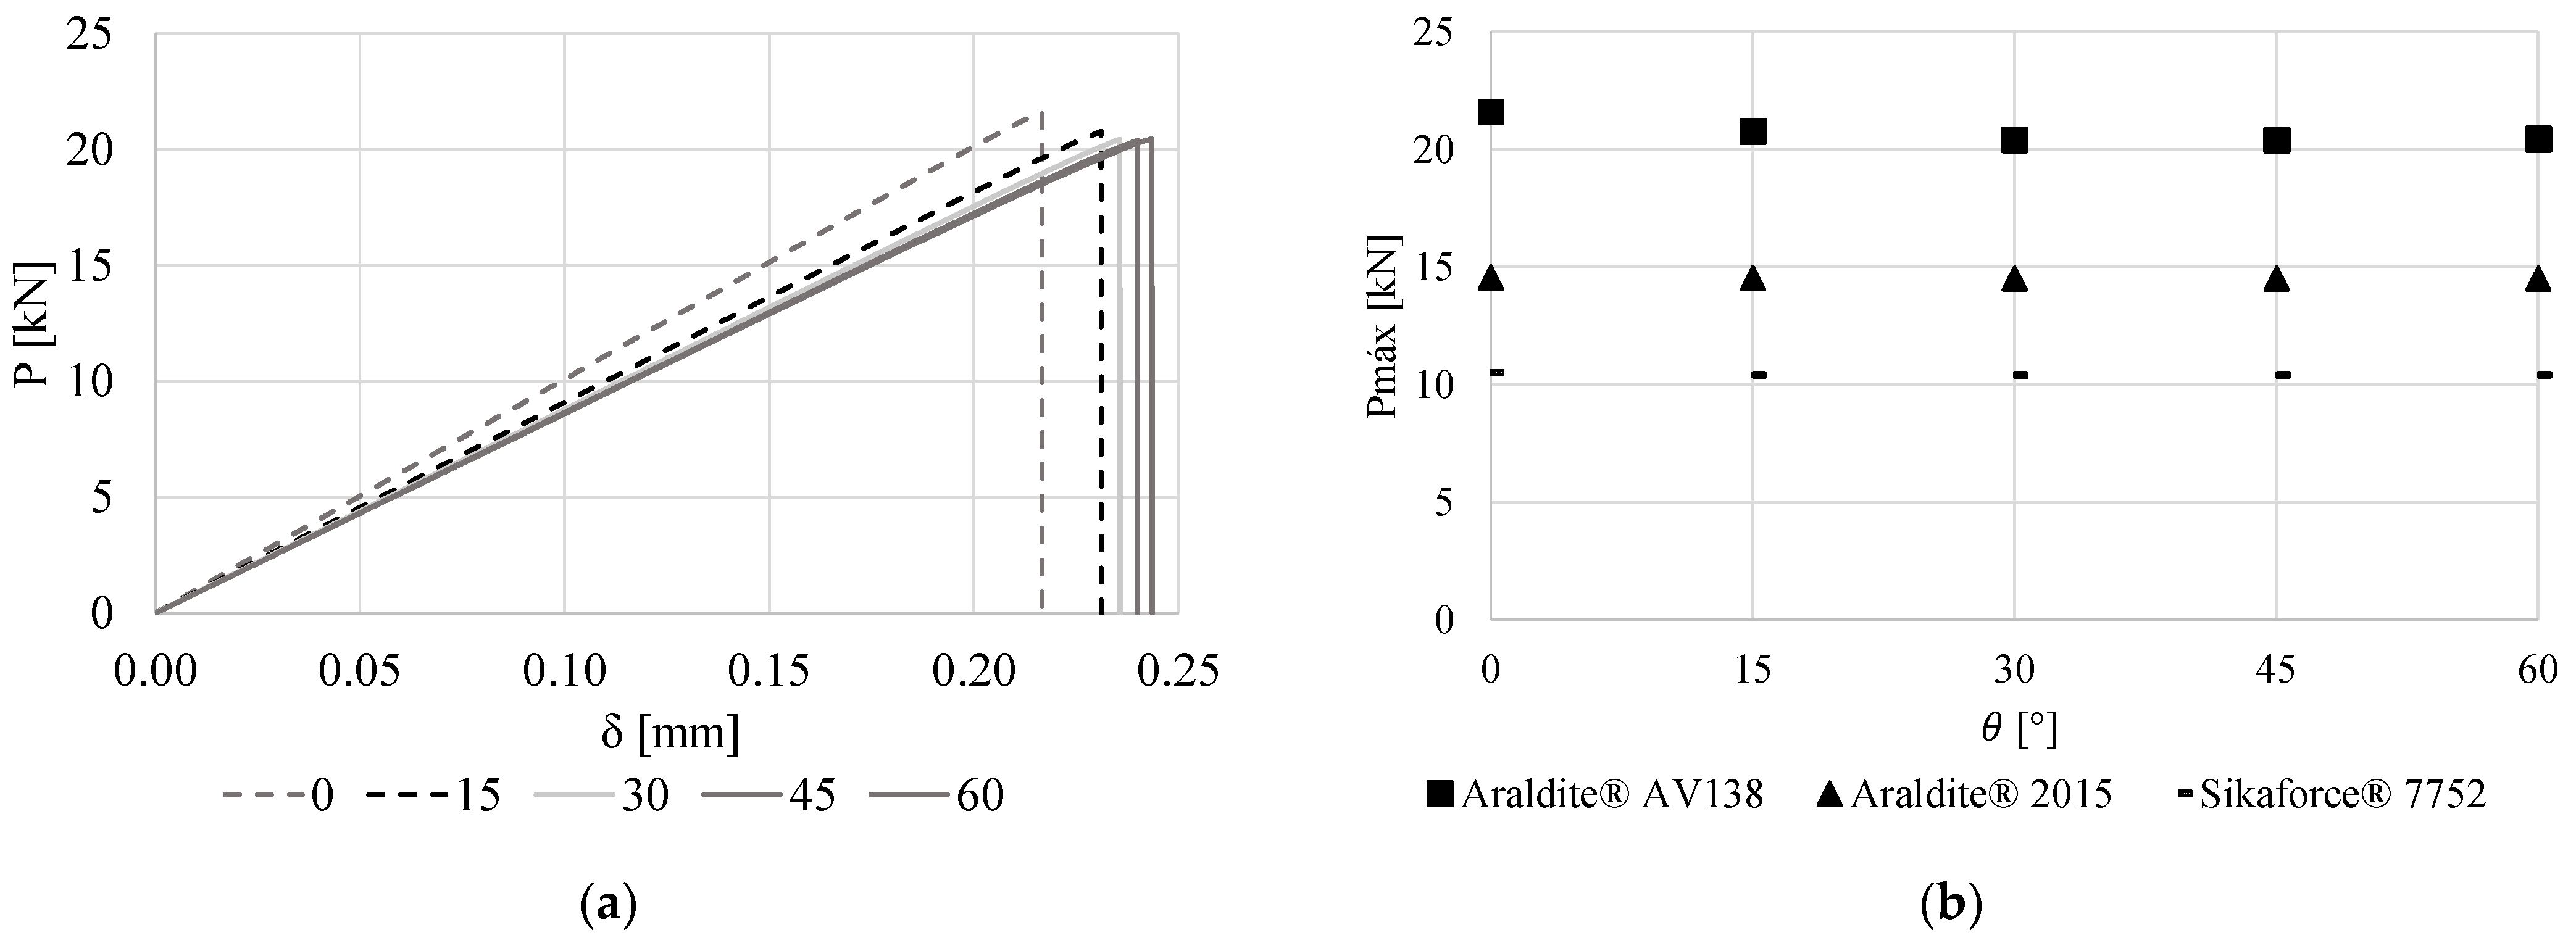
Figure 14a shows the P-δ curves as a function of θ for the AV138. The Pm results are summarized in Figure 14b for all the adhesives. The P-δ curves reveal a slight variation in stiffness and Pm by varying θ, common to all adhesives. In the case of the 2015, higher values of θ lead to a corresponding increase in stiffness and Pm. While the stiffness tends towards a constant value when approaching θ = 60°, Pm also stabilizes. The strongest joints are bonded with the AV138, followed by the 2015 and the 7752. Compared to the 7752, the improvements for the limit θ values were 105.60% and 38.80% for θ = 0° (AV138 and 2015, respectively) and 96.50% and 39.40% for θ = 60° (in the same order of adhesives). The Pm evolution with θ is higher for the AV138 (5.27% decrease in Pm between θ = 0 and 60°) and gradually reduces for the 7752 (decrease of 0.87% in Pm) and for the 2015 (0.39% Pm decrease between θ = 0 and 60°).
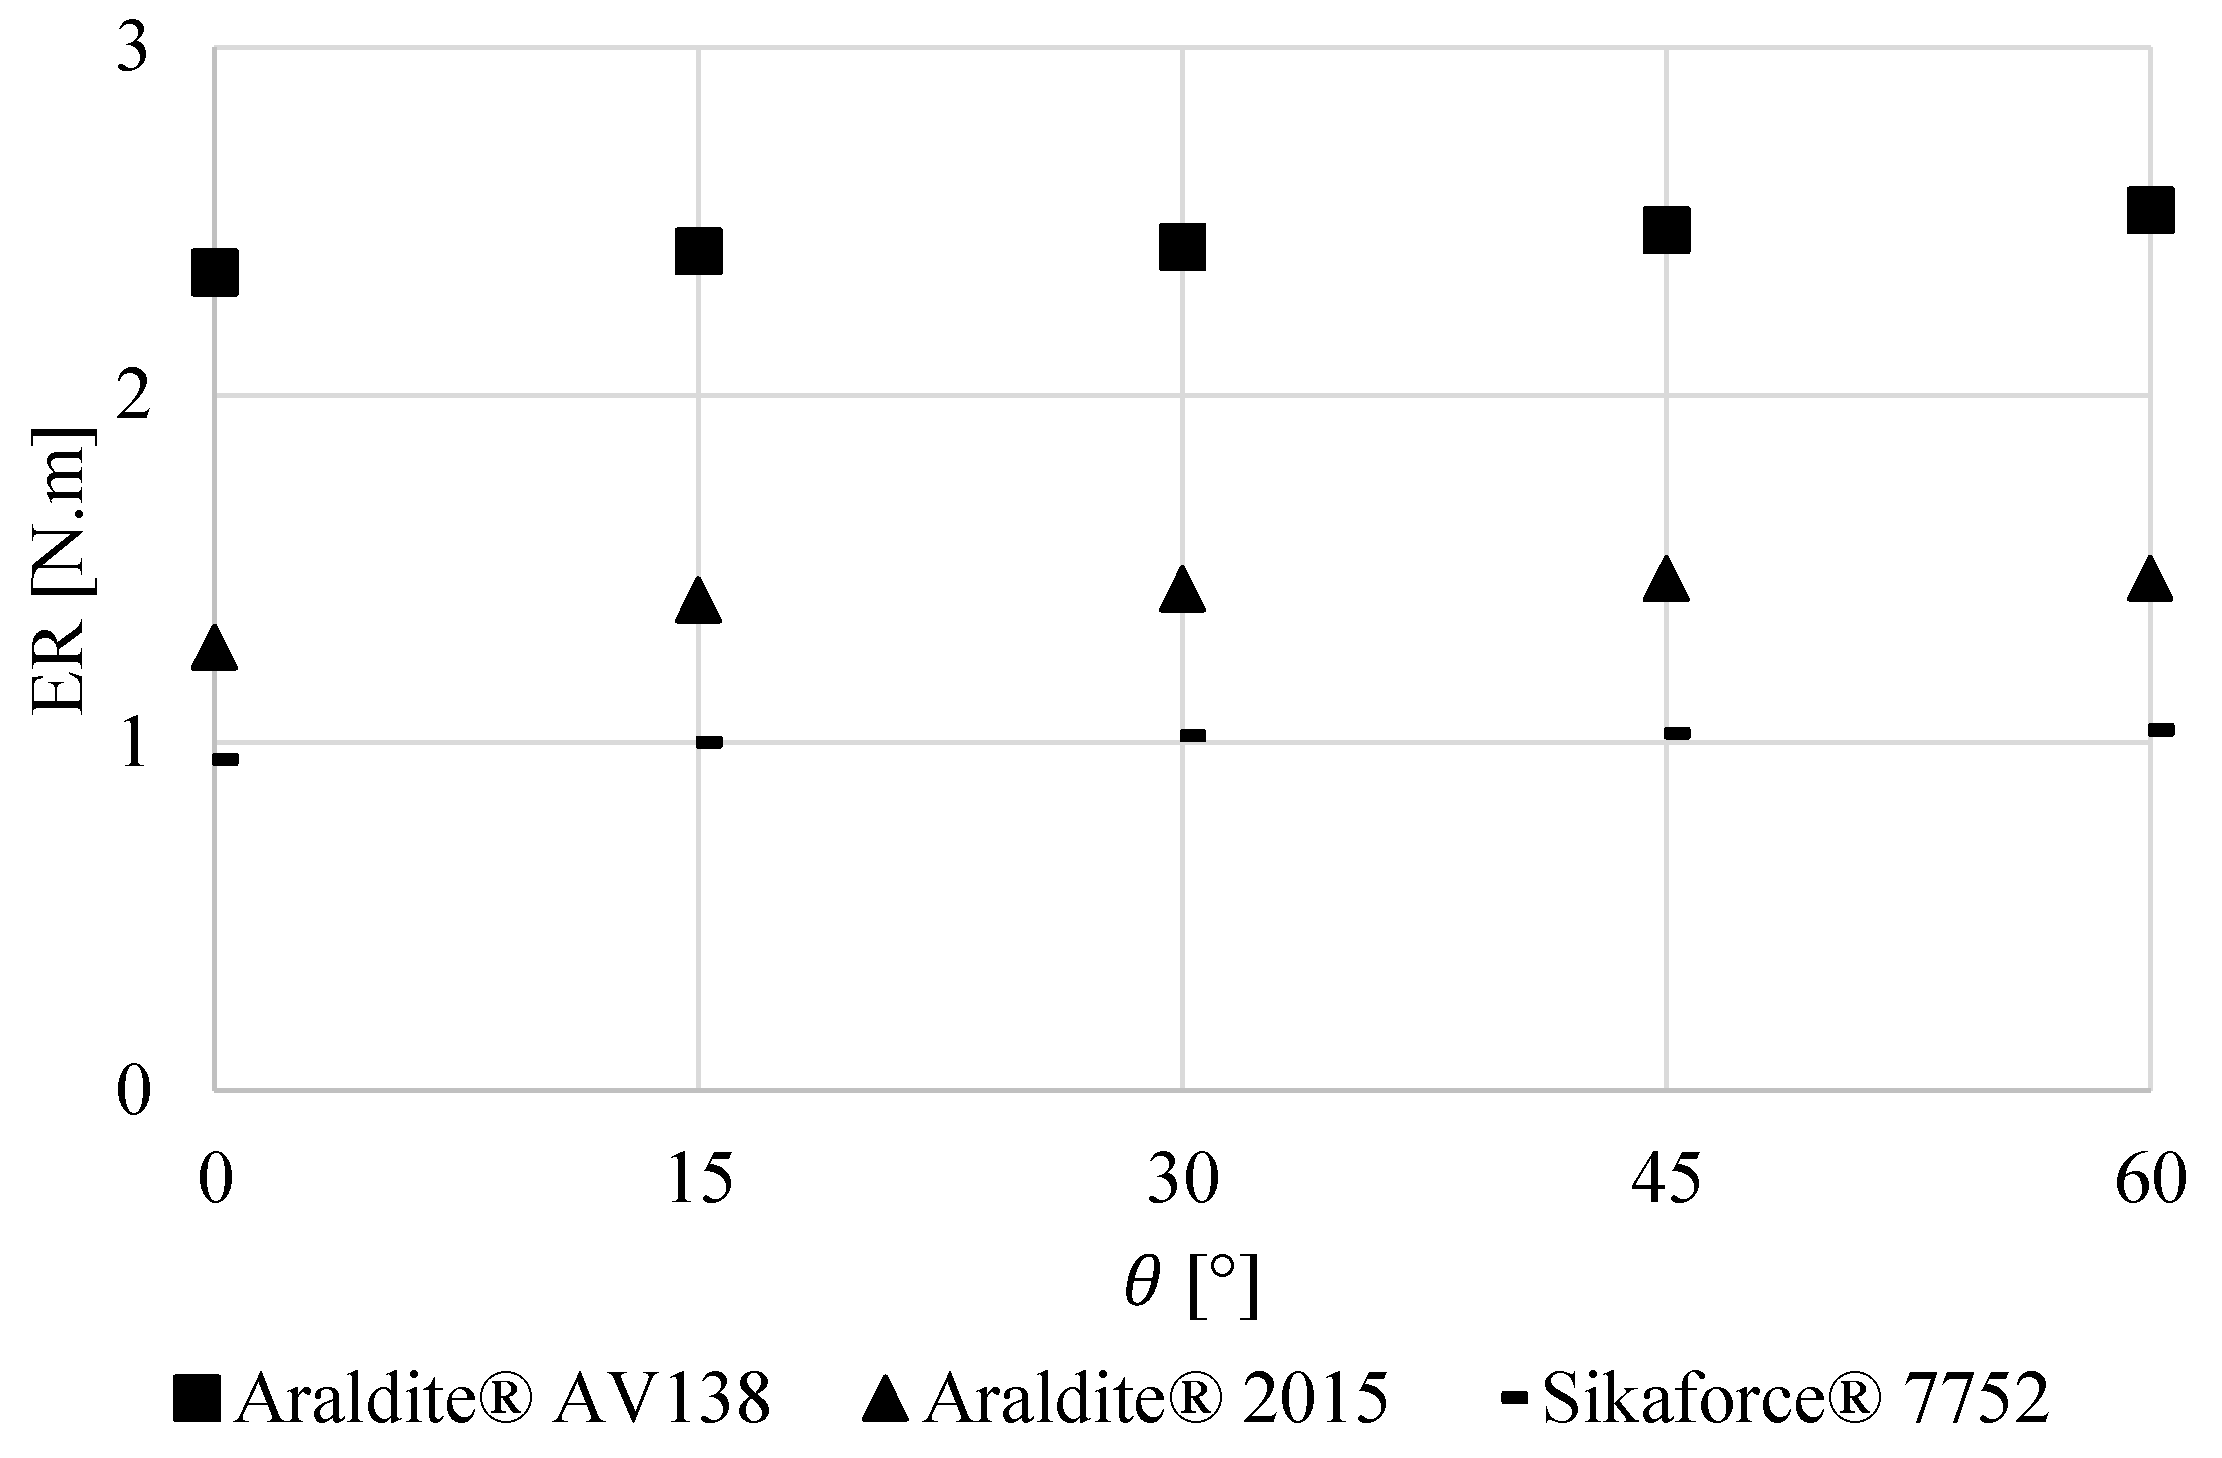
Figure 15 shows the ER evolution as a function of θ and the adhesive analyzed. ER increased with θ for the 7752. In the case of the 2015, the ER slightly increases from 0 to 45° and decreases for θ = 60°. For the AV138, the ER decreases slightly between 0 and 45° and increases for θ = 60°. Thus, the best performance was registered for the joints bonded with the AV138, followed by the 2015 and 7752, in that order. Compared to the 7752, ER improvements of 186.10% and 46.50% were obtained for θ = 0° (AV138 and 2015, respectively), values that decreased to 140.90% and 43.40% for θ = 60° (in the same order of adhesives). The differences are explained by the varying Pm between the adhesives, although θ does not significantly contribute to the increase in ER. Therefore, ER varies linearly with θ for all the adhesives analyzed, with a decrease in ER of 7.60% between the limit values for the AV138, an increase of 9.00% for the 7752 and 15.50% for the 2015.
Figure 16 illustrates the evolution of P and AP at the critical node as a function of δ, for all adhesives, for the joint with θ = 60° (a, b, and c), and the maximum AP for each adhesive/θ configuration (d). The results are next divided into adhesive type:
  • AV138: Joint failure was cohesive in the adhesive for all geometries of joint, and for higher θ values, δSAP decreases in relation to the corresponding δf. When varying θ and the adhesive under study, the adhesive joint with the highest AP value uses the AV138, with θ = 60°.
  • 2015: Joint failure was cohesive in the adhesive for all the geometries using the 2015. For θ ≥ 30°, the value of δSAP decreases in relation to the corresponding δf.
  • 7752: No AP occurred for any of the geometries analyzed, and joint failure was always cohesive in the adhesive.

4. Conclusions

The present work numerically analyzed, by CZM, the tensile behavior of hydroformed tubular adhesive joints between aluminum adherends for different adhesives and geometric parameters. CZM validation with experimental data of overlap tubular joints (θ = 0°) was undertaken, showing accurate prediction for the AV138 and 2015, although a higher deviation was found for the 7752, which was still found acceptable for design purposes. A parametric study was then numerically undertaken on dENHA, LO, tAd, and θ, for the different adhesives, leading to the following results:
  • dENHA: Led to an increase of Pm for all adhesives. The AV138 provided the best Pm results, followed by the 2015 and 7752. The highest Pm increase was found for the 2015, and was smallest for the AV138 due to its brittleness. ER increased with dENHA for all adhesives, with the same qualitative difference between adhesives as for Pm. AP was highest for the AV138, but with low absolute values, which did not prevent a cohesive failure of the adhesive layer for all joint conditions.
  • LO: Pm increased nearly proportionally with LO for all adhesives within the tested LO range. From best to worse Pm, the order of adhesives was AV138, 2015, 7752. ER showed the same tendency and adhesive ranking, although with higher percentile improvements over the smallest LO of 5 mm. AP showed an exponential increase with LO, reaching almost 4% for the AV138 and LO = 20 mm, but nonetheless failure took place in the adhesive layer for all tested conditions.
  • tAd: Higher tAd provide a Pm improvement, mostly between 1 and 2 mm, while between 2 and 4 mm the differences were minimal. The best results relate to the AV138 and the worst to the 7752. The improvements are moderate compared to the previously mentioned variables. ER decreased with tAd for all adhesives, mostly due to the smaller df. AP reached shortly below 6% for the AV138 and tAd = 1 mm, and highly reduced for bigger tAd. AP was negligible for the remaining adhesives.
  • θ provided the smallest variation in Pm between all variables, and the best results were found for q = 0°. In the observed Pm order of adhesives (highest for the AV138 and lowest for the 7752), the AV138 was affected the most by θ, showing an approximate 5% improvement. ER showed negligible variations with θ. The joint failure was cohesive in the adhesive for all the geometries analyzed, regardless of the adhesive employed. In the case of the 7752, no AP occurred.
Overall, from the obtained results, it can be concluded that the AV138 provides the best Pm and ER results; dENHA and LO significantly affect the joints’ performance, which benefit from higher values of these variables; tAd has a smaller effect, but there is a minimum tAd below which the joints lose performance; and θ has a negligible effect on the joint behavior. θ = 0° is the best solution, but joining of identical cross-section tubes using hydroformed joints, which is a feasible industrial scenario to join identical cross-section tubes, provides a nearly nil disruption to the joint characteristics. Based on the discussed topics, the following are proposals for future work: numerically analyze tubular adhesive joints submitted to torsional and combined loads (due to existing industrial applications), simultaneous variation of two geometric parameters around the factor that contributes the most to Pm (possibly applying statistical methods such as Taguchi for joint optimization), and carry out a market analysis and compare the percentage gains in strength and ductility with the investment required in molds, raw materials, and additional machining work.

Author Contributions

Conceptualization, A.L.F. and R.D.S.G.C.; methodology, R.D.S.G.C.; software, A.L.F.; validation, A.L.F.; formal analysis, A.L.F.; investigation, R.D.S.G.C.; resources, R.D.S.G.C.; data curation, A.L.F.; writing—original draft preparation, A.L.F.; writing—review and editing, R.D.S.G.C.; supervision, R.D.S.G.C. All authors have read and agreed to the published version of the manuscript.

Funding

This research received no external funding.

Data Availability Statement

The raw data supporting the conclusions of this article will be made available by the authors on request.

Conflicts of Interest

The authors declare no conflicts of interest.

References

  1. Kallitsis, N.; Anyfantis, K.N. On the design of composite patch repair for strengthening of marine plates subjected to compressive loads. Modelling 2022, 3, 127–139. [Google Scholar] [CrossRef]
  2. Correia, S.; Anes, V.; Reis, L. Effect of surface treatment on adhesively bonded aluminium-aluminium joints regarding aeronautical structures. Eng. Fail. Anal. 2018, 84, 34–45. [Google Scholar] [CrossRef]
  3. Petrie, E.M. Handbook of Adhesives and Sealants, 2nd ed.; McGraw Hill: New York, NY, USA, 2002. [Google Scholar]
  4. Da Silva, L.F.M.; de Magalhaes, A.G.; de Moura, M.F.S. Juntas Adesivas Estruturais; Publindústria Portugal: Porto, Portugal, 2007. [Google Scholar]
  5. Deng, P.; Guo, J.; Liu, Y.; Yang, B. Damaged tubular t-joints retrofitted with carbon fiber reinforced polymer subjected to monotonic and cyclic loadings. Int. J. Steel Struct. 2021, 21, 299–314. [Google Scholar] [CrossRef]
  6. Sonsino, C.M.; Łagoda, T.; Demofonti, G. Damage accumulation under variable amplitude loading of welded medium- and high-strength steels. Int. J. Fatigue 2004, 26, 487–495. [Google Scholar] [CrossRef]
  7. Lieurade, H.P.; Huther, I.; Lefebvre, F. Effect of weld quality and postweld improvement techniques on the fatigue resistance of extra high strength steels. Weld. World 2008, 52, 106–115. [Google Scholar] [CrossRef]
  8. Ahola, A.; Savolainen, J.; Brask, L.; Björk, T. Fatigue enhancement of welded thin-walled tubular joints made of lean duplex steel. J. Constr. Steel Res. 2024, 218, 108738. [Google Scholar] [CrossRef]
  9. Sorrentino, L.; Parodo, G.; Giuliano, G. Lightweight structures: An innovative method to uniform the thickness of metal sheets by patchwork blanks. Int. J. Lightweight Mater. Manuf. 2022, 5, 20–28. [Google Scholar] [CrossRef]
  10. Lee, D.G.; Kim, J.K.; Cho, D.H. Effects of adhesive fillers on the strength of tubular single lap adhesive joints. J. Adhes. Sci. Technol. 1999, 13, 1343–1360. [Google Scholar]
  11. Lavalette, N.P.; Bergsma, O.K.; Zarouchas, D.; Benedictus, R. Influence of geometrical parameters on the strength of Hybrid CFRP-aluminium tubular adhesive joints. Compos. Struct. 2020, 240, 112077. [Google Scholar] [CrossRef]
  12. Wang, J.; Kang, Y.L.; Qin, Q.H.; Fu, D.H.; Li, X.Q. Identification of time-dependent interfacial mechanical properties of adhesive by hybrid/inverse method. Comput. Mater. Sci. 2008, 43, 1160–1164. [Google Scholar] [CrossRef]
  13. Volkersen, O. Die Nietkraftverteilung in zugbeanspruchten Nietverbindungen mit konstanten Laschenquerschnitten. Luftfahrtfor Schung 1938, 15, 41–47. [Google Scholar]
  14. Adams, R.; Peppiatt, N. Stress analysis of adhesive-bonded lap joints. J. Strain Anal. 1974, 9, 185–196. [Google Scholar] [CrossRef]
  15. Harris, J.A.; Adams, R.A. Strength prediction of bonded single lap joints by non-linear finite element methods. Int. J. Adhes. Adhes. 1984, 4, 65–78. [Google Scholar] [CrossRef]
  16. Sosa, J.C.; Karapurath, N. Delamination modelling of GLARE using the extended finite element method. Compos. Sci. Technol. 2012, 72, 788–791. [Google Scholar] [CrossRef]
  17. Gribanov, I.; Taylor, R.; Thijssen, J.; Fuglem, M. Investigating Ice Loads on Subsea Pipelines with Cohesive Zone Model in Abaqus. Modelling 2023, 4, 394–407. [Google Scholar] [CrossRef]
  18. Stein, N.; Felger, J.; Becker, W. Analytical models for functionally graded adhesive single lap joints: A comparative study. Int. J. Adhes. Adhes. 2017, 76, 70–82. [Google Scholar] [CrossRef]
  19. Razavi, S.M.J.; Ayatollahi, M.R.; Majidi, H.R.; Berto, F. A strain-based criterion for failure load prediction of steel/CFRP double strap joints. Compos. Struct. 2018, 206, 116–123. [Google Scholar] [CrossRef]
  20. Dionísio, J.; Ramalho, L.; Sánchez-Arce, I.; Campilho, R.; Belinha, J. Fracture mechanics approach to stress singularities in composite adhesive joints. Compos. Struct. 2021, 276, 114507. [Google Scholar] [CrossRef]
  21. Zhang, Q.; Cheng, X.; Cheng, Y.; Li, W.; Hu, R. Investigation of tensile behavior and influence factors of composite-to-metal 2D-scarf bonded joint. Eng. Struct. 2019, 180, 284–294. [Google Scholar] [CrossRef]
  22. Huang, J.; Zeng, J.; Bai, Y.; Cheng, Z.; Wang, Y.; Zhao, Q.; Liang, D. Effect of adhesive layer properties on the shear strength of single-lap structures of dissimilar materials based on the cohesive zone model. J. Mech. Sci. Technol. 2021, 35, 133–143. [Google Scholar] [CrossRef]
  23. Sun, L.; Tie, Y.; Hou, Y.; Lu, X.; Li, C. Prediction of failure behavior of adhesively bonded CFRP scarf joints using a cohesive zone model. Eng. Fract. Mech. 2020, 228, 106897. [Google Scholar] [CrossRef]
  24. Ahmad, H.; Crocombe, A.D.; Smith, P.A. Strength prediction in CFRP woven laminate bolted double-lap joints under quasi-static loading using XFEM. Compos. Part. A Appl. Sci. Manuf. 2014, 56, 192–202. [Google Scholar] [CrossRef]
  25. Ma, X.; Bian, K.; Liu, H.; Wang, Y.; Xiong, K. Numerical and experimental investigation of the interface properties and failure strength of CFRP T-Stiffeners subjected to pull-off load. Mater. Des. 2020, 185, 108231. [Google Scholar] [CrossRef]
  26. Kwon, J.W.; Lee, D.G. The effects of surface roughness and bond thickness on the fatigue life of adhesively bonded tubular single lap joints. J. Adhes. Sci. Technol. 2000, 14, 1085–1102. [Google Scholar] [CrossRef]
  27. Albiez, M.; Vallée, T.; Fricke, H.; Ummenhofer, T. Adhesively bonded steel tubes—Part I: Experimental investigations. Int. J. Adhes. Adhes. 2019, 90, 199–210. [Google Scholar] [CrossRef]
  28. Nguyen, V.; Kedward, K.T. Non-linear modeling of tubular adhesive scarf joints loaded in tension. J. Adhes. 2001, 76, 265–292. [Google Scholar] [CrossRef]
  29. Esmaeel, R.A.; Taheri, F. Influence of adherend’s delamination on the response of single lap and socket tubular adhesively bonded joints subjected to torsion. Compos. Struct. 2011, 93, 1765–1774. [Google Scholar] [CrossRef]
  30. Hosseinzadeh, R.; Shahin, K.; Taheri, F. A simple approach for characterizing the performance of metallic tubular adhesively-bonded joints under torsion loading. J. Adhes. Sci. Technol. 2007, 21, 1613–1631. [Google Scholar] [CrossRef]
  31. Oh, J.H. Strength prediction of tubular composite adhesive joints under torsion. Compos. Sci. Technol. 2007, 67, 1340–1347. [Google Scholar] [CrossRef]
  32. Choi, J.K.; Lee, D.G. Torque transmission capabilities of bonded polygonal lap joints for carbon fiber epoxy composites. J. Adhes. 1995, 48, 235–250. [Google Scholar] [CrossRef]
  33. Breckner, M. Hydraulic systems for hydroforming. In Proceedings of the International Conference on Hydroforming, Stuttgart, Germany, 12–13 October 1999; pp. 12–13. [Google Scholar]
  34. Andelfinger, U.; Ramm, E. EAS-elements for two-dimensional, three-dimensional, plate and shell structures and their equivalence to HR-elements. Int. J. Numer. Methods Eng. 1993, 36, 1311–1337. [Google Scholar] [CrossRef]
  35. Simo, J.C.; Rifai, M. A class of mixed assumed strain methods and the method of incompatible modes. Int. J. Numer. Methods Eng. 1990, 29, 1595–1638. [Google Scholar] [CrossRef]
  36. Hughes, T.J. The Finite Element Method Prentice-Hall; Prentice-Hall, Inc.: Englewood Cliffs, NJ, USA, 1987. [Google Scholar]
  37. Faria, A.L.; Campilho, R.D.S.G. Parametric analysis of composite tubular joints bonded by the bi-adhesive technique. Acad. Mat. Sci. 2024, 1, 1–10. [Google Scholar]
  38. Nunes, S.L.S.; Campilho, R.D.S.G.; da Silva, F.J.G.; de Sousa, C.C.R.G.; Fernandes, T.A.B.; Banea, M.D.; da Silva, L.F.M. Comparative failure assessment of single and double-lap joints with varying adhesive systems. J. Adhes. 2016, 92, 610–634. [Google Scholar] [CrossRef]
  39. Campilho, R.D.S.G.; Banea, M.D.; Pinto, A.M.G.; da Silva, L.F.M.; de Jesus, A.M.P. Strength prediction of single- and double-lap joints by standard and extended finite element modelling. Int. J. Adhes. Adhes. 2011, 31, 363–372. [Google Scholar] [CrossRef]
  40. Campilho, R.D.S.G.; Banea, M.D.; Neto, J.A.B.P.; da Silva, L.F.M. Modelling adhesive joints with cohesive zone models: Effect of the cohesive law shape of the adhesive layer. Int. J. Adhes. Adhes. 2013, 44, 48–56. [Google Scholar] [CrossRef]
  41. Faneco, T.M.S.; Campilho, R.D.S.G.; Silva, F.J.G.; Lopes, R.M. Strength and fracture characterization of a novel polyurethane adhesive for the automotive industry. J. Test. Eval. 2017, 45, 398–407. [Google Scholar] [CrossRef]
  42. Sugiman, S.; Ahmad, H. Comparison of cohesive zone and continuum damage approach in predicting the static failure of adhesively bonded single lap joints. J. Adhes. Sci. Technol. 2017, 31, 552–570. [Google Scholar] [CrossRef]
  43. Carneiro Neto, R.M.; Sampaio, E.M.; Assis, J.T. Numerical and experimental analysis of bonded joints with combined loading. Int. J. Adhes. Adhes. 2019, 90, 61–70. [Google Scholar] [CrossRef]
  44. Álvarez, D.; Blackman, B.; Guild, F.; Kinloch, A. Mode I fracture in adhesively-bonded joints: A mesh-size independent modelling approach using cohesive elements. Eng. Fract. Mech. 2014, 115, 73–95. [Google Scholar] [CrossRef]
  45. Tserpes, K.; Barroso-Caro, A.; Carraro, P.A.; Beber, V.C.; Floros, I.; Gamon, W.; Kozłowski, M.; Santandrea, F.; Shahverdi, M.; Skejić, D.; et al. A review on failure theories and simulation models for adhesive joints. J. Adhes. 2022, 98, 1855–1915. [Google Scholar] [CrossRef]
  46. Rocha, R.; Campilho, R. Evaluation of different modelling conditions in the cohesive zone analysis of single-lap bonded joints. J. Adhes. 2018, 94, 562–582. [Google Scholar] [CrossRef]
  47. Dragoni, E.; Goglio, L. Adhesive stresses in axially-loaded tubular bonded joints—Part I: Critical review and finite element assessment of published models. Int. J. Adhes. Adhes. 2013, 47, 35–45. [Google Scholar] [CrossRef]
Figure 1. σ-ε curves for the AW6082-T651 aluminum alloy and numerical approximation [38].
Modelling 05 00052 g001
Figure 2. Base geometry and assigned symbology [37].
Modelling 05 00052 g002
Figure 3. Mesh created for a sample joint configuration and overlap edge details.
Modelling 05 00052 g003
Figure 4. CZM validation: Pm vs. LO data.
Modelling 05 00052 g004
Figure 5. (a) P-d curves obtained as a function dENHA for the 2015 and (b) Pm vs. dENHA curves for all adhesives.
Modelling 05 00052 g005
Figure 6. Evolution of ER as a function of dENHA and the adhesive used.
Modelling 05 00052 g006
Figure 7. Evolution of P and AP at the critical node as a function of δ, for dENHA = 20 mm, and (a) the adhesives AV138, (b) 2015, and (c) 7752; (d) summary of AP results for all adhesives.
Modelling 05 00052 g007aModelling 05 00052 g007b
Figure 8. (a) P-δ curves obtained as a function of LO for the 2015 and (b) Pm vs. LO curves for all adhesives.
Modelling 05 00052 g008
Figure 9. Evolution of ER as a function of LO and the adhesive used.
Modelling 05 00052 g009
Figure 10. Evolution of P and AP at the critical node as a function of δ, for LO = 20 mm, and the adhesives AV138 (a), 2015 (b), and 7752 (c); summary of AP results for all adhesives (d).
Modelling 05 00052 g010aModelling 05 00052 g010b
Figure 11. (a) P-δ curves obtained as a function of tAd for the AV138 and (b) Pm vs. tAd curves for all adhesives.
Modelling 05 00052 g011
Figure 12. Evolution of ER as a function of tAd and the adhesives used.
Modelling 05 00052 g012
Figure 13. Evolution of P and AP at the critical node as a function of δ, for tAd = 4 mm, and the adhesives AV138 (a), 2015 (b), and 7752 (c); summary of AP results for all adhesives (d).
Modelling 05 00052 g013aModelling 05 00052 g013b
Figure 14. (a) P-δ curves obtained as a function of tAd for the AV138 and (b) Pm vs. θ curves for all adhesives.
Modelling 05 00052 g014
Figure 15. Evolution of E R as a function of θ and the adhesives used.
Modelling 05 00052 g015
Figure 16. Evolution of P and AP at the critical node as a function of δ, for θ = 60°, and the adhesives AV138 (a), 2015 (b), and 7752 (c); summary of AP results for all adhesives (d).
Modelling 05 00052 g016aModelling 05 00052 g016b
Table 1. Measured mechanical properties of the adherends (AW6082-T651 aluminum alloy).
Adherend MaterialAW6082-T651 Aluminum Alloy
Young’s modulus, E [GPa]70.07 ± 0.83
Tensile yield stress, σe [MPa]261.67 ± 7.65
Tensile strength, σf [MPa]324.00 ± 0.16
Tensile failure strain, εf [%]21.70 ± 4.24
Table 2. Mechanical and fracture properties of the selected adhesives [39,40,41].
PropertyAV13820157752
Young’s modulus, E [GPa]4.89 ± 0.811.85 ± 0.210.49 ± 0.09
Poisson’s ratio, ν0.35 a0.33 a0.30 a
Tensile yield stress, σe [MPa]36.49 ± 2.4712.63 ± 0.613.24 ± 0.48
Tensile strength, σf [MPa]39.45 ± 3.1821.63 ± 1.6111.48 ± 0.25
Tensile failure strain, εf [%]1.21 ± 0.104.77 ± 0.1519.18 ± 1.40
Shear modulus, G [GPa]1.81 b0.70 b0.19 b
Shear yield stress, τe [MPa]25.1 ± 0.3314.6 ± 1.35.16 ± 1.14
Shear strength, τf [MPa]30.2 ± 0.4017.9 ± 1.810.17 ± 0.64
Shear failure strain, γf [%]7.8 ± 0.743.9 ± 3.454.82 ± 6.38
Toughness in tension, GIC [N/mm]0.20 c0.43 ± 0.022.36 ± 0.17
Toughness in shear, GIIC [N/mm]0.38 c4.70 ± 0.345.41 ± 0.47
a Manufacturer’s data. b Estimated from Hooke’s law using E and ν. c Estimated in reference [39].
Table 3. CZM validation: quantitative Pm and relative deviations [37].
AV13820157752
LO [mm]204020402040
Experimental avg. [N]32,79737,85727,23839,06723,85635,930
Numerical [N]33,56839,63128,89740,21019,45530,779
Relative deviation [%]2.44.76.12.9−18.4−14.3
Disclaimer/Publisher’s Note: The statements, opinions and data contained in all publications are solely those of the individual author(s) and contributor(s) and not of MDPI and/or the editor(s). MDPI and/or the editor(s) disclaim responsibility for any injury to people or property resulting from any ideas, methods, instructions or products referred to in the content.