Article

AscentAM: A Software Tool for the Thermo-Mechanical Process Simulation of Form Deviations and Residual Stresses in Powder Bed Fusion of Metals Using a Laser Beam

1
Technical University of Munich, TUM School of Engineering and Design, Institute for Machine Tools and Industrial Management (iwb), Boltzmannstr. 15, 85748 Garching, Germany
2
MTU Aero Engines AG, Dachauer Straße 665, 80995 Munich, Germany
*
Author to whom correspondence should be addressed.
Modelling 2024, 5(3), 841-860; https://doi.org/10.3390/modelling5030044
Submission received: 30 May 2024 / Revised: 2 July 2024 / Accepted: 9 July 2024 / Published: 15 July 2024
(This article belongs to the Special Issue Finite Element Simulation and Analysis)

Abstract

:
Due to the tool-less fabrication of parts and the high degree of geometric design freedom, additive manufacturing is experiencing increasing relevance for various industrial applications. In particular, the powder bed fusion of metals using a laser beam (PBF-LB/M) process allows for the metal-based manufacturing of complex parts with high mechanical properties. However, residual stresses form during PBF-LB/M due to high thermal gradients and a non-uniform cooling. These lead to a distortion of the parts, which reduces the dimensional accuracy and increases the amount of post-processing necessary to meet the defined requirements. To predict the resulting residual stress state and distortion prior to the actual PBF-LB/M process, this paper presents the finite-element-based simulation tool AscentAM with its core module and several sub-modules. The tool is based on open-source programs and utilizes a sequentially coupled thermo-mechanical simulation, in which the significant influences of the manufacturing process are considered by their physical relations. The simulation entirely emulates the PBF-LB/M process chain including the heat treatment. In addition, algorithms for the part pre-deformation and the export of a machine-specific file format were implemented. The simulation results were verified, and an experimental validation was performed for two benchmark geometries with regard to their distortion. The application of the optimization sub-module significantly minimized the form deviation from the nominal geometry. A high level of accuracy was observed for the prediction of the distortion at different manufacturing states. The process simulation provides an important contribution to the first-time-right manufacturing of parts fabricated by the PBF-LB/M process.

1. Introduction

In contrast to conventional technologies, metal-based additive manufacturing represents a tool-less manufacturing process and provides a key technology for fabricating complex part geometries [1]. It is mainly used for automotive, medical and aerospace applications [2]. In particular, powder bed fusion of metals using a laser beam (PBF-LB/M) allows for the fabrication of near-net-shape parts with good mechanical properties [3,4]. The parts are manufactured on a build platform using a high-power laser, which melts a powder material in a defined cross-sectional area [5]. During the subsequent cooling, the part solidifies [6]. Afterwards, the build platform is lowered and a new powder layer is applied. This layer-wise procedure is repeated in an inert gas atmosphere until the three-dimensional part is completed [7]. Oftentimes, the parts are sawn off the build platform after further optional post-processing steps have been applied.
During PBF-LB/M, high temperature gradients and the non-uniform cooling rates in the parts cause thermally induced macroscopic residual stresses [8,9]. These stresses lead to a distortion of the parts [10,11] and a reduced dimensional accuracy, often accompanied by the formation of cracks [12,13]. The resulting deformations represent one of the main challenges in this manufacturing process [14,15]. Different practical and theoretical approaches are available to address this challenge. Applying practical approaches, the dimensional accuracy can be increased by a trial-and-error principle, in which parts are manually re-designed and evaluated after the PBF-LB/M process. Also, additional support structures can be included, which results in a higher post-processing effort. In contrast, theoretical models, such as numerical process simulations, can be utilized to achieve first-time-right manufacturing [11]. These process simulations need to consider the geometry, the chemical composition, the microstructure, the residual stresses and the thermo-mechanical history [16]. These aspects can be particularly adressed by finite element (FE) models, which makes them suitable for predicting the PBF-LB/M process.
For FE models, the main challenge is the appropriate representation of the different time and length scales in the process. Therefore, a distinction is made between simulations using the actual layer dimensions (mesoscale) and those that combine actual layers in several layer compounds (LCs) for large workpieces (macroscale) [17]. While mesoscale models consider the local physical effects in detail, the macroscale models require certain model simplifications. Two approaches are currently available for modeling the macroscopic component behavior: a purely mechanical model and a thermo-mechanical model.
A purely mechanical model applies an inherent strain vector [18,19,20] or a mechanical layer equivalent to model the distortion behavior [21]. This approach can provide valid predictions of the distribution of the residual stress state near the surface for simple parts [22], while the transfer to complex parts might be limited due to geometric characteristics [23]. In contrast, a thermo-mechanical model can represent the thermally induced manufacturing process with actual melting by using a heat source. By means of the latter, a temperature load [24] or a heat flux [25,26,27] can be applied to the part geometry. The modeled temperature fields are subsequently transferred to the mechanical model to calculate the deformations and residual stresses according to the thermal expansion. Due to the consideration of the thermal history, this approach is particularly suitable for complex component geometries.
Hence, thermo-mechanical models are used to simulate the build-up process with a subsequent heat treatment [26,28]. However, previous publications only dealt with the predictive simulation of specific aspects of the PBF-LB/M process. The capabilities of an experimentally validated PBF-LB/M process simulation framework used to optimize the part distortion, to export machine-ready data formats, and to perform an uncertainty quantification for different manufacturing states have not been investigated yet. This paper presents the sequentially coupled thermo-mechanical process simulation tool AscentAM using a physics-based approach. To reduce the computation time, the process simulation considers macroscale effects. In Section 2, the working principle of the software framework is explained. In Section 3, two benchmark geometries, the applied simulation settings and the experimental layouts are described. These methods were used for a mesh convergence study and an experimental validation, the results of which are discussed in Section 4.

2. Simulation Framework

Within the thermo-mechanical simulation tool AscentAM, the fundamental phases of the PBF-LB/M process are represented to predict the residual stress states and the resulting part deformation. The structural layout of the process simulation is depicted in Figure 1, where the core module is shown with its functional blocks. The sub-modules represent optional extensions to the process simulation. The processing of the simulation data is performed using a Python3 routine. The numerical solution is provided by the open-source FE software CalculiX CrunchiX (CCX) [29], which can be extended by user-defined subroutines.
Prior to the simulation, the part geometry and the support structure, if required, need to be virtually positioned on the build platform. To reduce the computation time, the support structure is considered as a 3D continuum [30] with a block, a diamond or a bulk support implemented in AscentAM. After the positioning, all components are discretized by an FE mesh. Together with the simulation-specific parameters, the meshed geometry represents the input data for the simulation and is transferred into the core module, which comprises the pre-processing, the thermal analysis and the structural analysis. During the pre-processing, the part is virtually sliced into LCs, and the solver input files are automatically generated. In the subsequent thermal analysis, the nodal temperature field resulting during the PBF-LB/M process is determined for various manufacturing states. The temperature field is applied as a boundary condition within the building process of the structural analysis, which results in a sequentially coupled thermo-mechanical procedure. The building process is followed by the calculation of the optional heat treatment, as well as the part and support separation. If desired, various sub-modules can be activated. The optimization sub-module iteratively pre-deforms the part geometry based on the structural results using a non-linear algorithm. With the exportation sub-module, the part geometries can be extracted for different manufacturing states into a standard tessellation language (STL) file, which can be directly used for the physical build job preparation. An uncertainty quantification (UQ) sub-module can be executed to identify the main parameters, such as specific material properties, influencing the simulation results.

2.1. Core Module

The core module of the simulation tool can be interpreted as a holistic representation of the PBF-LB/M process, emulating the main manufacturing phases. The functional blocks, which are implemented in the core module, are presented in the following sections.

2.1.1. Pre-Processing

To provide a user-friendly application of the process simulation, the slicing of the meshed geometry into LCs is performed after the part and build platform have been discretized by linear or quadratic tetrahedral FEs. All LCs feature the same height and consist of several real layers, which regularly possess a layer height between 20 µm and 100 µm [31]. The assignment of the FEs to the corresponding LC is realized based on the center of gravity of each element. This leads to a non-planar, crinkled interface between the LCs. Figure 2a illustrates an exemplary part with eight LCs, four of them highlighted with the respective top and bottom nodes. It is recommended that the ratio of the maximum element size e to the LC height L is chosen to be e / L 0.50. This ensures having at least three nodes available within a newly activated LC along its height so that the thermal load is applied properly during the heating step of each LC.
The node and the element sets of the part, the build platform and the previously sliced LCs are stored in the definitions file. The latter also contains the parameters of the utilized materials, which are specified by the thermal expansion coefficients, the elastic and plastic mechanical properties, the creep law, the density, the thermal conductivity coefficients and the specific heat capacities. Both, isotropic and anisotropic materials can be simulated, whereby the respective material properties need to be specified as a function of the temperature. The definitions file is included in the thermal and structural CCX input files as this information provides the foundation for the corresponding analyses.

2.1.2. Thermal Building Process

The solver-specific CCX commands to simulate the thermal building process are stored in the thermal input file. At the beginning of the thermal analysis, the initial thermal conditions and the control parameters for the applied FE solver are specified before the heating and cooling steps of each LC are listed. In each computational step, the nodal temperature field is determined by solving the transient heat conduction equation:
ρ c T t = · ( k T ) + Q
Hereby, ρ is the density, c represents the specific heat capacity and k indicates the thermal conductivity of the utilized temperature-dependent material. The variables T, t and Q represent the temperature, the time and the heat flux, respectively. Phase changes and latent heat are not considered due their minor impact on the global heat transfer [17]. For the formation of residual stresses and distortion, only the solid state is relevant.
During the heating step, a flash exposure heat source with a linear temperature gradient is applied due to its computational efficiency. The corresponding temperatures are illustrated in Figure 2b for the currently activated LC. The temperature load is provided by a CCX user-defined subroutine, which imposes a temperature boundary condition for all nodes of the topmost active LC at once. The temperature in the z-direction is determined based on the position of the nodes within the currently heated LC. The temperature gradient over the LC height L results from the melting temperature T M at the topmost nodes and the process temperature T P , representing the temperature in the heat-affected zone at the bottom nodes in the respective LC. An extrapolation of this linear temperature gradient to nodes outside this LC is not performed. Underneath the active LC, the temperatures are calculated depending on the material properties. The temperature T BP is applied to the bottom nodes of the build platform as a boundary condition.
The subsequent computational steps—ten by default—consider the cooling due to heat conduction and convection phenomena. By incorporating a flux boundary condition h part on the top nodes of the topmost active LC only, the convective characteristics introduced due to an inert gas flow are also considered. Another flux boundary condition h platform is assigned to the build platform sides during the entire thermal simulation. Due to using aggregated LCs instead of real layer heights, the time scale was adapted by introducing the characteristic factor η . It considers the relative scaling of spatial measures and was derived from the analytical solution of the one-dimensional heat equation [32]:
η = L l 2
The square ratio of the LC height L and the real layer height l allows for the correct reheating of already solidified LCs [32]. Hence, a certain node within an LC passes the same thermal history as for the real layer height l. The cooling time for the LC t L is calculated from the time t l for manufacturing the real layer and the characteristic factor η :
t L t l = η t L = t l · η
After the current LC has been simulated with regard to the heating step and the defined number of cooling steps, the next LC is calculated. This LC is activated using the element birth and death method [33]. Subsequently, the explained procedure is repeated until the whole part is thermally analyzed. For the final LC of a part, two additional computational steps are performed, which represent the final cooling to the ambient temperature T amb after the part has been built.

2.1.3. Structural Building Process

To predict the deformation, the strain and the residual stresses resulting from the PBF-LB/M process, a non-linear mechanical analysis is performed. The governing equations, which are solved by the applied CCX solver, can be expressed as follows [34,35]:
· σ = · C ε e = 0
The second-order stress tensor σ is associated with the material behavior law. The parameters C and ε e are the fourth-order material stiffness tensor and the second-order elastic strain tensor, respectively. The total strain tensor ε can be calculated from the elastic strain ε e , the plastic strain ε p and the thermal strain ε t h or the displacement vector u [36]:
ε = ε e + ε p + ε t h = 1 2 u + ( u ) T
The structural CCX input file shows the same structure as the thermal CCX input file, which contains the initial thermal conditions and the numerical control parameters. Subsequently, the mechanical boundary conditions for the fixation of the boreholes of the build platform are defined. The nodal temperature field from the previously calculated thermal building process is imported as a boundary condition in the heating and cooling steps of each newly activated LC.
The activation of a new LC is performed as a solid material using a combination of the element birth and death method [37] and the semi-quiet element activation procedure [33]. To ensure that a new LC is activated free of load, its material properties are changed in a three-step approach according to Bayerlein [38].
First, the elements of the new LC are activated using a purely elastic material with a significantly reduced stiffness (e.g., 10 MPa), while the top nodes of the newly activated LC are fixed. Second, the material of the activated LC is changed to an ideal plastic material converting the elastic strains into plastic strains. This procedure incorporates the self-healing effect, which describes the exposure of new layers at their nominal position regardless of the deformation of the previous layers during PBF-LB/M. Third, the fixation of the top nodes of the newly activated LC is removed and the actual solid material properties are assigned to the FEs. This activation method is repeated for all LCs until the whole part geometry is simulated according to the PBF-LB/M process.
After the structural simulation of the additive build-up of all LCs and the cooling to room temperature has been performed, the build platform is fixated to be statically determined. For this, three nodes are randomly selected in the corner areas of the build platform. Subsequently, the opening of the screws is simulated by removing the mechanical constraints from the boreholes of the build platform.

2.1.4. Heat Treatment

After the structural building process, the parts typically exhibit a high concentration of residual stresses. These lead to a reduced dimensional accuracy due to deformations after the separation process [39,40]. To avoid an additional deformation during the separation, stress relief annealing (SRA) can be performed. The heating, the actual annealing and the final cooling phase of the SRA heat treatment are defined by a time-temperature curve, which is applied as a thermal load in the respective simulation step. To model the additional deformation during the heat treatment, a Larson-Miller creep model [41] was implemented. The Larson-Miller-Parameter P is calculated either by a logarithmic relationship of the temperature T and the time t, or by the stress σ :
P = T · C + log ( t ) = A 0 + A 1 · log ( σ )
The parameters C, A 0 and A 1 indicate the model constants, which need to be experimentally calibrated for the used material, respectively. The creep model was implemented as a CCX user subroutine being considered in a visco-elastic material model. As the FE program does not distinguish between creep and plastic strain, the hardening effect due to plastic deformation is taken into account besides the creep mechanism.

2.1.5. Part and Support Separation

The final step within the structural analysis is the separation of the part and the support structure from the build platform. In reality, the part can be separated by sawing or electrical discharge machining (EDM). To model this separation mechanism after the desired manufacturing phase, the FEs of the build platform are removed successively along the separation direction. For this, the element death method [33] is used. The separation can be divided into a user-defined number of sequential computational steps to simulate the process-specific separation speed. To prevent a rigid-body displacement of the part after a complete separation from the build platform, a statistically determined fixation is applied to the part. As depicted in Figure 3, this procedure allows for the local and temporal calculation of the residual stress release, which results in an additional part distortion.
If desired, the separation process between the part and the support structure can also be simulated analogously to the modeling approach described previously. In the structural analysis, this computational step is performed after the part and support structure have been separated from the build platform.

2.2. Sub-Modules

In AscentAM, optional sub-modules are available to optimize the dimensional accuracy of the part, to export the part geometries or to perform a UQ identifying the main influencing parameters during the process simulation. The implemented sub-modules are explained in the following subsections.

2.2.1. Optimization

A non-linear optimization algorithm according to Bayerlein et al. [11] was implemented to compensate for the part deformation that results from the PBF-LB/M process. The node coordinates of the part geometry, which are described by the vector c , are optimized separately [38]:
c i + 1 = c i Δ i = c i c i c target
The current form deviation Δ i is calculated from the difference between the deformed node coordinates c i and the undeformed node coordinates c target . If the current form deviation Δ i is larger than the user-defined tolerance, the initial node coordinates of the part geometry are pre-deformed inversely to the form deviation. The structural building process, the heat treatment and the part separation are repeated to simulate the deformed node coordinates c i + 1 resulting from the pre-deformed mesh c i + 1 . The optimized node coordinates are reached as soon as a further iteration i does not alter the node coordinates above the specified tolerance. This iterative optimization incorporates the non-linearities during the structural analysis. In contrast to a simple inverse pre-deformation, this approach increases the accuracy of the results.
During the optimization, the interface between the part and the build platform needs to remain within the x-y-plane to avoid a build failure due to a lack of cohesion or an excessive deformation resulting from a reduced stiffness. This is realized by excluding the z-coordinates of the interface nodes during the optimization. Since a slight variation of the temperature gradient during the heating step showed no significant effect on the part distortion [11], the thermal simulation does not need to be repeated.

2.2.2. Exportation

This sub-module enables the export of the numerical results to an STL or Visualization Toolkit data format. These data format can be directly used as an input for preparing the physical PBF-LB/M process or other post-processing tools. The discretized part geometry is used to export these data formats. From the FE mesh, all surface elements are detected along with their orientation for a desired computational step to extract the external surfaces. By doing so, the nominal, the deformed and the pre-deformed part geometry can be exported. Further simulation settings can be defined by the user to export the part with or without the build platform and support structures. In addition, different part views can be generated automatically based on the simulation results.

2.2.3. Uncertainty Quantification

Besides experimental results, simulations can also be subject to fluctuations depending on the selected user-defined simulation settings. Hence, it is necessary to gain a deeper understanding of the interaction of different factors and their contribution to result quantities. Therefore, the probability bounds analysis (PBA) [42] in the context of sensitivity analysis and UQ was implemented in the process simulation.
The PBA is intended to correctly propagate two kinds of uncertainty, namely naturally varying, non-reducible (aleatory) factors and epistemic factors that cannot be characterized by a probability function due to a lack of knowledge, e.g., if a certain influence is not known. The UQ sub-module allows for designing a study for a given geometry by providing an arbitrary number of aleatory and epistemic factors. These can either be absolute values or multipliers that are applied to the nominal values. After designing the sequence of analyses, a sampling is conducted and the individual simulations are started.
The application of this sub-module is presented by Bayerlein [38], who determined qualitative measures of the contributions of individual material properties to the variability of the part distortion. Hence, the predictive capability of the simulation model can be assessed and helpful insights into an improvement of a part can be generated.

3. Materials and Methods

The AscentAM tool was applied to investigate the distortion of parts manufactured by the PBF-LB/M process. In this section, two part geometries, the simulation procedure and the experimental procedure used for the validation of the simulation tool are described.

3.1. Part Geometries

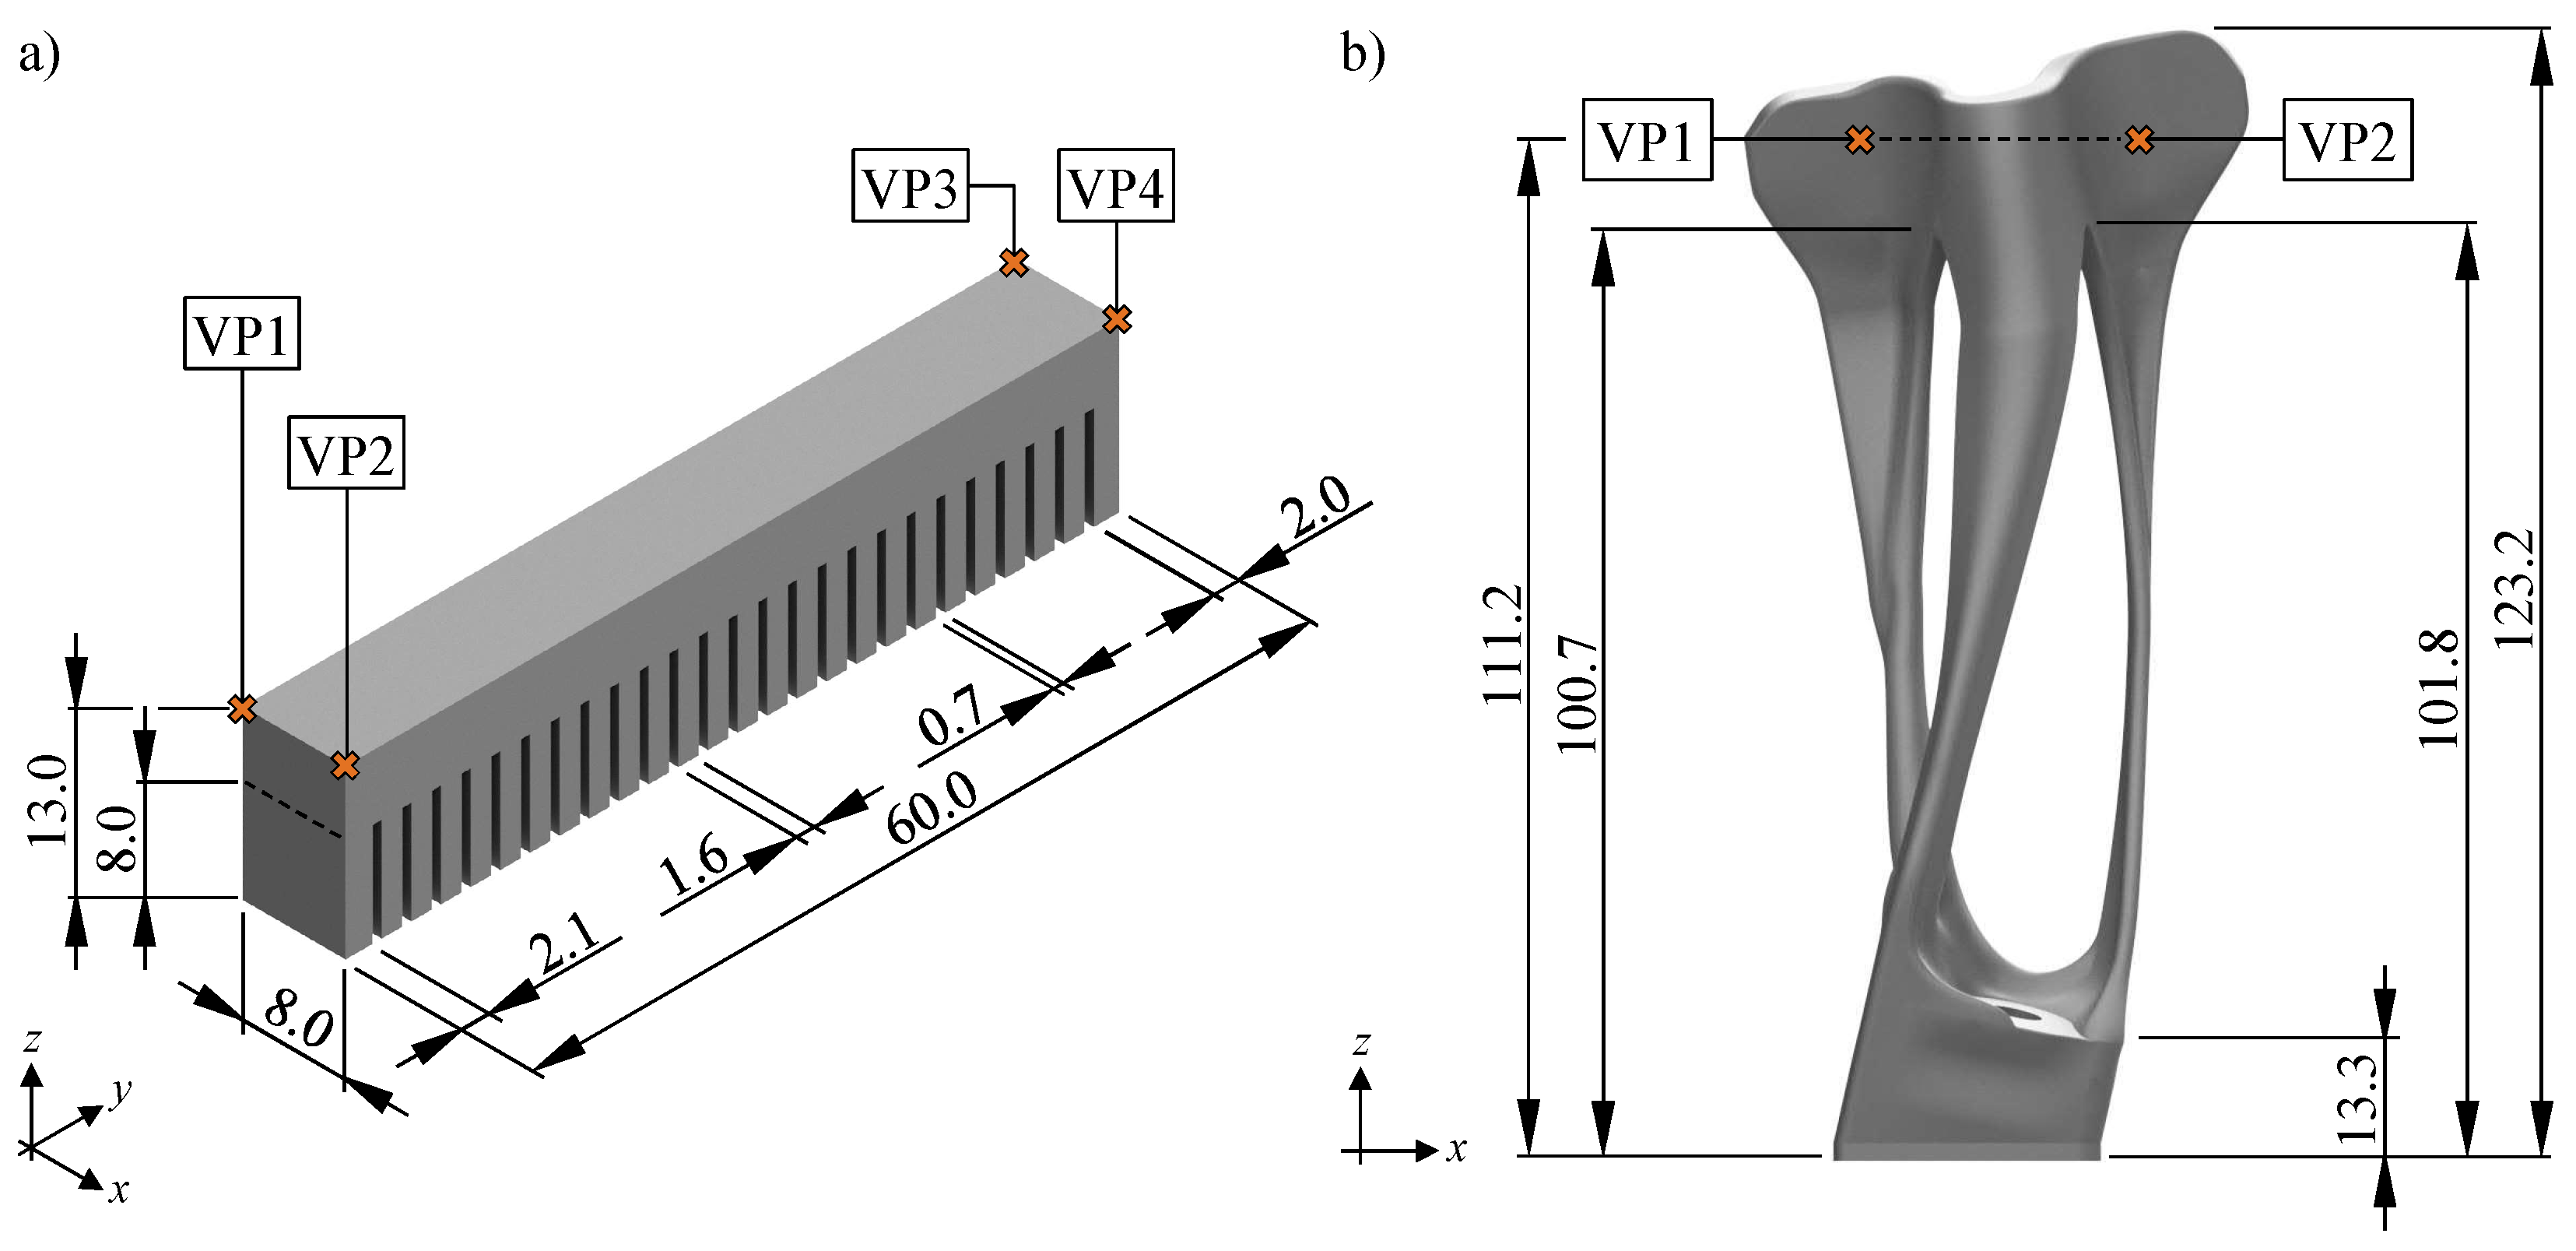
Two different part geometries, which are depicted in Figure 4 with their dimensions, were used in this work to demonstrate the capabilities of the simulation tool. In previous investigations, application-related parts, such as a turbine blade or a panel geometry, were analyzed using AscentAM [38]. The parts in this work, however, are intended to cover simpler and more complex geometry features, both leading to high distortions.
The cantilever beam [43] in Figure 4a represents a simple, academic part featuring a high residual stress state after the manufacturing, which is favored by the structural transition in a height of 8.0 mm, at which 26 pillars merge. The cantilever beam is generally applied to calibrate process simulations that use the inherent strain method and, therefore, serves as an ideal comparison geometry between different process simulation tools.
In contrast, the topology-optimized bracket [44] provides an industrial application, which shows a high level of deformation as a result of the PBF-LB/M process (see Figure 4b). The bracket is used to fasten oil pipes in a turbine engine and fulfills a safety-critical function. The areas to the left and right above the structural transition require a particularly high prediction accuracy of the distortion since these need to be post-processed.

3.2. Simulative Procedure

The placement of the parts on the build platform was performed with the computer-aided design program Inventor 2023 (Autodesk GmbH, Munich, Germany), whereby the center of the top side of the build platform coincides with the coordinate origin. The software HyperMesh 2019.1 (Altair Engineering GmbH, Munich, Germany) was used to discretize the part geometries by linear tetrahedral elements. The minimum element size was defined to be 10% of the respective maximum element size e, while a growth rate of 1.00 was maintained for the FEs during the meshing. All simulations were performed on a high-performance SUSE Enterprise Linux 15.2 server with 80× Intel® Xeon Gold 6248 2.50 GHz CPUs and 768 GB of RAM (Dell GmbH, Frankfurt am Main, Germany).
The heating of a newly activated LC was performed with the flash exposure heat source applying a linear temperature gradient, which is depicted in Figure 2b. The applied temperatures and convection coefficients are listed in Table 1. Ten computational steps represented the cooling phase after each heating step of a newly activated LC. Following the works of Seidel [24] and Bayerlein [38], the steel C45 and the nickel-based superalloy Inconel 718 were chosen as materials for the build platform and the parts, respectively. Both materials were defined to be isotropic, elasto-plastic and their parameters to be temperature-dependent. Using the experimental creep data from Bayerlein [38], the model constants in Equation (6) were determined to be C = 33.00 , A 0 = 56.76 and A 1 = 8.46 for the material Inconel 718.
The element sizes and LC heights applied in the simulation depend on the performed investigation. Hence, a convergence study was executed to ensure results in the FE simulations that are independent from the mesh size and the LC. Therefore, the element sizes, along with the LC heights, were continuously decreased. It was made sure that the latter was at least twice as high as the chosen element sizes.
For the cantilever beam, the maximum element sizes e were set to discrete values: e 1 = 4.00 mm, e 2 = 2.00 mm, e 3 = 1.00 mm, e 4 = 0.50 mm and e 5 = 0.25 mm. The LC heights were chosen to be L 1 = 8.00 mm, L 2 = 4.00 mm, L 3 = 2.00 mm, L 4 = 1.00 mm and L 5 = 0.50 mm. A two-dimensional convergence study was simulated so that each element size was combined with each LC height, if the element size was smaller than the respective LC height. In contrast, a reduced mesh convergence study was performed for the bracket geometry. The parts were meshed with the element sizes e 1 = 2.00 mm, e 2 = 1.50 mm, e 3 = 1.00 mm and e 4 = 0.50 mm, while the LC heights L i corresponded to twice the element size in each performed process simulation.
The deformations at the verification points, which are highlighted in Figure 4 for the two part geometries, were evaluated using the root mean square (RMS). The distortion was determined for the computational step after the screws were opened, but before the parts were separated from the build platform. Depending on the results of the convergence study, which are presented in Section 4.1, the element sizes and LC heights were chosen for the experimental validation. This was done independently for the cantilever beam and the topology-optimized bracket.

3.3. Experimental Procedure

The results of the process simulation were compared with the as-built part geometries for the experimental validation. In each case, AscentAM was used to predict the corresponding manufacturing states, which are explained in Section 3.3.1. The digitization of the parts and their evaluation using false-color comparisons is described in Section 3.3.2.

3.3.1. Experimental Layouts

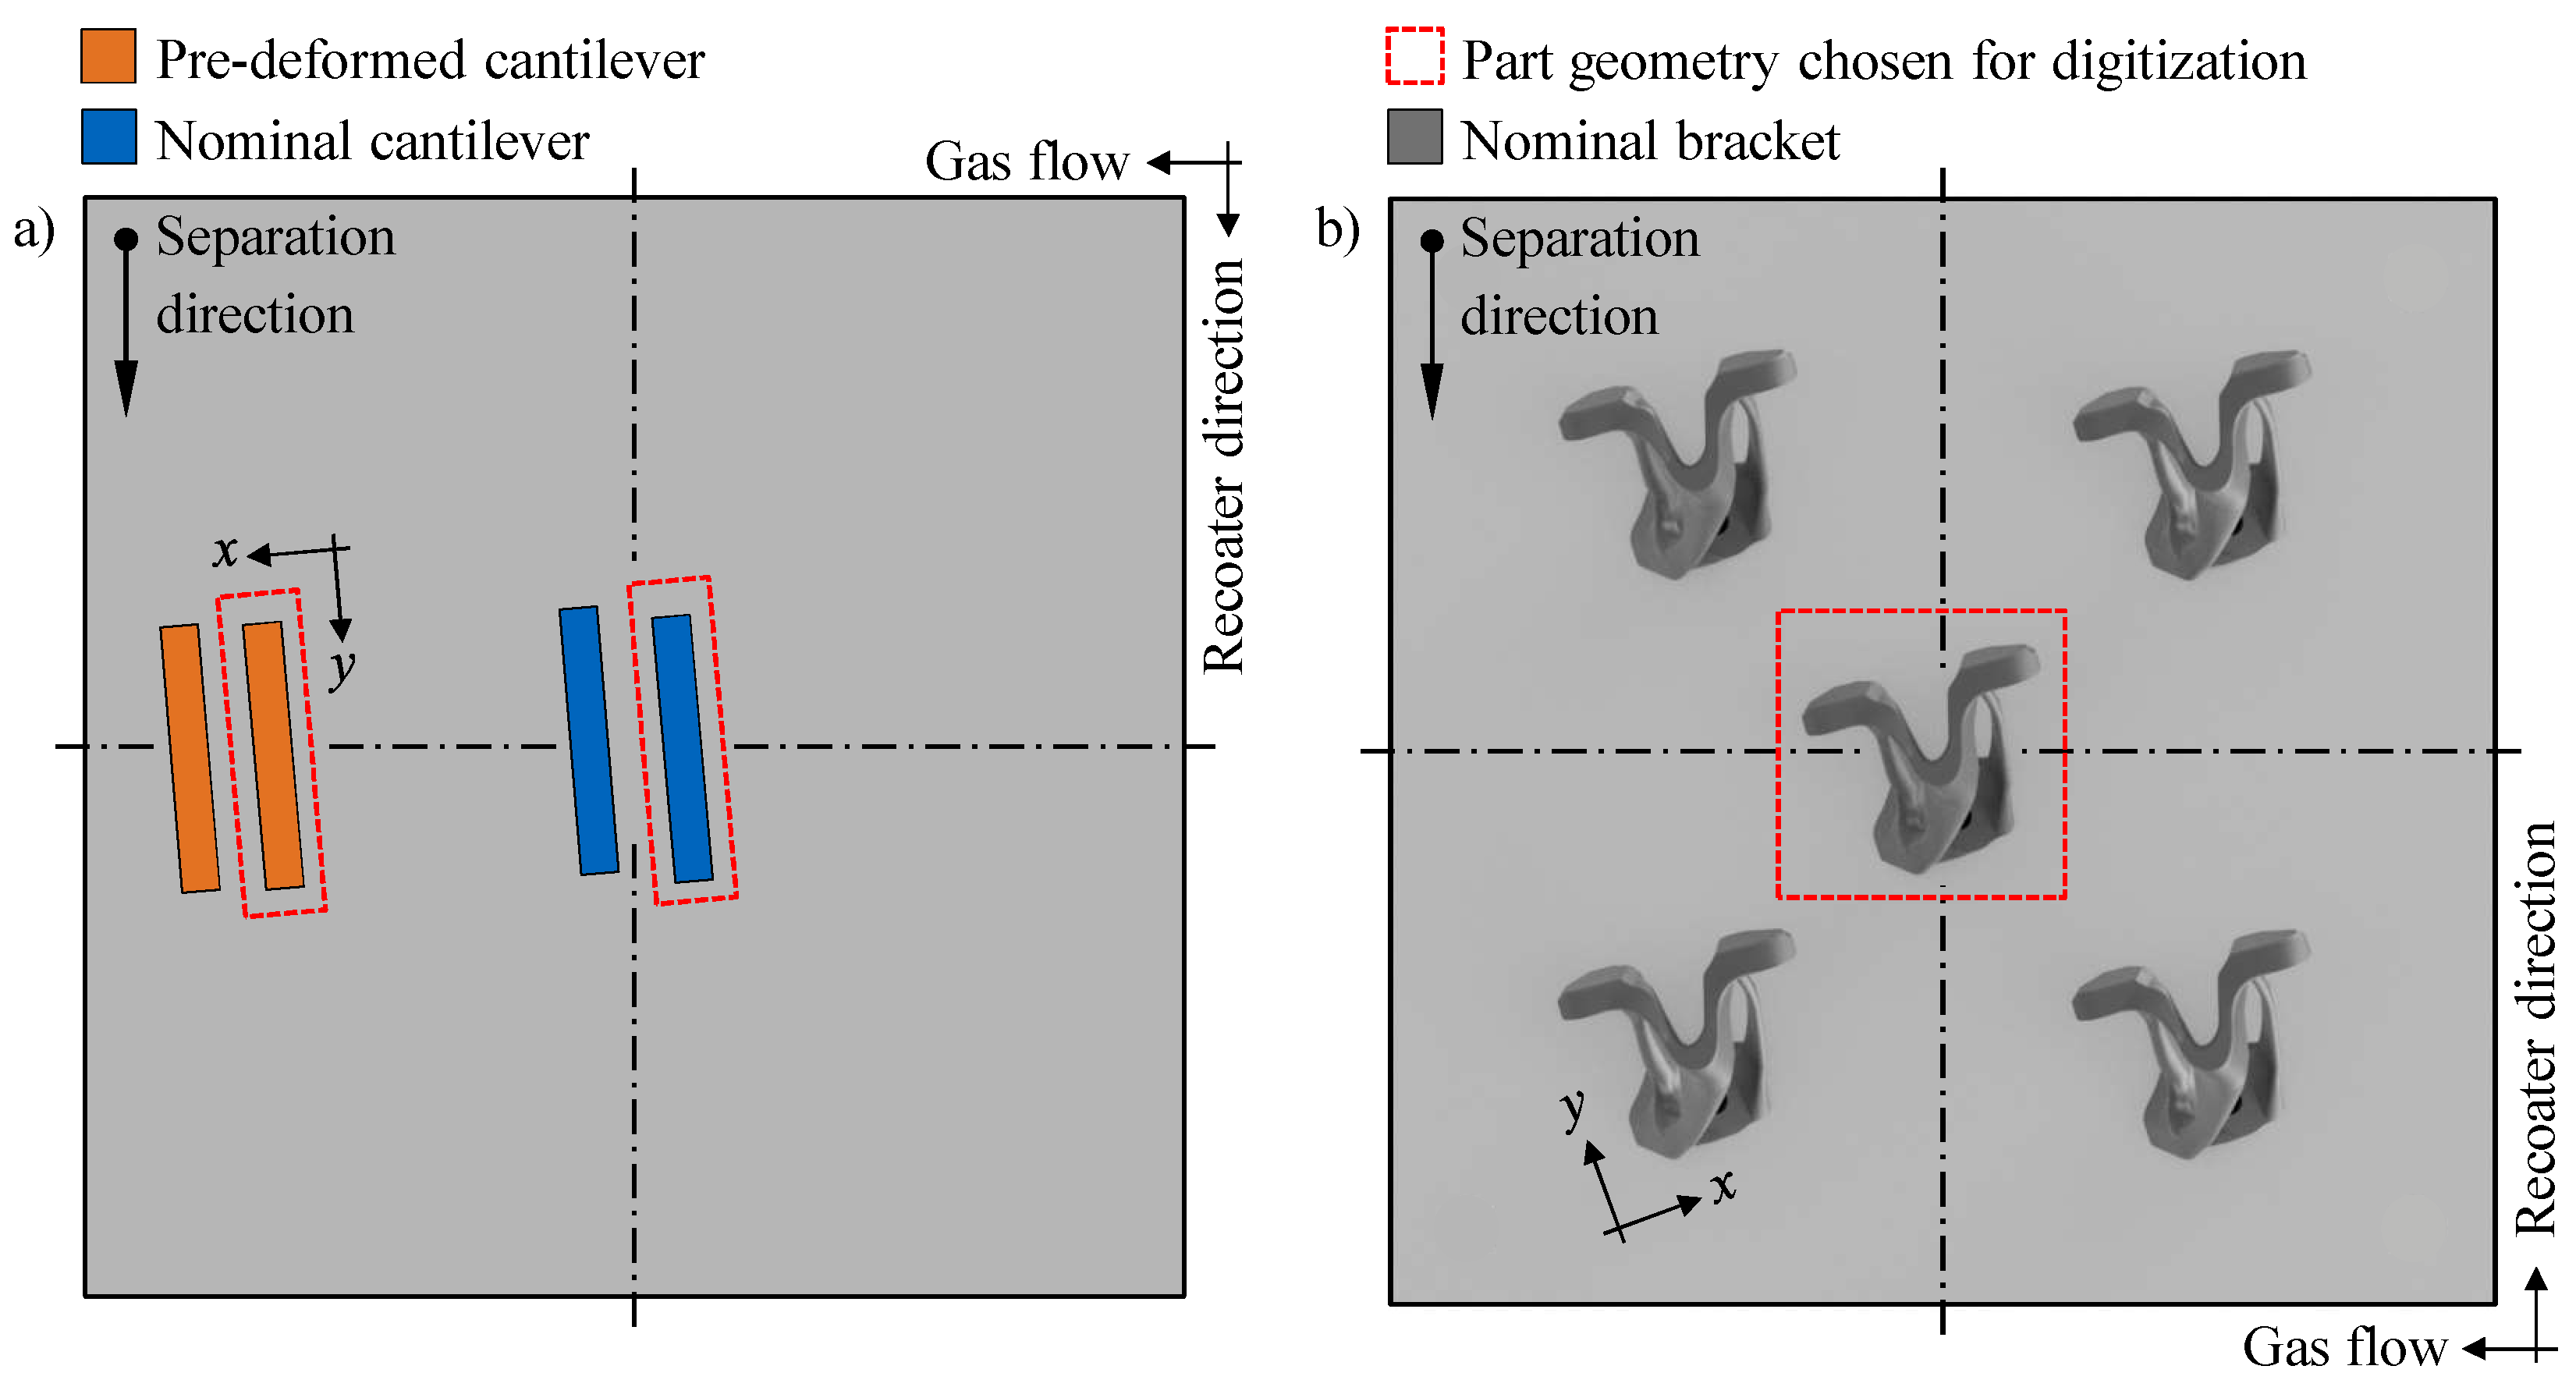
The cantilever specimens were fabricated on an EOS M400-1 PBF-LB/M machine (EOS GmbH, Krailling, Germany). The parts were positioned in the center of a 250 × 250 mm2 build platform, which was mounted on an additional adapter plate. The positions of the parts are shown in Figure 5a. The manufacturing was performed under an argon inert gas atmosphere. A build platform temperature T BP = 353.15 K and the EOS standard process parameters for the nickel-based superalloy Inconel 718C (Oerlikon Metco Europe GmbH, Raunheim, Germany) with an exposure against the gas flow direction were applied. Using EDM, the cantilevers were cut off the build platform.
The brackets were fabricated by MTU Aero Engines AG on an EOS M290 PBF-LB/M machine (EOS GmbH, Krailling, Germany). A 250 × 250 mm2 build platform and the nickel-based superalloy Inconel 718C (Oerlikon Metco Europe GmbH, Raunheim, Germany) were used. The part positions are shown in Figure 5b. They were processed under an argon inert gas atmosphere using a build platform temperature of T BP = 353.15 K and adapted EOS standard process parameters with an exposure against the gas flow direction. After PBF-LB/M, SRA was applied to the parts. Therefore, the parts were heated from the ambient temperature T amb to the SRA temperature T SRA = 1228.15 K over the time t = 5580 s. The temperature T SRA was held for the time t = 3600 s, before a final cooling from the temperature T SRA to the ambient temperature T amb was performed over the time t = 5580 s. After the SRA, the brackets were separated from the build platform using EDM.

3.3.2. Digitization

After the PBF-LB/M process, the as-built parts, which are marked with a red dashed frame in Figure 5, were measured with optical 3D scanners. The cantilever beam was measured at the Institute for Machine Tools and Industrial Management (iwb), while the topology-optimized brackets were digitized by MTU Aero Engines AG.
The cantilever beams were digitized using the industrial optical 3D scanner GOM ATOS Q 8M (Carl Zeiss GOM Metrology GmbH, Braunschweig, Germany). The digitizer allows for the optical measurement of small- to medium-sized parts by projecting 8 million points per scan onto the object to be measured and keeping a working distance of approximately 490 mm. The measurement was performed with the measuring volume MV100, which has an uncertainty of ±10 µm. The object was placed in the center of a motorized rotary table and scanned from various angles. The single scans were combined by an image composition. Measuring points with a spot size of 0.8 mm were arbitrarily applied onto the object for an improved digitization quality. The cantilever beams were measured after the separation from the build platform.
The topology-optimized bracket was optically measured using the 3D scanner GOM ATOS 5AF 12M (Carl Zeiss GOM Metrology GmbH, Braunschweig, Germany), which is mainly used for aviation applications. The scanner allows for a detailed resolution by projecting 12 million data points per scan at a working distance of approximately 530 mm. For the measurement, the bracket was placed on a rotary table and was digitized from various angles. To improve the optical measurement, the part was manually sprayed with a TiO 2 layer, which reduces reflections on the part surface. The bracket was measured before the SRA heat treatment and after the separation of the stress-relief-annealed part from the build platform.
After the scanning, the software GOM inspect (Carl Zeiss GOM Metrology GmbH, Braunschweig, Germany) was used to obtain the deviations of the actual geometries from the nominal geometries in a false-color comparison. For the actual geometries, the STL files, which were exported from the simulations or determined by the optical measurements, were used. The geometries were aligned with each other using a software-integrated best-fit algorithm, which calculates the minimum mean deviation between the two geometries to be compared. The dimensional accuracy was assessed by means of the surface comparison function.

4. Results and Discussion

In this section, the results of the convergence study, which represent the simulation settings for the experimental validation, are discussed. Subsequently, the results of the experimental validation are presented for the cantilever beam and the bracket.

4.1. Verification of the Simulation

The verification of the applied linear temperature gradient from the flash exposure during the heating step is performed exemplarily for the cantilever beam. The simulated temperature fields and the corresponding mechanical results of the cantilever beam are shown for selected computational steps of the last LC in Figure 6.
During the heating step, the linear temperature gradient is applied to the topmost LC of the cantilever by means of the flash exposure heat source. As a result of this high thermal gradient, the topmost LC expands, while the LCs with a reduced temperature underneath retain the distortion resulting from the previous build-up. In the subsequent cooling steps, this temperature is dissipated in the negative z-direction towards the build platform. This is accompanied by a rapid cooling of the peak temperature, which is consistent with previous findings [45,46]. As a result, the applied temperature gradient extends over several LCs. In the final cooling step of the LC, the build platform temperature is reached in the whole part. Due to the cooling behavior, the mechanical simulation result shows a decrease in the thermal expansion and an increasing thermal contraction of the upper LCs of the cantilever beam. This is caused by the thermally induced macroscopic residual stresses, which in turn lead to the distortion of the part [8,9]. The change of the mechanical stiffness at the height of the structural transition causes an increased distortion of the lower part towards the center of the cantilever. These results confirm the appropriate implementation of the physics-based equations according to Section 2.1 in the sequentially coupled thermo-mechanical process simulation.
The results of the convergence study for the cantilever geometry are illustrated in Figure 7. Each evaluation point contributes to the formation of the 3D surface. As shown by the 3D surface, at each LC evaluation, the FE size alterations did not have a strong influence on the RMS of the deformation. This is indicated by almost horizontal curves, which show a maximum deviation of 6%, along the axis representing the FE size. Along the LC height axis, however, clear changes in the analyzed values are evident. Therefore, selected evaluation points, which fulfill the condition of the LC height being twice as large as the FE size, are projected onto the backplane to highlight the influence of the LC height changes.
It can be observed that, with a decreasing LC height, the values for the distortion periodically converged towards a constant value. This behavior, however, should not be misunderstood with the oscillatory convergence behavior correlated with changing FE sizes [47]. Decreasing the FE sizes indeed exhibited a monotonic convergence of the RMS of the deformation. At an LC height L = 2.00 mm and an FE size e = 1.00 mm, corresponding to the location labeled with (2|1), the simulatively determined RMS of the distortion of 0.06 mm did not change strongly when further decreasing the LC heights or the FE sizes. The computation time for the selected evaluation points continuously increased from the rough towards the fine LC height and FE size combination, resulting in 101.48 s, 192.76 s, 592.14 s and 1835.54 s, respectively. For the remaining cantilever simulations, the LC height and FE size combination (2|1) was chosen as it balanced the solution accuracy and the computational effort.
The bracket shows an overall convergence for smaller element sizes and LC heights, which is shown for the two VPs in Table 2. At the VP1 and VP2, the distortion initially fluctuates and subsequently decreases slightly with a reduced LC height. Compared to the VP2, the VP1 showed a higher deformation during the simulation for LC heights L 3.00 mm . This effect reversed as the layer bond height decreased. Even with using rougher discretization and simulation parameters, the simulation already shows a satisfactory result quality. In previous investigations, good macroscopic results were also obtained with larger element sizes and LC heights [38]. Additionally, increased element sizes and LC heights are more economical due to the reduced computational effort, which is confirmed by the computation times presented in Table 2. Hence, the configuration with an element size e = 2.00 mm and an LC height L = 4.00 mm was used for the experimental validation of the bracket.

4.2. Experimental Validation

In this section, the results of the evaluation of the form deviation between the simulation and experimental results are presented. Therefore, false-color comparisons were derived for the cantilever beam and the bracket geometry to demonstrate the performance of the simulation tool AscentAM.

4.2.1. Cantilever Beam

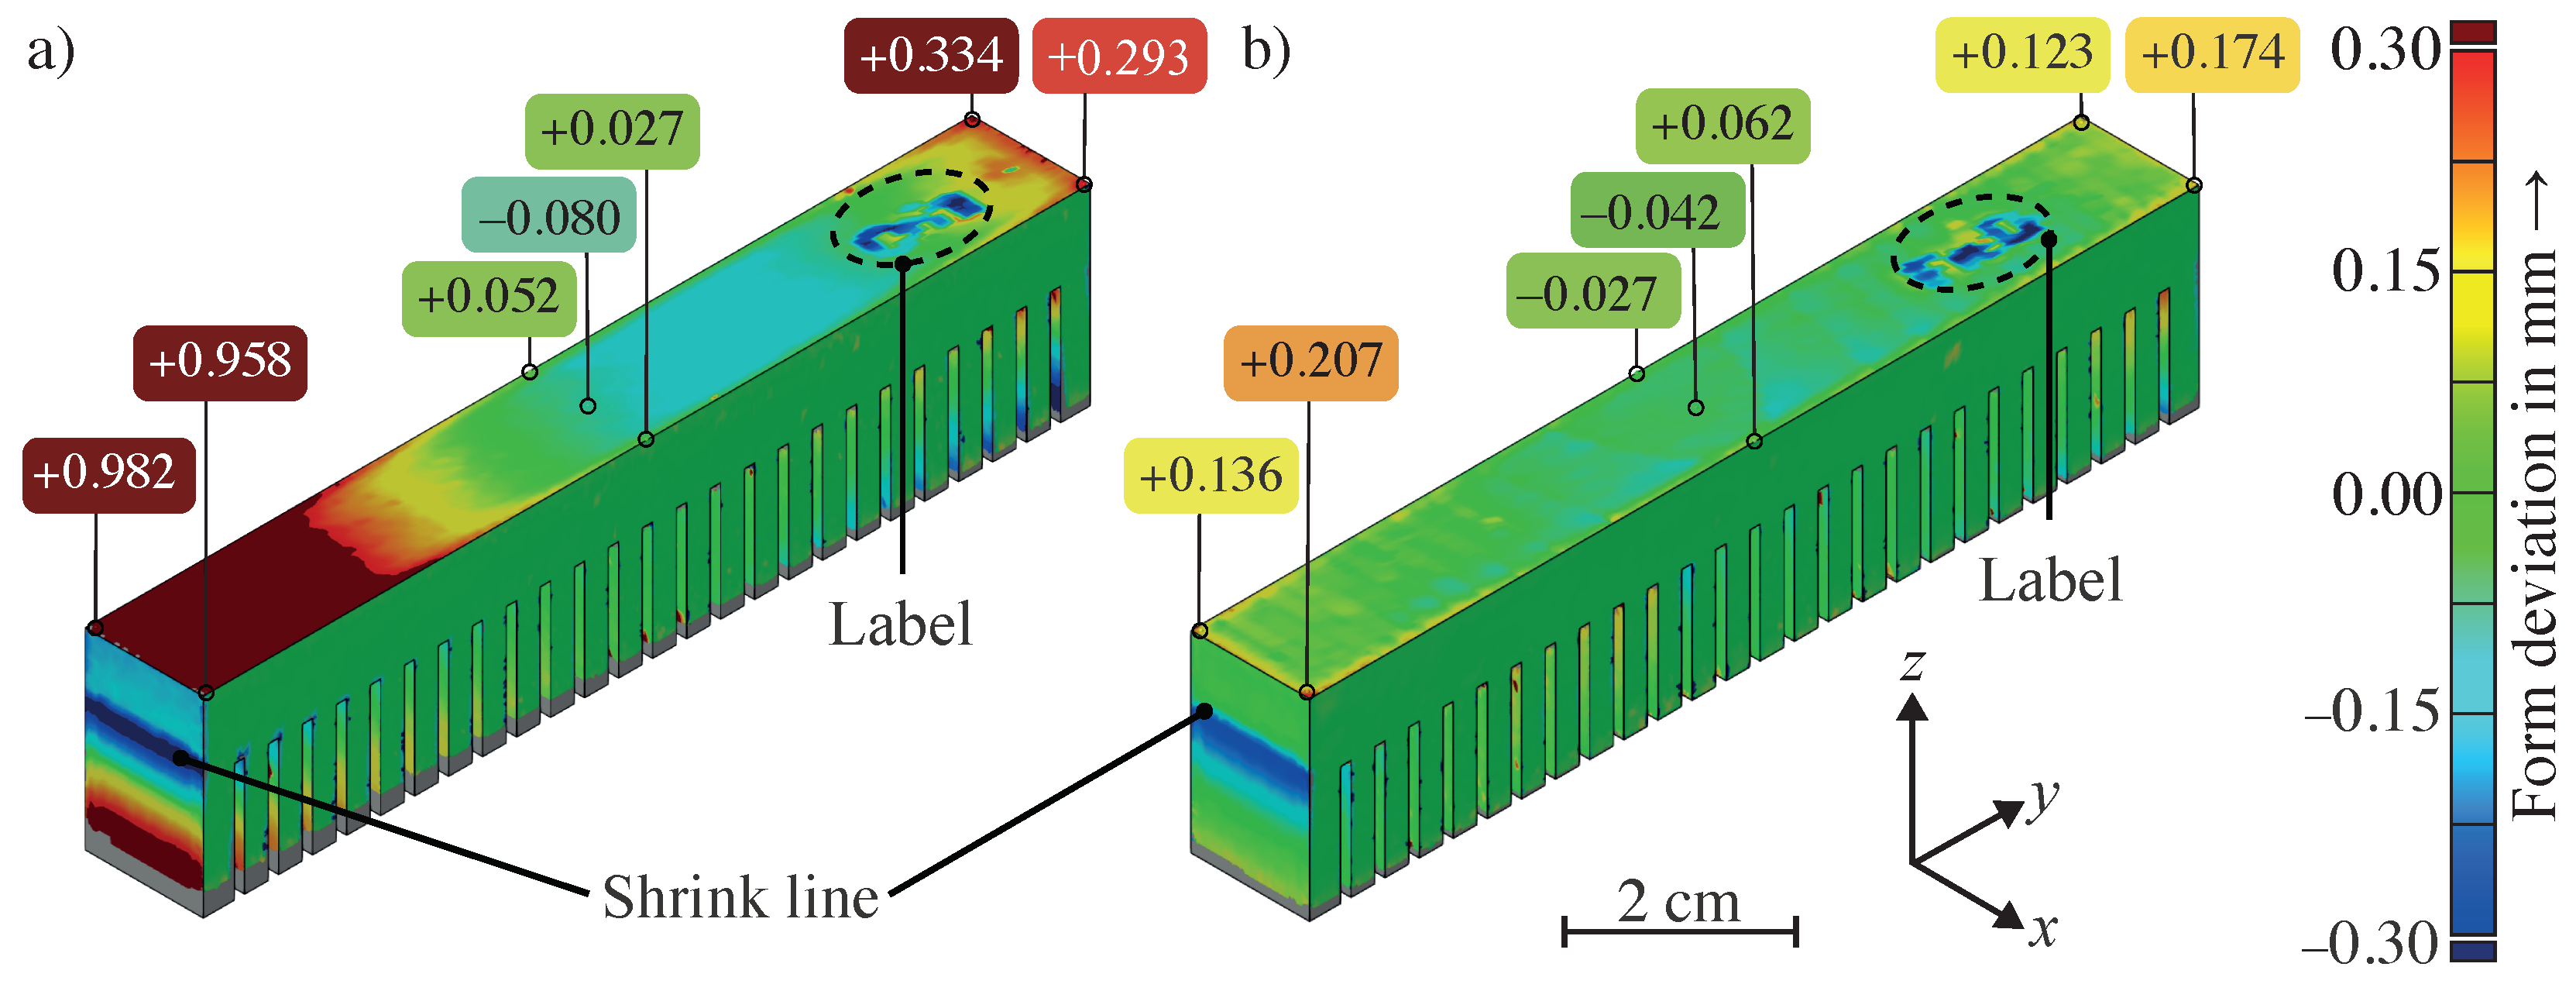
For the cantilever beam, the determined form deviation with and without applying the pre-deformation algorithm is depicted in Figure 8. The non-pre-deformed manufactured geometry in Figure 8a shows a strong one-sided distortion, which decreases in the direction of the separation process (see Figure 5). This distortion results from a bending in the positive z-direction of the part geometry due to the residual stresses released during the separation of the cantilever from the build platform [48]. The pre-deformed manufactured geometry showed a significantly increased dimensional accuracy after the separation. The largest deviations were determined at the contour regions. This is caused by the flash exposure heat source applying a linear temperature gradient, which does not consider the increased energy volume density in the contour areas during the PBF-LB/M process. To represent this effect, the different PBF-LB/M scanning strategies need to be modeled at the real layer level [49], which would in turn lead to a significantly increased computational effort. At the height of the structural transition, a shrink line formed, the investigation of which is subject of ongoing research [50].
For the nominal built geometry and a tolerance of ±0.10 mm, a dimensional accuracy of 69.6% was observed without a pre-deformation. By applying the optimization sub-module using AscentAM, the dimensional accuracy of the cantilever can be quantified to be 85.8%. Hence, in contrast to various commercial software tools applied by Peter et al. [43], AscentAM allows for a significantly increased dimensional accuracy in parts manufactured via PBF-LB/M after applying the pre-deformation algorithm. This can be explained by the physics-based and non-linear optimization approach, which directly takes into account the geometry-related heat conduction and the resulting temperature fields.

4.2.2. Bracket Geometry

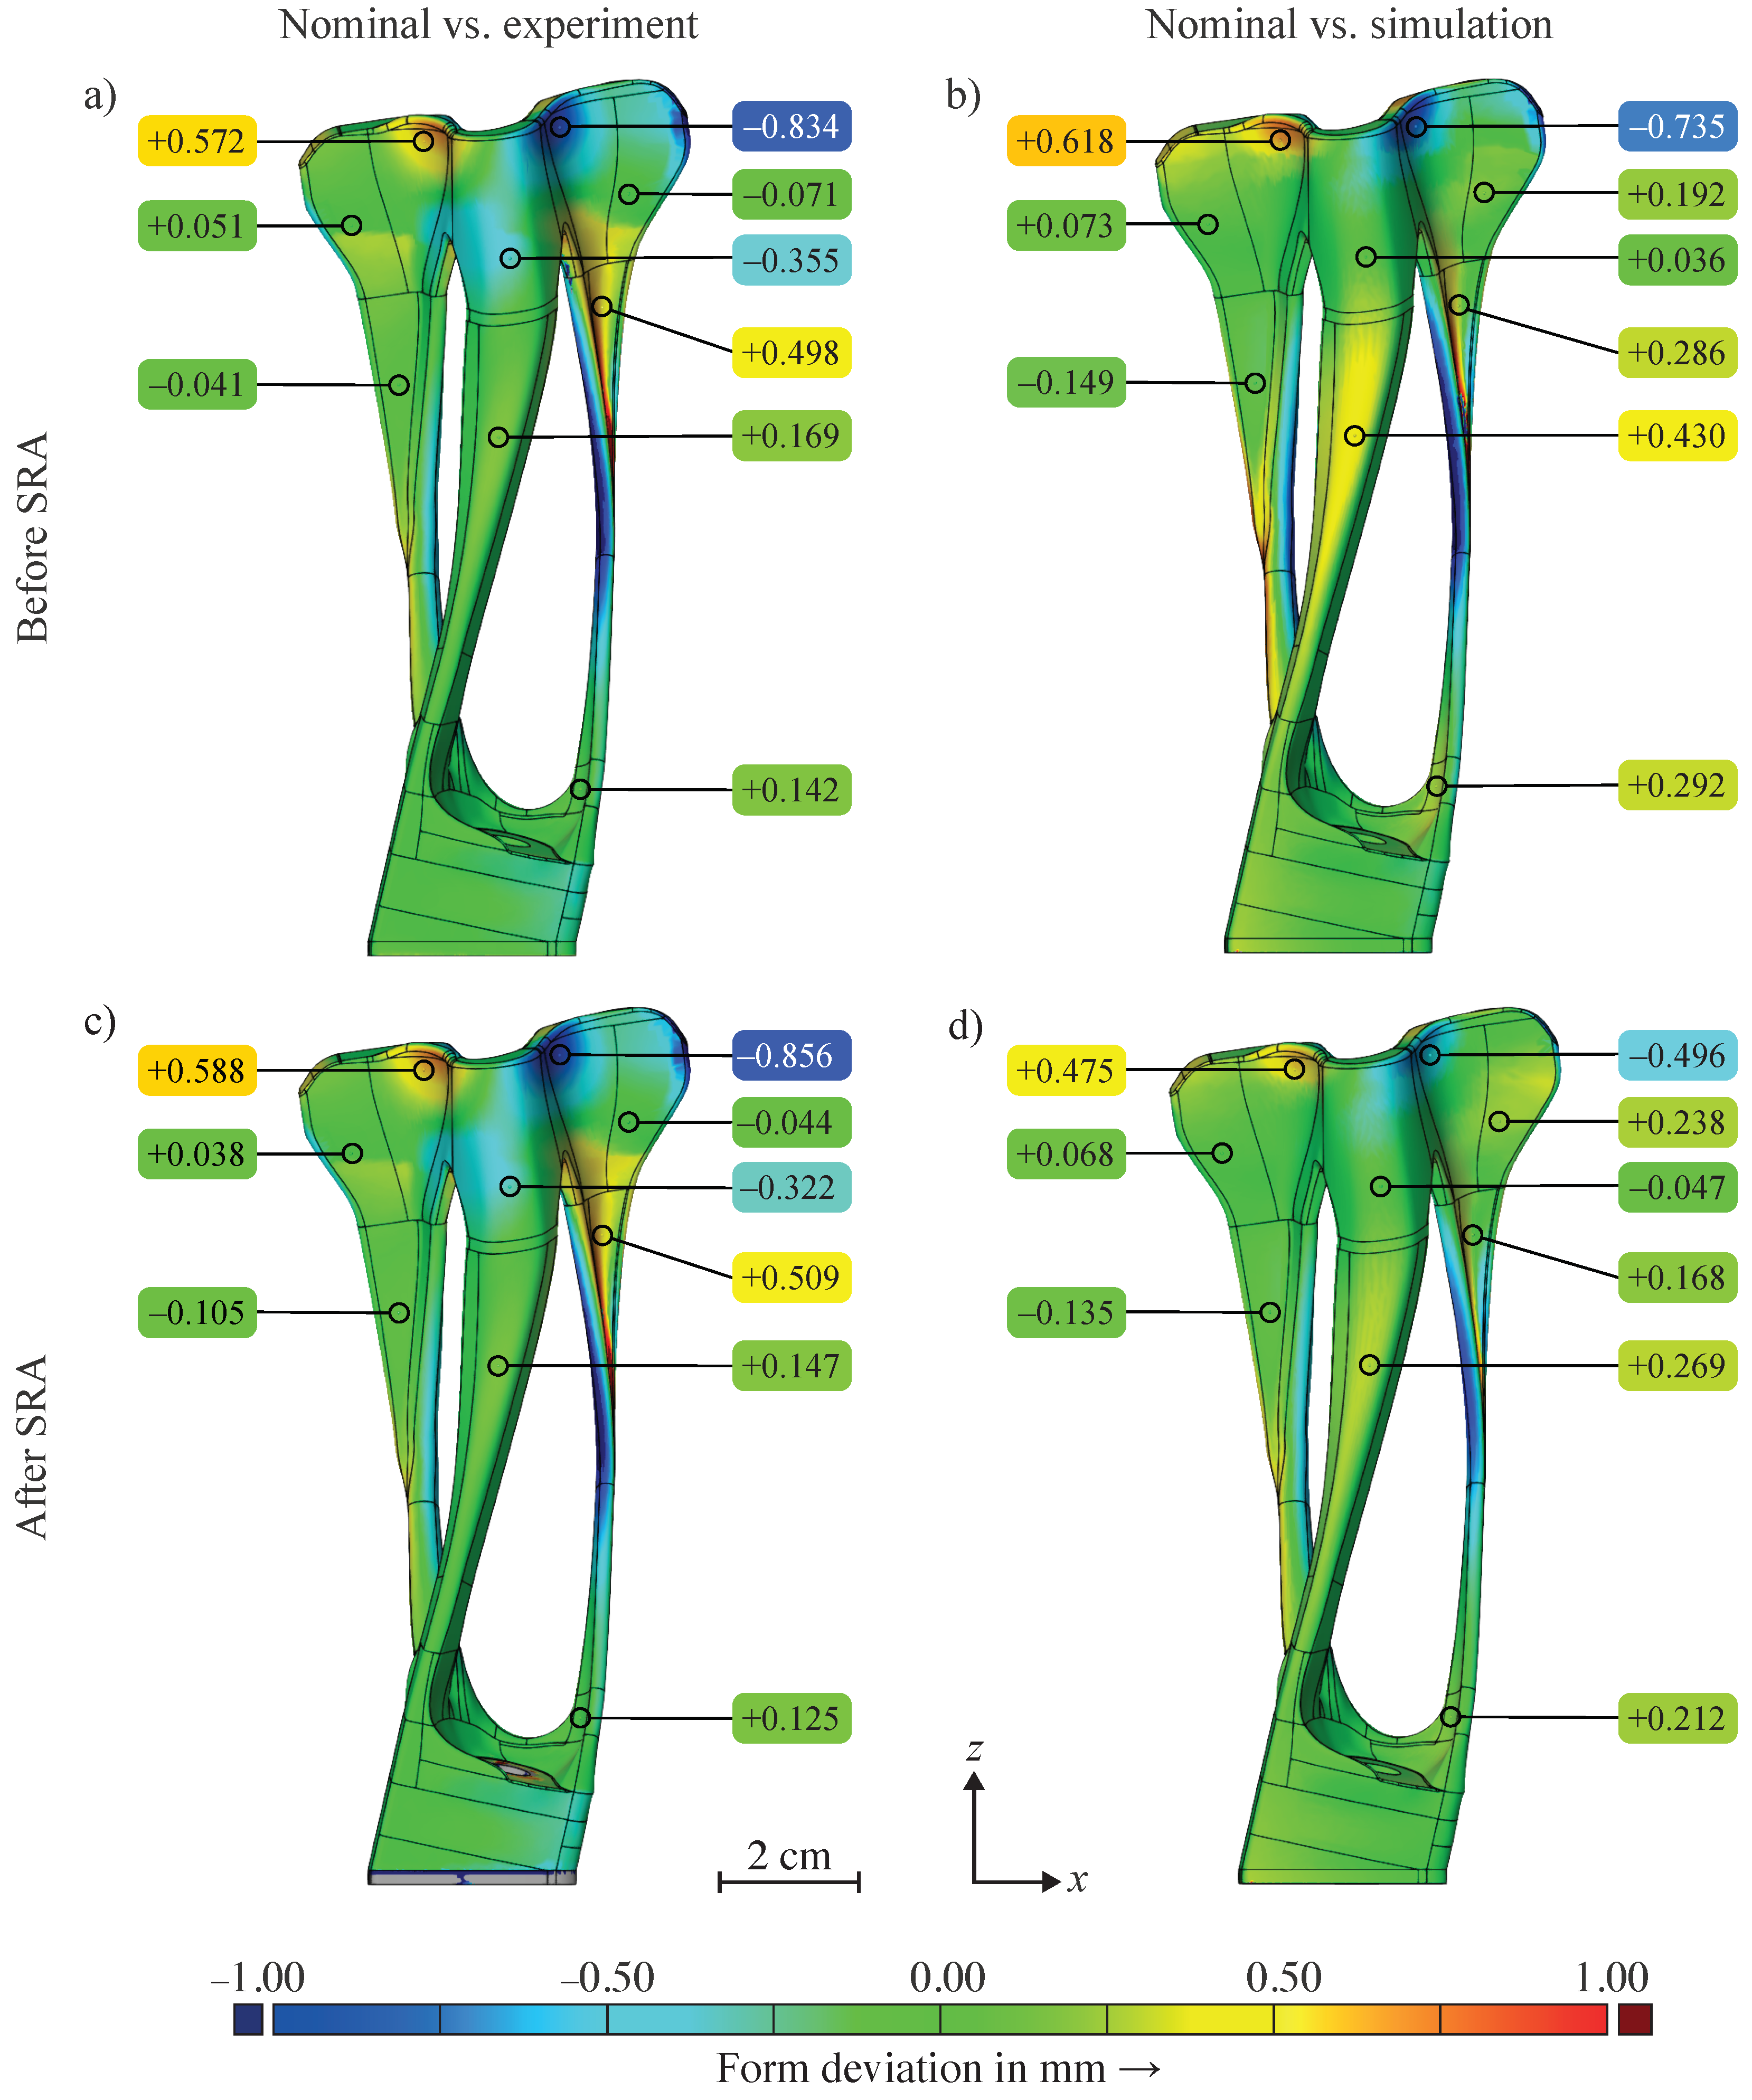
For the topology-optimized bracket, the determined form deviation before the SRA, and after the SRA and separation from the build platform are shown in Figure 9. For these two manufacturing states, the as-built part and the simulated result are each compared with the nominal geometry.
In general, the simulated distortion corresponds to the experimentally determined as-built distortion of the bracket. The highest form deviation was found at the pillars and in the section above the structural transition. The solid base underneath the pillars showed the smallest form deviation. For the experimental results, shrink lines formed at the height of the structural transitions, which led to a rapid change of the resulting form deviation at this height. The heat treatment and separation of the bracket from the build platform only showed a minor effect on the form deviation. For the simulated results, a similar form deviation above the structural transition was observed. The shrink line formation is not yet represented, as the determination of its physical cause-effect relationship is still the subject of current research [51]. Due to the simulation of the SRA and the part separation, the form deviation decreased slightly, while the basic qualitative progression remained the same.
When directly comparing the simulated and experimental results, a dimensional accuracy of 94.7% before the SRA, and 88.6% after the SRA and the separation was achieved within a tolerance of ±0.30 mm. In relation to the maximum simulated distortion, which was determined to be 2.46 mm in the pillars for the state before the SRA, this confirms the high prediction accuracy of AscentAM. The average deviation between the simulated and the experimental result was quantified to be Δ ¯ before SRA = 0.101 ± 0.190 mm before the SRA. After the separation of the stress-relief-annealed bracket, the average deviation was determined to be Δ ¯ after SRA = 0.075 ± 0.220 mm for all evaluation points. From these values, it can be deduced that the simulation generally overestimates the distortion of the bracket.
To further improve the prediction accuracy, a transversal isotropic material, a higher polynomial function for the SRA and the shrink line formation need to be implemented. Nevertheless, slight differences of the predicted and as-built results will remain due to the simplifications, such as a layer compound approach, used in the process simulation. Also, the applied TiO 2 layer to improve the digitization quality of the parts being measured slightly falsifies the results. Another deviation is caused by the best-fit algorithm used for deriving the false-color comparison between the simulative and experimental results. In principle, the obtained results confirm the prediction accuracy of the calculation of macroscopic form deviations, which are caused by the PBF-LB/M process, and show a good agreement with the experimental results.

5. Conclusions and Outlook

The PBF-LB/M process is characterized by its high degree of geometric design freedom. However, high temperature gradients during the manufacturing result in high residual stresses and deformations. This reduces the possibility of a first-time-right manufacturing, which leads to higher post-processing costs or even part scrap. In this work, the physics-based simulation tool AscentAM was introduced. It is used to predict the macroscopic distortions and residual stress states for the whole PBF-LB/M process chain. It was demonstrated that the relevant process chain phases of the PBF-LB/M process can be represented with an industrially relevant efficiency. The core module and optional sub-modules were presented, which allow for a distortion prediction, a part optimization, the exportation of part geometries in machine-specific data formats or a UQ of the main influencing parameters. The simulation tool allows for an easy extension of the core module due to the modular and open-source structure. The process simulation was applied to two part geometries, the cantilever beam and the topology-optimized bracket, with the key findings listed below:
  • For the academic cantilever beam, the simulation results confirmed that the physics-based thermal equations, which are used to model the heat input and the subsequent cooling, were correctly implemented in AscentAM. The relevant cause-and-effect relationships were represented using the sequentially coupled thermo-mechanical modeling approach. An average element size e = 1.00 mm and an LC height L = 2.00 mm were determined as suitable simulation settings, which led to a required computation time of 592.14 s. By applying the optimization sub-module, the dimensional accuracy was increased by 16.2% to 85.8% for the as-built part after the separation from the build platform.
  • The topology-optimized bracket was simulated using an element size e = 2.00 mm and an LC height L = 4.00 mm, which resulted in a computation time of 12,250.0 s for the thermo-mechanical analysis. Comparing the simulation result and the as-built part with each other, a dimensional accuracy of 94.7% and 88.6% was observed for the manufacturing state before the SRA, and after the separation of the stress-relief-annealed part, respectively. The distortions were slightly overestimated by the process simulation.
  • Due to the contrasting complexity of the two parts, it was confirmed that the process simulation tool AscentAM shows a high result quality with an adequate computing time. The operation of the simulation tool in an industrial environment at MTU Aero Engines AG also confirmed its economic relevance for applications in the aerospace industry. In contrast to other commercial process simulations, an increased dimensional accuracy was achieved using the non-linear pre-deformation algorithm of the optimization sub-module.
In summary, the process simulation allows for the prediction of the PBF-LB/M process by considering the main physical effects during the manufacturing and the post-processing. Hence, it is a decisive contribution to a first-time-right manufacturing for PBF-LB/M parts. To further increase the prediction accuracy, mesoscale and microscale effects, such as the formation of shrink lines, the crack initiation or the microstructure development during the manufacturing, need to be implemented into the process simulation. Likewise, extensions are possible to increase the part quality. For example, an artificial intelligence approach can be used to determine necessary process parameter adjustments depending on the physics-based thermal process behavior prior to the manufacturing process.

Author Contributions

Conceptualization, D.G.; methodology, D.G., H.P., D.W. and F.B.; software, D.G., H.P., D.W. and F.B.; validation, D.G., H.P., D.W. and J.S.; formal analysis, D.G. and H.P.; investigation, D.G.; resources, M.F.Z.; data curation, D.G.; writing—original draft preparation, D.G., H.P., D.W. and F.B.; writing—review and editing, J.S. and M.F.Z.; visualization, D.G. and H.P.; supervision, M.F.Z.; project administration, D.G., H.P., D.W. and M.F.Z.; funding acquisition, M.F.Z. All authors have read and agreed to the published version of the manuscript.

Funding

The presented results were obtained in an industrial project supported by the MTU Aero Engines AG as a subcontract within the LuFo VI-4 research project DesiPrint_AM (grant number 20D2103A), funded by the German Federal Ministry for Economic Affairs and Climate Action (BMWK). We express our sincere gratitude towards the MTU Aero Engines AG and the BMWK for their support and trusting cooperation.

Institutional Review Board Statement

Not applicable.

Informed Consent Statement

Not applicable.

Data Availability Statement

The data that support the findings of this study are available from the corresponding author upon request.

Conflicts of Interest

The authors Fabian Bayerlein and Josef Spachtholz were employed by the company MTU Aero Engines AG. The authors hereby confirm that there are no conflicts of interest associated with this publication. Although they have worked at a company involved in research and development, they affirm that all research methods and evaluation criteria applied were established independently and objectively. The results obtained were derived using standardized and recognized scientific procedures and were not influenced by their professional affiliations with the company. The research was conducted in strict adherence to the ethical guidelines and standards of the scientific community to ensure that the findings are transparent and reliable. The remaining authors declare that the research was conducted in the absence of any commercial or financial relationships that could be construed as a potential conflict of interest.

Abbreviations

The following abbreviations are used in this manuscript:
CCXCalculiX CrunchiX
EDMElectrical discharge machining
FEFinite element
LCLayer compound
PBAProbability bounds analysis
PBF-LB/MPowder bed fusion of metals using a laser beam
SRAStress relief annealing
STLStandard tesselation language
UQUncertainty quantification
VPVerification point

References

  1. Duda, T.; Raghavan, L.V. 3D Metal Printing Technology. In Proceedings of the 17th IFAC Conference on International Stability, Technology and Culture TECIS 2016, Durrës, Albania, 26–28 October 2016; Volume 49, pp. 103–110. [Google Scholar] [CrossRef]
  2. Srivastava, M.; Rathee, S. Additive manufacturing: Recent trends, applications and future outlooks. Prog. Addit. Manuf. 2021, 7, 261–287. [Google Scholar] [CrossRef]
  3. Riveiro, A.; del Val, J.; Comesaña, R.; Lusquiños, F.; Quintero, F.; Boutinguiza, M.; Pou, J. Laser Additive Manufacturing Processes for Near Net Shape Components. In Near Net Shape Manufacturing Processes; Gupta, K., Ed.; Springer International Publishing: Cham, Switzerland, 2019; pp. 105–141. [Google Scholar] [CrossRef]
  4. Sanchez, S.; Smith, P.; Xu, Z.; Gaspard, G.; Hyde, C.J.; Wits, W.W.; Ashcroft, I.A.; Chen, H.; Clare, A.T. Powder Bed Fusion of nickel-based superalloys: A review. Int. J. Mach. Tools Manuf. 2021, 165, 103729. [Google Scholar] [CrossRef]
  5. Cobbinah, P.V.; Nzeukou, R.A.; Onawale, O.T.; Matizamhuka, W.R. Laser Powder Bed Fusion of Potential Superalloys: A Review. Metals 2021, 11, 58. [Google Scholar] [CrossRef]
  6. Sun, S.; Brandt, M.; Easton, M. 2—Powder bed fusion processes: An overview. In Laser Additive Manufacturing; Brandt, M., Ed.; Woodhead Publishing Series in Electronic and Optical Materials; Woodhead Publishing: Sawston, UK, 2017; pp. 55–77. [Google Scholar] [CrossRef]
  7. Narasimharaju, S.R.; Zeng, W.; See, T.L.; Zhu, Z.; Scott, P.; Jiang, X.; Lou, S. A comprehensive review on laser powder bed fusion of steels: Processing, microstructure, defects and control methods, mechanical properties, current challenges and future trends. J. Manuf. Process. 2022, 75, 375–414. [Google Scholar] [CrossRef]
  8. Mercelis, P.; Kruth, J.P. Residual stresses in selective laser sintering and selective laser melting. Rapid Prototyp. J. 2006, 12, 254–265. [Google Scholar] [CrossRef]
  9. Bartlett, J.L.; Li, X. An overview of residual stresses in metal powder bed fusion. Addit. Manuf. 2019, 27, 131–149. [Google Scholar] [CrossRef]
  10. Zaeh, M.; Branner, G. Investigations on residual stresses and deformations in selective laser melting. Prod. Eng. 2009, 4, 35–45. [Google Scholar] [CrossRef]
  11. Bayerlein, F.; Zeller, C.; Zaeh, M.F.; Weirather, J.; Wunderer, M.; Seidel, C. Improving cost effectiveness in additive manufacturing—Increasing dimensional accuracy in laser beam melting by means of a simulation supported process chain. In Proceedings of the ANSYS Conference 33. CAFDEM Users’ Meeting, Bremen, Germany, 24–26 June 2015; pp. 1–9. Available online: http://www.cae-wiki.info/wikiplus/images/d/d4/UM2015-2.02.12.pdf (accessed on 30 May 2024).
  12. Panzer, H.; Wolf, D.; Bachmann, A.; Zaeh, M.F. Towards a Simulation-Assisted Prediction of Residual Stress-Induced Failure during Powder Bed Fusion of Metals Using a Laser Beam: Suitable Fracture Mechanics Models and Calibration Methods. J. Manuf. Mater. Process. 2023, 7, 208. [Google Scholar] [CrossRef]
  13. Panzer, H.; Diller, J.; Ehrenfels, F.; Brandt, J.; Zäh, M.F. Experimental investigation of process parameter variations on the microstructure and failure behavior of IN718 structures in PBF-LB/M. J. Laser Appl. 2024, 36, 012015. [Google Scholar] [CrossRef]
  14. Huang, Y.; Leu, M.C.; Mazumder, J.; Donmez, A. Additive Manufacturing: Current State, Future Potential, Gaps and Needs, and Recommendations. J. Manuf. Sci. Eng. 2015, 137, 014001. [Google Scholar] [CrossRef]
  15. Baumers, M.; Dickens, P.; Tuck, C.; Hague, R. The cost of additive manufacturing: Machine productivity, economies of scale and technology-push. Technol. Forecast. Soc. Chang. 2016, 102, 193–201. [Google Scholar] [CrossRef]
  16. Zoch, H.W. Distortion engineering–interim results after one decade research within the Collaborative Research Center: Distortion Engineering—Ein Zwischenbericht nach einem Jahrzehnt des Sonderforschungsbereichs. Mater. Und Werkst. 2012, 43, 9–15. [Google Scholar] [CrossRef]
  17. Chiumenti, M.; Neiva, E.; Salsi, E.; Cervera, M.; Badia, S.; Moya, J.; Chen, Z.; Lee, C.; Davies, C. Numerical modelling and experimental validation in Selective Laser Melting. Addit. Manuf. 2017, 18, 171–185. [Google Scholar] [CrossRef]
  18. Park, H.S.; Shin, H.S.; Tran, N.H. A new approach for calculating inherent strain and distortion in additive manufacturing of metal parts. Int. J. Adv. Manuf. Technol. 2022, 121, 6507–6521. [Google Scholar] [CrossRef]
  19. Mohammadtaheri, H.; Sedaghati, R.; Molavi-Zarandi, M. Inherent strain approach to estimate residual stress and deformation in the laser powder bed fusion process for metal additive manufacturing—A state-of-the-art review. Int. J. Adv. Manuf. Technol. 2022, 122, 2187–2202. [Google Scholar] [CrossRef]
  20. Dong, W.; Liang, X.; Chen, Q.; Hinnebusch, S.; Zhou, Z.; To, A.C. A new procedure for implementing the modified inherent strain method with improved accuracy in predicting both residual stress and deformation for laser powder bed fusion. Addit. Manuf. 2021, 47, 102345. [Google Scholar] [CrossRef]
  21. Keller, N. Verzugsminimierung Bei Selektiven Laserschmelzverfahren Durch Multi-Skalen-Simulation. Ph.D. Thesis, University of Bremen, Bremen, Germany, 2017. Available online: http://nbn-resolving.de/urn:nbn:de:gbv:46-00105808-15 (accessed on 30 May 2024).
  22. Siewert, M.; Neugebauer, F.; Epp, J.; Ploshikhin, V. Validation of Mechanical Layer Equivalent Method for simulation of residual stresses in additive manufactured components. Comput. Math. Appl. 2019, 78, 2407–2416. [Google Scholar] [CrossRef]
  23. Bugatti, M.; Semeraro, Q. Limitations of the inherent strain method in simulating powder bed fusion processes. Addit. Manuf. 2018, 23, 329–346. [Google Scholar] [CrossRef]
  24. Seidel, C. Finite-Elemente-Simulation des Aufbauprozesses beim Laserstrahlschmelzen. Ph.D. Thesis, Technical University of Munich, Munich, Germany, 2016. Available online: https://nbn-resolving.de/urn/resolver.pl?urn:nbn:de:bvb:91-diss-20160728-1303906-1-5 (accessed on 30 May 2024).
  25. Bayat, M.; Klingaa, C.G.; Mohanty, S.; De Baere, D.; Thorborg, J.; Tiedje, N.S.; Hattel, J.H. Part-scale thermo-mechanical modelling of distortions in Laser Powder Bed Fusion—Analysis of the sequential flash heating method with experimental validation. Addit. Manuf. 2020, 36, 101508. [Google Scholar] [CrossRef]
  26. De Baere, D.; Van Cauwenbergh, P.; Bayat, M.; Mohanty, S.; Thorborg, J.; Thijs, L.; Van Hooreweder, B.; Vanmeensel, K.; Hattel, J.H. Thermo-mechanical modelling of stress relief heat treatments after laser-based powder bed fusion. Addit. Manuf. 2021, 38, 101818. [Google Scholar] [CrossRef]
  27. Singh, U.P.; Swaminathan, S.; Phanikumar, G. Thermo-mechanical approach to study the residual stress evolution in part-scale component during laser additive manufacturing of alloy 718. Mater. Des. 2022, 222, 111048. [Google Scholar] [CrossRef]
  28. O’Brien, J.; Montgomery, S.; Yaghi, A.; Afazov, S. Process chain simulation of laser powder bed fusion including heat treatment and surface hardening. CIRP J. Manuf. Sci. Technol. 2021, 32, 266–276. [Google Scholar] [CrossRef]
  29. Dhondt, G. CalculiX CrunchiX User’s Manual, Version 2.20; MIT Press: Cambridge, MA, USA, 2022. [Google Scholar]
  30. Branner, G. Modellierung Transienter Effekte in der Struktursimulation von Schichtbauverfahren. Ph.D. Thesis, Technical University of Munich, Munich, Germany, 2011. Available online: https://www.mec.ed.tum.de/fileadmin/w00cbp/iwb/Institut/Dissertationen/246_Branner.pdf (accessed on 30 May 2024).
  31. Chowdhury, S.; Yadaiah, N.; Prakash, C.; Ramakrishna, S.; Dixit, S.; Gupta, L.R.; Buddhi, D. Laser powder bed fusion: A state-of-the-art review of the technology, materials, properties & defects, and numerical modelling. J. Mater. Res. Technol. 2022, 20, 2109–2172. [Google Scholar] [CrossRef]
  32. Zeller, C. Adaption of Numerical Methods to the Specific Requirements of the Thermal Simulation in Laser Beam Melting. Ph.D. Thesis, Techniscal University of Munich, Munich, Germany, 2019. Available online: https://nbn-resolving.de/urn/resolver.pl?urn:nbn:de:bvb:91-diss-20191115-1482942-1-3 (accessed on 30 May 2024).
  33. Afazov, S.; Denmark, W.A.; Toralles, B.L.; Holloway, A.; Yaghi, A. Distortion prediction and compensation in selective laser melting. Addit. Manuf. 2017, 17, 15–22. [Google Scholar] [CrossRef]
  34. Denlinger, E.R.; Michaleris, P. Effect of stress relaxation on distortion in additive manufacturing process modeling. Addit. Manuf. 2016, 12, 51–59. [Google Scholar] [CrossRef]
  35. Megahed, M.; Mindt, H.W.; N’Dri, N.; Duan, H.; Desmaison, O. Metal additive-manufacturing process and residual stress modeling. Integr. Mater. Manuf. Innov. 2016, 5, 61–93. [Google Scholar] [CrossRef]
  36. Irwin, J.; Michaleris, P. A Line Heat Input Model for Additive Manufacturing. J. Manuf. Sci. Eng. 2016, 138, 111004. [Google Scholar] [CrossRef]
  37. Luo, Z.; Zhao, Y. A survey of finite element analysis of temperature and thermal stress fields in powder bed fusion Additive Manufacturing. Addit. Manuf. 2018, 21, 318–332. [Google Scholar] [CrossRef]
  38. Bayerlein, F.A. Managing Form Deviation in Laser Beam Melting by Pre-Deformation. Ph.D. Dissertation, Technical University of Munich, Munich, Germany, 2020. Available online: https://nbn-resolving.de/urn/resolver.pl?urn:nbn:de:bvb:91-diss-20201015-1535958-1-4 (accessed on 30 May 2024).
  39. Bayerlein, F.; Zeller, C.; Wunderer, M.; Weirather, J.; Schmid, M.; Seidel, C.; Zaeh, M.F.; Hessert, R.; Schlick, G.; Uihlein, T.; et al. Validation of modeling assumptions for the buildup simulation of laser beam melting on the basis of the residual stress distribution. In Proceedings of the VII European Congress on Computational Methods in Applied Sciences and Engineering, Crete, Greece, 5–10 June 2016. [Google Scholar] [CrossRef]
  40. Kolbus, L.; Payzant, E.; Cornwell, P.; Watkins, T.; Babu, S.; Dehoff, R.; Lorenz, M.; Ovchinnikova, O.; Duty, C. Comparison of Residual Stresses in Inconel 718 Simple Parts Made by Electron Beam Melting and Direct Laser Metal Sintering. Metall. Mater. Trans. A 2015, 46, 1419–1432. [Google Scholar] [CrossRef]
  41. Larson, F.; Miller, J. A Time-Temperature Relationship for Rupture and Creep Stresses. Trans. Am. Soc. Mech. Eng. 1952, 74, 765–771. [Google Scholar] [CrossRef]
  42. Oberkampf, W.L.; Roy, C.J. Verification and Validation in Scientific Computing; Cambridge University Press: New York, NY, USA, 2010. [Google Scholar]
  43. Peter, N.; Pitts, Z.; Thompson, S.; Saharan, A. Benchmarking build simulation software for laser powder bed fusion of metals. Addit. Manuf. 2020, 36, 101531. [Google Scholar] [CrossRef]
  44. Spachtholz, J.; Fischersworring-Bunk, A.; Neuhäusler, S. Use of a Modified IQI Standard—A Way Forward in NDI of Metallic AM Parts? In Proceedings of the ASTM International Conference on Additive Manufacturing (ICAM 2022), Orlando, FL, USA, 31 October–4 November 2022. [Google Scholar]
  45. Schilp, J.; Seidel, C.; Krauss, H.; Weirather, J. Investigations on Temperature Fields during Laser Beam Melting by Means of Process Monitoring and Multiscale Process Modelling. Adv. Mech. Eng. 2014, 6, 217584. [Google Scholar] [CrossRef]
  46. Seidel, C.; Zaeh, M.; Wunderer, M.; Weirather, J.; Krol, T.; Ott, M. Simulation of the Laser Beam Melting Process—Approaches for an Efficient Modelling of the Beam-material Interaction. In Proceedings of the 8th International Conference on Digital Enterprise Technology—DET 2014 Disruptive Innovation in Manufacturing Engineering towards the 4th Industrial Revolution, Stuttgart, Germany, 25–28 March 2014; Volume 25, pp. 146–153. [Google Scholar] [CrossRef]
  47. Madenci, E.; Guven, I. The Finite Element Method and Applications in Engineering Using ANSYS®; Springer: Berlin/Heidelberg, Germany, 2015. [Google Scholar]
  48. Williams, R.J.; Vecchiato, F.; Kelleher, J.; Wenman, M.R.; Hooper, P.A.; Davies, C.M. Effects of heat treatment on residual stresses in the laser powder bed fusion of 316L stainless steel: Finite element predictions and neutron diffraction measurements. J. Manuf. Process. 2020, 57, 641–653. [Google Scholar] [CrossRef]
  49. Zhang, W.; Guo, D.; Wang, L.; Davies, C.M.; Mirihanage, W.; Tong, M.; Harrison, N.M. X-ray diffraction measurements and computational prediction of residual stress mitigation scanning strategies in powder bed fusion additive manufacturing. Addit. Manuf. 2023, 61, 103275. [Google Scholar] [CrossRef]
  50. Goetz, D.; Wolf, D.; Lehmann, M.; Zaeh, M.F. A novel approach for the quantitative characterization of shrink lines in the Powder Bed Fusion of metals using a laser beam. In Proceedings of the 12th CIRP Conference on Photonic Technologies [LANE 2022], Fürth, Germany, 4–8 September 2022. [Google Scholar] [CrossRef]
  51. Goetz, D.; Diller, J.; Achatz, K.; Zaeh, M.F. Shrink line impact on the fatigue resistance of Inconel 718 parts manufactured by powder bed fusion of metals using a laser beam. J. Manuf. Process. 2024, 115, 481–490. [Google Scholar] [CrossRef]
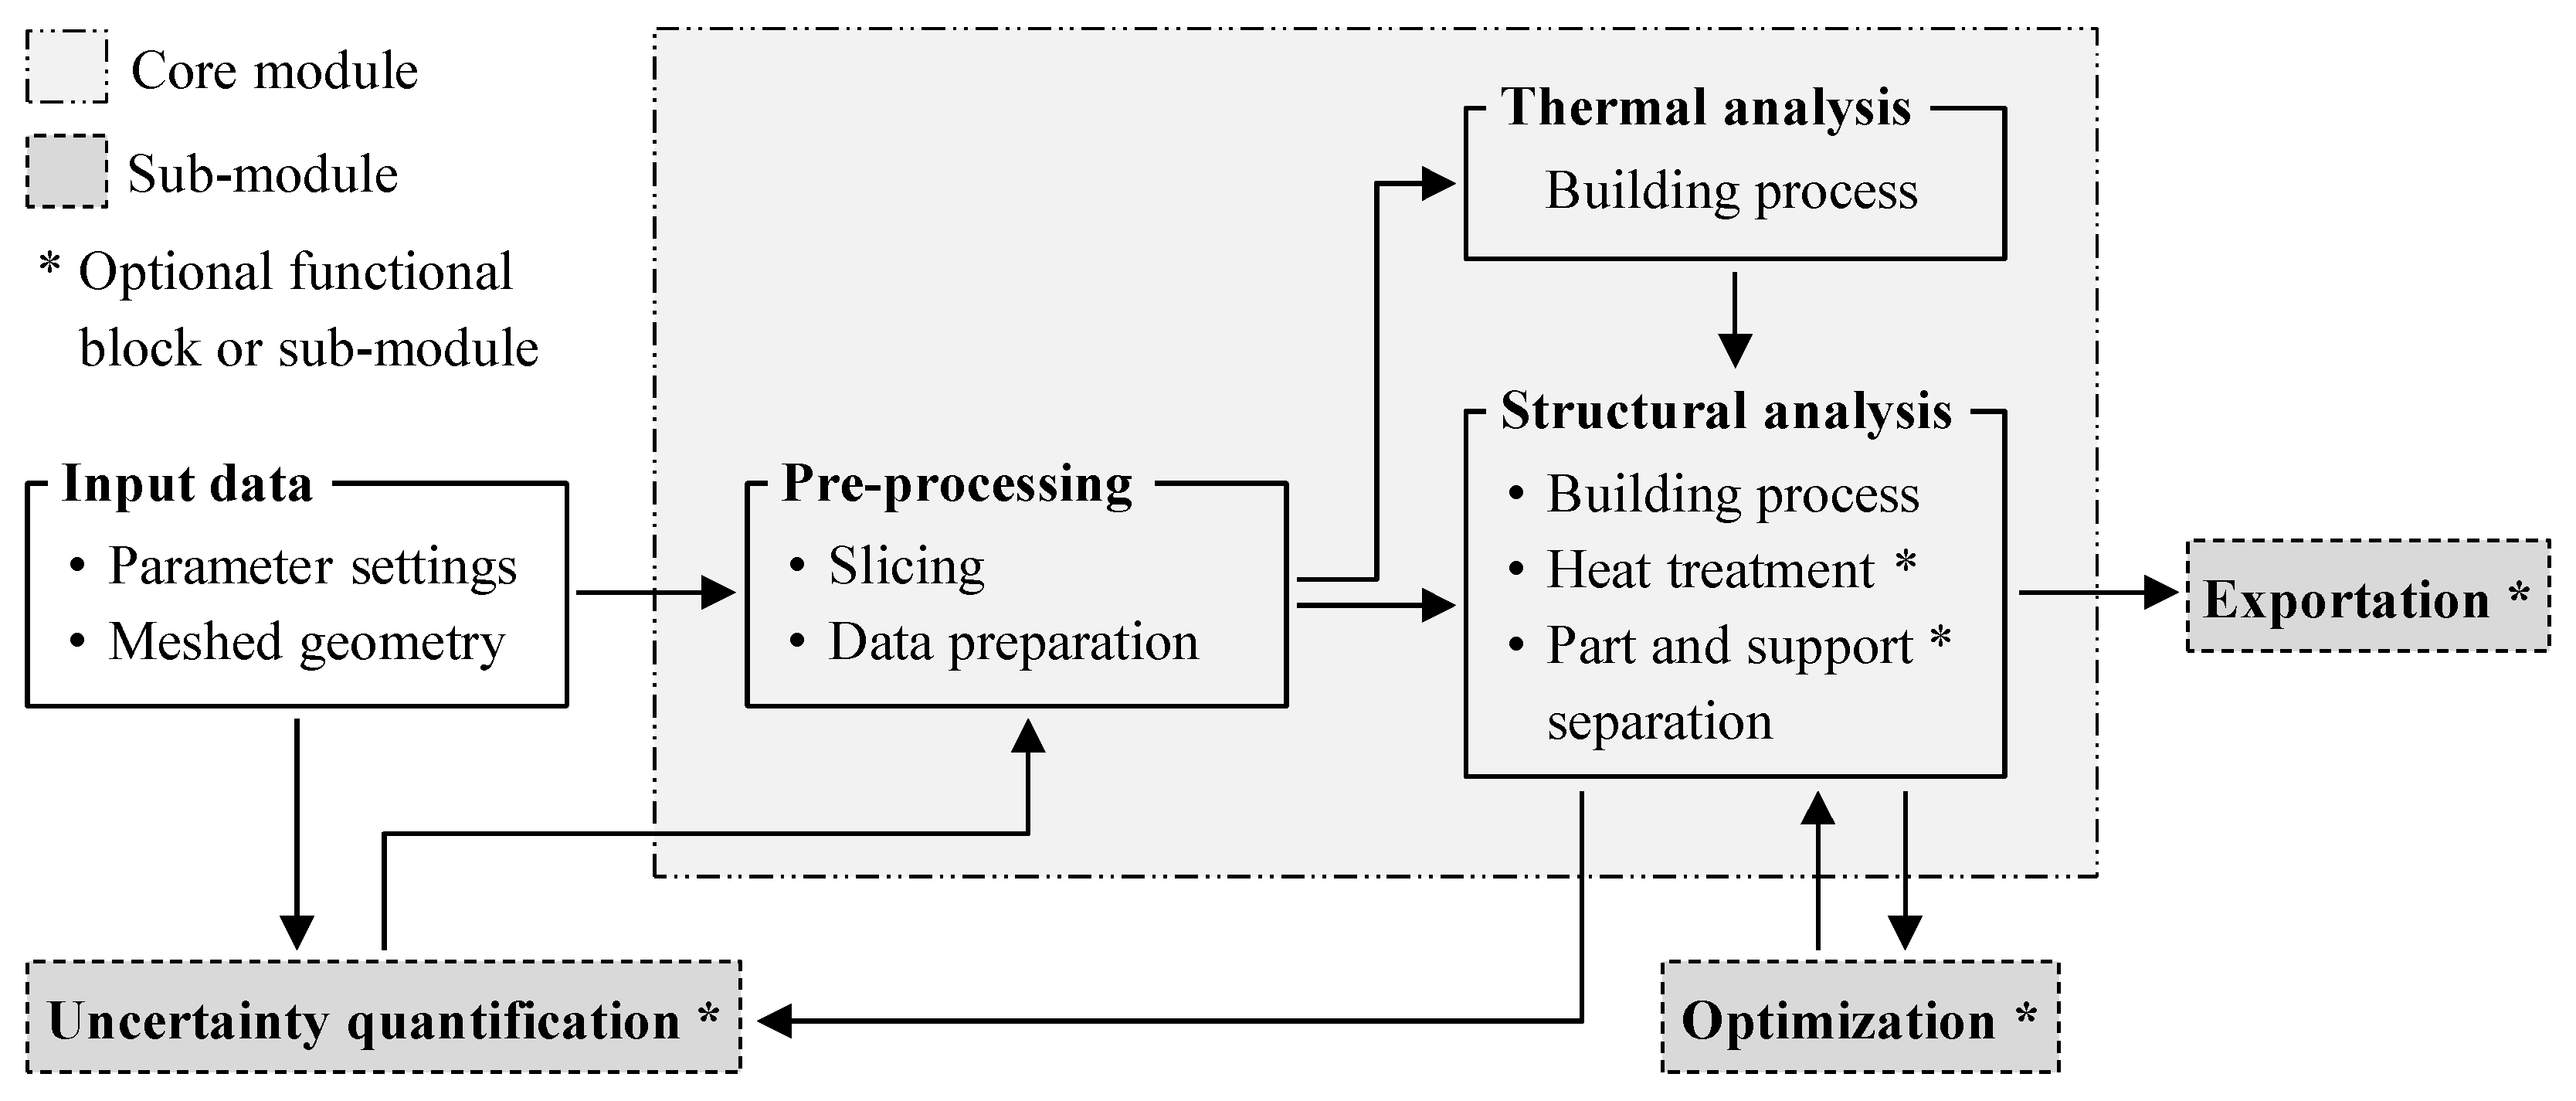
Figure 1. Schematic representation of the workflow of the simulation tool AscentAM shown for the core module with the implemented functional blocks and the optional sub-modules.
Modelling 05 00044 g001
Figure 2. Schematic representation of (a) an FE mesh, whose elements are sorted into several LCs by their center of gravity, and (b) the applied flash exposure heat source at a currently active LC showing the melting temperature T M , the process temperature T P , the build platform temperature T BP and the corresponding thermal gradient during the heating step; z: build direction.
Modelling 05 00044 g002
Figure 3. Modeling approach for the separation of the part from the build platform, exemplarily represented by twelve sequential computational steps, for each of which the interface elements are deactivated; z: build direction.
Modelling 05 00044 g003
Figure 4. True-to-scale representation of (a) the academic cantilever beam and (b) the topology-optimized bracket geometry with the marked verification points (VPs), each used for the mesh convergence study; dimensions in mm; z: build direction.
Modelling 05 00044 g004
Figure 5. True-to-scale top view of the build platforms indicating the positions of (a) the cantilever beams and (b) the brackets; exemplary representation of the local coordinate systems for each of the parts placed on the respective build platform (250 × 250 mm2).
Modelling 05 00044 g005
Figure 6. Simulation results of the cantilever beam depicted without the build platform for an FE size e = 0.50 mm and an LC height L = 1.00 mm; representation of the thermal results for (a) the heating step, (c) the first cooling step, (e) the fourth cooling step and (g) the tenth cooling step of the last LC; mechanical results shown with a five-fold scaling for (b) the heating step, (d) the first cooling step, (f) the fourth cooling step and (h) the tenth cooling step of the last LC; z: build direction.
Modelling 05 00044 g006
Figure 7. Mesh convergence results for the cantilever beam showing a converging behavior with decreasing the LC height and the FE size; nomenclature at selected evaluation points: (LC height L|FE size e).
Modelling 05 00044 g007
Figure 8. Measured form deviation between the nominal and the as-built cantilever beam after the separation (a) without applying the simulative pre-deformation algorithm and (b) using the simulative pre-deformation algorithm from the optimization sub-module; missing data points indicated by gray color; z: build direction.
Modelling 05 00044 g008
Figure 9. Form deviation of the bracket geometry (a) between the nominal geometry and the as-built part before SRA, (b) between the nominal geometry and the simulation result before SRA, (c) between the nominal geometry and the as-built part after SRA and (d) between the nominal geometry and the simulation result after SRA; missing data points indicated by gray color; z: build direction.
Modelling 05 00044 g009
Table 1. Temperatures and film coefficients during the process simulation.
ParameterSymbolValueUnit
Ambient temperature T amb 293.15K
Build platform temperature T BP 353.15K
Process temperature T P 473.15K
Melting temperature T M 1523.15K
Build platform convection [38] h platform 100.0W/(m2K)
Part convection [24] h part 10.6W/(m2K)
Table 2. Results of the convergence study performed for the topology-optimized bracket.
Verification PointDiscretization Parameters
e = 0.50 mm e = 1.00 mm e = 1.50 mm e = 2.00 mm
L = 1.00 mm L = 2.00 mm L = 3.00 mm L = 4.00 mm
VP10.885 mm1.086 mm1.595 mm1.237 mm
VP21.004 mm1.119 mm1.455 mm1.198 mm
RMS0.947 mm1.103 mm1.527 mm1.218 mm
Simulation time665,864.8 s41,933.0 s26,974.5 s12,250.0 s
Disclaimer/Publisher’s Note: The statements, opinions and data contained in all publications are solely those of the individual author(s) and contributor(s) and not of MDPI and/or the editor(s). MDPI and/or the editor(s) disclaim responsibility for any injury to people or property resulting from any ideas, methods, instructions or products referred to in the content.