Article

Comparative Study of Optimization Models for Evaluation of EDM Process Parameters on Ti-6Al-4V

by
JagadeeswaraRao Maddu
1,
Buschaiah Karrolla
1,
Riyaaz Uddien Shaik
2 and
Srikanth Vuppala
3,*
1
Department of Mechanical Engineering, University College of Engineering, Osmania University, Hyderabad 500007, Telangana, India
2
Department of Astronautics Electrical and Energy Engineering, University of Rome “La Sapienza”, Via Eudossiana 18, 00184 Rome, Italy
3
Department of Civil and Environmental Engineering, Politecnico di Milano, Piazza Leonardo da Vinci, 32, 20133 Milan, Italy
*
Author to whom correspondence should be addressed.
Modelling 2021, 2(4), 555-566; https://doi.org/10.3390/modelling2040029
Submission received: 6 September 2021 / Revised: 14 October 2021 / Accepted: 17 October 2021 / Published: 21 October 2021

Abstract

:
In this paper, different optimization techniques such as multi-objective optimization based on ratio analysis, the -nD angle, information divergence and multi-angle optimization methods were considered for comparative study in order to check their variation in results. These four techniques were considered asthese techniques were made from completely different methodologies, such as MOORA, is one of the latest multi-criteria decision-making methods that cover the weakness of other older methods and the latter three (-nD angle, Information Divergence and MAOT) methods are based on trigonometric methodologies. These optimization techniques were carried out using the effect of EDM process parameters viz., material removal rate and surface roughness as output parameters and current, pulse on time, pulse off time and different electrode materials as input process parameters. These parameters were obtained from the experiments modelled according to the Taguchi experimental design procedure in which the L18 orthogonal array was used to perform experimentation with the material of titanium alloy (Ti-6Al-4V). All the optimization techniques have obtained similar results among which -nD angle and Information Divergence technique tend to be easier and understandable for any similar application. The latter two methods avoid complexity and can be used for optimizing any relevant manufacturing process parameters such as the parameters of EDM, additive manufacturing, etc.

1. Introduction

Decision-making is an important task in almost every field of engineering when there are multiple factors involved. For instance, in the manufacturing field, in the Electrical Discharge Machining (EDM), the input process parameters affect the output parameters. In this process, the input process parameters are current (Amps), pulse-on (µs), pulse-off (µs) and flushing pressure (bar), etc., whereas output parameters could be material removal rate, electrode wear rate, radial overcut, etc. The input process parameters must be optimized in order to obtain the optimum output values [1,2,3]. Furthermore, when pursuing advances in computing systems, optimization techniques have become increasingly popular and important in different engineering applications [4].
In this study, three new simple techniques were introduced by comparing their results with the MOORA method. The output process parameters of the EDM were considered to optimize and find the suitable input process parameters for future machining procedures [5]. The EDM process follows a non-conventional machining procedure that removes the material from the substrate without being in physical contact with it. It is based on thermal energy by conversion from electrical energy which removes material by innumerable sparks between the tool electrode and the workpiece. Here, in straight polarity, the electrode acts as an anode and the workpiece act as a cathode, which develops the potential difference when they are close to each other to permit plasma channel creation between them. The thermal energy created due to potential difference leads to intense heat conditions on the workpiece causing melting and vaporizing of workpiece material. In this process, not just the workpiece is melted, but also sometimes there will be melting of an electrode which is measured with time as electrode wear rate (EWR) [6]. This change is the removal of the workpiece to electrode, which happens due to variation in process parameters, so it is important to optimize the parameters in order to machine further. Apart from the EWR, the process parameters will also cause uneven surface roughness which was considered in this study to find optimum parameters giving minimum surface roughness (SR) [7] with maximum material removal rate (MRR [8,9,10]). The EDM machine has various applications in various fields, so its parameters were considered to implement these techniques.
The input parameters that can be adjusted to obtain better output are current (Amps), pulse-on (µs), pulse-off (µs), and flushing pressure (Bar). Moreover, another parameter considered here was different electrode materials, i.e., brass, bronze, and copper, which could be optimized to find the better electrode for machining the workpiece of Ti-6Al-4V [11,12]. The experiments to be carried out were designed with the Design of Experiments (DOE) Taguchi experimental technique of L18 orthogonal array. This technique has been used in different fields for designing several experiments that have many factors to be considered. Due to the rapid development and increase in consumption of needs by individuals, industrial wastewater generation has increased abnormally [13]. There are various types of industrial wastewaters that are harmful to humans and the environment which is hard to manage the treatment process [14]. Recently, in the olive mill wastewater treatment process to validate the optimal operating conditions, gray relational analysis (GRA) was adopted [15], especially for coagulant dosage. Several researchers have developed different models to increase process efficiency and practical process assessment. The computational fluid dynamics model (CFD) was developed to analyze the distributions of radiation and chemicals through an in-flow reactor for the removal of recalcitrant organics in reverse osmosis concentrate from the coal chemical industry by UV/H2O2 and UV/PDS [16]. In another study, L.M.L.K.B. Lindamulla et al. [17] worked on an integrated mathematical model to simulate the performance of a membrane bioreactor and achieved calibration and validation of a model which enables the prediction of the system performance and membrane fouling under different operating conditions. Vuppala et al. [18] worked on olive mill wastewater treatment and proved the efficiency of the process through experimental and modeling by adapting the different pseudo-nth order models, identifying for each process step the most suitable one. This study would resolve the wastewater treatment optimization process by identifying the priorities based on multiple contradictory criteria towards a better sustainable approach that reduces CAPEX and OPEX of industries.
Here, three simple techniques (-nD angle, Information Divergence, and Multi-Angle Optimization Technique (MAOT)) are introduced to check the results in comparison with Multi-Objective Optimization of the Ratio Analysis (MOORA). The EDM output parameters were obtained by machining titanium alloy (Ti-6Al-4V) using three different electrodes [19,20,21].

2. Materials and Methods

In this work, Ti-6Al-4V alloy was used as workpiece material which has an extraordinary mechanical and thermal characteristic with outstanding resistance to corrosion, and a high strength-to-weight ratio. As it is known that traditional machining results in higher tooling costs, we use EDM, which is non-traditional machining is used to machine the material considering the economic constraints as shown in Figure 1 [22,23,24]. The low thermal conductivity, chemical composition, and the physical and mechanical properties [19] of the workpiece are given below in Table 1.
Ti-6Al-4V (material) was supplied by Jay Steel Corporation Mumbai India. Dimension of 20 mm × 20 mm × 8 mm was considered for the substrate with the help of an abrasive cutting tool machine. Then, the work pieces were surface ground and cleaned with acetone for removing the build-up edges. Polishing with grit sizes of 400, 800, and 1200 was performed in both manual and automatic modes using emery papers and then cleaned up with acetone. Workpiece and tool are directly connected to DC power supply in which positive and negative terminals are workpiece and tool, respectively, or otherwise as straight polarity [25]. The constant gap between the tool and workpiece are given by the servo feed mechanism. The layer formation due to dielectric fluid between tool and workpiece are driven for spark with a break in the circuit [26]. Electrodes made of copper, bronze, and brass materials were used in the present process of machining with the size of 12 mm diameter and 100 mm length. Prior to the ED machining process, electrodes were taken for facing operation on the lathe.

2.1. -nD Angle and Information Divergence Method

-nD angle and Information Divergence [27]. This method was introduced to check whether this gives similar results as the optimization technique MOORA method.
Given the test vector t and a reference vector r of length C, the score a is calculated as given [28] in Equation (1):
a = cos 1 [ i = 1 C t i γ i 1 = 1 N t i 2 i = 1 N γ i 2 ]
where t = test vector, a = reference vector, r = length, and C = score.
The Information Divergence (ID) method computes similarity based on the divergence between the probability distributions of the two vectors. Let t and r be test and reference vectors, respectively. Calculate the distribution values for the reference vector as given in Equation (2):
q i = γ i i = 1 c γ i
where t = test vector and r = reference vector.
Calculate the distribution value for the test vector is given in Equation (3):
P i = t i i = 1 N t i
Then, compute the ID value by using the probability distributions of the test and the references vectors as given in Equation (4):
i = 1 c p i log ( p i q i ) + i = 1 c q i log ( q i p i )
where pi = test vector data; qi = reference vector data. Then, the combination of both techniques is termed as MAOT which is described below.

2.2. Multi-Angle Optimization Technique (MAOT)

MAOT deals with two angles as per its naming, and in remote sensing it has also been used for pixel classification [27]. This is the multiplication of information divergence value with the sin of -nD angle as represented in Equation (5).
MAOT = ID × Sin (-nD angle)
This technique is more efficient than the two techniques as an individual because the -nD angle considers geometric features between two sequences, whereas ID considers two sequences as random and finds the probability values.

2.3. MOORA Methodology

MOORA stands for Multi-Objective Optimization based on Ratio Analysis which optimizes the two or more contradictory attributes simultaneously
Here, some criteria may be maximized and others may be minimized according to the requirement, but it considers both maximization and minimization principles for the selection of desired alternatives among all alternatives [29,30,31]. The steps for the optimization are as follows.
The first step is to develop a decision matrix showing the pertinent evaluation attributes for different alternatives:
X = | X 11 X 12     X 1 b X 21 X 22     X 2 b X a 1 X a 2 X a b |
Here, xij is the performance measure of ith alternative in jth criterion, wherein “a” is a number of alternatives and “b” is a number of criteria. The second step is the normalization of the decision matrix which is proposed as a ratio system to calculate the normalized performance as shown in Equation (7).
X i j * = X i j i = 1 a x i j 2
Here, X i j * lies in [0, 1] and represents the normalized performance. The third step is the calculation of the overall performance as per Equation (7).
y A = J = 1 k X i j * J = k + 1 b X i j *
Here, “k” is the number of parameters that need to be maximized and “bk” is the number of parameters that need to be minimized. “yA” is the assessment value of ith alternative concerning all the parameters. In many situations, it is witnessed that certain output parameters are more essential than the other parameters. In such situations, to provide more importance to certain parameters, individual weightage value needs to be multiplied. By considering the weightage value, Equation (8) can be modified as per Equation (9).
y A = j = 1 k W j × X i j * j = k + 1 b W j × X i j *
Subjected to
j = 1 n w j = 1  
Here, Wj is the weightage value of output parameters. The value of “yA” can be positive or negative. The ranking of the yA value helps in assigning a sequence of preference of experiments. In other words, the highest value of yA can be considered as the best sequence of operation and vice versa.

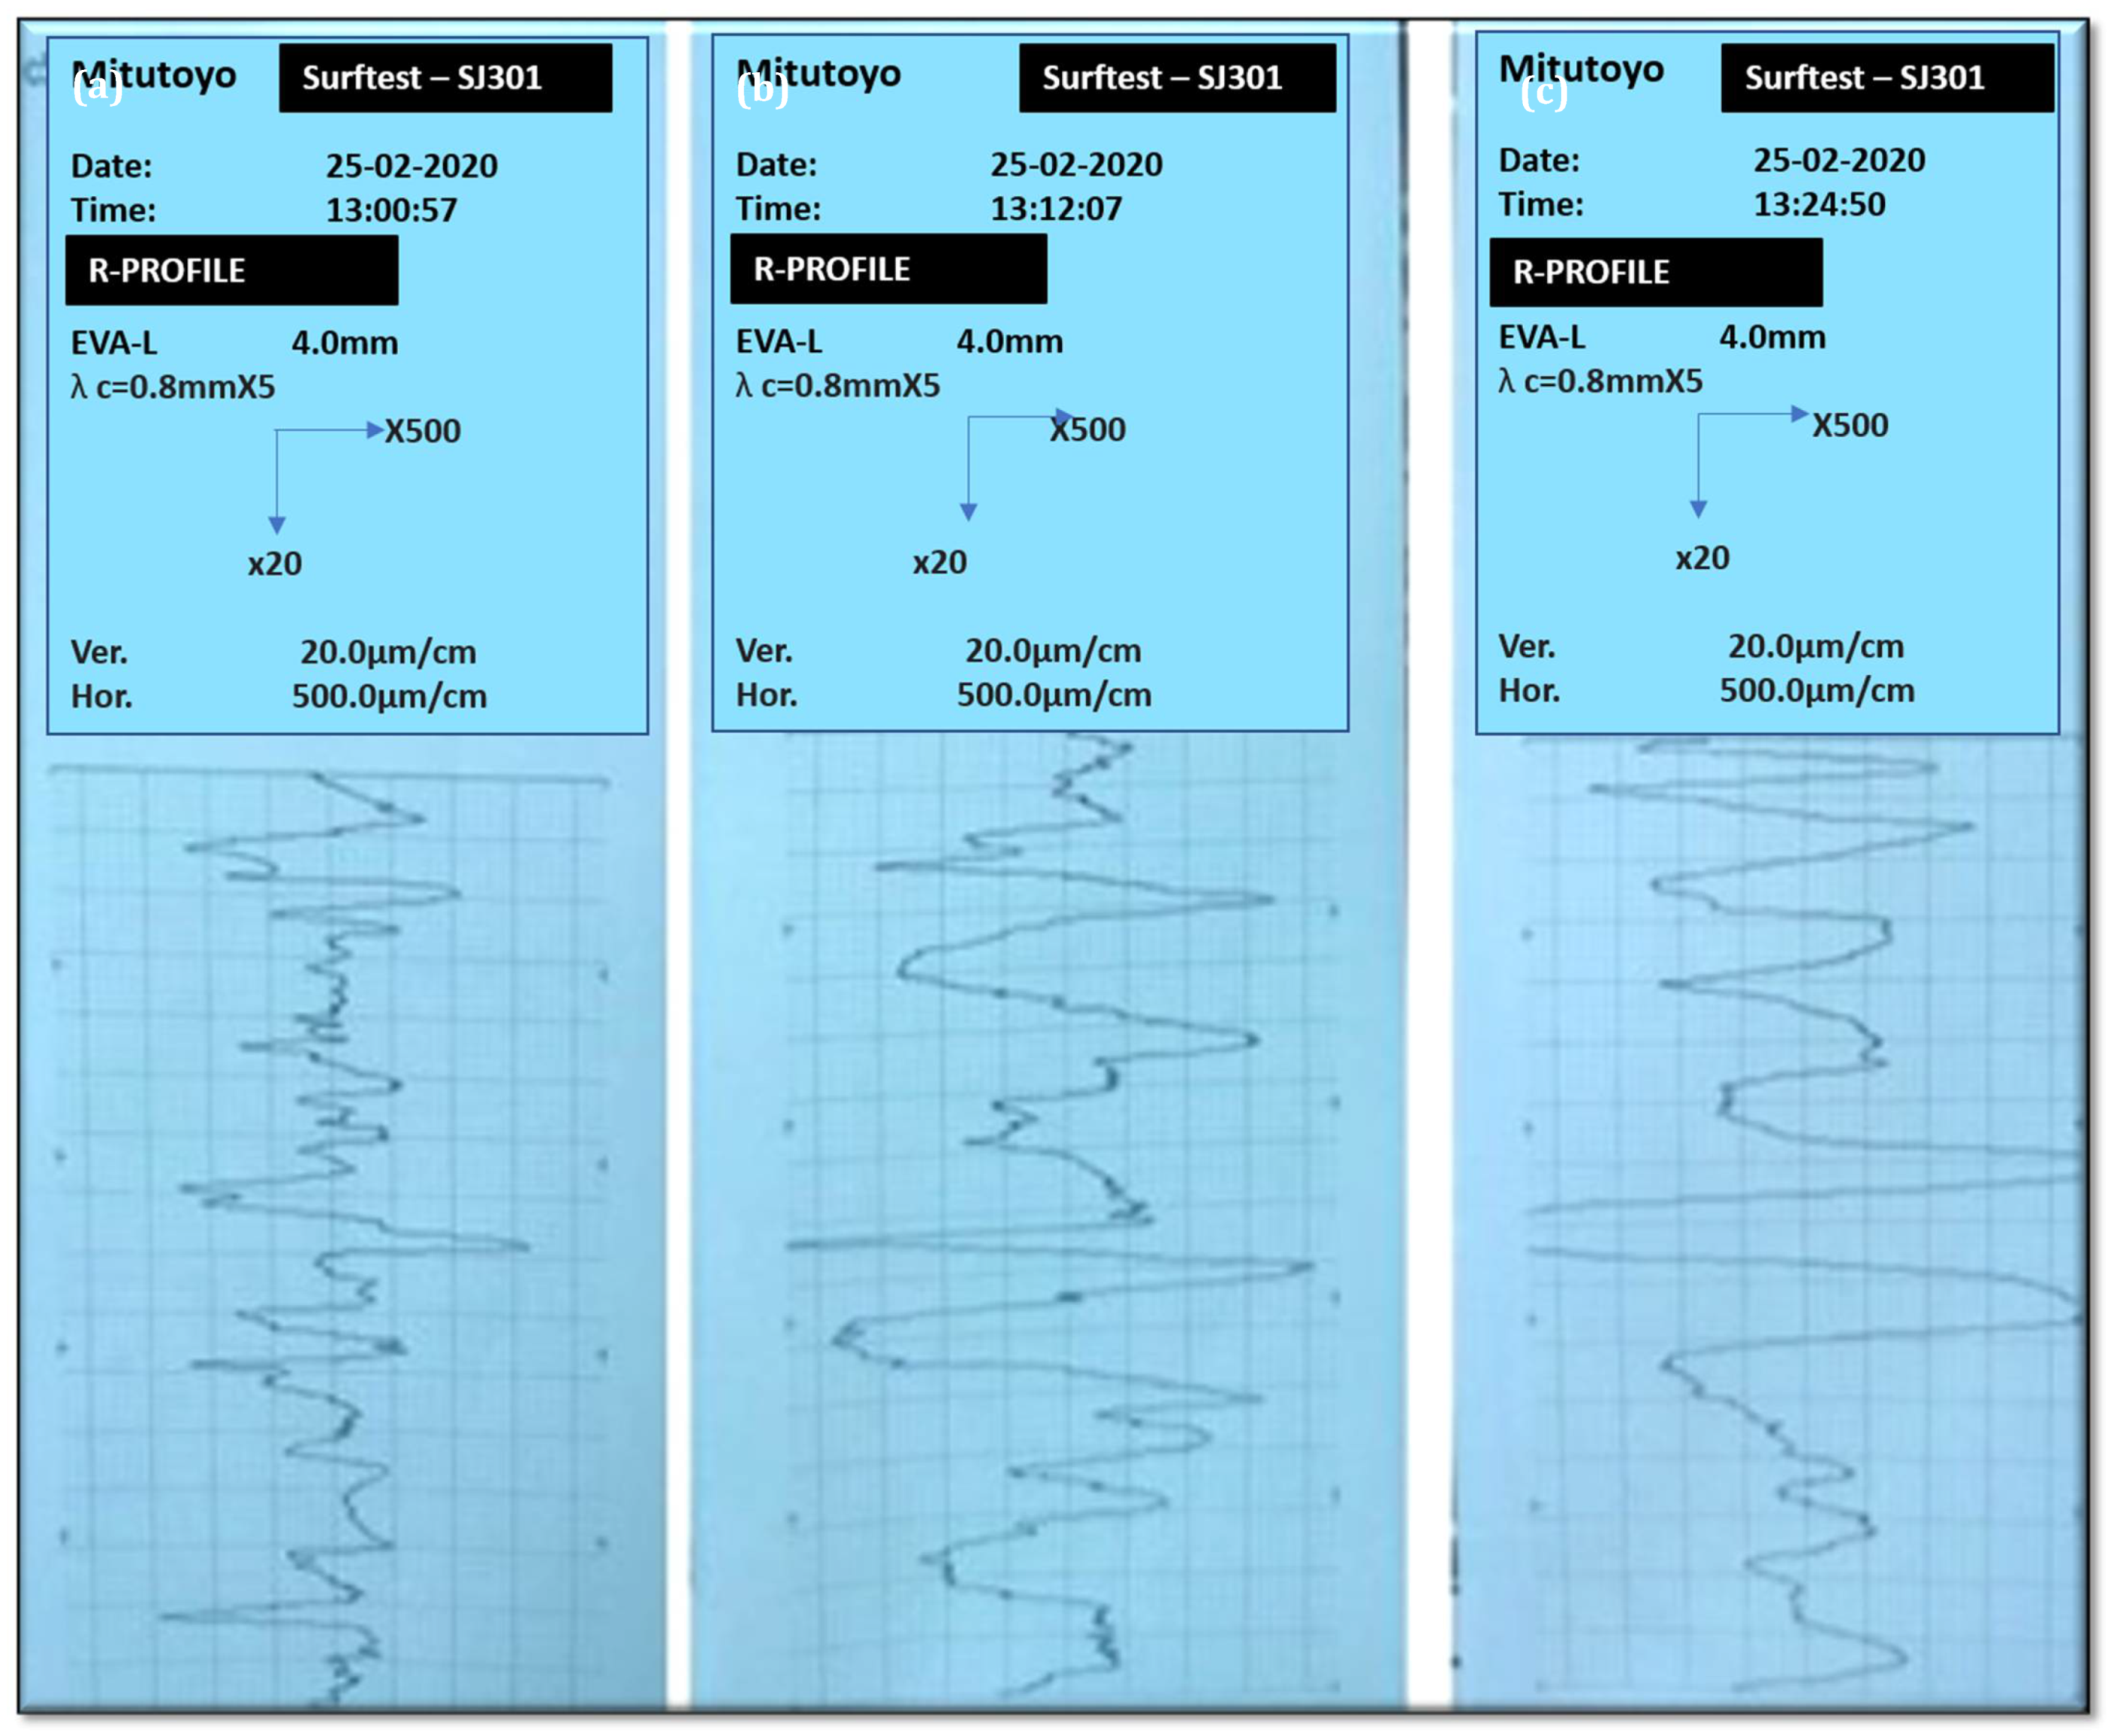
3. Experimental Procedure

These experiments were conducted to study machining parameters with respect to their effect on EDM [32]. Here, four input parameters were considered for conducting the experiments: current (Amps), pulse on time (µs), pulse off time (µs), flushing pressure (bar), and different electrode materials (copper, bronze, and brass). The experiments were conducted based on Taguchi L18 orthogonal array which suggests to conducts 18 experiments. The experiments were carried out on the material of Titanium Alloy (Ti-6Al-4V) which has its application in various fields such as aerospace, biomedical, wastewater treatment plants, automobiles, etc., Here, it was used to demonstrate the new optimization techniques in the field of machining. Minitab 17 software was used to design the number of experiments [33]. The combination of parameters is shown in Table 2.
The output parameters considered in this study are material removal rate (MRR) and surface roughness (SR) [34]. Material removal rate can be defined as the relation of difference in material weight before and after the machining to the time taken for the machining process which is represented in Equation (1).
M R R = W B M W A M T i m e
Here, WBM = Weight before machining and WAM = Weight after machining.
A surface roughness tester was used to measure the surface roughness of the substrate. A Surftester (Model: SJ301, Make: Mitutoyo), as shown in Figure 2, was used to evaluate the surface of the machined specimens, and it provides the surface profiles of the surface. The tester compares the surface with respect to the plane typical to that surface, ordinarily, at right angles, and a measure of surface peaks and valleys was taken for optimizing the output parameters in order to find the optimum sequence of input parameters. Therefore, material removal rate and surface roughness are considered following the criteria of higher-the-better and lower-the-better, respectively [3,35]. The real profile is the profile obtained concerning the convergence of the workpiece surface and a plane typical to that surface. A path that increases the surface roughness value, ordinarily at right angles to the lay of the machining marks.
Surface flaws, like breaks, scratches, and marks, are not part of the profile and should not be remembered for the chronicle. In that event, essential resiliences as per DIN EN ISO 8785 can be set for them. The essential profile (R-profile) is the profile that results because of electronic low-pass sifting of the deliberate profile with a remove frequency λs. This process eliminates the shortest wavelength components that are specified not relevant to a roughness measurement.
Figure 3 shows the surface roughness measurements, i.e., surface roughness readings related to experiments 1, 4, and 9, which indicate roughness interpretations of maximum, medium, and minimum, respectively. Maximum roughness depth Rz1max for surfaces in which individual deviations have a significant influence on the function of the surface. Mean roughness depth Rz as a rule for all other surfaces. The arithmetical mean roughness value Ra is hardly affected by individual peaks or valleys because it is the mean value of the whole profile. It is, therefore, only of minor importance. In addition, the measuring point pitch Δx and the cut-off wavelength λ s of the low-pass filter are standardized. These values are, however, preset in roughness measurement devices.

4. Results and Discussions

Surface roughness (Ra) is the output parameter, which is not directly considered in this study, but desired values of input parameters are fixed with respect to the surface roughness. For example, in the case of surface roughness, the requirement is to obtain a lower surface roughness value. Therefore, from the literature, it was understood that for obtaining the lower value of surface roughness, it is better to have lower current, lower pulse on time, lower pulse off time, and lower flushing pressure. However, according to the design of experiments, it is not possible to select a suitable combination of parameters. Therefore, there is a requirement of optimization techniques to find a suitable combination of parameters for obtaining a lesser value of surface roughness. Table 3 shows the MRR and surface roughness values obtained for all the experiments in which a minimum of 0.19639 mm3/min and 3.8825 µm and a maximum of 3.65237 mm3/min and 11.61 µm and the maximum are obtained for the experiments number 3 MRR and 8 SR for minimum and 13 MRR and 9 SR (Ra) for maximum, respectively.

4.1. -nD angle, MAOT and Information Divergence

Table 4 shows the values obtained for -nD angle, MAOT and ID methods by following the Equations (1), (3) and (5), respectively. All the values of experiments obtained the same values for the considered optimization methods. Here, the least value obtained is considered as the first rank. Therefore, the first rank was obtained for experiment number 14 having the input parameters as current (20 Amps), pulse-on (400 µs), pulse-off (80 µs), flushing pressure (0 bar), and the electrode of bronze material. Now, the results were to be compared with the MOORA method. MOORA gives similar results like this so it can be understood that -nD angle, MAOT and ID methods are easy to process with only one formula to obtain similar results as MOORA which is a five-step method.

4.2. Multi-Objective Optimization Based on Ratio Analysis (MOORA)

This optimization is used in electrical discharge machining since it can help in maximizing the desired benefits/outputs by minimizing the efforts/inputs request. Here, the MOORA multi-response optimization technique was used for comparing the results of newly introduced with these well-established methods. This method also has a weightage factor that can be provided to give more importance to certain parameters, but in this study, equal weightage was considered for all the parameters. Weightage factors are generally chosen according to the importance of different output parameters. To show the application and calculation of the weightage factor, here, it is taken the same weightage factor as 0.5 (equal weightage for two parameters) for each parameter. Optimized data values and final ranking are shown in Table 4. The response table also provides rank as per the most effective parameter. The highest value of each factor is taken as the optimum level for overall performance characteristics.
Table 5 represents the normalized values obtained by following Equation (7), and this helps to bring all the values in the range of [0, 1]. Then, the weighted values are normalized by considering the weightage of 0.5. The final step of calculation of overall performance was shown that helps to find out the optimum level. In this case, the optimum value was obtained for experiment number 14 having the input parameters as current (20 Amps), pulse-on (400 µs), pulse-off (80 µs), flushing pressure (0 bar), and the electrode of bronze material.
Figure 4 shows the graph comparing all the methods, i.e., -nD angle, Information Divergence, Multi-Angle Optimization Technique, and MOORA methods. From this figure, it can be observed that experiment numbers 2, 13, 14, and 17 have obtained the same results for all the methods whereas the former three methods have obtained the same results throughout the study. The first rank was given for experiment number 14 which is satisfying the optimum conditions. It could be observed that MRR is not the highest value here and SR is also not the lowest. In reality, experiment number 9 has the highest MRR and experiment number 8 has the lowest SR. In such situations, optimization techniques play a significant role.
To compare, relevant research carried out by other researchers is included here. Techniques such as Gray Relational Analysis [36], TOPSIS, Neural Network, Genetic Algorithm, Artificial Bee Colony Optimization, Finite Element Method, Simulated Annealing, Ant Colony Optimization Algorithm, Particle Swarm Optimization, Fuzzy-Optimization, and Sheep Flock Heredity Algorithm were implemented previously to optimize the electrical discharge parameters [37,38]. As few electrical discharge parameters exist, complex algorithms are not required for their optimization. They could be optimized by simple techniques as introduced in this study which provides similar results as the above mentioned [39].

5. Conclusions

In this study, optimization methods for Electrical Discharge Machining process parameters—current (Amps), pulse on time (µs), pulse off time (µs), flushing pressure (bar), and different electrodes measuring its output parameters (material removal rate and surface roughness)—have been compared to choose a simple technique for future implementation.
It was understood that techniques with a simple trigonometrical approach give the same results as the complicated optimization techniques which are popularly used in EDM machining for process parameters optimization. Among the experiments conducted using a different combination of input parameters, the input parameters of experiment number 14 were chosen as the optimum parameters (current 20 Amps, pulse-on 400 µs, pulse-off 80 µs, flushing pressure is zero, and bronze electrode) for obtained the condition of maximum material removal rate (2.47404 g) and minimum surface roughness (3.885 µm).
These techniques could also be extended for other applications such as in optimizing the process parameters in additive manufacturing for optimizing process parameters, in selecting wastewater treatment (optimum combination of parameters, the dosage of coagulants, catalysts in Advanced oxidation processes, etc.) in automobile and aerospace project management, etc.

Author Contributions

Conceptualization, J.M., S.V., R.U.S. and B.K.; methodology, J.M., S.V. and R.U.S.; investigation, J.M., S.V. and R.U.S.; software, J.M., R.U.S. and S.V.; resources, J.M., S.V. and B.K.; data curation, J.M., S.V. and R.U.S.; writing—original draft preparation, J.M., S.V. and R.U.S.; writing—review and editing, J.M., S.V. and R.U.S.; supervision, B.K. All authors have read and agreed to the published version of the manuscript.

Funding

This research received no external funding.

Data Availability Statement

Not applicable.

Acknowledgments

The authors would like to thank S Arun Kumar, Technician, Production Lab, A Krishnaiah, Production Lab In-Charge and Rega Rajendra, Head, Department of Mechanical Engineering, University College of Engineering, Osmania University, for their full support while conducting experiments.

Conflicts of Interest

The authors declare no conflict of interest. The funders had no role in the design of the study; in the collection, analyses, or interpretation of data; in the writing of the manuscript; or in the decision to publish the results.

Nomenclature

Acronym/ SymbolFull Form/Unit
EDMElectrical Discharge Machine
MAOTMulti-Angle Optimization Technique
MOORAMulti-Objective Optimization based on Ratio Analysis
WBMWeight before machining (grams)
WAMWeight after machining (grams)
Pulse On and Offµs
CurrentAmps
MRRMaterial Removal Rate (MM3/Min)
SR(Ra)Surface Roughness (Ra) µm
FPFlushing Pressure (bar)

References

  1. Jagadeeswara Rao, M.; Uddien Shaik, R.; Buschaiah, K. Electrical Discharge Machining: A Comparative Surface Integrity Study for Incoloy-800. Mater. Today Proc. 2020, 22, 3286–3296. [Google Scholar] [CrossRef]
  2. Sahu, A.K.; Thomas, J.; Mahapatra, S.S. An intelligent approach to optimize the electrical discharge machining of titanium alloy by simple optimization algorithm. Proc. Inst. Mech. Eng. Part E J. Process. Mech. Eng. 2021, 235, 371–383. [Google Scholar] [CrossRef]
  3. Rao, M.J.; Shaik, R.U.; Buschaiah, K.; Krishnaiah, A. Optimization of EDM Process Parameters using ANOVA and GRA on Stainless Steel-304. In Proceedings of the Technical Volume of 34th Indian Engineering Congress, Hyderabad, India, 27–29 December 2019. [Google Scholar]
  4. Jain, S.; Parashar, V. Critical review on the impact of EDM process on biomedical materials. Mater. Manuf. Process. 2021, 1–24. [Google Scholar] [CrossRef]
  5. Banu, A.; Ali, M.Y. Electrical Discharge Machining (EDM): A Review Electrical Discharge Machining (EDM): A Review. Int. J. Eng. Mater. Manuf. 2016, 2–10. [Google Scholar] [CrossRef]
  6. Kumar, A.; Siba, S.; Mahapatra, S. Surface Characteristics of EDMed Titanium Alloy and AISI 1040 Steel Workpieces Using Rapid Tool Electrode. Arab. J. Sci. Eng. 2020, 45, 699–718. [Google Scholar] [CrossRef]
  7. Yan, H.; Kabongo, D.B.; Yan, Z.; Han, F.; Chen, Z. Sustainable production of high-uniformity workpiece surface quality in wire electrical discharge machining by fabricating surface microstructure on wire electrode. J. Clean. Prod. 2020, 259, 120881. [Google Scholar] [CrossRef]
  8. Kumar, R.; Roy, S.; Gunjan, P.; Sahoo, A.; Sarkar, D.D.; Das, R.K. Analysis of MRR and Surface Roughness in Machining Ti-6Al-4V 2nd International Conference on Materials Manufacturing and Design Engineering ELI Titanium Alloy Using EDM Process Analysis of MRR and Surface Roughnes. Procedia Manuf. 2018, 20, 358–364. [Google Scholar] [CrossRef]
  9. Reddy, V.V.; Kumar, A.; Valli, P.M.; Reddy, C.S. Influence of surfactant and graphite powder concentration on electrical discharge machining of PH17-4 stainless steel. J. Braz. Soc. Mech. Sci. Eng. 2015, 37, 641–655. [Google Scholar] [CrossRef]
  10. Kolli, M.; Kumar, A. Parametric Optimization of Boron Carbide Powder Added Electrical Discharge Machining of Titanium Alloy. Appl. Mech. Mater. 2014, 592–594, 678–683. [Google Scholar] [CrossRef]
  11. Wu, H.; Ma, J.; Meng, Q.; Jahan, M.P.; Alavi, F. Numerical modeling of electrical discharge machining of Ti-6Al-4V. Procedia Manuf. 2018, 26, 359–371. [Google Scholar] [CrossRef]
  12. Yadav, U.S.; Yadava, V. Experimental Investigation on Electrical Discharge Drilling of Ti-6Al-4V Alloy. Mach. Sci. Technol. 2015, 19, 515–535. [Google Scholar] [CrossRef]
  13. Naidoo, S.; Olaniran, A.O. Treated wastewater effluent as a source of microbial pollution of surface water resources. Int. J. Environ. Res. Public Health 2013, 11, 249–270. [Google Scholar] [CrossRef] [Green Version]
  14. Adar, E.; Delice, E.K.; Adar, T. Prioritizing of industrial wastewater management processes using an integrated AHP–CoCoSo model: Comparative and sensitivity analyses. Int. J. Environ. Sci. Technol. 2021. [Google Scholar] [CrossRef]
  15. Vuppala, S.; Shaik, R.U.; Stoller, M. Multi-response optimization of coagulation and flocculation of olive mill wastewater: Statistical approach. Appl. Sci. 2021, 11, 2344. [Google Scholar] [CrossRef]
  16. Li, W.; Zhang, M.; Wang, H.; Lian, J.; Qiang, Z. Removal of recalcitrant organics in reverse osmosis concentrate from coal chemical industry by UV/H2O2 and UV/PDS: Efficiency and kinetic modelling. Chemosphere 2022, 287, 131999. [Google Scholar] [CrossRef] [PubMed]
  17. Lindamulla, L.M.L.K.B.; Jegatheesan, V.; Jinadasa, K.B.S.N.; Nanayakkara, K.G.N.; Othman, M.Z. Integrated mathematical model to simulate the performance of a membrane bioreactor. Chemosphere 2021, 284, 131319. [Google Scholar] [CrossRef]
  18. Vuppala, S.; Bavasso, I.; Stoller, M.; di Palma, L.; Vilardi, G. Olive mill wastewater integrated purification through pre-treatments using coagulants and biological methods: Experimental, modelling and scale-up. J. Clean. Prod. 2019, 236, 117622. [Google Scholar] [CrossRef]
  19. Stráský, J.; Janeček, M.; Harcuba, P.; Bukovina, M.; Wagner, L. The effect of microstructure on fatigue performance of Ti-6Al-4V alloy after EDM surface treatment for application in orthopaedics. J. Mech. Behav. Biomed. Mater. 2011, 4, 1955–1962. [Google Scholar] [CrossRef]
  20. Tang, L.; Du, Y.T. Experimental study on green electrical discharge machining in tap water of Ti–6Al–4V and parameters optimization. Int. J. Adv. Manuf. Technol. 2013, 70, 469–475. [Google Scholar] [CrossRef] [Green Version]
  21. Prakash, C.; Singh, S.; Pruncu, C.I.; Mishra, V.; Królczyk, G.; Pimenov, D.Y.; Pramanik, A. Surface modification of Ti-6Al-4V alloy by electrical discharge coating process using partially sintered Ti-Nb electrode. Materials 2019, 12, 1006. [Google Scholar] [CrossRef] [Green Version]
  22. Czelusniak, T.; Higa, C.F.; Torres, R.D.; Laurindo, C.A.H.; Júnior, J.M.F.D.P.; Lohrengel, A.; Amorim, F.L. Materials used for sinking EDM electrodes: A review. J. Braz. Soc. Mech. Sci. Eng. 2018, 41, 14. [Google Scholar] [CrossRef]
  23. Nimbalkar, V.S.; Shete, M.T. Electric Discharge Machining (EDM) of Titanium Alloys: A Review. Int. J. Eng. Res. 2017, V6, 776–778. [Google Scholar] [CrossRef]
  24. Chandrashekarappa, M.P.G.; Kumar, S.; Jagadish, J.; Pimenov, D.; Giasin, K. Experimental analysis and optimization of edm parameters on hchcr steel in context with different electrodes and dielectric fluids using hybrid taguchi-based pca-utility and critic-utility approaches. Metals 2021, 11, 419. [Google Scholar] [CrossRef]
  25. Fauchais, P.; Vardelle, A.; Dussoubs, B. Quo vadis thermal spraying? J. Therm. Spray Technol. 2001, 10, 44–66. [Google Scholar] [CrossRef]
  26. Homayoun, H.; Shahbaz, M.; Ebrahimi, R. Investigation of Floating and Single-Action Dies in Producing Dense Compacts with High Aspect Ratio. Iran. J. Sci. Technol. Trans. Mech. Eng. 2019, 44, 1005–1011. [Google Scholar] [CrossRef]
  27. Shaik, R.U.; Fusilli, L.; Giovanni, L. New Approach of Sample Generation and Classification for Wildfire Fuel Mapping on Hyperspectral (Prisma) Image. In Proceedings of the 2021 IEEE International Geoscience and Remote Sensing Symposium IGARSS, Brussels, Belgium, 11–16 July 2021; pp. 5417–5420. [Google Scholar] [CrossRef]
  28. Maddu, J.; Karrolla, B.; Vuppala, S.; Shaik, R.U. Formation and Optimization of Electrical Discharge Coatings Using Conventional Electrodes. Energies 2021, 14, 5691. [Google Scholar] [CrossRef]
  29. Muniappan, A.; Raj, J.A.; Jayakumar, V.; Prakash, R.S.; Sathyaraj, R. Optimization of WEDM process parameters using standard deviation and MOORA method. IOP Conf. Ser. Mater. Sci. Eng. 2018, 402, 012139. [Google Scholar] [CrossRef]
  30. Mukhuti, A.; Rout, A.; Tripathy, S. Optimization of INCONEL 600 using wire EDM by MOORA and Taguchi’s method. In 2016 International Conference on Electrical, Electronics, and Optimization Techniques (ICEEOT); IEEE: Piscataway, NJ, USA, 2016; pp. 1577–1582. [Google Scholar] [CrossRef]
  31. Sahoo, S.K.; Naik, S.S.; Rana, J. Experimental Analysis of Wire EDM Process Parameters for Micromachining of High Carbon High Chromium Steel by Using MOORA Technique. Micro Nano Mach. Eng. Mater. 2018, 137–148. [Google Scholar] [CrossRef]
  32. Izwan, N.S.L.B.; Feng, Z.; Patel, J.B.; Hung, W.N. Prediction of Material Removal Rate in Die-sinking Electrical Discharge Machining. Procedia Manuf. 2016, 5, 658–668. [Google Scholar] [CrossRef] [Green Version]
  33. Varma, K.S.; Rao, M.J.; Uddien, S.R. Multi-Response Optimization and Regression Analysis of Process Parameters for Wire-EDMed HCHCr Steel Using Taguchi’s Technique. Mech. Mater. Sci. Eng. 2017, 10. [Google Scholar] [CrossRef]
  34. Buschaiah, K.; Jagadeeswararao, M.; Krishnaiah, A. Investigation on the Influence of Edm Parameters on Machining Characteristics for Aisi 304. Mater. Today Proc. 2018, 5, 3648–3656. [Google Scholar] [CrossRef]
  35. JagadeeswaraRao, M.; Shaik, R.U.; Buschaiah, K. Grey Relational Analysis of EDM Process Parameters for Incoloy-800. In International Conference on Emerging Trends in Engineering (ICETE); Satapathy, S., Raju, K., Molugaram, K., Krishnaiah, A., Tsihrintzis, G., Eds.; Learning and Analytics in Intelligent Systems; Springer: Cham, Switzerland, 2019; Volume 2. [Google Scholar] [CrossRef]
  36. Maniyar, K.G.; Ingole, D.S. Multi response Optimization of EDM Process Parameters for Aluminium Hybrid Composites by GRA. Mater. Today Proc. 2018, 5 Pt 3, 19836–19843. [Google Scholar] [CrossRef]
  37. Maddu, J.; Buschaiah, K.; Shaik, R.U. A Review on Electrical Discharge Coating (EDC) and its Multi-Optimization Techniques. IOP Conf. Ser. Mater. Sci. Eng. 2021, 1185, 012027. [Google Scholar] [CrossRef]
  38. Meel, R.; Singh, V.; Katyal, P.; Gupta, M. Optimization of process parameters of micro-EDD/EDM for magnesium alloy using Taguchi based GRA and TOPSIS method. Mater. Today Proc. 2021. [Google Scholar] [CrossRef]
  39. Sahu, A.K.; Mahapatra, S.S.; Chatterjee, S.; Thomas, J. Optimization of surface roughness by MOORA method in EDM by electrode prepared via selective laser sintering process. Mater. Today Proc. 2018, 5 Pt 3, 19019–19026. [Google Scholar] [CrossRef]
Figure 1. Computer numerical control die-sinking EDM.
Modelling 02 00029 g001
Figure 2. Experimental setup of surface roughness: (a) Surface roughness tester. (b) Stylus. (c) Specimen preparation. (d) Surface roughness measuring.
Modelling 02 00029 g002
Figure 3. Surface roughness profile graphs: Experiment 1 (a). Experiment 4 (b). Experiment 9 (c).
Modelling 02 00029 g003
Figure 4. Comparison of optimization methods w.r.t. experimental ranking and output parameters.
Modelling 02 00029 g004
Table 1. Ti-6Al-4V Chemical composition.
ElementTitaniumAluminiumVanadiumIronOxygenCarbonNitrogenHydrogenRef
Weight%89.464–905.5–6.753–4.5<0.3<0.2<0.1<0.05<0.015[19]
Table 2. Experimental layout using L18 orthogonal array.
RunCurrent (Amps)Ton (µs)Toff (µs)FlushingElectrodes
Pressure
(bar)
110200400Copper-1
210400800.5Bromnze-1
3106001201Brass-1
420200400.5Bronze-2
520400801Brass -2
6206001200Copper-2
730200400Brass-3
830400800.5Copper-3
9306001201Bronze-3
1010200401Bronze-4
1110400800Brass-4
12106001200.5Copper-4
1320200401Copper-5
1420400800Bronze-5
15206001200.5Brass-5
1630200400.5Brass-6
1730400801Copper-6
18306001200Bronze-6
Table 3. Experimental data of MRR and SR.
Input ParametersOutput Parameters
ExperimentsCurrent (Amps)Ton (μs)Toff (μs)Flushing Pressure (bar)ElectrodesMRR (mm3/min)Ra (µm)
110200400Copper-11.164794.95
210400800.5Bromnze-10.966149.13
3106001201Brass-10.196396.545
420200400.5Bronze-23.27546.805
520400801Brass-20.2392811.02
6206001200Copper-20.792336.9325
730200400Brass-30.620774.4675
830400800.5Copper-31.501133.8825
9306001201Bronze-31.8124211.61
1010200401Bronze-41.417617.015
1110400800Brass-40.822997.5125
12106001200.5Copper-40.4040611.32
1320200401Copper-53.652376.02
1420400800Bronze-52.474043.885
15206001200.5Brass-50.214949.02
1630200400.5Brass-60.708810.13
1730400801Copper-60.857797.515
18306001200Bronze-62.063216.1
Table 4. Closeness of -nD angle, MAOT, and ID.
Experiments-nd AngleRankIDRankMAOTRank
10.52375960.40774460.2039283166
20.649438130.850006130.51403155713
30.724869161.569646161.04073357216
40.30627130.10708530.0322868073
50.733156181.74672181.16893654318
60.641067100.805553100.48176168210
70.61679790.69372690.4012690219
80.38592940.18307540.0689130224
90.60000780.62809680.3546532698
100.55546870.48695270.2567896237
110.645751120.829998120.49949145312
120.719186151.473113150.9704470915
130.2095320.04698420.0097726482
140.18781310.03732710.0069694251
150.731041171.696185171.13244939917
160.685009141.089674140.68941491914
170.641214110.806301110.48230403411
180.42871450.23730250.0986466165
Table 5. Normalized decision and weighted matrices.
ExperimentsNormalization of Decision MatrixNormalized Weighted MatrixYA
MRR (gm)Ra (µm)MRR (gm)Ra (µs)
10.1689740.1493080.0281620.024885−3.78521
20.1401560.2753910.0233590.045898−8.16386
30.028490.1974190.0047480.032903−6.34861
40.4751560.2052610.0791930.03421−3.5296
50.0347120.3323990.0057850.0554−10.7807
60.1149420.2091070.0191570.034851−6.14017
70.0900540.1347540.0150090.022459−3.84673
80.2177660.1171090.0362940.019518−2.38137
90.2629240.3501960.0438210.058366−9.79758
100.205650.2115950.0342750.035266−5.59739
110.119390.2266020.0198980.037767−6.68951
120.0586160.3414480.0097690.056908−10.9159
130.5298430.1815830.0883070.030264−2.36763
140.3589040.1171840.0598170.019531−1.41096
150.0311810.2720730.0051970.045345−8.80506
160.1028240.3055540.0171370.050926−9.4212
170.1244380.2266770.020740.037779−6.65721
180.2993060.1839960.0498840.030666−4.03679
Publisher’s Note: MDPI stays neutral with regard to jurisdictional claims in published maps and institutional affiliations.

