Tensile Fracture Mechanism of Masonry Wallettes Parallel to Bed Joints: A Stochastic Discontinuum Analysis

 ,
,  , and
, and
Abstract
1. Introduction
- To investigate the effect of nonlinear contact properties on the macro behavior of the masonry wallettes subjected to tension parallel to bed joints.
- To gain a better understanding of the tensile fracture mechanism in masonry, considering strong masonry unit–weak mortar joint and weak masonry unit–strong mortar joint systems.
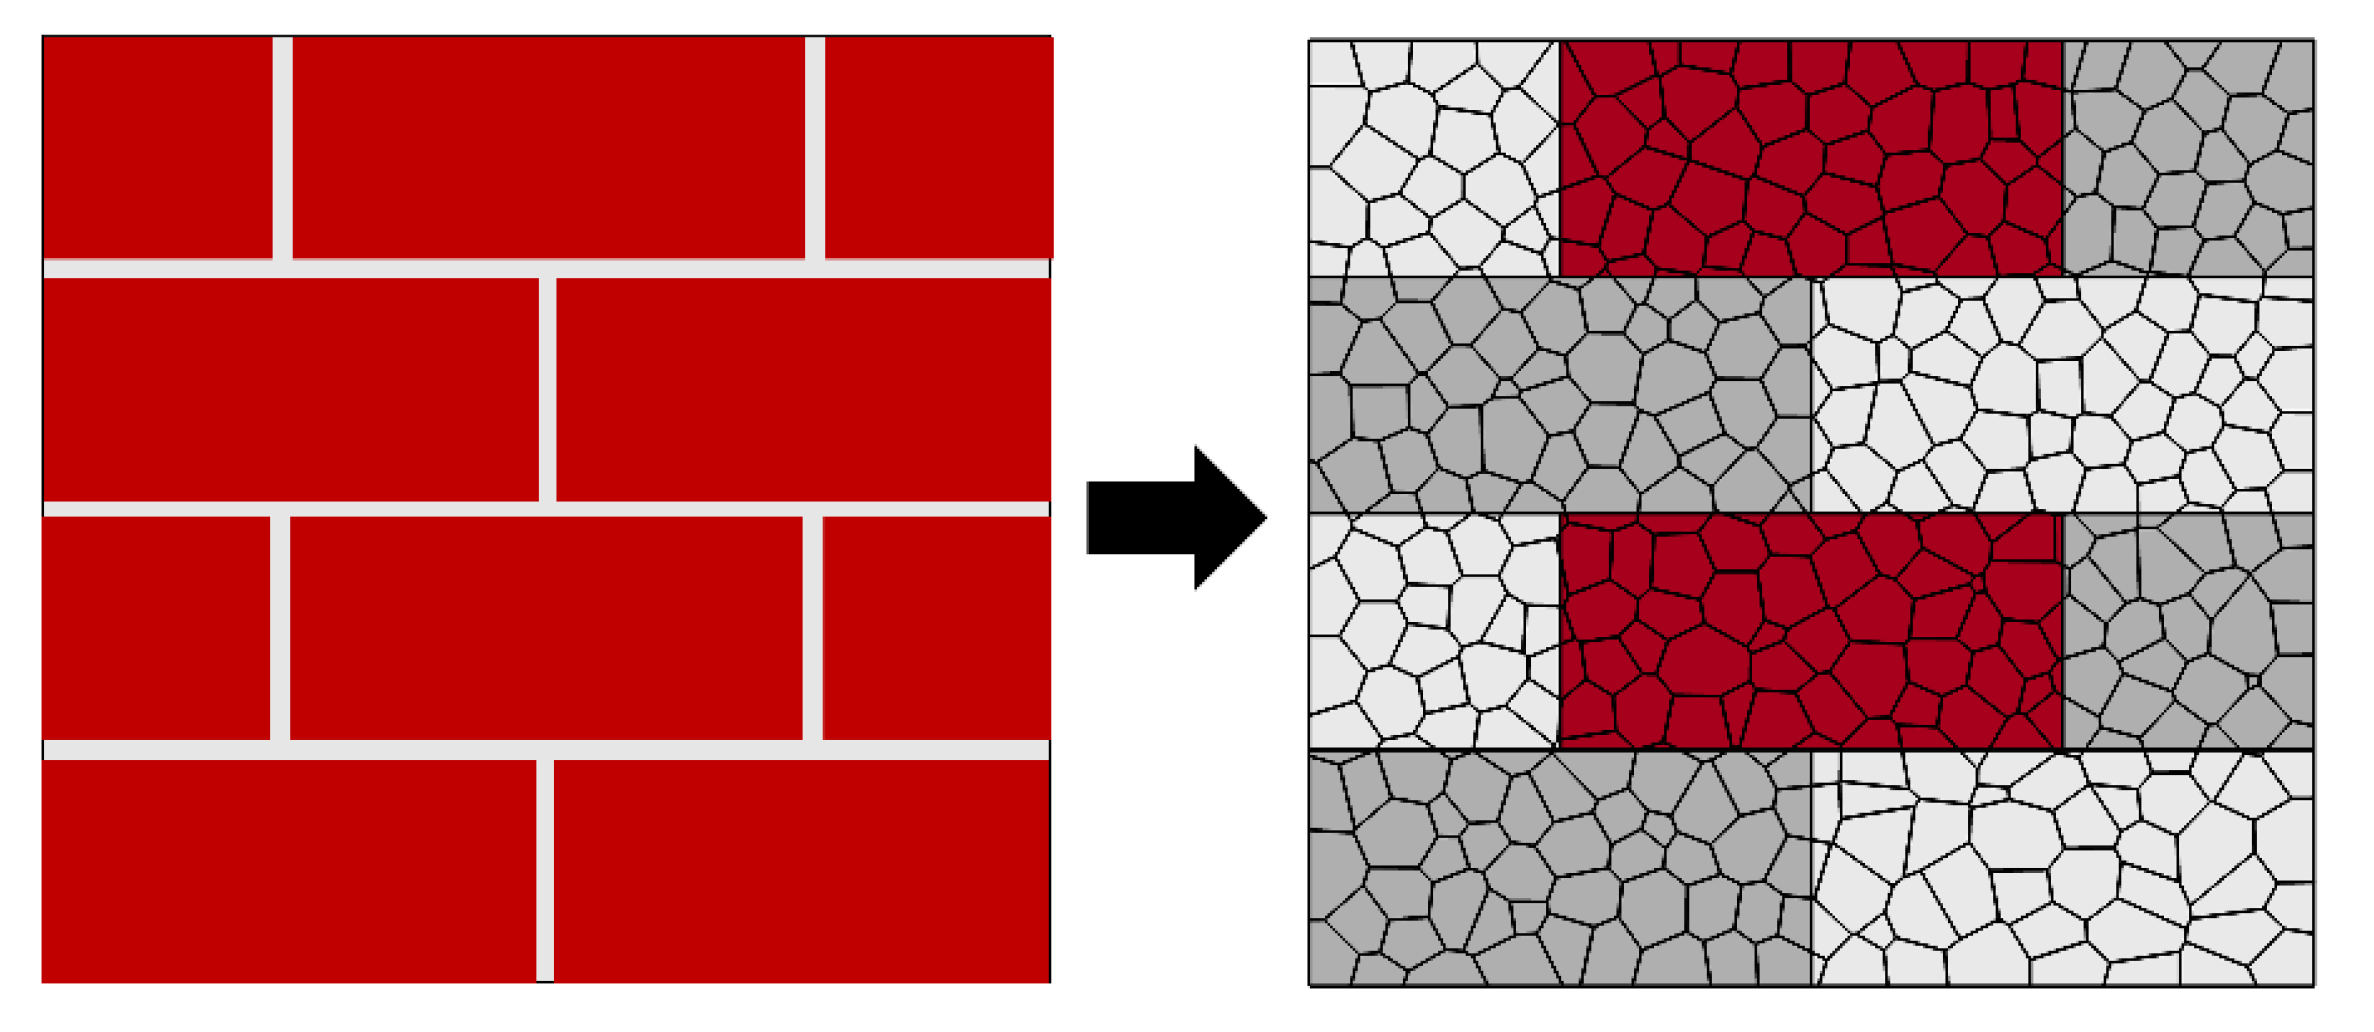
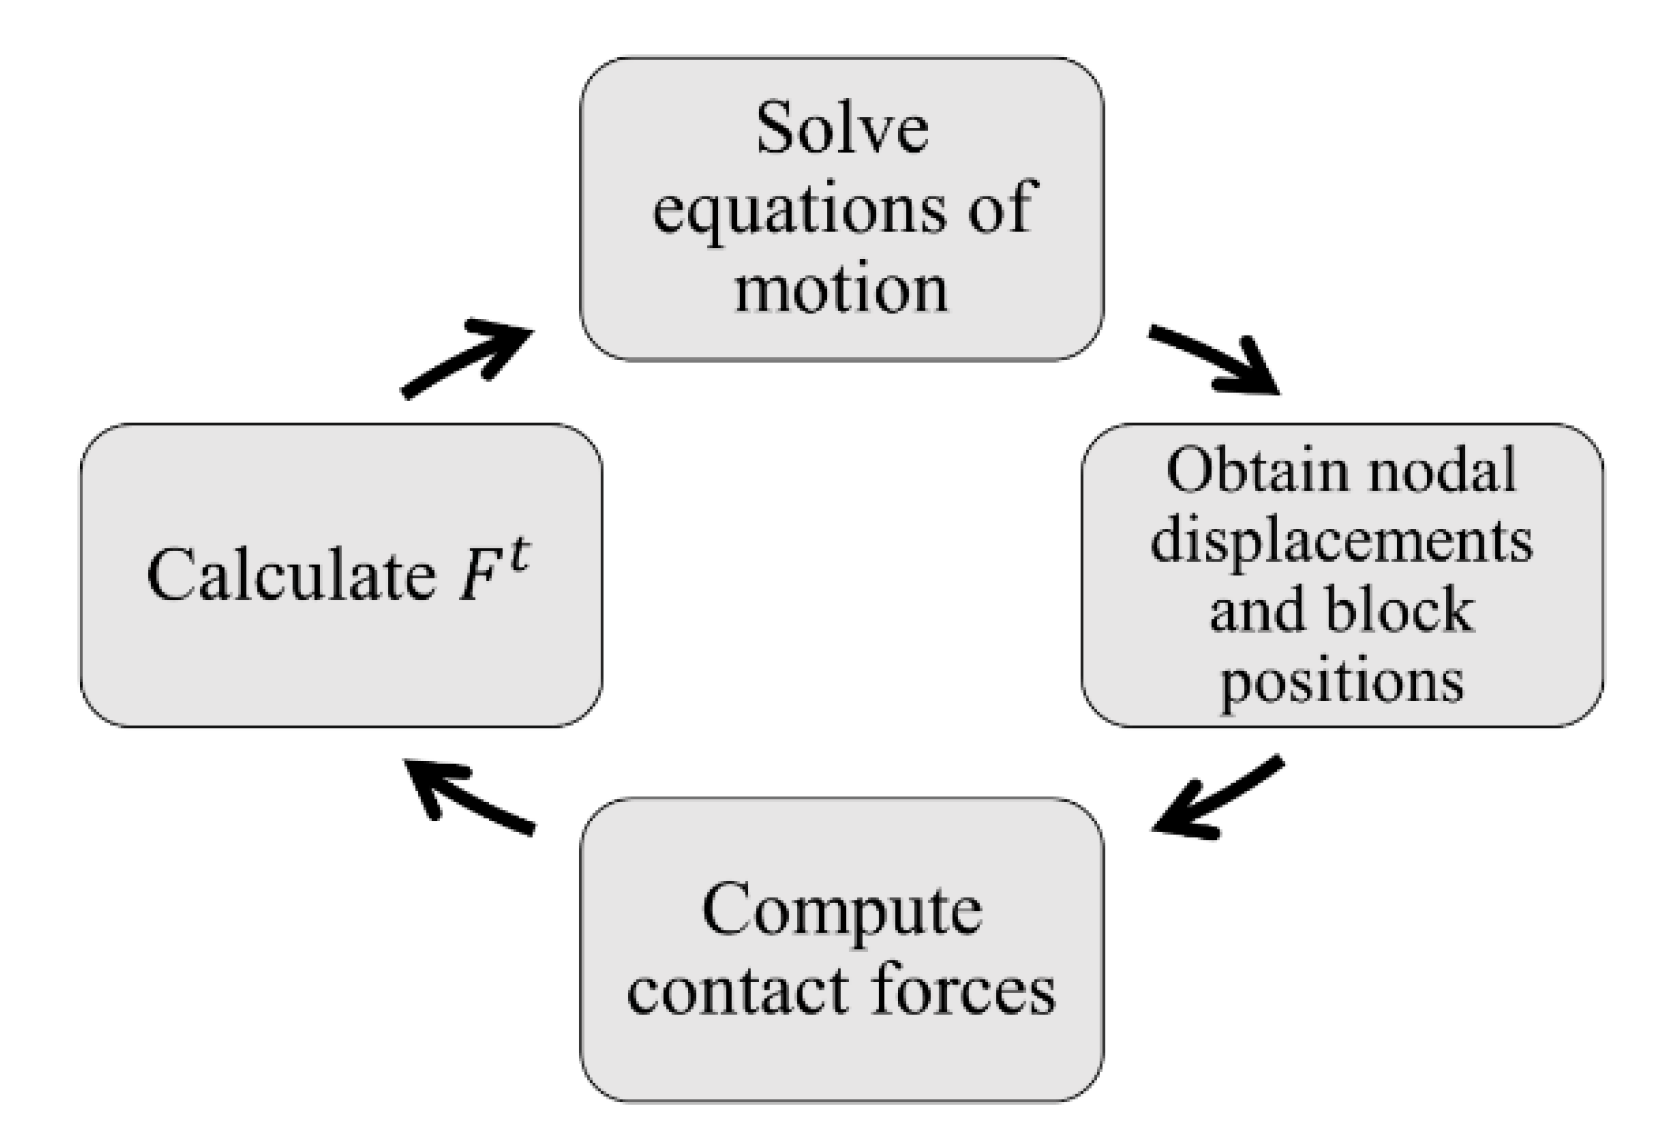
2. Computational Framework
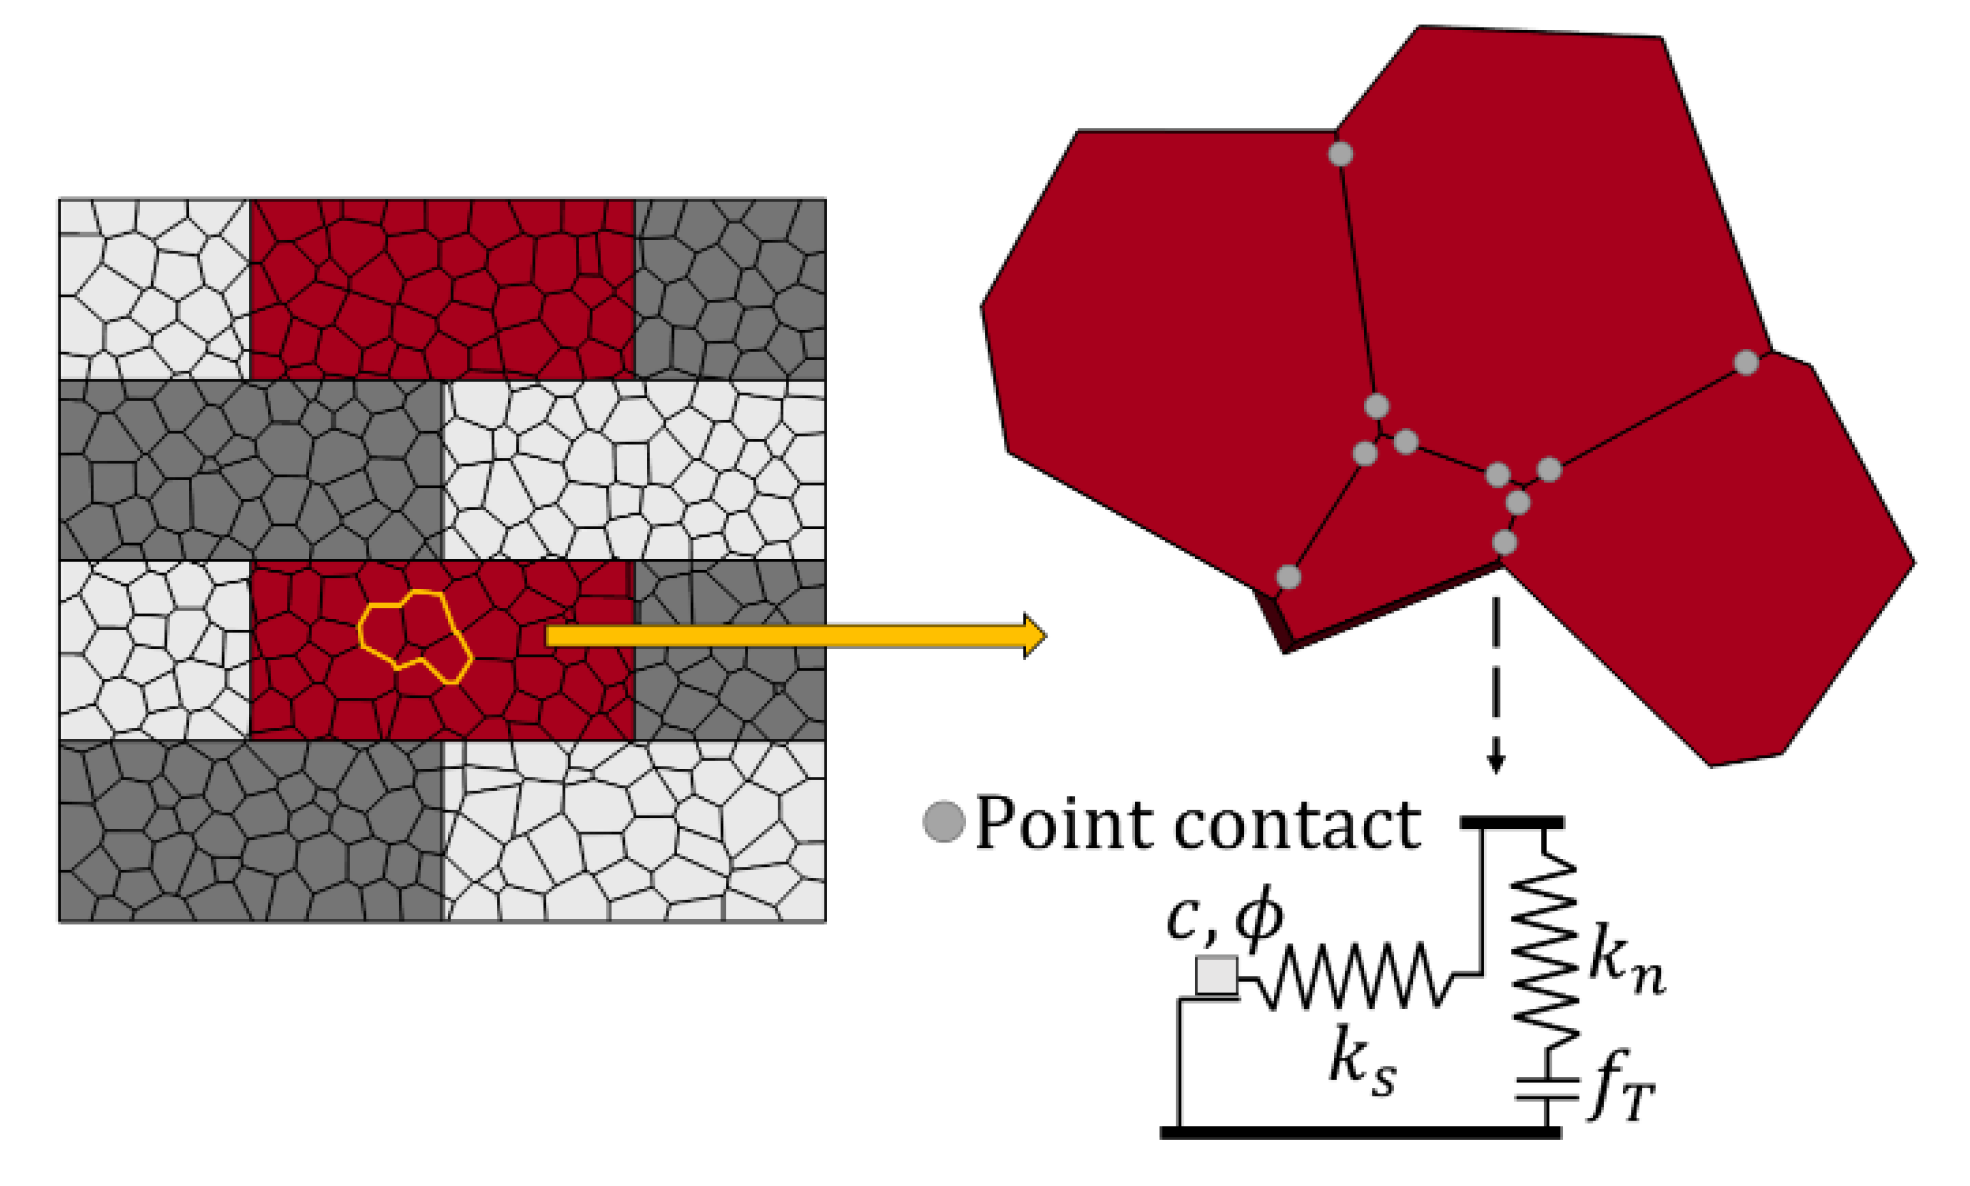
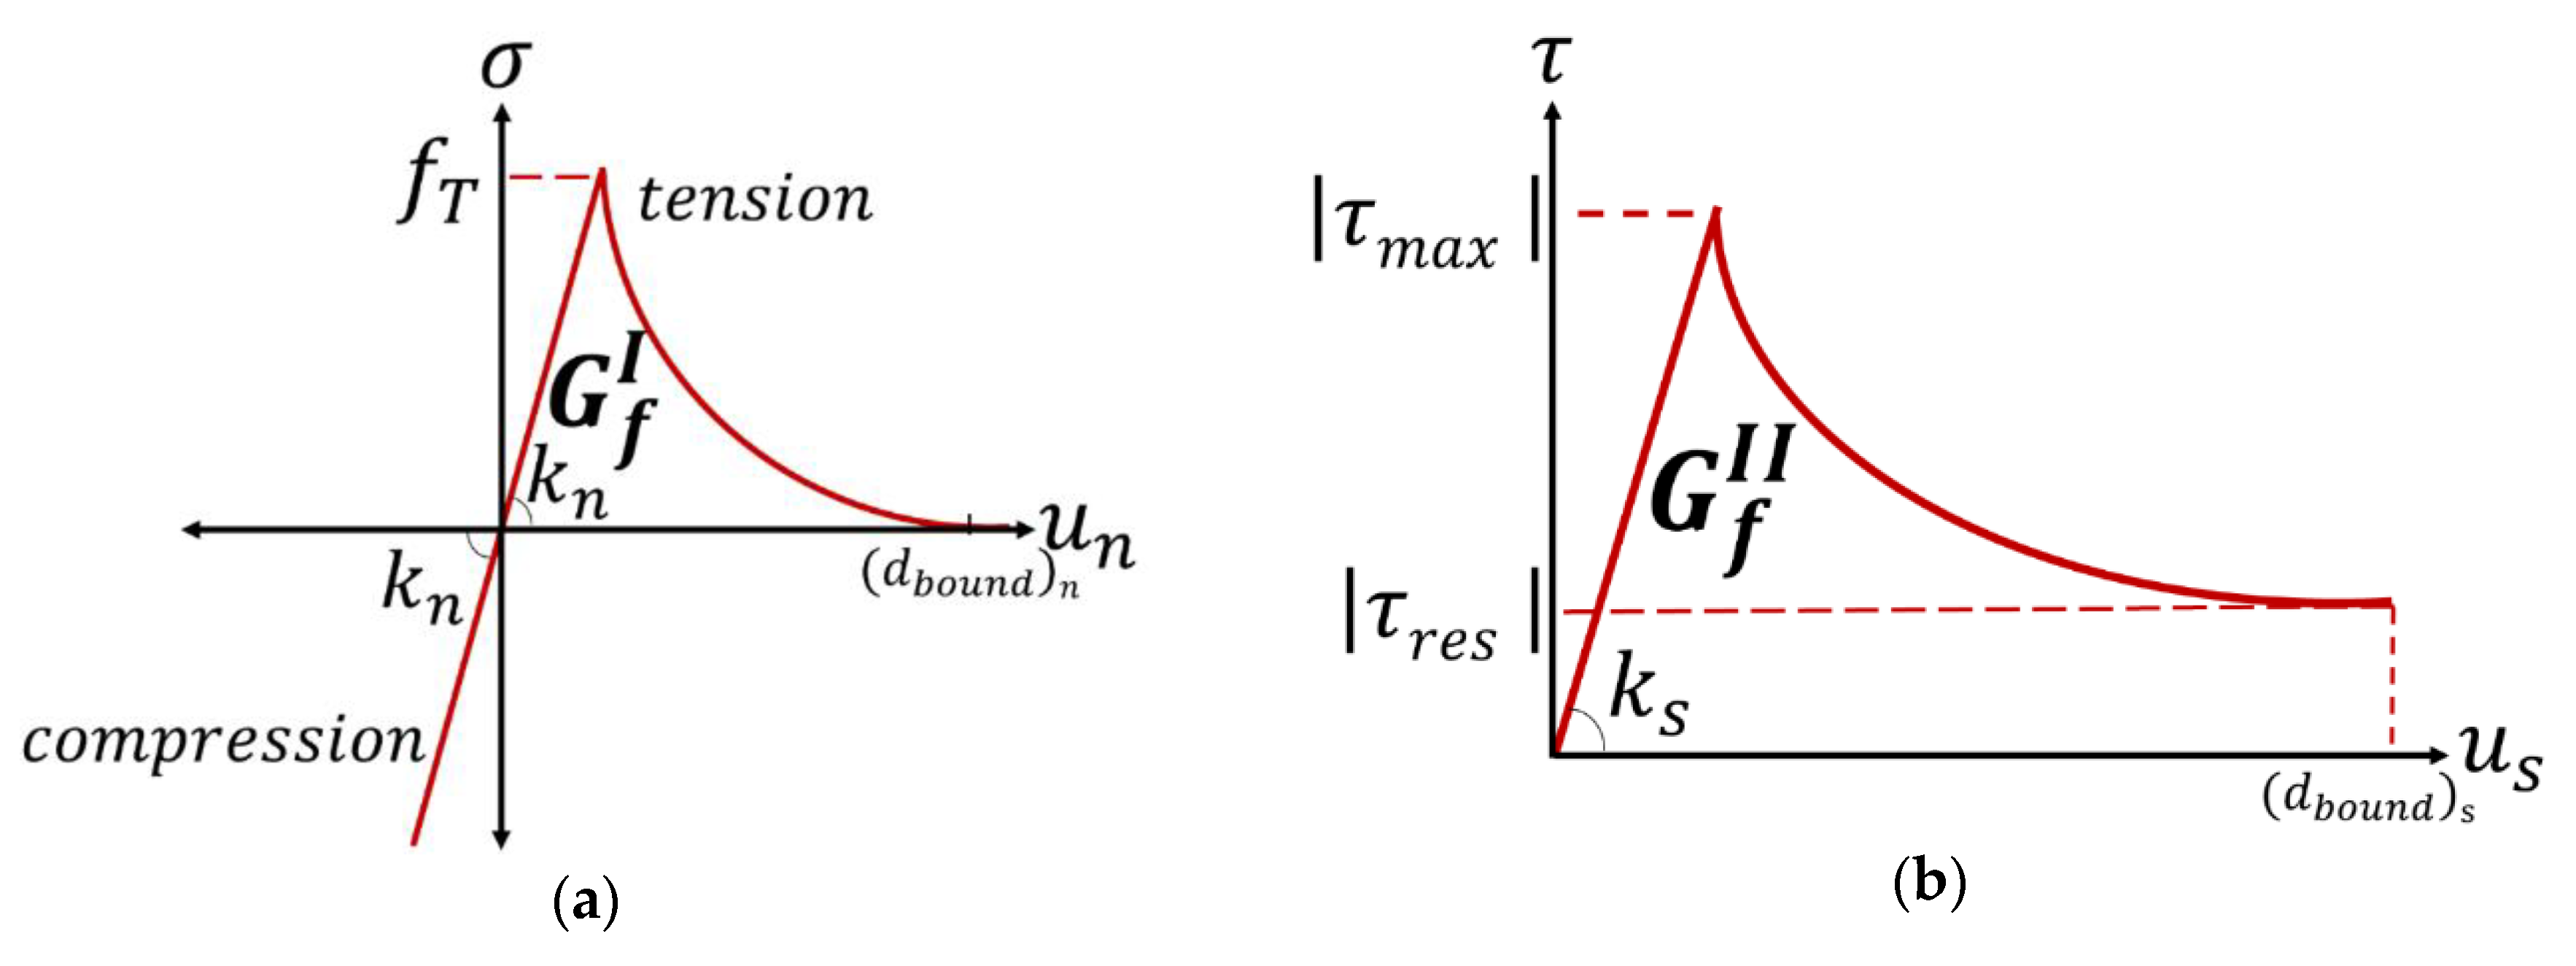
2.1. Contact Constitutive Models
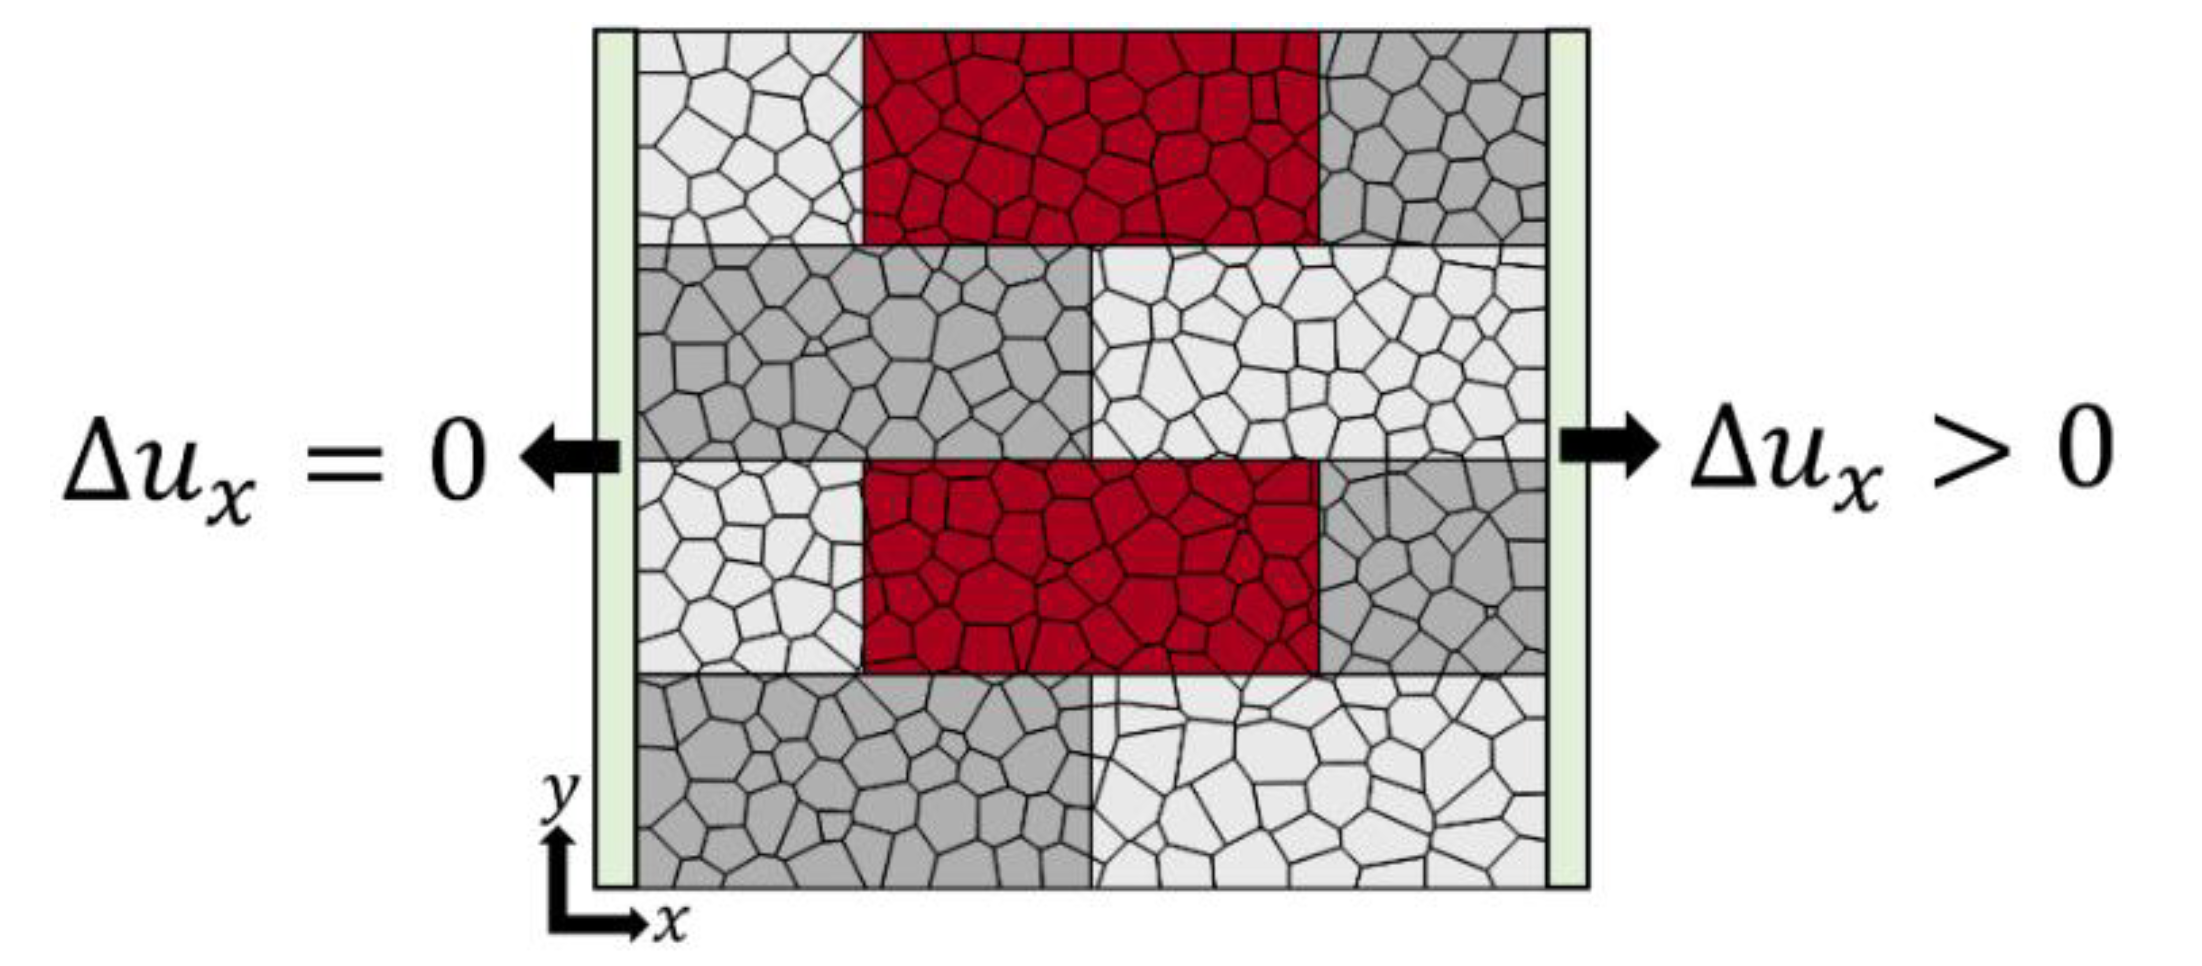
2.2. Benchmark Study and Testing Setup
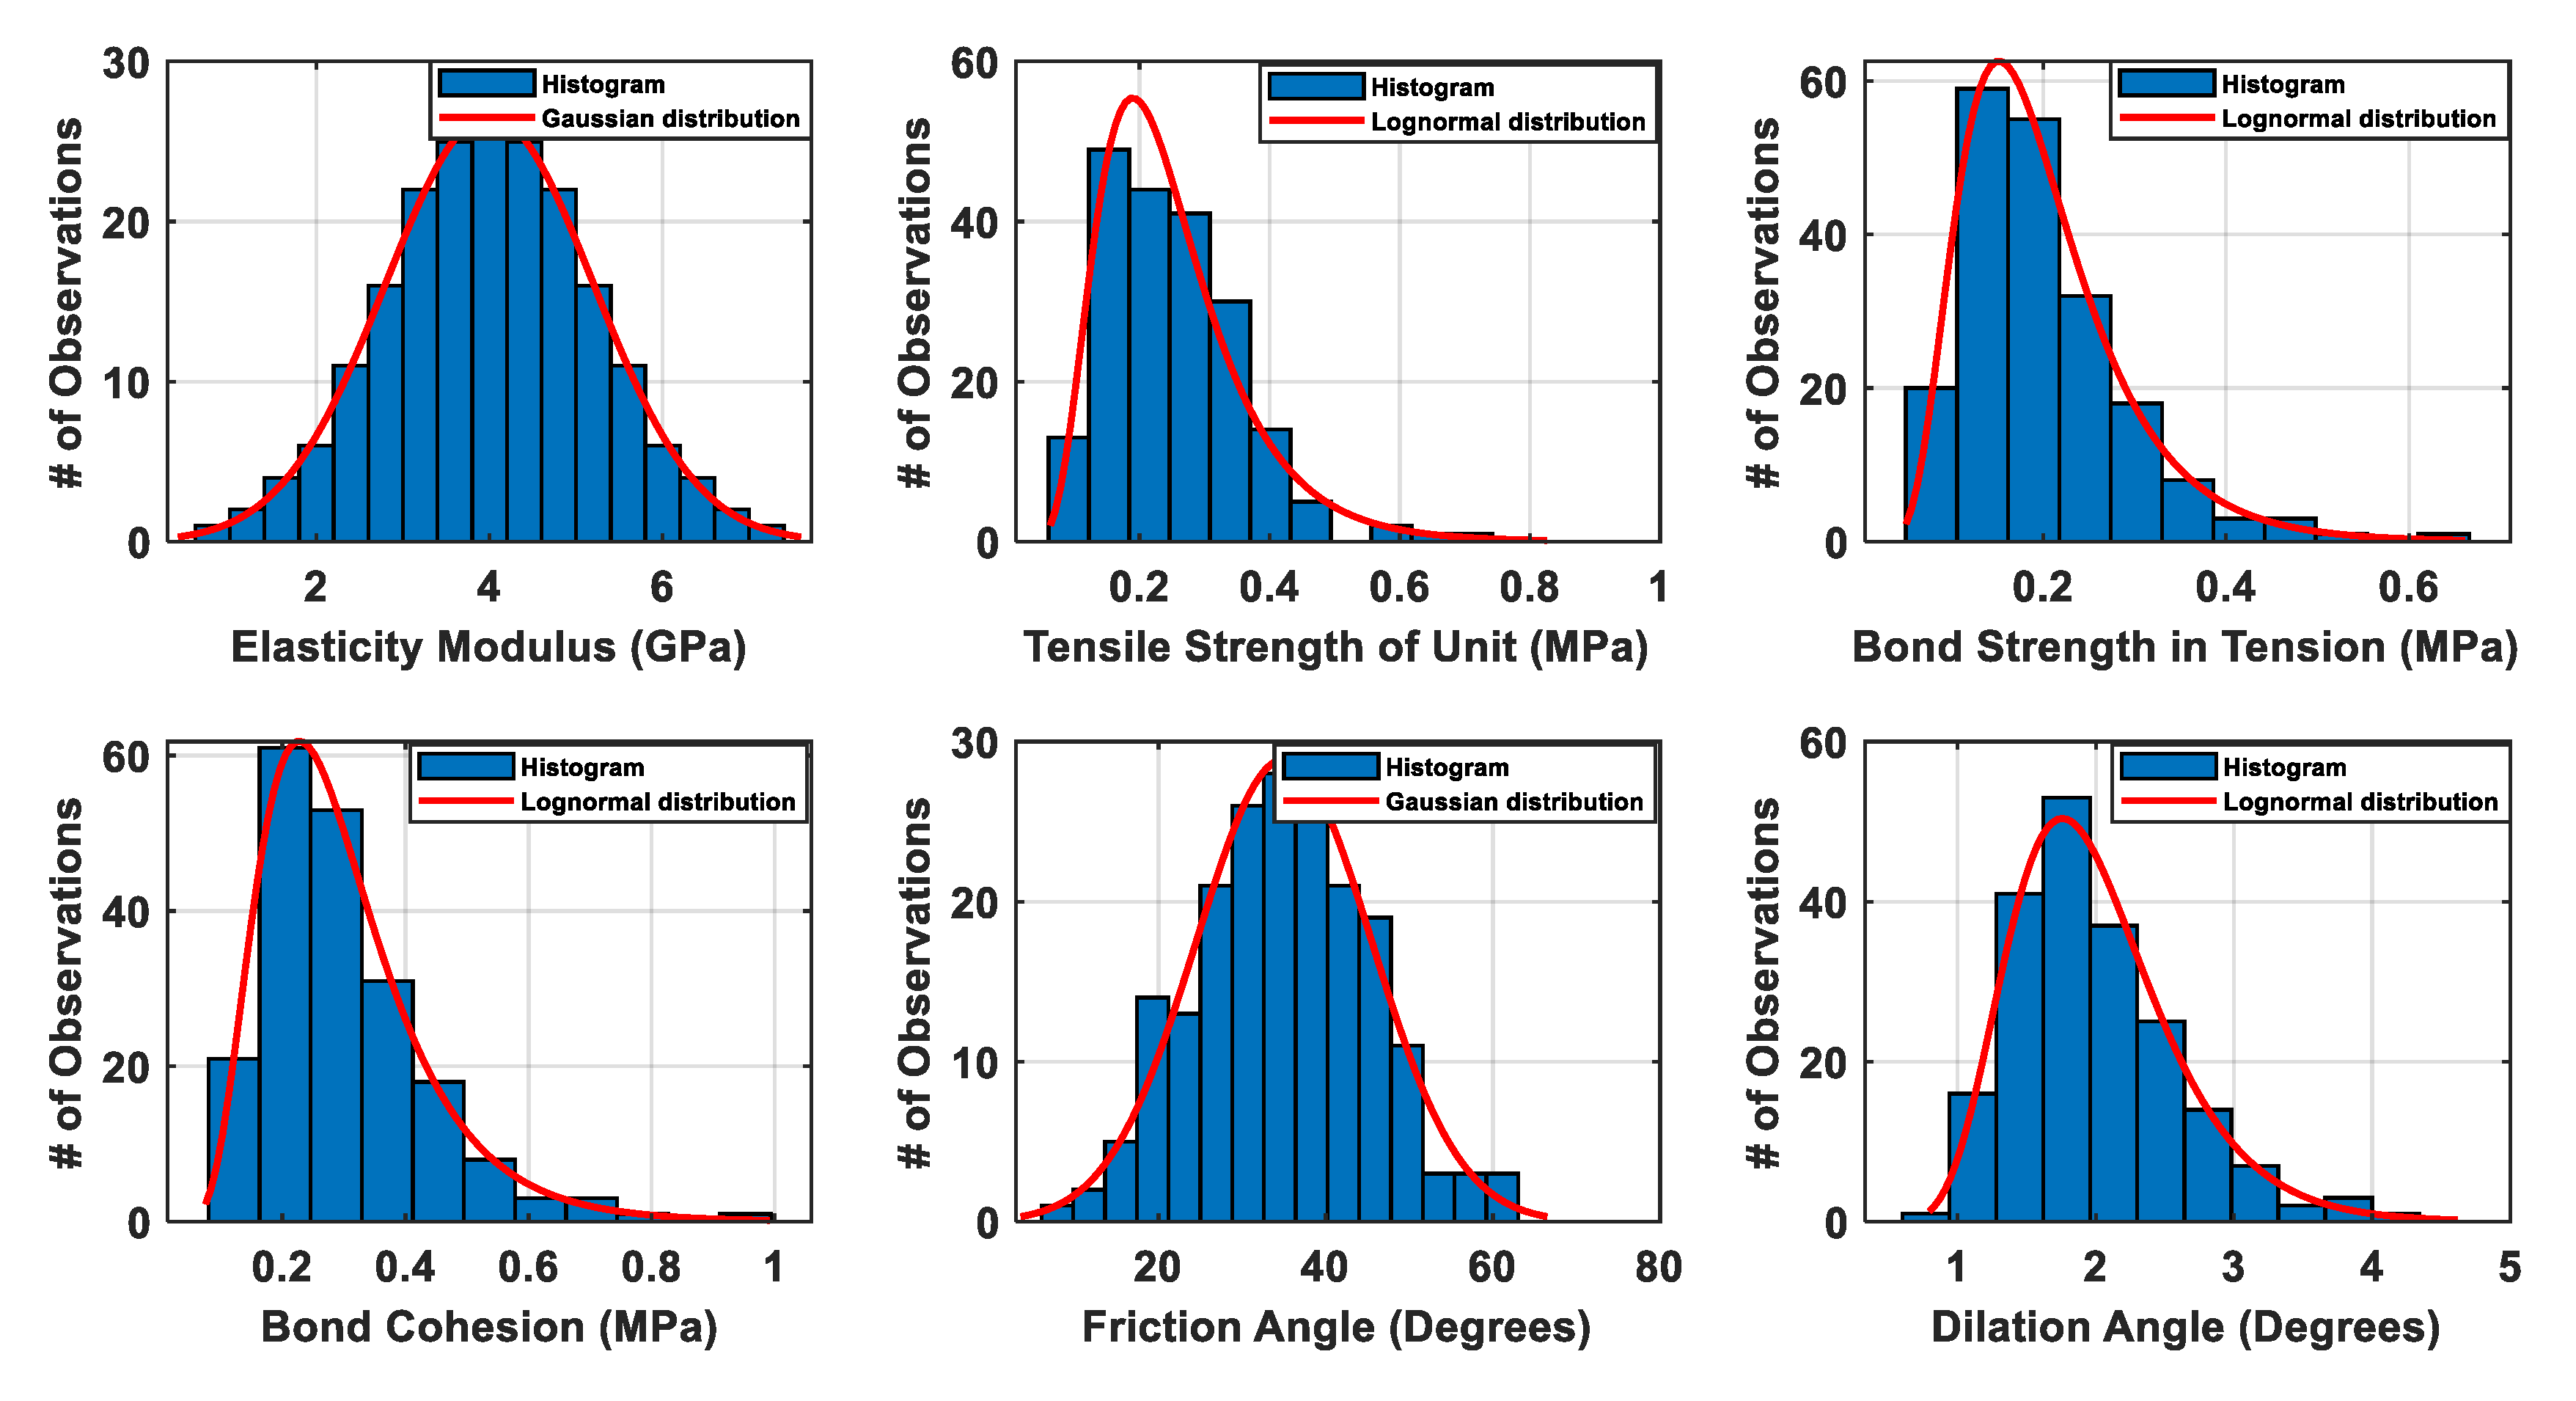
3. Statistical Representation of the Material Properties
4. Results of the Computational Models
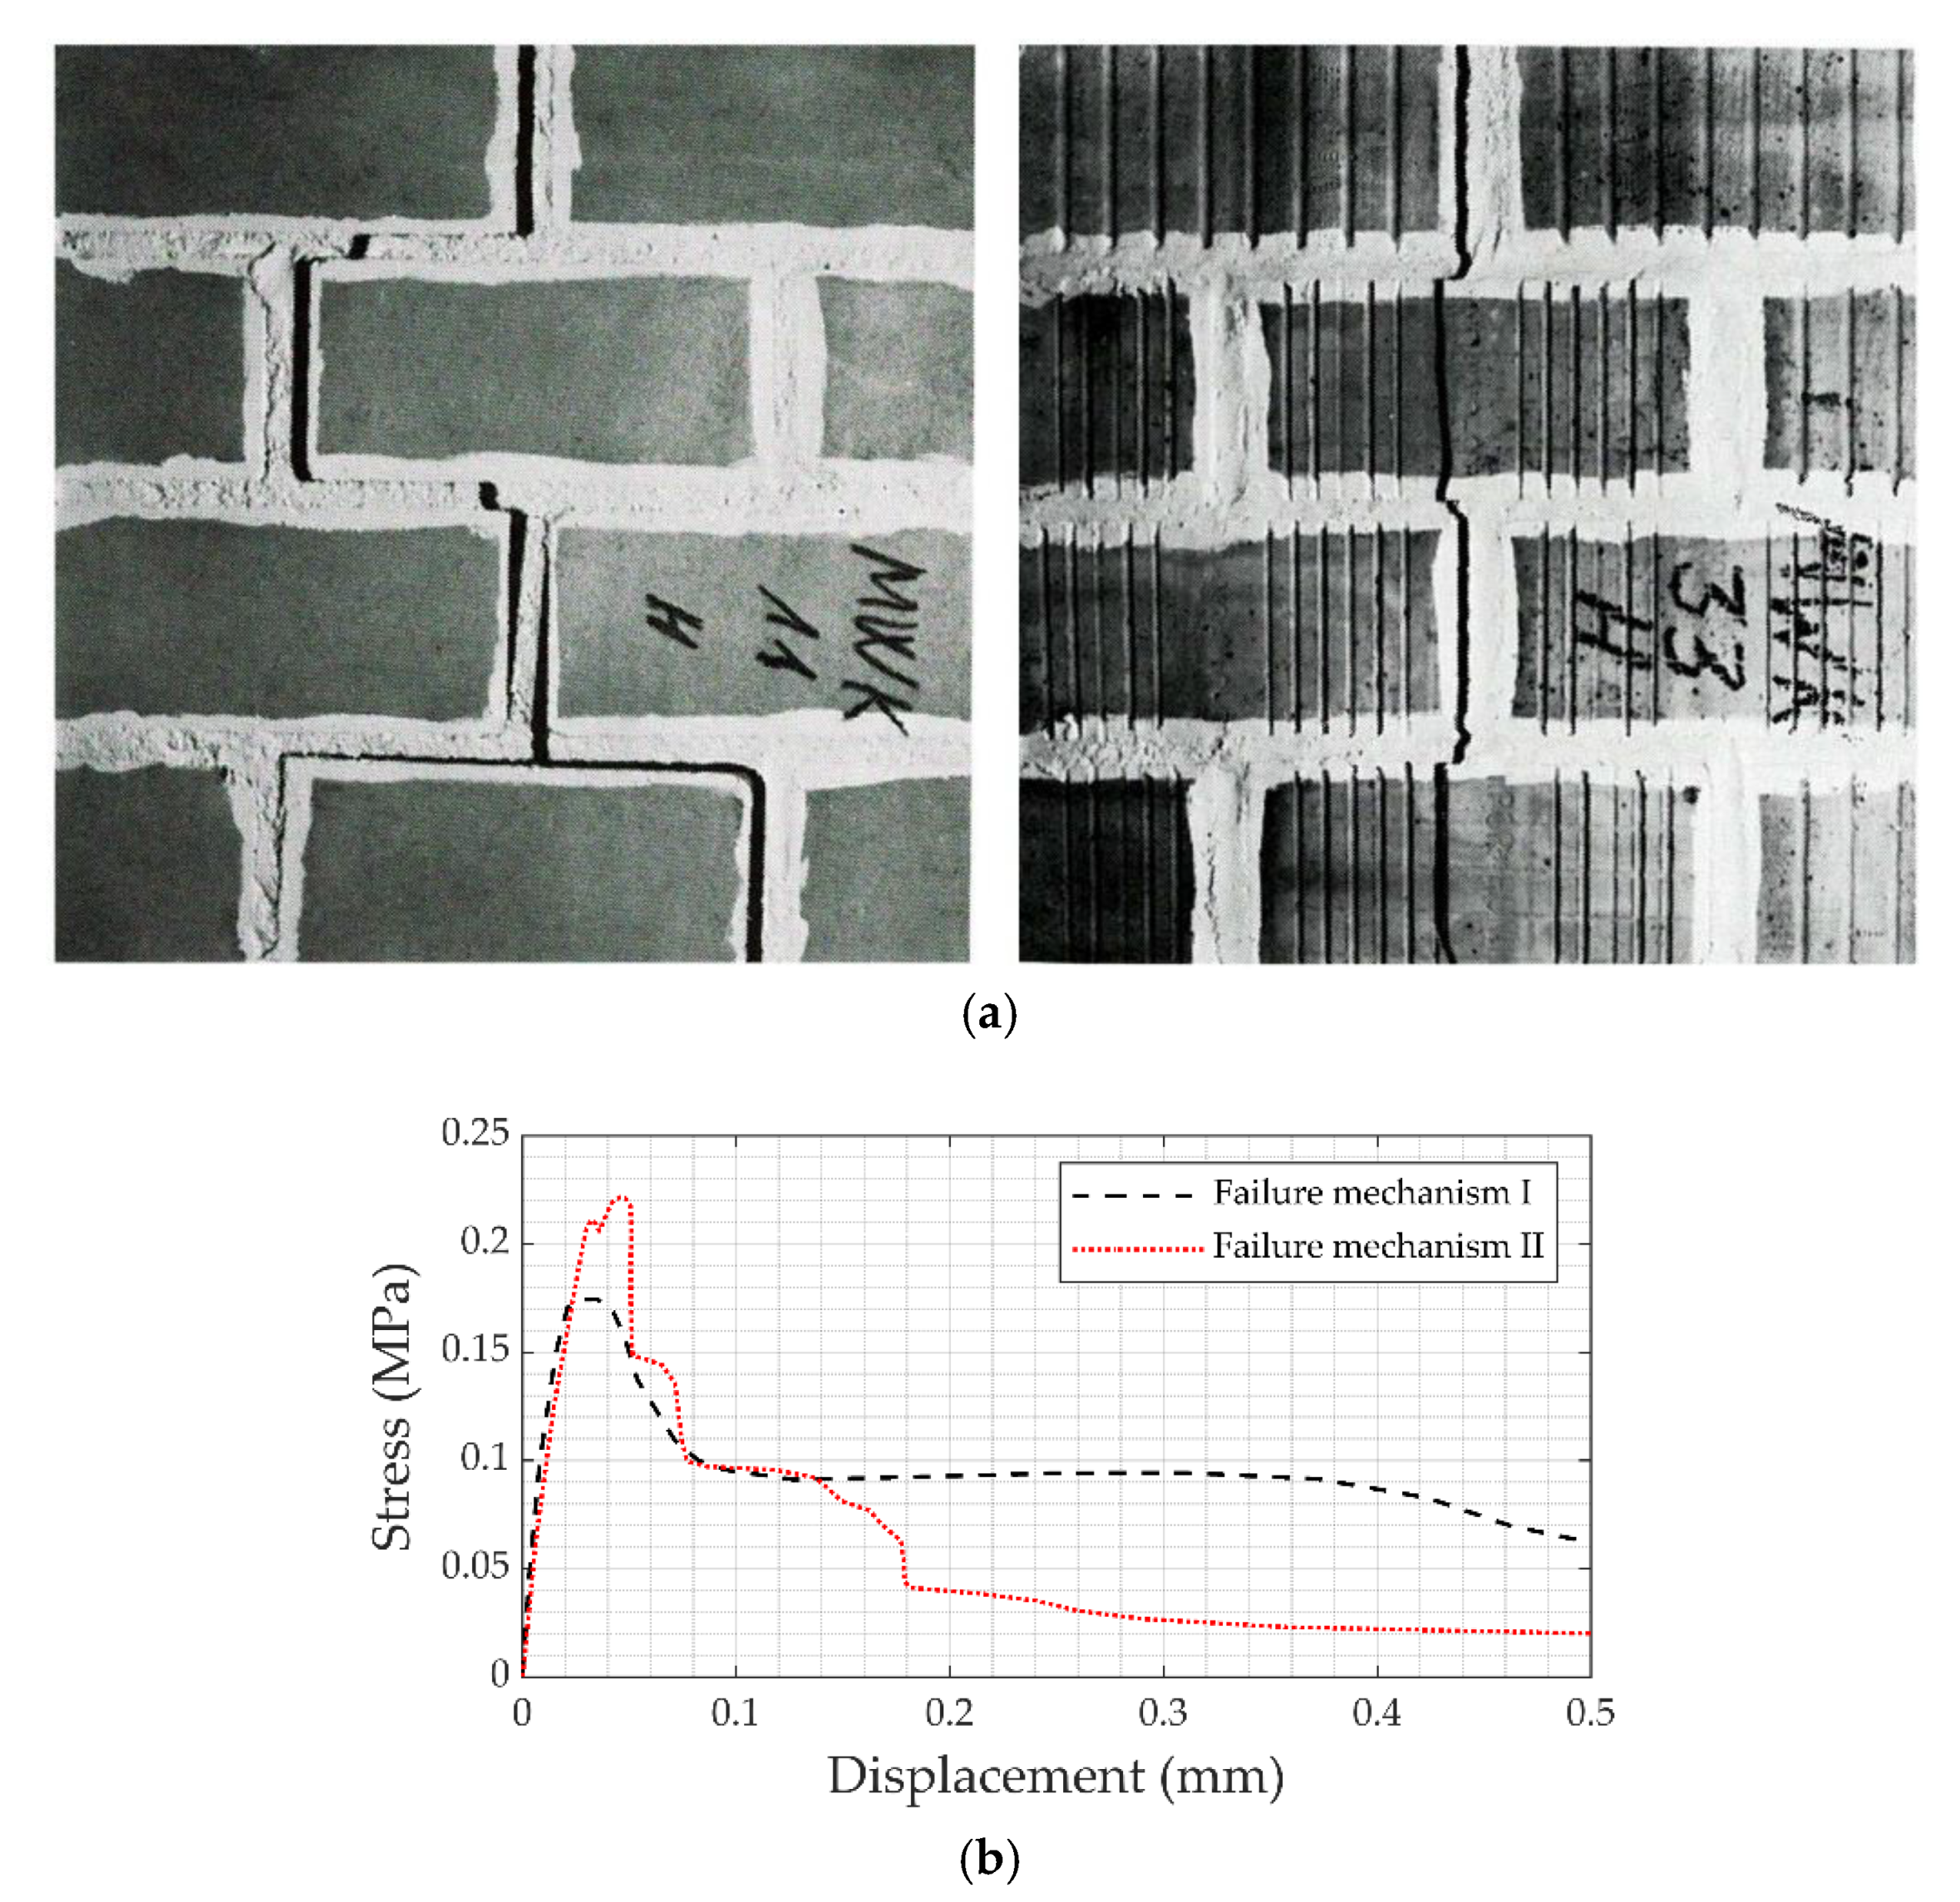
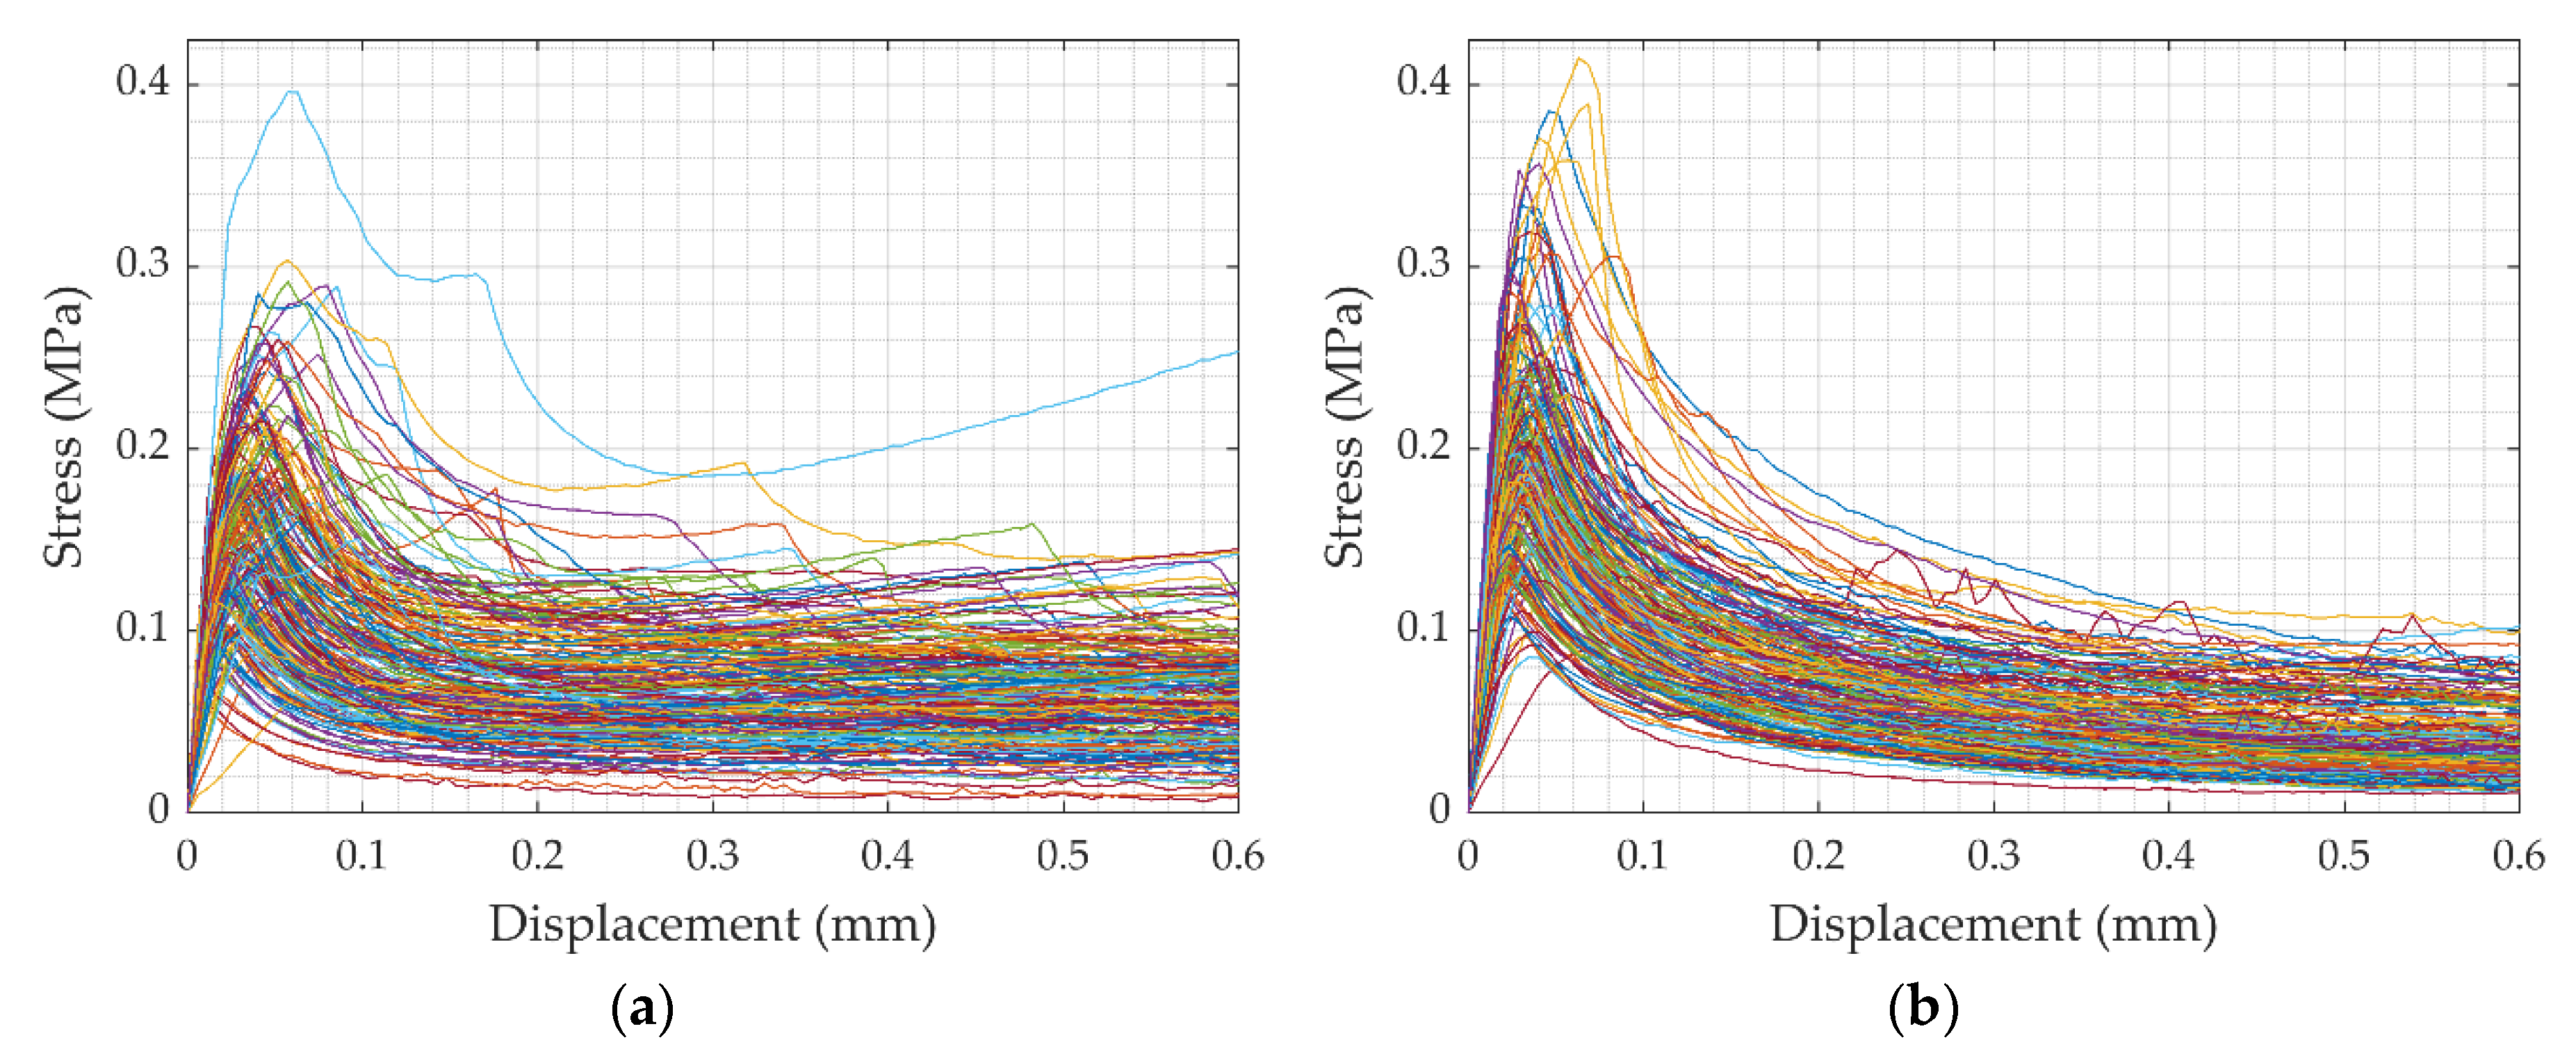
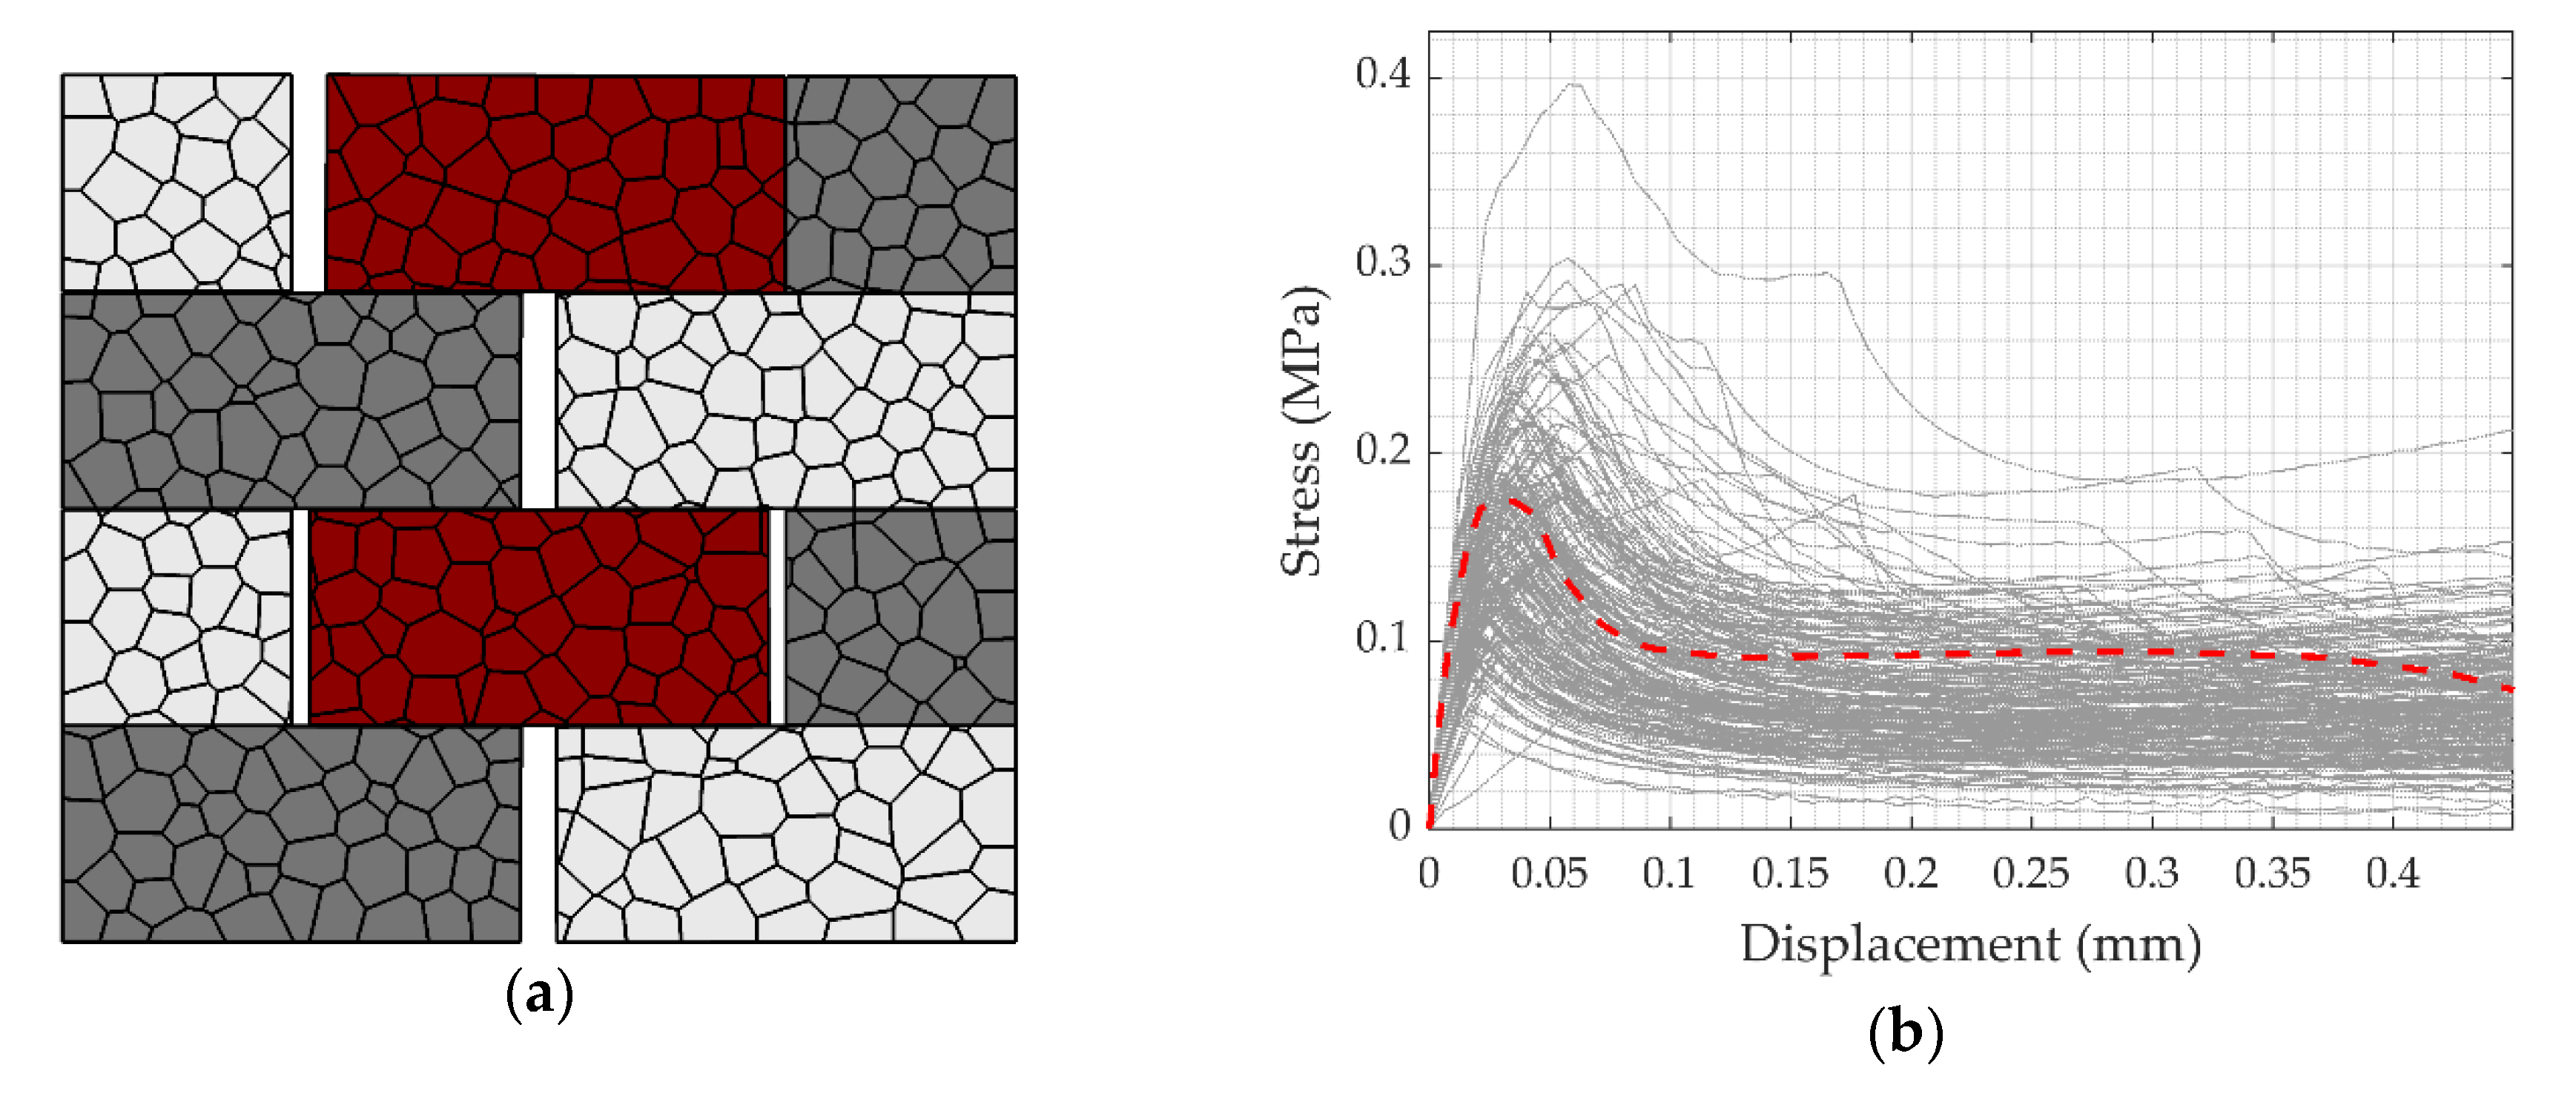
4.1. Failure Mode I: Strong Unit–Weak Bond (SU-WB) Behavior
4.2. Failure Mode II: Weak Unit–Strong Bond (WU-SB) Behavior
5. Conclusions
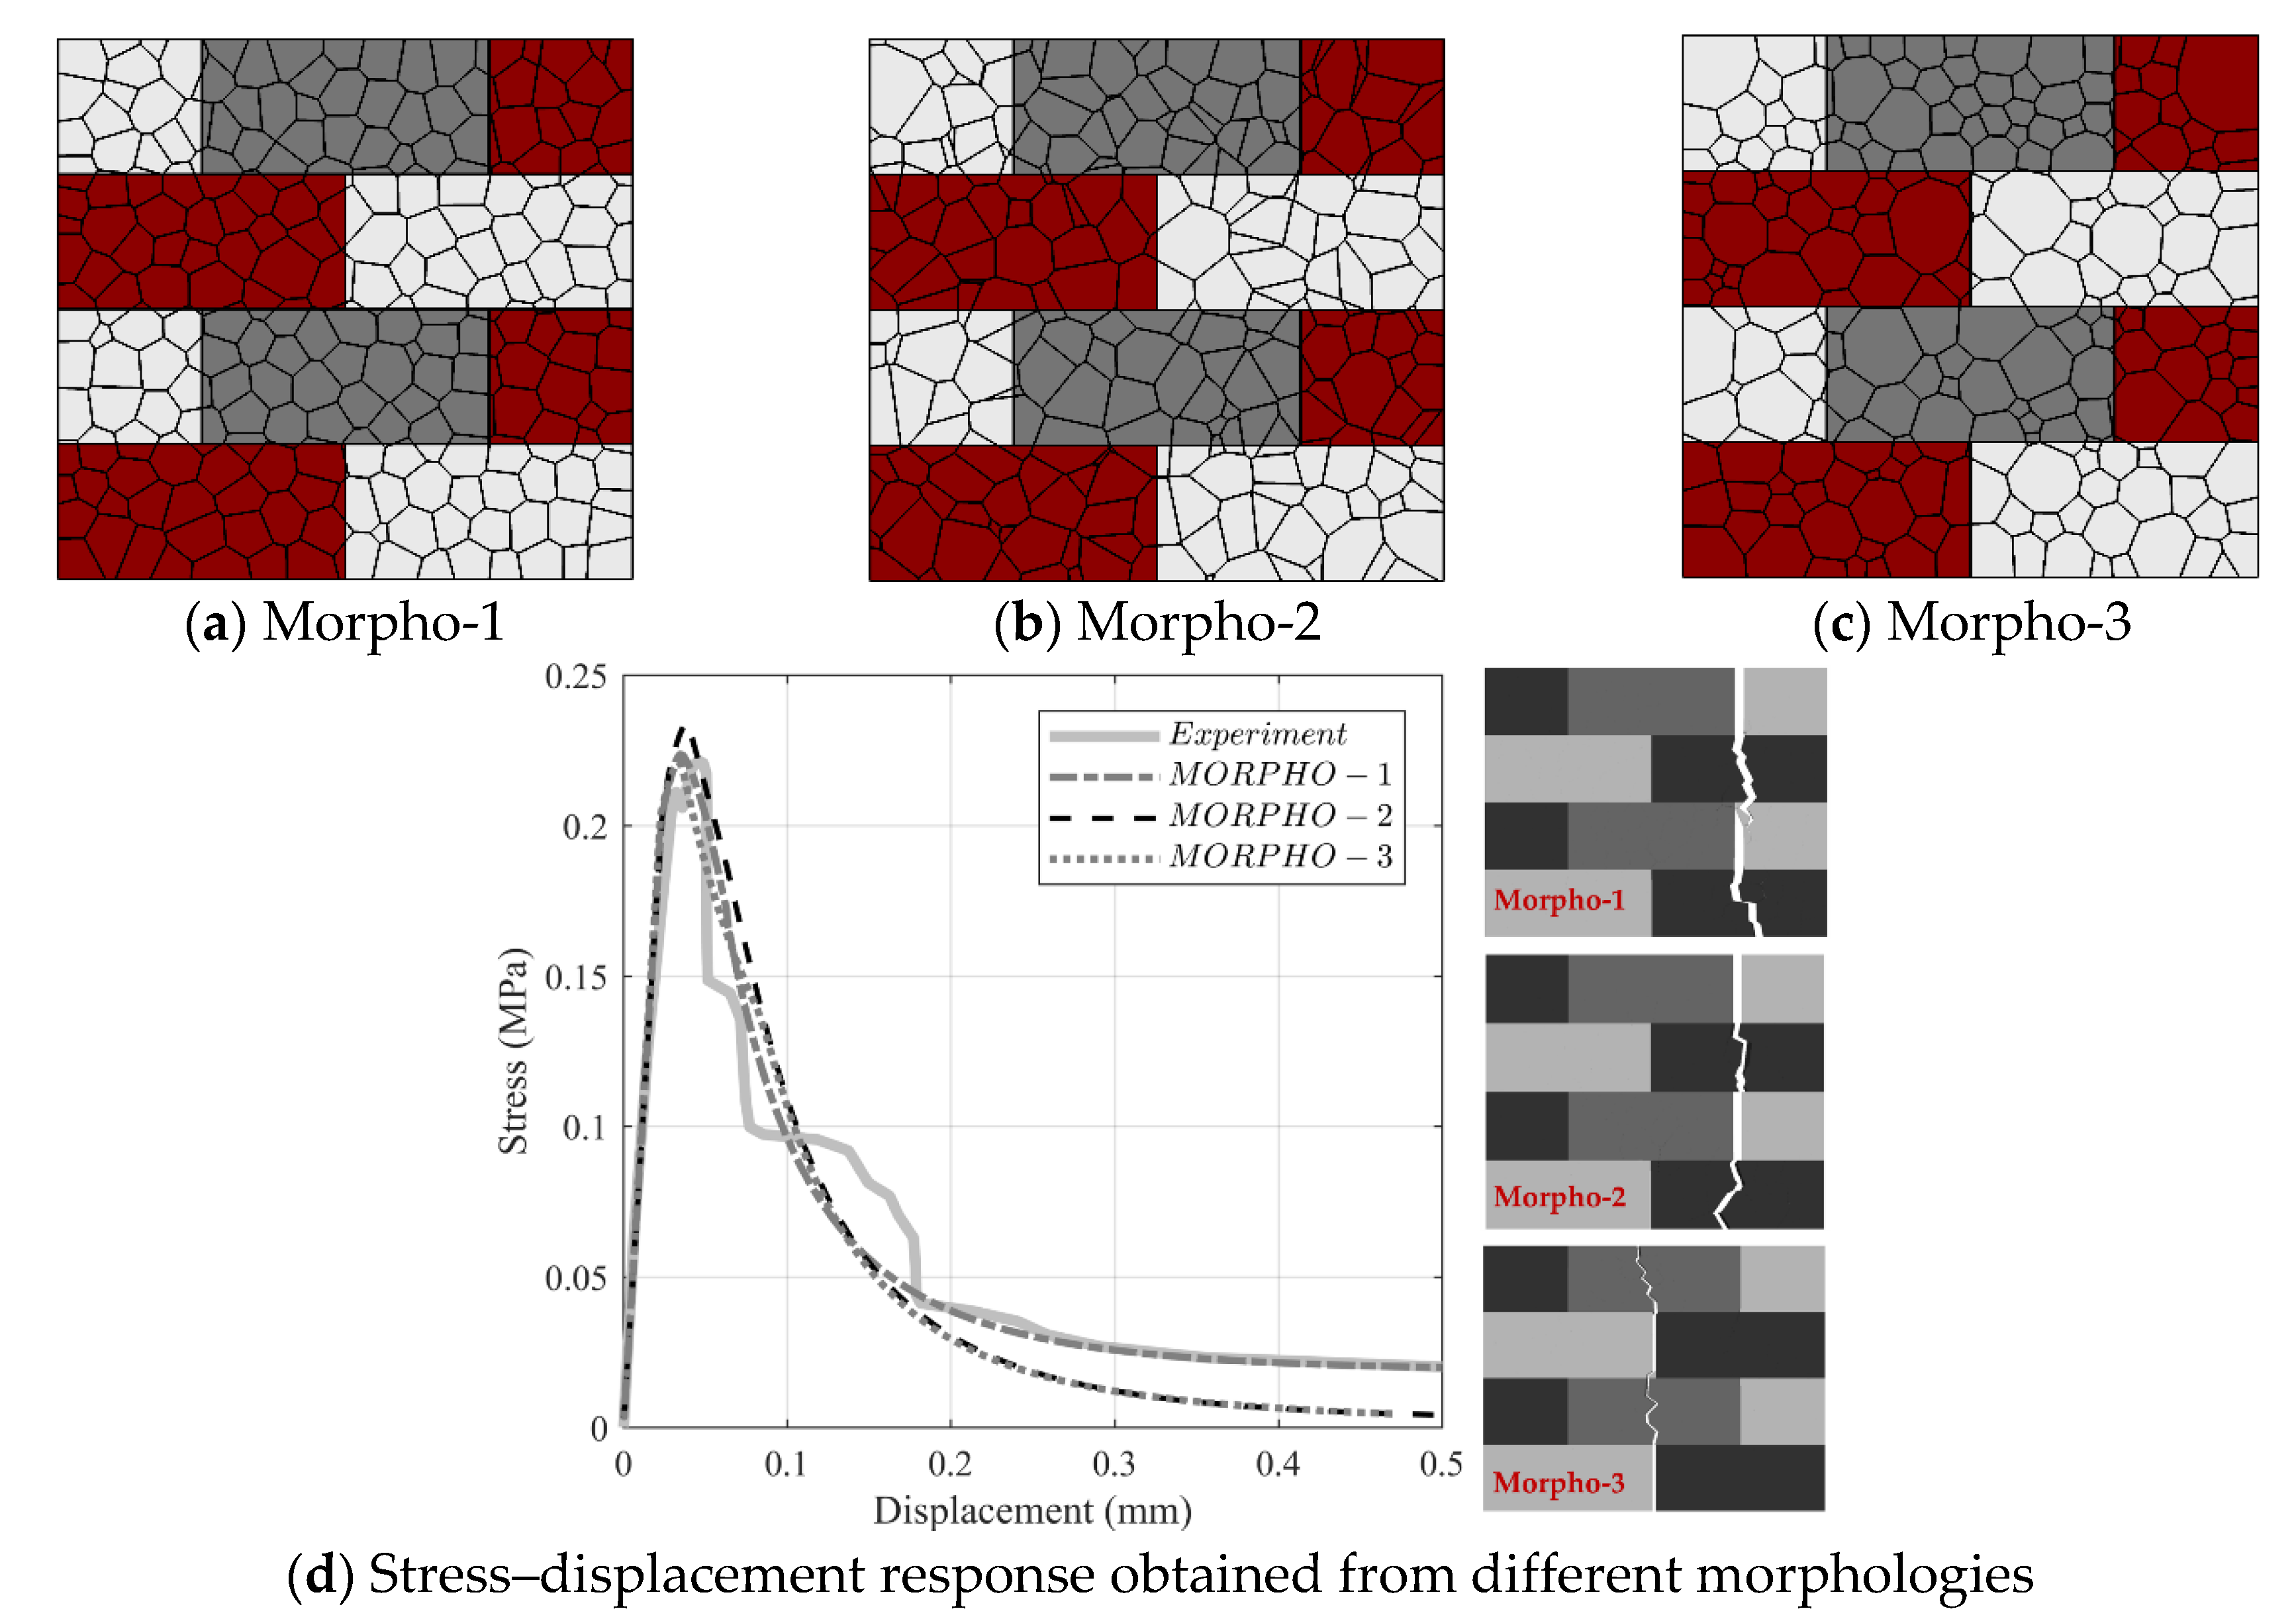
- The proposed modeling strategy allows detailed and realistic (based on comparison with experimental results) fracture patterns of masonry wallettes. This is accomplished by representing the masonry components (masonry units and unit–mortar interfaces) using mechanically interacting discrete polyhedral blocks.
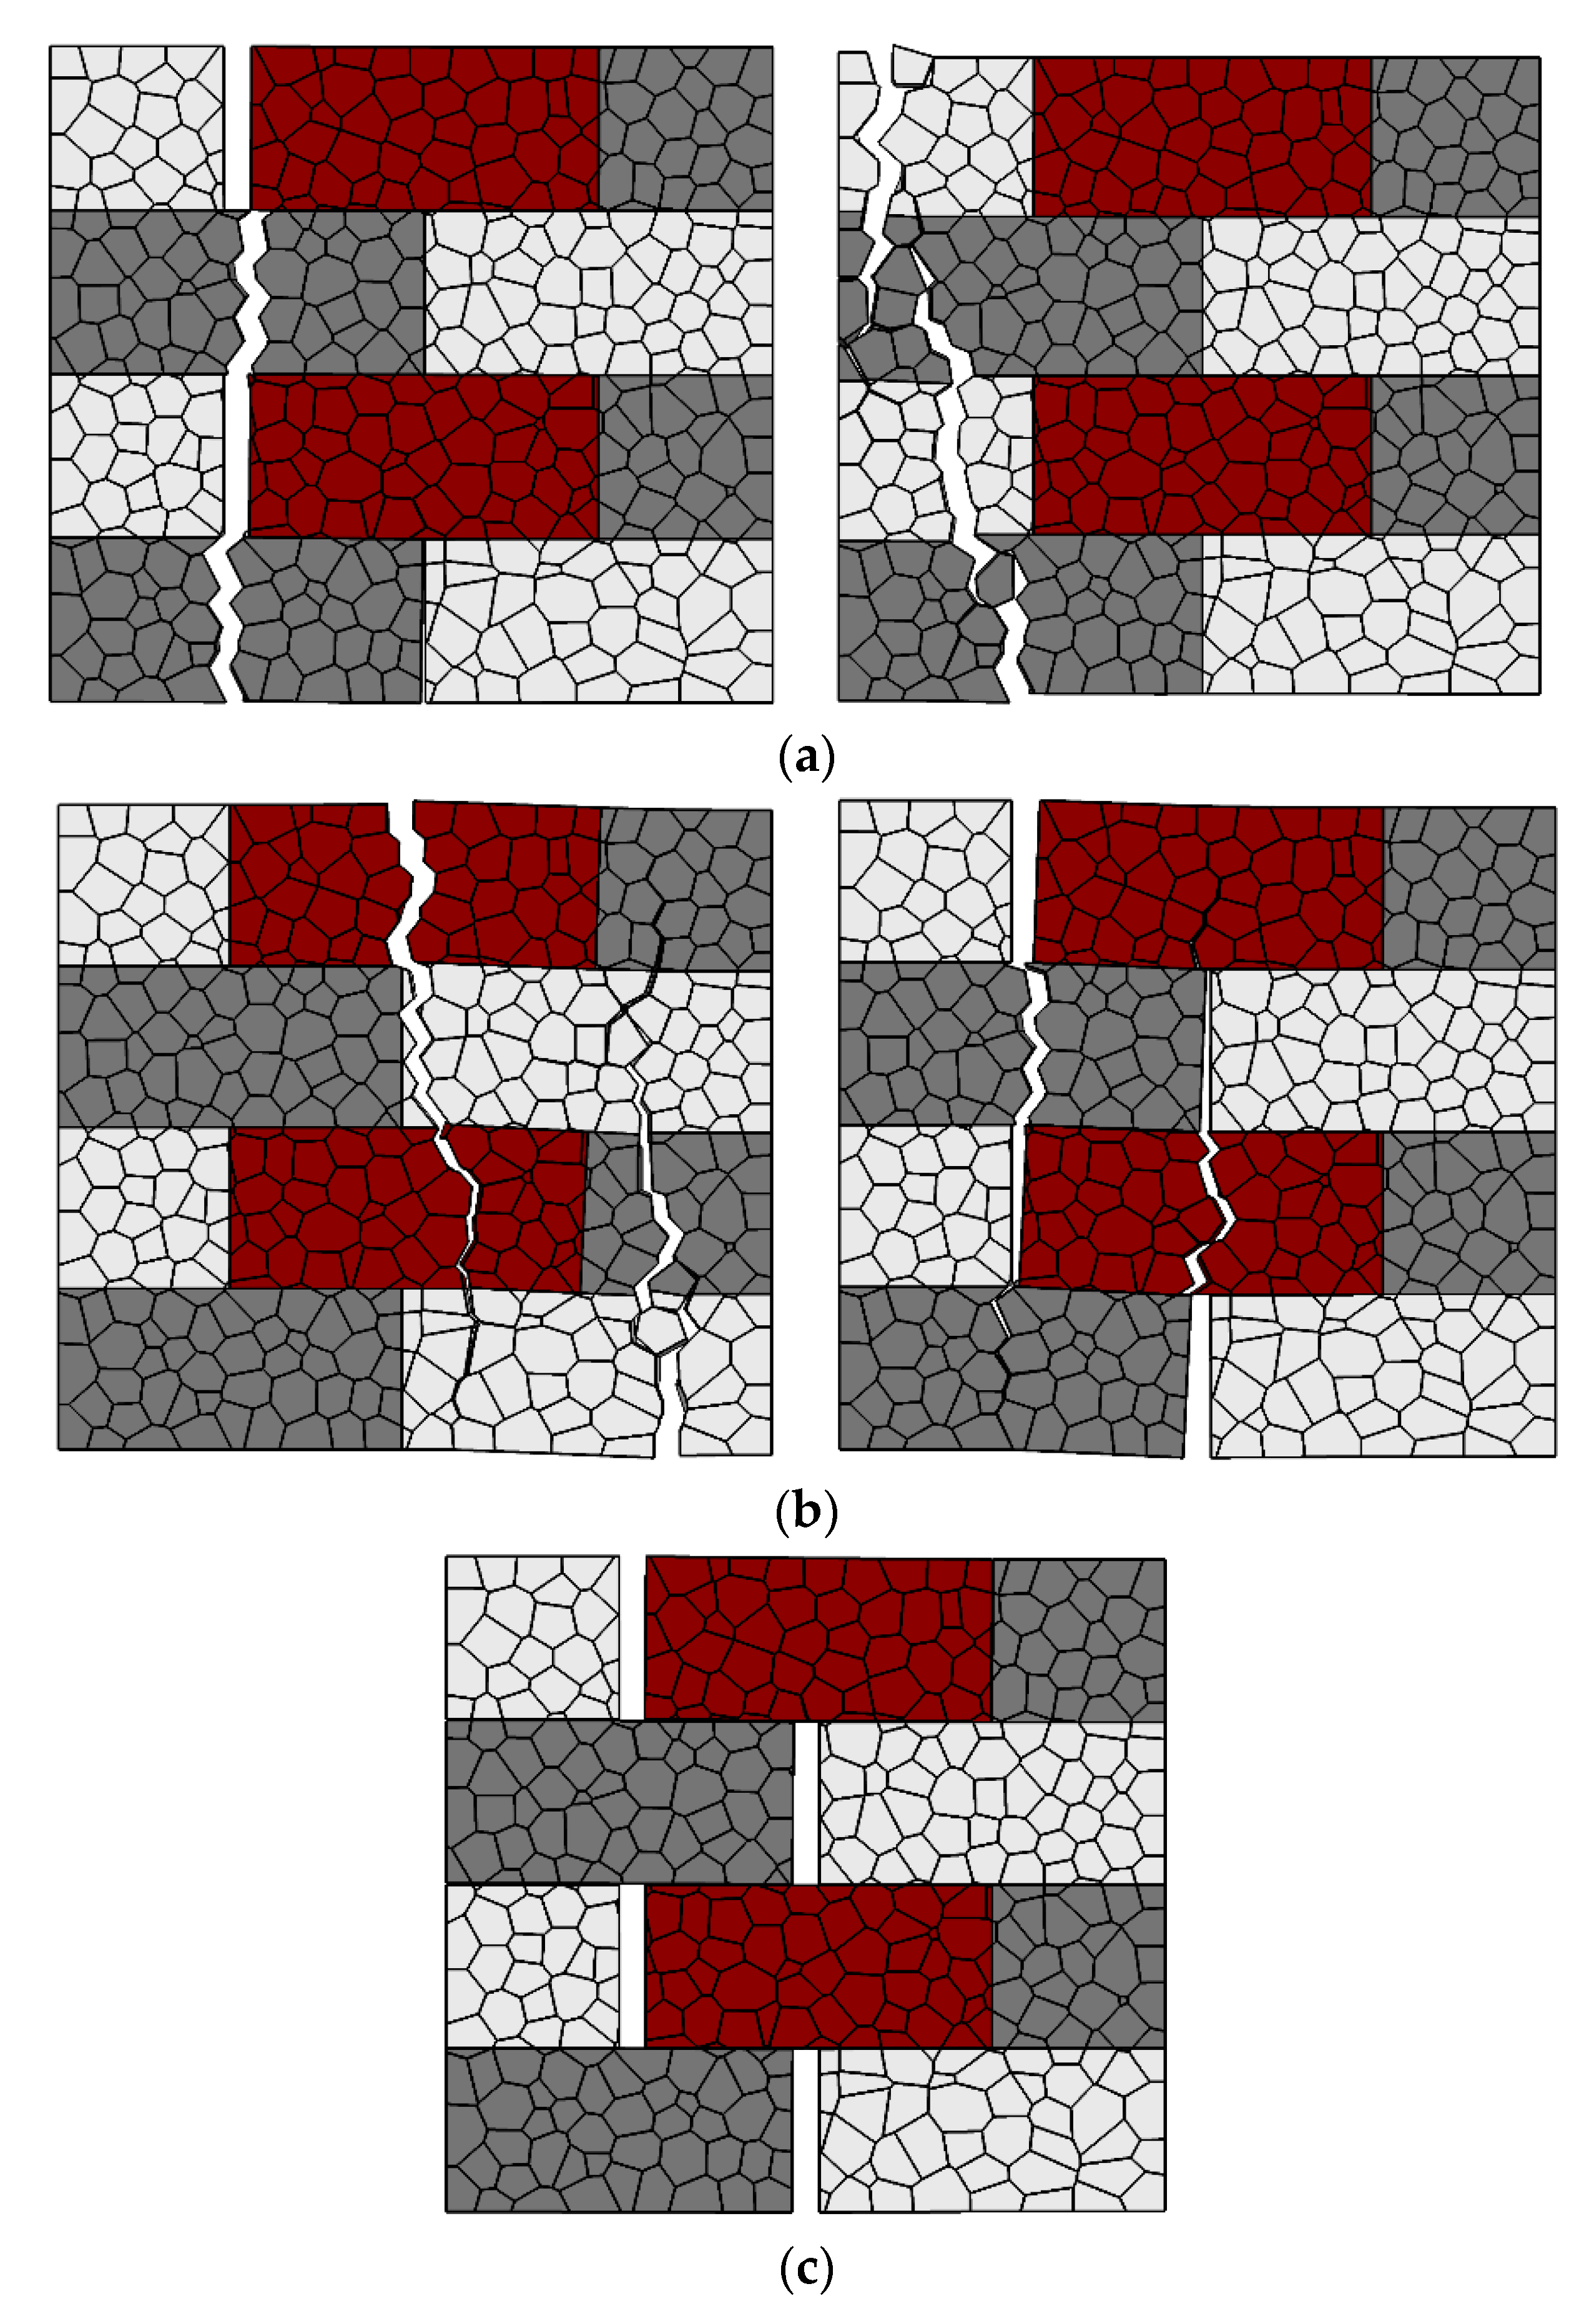
- The inherent uncertainty in the mechanical properties of masonry constituents yields various possible fracture mechanisms. Through this research, all possible fracture patterns of masonry wallettes under tension parallel to bed joints are explored. There is a great economy in performing such a comprehensive study computationally instead of a very broad and costly experimental campaign.
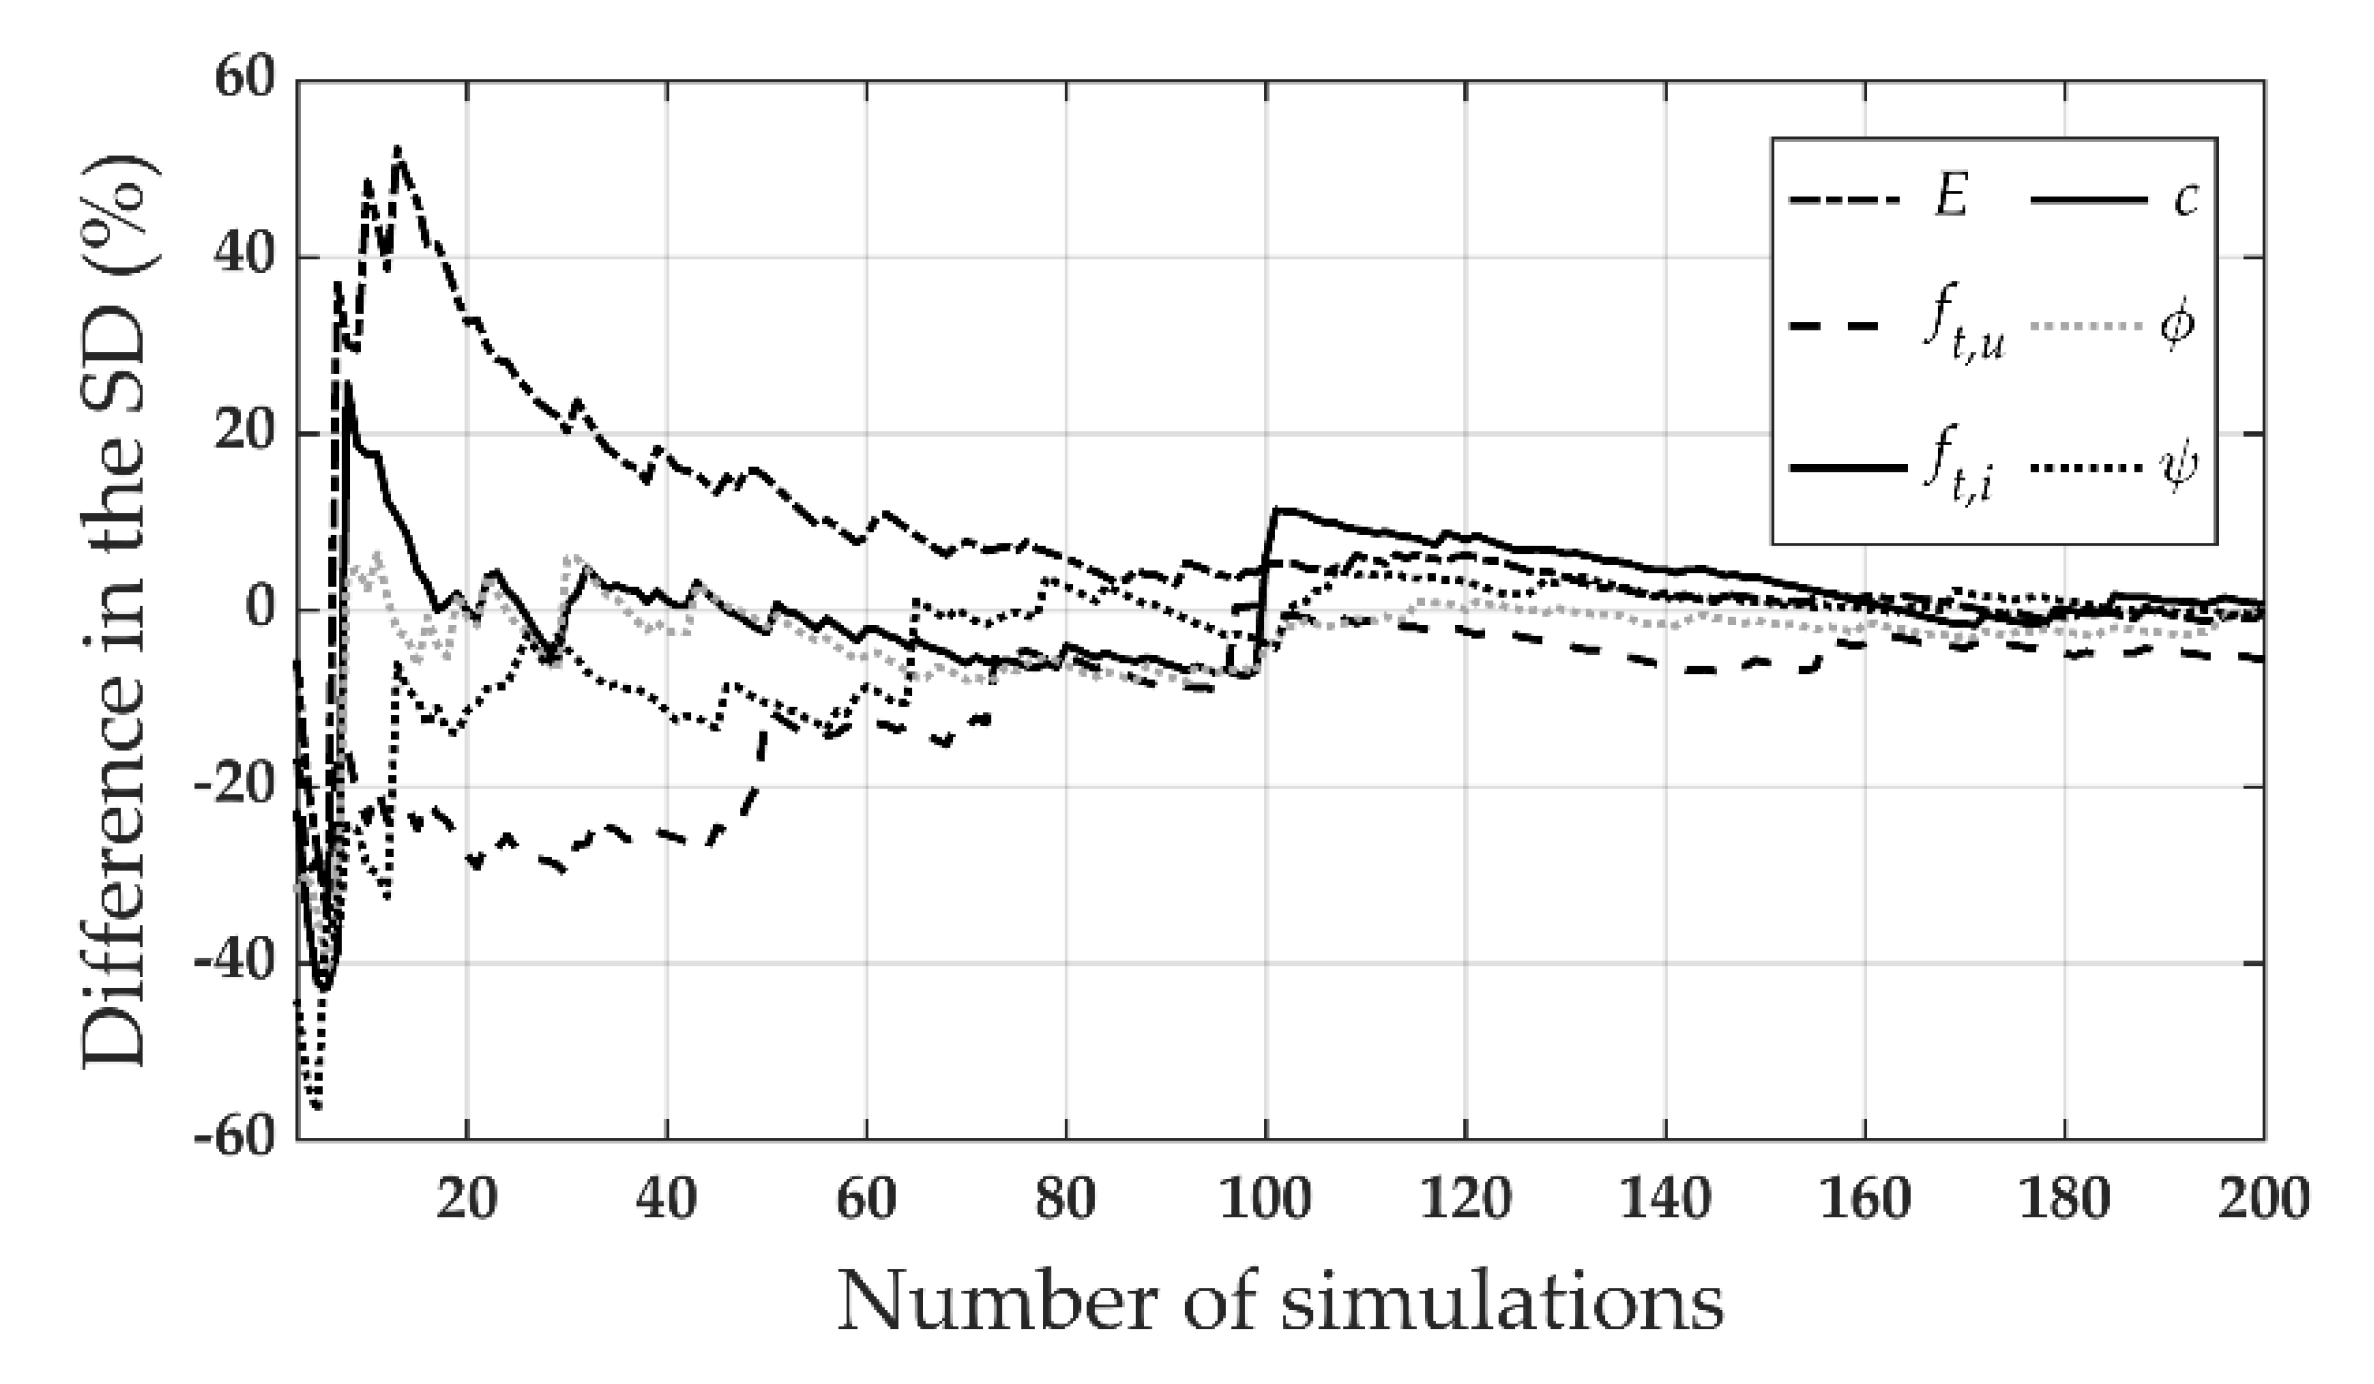
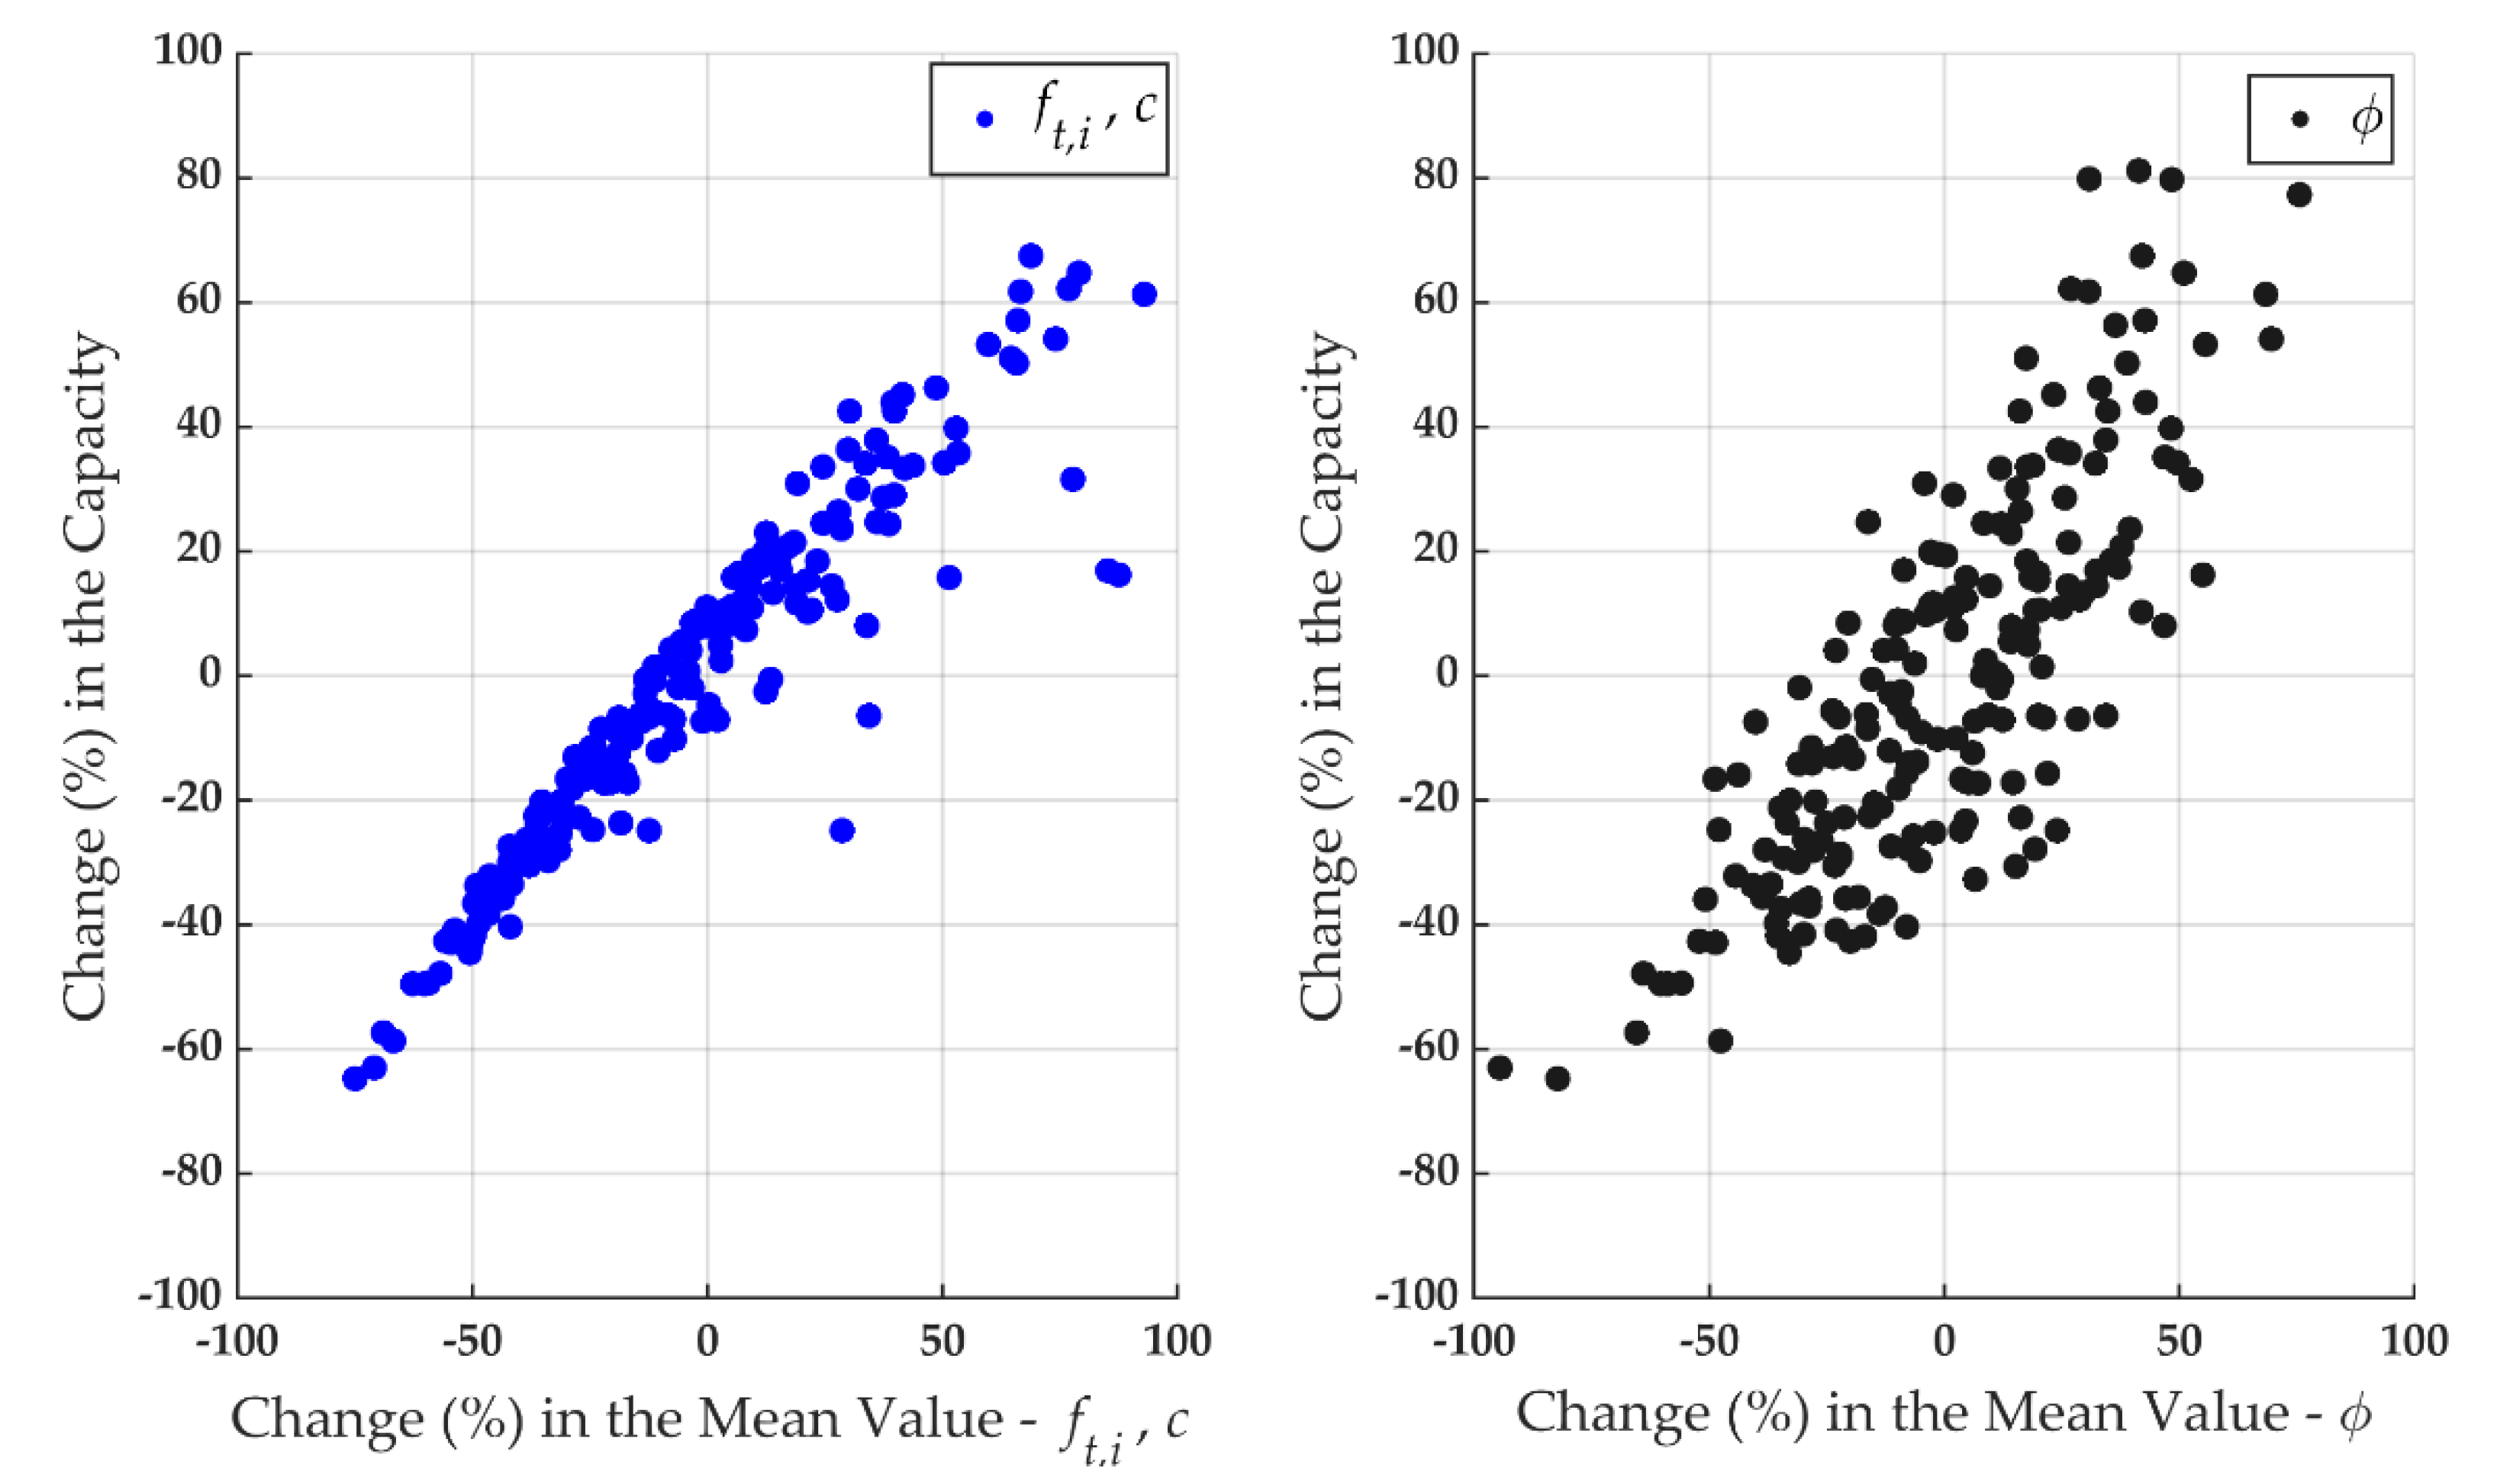
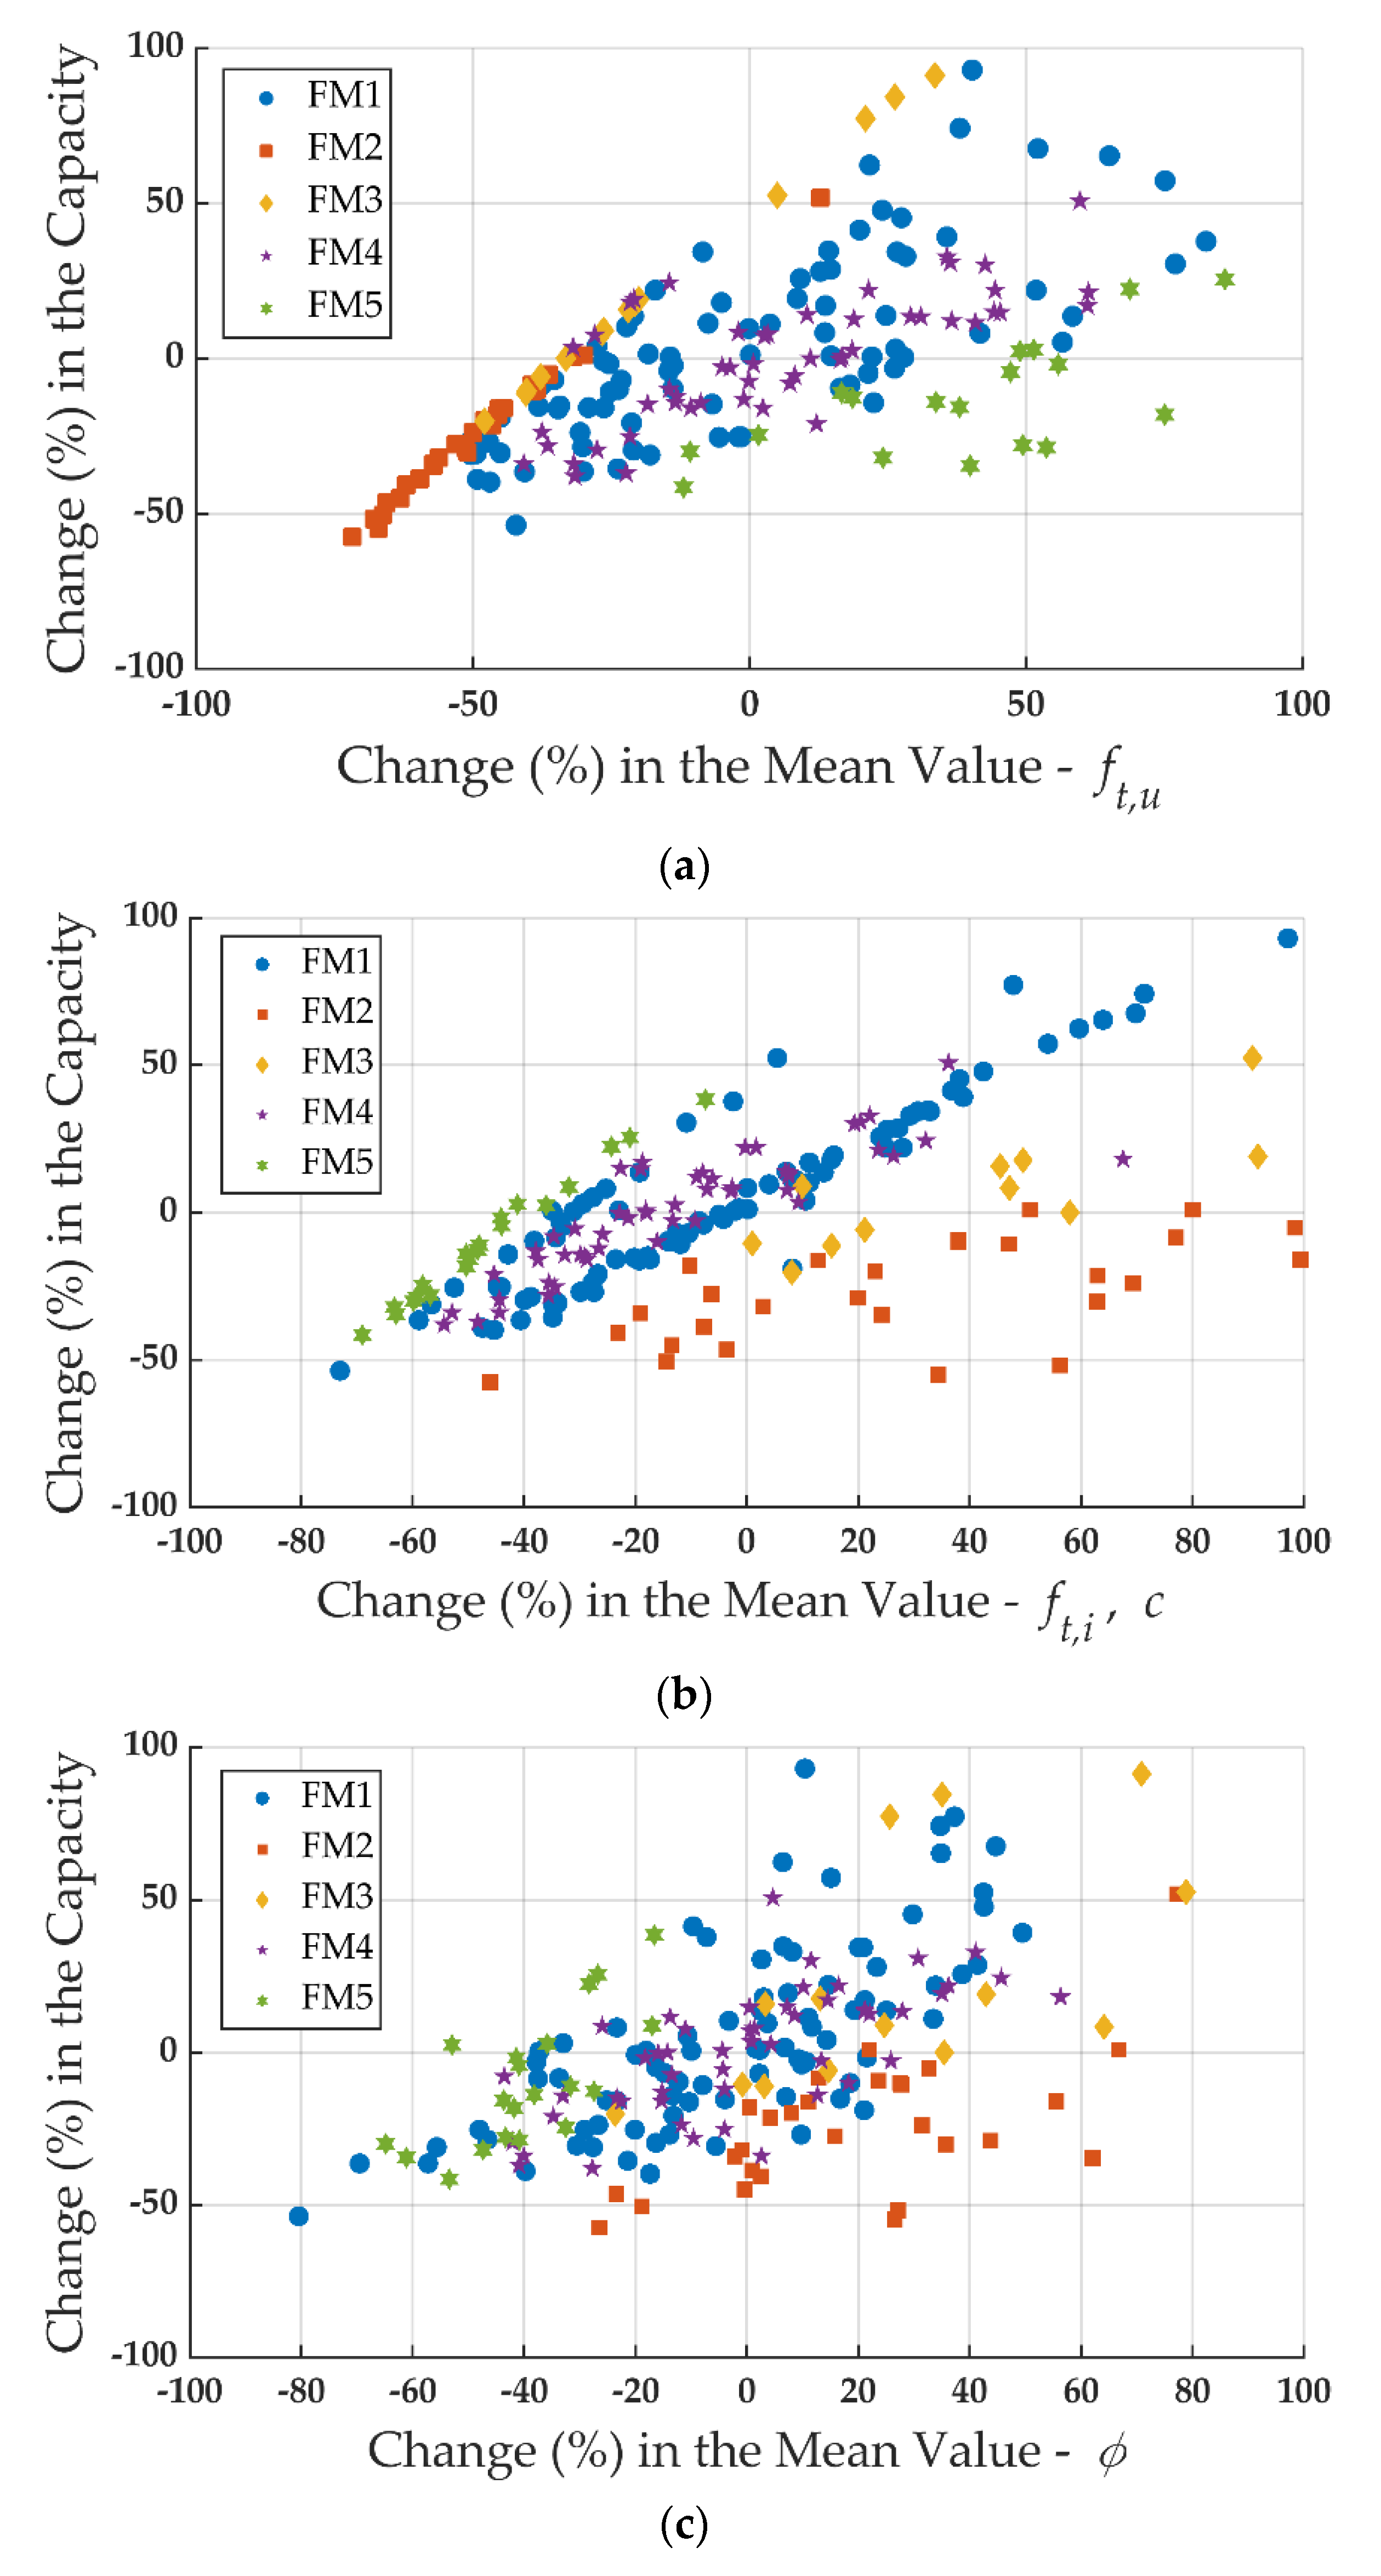
- Stochastic analyses enable us to attain the dispersion of the load-carrying capacity concerning the modeling parameters (, and ). They highlight both the direct and indirect influence of these parameters on the fracture patterns and stress–displacement behavior. Direct correlation of the parameters such as the bond tensile strength, friction angle, or the unit tensile strength with the capacity reflects the physically expected phenomena. In the future, results of these determined correlations can be used to estimate the capacity of different arrangements of masonry materials without using numerical simulations and may lead to the derivation of new empirical formulas to predict the tensile capacity of masonry parallel to bed joints.
- For the given probability distributions of the material parameters, the fracture mechanisms and their likelihood have been found. Moreover, the influence of the modeling parameters on the tensile strength of masonry has been quantified. However, it should be noted that the results presented within this study may be restricted to the statistical distributions and the parameters used.
Supplementary Materials
Author Contributions
Funding
Conflicts of Interest
Appendix A


References
- Lourenço, P.B.; Almeida, J.C.; Barros, J.A. Experimental investigation of bricks under uniaxial tensile testing. Mason. Int. 2005, 18, 11–20. [Google Scholar]
- Backes, H.P. Tensile strength of masonry. In Proceedings of the 7th International Brick Masonry Conference, Melbourne, Australia, 17–20 February 1985; pp. 779–790. [Google Scholar]
- Pulatsu, B.; Erdogmus, E.; Lourenço, P.B.; Quey, R. Simulation of uniaxial tensile behavior of quasi-brittle materials using softening contact models in DEM. Int. J. Fract. 2019, 217, 105–125. [Google Scholar] [CrossRef]
- Resende, R.; Lemos, J.V.; Dinis, P.B. Application of a discontinuity model with softening to the analysis of dam foundations using the Discrete Element Method. In Proceedings of the 1st International UDEC/3DEC Symposium: Numerical Modelling of Discrete Materials in Geotechnical Engineering, Civil Engineering and Earth Sciences, Bochum, Germany, 29 September–1 October 2004; pp. 249–255. [Google Scholar]
- Sarhosis, V.; Lemos, J.V. A detailed micro-modelling approach for the structural analysis of masonry assemblages. Comput. Struct. 2018, 206, 66–81. [Google Scholar] [CrossRef]
- Pulatsu, B.; Erdogmus, E.; Lourenço, P.B.; Lemos, J.V.; Hazzard, J. Discontinuum analysis of the fracture mechanism in masonry prisms and wallettes via discrete element method. Meccanica 2020, 55, 505–523. [Google Scholar] [CrossRef]
- Cundall, P.A. A computer model for simulating progressive, large-scale movements in blocky rock systems. In Proceedings of the The International Symposium on Rock Mechanics, Nancy, France, 4–6 October 1971; pp. 47–65. [Google Scholar]
- Lemos, J.V. The Basis for Masonry Analysis with UDEC and 3DEC. In Computational Modeling of Masonry Structures Using the Discrete Element Method; ACIE: Hershey PA, USA, 2016; pp. 61–89. [Google Scholar]
- Quey, R. Neper Reference Manual. Available online: https://neper.info/docs/neper.pdf (accessed on 17 September 2020).
- Quey, R.; Dawson, P.R.; Barbe, F. Large-scale 3D random polycrystals for the finite element method: Generation, meshing and remeshing. Comput. Methods Appl. Mech. Eng. 2011, 200, 1729–1745. [Google Scholar] [CrossRef]
- Quey, R.; Renversade, L. Optimal polyhedral description of 3D polycrystals: Method and application to statistical and synchrotron X-ray diffraction data. Comput. Methods Appl. Mech. Eng. 2018, 330, 308–333. [Google Scholar] [CrossRef]
- Pulatsu, B.; Kim, S.; Erdogmus, E.; Lourenço, P.B. Advanced Analysis of Masonry Retaining Walls Using Mixed Discrete-Continuum Approach. Available online: https://www.icevirtuallibrary.com/doi/abs/10.1680/jgeen.19.00225 (accessed on 2 August 2020).
- Pulatsu, B.; Erdogmus, E.; Lourenço, P.B.; Lemos, J.V.; Tuncay, K. Numerical modeling of the tension stiffening in reinforced concrete members via discontinuum models. Comput. Part. Mech. 2020. [Google Scholar] [CrossRef]
- Cundall, P.A. Distinct element models of rock and soil structure. In Analytical and Computational Methods in Engineering Rock Mechanics; Brown, E.T., Ed.; George Allen Unwin: London, UK, 1987; pp. 129–163. [Google Scholar]
- Lemos, J.V. Block modelling of rock masses. Concepts and application to dam foundations. Rev. Eur. génie Civ. 2008, 12, 915–949. [Google Scholar] [CrossRef]
- Itasca Consulting Group Inc. 3DEC Three Dimensional Distinct Element Code. Available online: https://www.itascacg.com/software/3dec (accessed on 2 August 2020).
- Kazerani, T. A discontinuum-based model to simulate compressive and tensile failure in sedimentary rock. J. Rock Mech. Geotech. Eng. 2013, 5, 378–388. [Google Scholar] [CrossRef]
- Kazerani, T.; Zhao, J. Micromechanical parameters in bonded particle method for modelling of brittle material failure. Int. J. Numer. Anal. Methods Geomech. 2010, 34, 1877–1895. [Google Scholar] [CrossRef]
- Lourenço, P.B. Computational Strategies for Masonry Structures; Delft University of Technology: Delft, The Netherlands, 1996. [Google Scholar]
- Van Mier, J.G.M.; Man, H.-K. Some Notes on Microcracking, Softening, Localization, and Size Effects. Int. J. Damage Mech. 2009, 18, 283–309. [Google Scholar] [CrossRef]
- Lourenço, P.B.; Rots, J.G. Multisurface interface model for analysis of masonry structures. J. Eng. Mech. 1997, 123, 660–668. [Google Scholar] [CrossRef]
- Van der Pluijm, R.; Rutten, H.; Ceelen, M. Shear behaviour of bed joints. In Proceedings of the 12th International Brick/Block Masonry Conference, Madrid, Spain, 25–28 June 2000; pp. 1–14. [Google Scholar]
- Itasca Consulting Group Inc. UDM Library-Fracture Energy Softening Model. Available online: https://www.itascacg.com/software/udm-library/fracture-energy-softening-model (accessed on 7 September 2020).
- van der Pluijm, R. Out-of-Plane Bending of Masonry Behaviour and Strength; Technische Universiteit Eindhoven: Eindhoven, The Netherlands, 1999. [Google Scholar]
- Lourenço, P.B.; Barros, J.A.; Almeida, J.C. Characterization of masonry under unixial tension-Report 02-DEC/E-12; Universidade do Minho: Guimarães, Portugal, 2002. [Google Scholar]
- Backes, H.P. On the Behavior of Masonry under Tension in the Direction of the Bed Joints. Ph.D. Thesis, Aachen University of Technology, Aachen, Germany, 1985. [Google Scholar]
- Pulatsu, B.; Erdogmus, E.; Lourenço, P.B.; Lemos, J.V.; Tuncay, K. Simulation of the in-plane structural behavior of unreinforced masonry walls and buildings using DEM. Structures 2020, 27, 2274–2287. [Google Scholar] [CrossRef]
- Atkinson, R.H.; Amadei, B.P.; Saeb, S.; Sture, S. Response of masonry bed joints in direct shear. J. Struct. Eng. 1989, 115, 2276–2296. [Google Scholar] [CrossRef]
- Schubert, P. Tensile and flexural strength of masonry - influences, test methods, test results. In Proceedings of the 10th International Brick/Block Masonry Conference, Calgary, AB, Canada, 5–7 July 1994; pp. 895–908. [Google Scholar]
- Parisi, F.; Augenti, N. Uncertainty in seismic capacity of masonry buildings. Buildings 2012, 2, 218–230. [Google Scholar] [CrossRef]
- Conde, B.; Matos, J.C.; Oliveira, D.V.; Riveiro, B. Probabilistic-based structural assessment of a historic stone arch bridge. Struct. Infrastruct. Eng. 2020, 1–13. [Google Scholar] [CrossRef]
- Pina-Henriques, J.; Lourenço, P.B. Masonry compression: A numerical investigation at the meso-level. Eng. Comput. (Swansea, Wales) 2006, 23, 382–407. [Google Scholar] [CrossRef]
- Moreira, V.N.; Fernandes, J.; Matos, J.C.; Oliveira, D.V. Reliability-based assessment of existing masonry arch railway bridges. Constr. Build. Mater. 2016, 115, 544–554. [Google Scholar] [CrossRef]
- Ghiassi, B.; Vermeltfoort, A.T.; Lourenço, P.B. Masonry mechanical properties. In Numerical Modeling of Masonry and Historical Structures; Ghiassi, B., Milani, G., Eds.; Elsevier: Amsterdam, The Netherlands, 2019; pp. 237–261. ISBN 9780081024393. [Google Scholar]
- Lourenço, P.B. Recent advances in masonry structures: Micromodelling and homogenisation. Available online: https://www.worldscientific.com/doi/abs/10.1142/9781848163089_0006 (accessed on 2 August 2020).
- Boussabaine, A.; Kirkham, R. Whole Life-Cycle Costing: Risk and Risk Responses; Wiley: Oxford, UK, 2004. [Google Scholar]
- Lemaire, M.; Chateauneuf, A.; Mitteau, J.-C. Structural Reliability; ISTE: London, UK, 2009; ISBN 9780470611708. [Google Scholar]


| Random Variable | Prob. Distribution | Coeff. of Variation | |||
|---|---|---|---|---|---|
| (GPa) | Normal | 4 | 0.30 | N/A | N/A |
| Lognormal | 1.0 | 0.45 | −0.0922 | 0.4294 | |
| Lognormal | 0.10 | 0.45 | −2.3948 | 0.4294 | |
| (degrees) | Normal | 35 | 0.30 | N/A | N/A |
| Lognormal | 0.15 | 0.45 | −1.9893 | 0.4294 | |
| (degrees) | Lognormal | 2 | 0.30 | 0.6501 | 0.2936 |
| Random Variable | Prob. Distribution | Coeff. of Variation | |||
|---|---|---|---|---|---|
| (GPa) | Normal | 4 | 0.30 | N/A | N/A |
| Lognormal | 0.25 | 0.45 | −1.4785 | 0.4294 | |
| Lognormal | 0.20 | 0.45 | −1.7016 | 0.4294 | |
| ϕ (degrees) | Normal | 35 | 0.30 | N/A | N/A |
| Lognormal | 0.30 | 0.45 | −1.2962 | 0.4294 | |
| (degrees) | Lognormal | 2 | 0.30 | 0.6501 | 0.2936 |
© 2020 by the authors. Licensee MDPI, Basel, Switzerland. This article is an open access article distributed under the terms and conditions of the Creative Commons Attribution (CC BY) license (http://creativecommons.org/licenses/by/4.0/).
Share and Cite
Pulatsu, B.; Gonen, S.; Erdogmus, E.; Lourenço, P.B.; Lemos, J.V.; Hazzard, J. Tensile Fracture Mechanism of Masonry Wallettes Parallel to Bed Joints: A Stochastic Discontinuum Analysis. Modelling 2020, 1, 78-93. https://doi.org/10.3390/modelling1020006
Pulatsu B, Gonen S, Erdogmus E, Lourenço PB, Lemos JV, Hazzard J. Tensile Fracture Mechanism of Masonry Wallettes Parallel to Bed Joints: A Stochastic Discontinuum Analysis. Modelling. 2020; 1(2):78-93. https://doi.org/10.3390/modelling1020006
Chicago/Turabian StylePulatsu, Bora, Semih Gonen, Ece Erdogmus, Paulo B. Lourenço, Jose V. Lemos, and Jim Hazzard. 2020. "Tensile Fracture Mechanism of Masonry Wallettes Parallel to Bed Joints: A Stochastic Discontinuum Analysis" Modelling 1, no. 2: 78-93. https://doi.org/10.3390/modelling1020006
APA StylePulatsu, B., Gonen, S., Erdogmus, E., Lourenço, P. B., Lemos, J. V., & Hazzard, J. (2020). Tensile Fracture Mechanism of Masonry Wallettes Parallel to Bed Joints: A Stochastic Discontinuum Analysis. Modelling, 1(2), 78-93. https://doi.org/10.3390/modelling1020006