Article

Automatic Weight-Bearing Foot Series Measurements Using Deep Learning

1
Department of Radiology, Perpignan Hospital, 20 Av. du Languedoc, 66000 Perpignan, France
2
Milvue, 29, Rue du Faubourg Saint-Jacques, 75014 Paris, France
3
Department of Medical Imaging, IMAGINE UR UM 103, Nîmes University Hospital, Montpellier University, 30900 Nîmes, France
4
General Surgery Department, Fattouma Bourguiba Hospital, Monastir 5000, Tunisia
*
Author to whom correspondence should be addressed.
AI 2025, 6(7), 144; https://doi.org/10.3390/ai6070144
Submission received: 17 May 2025 / Revised: 20 June 2025 / Accepted: 26 June 2025 / Published: 2 July 2025
(This article belongs to the Section Medical & Healthcare AI)

Abstract

Background: Foot deformities, particularly hallux valgus, significantly impact patients’ quality of life. Conventional radiographs are essential for their assessment, but manual measurements are time-consuming and variable. This study assessed the reliability of a deep learning-based solution (Milvue, France) that automates podiatry angle measurements from radiographs compared to manual measurements made by radiologists. Methods: A retrospective, non-interventional study at Perpignan Hospital analyzed the weight-bearing foot radiographs of 105 adult patients (August 2017–August 2022). The deep learning (DL) model’s measurements were compared to those of two radiologists for various angles (M1-P1, M1-M2, M1-M5, and P1-P2 for Djian–Annonier, calcaneal slope, first metatarsal slope, and Meary–Tomeno angles). Statistical analyses evaluated DL performance and inter-observer variability. Results: Of the 105 patients included (29 men and 76 women; mean age 55), the DL solution showed excellent consistency with manual measurements, except for the P1-P2 angle. The mean absolute error (MAE) for the frontal view was lowest for M1-M2 (0.96°) and highest for P1-P2 (3.16°). Intraclass correlation coefficients (ICCs) indicated excellent agreement for M1-P1, M1-M2, and M1-M5. For the lateral view, the MAE was 0.92° for calcaneal pitch and 2.83° for Meary–Tomeno, with ICCs ≥ 0.93. For hallux valgus detection, accuracy was 94%, sensitivity was 91.1%, and specificity was 97.2%. Manual measurements averaged 203 s per patient, while DL processing was nearly instantaneous. Conclusions: The DL solution reliably automates foot alignment assessments, significantly reducing time without compromising accuracy. It may improve clinical efficiency and consistency in podiatric evaluations.

1. Introduction

1.1. Clinical Context and Challenges

Foot deformities and their associated complications can significantly affect patients’ quality of life, leading to mobility limitations and pain [1]. Among these deformities, tarsal and forefoot pathologies, such as hallux valgus, are common concerns for clinicians and radiologists. Hallux valgus, characterized by the lateral deviation of the big toe, is a widespread condition affecting up to 23% of adults and 35.7% of the elderly [2]. The diagnosis, management, and post-treatment monitoring of this condition primarily rely on the assessment of foot statics using conventional radiography. Radiographic evaluation allows for the quantification of deformity by measuring specific angles, including the M1-P1, M1-M2, M1-M5, P1-P2, Djian–Annonier, calcaneus slope, first metatarsal slope, and Meary–Tomeno angles. However, these measurements are time-consuming, require trained operators, and are subject to significant intra- and inter-observer variability [3].

1.2. Related Work

To address these limitations, artificial intelligence (AI), particularly deep learning (DL), has been increasingly used in radiology to automate image interpretation tasks [4,5]. Several studies have specifically examined the application of DL to foot radiographs [6], particularly for diagnosing flat feet through automatic angle measurements [7]. Hida et al. trained a convolutional neural network to detect hallux valgus based on the M1-P1 angle, achieving an accuracy of 79% [8]. Kwolek et al. developed a DL model capable of estimating hallux valgus and intermetatarsal angles with a strong correlation to expert radiologists’ values [9]. Takeda et al. developed a deep neural network to automatically measure the hallux valgus angle (HVA) and intermetatarsal angle (IMA) on foot radiographs, demonstrating measurement accuracy comparable to that of expert surgeons, with lower variability than inter-observer variation for the HVA [10]. Kim-Choi et al. designed a DL pipeline combining bone segmentation and reference line detection to estimate four key podiatric angles on both frontal and lateral foot radiographs, achieving excellent agreement with manual measurements, as ICCs were consistently above 0.8 [11]. Semi-automated computer-aided techniques have also been explored for computed tomography [12].
However, these studies primarily focus on a limited number of angles and do not address the full spectrum of podiatric measurements routinely used in radiopodometry. Furthermore, reproducibility and the clinical integration of these tools remain underexplored. To our knowledge, no study has yet evaluated the performance of an AI-based tool capable of providing comprehensive, automated measurements of both coronal and sagittal foot alignment angles in a real-life clinical setting.

1.3. Objectives of the Study

The primary objective of this study was to assess the consistency of a DL-based solution for evaluating coronal and sagittal foot alignment compared to radiologist measurements as the gold standard. The secondary objectives were (i) the detection of hallux valgus and the classification of its severity using the M1-P1 angle; (ii) the detection of flat feet and cavus feet using the Djian–Annonier angle; (iii) the assessment of inter-rater variability among radiologists; and (iv) the evaluation of the software’s impact on measurement time.

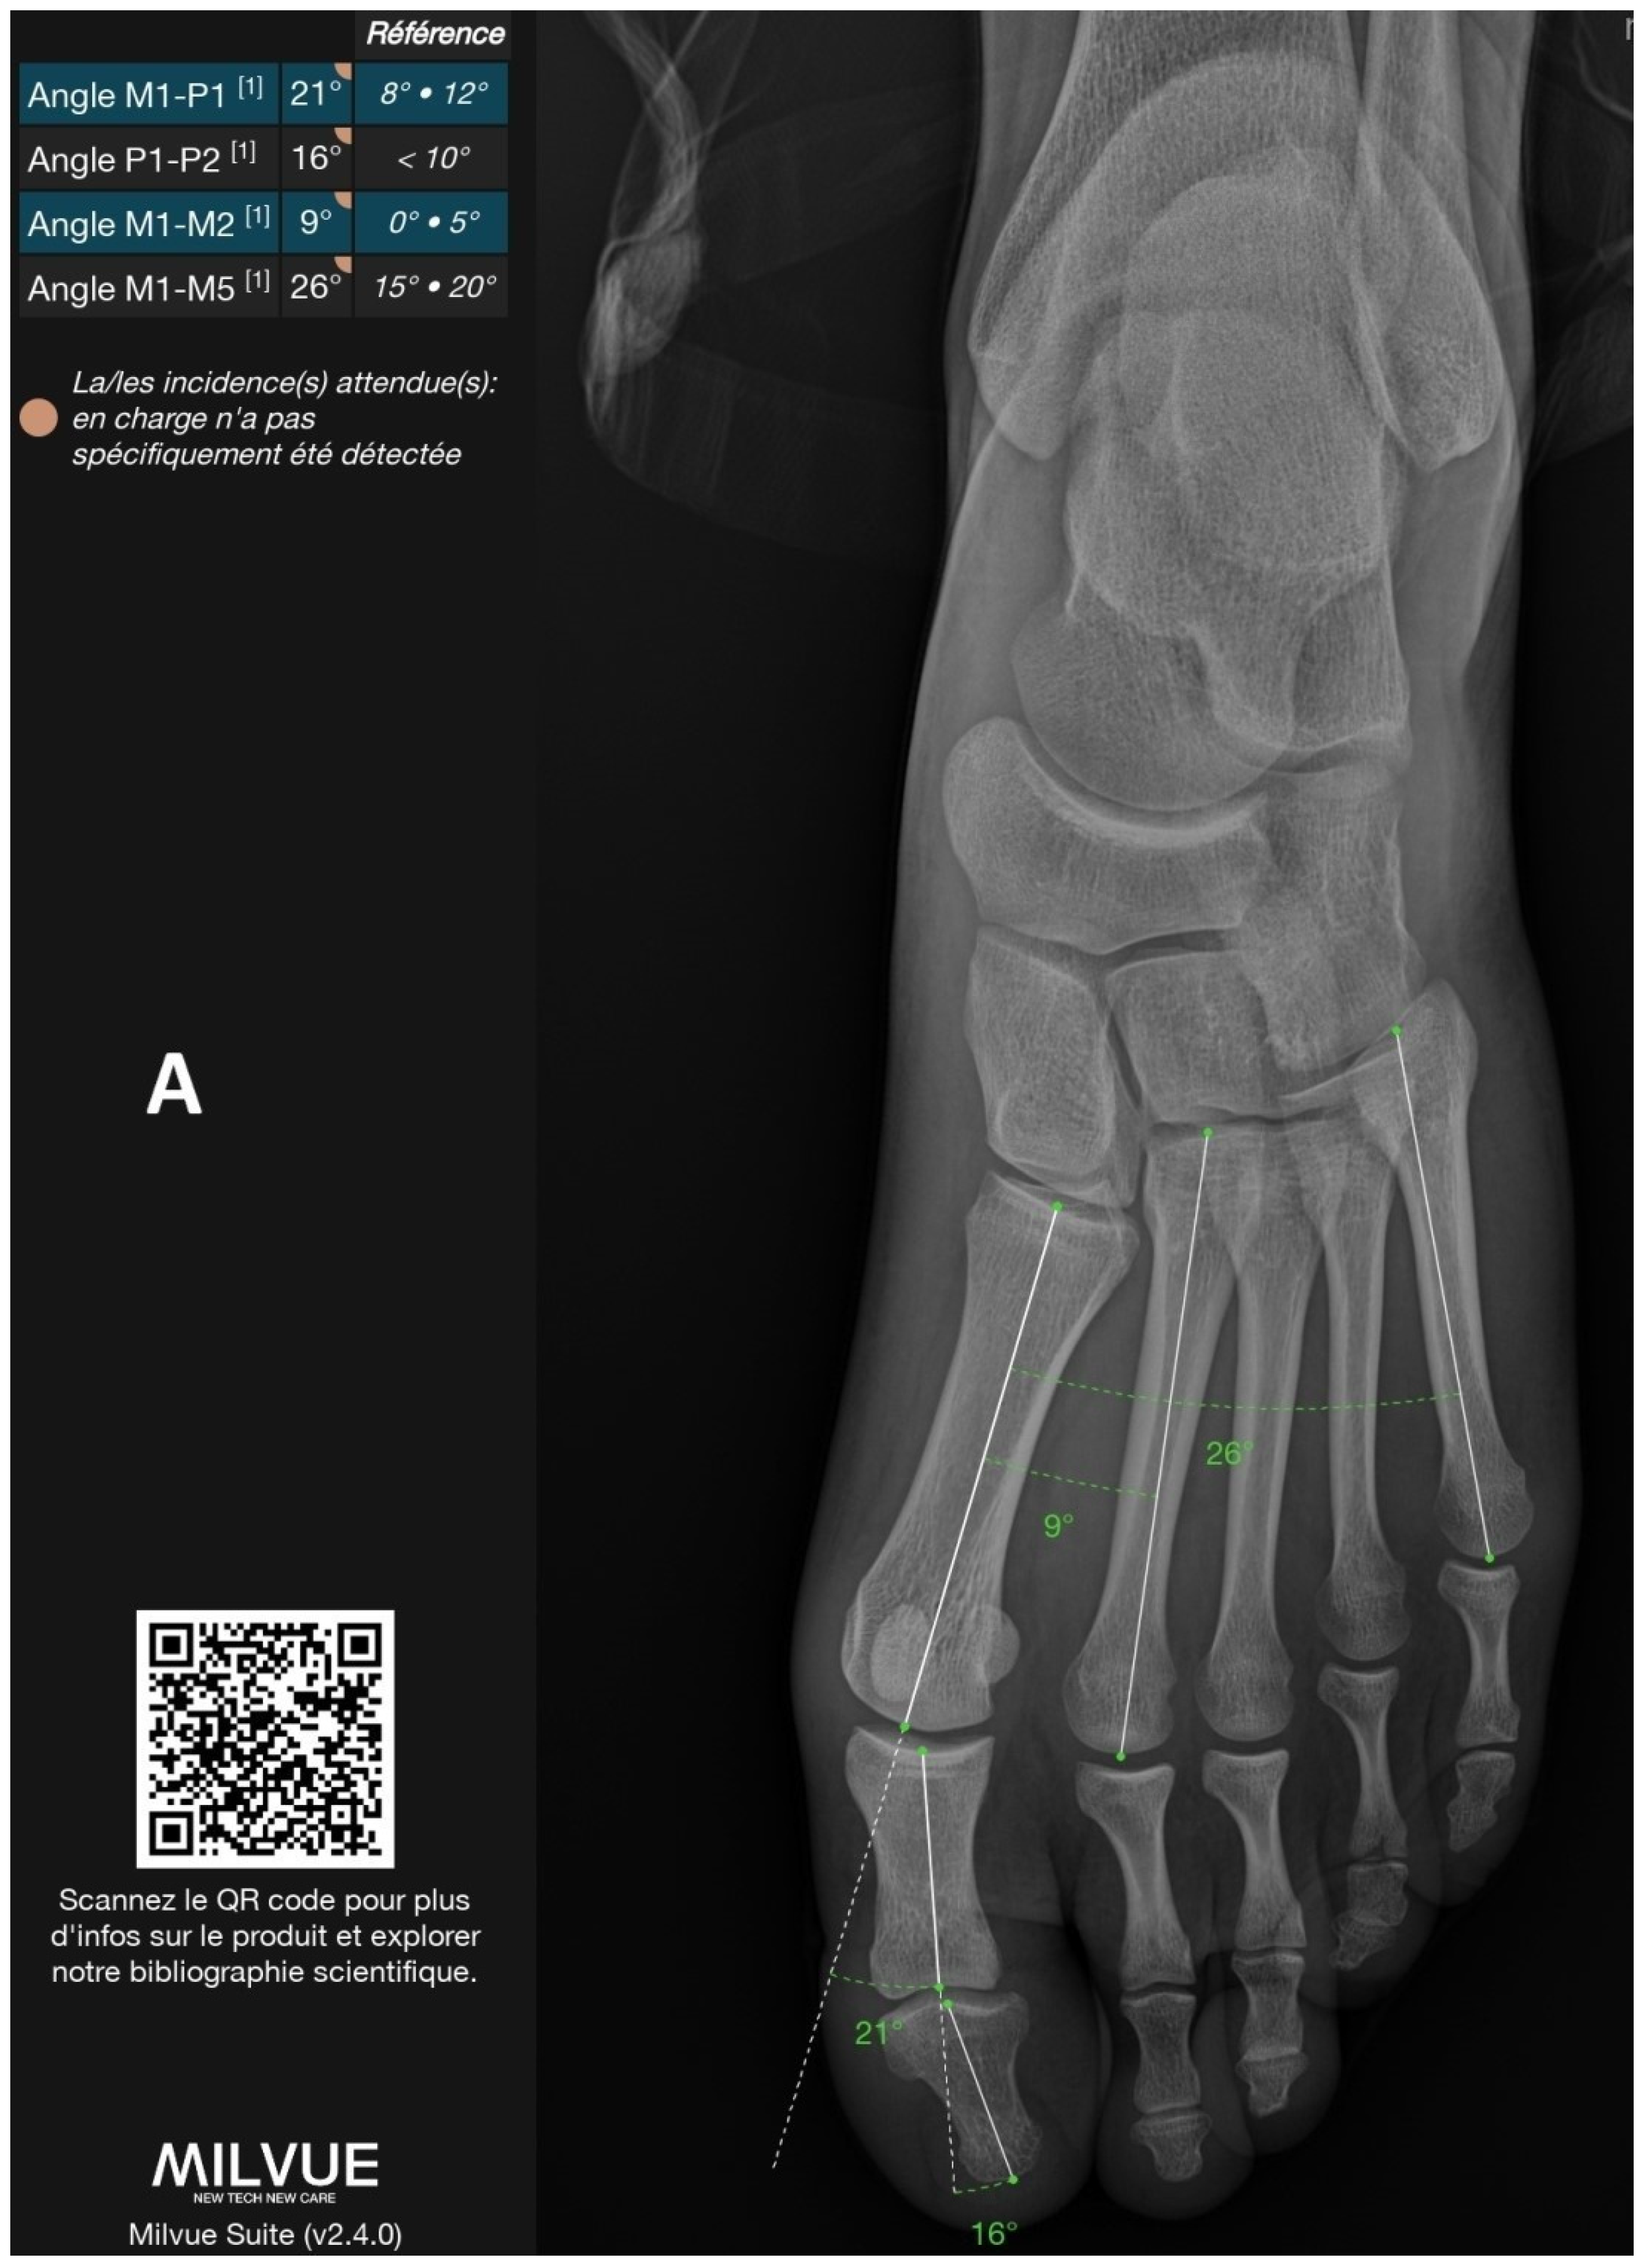
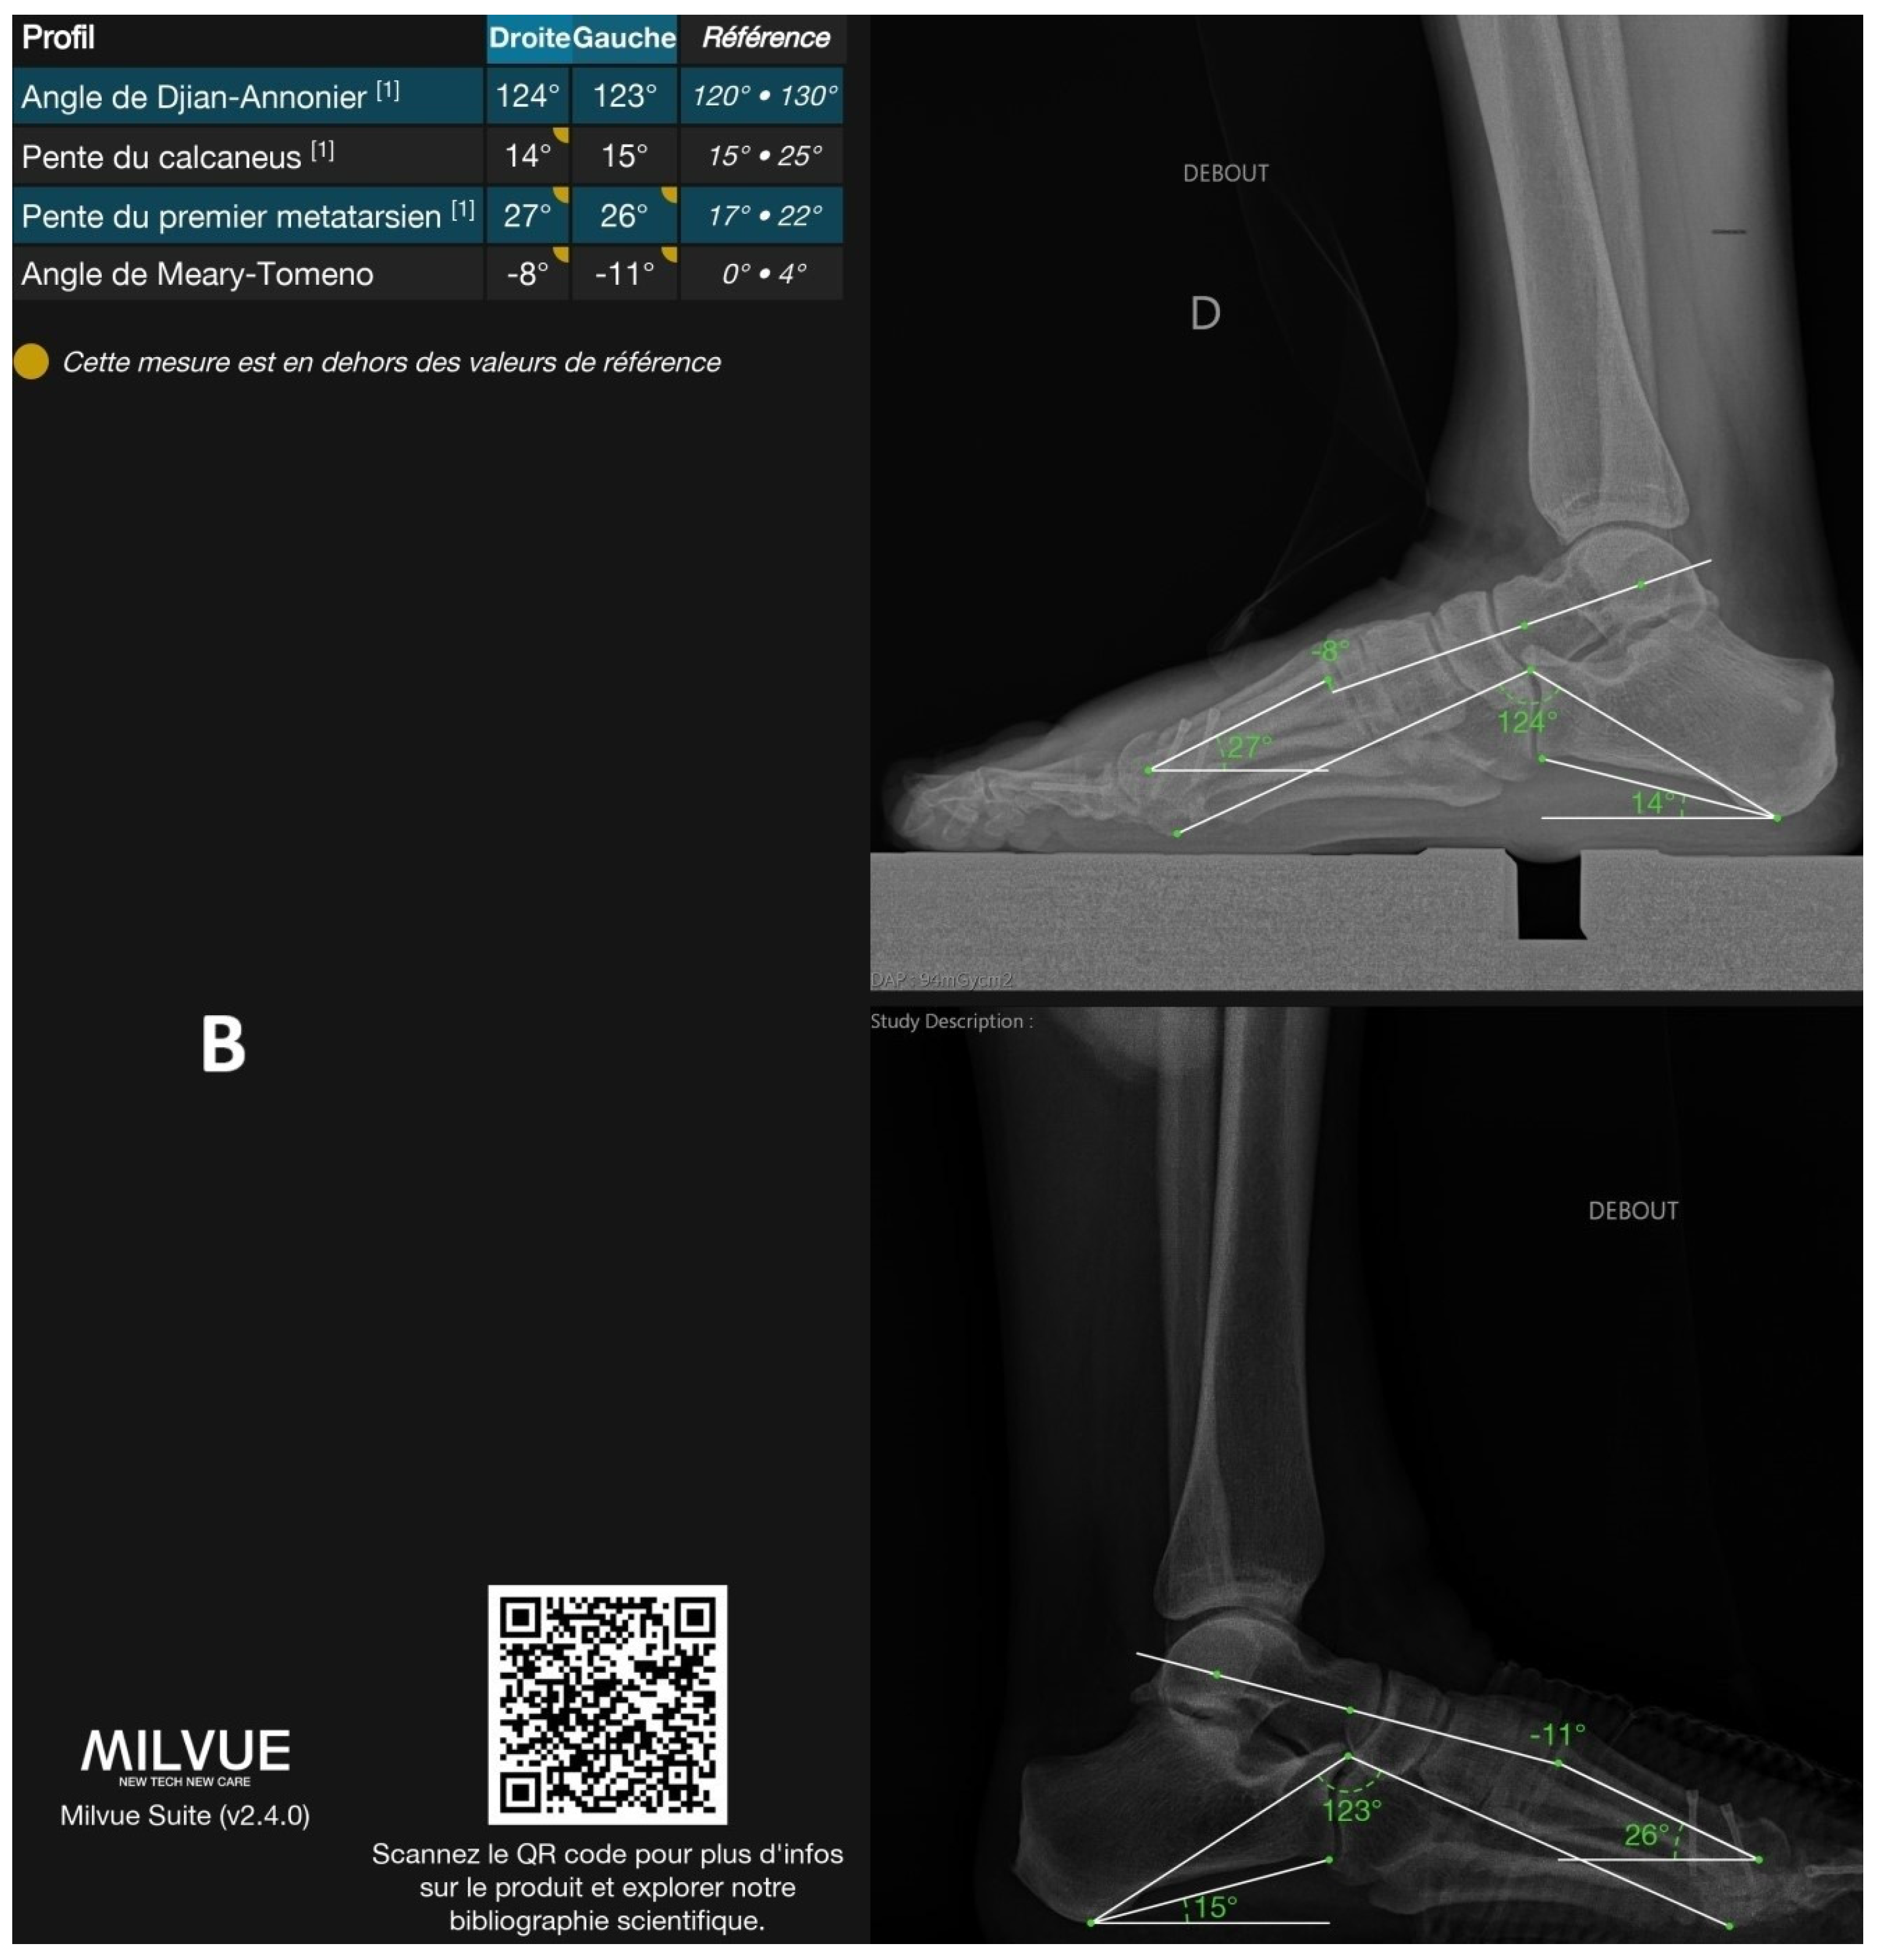
2. Materials and Methods
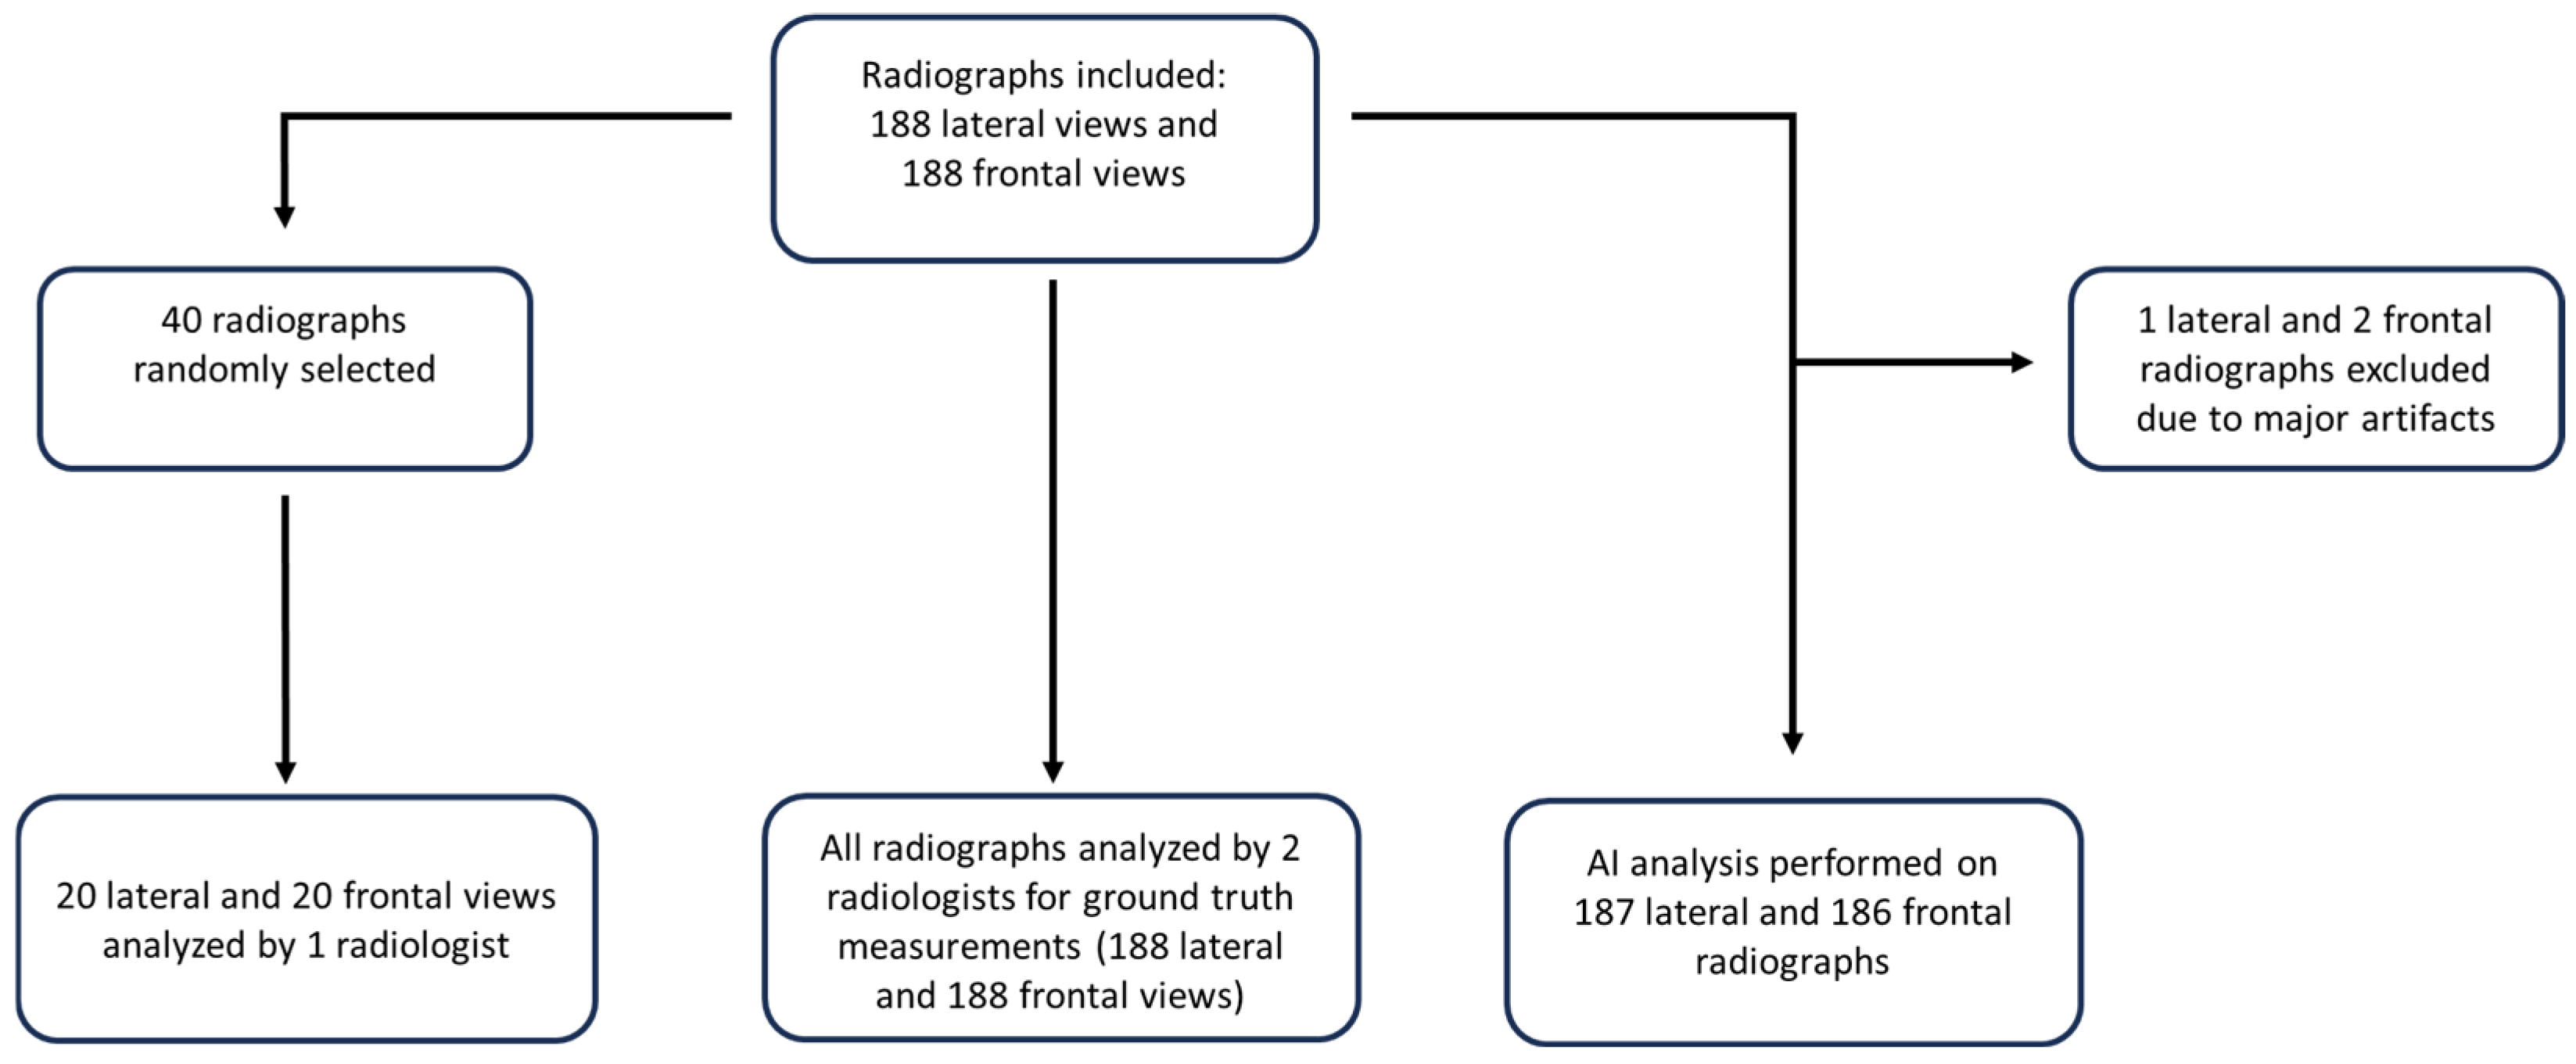
2.1. Study Design

This retrospective, non-interventional study was conducted in the Radiology Department of our institution (Perpignan Hospital, France) and received non-financial support from Milvue, which provided the DL model (Milvue Suite v2.0). All authors reviewed and approved the data and information submitted for publication. The study was approved by the Institutional Review Board (IRB) (CRM-2210-302), which waived the requirement for written informed consent. The Checklist for Artificial Intelligence in Medical Imaging (CLAIM) was followed in this study [13].

2.2. Data Source and Processing

Adult weight-bearing lateral and frontal (dorsoplantar) radiographs of the foot from August 2017 to August 2022 were retrieved from our institutional PACS (Picture Archiving and Communication System), and the first 105 consecutive, randomly selected patients who met the study’s inclusion and exclusion criteria were included. The inclusion criteria were as follows: whole-foot radiographs that were acquired in a standing position with both lateral and frontal views. The exclusion criteria were as follows: refusal to participate in the study and major motion artifacts during image acquisition, as defined by the principal investigator. Otherwise, surgical material, history of bone fracture, off-centering, over- or underexposure to X-rays, and/or minor to moderate motion artifacts were not excluded to evaluate the performance of AI in a representative sample of routine cases.
All included cases were locally anonymized and uploaded to a secure local server for analysis by a deep learning (DL) algorithm (TechCare Bones, Milvue Suite v2.0, Milvue, France). This proprietary model is based on a convolutional neural network (CNN) specifically designed for musculoskeletal radiograph interpretation. The model relies on a multi-stage pipeline that includes the automated preprocessing of the images (the standardization of pixel values, contrast enhancement, and cropping around relevant anatomical areas), followed by body part classification, region of interest (ROI) detection, and keypoint localization. This architecture has been described in previous publications [14].
Anatomical landmarks—such as joint centers, cortical margins, and bone extremities—are automatically detected using learned patterns from the training set. Based on these keypoints, the system derives geometric measurements (e.g., angles, lengths) using deterministic post-processing rules grounded in clinical anatomy.
The model was developed using a total of 19,937 radiographs collected from at least four French radiology centers, all independent of our institution. This multi-center dataset, annotated by French radiologists, was split into 17,273 images for training, 1304 images for validation, and 1360 images for testing. The development process followed an iterative training–validation loop, during which AI engineers fine-tuned model parameters and monitored performance on a dedicated validation set. The final evaluation was conducted on a hold-out test set comprising radiographs that were not used during the training or validation phases. Due to ongoing industrial protection, detailed information on the network architecture and training parameters cannot be disclosed.

2.3. Ground-Truth Measurements and Inter-Reader Variability

Two radiologists (JT and AP—5 and 8 years of experience), blinded to the DL measurements, independently performed manual annotations on weight-bearing frontal and lateral radiographs from the study sample. For each patient, the following information was collected: age, sex, and the clinical indication for a radiographic examination. The presence or absence of prior surgical intervention and surgical material was also recorded. On each radiograph, the radiologists assessed the following angles (in degrees): the M1-P1 angle, M1-M2 angle, M1-M5 angle, P1-P2 angle, Djian–Annonier angle, calcaneal slope, first metatarsal slope, and Meary–Tomeno angle. All images were visualized and measured using the institution’s standard DICOM (Digital Imaging and Communications in Medicine) viewer.
For subsequent analysis, the ground truth (GT) was defined as the mean of the two radiologists’ measurements. The time required for manual measurements was recorded for the last 20 cases to assess the time burden of manual annotation. To evaluate inter-observer variability, a third radiologist (MT, 12 years of experience), blinded to the other two readers, independently performed the same measurements on a random subset of 40 radiographs.
Figure 1 shows an example of a radiograph annotated by the deep learning model, illustrating all automatically detected angles.

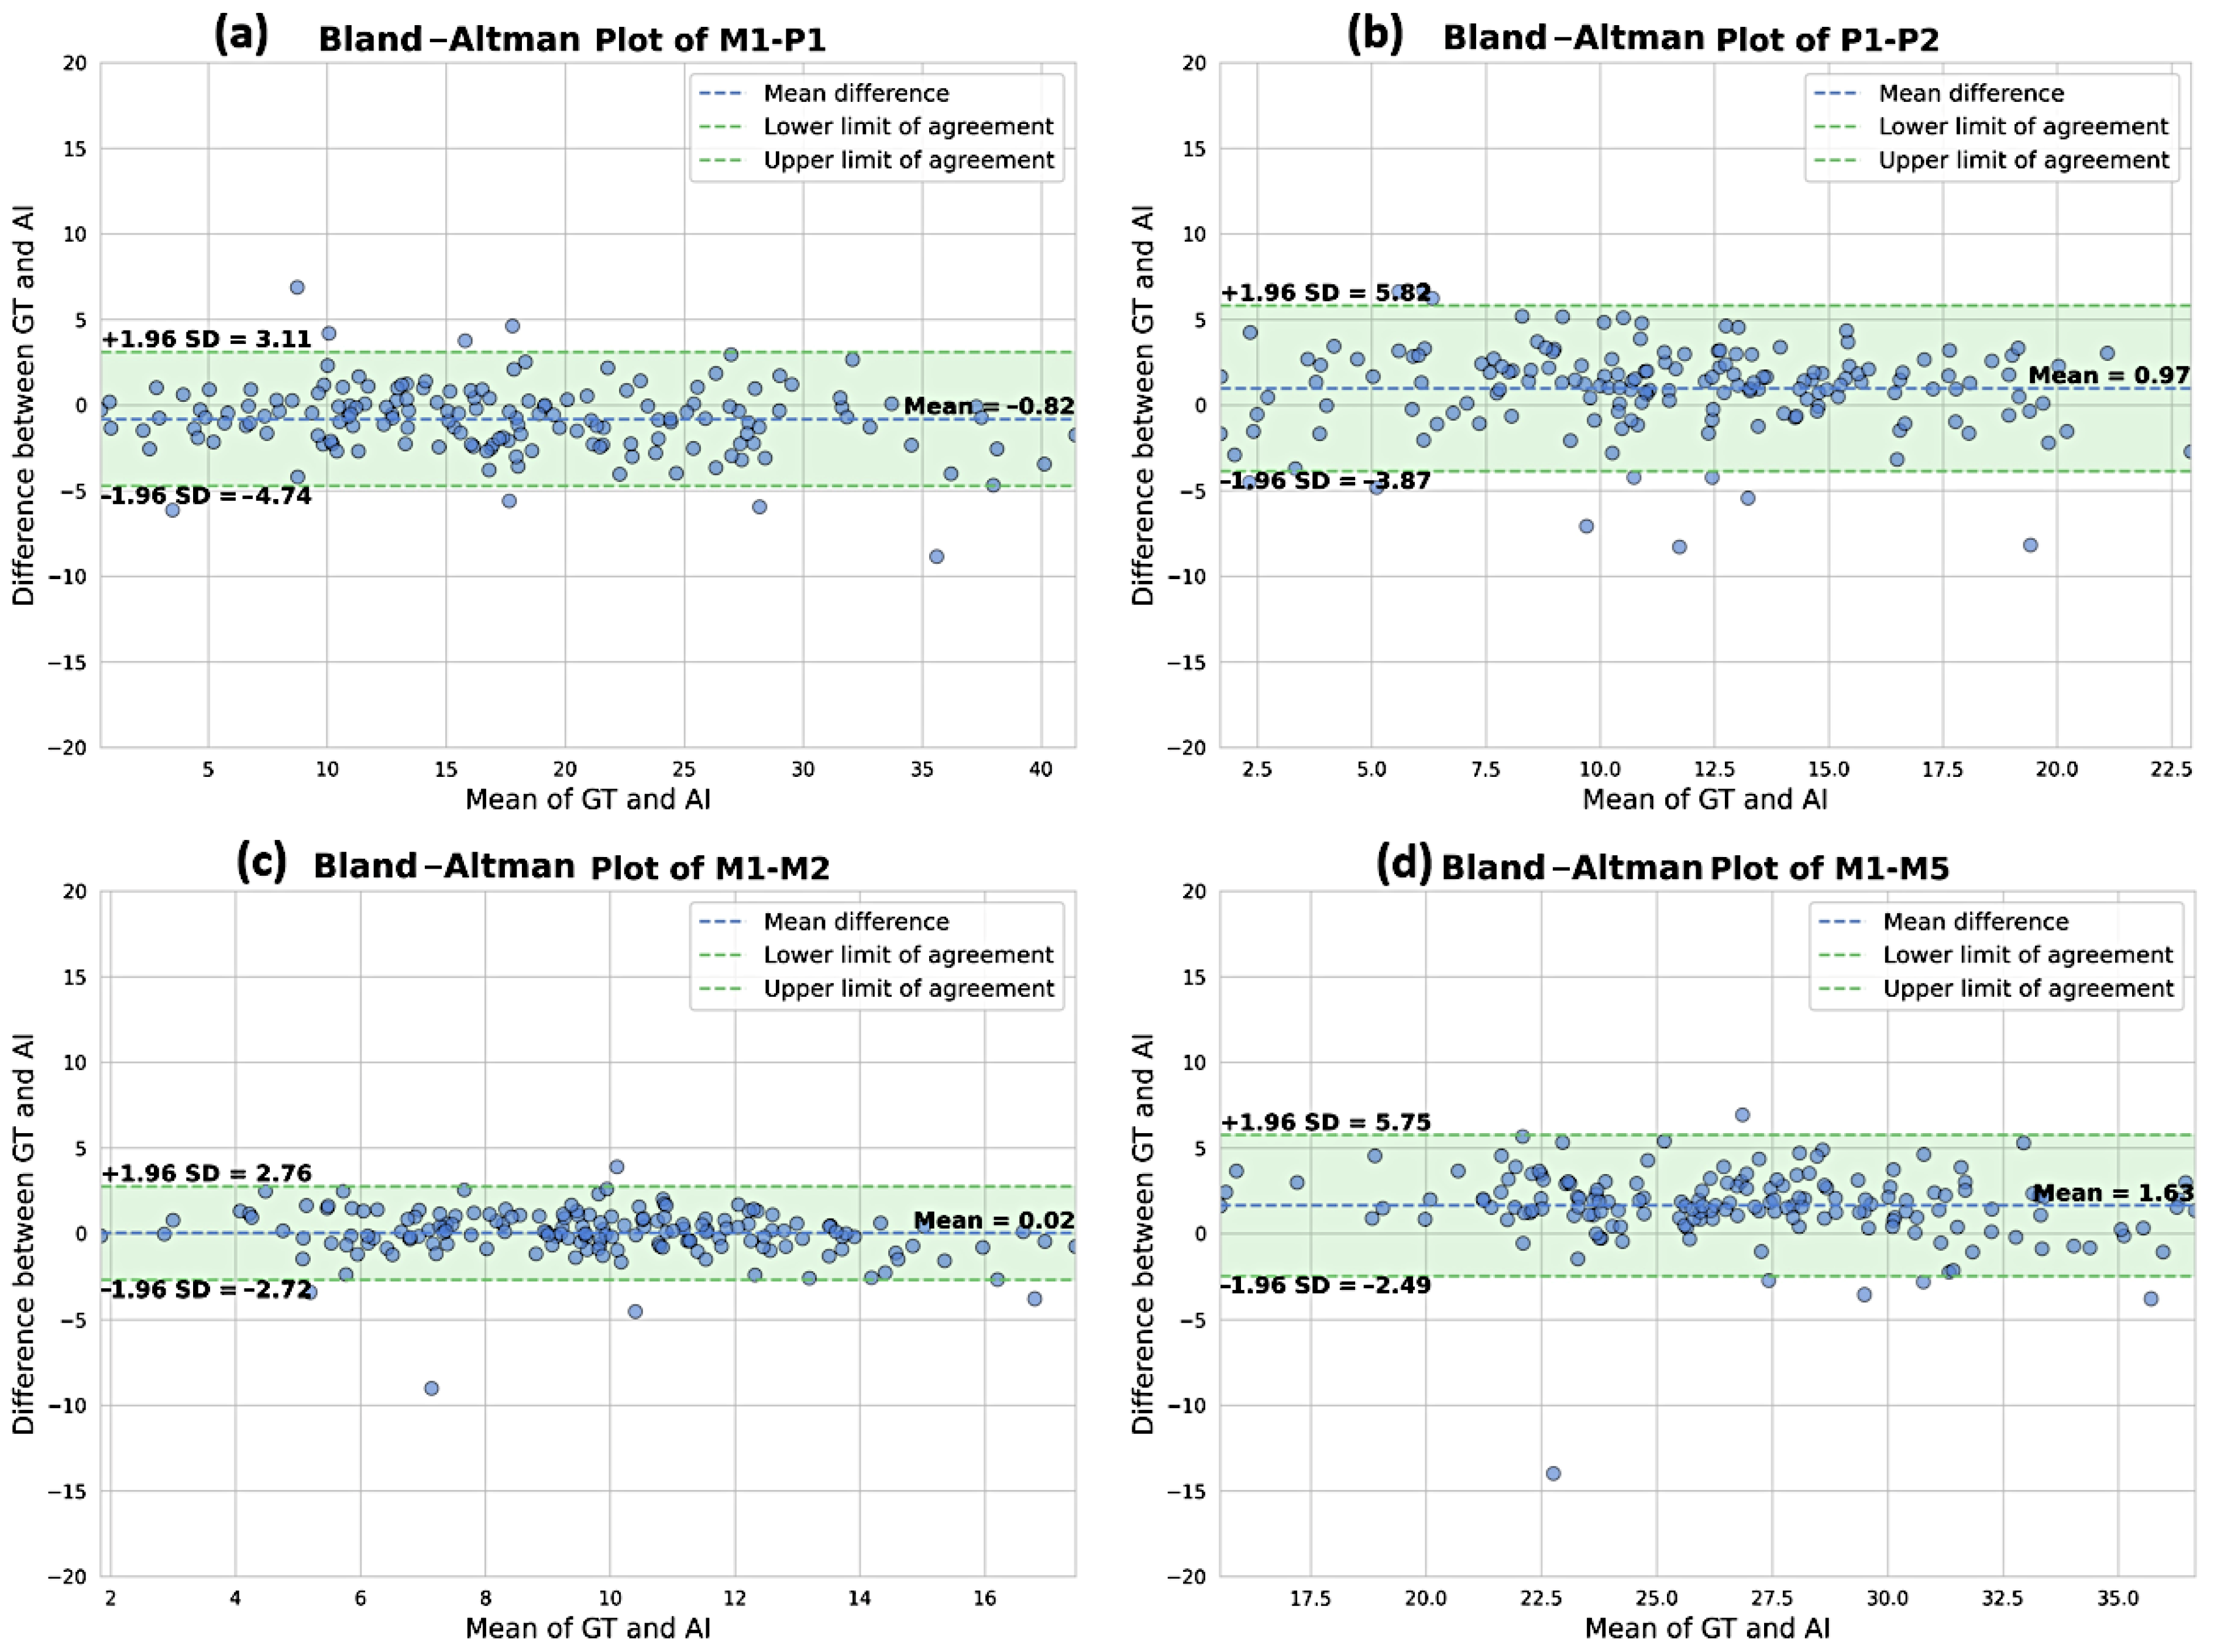
2.4. Statistical Analyses

Statistical analyses were performed using Python (version 3.10.6) and R (version 4.1.2; R Foundation for Statistical Computing). A descriptive analysis was carried out to report the means and standard deviations (SDs) as well as the ranges of data. DL performance was evaluated against the ground truth (GT) using the mean absolute error (MAE) and its 95% confidence interval (95% CI), normalized MAE (NMAE), mean bias, and limits of agreement with the Bland–Altman calculation, and consistency with the intraclass correlation coefficient (ICC) and its 95% CI. Inter-reader variability was assessed using MAE and ICC matrices between radiologists. Intraclass correlations were computed using a two-way random-effects model with consistency definition. Reliability was classified according to the ICC thresholds proposed by Cicchetti et al. [15] as follows: excellent (ICC ≥ 0.75), good (0.60 ≤ ICC < 0.75), fair (0.40 ≤ ICC < 0.60), and poor (ICC < 0.40). A subgroup analysis was performed for surgical material: the absence of surgical material and the presence of surgical material. Paired t-tests were used to compare values. Statistical significance was defined as p < 0.05. Clinically relevant thresholds were defined for the M1-P1 and Djian–Annonier angles, with a subsequent confusion matrix generated to evaluate the classification performance of the DL model. The numbers of true positive (TP), true negative (TN), false positive (FP), and false negative (FN) cases were counted, and the corresponding sensitivities (Sn) = TP/(TP + FN) and specificities (Sp) = TN/(TN + FP) were calculated. The accuracy of the DL model was calculated as the ratio of the correctly classified cases to the total number of cases.

3. Results

3.1. General Results

One hundred and five patients, accounting for 188 lateral and 188 frontal weight-bearing foot radiographs, were included based on the study’s criteria. The mean age of the 29 men and 76 women was 55 years (SD = 17 years, range = 18–86 years). Eighty-four patients underwent a static foot assessment based on their medical records. Others were referred to for pain, postoperative follow-up, or for an unspecified reason. Twelve patients underwent surgery. One hundred and eight radiographs showed an M1-P1 angle > 15°, defining the hallux valgus, of which 63 showed a moderate angle (20–40°), and 12 showed severe hallux valgus deformation, defined as an angle > 40°. Two frontal views and one lateral view were not analyzed by the DL solution, resulting in a comparison between DL and GT for 186 frontal and 187 lateral views. (Figure 2).

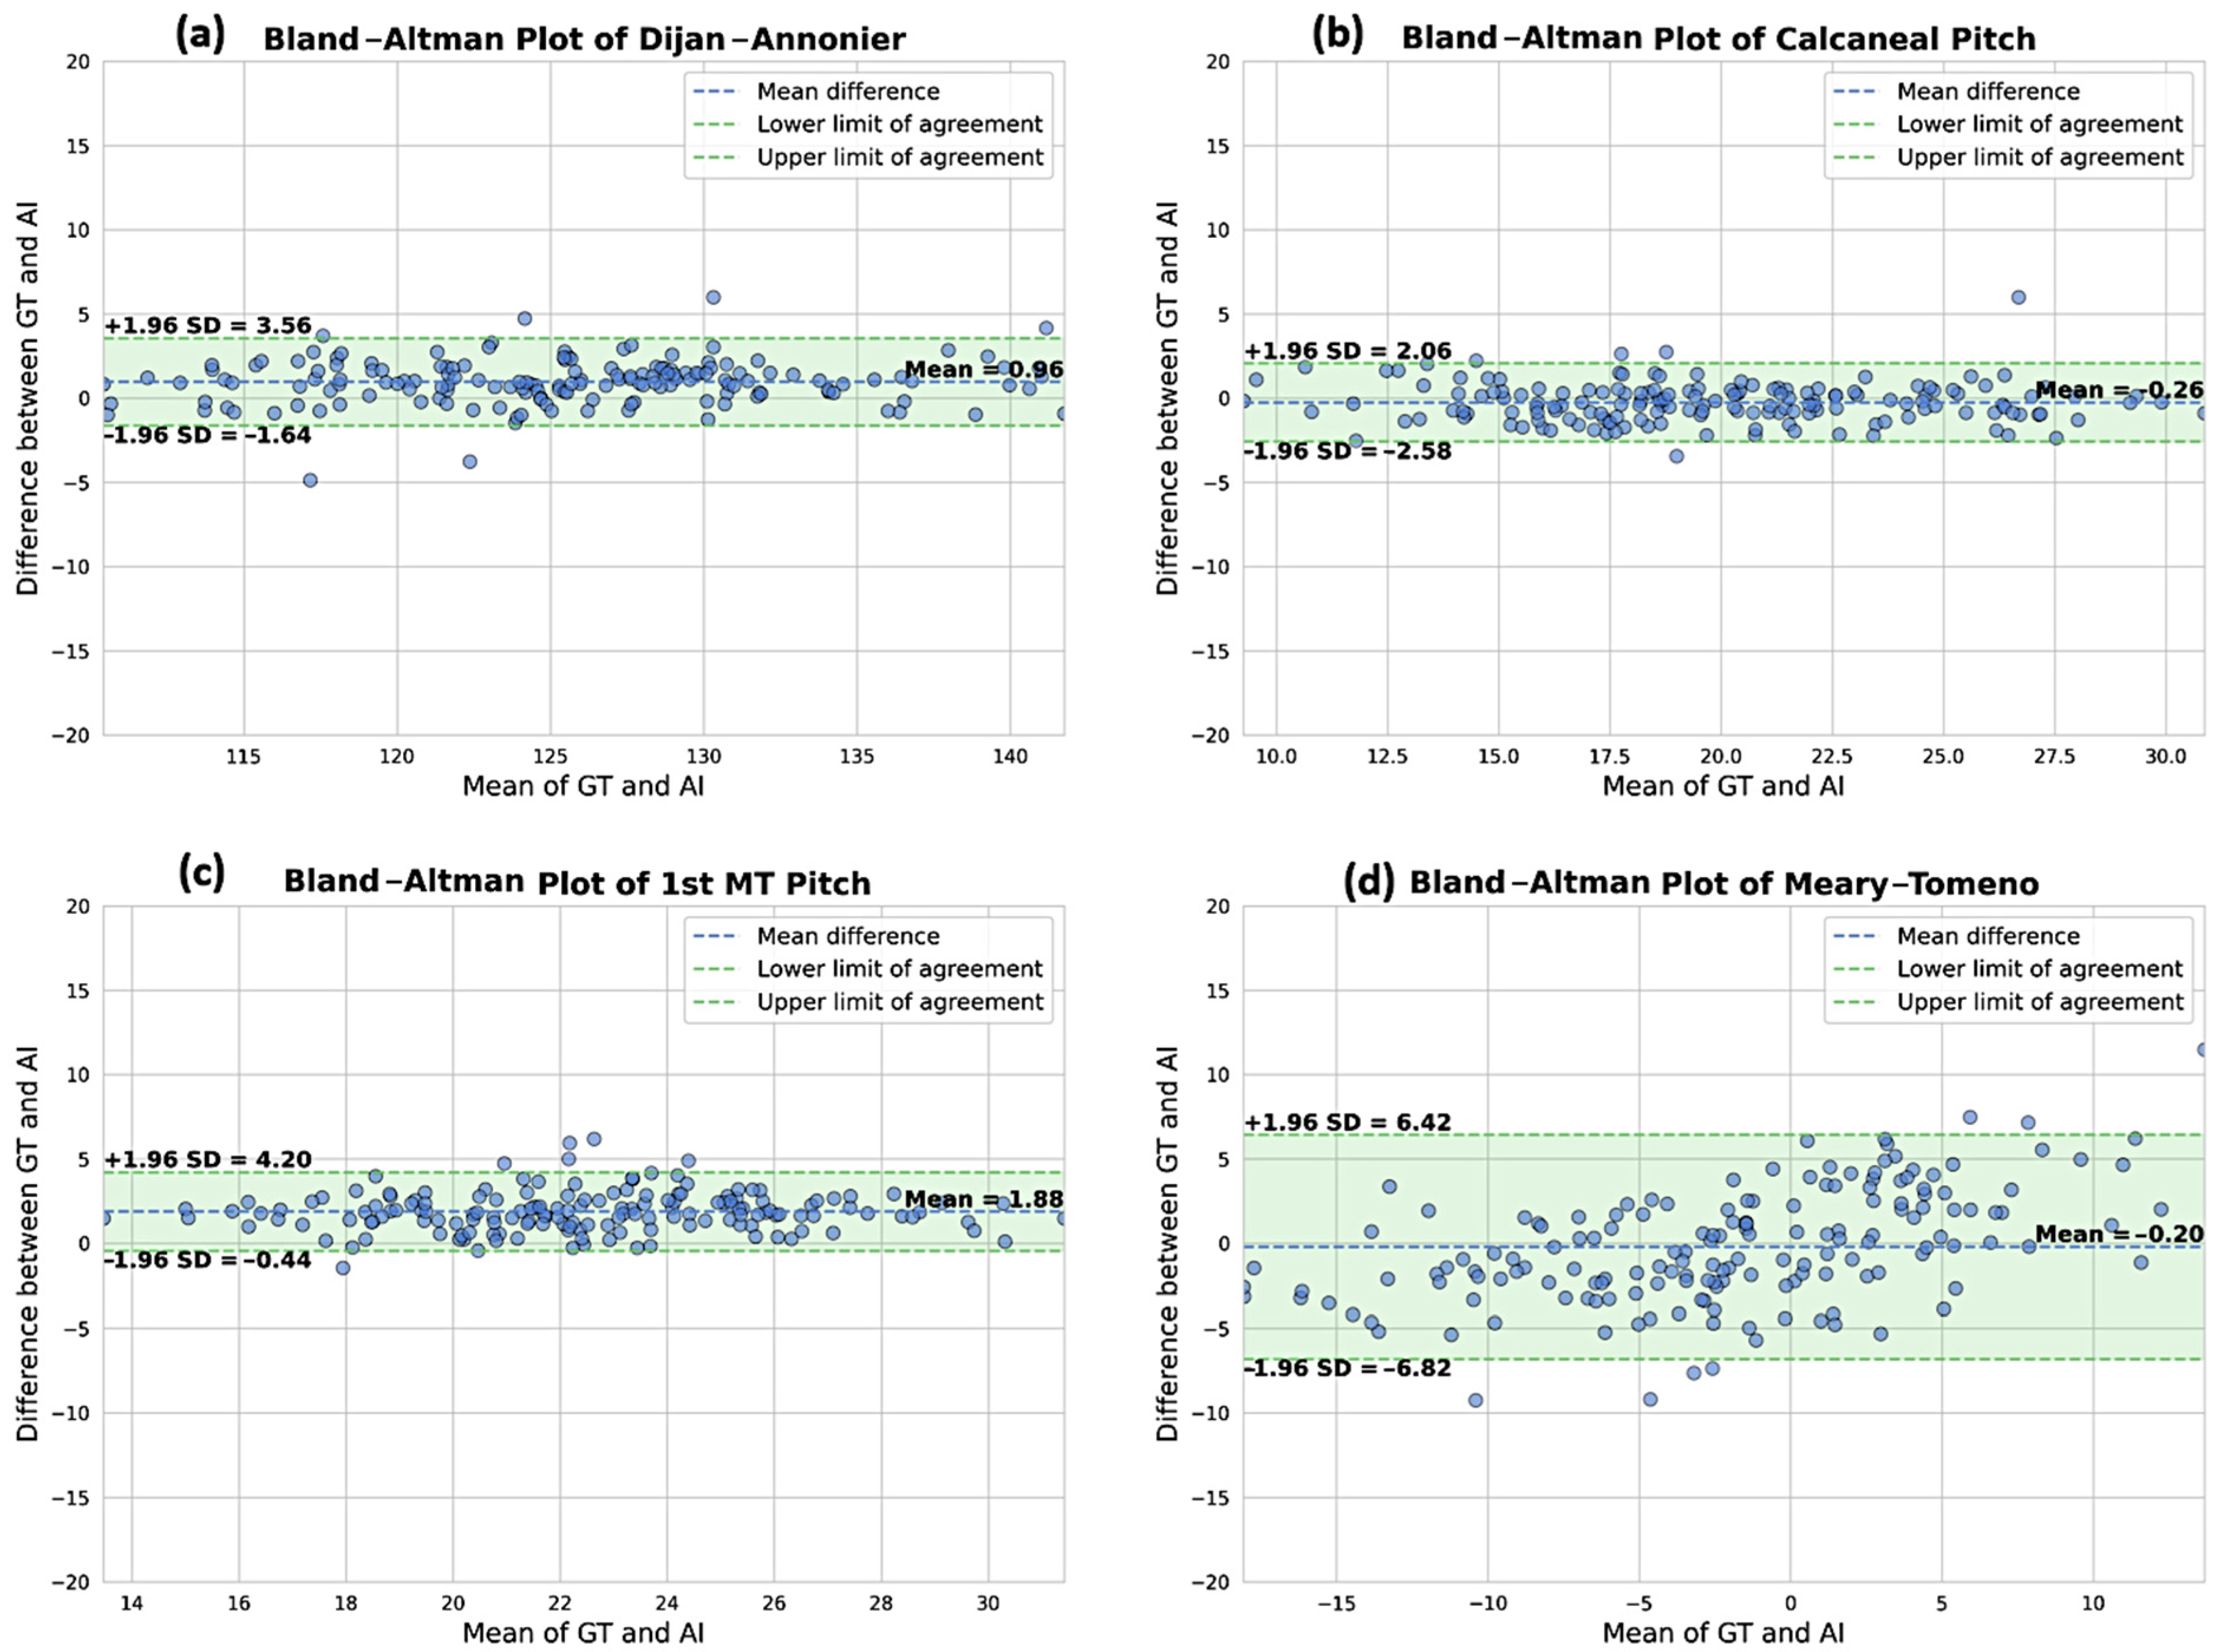
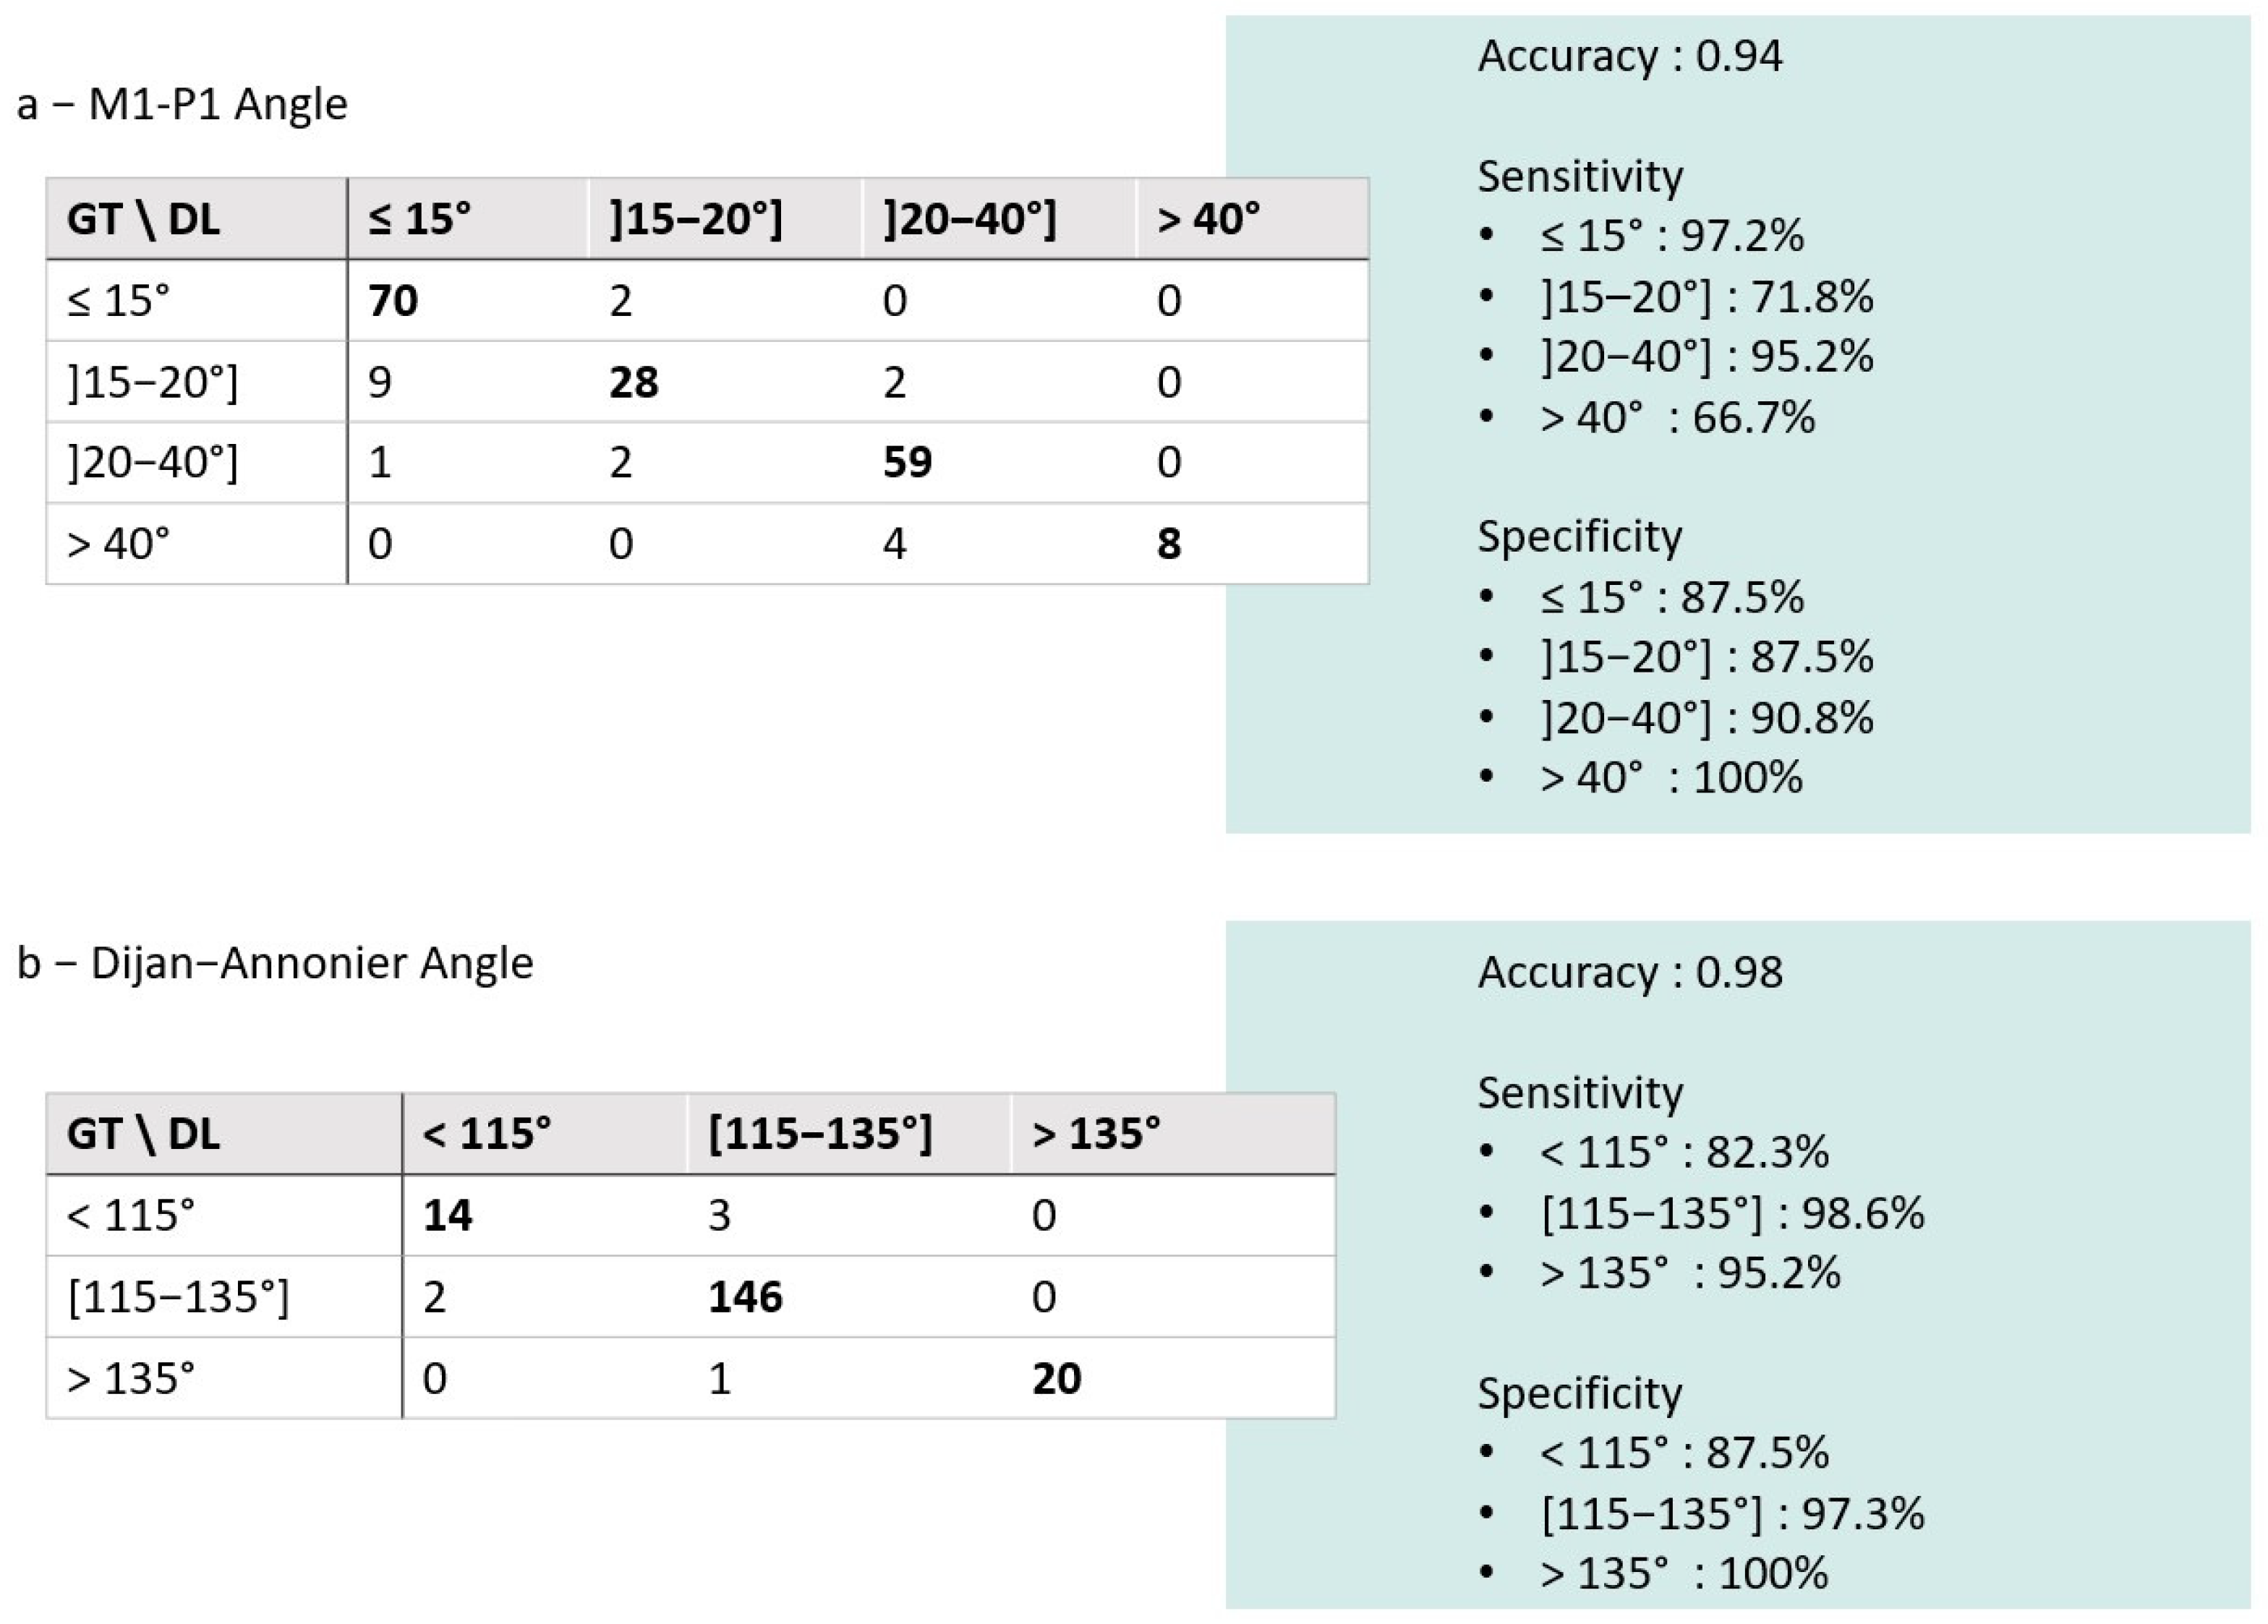
3.2. Comparison of the DL Solution to the Ground Truth

For the 186 frontal views, all four parameters were compared to the ground truth. The MAEs between the DL and GT values were minimal for the M1-M2 angle (0.96°) and maximal for the P1-P2 angle (3.16°). The ICC values demonstrated excellent consistency between DL and GT for M1-P1, M1-M2, and M1-M5 (Table 1).
For P1-P2, the ICC was fair (0.51). Bland–Altman plots showed mean biases of −0.44°, −0.01°, 1.59°, and 1.96° for M1-P1, M1-M2, M1-M5, and P1-P2, respectively. No proportional bias was observed (Figure 3).
For the lateral parameters, the MAEs between the DL and GT values were minimal for the calcaneal slope (0.92°) and highest for the Meary–Tomeno angle (2.83°). The ICC values demonstrated excellent consistency between DL and GT for all parameters with ICCs ≥ 0.93 (Table 1).
Bland–Altman plots showed mean biases of 0.88°, −0.25°, 1.86°, and −0.07° for the Djian–Annonier angle, calcaneal slope, first MT slope, and Meary–Tomeno angle, respectively. No proportional bias was observed (Figure 4).
The subgroup analysis for age and surgical material demonstrated decreased DL performance for the M1-P1 and P1-P2 angles of patients aged ≥ 65 years and for the P1-P2 angles of patients with surgical material. All other measurements were unchanged across age and surgical material subgroups (Figure 5).
Using a threshold of 15° for the M1-P1 angle to define the hallux valgus [16] and a grading scheme with 20° and 40° as thresholds for mild, moderate, and severe hallux valgus, the confusion matrix (Figure 6) was obtained. The DL model achieved an accuracy of 0.94, and its sensitivity and specificity for hallux valgus detection were 91.1% and 97.2%, respectively. An analysis of severe hallux valgus (>40°) showed a sensitivity and specificity of 66.7% and 100%, respectively.
Thresholds of 115° and 135° for the Djian–Annonier angle were used to define arched feet and flat feet, respectively [17]. Based on these thresholds, the DL model achieved an accuracy of 0.98. Its sensitivity and specificity for detecting arched feet were 82.3% and 87.5%, respectively, and 95.2% and 100% for detecting flat feet (Figure 6).

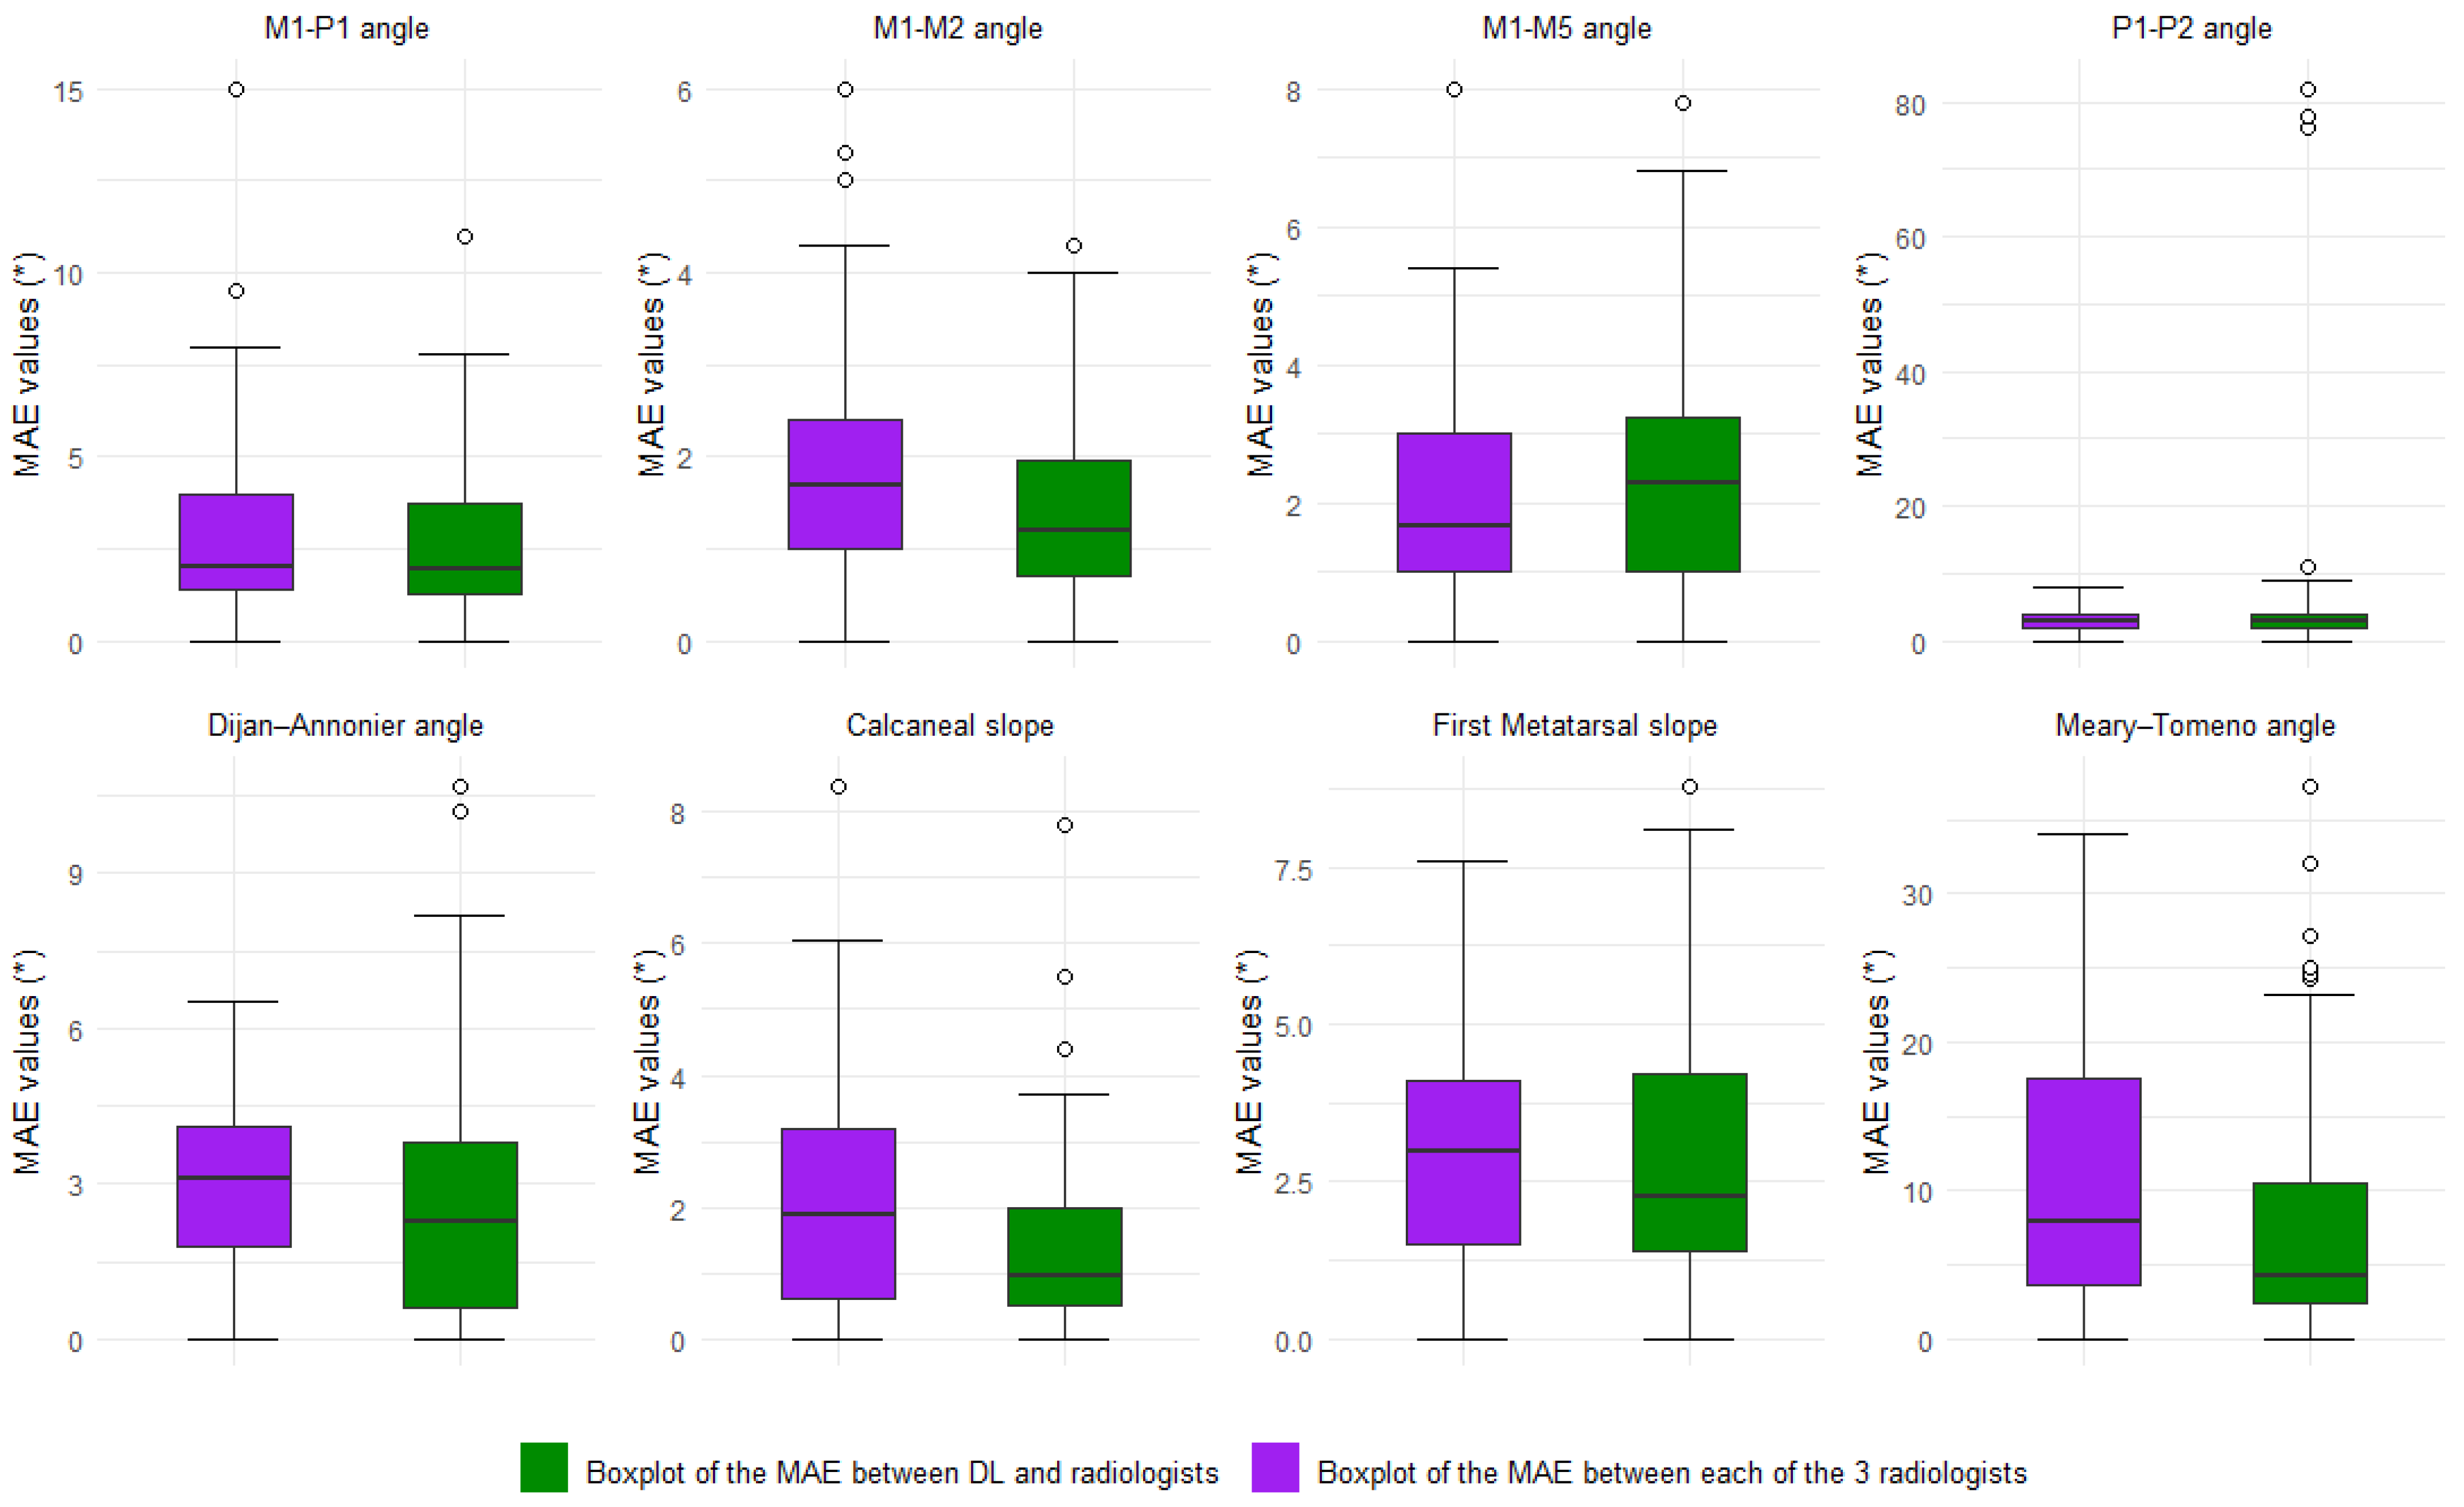
3.3. Inter-Reader Variability and Comparison to the DL Model

In a subset of 40-foot views, the ICCs between the radiologist (MT) and the GT were excellent for each angle, ranging from 0.87 for the P1-P2 angle to 0.98 for the Djian–Annonier angle (Table 2). Inter-reader variability was minimal for the M1-M5 angle (median MAE among radiologists = 1.53°) and highest for the Meary–Tomeno angle (8.66°).
For all angles except M1-M5, the inter-reader variability was slightly higher than the MAE between the DL solution and the radiologists (Figure 7). However, the DL solution had more outliers for the P1-P2 angle, the Djian–Annonier angle, the first metatarsal slope, and the Meary–Tomeno angle.
In the 40-foot views subset, the DL solution was closer to the ground truth than the radiologist (MT) for all foot angles except for the M1-M5 angle, the P1-P2 angle, and the first metatarsal slope (Figure 8).

3.4. The Assessment of Time to Measurements

Based on the last 20 cases measured, a retrospective assessment showed that manual radiological measurements took an average of 203 ± 15 s per patient, including all measurements, compared to an almost instantaneous inference time for the DL model, which is the time taken to receive the results computed by the server.

4. Discussion

The diagnosis and follow-up of non-traumatic pathologies of the foot, as well as the decision-making and control of treatments, whether surgical or not, are largely based on conventional radiographs that allow for the assessment of foot alignment from the lateral and dorsoplantar (frontal) views. This retrospective study evaluated a deep learning solution (TechCare Bones—Milvue Suite v2.0) for the automated measurement of radiographic foot alignment parameters for an external dataset. One strength of this study was that the inclusion criteria for radiographs allowed for the inclusion of images with surgical material, bone fracture history, off-centering, and minor to moderate motion artifacts, thereby creating a sample representative of routine clinical scenarios. These inclusion criteria enhance the external validity of the findings, increasing their generalizability to real-world settings.
Our study is consistent with previous work demonstrating the ability of DL models to accurately and reliably measure foot alignment from radiographs [9,11,18]. We demonstrated a high degree of agreement between the DL measurements and ground truth across all foot alignment parameters for both the frontal and lateral views. Except for the P1-P2 angle, which showed fair agreement, all other parameters demonstrated excellent consistency, especially for the M1-P1 and Djian–Annonier angles. These two angles are most commonly used to assess foot alignment. For the forefoot, M1-P1 enables the detection of hallux valgus, which affects more than 20% of adults worldwide [2]. Hindfoot disorders are dominated by flat and hollow feet, which are well characterized by the Djian–Annonier angle [19,20].
Several studies have shown that inter-observer reproducibility is good; however, when used for manual radiographic measurement statics, it generates errors of 4–20°, depending on the angle considered. In particular, for the measurement of M1-P1 and M1-M2, correlation coefficients >0.85 were reported, with absolute angle deviations ranging from 3° to 6°. However, intra-individual variability is not as good, with larger absolute angle deviations [21,22,23,24].
In clinical practice, reporting a weight-bearing foot series remains cumbersome and time-consuming to perform with current software, and even more so for non-expert radiologists. Our study demonstrated the promising potential of DL in substantially reducing the time needed for measurements. The DL model provided results almost instantaneously compared to an average of 203 s for manual radiological measurements. This significant time reduction aligns with previous findings and underscores the potential for AI to streamline workflows in radiology departments, saving valuable clinician time without compromising measurement accuracy. Furthermore, we can envision the automatic integration of angle measurements into reports, enabling the broader screening of this underdiagnosed condition. However, its actual implementation in clinical workflow—including system setup, user interaction, and report integration—was not evaluated in this study and should be addressed in future prospective work.
Another strength of this study was the analysis of the performance for classifying patients based on clinically relevant thresholds for the M1-P1 and Djian–Annonier angles. The sensitivity and specificity of the DL model for detecting hallux valgus and grading its severity suggests that AI could play a critical role in the accurate and timely diagnosis of such foot deformities. It is important to highlight the model’s 100% specificity in detecting severe hallux valgus. Hida et al. found an accuracy rate of 0.79 compared to 0.94 in our study for detecting hallux valgus [8]. Given that surgical decisions for hallux valgus are primarily based on severe deformities and that our model showed 100% specificity for detecting such cases, small misclassifications near the 15° threshold are unlikely to impact clinical management.
While the model showed good performance for the majority of the angles assessed, the P1-P2 and Meary–Tomeno angles displayed larger errors. For the P1-P2 angle, the performance was lower, with an ICC rated as fair. However, this angle is considered a secondary criterion in the evaluation of hallux valgus, with less influence on diagnosis and treatment decisions than the M1-P1 angle. Its limited clinical weight reduces the impact of this lower performance. For the Meary–Tomeno angle, although the mean absolute error (MAE) was higher than the other measurements, the ICC remained excellent (≥0.93), indicating a systematic bias rather than random variability. In practice, such high reproducibility is often more important than a small absolute error, particularly for consistent follow-up over time.
Although the DL performance is generally high, it is important to acknowledge some limitations. First, the DL model was tested at a single institution, which might limit the generalizability of the findings; therefore, further validation on multi-center datasets is warranted to confirm the robustness and applicability of the model across diverse clinical settings. Although this study included a wide range of parameters, testing the model across multiple institutions and more diverse patient populations would be valuable for assessing its adaptability. Second, although surgical material, the history of bone fracture, and off-centering were not excluded, these conditions might impact the performance of the DL model, and a comprehensive evaluation of these effects is recommended in future studies. This likely explains, at least in part, the presence of outliers observed in Figure 3 and Figure 4.
The presence of surgical equipment appears to have affected the DL model’s performance for P1-P2 measurements, which is a limitation to be aware of in radiological practice. This AI-derived angle should be interpreted with caution by clinicians, especially in borderline cases. This suggests that additional training with more cases involving surgical implants or elderly patients—who often present with anatomical changes or degenerative features—may be necessary to improve the model’s robustness in these situations.
In addition to these points, several practical and methodological challenges were encountered during this study. First, although the model was trained on a wide variety of radiographs, certain atypical cases (e.g., poor image quality) led to inconsistent predictions or failed angle recognition, particularly for the P1-P2 angle. Second, some difficulties arose when validating the model’s output due to a lack of absolute reference for certain measurements and the known high variability of manual assessments [25]. Moreover, only a subset of 40 cases was reviewed by the third radiologist, which limits the assessment of inter-observer variability. Finally, the retrospective design and limited number of expert raters may restrict the generalizability of our findings to other institutions or clinical contexts. These limitations highlight the need for prospective, multi-center studies and for further development to improve robustness and usability across varied radiological environments.

5. Conclusions

In conclusion, our study demonstrates that the DL-based solution (TechCare Bones, Milvue Suite 2.0) has the potential to provide accurate and reliable measurements for several parameters commonly used to assess foot alignment from radiographs in a fraction of the time needed for manual measurements. This adds to the growing body of evidence supporting the integration of deep learning into medical imaging, specifically in the realm of automatic static measurements.

Author Contributions

Conceptualization, A.G.; Formal analysis, A.P. and M.A.C.; Investigation, J.T. and M.H.; Methodology, A.G.; Project administration, A.G.; Resources, A.P.; Software, A.P. and M.H.; Supervision, M.H.; Validation, M.T.; Writing—original draft, J.T.; Writing—review and editing, F.d.O. All authors have read and agreed to the published version of the manuscript.

Funding

This research received no external funding.

Institutional Review Board Statement

The study was approved by the Institutional Review Board (IRB) (CRM-2210-302).

Informed Consent Statement

Written informed consent requirement was waived by the IRB.

Data Availability Statement

The original contributions presented in this study are included in the article. Further inquiries can be directed to the corresponding author.

Conflicts of Interest

Alexandre Parpaleix and Malo Huard are shareholders of Milvue. The other authors have no competing interests to disclose in relation to this article.

Abbreviations

The following abbreviations are used in this manuscript:
AIArtificial Intelligence
DLDeep Learning
CNNConvolutional Neural Network
ROIRegion of Interest
GTGround Truth
IRBInstitutional Review Board
CLAIMChecklist for Artificial Intelligence in Medical Imaging
PACSPicture Archiving and Communication System
DICOMDigital Imaging and Communications in Medicine
MAEMean Absolute Error
CIConfidence Interval
NMAENormalized Mean Absolute Error
ICCIntraclass Correlation Coefficient
TPTrue Positive
TNTrue Negative
FPFalse Positive
FNFalse Negative
SnSensitivity (TP/(TP + FN))
SpSpecificity (TN/(TN + FP))
SDStandard Deviation
HVAHallux Valgus Angle
IMAIntermetatarsal Angle
M1-P1, M1-M2, etc.Abbreviations for Metatarsal and Phalangeal Angles (e.g., 1st Metatarsal–1st Phalanx)

References

  1. Menz, H.B.; Morris, M.E.; Lord, S.R. Foot and Ankle Characteristics Associated with Impaired Balance and Functional Ability in Older People. J. Gerontol. A Biol. Sci. Med. Sci. 2005, 60, 1546–1552. [Google Scholar] [CrossRef] [PubMed]
  2. Nix, S.; Smith, M.; Vicenzino, B. Prevalence of Hallux Valgus in the General Population: A Systematic Review and Meta-Analysis. J. Foot Ankle Res. 2010, 3, 21. [Google Scholar] [CrossRef] [PubMed]
  3. Condon, F.; Kaliszer, M.; Conhyea, D.; O’ Donnell, T.; Shaju, A.; Masterson, E. The First Intermetatarsal Angle in Hallux Valgus: An Analysis of Measurement Reliability and the Error Involved. Foot Ankle Int. 2002, 23, 717–721. [Google Scholar] [CrossRef] [PubMed]
  4. Hosny, A.; Parmar, C.; Quackenbush, J.; Schwartz, L.H.; Aerts, H.J.W.L. Artificial Intelligence in Radiology. Nat. Rev. Cancer 2018, 18, 500–510. [Google Scholar] [CrossRef]
  5. Kermany, D.S.; Goldbaum, M.; Cai, W.; Valentim, C.C.S.; Liang, H.; Baxter, S.L.; McKeown, A.; Yang, G.; Wu, X.; Yan, F.; et al. Identifying Medical Diagnoses and Treatable Diseases by Image-Based Deep Learning. Cell 2018, 172, 1122–1131.e9. [Google Scholar] [CrossRef]
  6. Hussain, A.; Lee, C.; Hu, E.; Amirouche, F. Deep Learning Automation of Radiographic Patterns for Hallux Valgus Diagnosis. World J. Orthop. 2024, 15, 105–109. [Google Scholar] [CrossRef]
  7. Noh, W.-J.; Lee, M.S.; Lee, B.-D. Deep Learning-Based Automated Angle Measurement for Flatfoot Diagnosis in Weight-Bearing Lateral Radiographs. Sci. Rep. 2024, 14, 18411. [Google Scholar] [CrossRef]
  8. Hida, M.; Eto, S.; Wada, C.; Kitagawa, K.; Imaoka, M.; Nakamura, M.; Imai, R.; Kubo, T.; Inoue, T.; Sakai, K.; et al. Development of Hallux Valgus Classification Using Digital Foot Images with Machine Learning. Life 2023, 13, 1146. [Google Scholar] [CrossRef]
  9. Kwolek, K.; Liszka, H.; Kwolek, B.; Gądek, A. Measuring the Angle of Hallux Valgus Using Segmentation of Bones on X-Ray Images. In Proceedings of the Artificial Neural Networks and Machine Learning—ICANN 2019: Workshop and Special Sessions, Munich, Germany, 17–19 September 2019; Tetko, I.V., Kůrková, V., Karpov, P., Theis, F., Eds.; Springer International Publishing: Cham, Switzerland, 2019; pp. 313–325. [Google Scholar]
  10. Takeda, R.; Mizuhara, H.; Uchio, A.; Iidaka, T.; Makabe, K.; Kasai, T.; Omata, Y.; Yoshimura, N.; Tanaka, S.; Matsumoto, T. Automatic Estimation of Hallux Valgus Angle Using Deep Neural Network with Axis-Based Annotation. Skelet. Radiol. 2024, 53, 2357–2366. [Google Scholar] [CrossRef]
  11. Kim, Y.-C.; Choi, Y.-H. AI-Based Foot X-Ray Reading in Real-World: Evaluating the Accuracy of Assistive Decisions for Diagnosing Foot & Ankle Disorders. Foot Ankle Orthop. 2023, 8, 2473011423S00022. [Google Scholar] [CrossRef]
  12. de Carvalho, K.A.M.; Walt, J.S.; Ehret, A.; Tazegul, T.E.; Dibbern, K.; Mansur, N.S.B.; Lalevée, M.; de Cesar Netto, C. Comparison between Weightbearing-CT Semiautomatic and Manual Measurements in Hallux Valgus. Foot Ankle Surg. 2022, 28, 518–525. [Google Scholar] [CrossRef] [PubMed]
  13. Mongan, J.; Moy, L.; Kahn, C.E. Checklist for Artificial Intelligence in Medical Imaging (CLAIM): A Guide for Authors and Reviewers. Radiol. Artif. Intell. 2020, 2, e200029. [Google Scholar] [CrossRef] [PubMed]
  14. Zerouali, M.; Parpaleix, A.; Benbakoura, M.; Rigault, C.; Champsaur, P.; Guenoun, D. Automatic Deep Learning-Based Assessment of Spinopelvic Coronal and Sagittal Alignment. Diagn. Interv. Imaging 2023, 104, 343–350. [Google Scholar] [CrossRef]
  15. Cicchetti, D.V. Guidelines, Criteria, and Rules of Thumb for Evaluating Normed and Standardized Assessment Instruments in Psychology. Psychol. Assess. 1994, 6, 284–290. [Google Scholar] [CrossRef]
  16. Iliou, K.; Paraskevas, G.; Kanavaros, P.; Barbouti, A.; Vrettakos, A.; Gekas, C.; Kitsoulis, P. Correlation between Manchester Grading Scale and American Orthopaedic Foot and Ankle Society Score in Patients with Hallux Valgus. Med. Princ. Pract. 2016, 25, 21–24. [Google Scholar] [CrossRef]
  17. Vanderwilde, R.; Staheli, L.T.; Chew, D.E.; Malagon, V. Measurements on Radiographs of the Foot in Normal Infants and Children. J. Bone Joint Surg. Am. 1988, 70, 407–415. [Google Scholar] [CrossRef]
  18. Patton, D.; Ghosh, A.; Farkas, A.; Sotardi, S.; Francavilla, M.; Venkatakrishna, S.; Bose, S.; Ouyang, M.; Huang, H.; Davidson, R.; et al. Automating Angle Measurements on Foot Radiographs in Young Children: Feasibility and Performance of a Convolutional Neural Network Model. J. Digit. Imaging 2023, 36, 1419–1430. [Google Scholar] [CrossRef]
  19. Zirngibl, B.; Grifka, J.; Baier, C.; Götz, J. Hallux valgus: Etiology, diagnosis, and therapeutic principles. Orthopade 2017, 46, 283–296. [Google Scholar] [CrossRef]
  20. Wybier, M.; Mathieu, P.; Morvan, G.; Vuillemin-Bodaghi, V.; Guerini, H. Radiologie Osseuse: Cheville et Pied de l’adulte. J. Radiol. 2008, 89, 711–735. [Google Scholar] [CrossRef]
  21. Saro, C.; Johnson, D.N.; Martinez De Aragón, J.; Lindgren, U.; Felländer-Tsai, L. Reliability of Radiological and Cosmetic Measurements in Hallux Valgus. Acta Radiol. 2005, 46, 843–851. [Google Scholar] [CrossRef]
  22. Saltzman, C.L.; Brandser, E.A.; Berbaum, K.S.; DeGnore, L.; Holmes, J.R.; Katcherian, D.A.; Teasdall, R.D.; Alexander, I.J. Reliability of Standard Foot Radiographic Measurements. Foot Ankle Int. 1994, 15, 661–665. [Google Scholar] [CrossRef] [PubMed]
  23. Coughlin, M.J.; Freund, E.; Roger, A. Mann Award. The Reliability of Angular Measurements in Hallux Valgus Deformities. Foot Ankle Int. 2001, 22, 369–379. [Google Scholar] [CrossRef] [PubMed]
  24. Gibboney, M.D.; LaPorta, G.A.; Dreyer, M.A. Interobserver Analysis of Standard Foot and Ankle Radiographic Angles. J. Foot Ankle Surg. 2019, 58, 1085–1090. [Google Scholar] [CrossRef] [PubMed]
  25. Srivastava, S.; Chockalingam, N.; El Fakhri, T. Radiographic Angles in Hallux Valgus: Comparison between Manual and Computer-Assisted Measurements. J. Foot Ankle Surg. 2010, 49, 523–528. [Google Scholar] [CrossRef]
Figure 1. Example of a radiograph analyzed by the deep learning model with all annotated angles. (A): Frontal view. (B): Lateral view. The software output includes a prompt to scan the QR code for more information about the product and to explore related scientific publications, directing to the following URL: https://product.milvue.com/fr/?content=cD1jZSZ2PXYyLjQuMA%3D%3D (accessed on 5 June 2025).
Ai 06 00144 g001aAi 06 00144 g001b
Figure 2. Overview of radiograph selection and analysis.
Ai 06 00144 g002
Figure 3. Bland–Altman plots assessing the agreement between the AI model’s predictions and the ground truth for the frontal view angle parameters. (a) M1-P1 angle; (b) P1-P2 angle; (c) M1-M2 angle; and (d) M1-M5 angle. The Y-axis indicates the difference between the DL result and the GT. The X-axis represents the average of the DL and GT results. The green dotted lines are the 95% limits of agreement. Note: Each dot corresponds to a single measurement.
Ai 06 00144 g003
Figure 4. Bland–Altman plots assessing the agreement between the AI model’s predictions and the ground truth for the lateral view angle parameters. (a) Djian–Annonier angle; (b) Calcaneal slope; (c) First Metatarsal slope; and (d) Meary–Tomeno angle. The Y-axis indicates the difference between the DL result and the GT. The X-axis represents the average of the DL and GT results. The green dotted lines are the 95% limits of agreement. Note: Each dot corresponds to a single measurement.
Ai 06 00144 g004
Figure 5. AI performance for each angle, in absence or presence of surgical material.
Ai 06 00144 g005
Figure 6. The confusion matrices and accuracy of the DL solution for (a) the M1-P1 angle and (b) the Djian–Annonier angle at given thresholds. For M1-P1, an angle of >15° indicates hallux valgus. We considered a grading scheme for the hallux valgus as follows: mild [15–20°], moderate [20–40°], and severe >40°. For Djian–Annonier, an angle <115° indicates an arched foot, and >135° indicates a flat foot. Note: Data are the number of cases per category. DL = deep learning solution; GT = ground truth.
Ai 06 00144 g006
Figure 7. Boxplots of the MAE values between radiologists and DL measurements for each angle. Within each box, horizontal black lines denote median values; boxes extend from the 25th to the 75th percentile of each group’s distribution of values; vertical extending lines denote adjacent values (i.e., the most extreme values within the 1.5 interquartile range of the 25th and 75th percentile of each group). Dots denote observations outside the range of adjacent values.
Ai 06 00144 g007
Figure 8. The MAE values for the radiologist and DL measurements compared to the GT for each angle. Note: MAE = mean absolute error; DL = deep learning solution; GT = ground truth; RAD = radiologist. Error bars are standard deviations.
Ai 06 00144 g008
Table 1. Agreement between AI and ground truth measurements.
ParametersN. of CasesDL|GT
ICC (95%CI)
DL|GT
MAE (°) (95%CI)
DL|GT
NMAE
DL|GT
Bias (°) (95%CI)
Frontal parametersM1-P11860.91 (0.87; 0.93)2.27 (1.56–3.55)19.7%−0.44 (−1.25–0.91)
M1-M21860.96 (0.94; 0.97)0.96 (0.82–1.12)40.5%−0.01 (−0.21–0.20)
M1-M51860.94 (0.80; 0.97)2.15 (1.92–2.41)67.7%1.59 (1.26–1.92)
P1-P21860.51 (0.33; 0.63)3.16 (2.03–4.84)127.7%1.96 (0.76–3.65)
Lateral parametersDjian–Annonier1870.99 (0.97; 0.99)1.38 (1.21–1.58)21.1%0.88 (0.61–1.10)
Calcaneal slope1870.99 (0.98; 0.99)0.92 (0.81–1.04)20.0%−0.25 (−0.42–−0.06)
1st MT slope1870.93 (0.06; 0.98)1.90 (1.73–2.07)68.3%1.86 (1.68–2.04)
Meary–Tomeno1870.94 (0.92; 0.96)2.83 (2.49–3.16)61.4%−0.07 (−0.61–0.53)
Note: ICC = intraclass correlation coefficient; MAE = mean absolute error; NMAE = normalized mean absolute error; MT = metatarsal; DL = deep learning solution; GT = ground truth.
Table 2. Variability of measurements for 40-foot views between all radiologists, between DL and GT, and between the radiologist and GT.
ParametersICC(2,3) All Rads
(95%CI)
ICC(2,2) DL|GT
(95%CI)
ICC(2,2) Rad|GT
(95%CI)
Frontal
parameters
M1-P10.98 (0.96; 0.99)0.91 (0.87; 0.93)0.97 (0.93; 0.99)
M1-M20.92 (0.82; 0.97)0.96 (0.94; 0.97)0.89 (0.71; 0.96)
M1-M50.95 (0.89; 0.98)0.94 (0.80; 0.97)0.93 (0.82; 0.98)
P1-P20.91 (0.81; 0.96)0.51 (0.33; 0.63)0.87 (0.66; 0.95)
Lateral
parameters
Djian–Annonier0.99 (0.95; 0.99)0.99 (0.97; 0.99)0.98 (0.94; 0.99)
Calcaneal Slope0.97 (0.94; 0.99)0.99 (0.98; 0.99)0.96 (0.88; 0.98)
1st MT Slope0.89 (0.52; 0.96)0.93 (0.06; 0.98)0.93 (0.81; 0.97)
Meary–Tomeno0.82 (0.61; 0.93)0.94 (0.92; 0.96)0.89 (0.66; 0.96)
Note: ICC = intraclass correlation coefficient; MT = metatarsal; DL = deep learning solution; GT = ground truth; Rad = radiologist.
Disclaimer/Publisher’s Note: The statements, opinions and data contained in all publications are solely those of the individual author(s) and contributor(s) and not of MDPI and/or the editor(s). MDPI and/or the editor(s) disclaim responsibility for any injury to people or property resulting from any ideas, methods, instructions or products referred to in the content.

