1. Introduction
Competition within the banking sector forces institutions to focus on retaining customers while recognising retention as their primary business goal [
1]. Maintaining existing customers proves more profitable for organisations since new acquisition expenses exceed the first-time earnings from newly obtained customers [
2]. Customer attrition leads to immediate financial damage and long-term financial losses as it reduces existing promotional possibilities and untapped service opportunities. Constant customer defections generate negative impacts on brand reputation, thus preventing banks from establishing lasting customer relationships [
3]. The strategies for loyal customer management in banking consist of personalised service and loyalty perks, competitive loan rates, and enhanced engagement methods [
4].
Some financial organisations enable prudent banking customers to access discounts through rebate packages and flexible loan terms. Better customer relationships happen when financial institutions send early alarms and targeted services that strengthen their connection to create happier clients. Qualitative measures used in customer assessment fail to identify customers who are set to depart properly. Predicting customer departures requires a higher accuracy rate than what current service quality and engagement metrics can provide [
5]. The prediction methods based on rule-based models and customer surveys utilise static data and pre-established assumptions, which fail to change according to changing customer behaviours. Using the dynamic function of ML and AI models, banks can effectively identify the buried churn tendencies so that there is generation of automated decision processes and improvement in the accuracy of forecasting to be used for proactive client retention strategies [
6].
Machine learning (ML) algorithms have enhanced predictive statistical models in several industries [
7,
8]. Implementing AI and ML solutions that use artificial intelligence solves model limitations at financial institutions to boost the accuracy of their customer churn predictions. Financial institutions can identify minor behavioural indicators that suggest customer churn using ML techniques that analyse extensive customer datasets [
9]. Financial organisations can keep their customer bases intact using ML models linking population data to transaction evaluations. Using present dataset elements rather than past data banks, they identify their departing customers by noticing which consumers will leave. DT, RF, and GBM prediction models are three ensemble modelling systems that banks use. Ensemble methods have shown high accuracy in various domains by successfully enhancing medical imaging diagnostics in the healthcare area [
10]. Predictive models have a valuable purpose due to the necessity of expert interpretation for outcome analysis [
9]. Churn prediction requires additional explanations to illustrate its connections between financial indicators and account balance information. This investigation evaluates the superiority of account balance metrics for forecasting customer departures compared to traditional approaches based on demographics and engagement activities [
11].
1.1. Research Gap
Customer churn prediction systems in current research struggle to track the fundamental financial patterns that cause customer churn due to their restricted accuracy potential. Standard predictive modelling techniques avoid implementing dynamic changes in behavioural patterns affecting predictive analytics in various industries [
12]. The account balance is a significant economic indicator since it shows customer interaction with the bank institution. Balance demonstrates the highest importance in all qualitative customer engagement research. Estimation of client financial management requires considering balance information due to its ease of assessment. Account balance analysis conducted independently in traditional churn research fails to produce satisfactory results due to researchers’ inability to assess future predictive abilities. This study investigates account balance independently to determine its effectiveness in churn prediction analysis. Account balance provided the central measurement as it instantly displays customer finances, which results in high-quality churn prediction data [
13]. The customer balance provides an instant sign of engagement given that financial difficulties and reduced service usage lead to changes in this balance. Consistent banking customers demonstrate strong loyalty, but banks must focus specifically on retaining their inconsistent banking customer base. Banks prevent customers from changing accounts through customised solutions, instant support, and special incentives, so they maintain a secure customer relationship.
Account balance distinguishes itself from satisfaction scores by providing stable and numeric information, which helps predict customer risks [
14]. Account balance outperforms previous research factors that relied on demographic or service engagement indicators, given its ability to provide a real-time assessment of financial stability. Many customer engagement and product ownership studies and credit score analyses fail to provide accurate data about customer financial behaviours [
15]. Researchers utilise account balance since it provides a quantifiable and objective means to assess customer retention risk through financial stability evaluation. It is possible to find a link between customer loss and changes in their bank account balances using DT, RF, and GBM models. Financial results and customer retention success in banks heavily rely on open-systems data processing to develop effective retention strategies.
This study aims to evaluate the predictive power of account balance in determining customer attrition and its comparative significance against other factors, such as demographics and engagement. The investigation involves analysing the relationship between fluctuation in account balances and customer dropout rates. At the same time, we use DT, RF, and GBM models for accurate predictions. This research identifies proactive retention approaches that financial organisations can use to benefit from the information.
1.2. Novelty and Contribution
This study addresses a gap in customer churn prediction by introducing a statistical framework that positions account balance as a primary churn indicator. Unlike previous research that relies on complex deep learning algorithms or qualitatively evaluated engagement metrics, this approach offers a more interpretable and data-driven alternative [
16,
17,
18]. This research mainstreamed simple, purely quantitative statistical tools such as correlation analysis, one-way, two-way, and three-way ANOVA, independent sample
t-tests, and bootstrapping to analyse the account balance about other demographic and behavioural variables. The study made significant contributions in the following areas:
This study shows that account balance is a statistically significant predictor of churn and offers banking institutions actionable, simple, and effective ways to improve their customer retention strategies.
The results imply that proactive retention strategies for low-balance customers can significantly address churn, providing banks with an inexpensive approach to managing customer churn.
This research aims to fill the gap in the literature by employing a solely quantitative analysis. This analysis quantitatively replicates the foundational qualitative measures and simplifies the models into tangible figures for practical use by decision-makers.
Specifically, this research demonstrates that account balance can be an additional variable in predicting churn. Future research should focus on other measures of customer financial and behavioural details, which could refine churn models by incorporating additional variables related to retailer customer attrition.
The rest of this paper is organised as follows:
Section 2 presents previous work on challenging the churn prediction of the target subscriber segment. In
Section 3, we discuss measures of data preprocessing and model selection for the same analysis. The selected prediction models are evaluated in
Section 4. The results are examined in
Section 5, and the discussion is presented in
Section 6. Finally,
Section 7 presents a summary of the conclusions.
2. Literature Review
Customer churn can be described as the rate at which customers cancel their subscriptions. Predicting churn has gained significant interest in the banking sector, with most solutions focused on achieving high predictive accuracy through machine learning techniques [
17].
Table 1 reviews several studies that frequently incorporate significantly sophisticated and complicated models based on components of multi-feature data to embrace various types of customers’ behaviours and details. Research studies evaluate customer credit risks, purchasing behaviours, and service usage levels. The implementing of predictive models encounters accuracy limitations due to their analytical demands surpassing what banks can feasibly manage in their operations. Banks prefer decision systems that fulfil three criteria, namely, interpretability, the ability to take direct action, and direct alignment, to achieve business goals as computation accuracy does not guarantee effective customer retention outcomes [
18].
However, there is limited work on more basic, actionable, quickly interpretable measures, such as account balance, which could help recast customer retention within banks. Account balance data is invaluable for predicting churn risk as it provides direct financial evidence about what customers do, making it more accurate than other indicators. Therefore, it is not just more straightforward to understand than more complicated measures, such as return on investment, it is also directly associated with how much a customer actively uses banking services [
19]. Hence, this work provides an understandable and easily implementable statistical model to address churn by strictly focusing on an independent variable such as account balance. This research implements account balance as its primary metric to provide banks with measurable, objective data for developing retention strategies based on financial stability patterns. Therefore, this study aims to fill the gap created by modelling approaches with high levels of churn complexity and, at the same time, provide simple, easy-to-use performance measures that bank operations can quickly implement.
Table 1.
Summary of Customer Churn Prediction Models Across Various Studies.
Table 1.
Summary of Customer Churn Prediction Models Across Various Studies.
| Author | Dataset | Model | Advantage | Disadvantage | Best Accuracy |
|---|
| Maan et al. [20] | Customer churn data with financial behaviors.
Customer churn related conducted on software industry. | XGBoost achieves interpretability with the assistance of SHAP, Random Forest, AdaBoost, XGBoost, logistic regression, etc. | Accurate interpretation model based on SHAP values. The boosting techniques, relatively high recall, and AUC values were shown. | Complicated model to understand and implement, and also complicated to manage SHAP values. Interpretability problems, which are likely to occur due to complexity. | 92% |
| Hejazinia et al. [21] | Customer churn in the banking industry. | Correlation analysis, chi-square, t-test, ANOVA, analysis of variance by logistic method. | Defines main demographic characteristics that influence churn, such as credit rating and balance. | It has lower predictive ability compared to the other artificial intelligence models. | 78% |
| Zhang [22] | Customer churn in the banking industry. | A set of statistical tools containing cross-tabs and logistic regression. | Useful demographic information linked to churn. | Neglects account balance as a predictor. | 75% |
| Suh et al. [23] | Large banking dataset (3 M customers, 170 M transactions) | XGBoost and SHAP for model interpretability. | It emerged that various demographic factors influence churn. | The requirements for preprocessing and computing are high. | 91% |
| Morris et al. [24] | Customer churn data with financial behaviours. | Recency, Frequency, and Monetary Value (RFM)-based framework, XGBoost, elastic net models. | The model is accurate and can be interpreted through SHAP values. | The model is complex, entailing comprehension of SHAP values, application of such values, and regulation of the resulting values. | 93% |
Relatedly, Hejazinia et al. [
21] also developed an ensemble learning model, including, for instance, random forest, Adaboost, and logistic regression, to enhance churn prediction. However, this study paid more attention to variances and accuracy than the heuristic values of one or another components. The approach neglects how individual financial indicators are used in practice and interpreted by financial analysts. Account balance provides information about measurable customer retention risks, generating valuable retention insights.
In a study [
22], Zhang used basic cross-tabulation, independent samples
t-test, and logistic regression analysis to explore whether various potential demographic and credit characteristics contribute to customer attrition. The observed results illustrated demographic distributions, revealing a higher likelihood of bank switching among older customers with lower credit standing and more significant outstanding balances. While statistical analysis of demographic effects was appropriate, their studies examined only credit scores and demographic profiles without considering financial actions linked to customer attrition. Account balance operates as an on-time financial indicator that tracks banking service patterns and money flow activities to determine the potential for customer churn.
Suh et al. [
23] used cross-tabulations and logistic regression analysis to study the factors leading to customer attrition and population-based attrition. They established that customer age and geographic area significantly influenced customers’ leaving the bank. Although the authors acknowledged that balance and other financial metrics were not essential for their model, they recognised how they could help as supporting indicators in churn prediction. Account balance demonstrates different behaviour than demographic attributes as it fluctuates based on financial conduct, yet it remains an evolving signal of potential customer churn.
Morris et al. [
24] conducted a large-scale experimental churn analysis in retail banking that combined segmentation approaches with supervised learning techniques like XGBoost and elastic net. Their strategy for segmentation relied on recency, frequency, and monetary (RFM) values to deal with data that had class imbalances and ensure the classification worked. By breaking the data down into different parts, they managed to handle the code challenge by controlling the data variety of the method and the model [
25]. RFM values help understand purchase activity but fail to measure actual financial security for direct churn prediction. Account balance delivers up-to-the-minute financial data, making it a superior indicator for building retention strategies compared to RFM values. Despite this incorporation of high-level features and model selection, applying the system to daily banking would not be feasible.
This research analysis presents several studies demonstrating the viability of highly sophisticated machine learning methods for customer churn prediction. Despite this fact, many existing works oversell the sophistication and accuracy of models and neglect computational interpretation. For instance, Maan et al. [
20] applies XGBoost and SHAP values to improve model interpretability, but the complexity and particulars of these methods are difficult for managers to understand. Similarly, in [
21], the RF and AdaBoost classifiers enhanced the algorithm’s performance on a novel dataset. However, as with previous findings, the models’ inattention to decision-oriented, easily understandable measures, such as the account balance, hinders their usefulness for decision-makers.
At the other extreme, this study prioritised interpretability, restricting the analysis to the predictor variable—the account balance—in contrast to [
22], which included various demographic characteristics and credit histories without emphasising account balances. This study establishes the importance of predicting past account balances and offers a precise, actionable measure. Furthermore, Zhan [
23] and Suh et al. [
24] proposed global predictive models for MIC financial behaviours, but they failed to assess the balance of accounts as a primary criterion. The current study fills this gap by identifying a practical but interpretable approach that combines high-powered machine learning algorithms with essential operating tips to assist banks in enhancing customer satisfaction strategies.
3. Proposed Integrated Framework
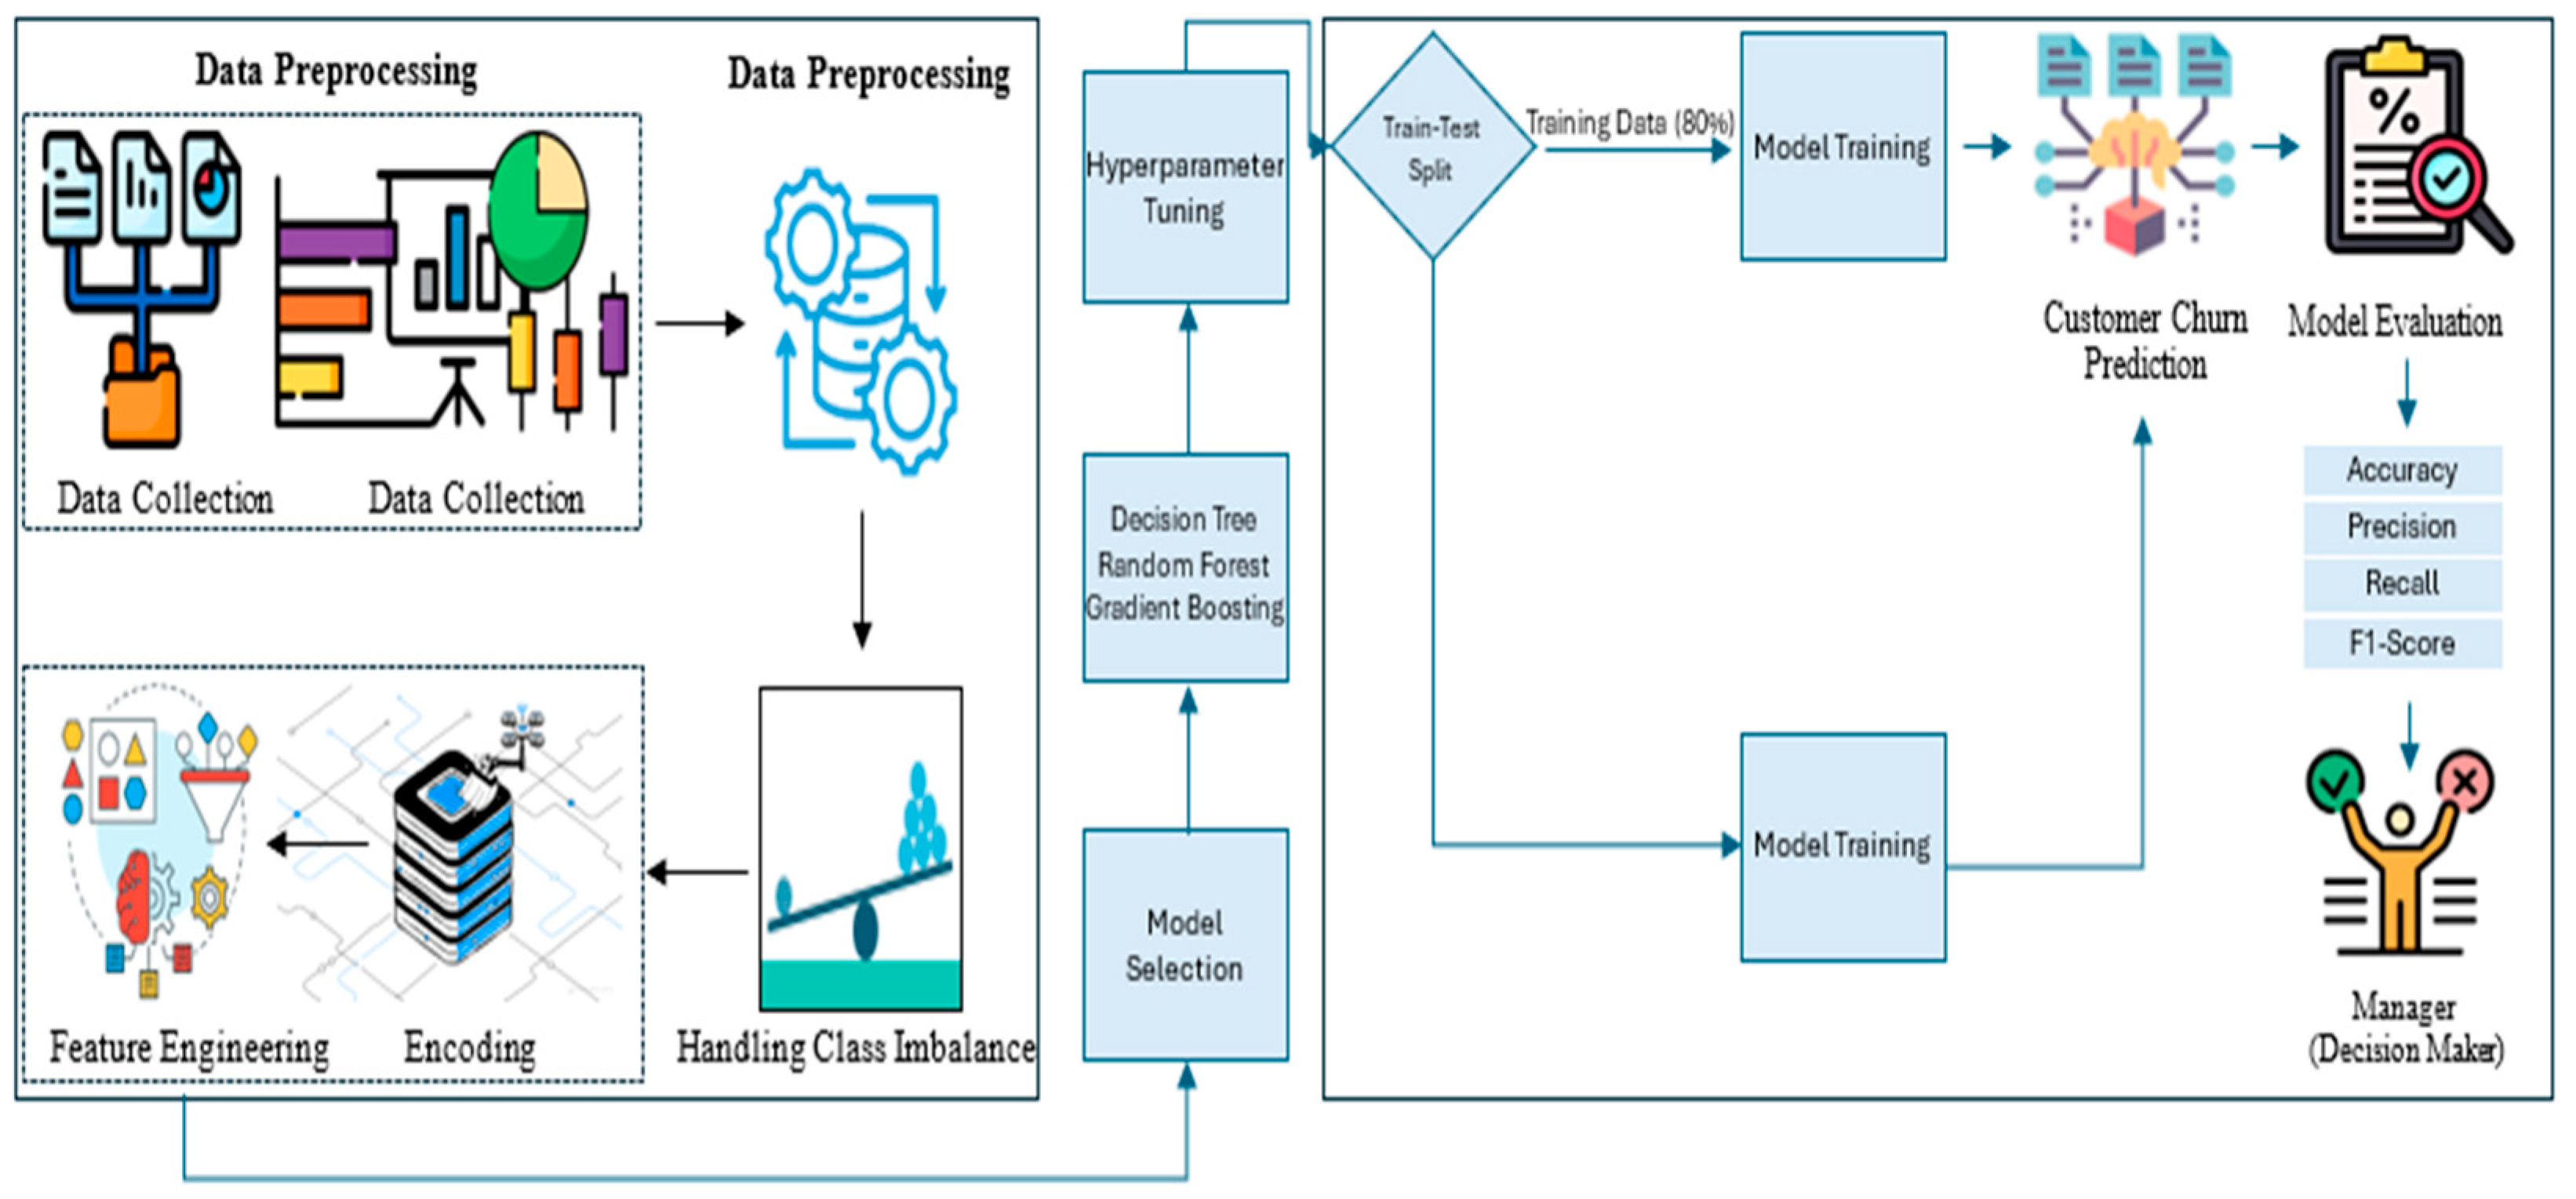
The proposed conceptual integrated framework’s layout plans, shown in
Figure 1, are methodical and easily understandable. These plans will help in determining why customers leave banks. There are two primary phases to its development. The data preparation phase includes data collection, exploratory data analysis (EDA), data preprocessing, feature engineering, class imbalance handling, etc. For the betterment of the dataset, we apply trends, fill in missing values, encode the categorical variables, and apply the Synthetic Minority Oversampling Technique (SMOTE) so that the numbers of people who do and do not churn are equal. This phase ensures that our dataset is clean, and our models can catch the customers’ interesting behaviours. The second phase of the proposed conceptual integrated framework is where interpretable machine learning classifiers with high predictive abilities, such as DT, RF, and GBM models, are utilised. The churn predictions are finally analysed to assist bank managers in understanding what aspects they need to improve to improve customer satisfaction through active retention strategies, personalised incentives, and engagement campaigns to combat churn. This framework enforces an efficient balance between the realisation of practical business applicability and accuracy.
3.1. Dataset Overview and Its Structure
In the current work, customer churn pertains to categorising bank customers to regain a deeper understanding of the data. This study was achieved by analysing a dataset comprising 10,000 entries and 18 fundamental contextual features of potential churns [
26]. The quantitative variable includes credit score, age, tenure, balance, and estimated salary; the qualitative variable includes geography, gender, and card type. This analysis’s dependent variable is has a customer churned or remained. Such a large volume of data helps us understand the internal and external influences of churn behaviours in the banking industry. The dataset has no duplicate records, thus ensuring qualitative accuracy for analysis. The count of entries for each unique value is plotted to indicate no duplicate records. A high-quality dataset ensures no need for voids and redundancies in the analyses.
Accordingly, the type of customers covered in this dataset is highly diverse relative to the ratio of tiny transactions to few accounts with large balances. This variability in the customers’ behaviour can be beneficial for diagnosing churn patterns in the banking industry [
27]. In addition, the dataset includes numerical, categorical, and float features, which help to capture a rich feature inventory for analysis.
3.2. Data Processing Approach and Feature Engineering Process
Once the dataset was ready for building the proposed integrated framework, steps from both preprocessing and feature engineering were used to make sure the customer churn dataset was represented consistently and to make it more predictive, as follows.
3.2.1. Data Preprocessing
First, fields that included RowNumber and CustomerId were changed from numerical variables since they did not incorporate enumeration values in their values but rather served as record unique identifiers. We enhanced the data structure to align with our intended analysis. We also examined another factor to confirm the accuracy of the data capture. We verified all columns in the current dataset for null values to ensure they contained non-null but valid attributes. Applying this critical step implies that all results obtained from customer churn analysis are plausible to a certain degree.
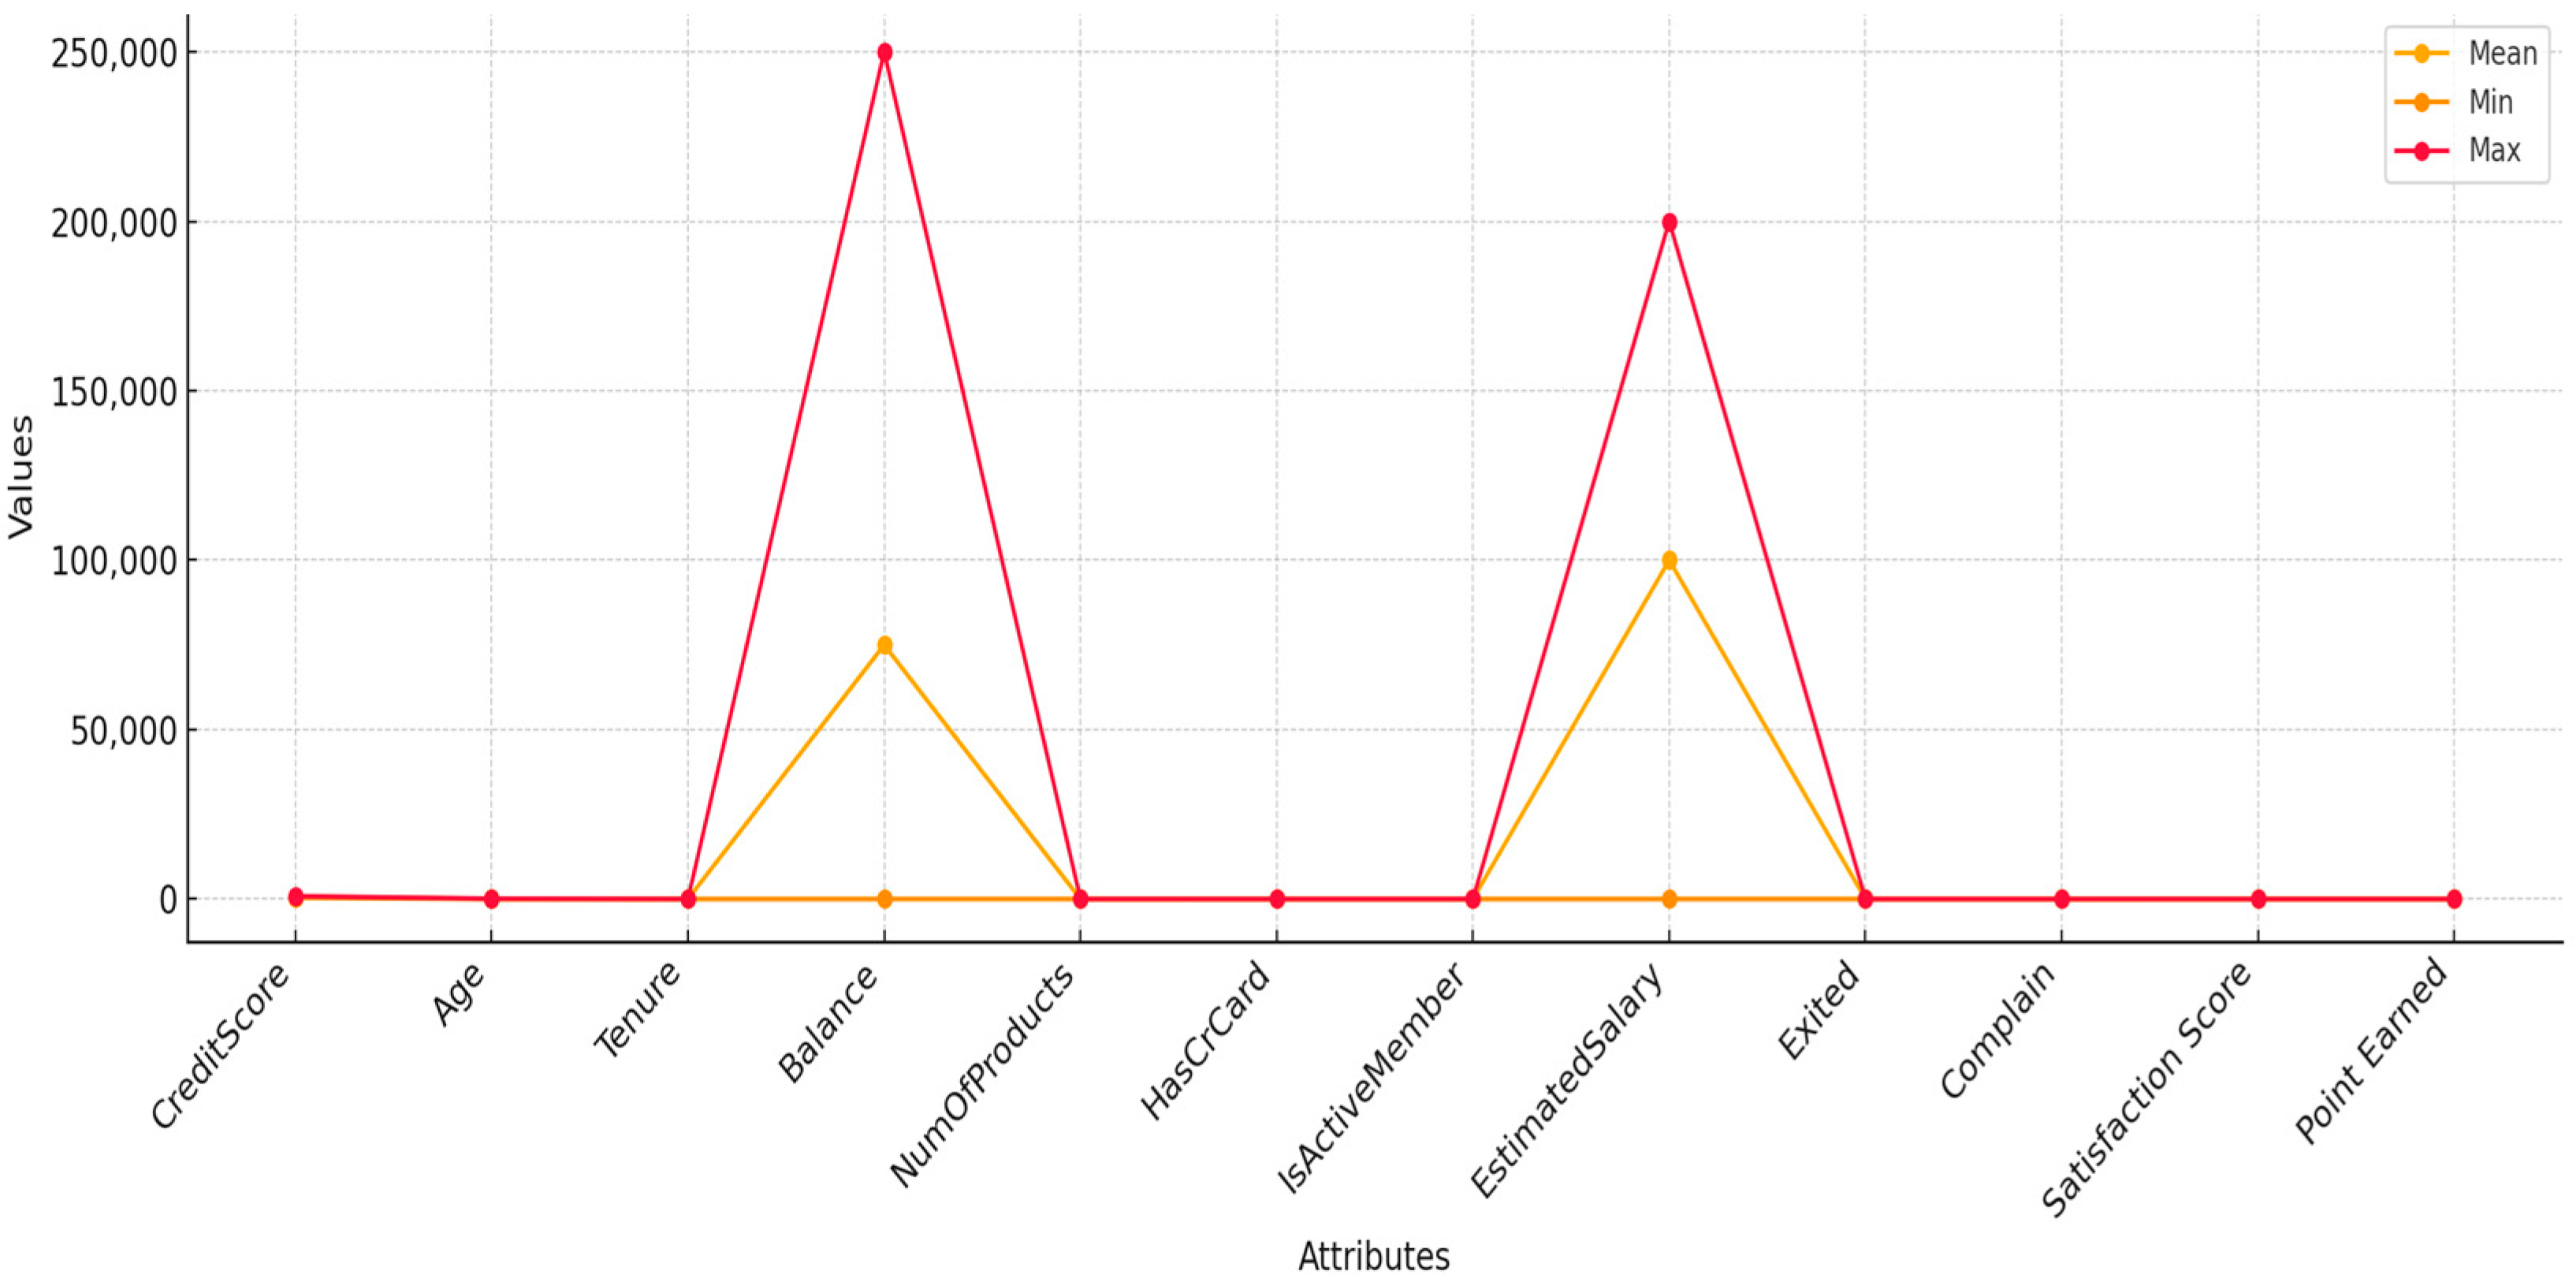
We computed measures of central tendency, such as mean, median, mode, and percentiles, based on the numerical attributes, as shown in
Figure 2, to determine the distribution and variability of the essential characteristics. For example, the observed customer balances showed a high variance in distribution, indicating that the customers’ spending patterns varied. Similarly, variations in the customer’s age significantly influence their role in determining their choices within the banking community.
3.2.2. Feature Engineering
We transformed the categorical variables using multiple methods before constructing the machine learning model. This process made the data easier to understand and more accurate. One-hot encoding transforms geographical and card-type variables into binary indicators to prevent models from allocating mistaken relationships from ordinal data types. The Min-Max scaling technique was applied to the financial variables, precisely the balance and estimated salary. Normalisation was applied so that models would not prioritise large values. The financial datasets benefited from log transformation as this produced standardised distributions that led to more accurate models and improved comprehension of results [
28]. The model utilised SMOTE data balancing techniques to handle class imbalances while improving its capability to identify vulnerable customers.
Categorical encoding plays a significant role by enabling the performance of non-numerical features in predictive modelling applications. The important categorical variables received proper encoding to decrease bias yet maintain the interpretability of the model. The study applied numerical assignment to convert binary categorical data by representing one gender category as zero and the other as 1. This method makes the computation process easier and works with all tree-based machine learning algorithms, such as the DT, RF, and GBM classifiers.
Encoding non-binary categorical variables became more challenging as they were used across multiple geography-based regions and various membership levels based on card type, ranging from sliver to diamond. Before inferring ordinally ordered relationships, a one-hot encoding process was activated by the Pandas get_dummies() function and the Scikit-learn OneHotEncoder(). Each category received a single binary column through this technique, which helped the model learn about the variables without knowing their ordering positions. One-hot encoding increases the size of datasets while ensuring that category recognition works well during model prediction without changing the final results [
29].
Applying feature scaling is necessary to standardise numerical variables and ensure that all measurements match the same scale [
30]. Min-max normalisation transformed the numerical fields Balance and Estimated Salary into values between 0 and 1. The purpose of this step was to postpone features with large values so that they do not dominate the model learning process and retain relationships within the data. These implementations transformed the dataset structure and increased the interpretability and optimisation needed for predictive modelling. The models (DT, RF, and GBM) exhibited a high-performance boost over time as they efficiently processed customer behaviour patterns and minimised predictability bias.
3.2.3. Additional Transformations Workflow
We also used descriptive statistics to examine the associations between numerical features in a correlation matrix. For instance, we trained the excluded target variable using the complaint feature, and its perfect correlation necessitated additional scrutiny to prevent data leakage during feature selection. We standardised numerical attribute variables using the min-max normalisation equation to prevent more expansive learning scales from outperforming other features:
Here, x is a measurement of that feature, and is a normalised measure of x = 0 and x = 1. Therefore, these conversions and improvements have led to the development of a robust and consistent dataset that will help promote better machine learning modelling and assessment activities.
3.3. Statistical Analysis and Distribution Recognition
Specific evidence was collected using several statistical methods to evaluate the behaviour and interaction of valuable customer characteristics.
Figure 3 shows the quantitative analysis of central tendency metrics, which find the mean minimum and maximum values for key numerical data fields. The provided measures offer an extensive view of data distribution, which reveals significant trends and data irregularities in multiple customer features. The other attributes remain within a lower range of variation as their maximum values exceed 250,000, even though the other attributes stay within a lower value range. These attributes demonstrate extreme divergence between their mean (orange line) value and maximum (red line) values due to the presence of exceptional customers who reach dramatically higher levels of balance and salary. Understanding high-balance customer behaviour is vital for churn prediction since customers may modify their service usage patterns due to reduced transaction needs.
Middle-aged customers represent the majority of observations in the dataset since their age distribution displays a single block with its maximum point at 40 years old. A substantial demographic of customers displays credit scores between 600 and 700 according to a balanced distribution but there are also more individuals on the lower scale end, which indicates moderate to poor creditworthiness. There are two clear groups of customers based on the distribution patterns of balance and estimated salary data. Two distinct customer groupings show zero balance in dormant accounts and balances around 100,000, which creates a standard distribution model. Bank customers fall into two different account types due to their tendency to either lack deposits or hold large amounts that remain unused for banking services.
Numerical features NumOfProducts, IsActiveMember, and HasCrCard appear to have similar maximum and minimum value ranges, so their values remain stable across all customers. The Exited variable, which identifies churned customers, reveals a lower mean level since most customers have not churned from the dataset. Statistical data analysis allows a deeper comprehension of the connection between vital financial measures and customer attrition patterns. Customers who maintain high balances and earn substantial salaries may leave due to dissatisfaction with service quality or minimal incentives, but low-balance customers tend to depart as a result of monetary limitations and product disinterest. Pattern recognition operates on machine learning models to choose features that boost accuracy and make models more interpretable during churn prediction.
The estimated salary ranges based on age groups can be observed through box plots, as shown in
Figure 4, to study income and customer churn patterns. The box plots show important statistical values from the lowest to the highest, from the first and third quartiles (Q1 and Q3) to the median and the highest. They also show the salary range for each age group with whisker lines. Salary levels remain stable across all age groups according to the consistent median salary readings displayed on the green line. The range of salaries is not the same for all employees. The IQRs are wider for workers aged 10 to 20, 80 to 90, and 90 to 100. This means that salaries vary more between these age groups. Most employee salaries exceed the expected salary range since outlier cases are scarce.
Salaries within the age groups of 10–20 and 80–100 demonstrate wider distribution ranges with additional extreme values than other generational segments. The salary data shows two groups of young customers having low incomes from student earnings or entry-level positions and high-income customers who earned wealth through inheritance and career progression. The 80–100 age group contains retirement customers receiving different financial benefits and experiencing varying levels of income reduction. The customer retention analysis demands a comprehensive examination of this customer pattern. Bank customers aged 30–60 demonstrate long-term banking engagement due to the stability of their salaries, making them strong candidates for bank retention strategies. Well-established financial conditions make younger customers (10–20) and older customers (80–100) more likely to leave an institution due to their shifting banking preferences and decreased financial product interest. Knowledge of salary differences between customer age groups assists organisations in developing specialised strategies for business retention. Customer data analysis allows banks to create personalised products and rewards for specific customer segments, such as educational, financial services for students and pension-friendly incentives for elderly customers [
31].
3.4. Data Exploration
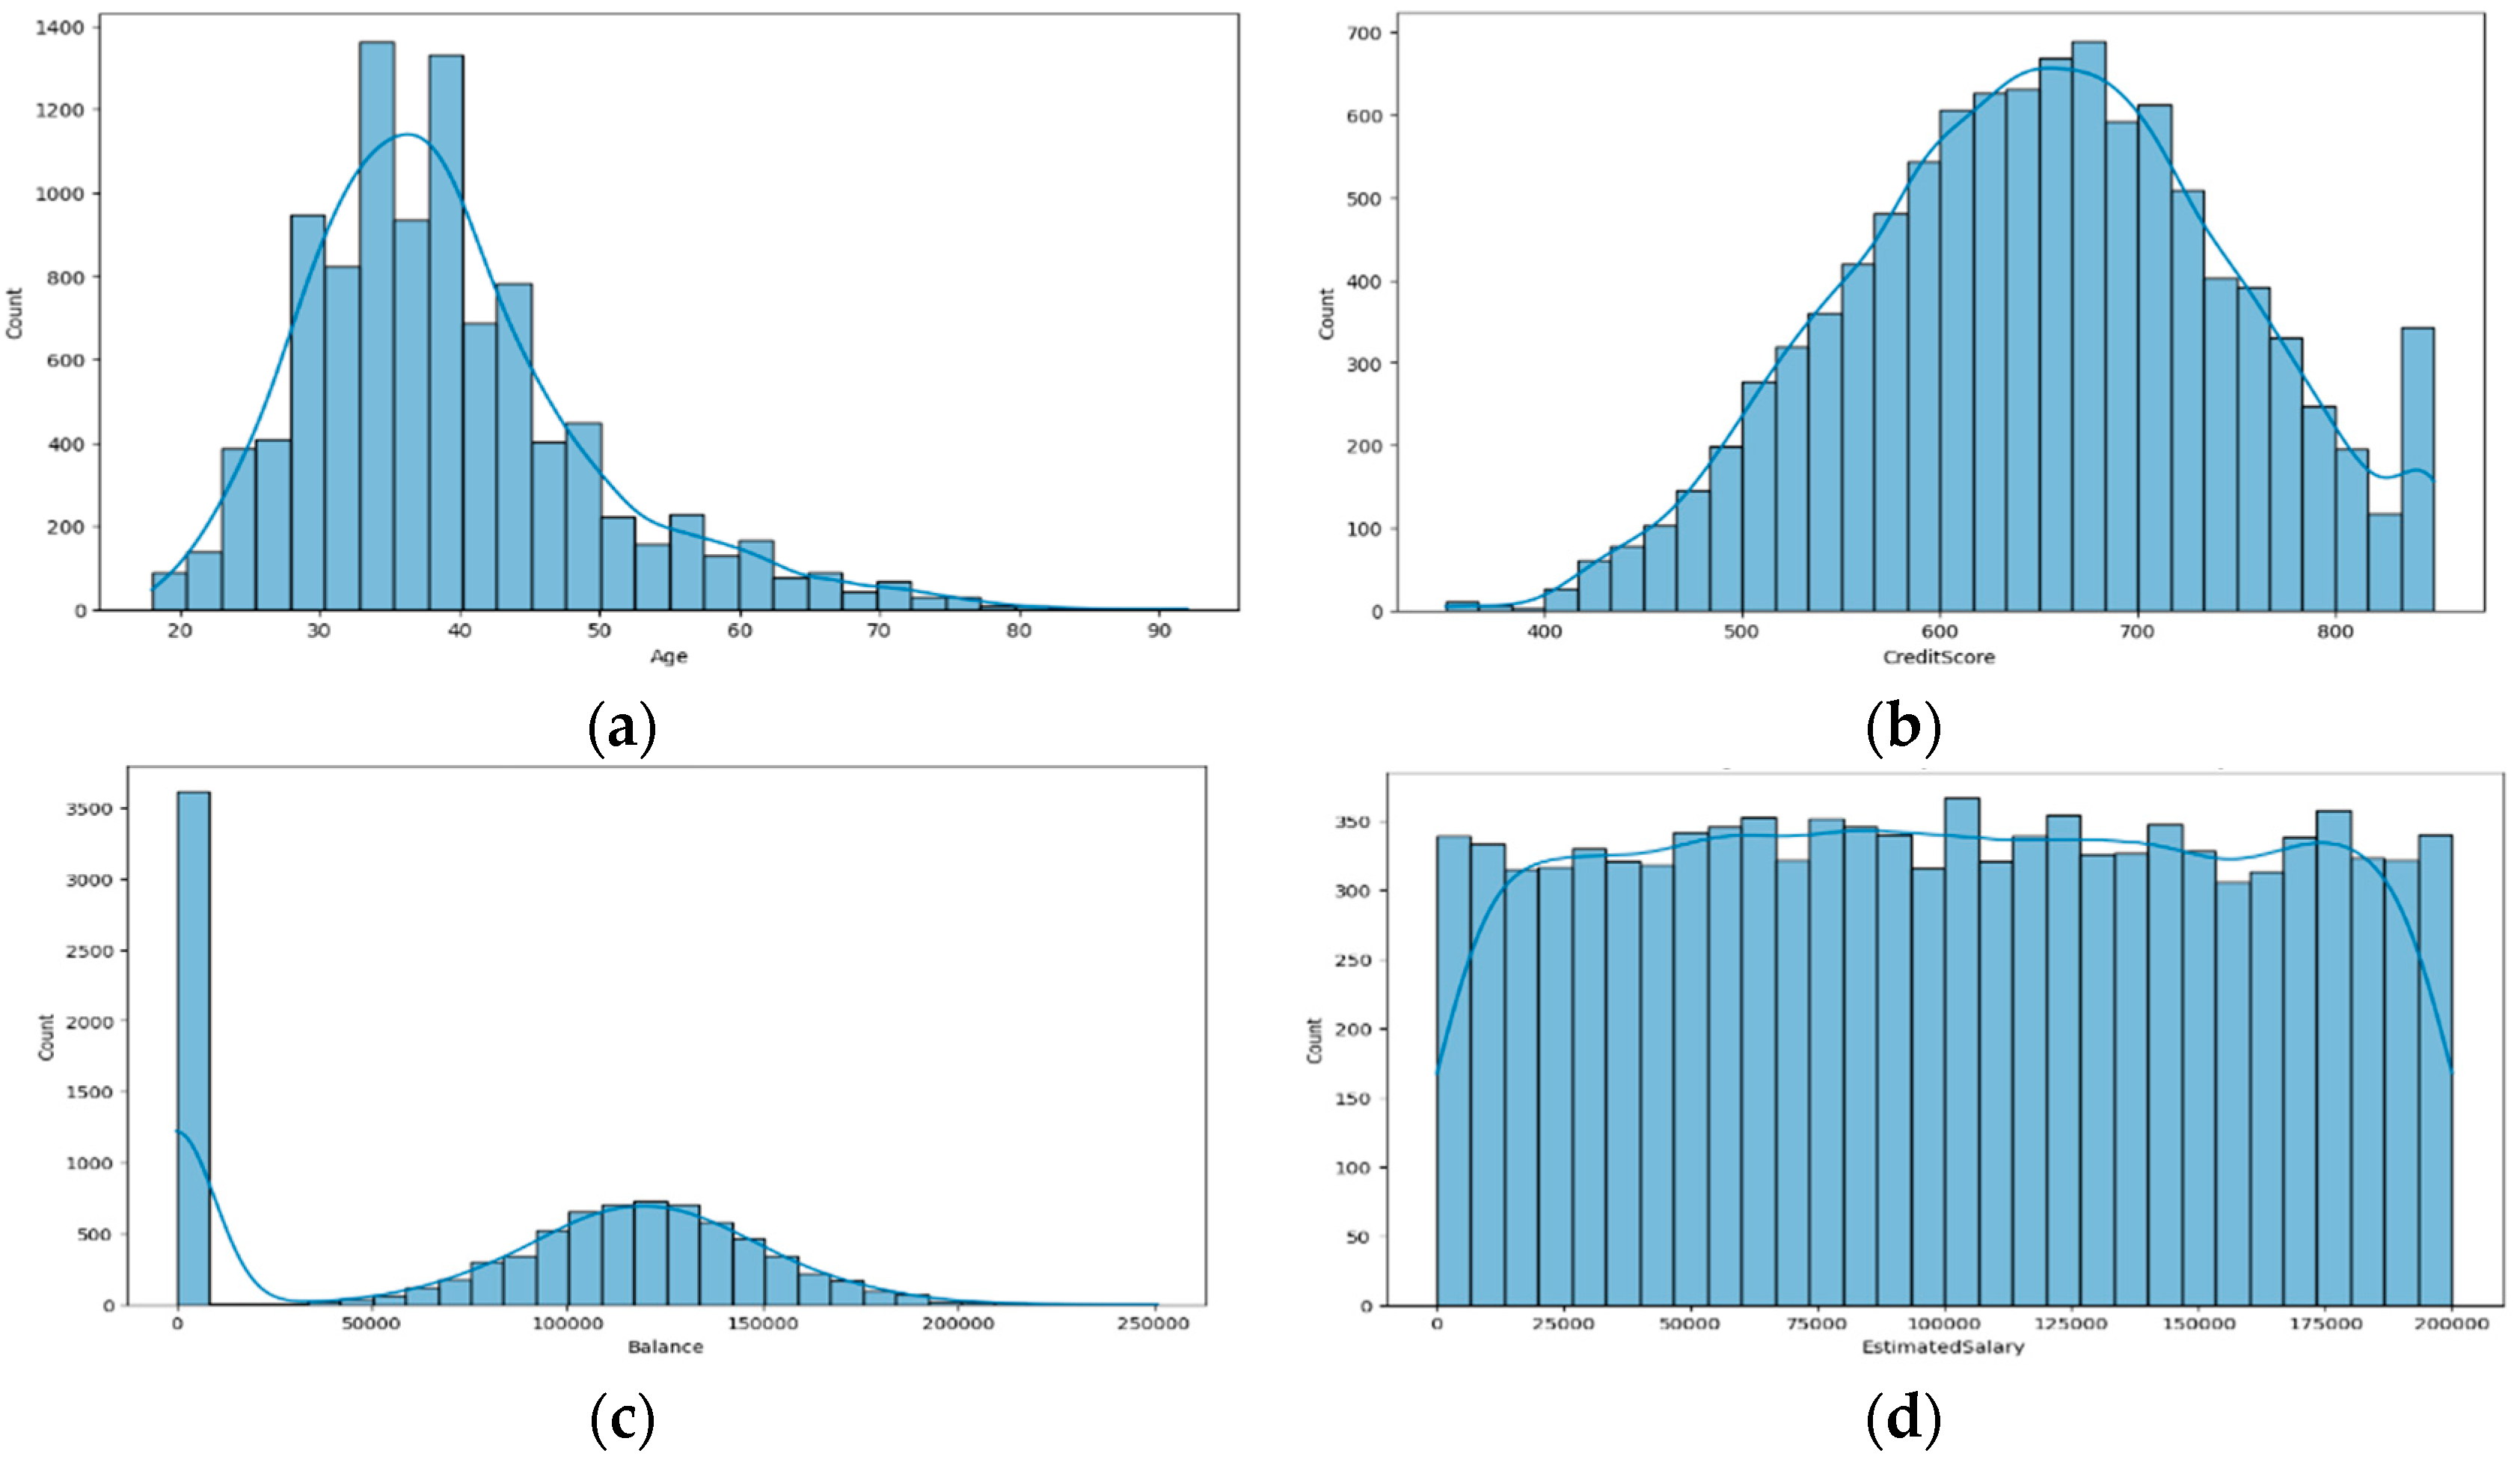
To explore and examine the customer data, we used visualisation methods to detect patterns or points out of place. We started with the initial quantitative variables, including age, credit score, balance (cash), and estimated salary, and we observed them via a histogram and KDE. These methods performed a distribution review and provided insights into the occurrence of features in the dataset.
Figure 5 demonstrates the distribution of key demographic and financial features. According to the data, most bank customers have ages ranging from 25 to 45 years old, with the most significant number of users present in the 30–40 group, as shown in
Figure 5a. The bank’s main clientele lies between ages 30 and 40 since this period shows the bank’s highest customer density. The correct analysis of this distribution pattern remains essential for modelling customer departure behaviour. The likelihood of changing banks remains high for customers between 20 and 30 years old, so they need personalised contact from banking institutions to maintain retention. Customers over 60 years old require financial retirement products. These analytical findings provide the information banks require to create retention strategies that meet the needs of different age groups, thus building better customer loyalty.
Similarly,
Figure 5b displays the frequency of customer credit scores, which reveals most scores are between 600 and 700 with a slight bias towards lower-scoring customers. The present pattern indicates that organisations should prioritise assessing credit risks in their churn prediction efforts. Customers with lower ratings encounter more significant financial challenges, increasing their probability of leaving, but stable customers with better ratings become attractive targets for competitive offers. Knowing these customer risk profiles enables banks to improve their approach to risk-based customer retention programs [
32].
Figure 5c shows a bimodal distribution of customer balances. The first peak at zero balance suggests a large segment of inactive or low-engagement customers. The second peak follows a normal distribution of around 100,000, indicating a group of financially active customers. This pattern implies two distinct customer behaviours: those who rarely use their accounts and those who maintain stable balances. Specific customer groups require targeted retention strategies since organisations can create distinct re-engagement plans and personalised financial deals for zero-balance users and high-balance clients.
Finally, the estimated salary distribution among customers appears uniform, as shown in
Figure 5d. Salaries show a standard distribution, which suggests that customer earnings cannot effectively predict churn patterns independently. The uniform distribution of estimated salary in
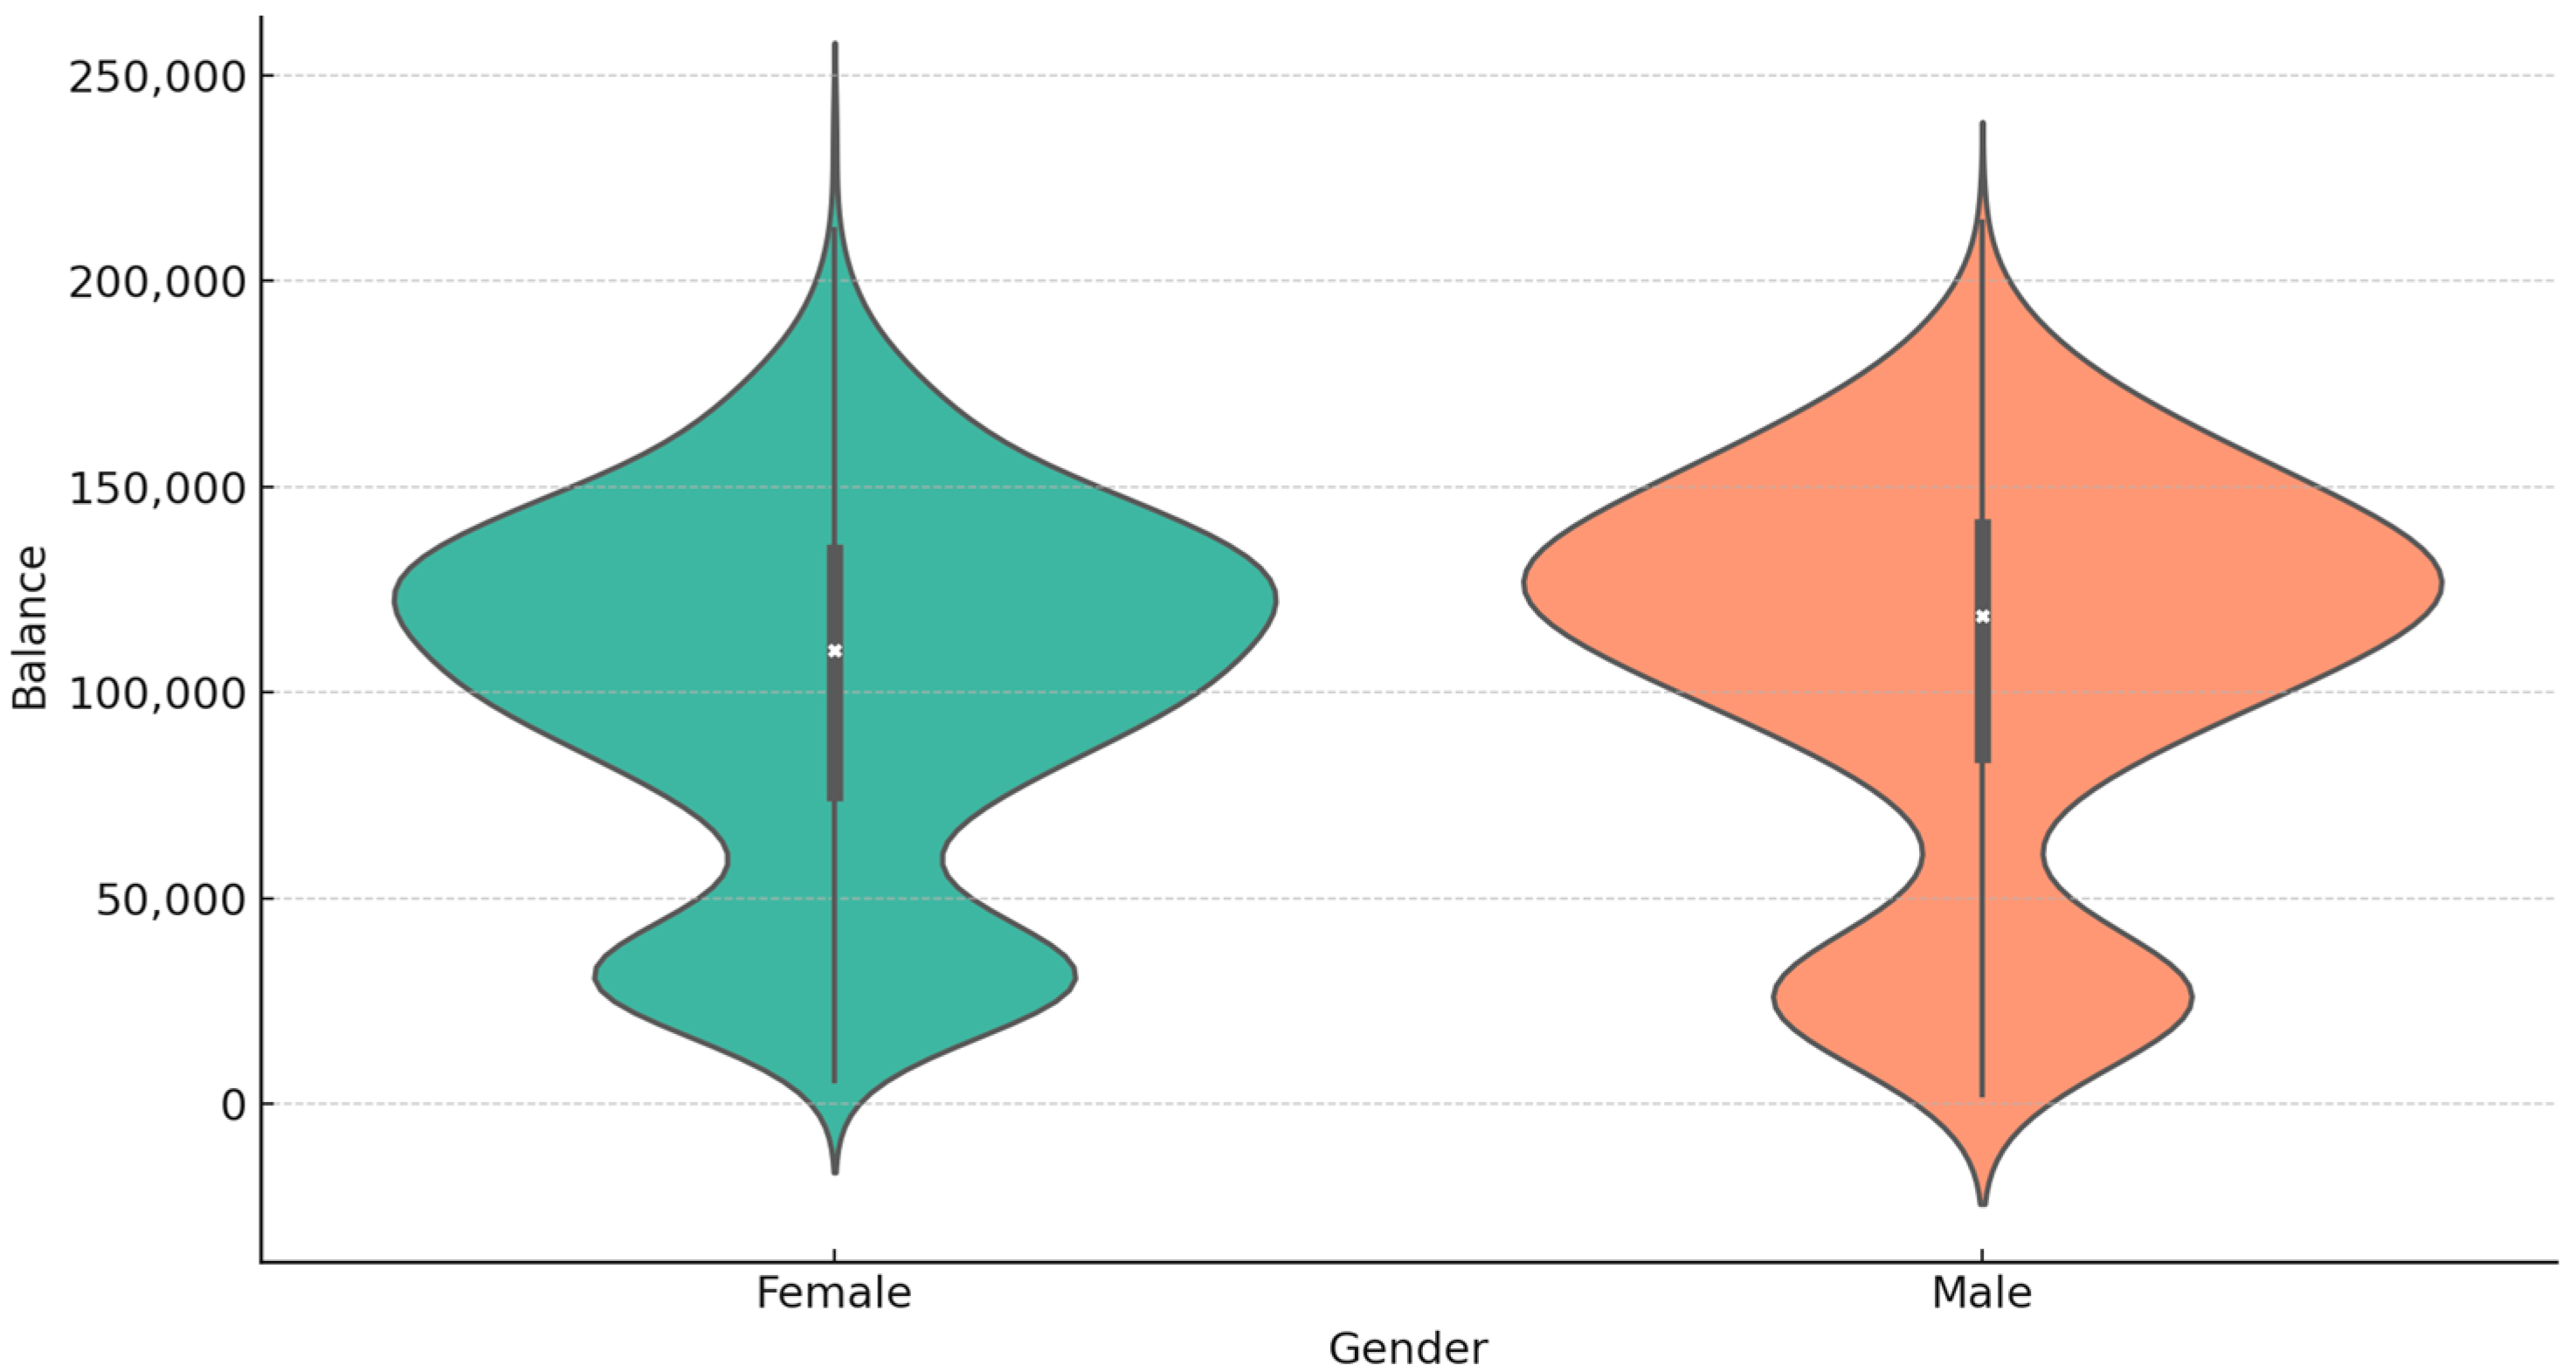
Figure 5d shows that income level does not directly affect customer churn behaviour since other factors remain more critical. In addition,
Figure 6 shows the account balance distribution by gender through a violin plot that shows shape information, density information, and details about variation. The chart reveals that male and female customers with minimal savings or small amounts have equivalent balance distributions. Account balances show identical value proximity between genders, which creates no gender gap in the median results. The widespread nature of account balances appears primarily within high-value customer accounts that surpass the upper quartile. Density plots show a bimodal distribution distinguishing bank customers between low and high-balance activity groups. Behavioural analysis shows that most account holders have zero balances, but a population that keeps active midrange balances exists. High-end customer segments exist for both genders, though these segments are scarce across the market. Banks can create focused retention approaches for their active customer segments through the knowledge of their balance distributions.
This analysis identifies elements that cause overall customer departure. Total customer attrition rates show a high degree of sensitivity to products owned, account duration, balance, and customer credit scoring information. The precision of predictive models improves through financial and demographic characteristics, which simultaneously support the formation of retention strategies. After obtaining these metrics, businesses should initiate intervention methods, including offering high-spenders incentives while implementing innovative contact strategies for disengaged customers alongside high-risk and short-term and poor credit state clients.
The heatmap in
Figure 7 displays correlations between customer-related factors. Moreover, it presents the correlation between features by referring to the strength and direction of their correlation. For instance, age has a moderate positive correlation with the excluded variable, meaning that the older the customers are, the more likely they will churn. A strong and positive relationship between the complaint and exit variables indicates that customers who complain more are more likely to defect. Conversely, a moderate negative relationship between the balance variable and the number of products suggests that customers with a higher balance maintain fewer bank products. Given the complexity of customer relationships, these insights serve two primary functions in studying customer behaviour.
3.5. ML Models: Customer Churn Prediction Model Selection
Selecting appropriate classifiers conserves interpretability, accuracy, and computation costs when embracing predictive modelling. Among the methods, LR, DT, and RF are preferable for churn prediction due to their effectiveness in combination with different types of characteristics of the provided dataset [
33]. The GBM model stands with two other predictive banking models, DT and RF models, while including other existing models. Decision trees have become popular among banking institutions due to their ability to provide accurate solutions and straightforward interpretation [
34]. The ensemble averaging technique in the RF model constructs multiple DT solutions for better generalisation outcomes and reduced variance [
35]. The GBM classifier increases prediction accuracy as a result of its continual weak learning model process and detects complex behavioural patterns [
36]. Based on the results, the banking churn models developed through big data techniques have achieved considerably higher accuracy than traditional statistical models and have shown better predictive performance. Previous studies have shown that these classifiers are suitable for churning analysis, providing valuable recommendations and reporting accurate prediction accuracy across different domains. This study uses the LR, DT, and RF algorithms in the customer churn prediction area. Each classifier contributes a unique advantage to the analysis; therefore, there is no loss of interpretability while maintaining high accuracy for breakdowns.
3.5.1. Gradient Boosting Machine (GBM) Classifier
A GBM classifier improves classification accuracy by training several weak algorithms [
37]. Usually, decision trees perform multiple control passes together to achieve the least error. A GBM model aims to find the optimal function
that approximates the actual underlying function
mapping training examples
to the minimum of the expectation of a loss function
In many classification tasks, a GBM model uses the following logistic loss function:
Here,
denotes a prediction function and
denotes the initial model, often a constant, such as the mean of the targets. The subsequent weak learners’ objectives are to amend the remaining errors from the previous iteration to enhance the general prediction of the loss function. We then take the loss function in each iteration
I of the GBM model concerning the current working model, identifying the direction of prediction improvement, and calculate the gradient at this point, which represents the pseudo-residuals:
We then fit the weak learner, typically a decision tree, to these residuals at each iteration. The optimisation process adjusts
α to minimise the residual loss, which can be expressed as follows:
We denote the weak learner as
, the learning rate as
and
h as the previous step of the method
n. Here is how we update the method progressively:
The learning rate
β is an important hyperparameter that balances learning efficiency and overfitting. A small
β implies a slow algorithm speed, but there is optimal generalisation emergence. In contrast, the growth of
β implies a low latent approximate estimating speed up with enhancement of the chancy over/export occurring. In addition, GBM classifiers have incredible effectiveness due to their great adaptability and high precision in their predictions [
38]. However, their performance relies on correctly tuning for the number of trees, tree depth, and learning rate. A tree’s depth determines its ability to detect attribute interactions, yet the overall model performance relies on the number of trees. While this may minimise the gap between the decision rules implied by the deeper trees, they carry a greater risk of falling into the hands of overfitting and are usually slower to run. Feature importance ratings from the GBM model provide significant input into the factors influencing predictive performance. The GBM method has also proved very successful in various problem areas like finance, health, and customer churn [
39]. GBM is a strong predictive modelling instrument because it may accommodate unbalanced datasets, generate non-linear relationships, and produce forensic consequences. The model’s capacity to iteratively revise the hypotheses of the model improves the accuracy over time. Therefore, GBM provides excellent predictive performance compared to typical benchmark models.
3.5.2. Decision Tree Classifier
Decision tree models are valuable in predictive modelling as they are capable of handling complex choice processes while maintaining interpretability [
40]. They are particularly valuable in customer churn prediction, where many interacting factors are cited in a life span. Unlike linear models, decision trees do not assume that there is a linear relationship between the independent variables and the target variable [
41]. What happens instead is that they allow for interactions between features crucial in industries such as banking where the customer churn is driven by multiple dynamic factors, i.e., account balance, tenure, geo, credit score, and product engagement.
Decision tree models are hierarchical, with the root node representing the whole data set. At every step, the model divides the data into subsets depending on selected features; the resulting groups should be as homogeneous as possible according to the target variable. This process is repeated recursively until a stopping condition is fulfilled, such as the maximum depth is reached, the node has too few samples, or the minimum impurity threshold is reached. The decision splits of a decision tree are influenced by impurity measures, such as Gini impurity, which minimises the impurity by discriminating classes well. When the Gini impurity is lower, this is indicative of a purer node—that the samples are more uniform. Decision trees choose the feature that leads to the most significant decrease in impurity at each node to carry out the most effective data partitioning. Gini impurity, a widely used metric, is defined by:
Here,
means the probability of a sample belonging to class
k at a given node of the decision tree. In churn prediction, the tree seeks to segment the data so that Customers are likely to be either churners(Exited = 1) or non-churners(Exited = 0). Consequently, the model yields two distinct customer segments the model foresees to churn. Besides the Gini impurity, entropy can be used as a cut criterion. Entropy is the disorder or uncertainty of a node and is expressed as:
Here, denotes the prior probability of the data point belonging to class k. A lower entropy value means a given node is more homogenous and contributes more to classification accuracy.
For customer churn prediction, decision trees divide customers into groups that show different retention behaviours. For example, a decision tree can show that customers with low account balances and young customers are likely to churn, while customers with high balances and older ages are more prone to stay with the bank. In addition, demographic properties such as location and customer activity status might act as other good churn indicators. Decision trees vastly differ from black box machine learning models as they present a very transparent way to relate every prediction to data, making themselves helpful for business choices [
42]. The road from the root to a leaf node represents a chain of decision rules that can be converted to actionable information for decision-makers.
For instance, in a banking context, a decision tree technique could produce the following classifier rules for the task of churn prediction:
If account balance < 10,000 and tenure < 3 years, then there is a high probability of churn.
If account balance > 50,000 and IsActiveMember = Yes, then there is a low probability of churn.
If geography = ‘Region X’ and credit score < 600, then there is a moderate probability of churn.
Retention strategies with focused objectives emerge from these insights so financial institutions can provide special incentives to customers who demonstrate existing tendencies. Decision tree algorithms excel in finding complex feature relationships, and they offer straightforward explanations for resulting predictions. However, the models have limitations since inadequate regularisation can lead to overfitting of the training data. A model exhibits overfitting behaviour when it learns patterns that only apply to training data, affecting its capability to handle new data configurations [
43]. This problem can be managed by pruning alongside maximum depth constraints and sample count requirements for leaves in the decision tree structure.
The regularisation method, pruning, removes unneeded tree branches to prevent the model from memorising training data excessively. The cost complexity parameter is the standard approach to perform tree pruning functions. The penalty strength for tree complexity is set by
α in the pruning process. A selection of optimal subtree occurs when the cost following function reaches its minimum value:
The classification error of tree
is
, while ∣T∣ shows the number of leaf nodes present in the tree. The
α parameter enables users to balance how complex the tree becomes and its performance quality. The challenges surrounding decision tree implementation do not diminish their importance as an essential and understandable prediction model for customer churn analysis. Decision trees are vital analytical tools in customer analytics as they empower businesses to extract meaningful insights from data, aiding in the understanding of customer exit patterns and the development of effective customer retention strategies [
44].
3.5.3. Random Forest Classifier
The RF model is a powerful ensemble learning method that bases its increase in prediction accuracy on the aggregation of countless decision trees [
45]. It is mostly used for customer churn prediction, removing over-tracking and variance but keeping high generalised performance. The RF model core is built upon the concept of bootstrap aggregating (bagging), in which a set of decision trees are generated from random subsets of the training set both in terms of rows (samples) and columns (features). The randomness allows for diversity within the tree set, making the tree more resistant to overfitting than an individual tree. Each decision tree in the random forest model is trained independently using a random subset of features at each split, which minimises the overfitting of the model to any single point. When making predictions, the model collects outcomes from all trees using a majority vote for a classification problem or averaging the prediction in a regression problem. The last decision for the final prediction of classification is based on:
Here
, represents the number of trees,
is a prediction by the
-th tree or input
, and
represents the prediction. The most significant advantage of the RF classifier as utilised in this study is its ability to output feature-importance measurements, such as Gini importance or permutation importance. According to this study, the Balance and Satisfaction scores were significant variables influencing churn. Our research showed that customers with less than USD 50 in their accounts and a dissatisfaction score of more than 2 were most likely to leave. We define the feature importance metric as follows:
where
denotes a decrease in impurity brought in by attribute
f of tree
t. Models scoring higher importance of features have a more significant influence on prediction models. Also, permutation importance does feature importance by randomly permuting a feature’s values and assessing model performance change on permutated vs. original data. A significant decrease in accuracy signifies an essential feature.
In customer churn prediction, the random forest model effectively reveals the principal financial and conductive factors of attrition [
46]. For instance, our evaluation demonstrated that balance scores and customer satisfaction were great predictors of churn. Customers with balances less than or equal to a certain threshold and similar complaints score above a specific value had a significantly greater likelihood of leaving. This data enables banks to implement pre-emptive retention actions, such as delivering targeted offers to frightened customers.
One benefit of random forest is its effectiveness in dealing with high-dimensional data with low feature selection requirements. Since it builds multiple trees using distinct subsets of features, it genetically tackles the problem of multicollinearity and enhances the stability of the model. It also exhibits robustness to outliers and the handling of missing data; therefore, utilising customer analytics in banking is sensible. However, upon extensive data, the random forest models can become capability-consuming for the multiple trees training required, as discussed. The complexity depends on the number of trees and the depth of each tree. Additionally, though random forest boosts accuracy over a solitary decision tree, it yields less interpretability since the predictions come from many enrolled models instead of a route through a solitary decision tree [
47].
4. Costumer Churn Predictive Model Evaluation
We assessed the efficiency of the framework’s performance using numerous metrics, such as accuracy, precision, recall, and the
F1 score. We used each metric to clearly understand the model’s predictive accuracy for the various components under analysis [
48,
49]. We adopted these measures to capture certain aspects of the model’s performance in an evaluation that is not partial. The next chapter will discuss the suggestions for model improvement that this evaluation helped identify.
The following equations use the total number of positive samples (TP) to distinguish between customers from class 1 who are positive and those who have churned. Total negatives (TN) refers to the total number of customers who should not churn, correctly classified as the negative class. False positives (FP) are statistical variables that indicate whether customers who did not convert to churn are classified as churners. Conversely, FN stands for false non-churners, indicating that the model’s programming precisely determined the number of genuine churners classified as non-churners. These definitions are inherent to correct and incorrect classifications studied in the context of evaluation metrics.
4.1. Performance Metrics
In this study, the performance of the ML model was evaluated with the help of the following parameters.
4.1.1. Accuracy
Accuracy calculates the percentage between the actual classes of instances and the total number of cases. It indicates how well or poorly the model has performed across all classes, which is desirable since the model’s efficiency may vary across different courses. The accuracy formula is denoted as follows:
4.1.2. Precision
Precision is a positive predictive value that quantifies how many of the predicted churners were actually true churners. Note that minimising false positive results makes this metric most relevant. The formula for precision is:
Accuracy is essential to limit false positives and to avoid misclassifying non-churning customers as churners.
4.1.3. Recall
This metric establishes the concept of measuring the actual positive measure made by the model. In this case, we have avoided false negatives. The recall equation is as follows:
This metric is essential in banking churn prediction as missing a true churner (false negatives) could result in customer loss.
4.1.4. F1 Score
This statistics metric represents the harmonic mean averaging the precision and recall measures; erroneous positives and false negatives are involved. It is especially effective for highly skewed distributions. This metric is formulated as follows:
Churn prediction tends to involve imbalanced data, so the F1 score is a better function for indicating how well the model is performing overall.
4.2. Impact of SMOTE on Class Distribution
Class imbalance is one major problem in churn prediction, where most clients are those who do not churn [
50]. In our dataset, only 20% of the customers have churned; all others are non-churners, i.e., 80%. Training on such imbalanced data usually leads to an excessive bias towards the majority, making it hard to predict churners precisely. For this reason, we employed the Synthetic Minority Oversampling Technique (SMOTE) in the training set, which produced synthetic examples for the minority class and changed the class distribution to 50:50. This oversampling method ensures that the outcomes of models are not biased towards the majority class and learn better decision boundaries for churners. SMOTE increased the recall by making the models classify the churners more correctly [
51]. The RF and GBM classifiers showed the best performance in terms of recall, exploiting the additional synthesised data to extend their effectuating steps. The DT classifier similarly benefited from SMOTE but remained more prone to overfitting due to its hierarchical characteristics. In general, SMOTE improved at-risk customer identification for the model, leading to more reliable and usable churn prediction.
For the RF classifier, we increased the number of estimators from 100 to 500 to increment predictive stability by averaging predictions from many different decision trees. Also, we set the max features to sqrt (n features), this is to enforce selecting assorted features throughout trees preventing overfitting. These improvements resulted in a 5% increase in F1 score, which validates that the improvements were balanced by the increase in both precision and recall without losing RF’s generalisation capability. The GBM method was tuned to enhance the model in preventing overfitting. The learning rate was dropped from 0.1 to 0.05 and the model was allowed to learn more slowly and to improve poor learners iteratively. Furthermore, the number of boosting rounds was increased from 100 to 300, allowing the model to go through incremental enhancements at each stage. These adjustments led to the greatest predictive accuracy, rising by 8% in recall following SMOTE, which made the GBM model the best model for detecting churners.
4.3. Hyperparameter Tuning and Model Optimization
To obtain the best model performance, hyperparameter searching was performed using the grid search and cross-validation method, improving the important parameters that influence model generalisation and explanation power [
52]. By tweaking these parameters, the models were able to reach an optimal balance between accuracy, recall, and robustness in predicting customer churn. The DT model was particularly adapted to discover useful structures whilst mitigating overfitting. The maximum depth was increased from 5 to 15 to enable the model to learn more intricate decision boundaries, enhancing classification accuracy. Furthermore, the minimum samples per split were changed from two to ten, allowing splits to only occur in statistically significant patterns. Those optimisations cubed the model’s hedging but slightly reduced recall, making the DT classifier more cautious about predicting churners.
4.4. Computational Setup
Experiments were conducted using modern hardware in 2024 to get an accurate dataset filing and model training outcomes. The system was composed of an Intel Core i9-13900K processor (Intel Corporation, Santa Clara, CA, USA) running at a base clock of 3.0 GHz, NVIDIA RTX 4090 GPU with 24 GB VRAM (NVIDIA Corporation, Santa Clara, CA, USA) and 64 GB DDR5 RAM (Corsair, Fremont, CA, USA). The operating system applied was Windows 11 Pro (Microsoft Corporation, Redmond, WA, USA).
In this study, we employed Python 3.11 for efficient evaluation and measurement of the models. Additionally, we used machine learning libraries, including scikit-learn [
34]. For a fair assessment of model generalisation, the dataset was divided into 80% training data and 20% test data. SMOTE was applied to only the training dataset, ensuring that synthetic samples did not affect the performance metrics during the test. This approach gave a practical feel for how the models would behave on hidden data. The partitioning technique provides a reliable way to evaluate a model’s generalisation and prediction performance [
53].
6. Discussion
This study reveals vital information about banking sector customer attrition by showing how financial characteristics, demographics, and customer conduct patterns determine client attrition. Account balance is crucial for customer churn prediction, yet the pattern contradicts typical predictions as customers who hold more funds show higher churn rates. Research data demonstrate that traditional beliefs regarding low-balance customers as high-risk have been disproven by the information presented in
Table 2 combined with
Figure 11, which shows that high-balance customers often fail to receive adequate incentives to keep their accounts. Financial institutions should adjust their retention plans through customised financial services, elevated interest rates, and dedicated loyalty rewards for superior customers.
Analysis of categorical features provides a deeper insight into customer behaviour and what causes them to change banks. New South Wales (NSW) stands as the hotspot for client locations, as shown in
Figure 8, which indicates that regional factors play a role in customer turnover rates. The need for banking strategies that address local characteristics becomes stronger since location-specific promotions, improved local services, and organisation partnerships enable better customer relationships. The bar chart in
Figure 9 displays customer data and shows an equal proportion of male and female users; therefore, gender does not cause customers to churn. The evaluation of customer preferences should proceed to identify gender-based service preferences, which could help develop specialised banking solutions.
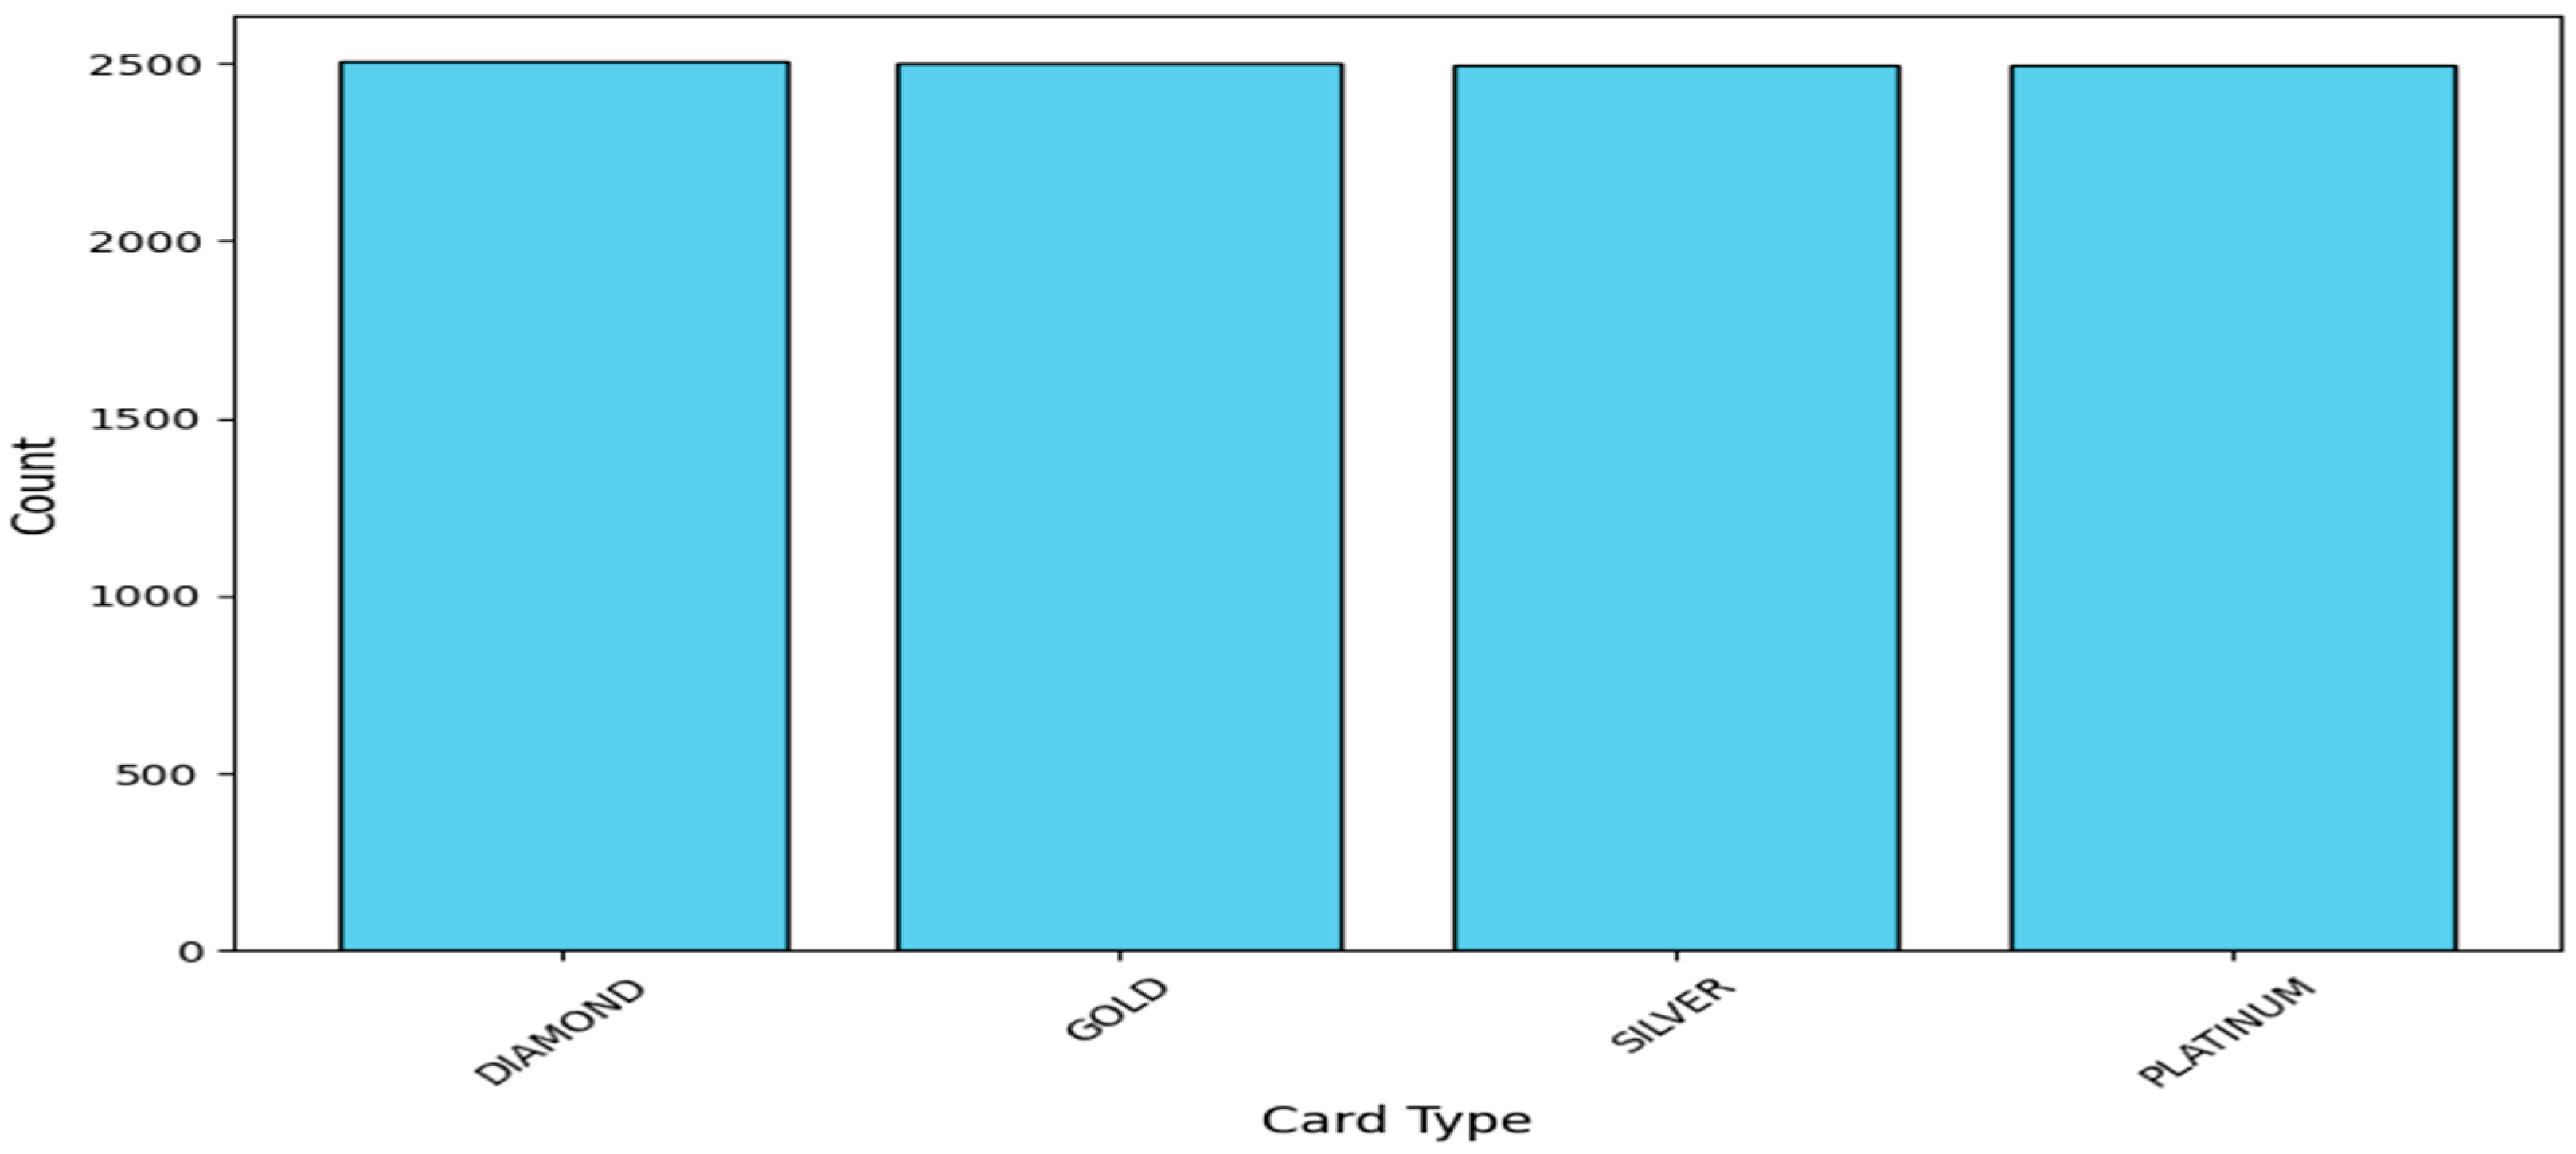
Figure 10 presents vital information regarding loyalty among premium cardholders within diamond, gold, silver, and platinum customer levels. The research demonstrates weak brand commitment from premium customers, for whom existing loyalty initiatives do not present enough worth. Financial institutions need to boost customer interactions through personal finance advancement, better reward system transparency, and member-only privileges to build longer customer relationships.
6.1. Optimising Predictive Modelling for Customer Retention
Predictive model longevity is a key requirement in the case of banking applications that are to be implemented [
64]. The model currently shows excellent predictive skills with historical data, but this may become less true in the face of customer behaviour changes, economic factors, and regulatory changes. Continuous model surveillance and routine retraining are needed for new financial data and population numbers. A rolling window validation helps determine the flexibility of a model and the points of deterioration of its performance [
65]. The model should benefit from dynamically updated techniques such as online learning and transfer learning as they sustain the model’s potency and ability to respond to shifts in banking trends. The model performance should be enhanced by including macroeconomic data points as additional predictive features for market stability [
66].
The substantially challenging part of this study was the meticulous investigation and formative adjustment of machine learning models to guarantee precise and transferable churn prognosis. Though the initial models had shown substantial predictive accuracy, data leakage and class imbalance issues appeared upon closer inspection, which led to an overestimation of performance measures. One of the most significant enhancements was removing feature leakage, which significantly affects the reliability of forecasts. In particular, the complaint feature had an unreasonably strong correlation with the churn target variable and, consequently, became a direct determinant rather than an inferred insight. By taking this out and retuning the model, predictions aligned with actual user behaviour as the model learned from independent patterns, not latent categories. Another significant hurdle was class imbalance, since churners were a minority compared to non-churners, reducing the ability of a model to detect at-risk individuals.
Using the Synthetic Minority Over-sampling Technique (SMOTE) significantly boosted recall and resulted in better identification of churners [
67]. Although precision suffered slightly, the gain in recall ensured that more possible churners were classified correctly, which is essential for real-world banking. GBM’s incremental boosting mechanism effectively captured the intricate, non-linear relationships among financial, demographic, and behavioural attributes. By tuning hyperparameters such as the learning rate, the tree depth, and the number of estimators, the GBM technique provided better predictive performance while remaining robust to hidden data. Although more computationally costly, GBM’s capacity to improve predictions iteratively made it the most suitable choice for this experiment.
6.2. Actionable Insights for Banking Institutions
The findings of this study have immediate strategic implications for banking institutions in maintaining customer retention. Using machine learning models and coupling them with knowledge from the financial, demographic, and behavioural knowledge banks makes data-driven, more effective retention strategies possible. Segmentation-based is the best way to increase retention efforts. For instance, upscale clients (high balance) may need more advanced financial advice, priority banking, and matchless rewards for loyalty to retain their loyalty. More vulnerable, younger, lower-income customers with poor credit records may profit from using financial living education providers and low-income credit-building programmes to develop lasting banking relationships; location-specific high churn requires location specification specifications—brand location-specification specific marketing and location-specific product plans. Moreover, the study shows how important corporate social responsibility (CSR) engagement is for generating customer trust and loyalty. Banks that invest time and resources into appropriate financial literacy initiatives, ethical banking, and community involvement foster their customers’ loyalty, reducing churn rates [
67]. By training frontline banking staff on CSR-equipped services, CSRs are assured that at all touchpoints, customers receive services that fit in with the banking standards that uphold ethics while strengthening customer satisfaction and retention rates in the long run [
68,
69].
6.3. Refining Predictive Modelling for Future Retention Strategies
Younger individuals who are financially vulnerable and have lower incomes and poor credit scores are more likely to switch their banking providers [
70]. Customers who have financial difficulties maintaining enough funds face challenges in managing debt and collecting needed financial services properly. Banks should establish financial literacy and credit-building programs with tailored financial solutions to build long-term banking relationships and improve customer retention among these vulnerable customers. Bank institutions offering microloans at low interest rates, secured credit cards, and personal financial advice help lower-income customers create better credit ratings while growing their confidence in banking institutions. Financial stability and client satisfaction increase due to programmable mobile banking with automatic saving tools, budgets, and debt management.
Organisations serving high-turnover client areas must develop localised retention techniques that understand regional banking patterns and their economic impact on consumer actions. Service availability in underserved areas becomes better thanks to increased branch expansion, more excellent ATM networks, and mobile banking unit deployment. The strength of banking client relationships depends on local marketing strategies, specialised banking products, and locally operated customer service divisions. Local financial literacy programs for specific economic backgrounds require partnerships between banks, nearby corporations, and community organisations with educational institutions. Internet and education collide to reduce customer turnover and increase loyalty between banks while providing sustained access to financial services for different population segments across regions.
7. Conclusions
The study investigates account balance as a significant financial measurement that helps identify bank customer defection probability. Account balance and other economic indicators produce better and more precise detection methods than standard engagement-based techniques for customer churn reduction. Machine learning models such as DT, RF, and GBM were integrated to enhance predictions of real-world outcomes and improve model readability as well as precision. GBM achieved superior predictive results than DT and RF models in the evaluation phase since it has a powerful capability to process non-linear data and handle massive datasets. Synthetic Minority Oversampling Technique (SMOTE) effectively handled class imbalance and boosted the identification of risk customers. The DT, RF, and GBM models were combined to enhance predictions for real outcomes and clarify and increase model accuracy. The framework generates an interpretable, generalisable, scalable churn prediction using feature engineering methods and hyperparameter tuning.
The results confirm the importance of account balance trends in determining what works best to keep customers. Unlike conventional wisdom, high-balance customers demonstrate a higher propensity for churn. Therefore, financial institutions must reassess their retention strategies with targeted incentives, loyalty programs, and monetary services. Also, demographics and regional reasons for churn behaviour were found with categorical feature analysis, pointing toward a requirement for concentrated and suitably regional engagement strategies. Practically speaking, this study gives actionable findings for commercial financial institutions to boost their customer service approach. The findings indicate that banks could divide their customers along financial stability and affordability lines and tailor retention strategies to individual bank clients. For example, high-end consumers should obtain premium financial solutions and investment guidance, while lower-income and younger consumers would require financial education and credit-building tools. Also, corporate social responsibility (CSR) programs—such as best business ethics and community engagement—will build additional customer loyalty.
This research provides a basis for further studies involving extra financial and behavioural factors that could enhance churn prediction models for other reasons. By continuously updating machine learning systems with customer behavioural data, banks are able to maintain high predictive capability and manage churn risk actively. Interpretable AI techniques lead financial entities to develop successful retention methods that maintain stability while satisfying long-term customers.


 ,
, 