Article

Voice-AttentionNet: Voice-Based Multi-Disease Detection with Lightweight Attention-Based Temporal Convolutional Neural Network

1
PAMI Research Group, Department of Computer and Information Science, University of Macau, Taipa, Macau SAR 999078, China
2
School of Computer Engineering and Science, Shanghai University, Shanghai 200444, China
3
Centre for Artificial Intelligence and Robotics, Institute of Collaborative Innovation, University of Macau, Taipa, Macau SAR 999078, China
*
Author to whom correspondence should be addressed.
Submission received: 31 December 2024 / Revised: 2 March 2025 / Accepted: 24 March 2025 / Published: 28 March 2025
(This article belongs to the Section Medical & Healthcare AI)

Abstract

Voice data contain a wealth of temporal and spectral information and can be a valuable resource for disease classification. However, traditional methods are often not effective in capturing the key features required for the classification of multiple disease classes. To address this challenge, we propose a voice-based multi-disease detection approach with a lightweight attention-based temporal convolution neural network (Voice-AttentionNet) designed to analyze speech data for multi-class disease classification. Our model utilizes the temporal convolution neural network (CNN) architecture to extract high-resolution temporal features, while incorporating attention mechanisms to highlight disease-related patterns. Extensive experiments have been conducted on our dataset, including speech samples from patients with multiple illnesses. The results show that our method achieves the most advanced performance with an average classification accuracy of 91.61% on six datasets and is superior to the existing classical models. These findings highlight the potential of combining attention mechanisms with temporal CNNs in the use of speech data for disease classification. Moreover, this study provides a promising direction for deploying AI-driven diagnostic tools in clinical scenarios.

1. Introduction

With the aging of the human population and its strain on medical resources, modern medicine needs to accurately identify diseases within a short time in order to provide timely and effective treatment options for patients while reducing stress on the healthcare system [1]. In this context, the rapid development of artificial intelligence and deep learning technologies has provided new possibilities for precision medicine and early disease warning [2]. At the same time, in the face of a variety of complex and diverse disease types, Artificial Intelligence (AI) uses its efficient and objective calculations along with reasoning to help us accurately identify and judge diseases [3]. AI not only affects the way patients diagnose diseases, it also affects the entire medical field. The question of how to better combine AI and health care has become a research hotspot for the future [4]. Traditional diagnostic methods, such as imaging tests (including X-rays, Computed Tomography (CT), Magnetic Resonance Imaging (MRI)) and blood tests, have made significant progress in many areas, but still face several limitations. Firstly, these methods tend to be costly and require long inspection and processing times. Secondly, many diagnostic technologies rely on specialized medical equipment and high-level medical personnel to operate them, resulting in limited popularity. These problems are crying out for more efficient and convenient alternatives.
Against this background, voice detection provides a non-invasive and effective method for identifying and diagnosing various diseases. The human voice is formed by complex physiological structures, neural processes, and respiratory processes, and it carries rich information about an individual’s voice, such as the pitch, timbre, and volume [5]. Voices contain a time-series feature, which has wide application in many fields, such as human activity recognition [6], emotion detection [7], and emotional style transfer [8]. In the area of healthcare, voice information can provide valuable judgments about an individual’s health status and can reflect the presence of multiple diseases. Parkinson’s disease (PD) is a neurodegenerative movement disorder [9] and its core symptoms include tremor, stiffness, and bradykinesia [10]. Dysarthria (such as dysphonia and hoarseness) is often associated with Parkinson’s disease (PD), and these speech problems may appear early in PD or even in the prodromal phase [11]. Liver complaint can induce neurological complications, which leads to language impairments, including speech fluency and phrase construction impairments [12,13]. Lung disease may disrupt the function of the anatomy associated with vocalization, resulting in abnormal or distorted sound quality [14,15,16]. Sinus arrhythmia is related to respiratory patterns [17,18], and it can impact the neural regulation of auditory pathways related to speech, vital for both perceiving and producing speech [19]. Thyroid disease affects the growth and development of sound structures and thus influences pitch, voice, and vocal range [20,21]. These medical studies prove that these diseases are directly or indirectly related to voice, and provide a theoretical basis for voice analysis to detect these diseases.
Although sound-based disease diagnosis research has made some progress, it still faces many challenges in multi-disease classification. The first is the complexity of the sound feature extraction. The sound manifestations of different diseases may overlap. The question of how to accurately extract and distinguish these subtle differences is a difficult problem. The second is insufficient data samples. Effective sound classification models rely on a large number of high-quality labeled data. However, in practical applications, especially for some rare diseases, the sound data may be relatively small, resulting in the risk of overfitting (the trained model).
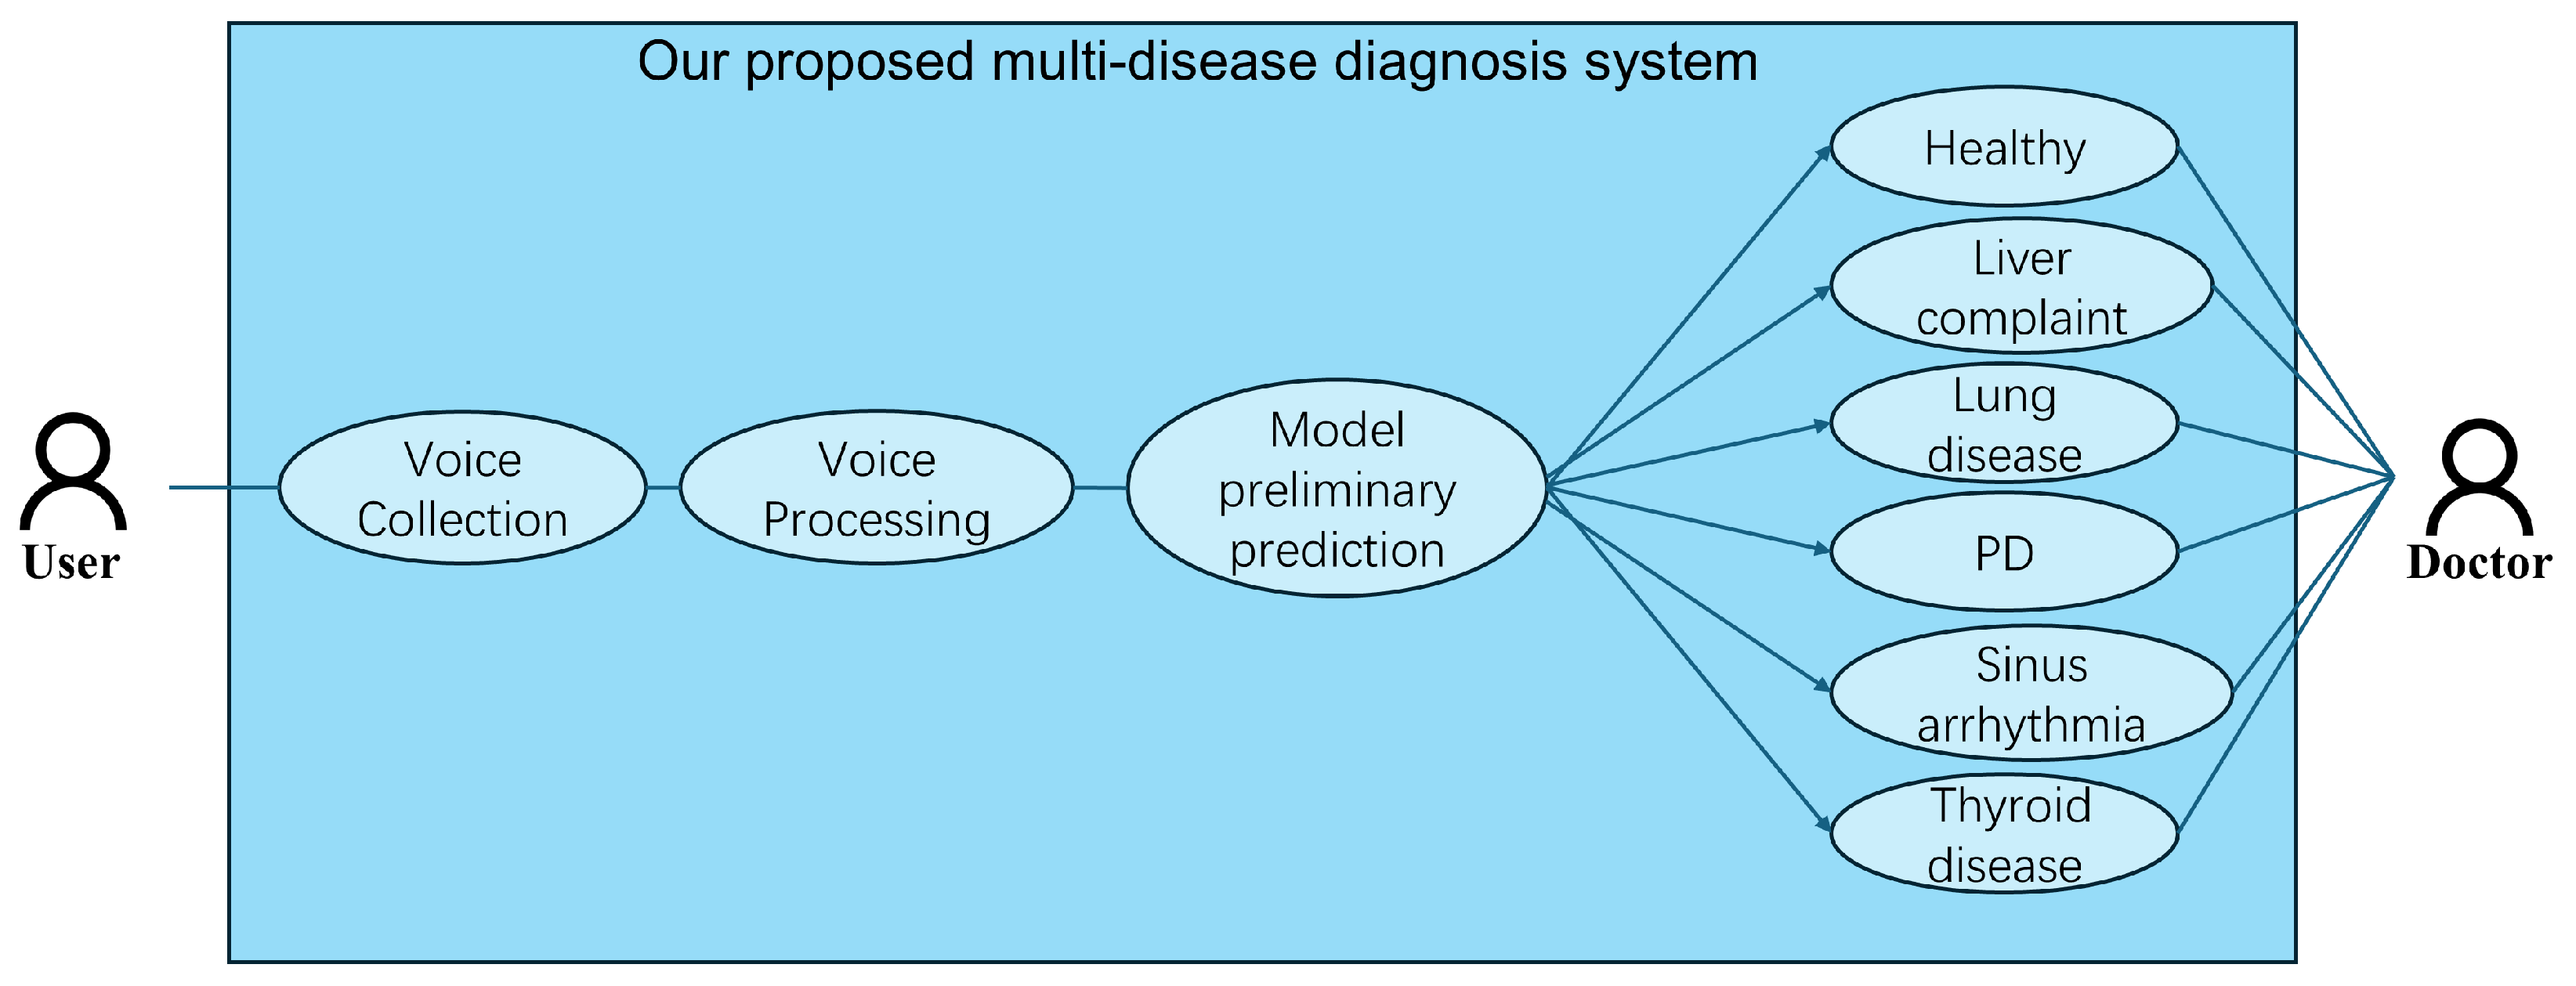
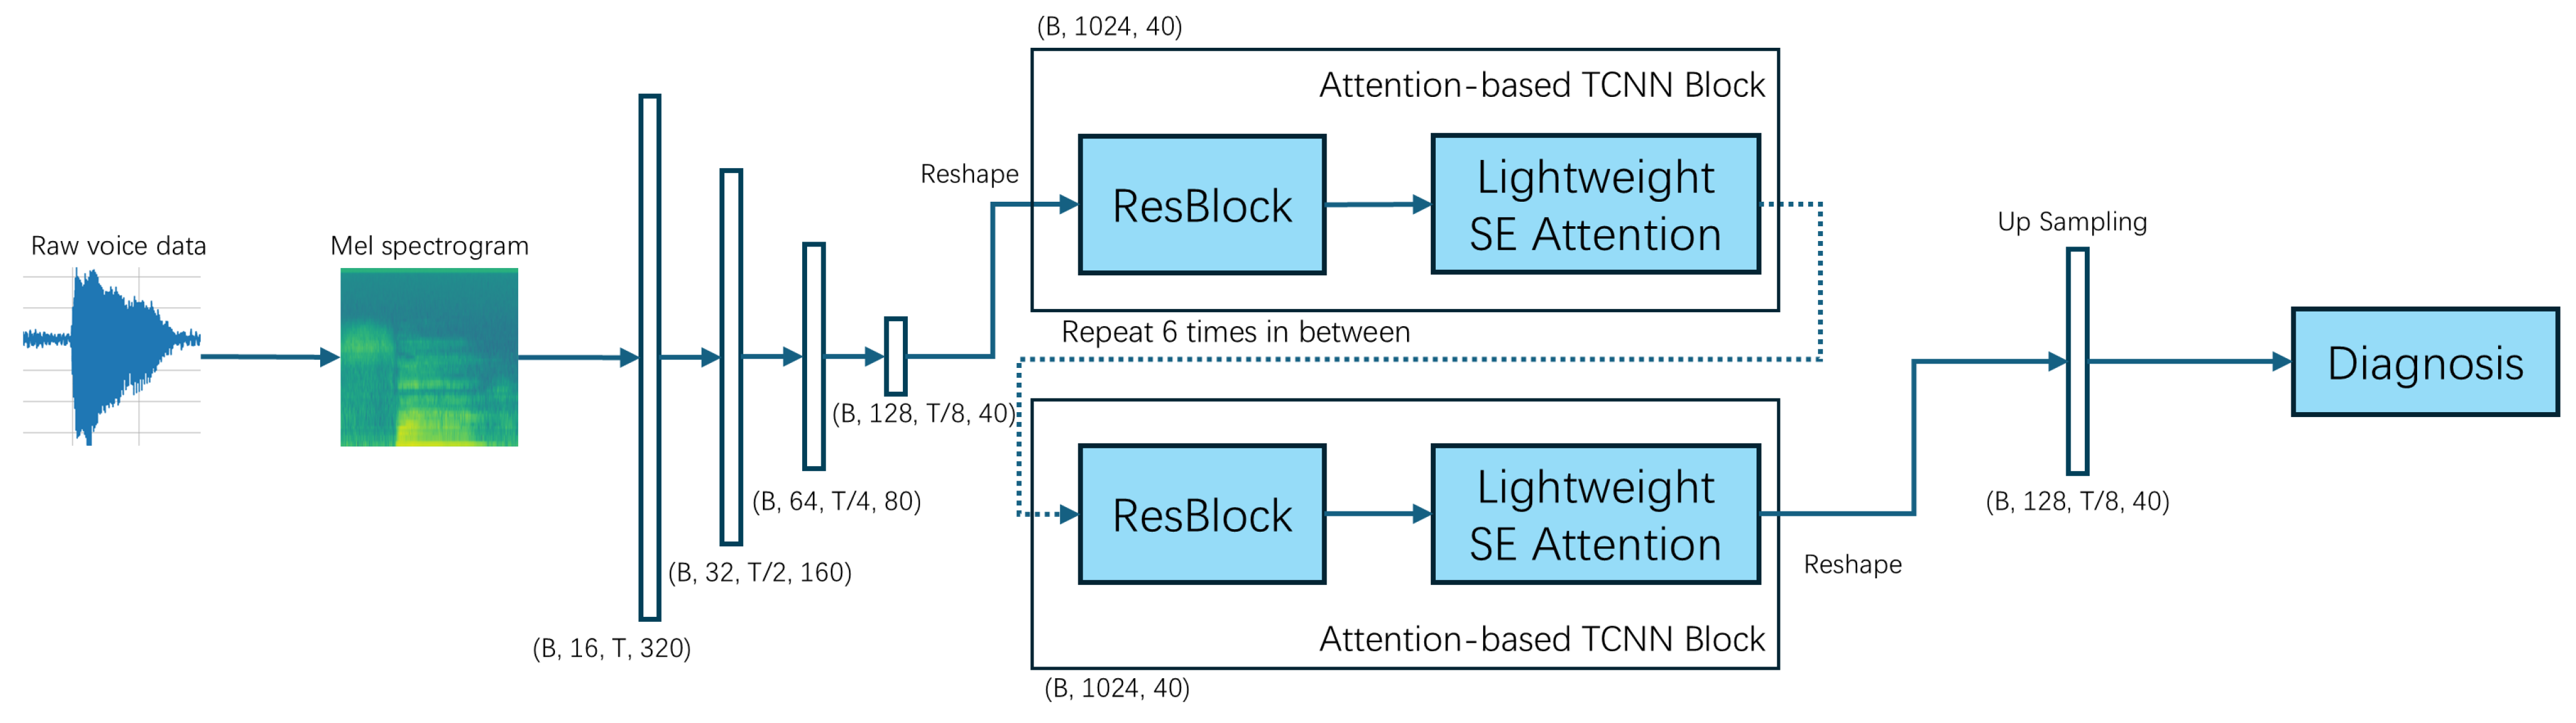
To resolve these issues, in this paper, we hope to realize an efficient and accurate multi-disease classification system and promote the application of sound detection technology in clinical practice. We propose a Lightweight Attention-Based Temporal-CNN model (Voice-AttentionNet) for multi-disease classification. Through deep learning techniques, more representative sound features are extracted to better capture subtle differences in different diseases. Compared with traditional CNNs and Recurrent Neural Networks (RNNs), Temporal-CNN can efficiently capture local patterns in time series data, reduce recursive dependencies in sequence processing, and significantly improve the computation speed. Furthermore, as the traditional CNN usually captures only local patterns, with the attention mechanism (in the proposed method), the model can dynamically adjust the attention degree of the framework to different time step features, so as to improve the modeling ability of key time points, improving the recognition ability of pathological features in voice. To sum up, the main contributions of our work are shown as follows:
  • We proposed a Lightweight Attention-Based Temporal-CNN model (Voice-AttentionNet), which combines the ability of time series local feature extraction and global dependent modeling to improve the recognition ability of pathological features in speech. The results show our proposed method has promising performance in voice-based multi-disease classification.
  • We introduced a novel voice-based loss specifically for supervising our proposed Voice-AttentionNet in multi-disease detection with voice data. In the voice-based loss, superiorities from multiple losses were fully considered to optimize the model from different perspectives (overall performance, hard-to-detect voice samples, and regularization effect). The voice-based loss improves the generalization ability of the model and performs well in the case of class imbalance in the dataset.
  • We performed extensive experiments with comprehensive metrics to evaluate the effectiveness of the proposed Voice-AttentionNet for multi-disease detection with voice data.

2. Related Work

In this section, we explore machine learning methods and deep learning methods for disease classification using voice data.

2.1. Machine Learning Methods

The analysis of vocal features through machine learning to classify disease is a very promising medical assisted diagnosis technology. A person’s vocal signature may contain potential biomarkers for many diseases, such as lesions related to vocal cords, the respiratory system, the nervous system, or cognitive function [22]. Recent studies have explored various approaches to optimize this technology. Lamba et al. [23] applied the best combination of feature selection methods and classification algorithms, with their model performing well in the quasi-equilibrium problem for PD diagnosis. While their model achieved impressive performance in PD diagnosis under quasi-equilibrium conditions, its effectiveness in real-world environments with uneven data distribution remains to be verified. Senturk et al. [24] adopted corresponding feature selection and classification according to voice characteristics, focusing on feature importance and recursive feature elimination, helping identify sound biomarkers and improve the interpretability of models. However, the computational complexity of their approach may limit its application in real-world scenarios. Aich et al. [25] discovered that their feature set based on the genetic algorithm performed well in distinguishing between PD and a healthy group. Although this method optimizes feature selection effectively, it requires a lot of computational resources and complex parameter tuning to avoid local optimality. Almeida et al. [26] used a variety of feature extraction techniques and machine learning methods to classify PD. They applied five indexes to evaluate the classification performance. That being said, the complexity of multiple feature extraction techniques may bring challenges to real-world diagnostic scenarios. Ali et al. [27] proposed multiple types of machine learning models for comparison and employed different criteria for the evaluation of PD. While this comprehensive comparison provides valuable insights into model selection, there is a lack of standardization of assessment metrics across different studies.
Machine learning is not only widely used in the detection of Parkinson’s disease, but also shows potential in the detection of other diseases. Gonzalez-Moreira et al. [28] adopted a new method to extract prosodic features and achieved good performance in classifying mild dementia. Even though their approach demonstrated the validity of prosodic features in dementia detection, the study was limited by a relatively small sample size and did not address situations with different linguistic and cultural backgrounds. At the same time, prosodic features can be affected by various external factors, which may affect the robustness of the classification. Nasrolahzadeh et al. [29] applied multiple classifiers and bi-spectral analysis to diagnose Alzheimer’s disease (AD) with a high accuracy at all stages. Although their multi-classifier approach shows robustness in different AD phases, the computational complexity of bispectral analysis can lead to increasing computational efforts, limiting its real-world applications, where the approach requires high-quality speech recording in a controlled environment. Al-Hameed et al. [30] extracted several acoustic features and trained several classifiers to distinguish neurodegenerative disorders (NDs) and Functional Memory Disorder (FMD) based on these features, showing that their model performs well with low computational cost. The advantage of their approach is that it focuses on computational efficiency; however, relying solely on acoustic features may limit the model’s ability to capture other relevant aspects of the disease. Gao et al. [31] extracted the speech features of subjects in different periods, establishing the models of these features along with fatigue degree, demonstrating the high efficiency of these models. The benefit of this approach is its ability to combine time variations and fatigue levels, which is crucial for understanding the progression of certain diseases. However, this method may be sensitive to environmental noise, and individual differences in fatigue performance patterns need to be considered to ensure that the model is still valid in different scenarios.

2.2. Deep Learning Methods

Due to the highly complex patterns and nonlinear characteristics of voice data [32,33], it is difficult for machine learning methods to capture sound features comprehensively, thus affecting the expression of the model. Meanwhile, machine learning has not been sufficiently utilized when it comes to the timing signal information of voice data. Therefore, more and more research has paid attention to deep learning methods.
Deep learning can effectively extract and analyze hidden information in complex voice signals for disease detection and classification. Quan et al. [34] explored the application of static and dynamic speech features in the detection of Parkinson’s disease. Here, the bidirectional long short-term memory model was used, and the results were superior to the traditional machine learning model based on static features. Their method benefits from the advantage of being able to capture time series in vo signals, providing a more comprehensive analysis. However, the complexity of the model may require a lot of training data and computational resources. Nagasubramanian et al. [35] proposed a DMVDA model, which combined the characteristics of deep neural networks (DNNs) and recurrent neural network (RNN) models. Their proposed model showed good performance in the detection of Parkinson’s disease. The hybrid architecture takes advantage of the feature extraction capability of DNNs and the time modeling advantage of RNNs to improve the detection accuracy. However, the integration of multiple neural network architectures can increase the complexity and training time of the model, while also requiring adjustment of hyperparameters to prevent overfitting. Rehman et al. [36] used a variety of sampling techniques to extract more effective sound features and proposed a model based on long short-term memory networks (LSTMs) and Gated Recurrent Unit (GRU). Their approach better handles long-term and short-term dependencies in the data by combining LSTM and GRU networks. That being said, the multi-sampling technique requires more preprocessing steps and the model can be sensitive to the quality of the input audio recording. Saltos et al. [37] mainly focused on the tonal characteristics of sound and proposed a new CNN structure for detecting Parkinson’s disease. Their model is well suited for capturing tonal changes in speech associated with a Parkinson’s diagnosis. Here, the model focuses primarily on tonal features and may miss other important acoustic features, potentially affecting its overall accuracy. Eguchi et al. [38] developed a transformer model based on DNN to distinguish between PD and spinocerebellar degeneration (SCD). The self-attention mechanism of the transformer architecture can effectively capture long-term dependencies in voice data that can enhance its ability to distinguish similar neurological disorders. However, transformers typically require large datasets and a lot of computing resources, which may limit real-world use.
In addition to Parkinson’s disease, deep learning has a wide range of applications in the detection of other diseases. Dar et al. [39] proposed an HBO-DNFN model to detect COVID-19, which used the HBA optimization algorithm. The performance of the model was evaluated via several indexes, and the robustness and accuracy of the model were verified. That being said, the complexity of HBA optimization algorithms and the need for large training datasets may pose challenges for practical applications. Agbavor et al. [40] applied a pre-trained data2vec model and optimized it, with their proposed model showing good results on the ADReSSo dataset [41] for Alzheimer’s disease detection. This approach benefits from transfer learning to reduce training time and data requirements, but the interpretability of the model remains a problem. Pérez-Toro et al. [42] mainly focused on ForestNet to evaluate Alzheimer’s disease by analyzing the interpretability of some extracted features. This emphasis on interpretability is particularly valuable for clinical applications; nevertheless, the performance of the model may be slightly lower. Lin et al. [43] proposed a deep learning model based on DepAudioNet [44], where the results showed some indication in early diagnosis of depression in older adults. This model offers some potential for early detection, yet its effectiveness may be limited by recording quality and ambient noise. Dang et al. [45] proposed a surveillance system to monitor COVID-19 progress. Although the system has real-time monitoring capabilities, it relies on a data collection infrastructure, which can pose challenges for implementation in resource-limited areas. Ye et al. [46] combined CNN and LSTM models in a hybrid model to detect post-stroke dysarthria (PSD). This hybrid approach takes advantage of the strengths of both architectures, but can also result in longer training times and higher computing requirements.

3. Materials and Methods

3.1. Overall Framework

Figure 1 shows the overall framework of our proposed multi-disease diagnosis system. The system can be divided into two main parts, data preparation and model development. Data preparation includes voice acquisition and data processing. For the data acquisition part, we used a soundproof room containing hardware such as a sound card, microphone, and computer (more details concerning the equipment are shown in [47]). For the data processing part, the main task is to simplify the raw data and extract valid information, and we discuss the details of this process in the next subsection. Model development includes model training, model validation, and model evaluation, with these being elaborated in the section on the experiments.

3.2. Use Case

In order to better demonstrate the application of our model in actual scenarios, we will further introduce its use case in Figure 2. Our proposed multi-disease diagnosis system will first collect the patient’s voice, where the system will process raw voice data and input the processed data into our model to make a preliminary prediction. Our model can initially determine five major categories of diseases, which include liver complaint, lung disease, PD, sinus arrhythmia, and thyroid disease. Finally, the doctor will refer to the preliminary prediction results of our model and make a final diagnosis.

3.3. Data Processing

The raw audio is a time-domain signal. Here, the data length is proportional to the sampling rate and the audio length. The raw data of audio signals are numerous and complex; however, the Mel spectrogram compresses high-dimensional raw data into a fixed-size two-dimensional matrix (time × frequency), drastically reducing the data dimension while retaining most of the meaningful information. We use the Mel frequency instead of the Hertz frequency, where the conversion formula is given as follows:
m e l = 2595 · log 10 1 + f 700
f = 700 · 10 m e l 2595 1
Mel frequency is closer to human auditory perception, with high resolution in the low-frequency region (small interval) and low resolution in the high-frequency region (large interval), providing a more nuanced resolution in the low-frequency region, preserving perceptually important information, and highlighting key features of the speech signal. We set 64 Mehr filter channels, each channel representing a frequency interval, and the frequency gradually increases from the bottom to the top, so as to simulate the hearing characteristics of the human ear in this distribution mode. A waveform and Mel spectrogram for healthy and diseased people are illustrated in Figure 3, respectively:

3.4. Voice-AttentionNet

3.4.1. Temporal-CNN

Temporal-CNN (TCNN) [48] has some unique advantages when dealing with time series data. Traditional CNNs are mainly used for static image data processing, usually processing two-dimensional spatial data (width × height). That being said, however, temporal CNNs considers the time dimension, using convolution operations to slide along the time axis to capture timing patterns and dynamic features in time series. For this type of data, additional structures such as recurrent neural networks (RNNs) or long short-term memory networks (LSTMs) may need to be added to model time series dependencies for traditional CNNs, which increases the complexity and training difficulty of the model. However, temporal CNNs extract timing features directly through convolution operations without additional timing modeling modules such as RNN or LSTM. Therefore, temporal CNNs generally have fewer parameters and higher training efficiency than CNN models.
In order to better adapt to the task of classifying diseases on small datasets, we make some modifications. We reduce the original number of convolution layers (from 7 to 4), and simplify the upsampling process. In doing so, we preserve the performance and reduce computation. We extensively employed regularization strategies (Dropout) to improve the model generalization, and adopt a more modern activation function Gaussian Error Linear Unit (GeLU) to improve the nonlinear representation. Furthermore, we add an attention mechanism to improve the feature extraction capability of the model. The details of the attention mechanism will be discussed in the next subsection. The structure of our proposed model is illustrated in Figure 4:

3.4.2. Attention Mechanism

We proposed a lightweight SE (Squeeze-and-Excitation) attention mechanism that is suitable for one-dimensional signals (refer to Figure 5). Compared with the traditional SE module, our designed module greatly reduces the computational effort and avoids excessive computational overhead. The lightweight SE module dynamically adjusts the weight of each channel based on the input data. This means that for each input sample, the model can reassign the importance of channels according to the characteristics of that sample, further enhancing the feature representation ability. Using GeLU instead of the traditional Rectified Linear Unit (ReLU) activation function can provide better training stability and effectiveness, especially in deep networks, where GeLU helps retain more information and reduces the problem of gradient disappearance. The SE attention mechanism helps the model pay more attention to the features that are useful to the task and enhance the network’s ability to learn important patterns, thus improving the performance of the model. In general, the lightweight SE focuses on structural optimization and simplification on the original SE mechanism, such that it can guarantee a certain performance improvement, but also reduce the computational complexity.

3.5. Loss Functions

A loss function is mainly used to measure the difference between the model’s prediction results and its true value. In complex tasks, a single loss will limit the performance of the model. By combining multiple loss functions, different objectives can be optimized at the same time to better maximize the model. We designed additional combinations of loss functions, including Cross-Entropy Loss, Focal Loss, and Label Smoothing Loss.

3.5.1. Cross-Entropy Loss

Cross-Entropy Loss is a loss function often used in classification problems, especially multi-class classification problems. However, in the case of unbalanced classes, the cross-entropy loss may be biased towards classes with a larger proportion of predictions, resulting in inaccurate predictions for a few classes. In our proposed voice-based multi-disease detection architecture, the Cross-Entropy Loss can be expressed as follows:
L C E = c = 1 C y ˜ c log e x p y p j C e x p y j
where C represents the number of diseases in our dataset, y ˜ c represents the value of the ground truth label of the c t h class, and y p represents the prediction score of the positive disease class.

3.5.2. Focal Loss

Focal Loss is particularly suitable for dealing with class imbalance problems. It automatically reduces the weight of the easy-to-classify samples and increases the weight of the hard-to-classify voice samples. This helps the model learn features of minority classes better. In this case, the Focal Loss is expressed as follows:
L F L = c = 1 C 1 y c γ y ˜ c log y c
where γ is the focusing parameter for reducing the influence of corrected-classified voice samples and y ˜ c represents the value of the ground truth label of the c t h class.

3.5.3. Label Smoothing Loss

Label Smoothing prevents model overconfidence by softening hard labels. This regularization technique can improve a model’s generalization ability and reduce the risk of overfitting. We write the label smoothing loss via the following Equation (5):
L L S = c = 1 C 1 C 1 C δ log y c + δ C k C log y k
where δ gives the hyper-parameters.
In general, we comprehensively consider the overall performance, hard-to-classify voice samples, and model generalization by introducing the voice-based (Equation (6)) loss as follows:
L V = μ L C E + λ L F L + ξ L L S
where μ , λ , and ξ are the weights in the three losses, respectively, and the sum of δ , λ , and ξ is 1.

4. Experiments and Results

In this section, we describe extensive experiments we conducted to evaluate our proposed method and compare it with common methods. In order to ensure the representativeness and persuasiveness of the experimental comparisons, a large number of subjective and objective analyses were conducted—showing the performance and effect of the model through diagrams and charts, and evaluating the performance of the model through quantitative indicators. In addition, we also conducted an extended test to evaluate the efficiency of the model.

4.1. Datasets

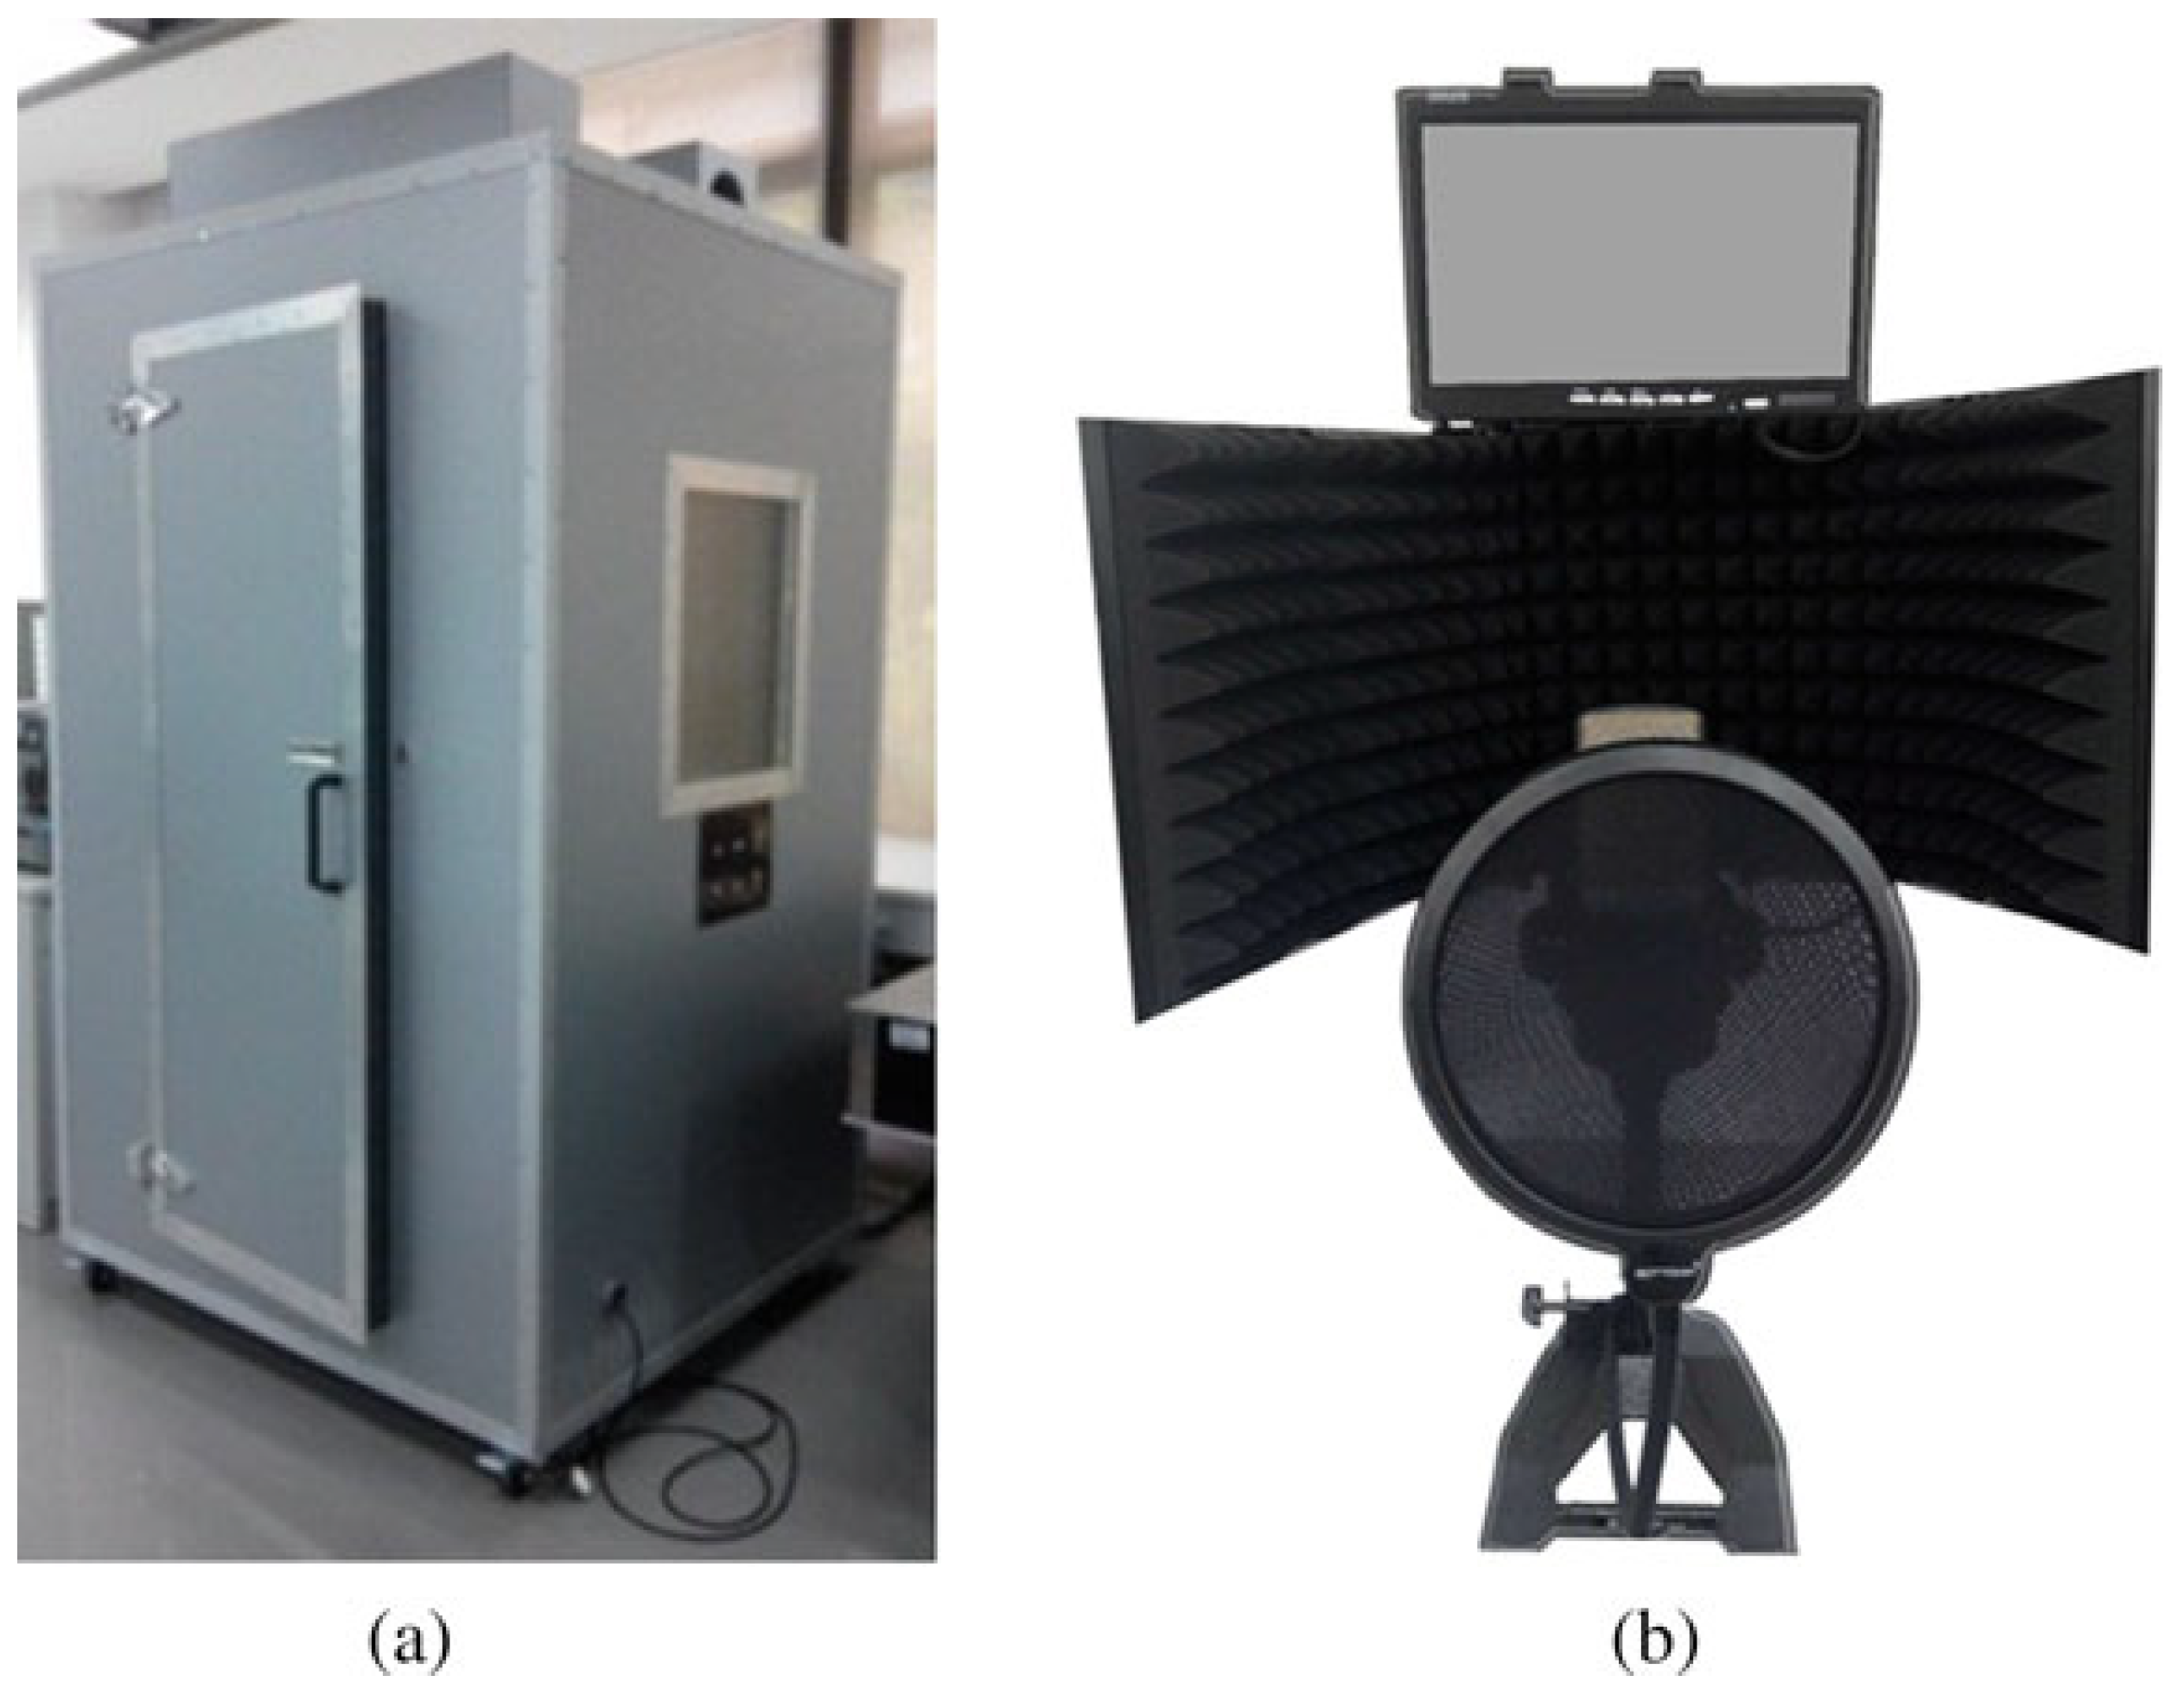
In this study, we used 6 different datasets, with 5 disease datasets (liver complaint, lung disease, PD, sinus arrhythmia, and thyroid disease) and a dataset with healthy individuals. All voice signals in the datasets were captured using the acquisition system [47] (refer to Figure 6) from the Guangdong Provincial Hospital of Traditional Chinese Medicine, Guangzhou, China.
Altogether, there are a total of 892 cases (in the datasets). Specific to each category, we have 446 healthy cases, 253 liver complaint cases, 42 lung disease cases, 29 PD, 49 sinus arrhythmia cases, and 73 thyroid disease cases. Each case has about 40 voice samples, and each voice sample is about two seconds long. 
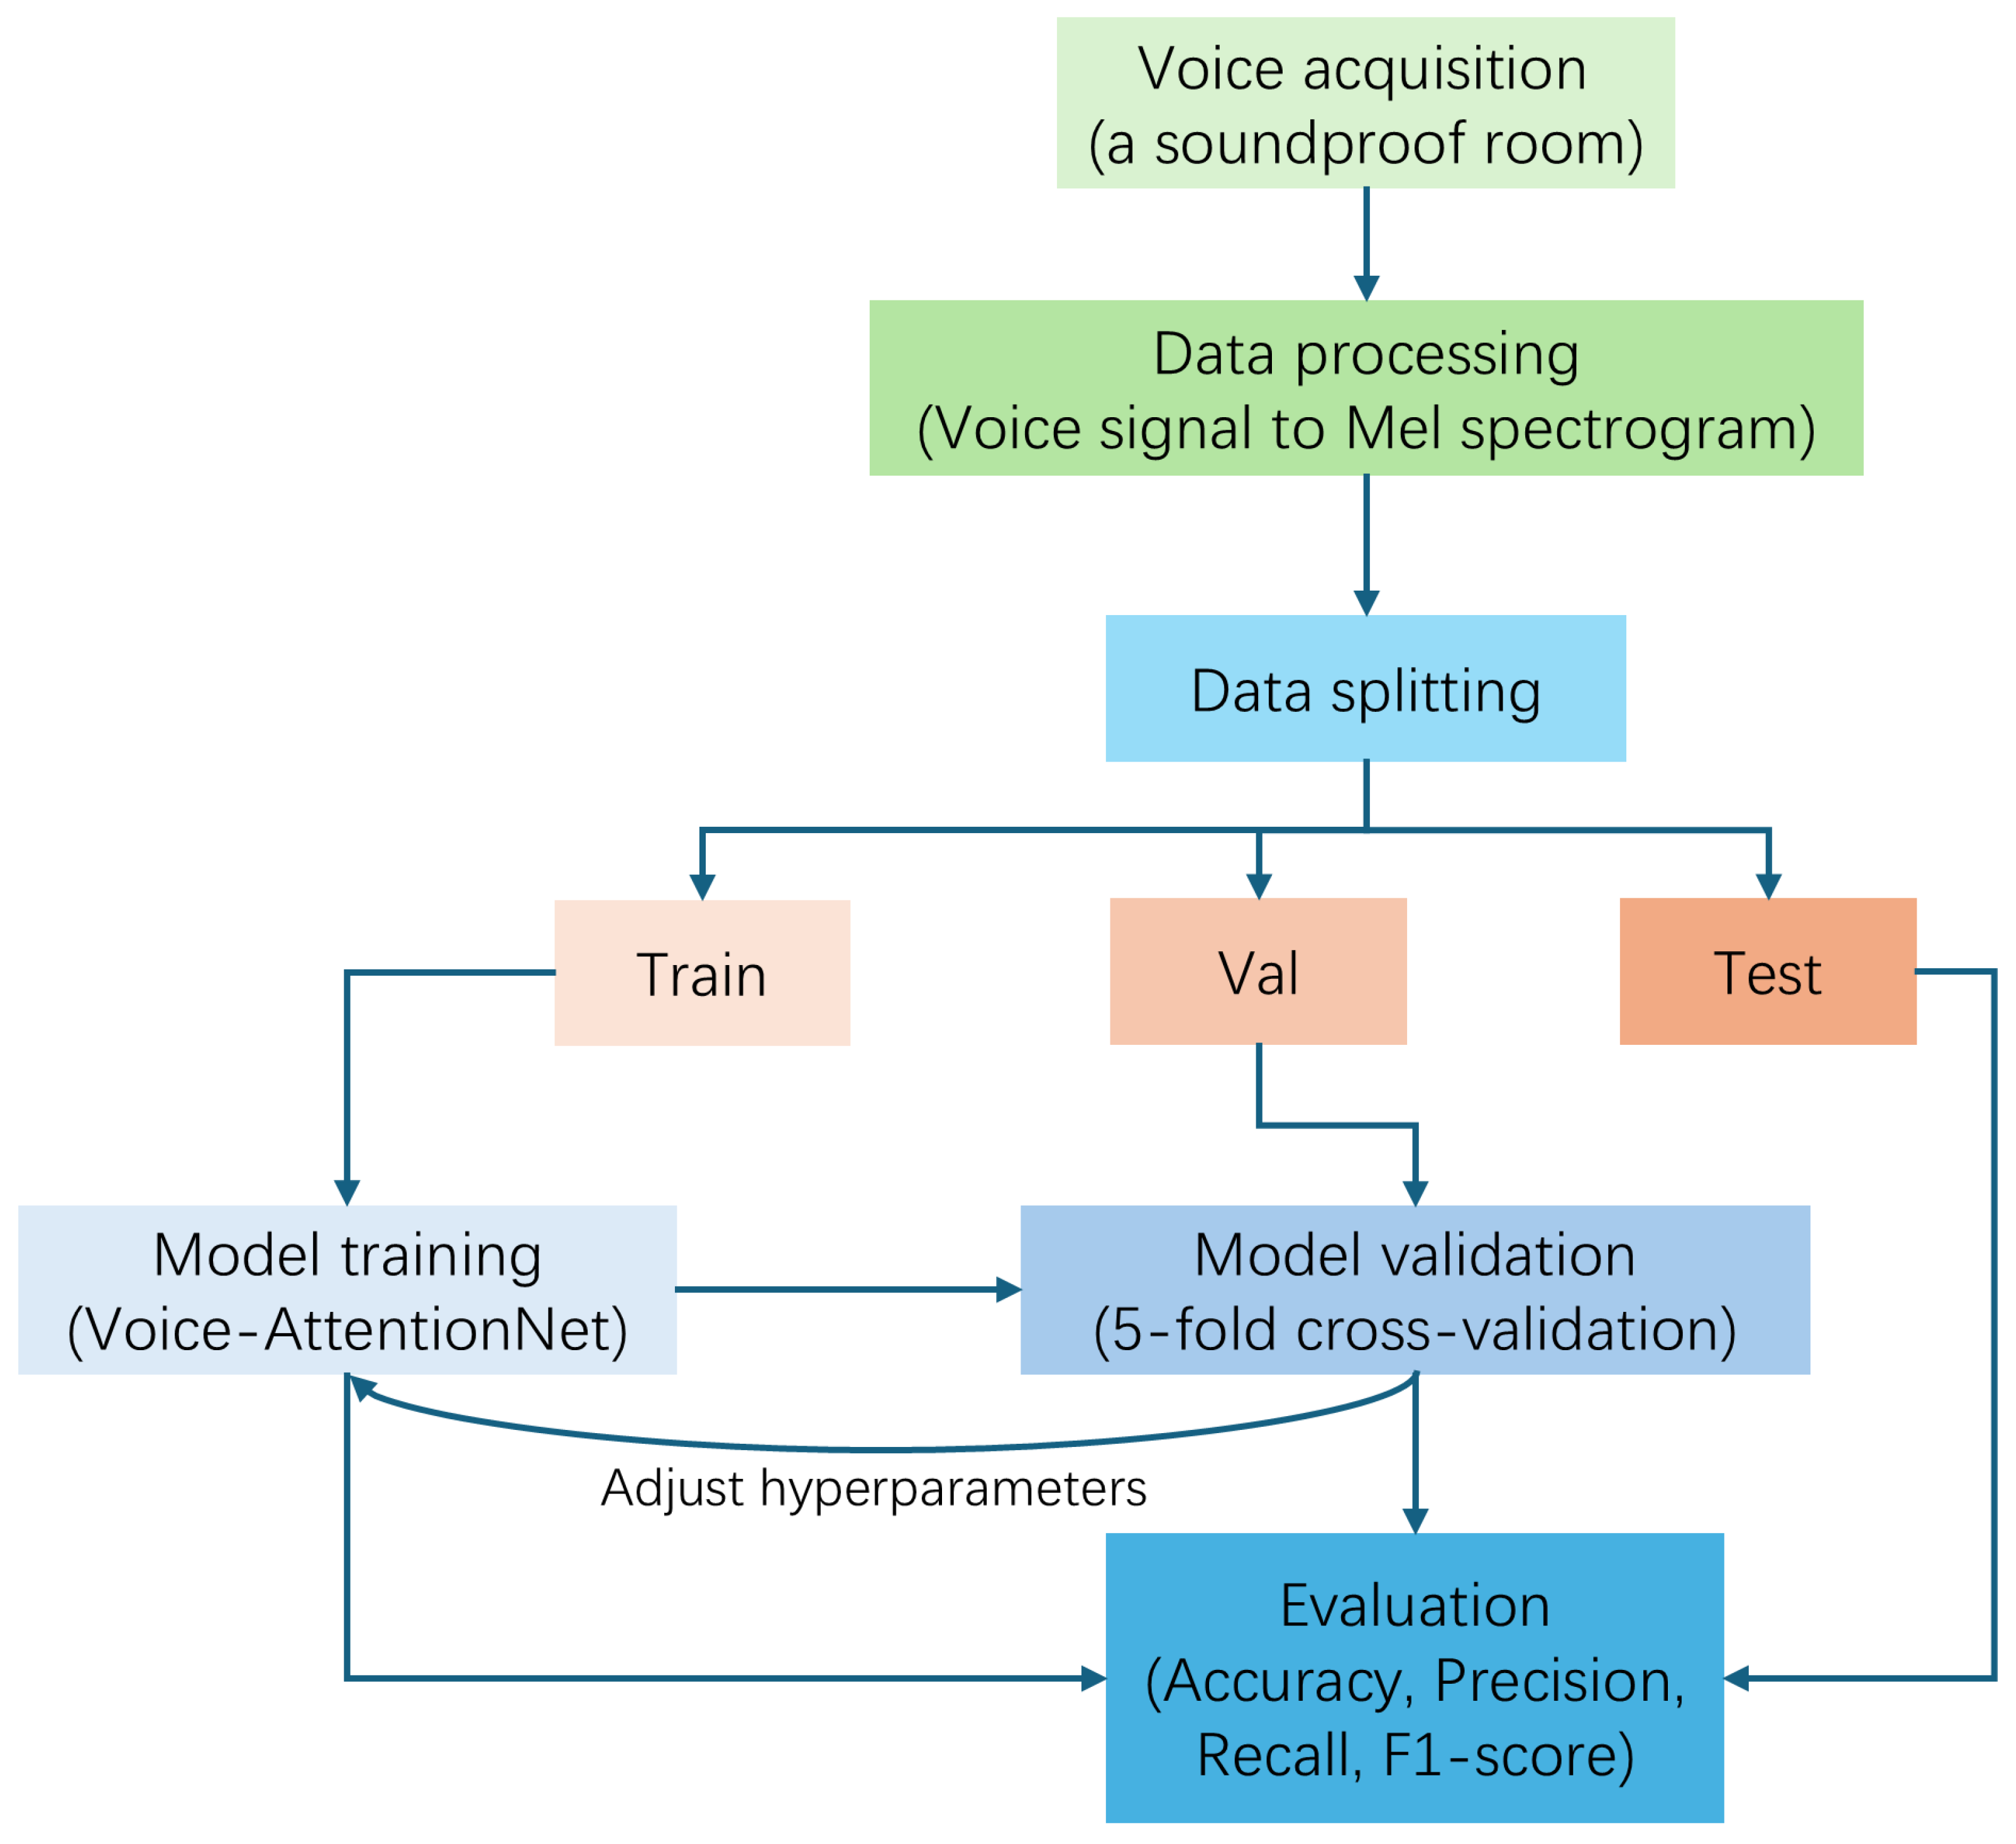
Table 1 shows the label distribution for cases and samples. Audio files were recorded at a 192 kHz sampling frequency and 32-bit depth. In the real world, due to the cost of equipment and time, for the diagnosis of diseases, we can only collect a small snippet of the patient’s voice. Therefore, we decided to use each voice sample as the input for training, and predict each sample’s category instead of the case’s category. Since the data distribution is uneven, in order to have a more comprehensive and stable evaluation of the model’s performance, we adopted 5-fold cross-validation, which can reduce the chance of error by averaging multiple validation results and make the performance evaluation more representative. We assigned 20% of the total dataset to the test set, and 20% of the remaining dataset to the validation set (see Table 2). Because the category data are unbalanced, a few diseases were placed together in broad categories (for more details, please refer to Appendix A.1).

4.2. Evaluation Protocols

Accuracy = TP + TN TP + TN + FP + FN
Precision = TP TP + FP
Recall = TP TP + FN
F 1 - score = 2 × Precision × Recall Precision + Recall
Accuracy is defined as the proportion of samples that are correctly predicted by the model of the total samples. Precision is defined as the proportion of actual positive samples among all samples predicted by the model to be positive. Recall is defined as the proportion of samples that are correctly predicted as positive among all samples that are actually positive. The definition of F1-score is the harmonic average of precision and recall, which comprehensively balances the two, and TP, FP, TN, and FN correspond to true positive, false positive, true negative, and false negative, respectively.

4.3. Implementation Details

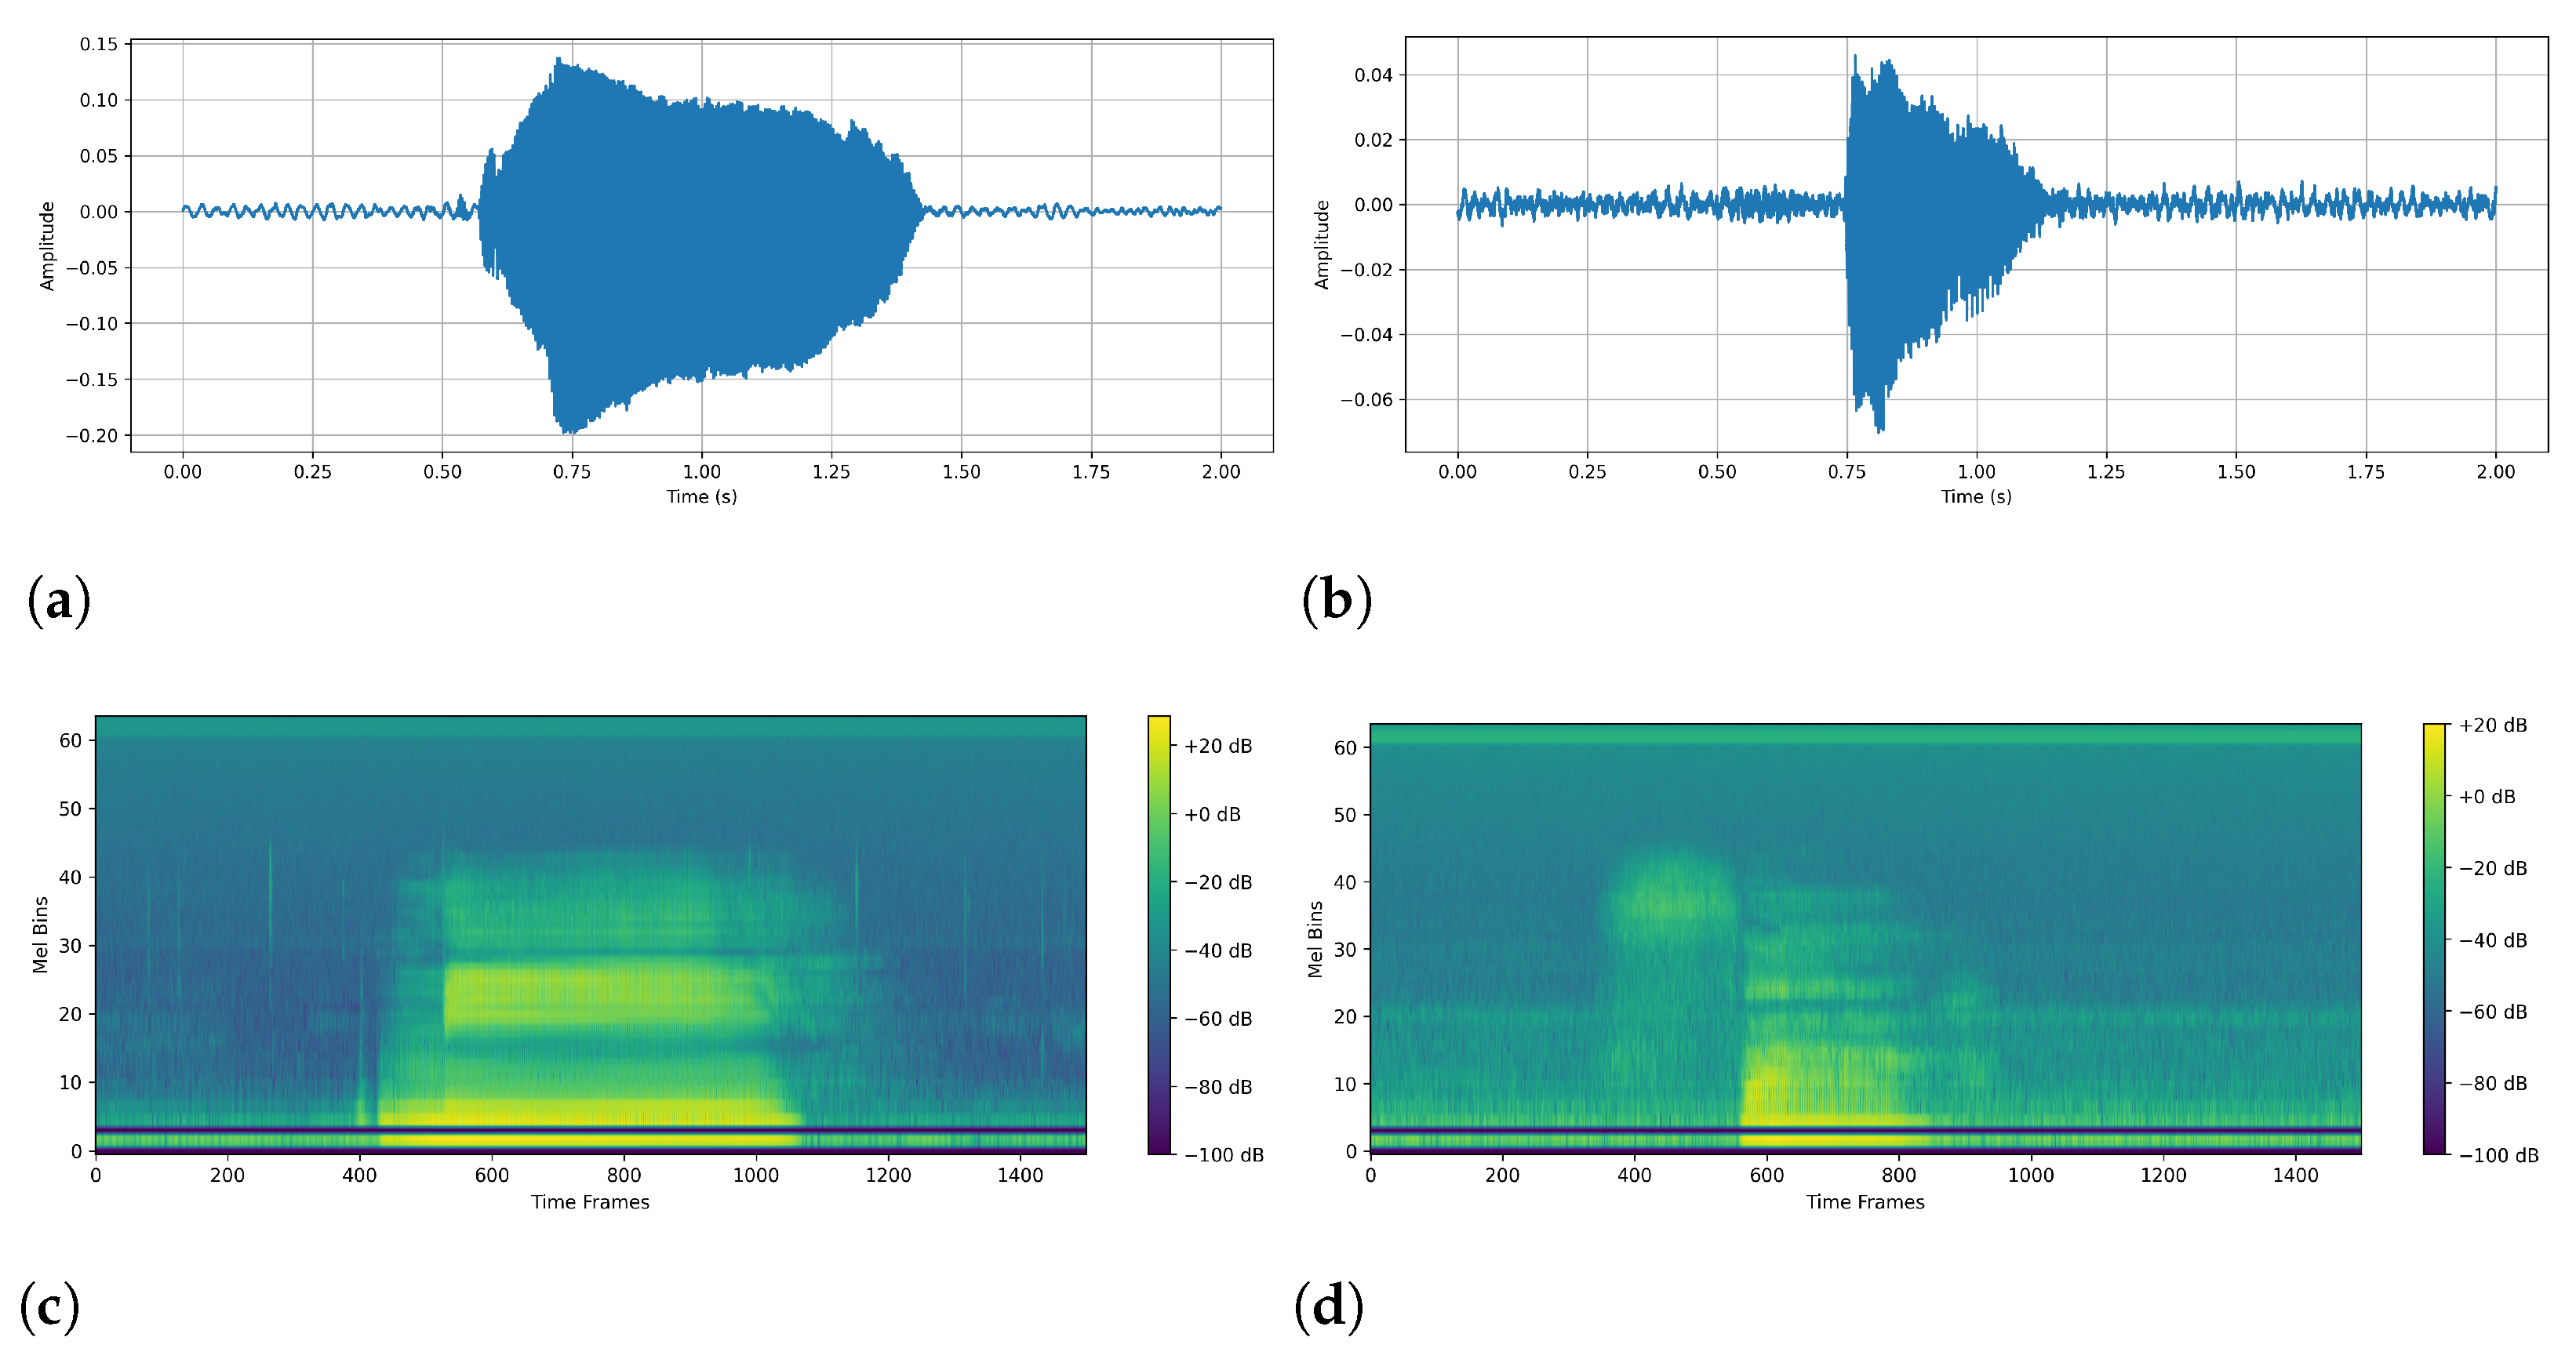
Data Preprocessing: The original data were in .wav format, and we used torchaudio to load each audio file. Then, to ensure the same sampling rate, we unified all audio to a 192 kHz sampling rate. The next step was to ensure that the audio length was uniform. Here, we set the uniform audio length to 2 s (384,000 sampling points). If it was too long, it was cut from the middle, and if it was too short, we applied zeros on both sides. To ensure a fair comparison in the following experiments, we set the same parameters to generate a Mayer spectrogram chart: FFT window size: 1024; steps: 256; Mehr filter banks: 64; min frequency: 20 Hz; max frequency: 96 kHz. The number of time frames in our unified spectrogram was 1500. The final Mayer spectrogram data format is: as follows (1, 64, 1500)—(number of channels, number of Mayer filters, number of time frames).
As for the setup before training, the framework we employed was PyTorch version 2.1.0. All the models were trained for 50 epochs with a batch size of 64 and a learning rate of 0.001 on one NVIDIA 4090 GPU with Intel(R) Core(TM) i7-14700K, 64 GB RAM.

4.4. Validation Performances

In this subsection, we chose some classical models for comparison. VGG was proposed by Simonyan et al. [49], which provided inspiration for later deep learning models. ResNet was proposed by He et al. [50], and its idea of Residual Learning was widely used by later deep learning models. TCNN was proposed by Pandey et al. [48] and it was widely applied to deal with time-series-related tasks. MobileViT was proposed by Mehta [51], which was a lightweight transformer-based model. RNN was proposed by MI Jordan [52] and it has had a wide range of applications in processing data sequences. CNN-RNN was proposed by J Wang [53], which showed excellent performance in multi-label classification tasks. We employed relatively light models, VGG16 and Resnet18, in comparison.
By comparing the results of the validation sets, it is possible to judge the performance of the model on previously unseen data. In order to not make the results seem redundant, we compared the best outputs for all models according to the 5-fold cross-validation. As shown in Table 3, Table 4, Table 5, Table 6, Table 7 and Table 8, Voice-AttentionNet+ L V is stable across a range of diseases, often achieving the best or second-best scores on multiple indicators. Especially in terms of F1-score, the Voice-AttentionNet+ L V model shows good performance, mainly due to its attention mechanism and the introduction of multi-loss combination. The performance of traditional basic models such as CNN is relatively weak; however, models with mixed architectures and attention mechanisms generally outperform simple architectures. In terms of difficulty of disease recognition, lung disease and Parkinson’s disease are easy to recognize due to obvious voice features (F1-score is generally above 0.93), while thyroid disease and sinus arrhythmia (F1-score is generally below 0.85) are difficult to recognize due to inapparent voice features.

4.5. Test Performances

For the comparison performance on the test set, we used the metrics of average accuracy and best accuracy. The test set was a dataset that was completely independent of the training and validation process—thus, the models had never seen it, allowing it to provide a more impartial evaluation of the performance. In this experiment (as shown in Table 2), we constructed a dataset consisting of samples from each of the six datasets. The purpose here was to determine the classification accuracy of each sample in this mixed dataset. As shown in Table 9, our model with L V obtained the best performance under these two metrics, while our model without L V attained the second-best average accuracy. This shows that our proposed models can adapt to the overall distribution of the data, rather than just performing well in some specific data partitions. In addition, it also illustrates the good generalization ability of our models.

4.6. Visualization

In this subsection, we analyze the classification accuracy of each category in the dataset.
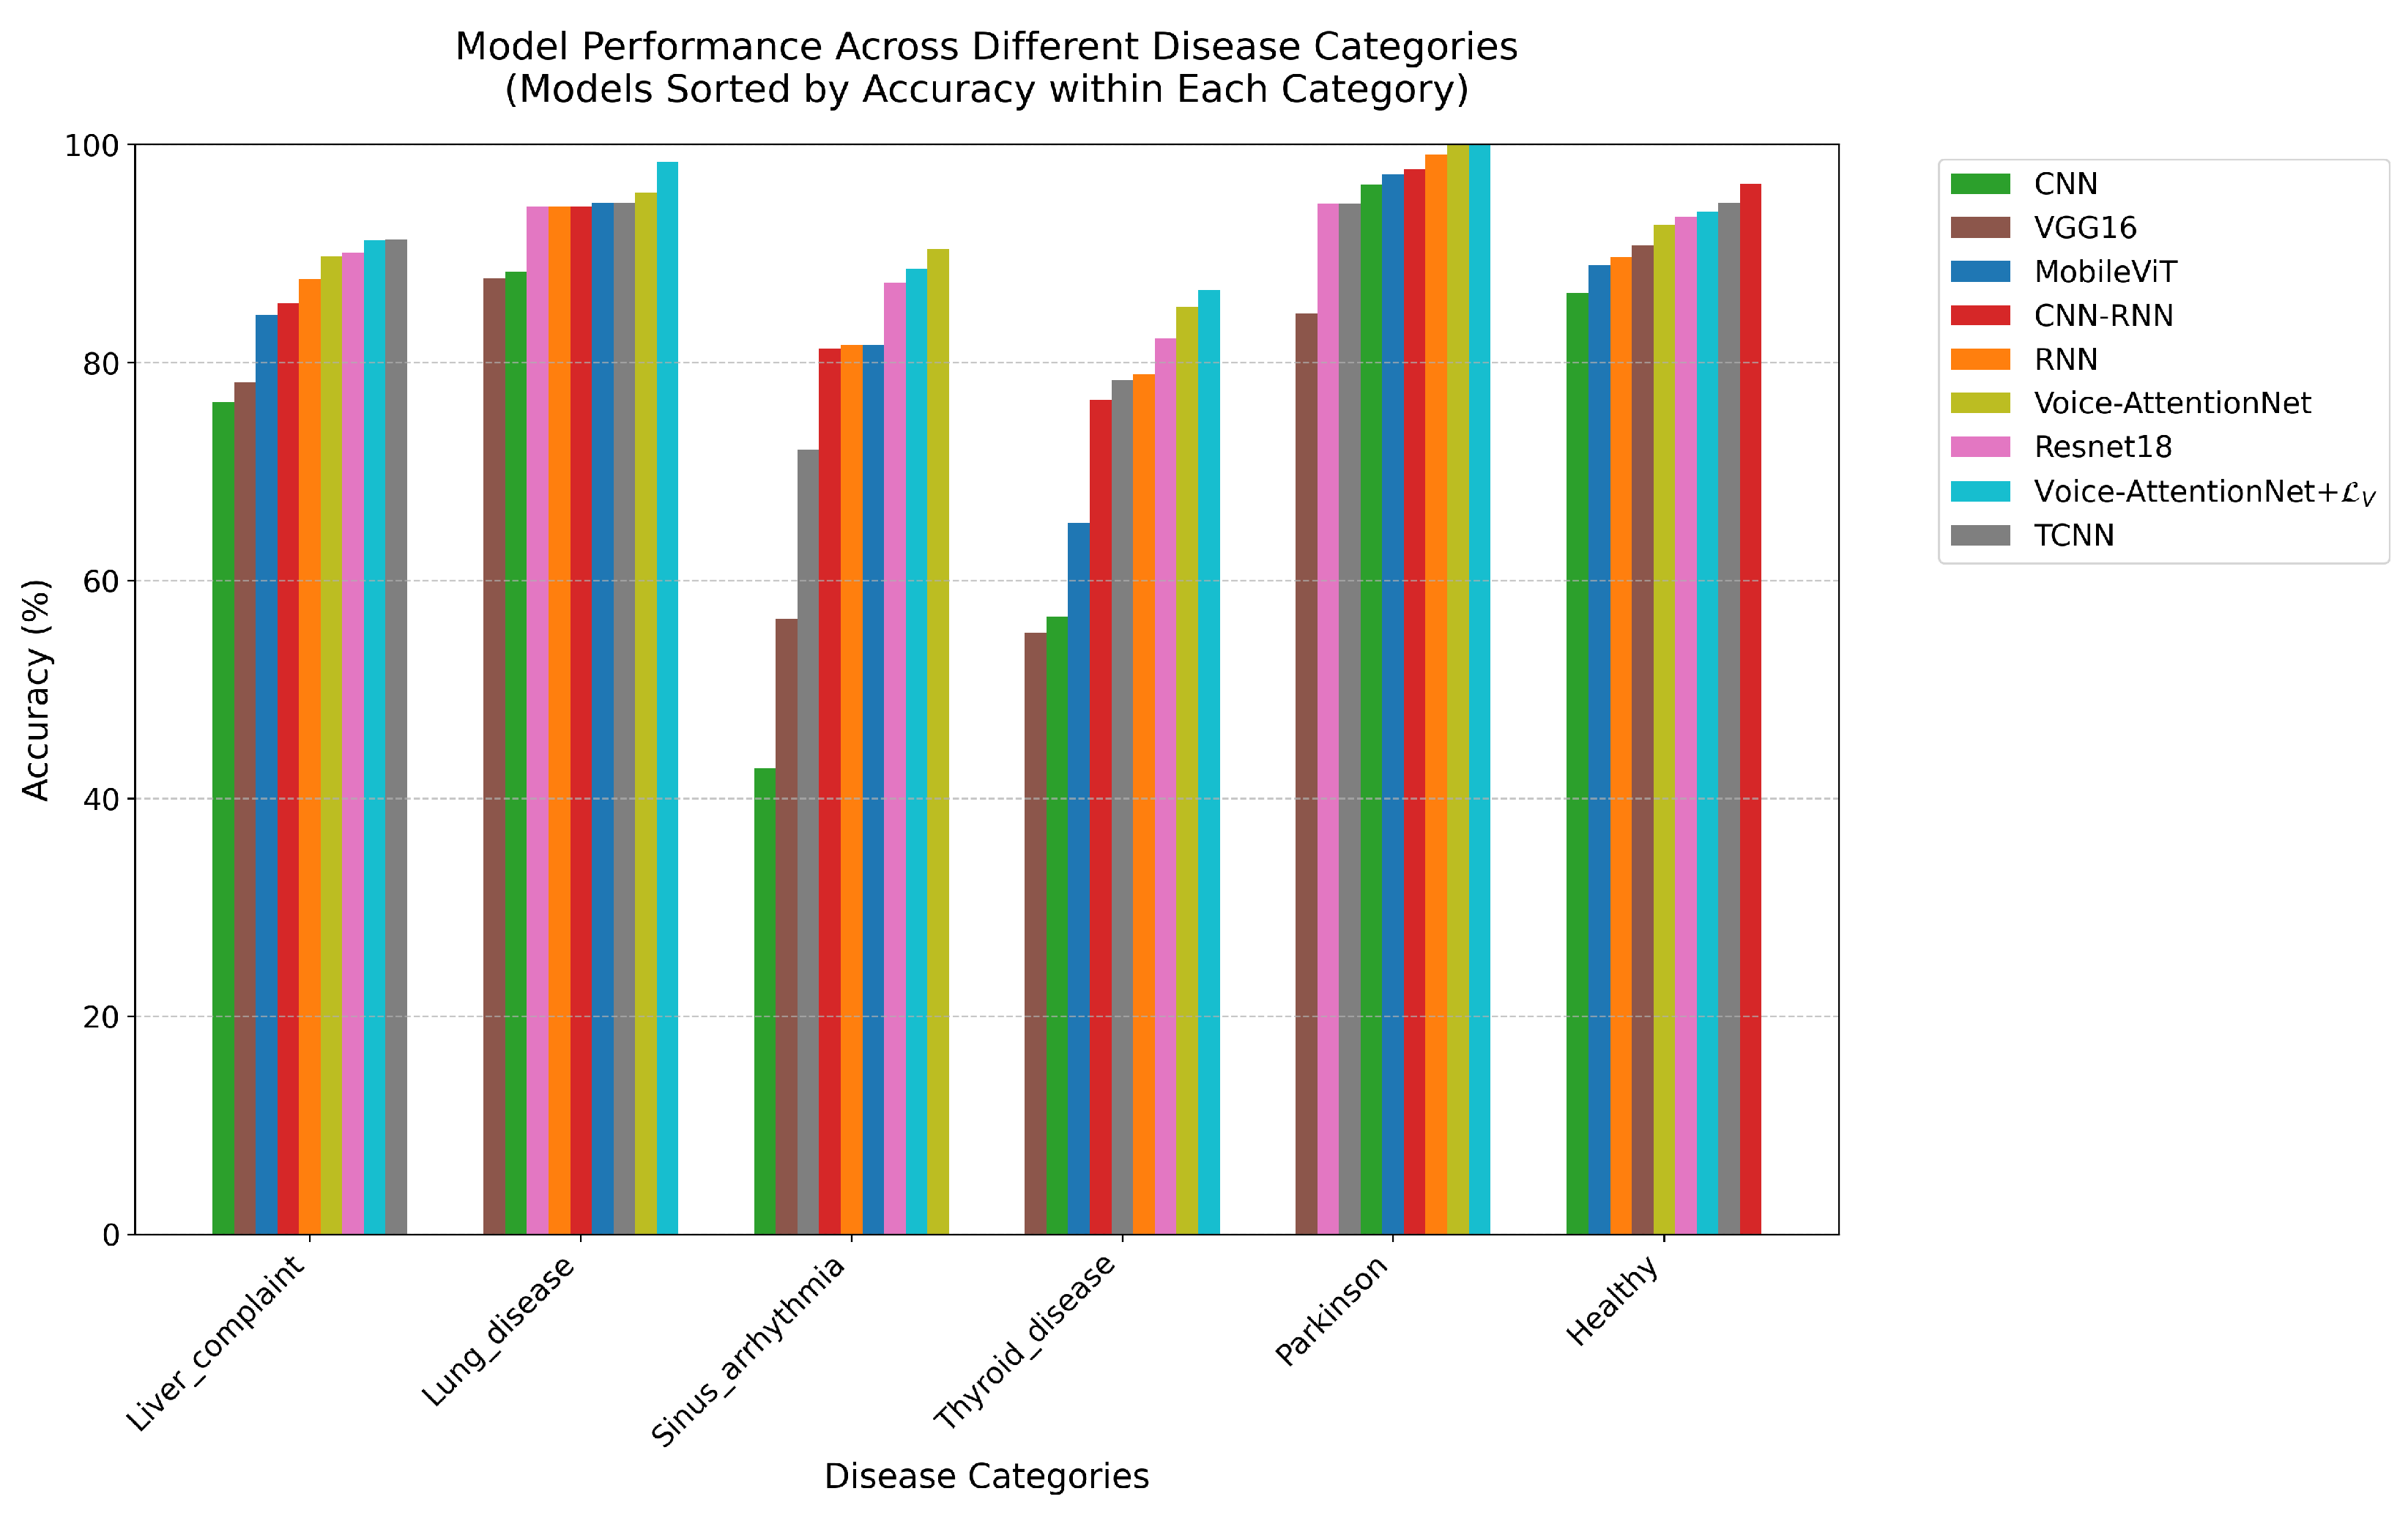
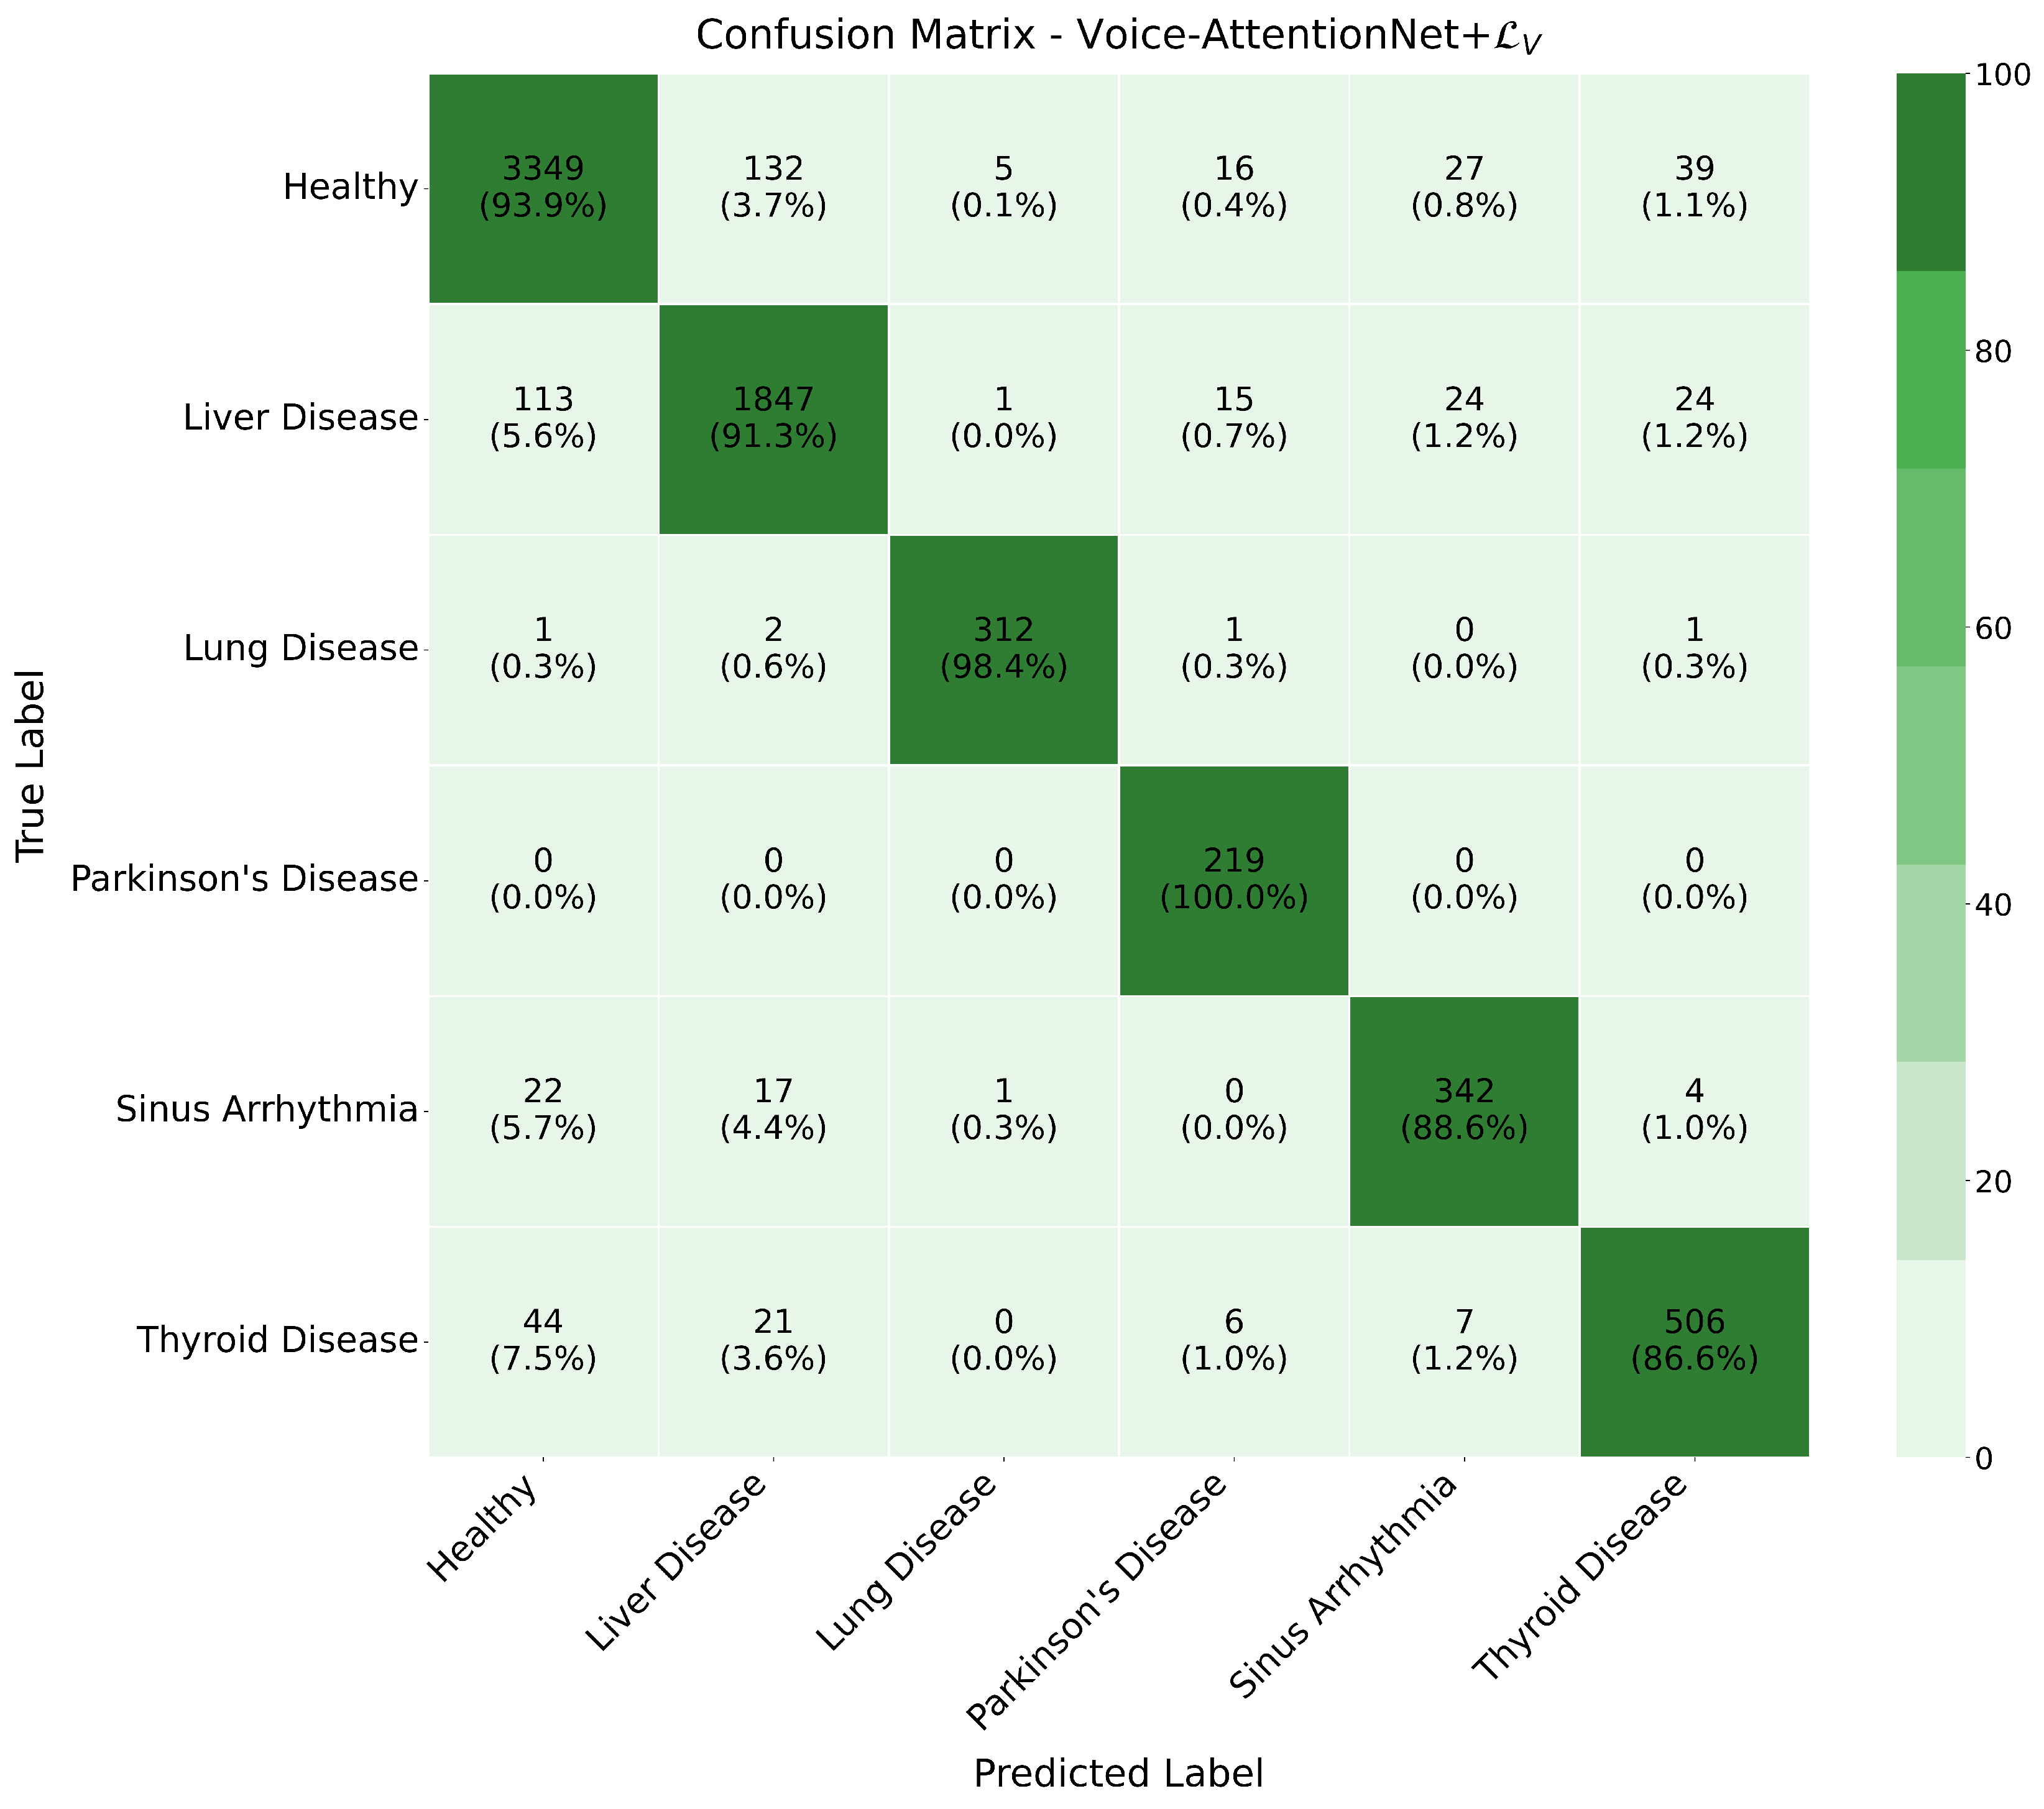
Combined with the comparison graph (Figure 7) and confusion matrix (since it would be redundant to place them all in the article, we only show the confusion matrix of Voice-AttentionNet+ L V (Figure 8) here as an example, with the remaining figure given in the Supplementary File S1) for the models, for the Healthy category, all models showed stable performance. The CNN-RNN model achieved the best accuracy (96.44%), followed by TCNN (94.65%) and Voice-AttentionNet+ L V (93.86%). Even the worst-performing VGG16 reached 90.72%, indicating that healthy voice features are relatively easy to identify.
For liver complaint category, TCNN demonstrated the best performance (91.30%), closely followed by Voice-AttentionNet+ L V (91.25%). The simple RNN achieved 87.65%, while the complex VGG16 only reached 78.16%. These results suggest that liver disease’s effects on speech may be more prominently manifested in temporal features.
Thyroid disease proved to be the most challenging category to identify. The best-performing model, Voice-AttentionNet+ L V , achieved only 86.64% accuracy, while the basic CNN’s accuracy was as low as 56.68%. The notably lower performance across all models suggests that thyroid disease’s effects on speech are more subtle and require sophisticated feature extraction capabilities.
In the sinus arrhythmia category, Voice-AttentionNet showed superior performance (90.41%), while basic CNN performed poorly (42.75%). The wide performance gap between models indicates the complexity of voice features associated with this condition. The attention mechanism demonstrated particular advantages in this task.
For the lung disease category, Voice-AttentionNet+ L V achieved remarkable accuracy at 98.42%, with other models generally exceeding 85%. These results indicate that lung diseases have significant and detectable effects on voice, even with limited sample sizes.
The Parkinson’s category, despite having the smallest sample size, showed exceptional classification results. Both Voice-AttentionNet+ L V and Voice-AttentionNet achieved perfect accuracy (100%), while CNN-RNN reached 97.73%, and the base CNN achieved 96.35%. These high accuracy rates suggest that Parkinson’s disease has distinct and easily recognizable effects on speech patterns, even in small samples.
Overall, the effectiveness of speech features in the diagnosis of different diseases varies. Some diseases, such as Parkinson’s disease and lung disease, are so pronounced that they can be accurately identified even in small samples; others, such as thyroid disease, have more subtle voice features that require more advanced models and possibly more training data.

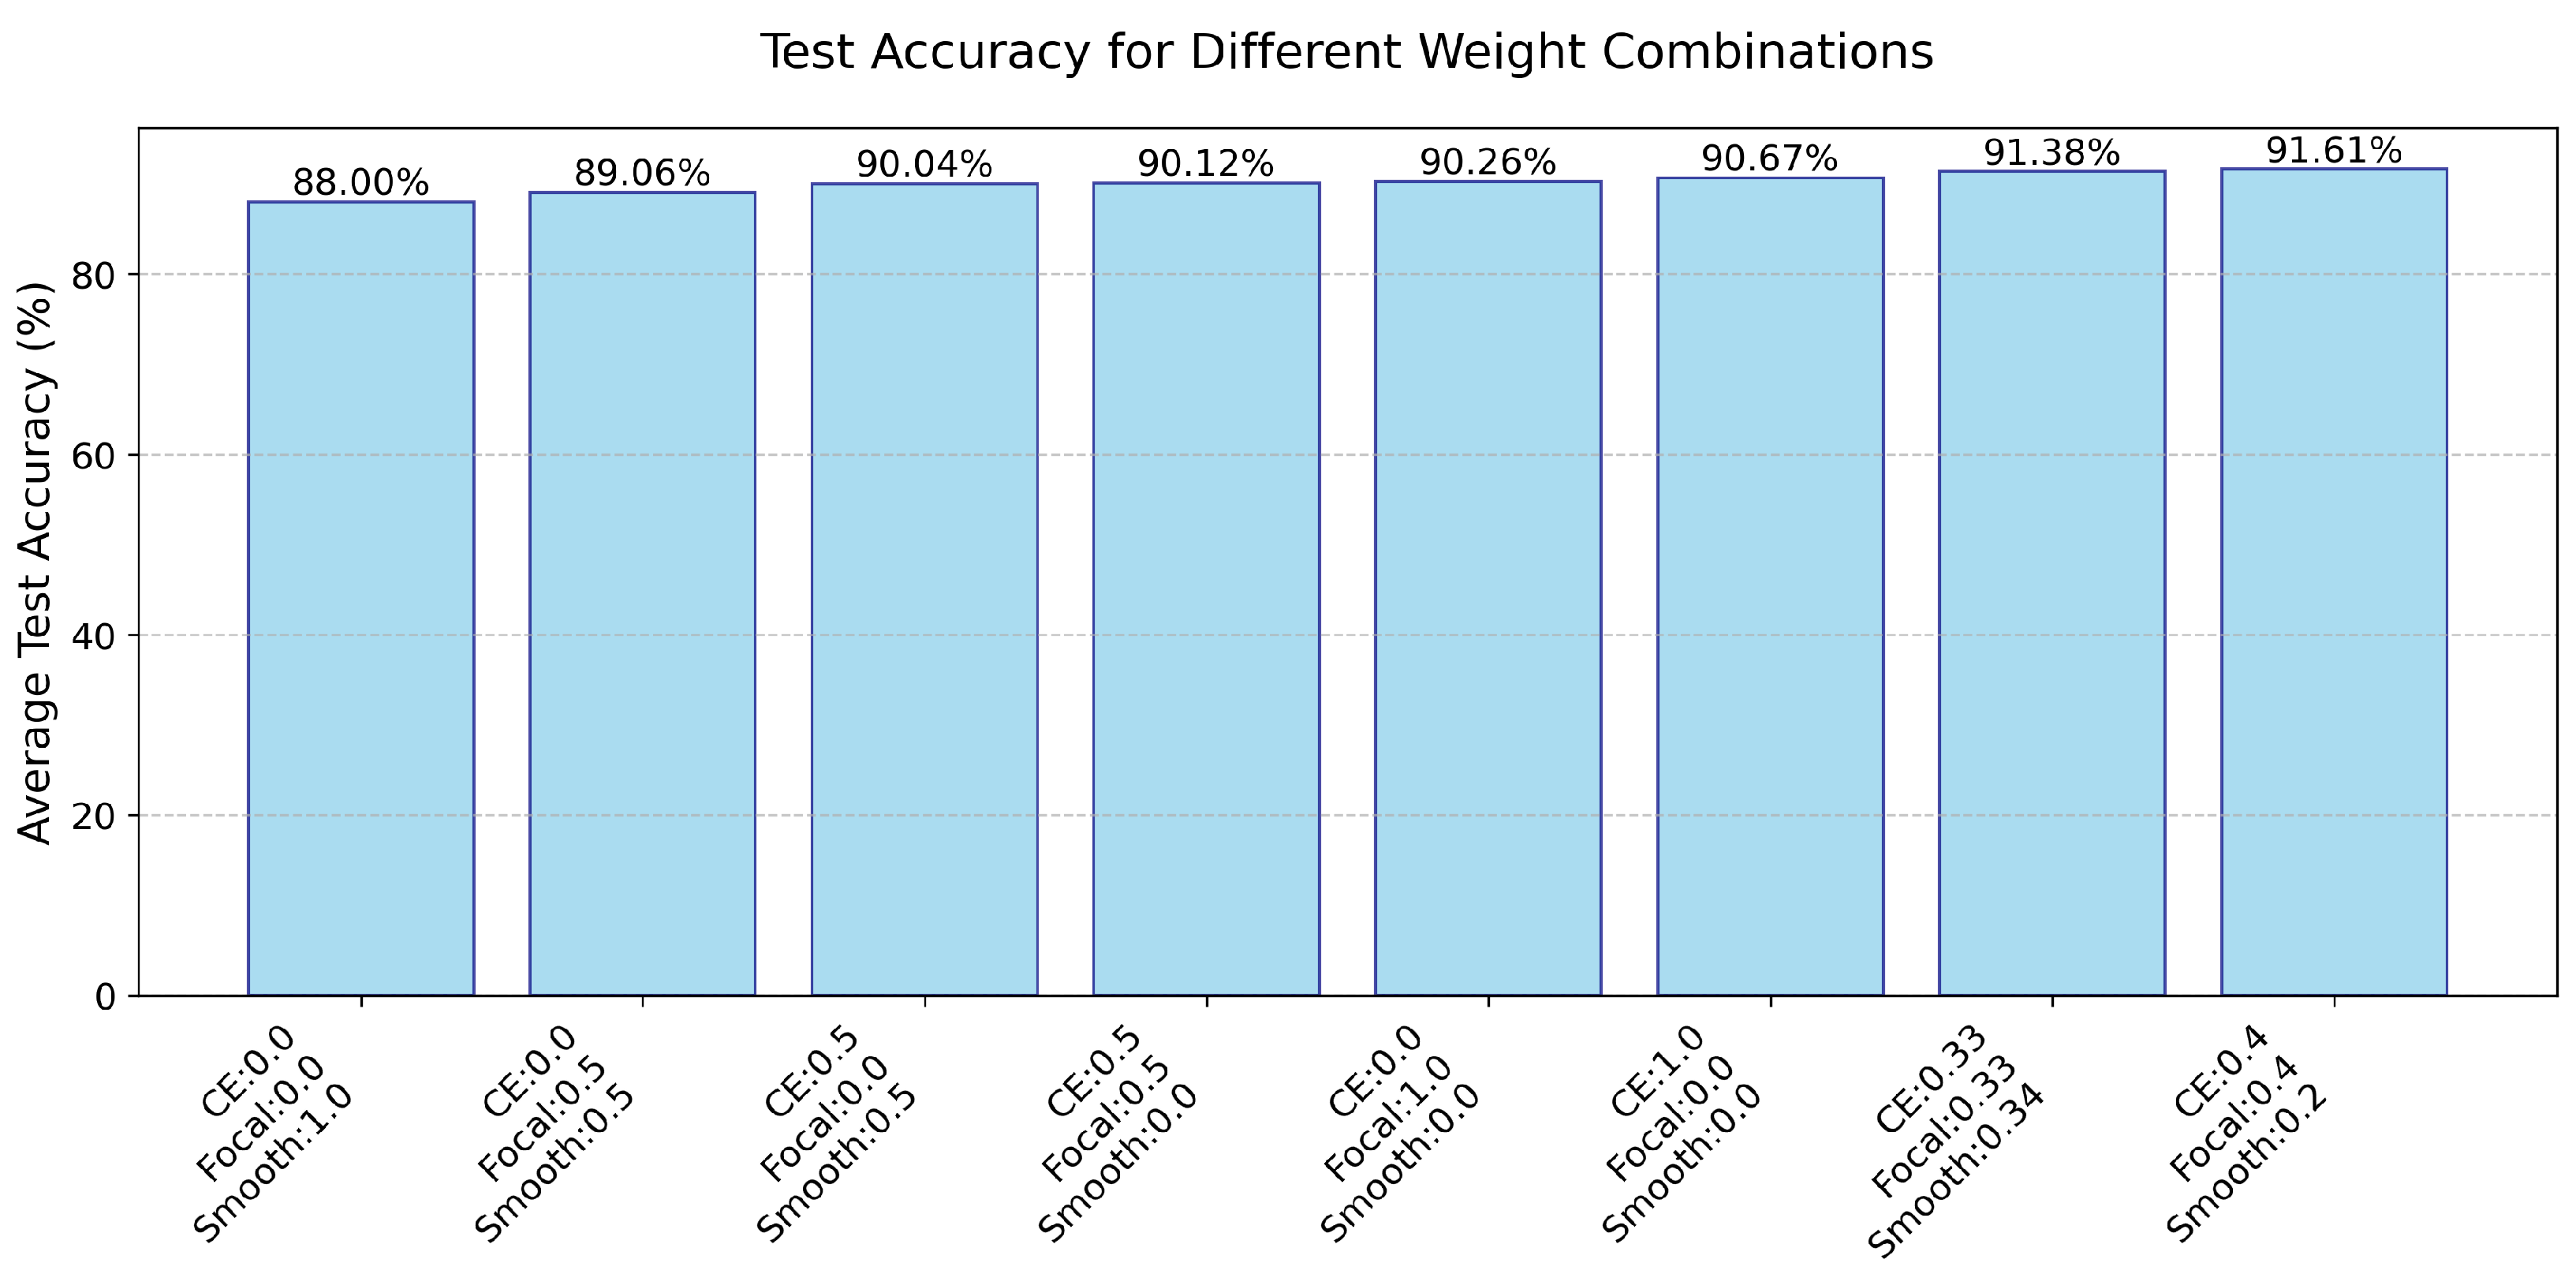
4.7. Test Accuracy for Different Weight Combinations

In this subsection, we describe experiments we conducted to explore how different combinations affect the performance of the model. We explored a single weight, as well as a combination of two weights and a combination of three weights (Figure 9). We found that the CE and Focal Loss had the greatest impact on model performance, where three weight combinations can further improve performance. Here, the average of each weight can even achieve the best average accuracy on the test set among nine models, and we conducted more experiments of different combinations of the three weights. In this paper, we used CE = 0.4, Focal = 0.4, and Smooth = 0.2 as the default values.

4.8. GPU Training Time Comparison

In this subsection, we compare the GPU training time (refer to Table 10) among the nine models. Although we added more loss functions, the running time is drastically reduced. We figured out different loss terms may provide complementary gradient information, improving the optimization efficiency of the model, and enabling the optimizer to converge more effectively. This also indirectly shows the effectiveness and feasibility of our designed L V .

5. Discussion

To sum up, Voice-AttentionNet shows good performance compared with other classical models on both our validation and test sets; at the same time, the L V we designed also further improves its performance. This demonstrates that our model is really learning more subtle differences between various diseases, while maintaining good results as demonstrated by precision, recall, F1-score, and accuracy. In addition, Voice-AttentionNet still achieved the second-fastest GPU training time among the comparison models, illustrating the efficiency of our proposed model and designed loss function.
However, the results on the validation set show that Voice-AttentionNet and Voice-AttentionNet+ L V do not perform best in every case of disease classification. Even though they do perform well in most disease classifications, they are not particularly advantageous compared to other approaches. Hence, there is still room for improvement and progress on Voice-AttentionNet and Voice-AttentionNet+ L V .
For future work, we will explore a more efficient network structure, and further reduce the training time while ensuring training accuracy. At the same time, we will enhance the data preprocessing to make the models better learn tiny features that distinguish the different diseases.

6. Conclusions

This paper proposes a Lightweight Attention-based Temporal Convolution Neural Network, which aims to solve the problem of multi-disease classification through speech detection. We added the attention mechanism to help the network automatically learn the importance of feature channels, so as to dynamically adjust the weights of each channel to improve the effect of feature expression. At the same time, we also included a multi-loss combination to provide a smoother gradient for the model, which helps to avoid the gradient explosion problem during training, leading to the model performing particularly well when there is a class imbalance in the dataset. In order to further enhance the performance of our model, as part of our future work, we will further optimize the network structure, reduce the complexity of the model through techniques such as knowledge distillation, and explore the application potential of the proposed method in the classification of more disease types.

Supplementary Materials

The following supporting information can be downloaded at https://www.mdpi.com/article/10.3390/ai6040068/s1. Supplemental File S1. Confusion matrices of CNN, RNN, CNN-RNN, MobileViT, VGG16, ResNet18, TCNN, Voice-AttentionNet on test set.

Author Contributions

Conceptualization, J.W.; methodology, J.W. and J.Z.; formal analysis, J.W. and J.Z.; data curation, J.W. and J.Z.; visualization, J.W.; writing—original draft, J.W.; writing—review and editing, J.Z. and B.Z.; supervision, B.Z.; project administration, B.Z.; funding acquisition, B.Z. All authors have read and agreed to the published version of the manuscript.

Funding

This work was supported by the Science and Technology Development Fund, Macao S.A.R (FDCT) 0028/2023/RIA1.

Institutional Review Board Statement

We conducted the research in accordance with the Declaration of Helsinki, and received approval by Hong Kong Polytechnic University and Chinese University of Hong Kong (Shenzhen).

Informed Consent Statement

Informed consent was obtained from all subjects involved in the study.

Data Availability Statement

Partial data can be accessed via the following link: https://hw1761.huaweicloudsite.cn (accessed on 28 August 2024).

Acknowledgments

We would like to thank the Biometrics Research Centre at Hong Kong Polytechnic University and Chinese University of Hong Kong (Shenzhen) for sharing the dataset with us.

Conflicts of Interest

The authors declare no conflicts of interest.

Appendix A

Appendix A.1. Disease Categories

CategoryDiseases
Lung_diseaselung cancer, lung infection, lung malignancy, lung sarcoidosis, left upper pulmonary fibrosis, left lower pulmonary nodules, left lower pulmonary fibrosis
Liver_complaintliver CA, liver tube calcification, liver calcifications tube, hepatolith, liver multiple cysts, abnormal liver function, liver cyst, liver hemangioma, hepatitis, chronic liver failure, chronic hepatitis b viral hepatitis, mild fatty liver, mild fatty liver with elevated aminotransferase, hepatitis b surface antigen carrier, hepatitis b dasanyang, hepatitis b minor sanyang, fatty liver, fatty liver with hepatic cyst, fatty liver with elevated aminotransferase, fatty liver to be expelled, fatty liver pending and calcification, fatty liver pending and liver cyst, fatty liver pending and elevated transaminase, moderate fatty liver, severe fatty liver
Thyroid_diseasesecond-degree goiter, first-degree goiter, third-degree goiter, nodular goiter, glial cyst of thyroid gland, thyroid nodule, thyroid nodule chaine, thyroid cyst, thyroid cyst with thyroid nodule, Hashimoto gland of thyroid gland, small cyst of thyroid gland, right lobe mass chaine of thyroid gland, goiter, nodular goiter

References

  1. Alowais, S.A.; Alghamdi, S.S.; Alsuhebany, N.; Alqahtani, T.; Alshaya, A.I.; Almohareb, S.N.; Aldairem, A.; Alrashed, M.; Bin Saleh, K.; Badreldin, H.A.; et al. Revolutionizing healthcare: The role of artificial intelligence in clinical practice. BMC Med. Educ. 2023, 23, 689. [Google Scholar] [CrossRef] [PubMed]
  2. Chakraborty, C.; Bhattacharya, M.; Pal, S.; Lee, S.S. From machine learning to deep learning: Advances of the recent data-driven paradigm shift in medicine and healthcare. Curr. Res. Biotechnol. 2024, 7, 100164. [Google Scholar] [CrossRef]
  3. Johnson, K.B.; Wei, W.Q.; Weeraratne, D.; Frisse, M.E.; Misulis, K.; Rhee, K.; Zhao, J.; Snowdon, J.L. Precision medicine, AI, and the future of personalized health care. Clin. Transl. Sci. 2021, 14, 86–93. [Google Scholar]
  4. Bajwa, J.; Munir, U.; Nori, A.; Williams, B. Artificial intelligence in healthcare: Transforming the practice of medicine. Future Healthc. J. 2021, 8, e188–e194. [Google Scholar] [PubMed]
  5. Zhang, Z. Mechanics of human voice production and control. J. Acoust. Soc. Am. 2016, 140, 2614–2635. [Google Scholar]
  6. Chen, H.; Leu, M.C.; Yin, Z. Real-time multi-modal human–robot collaboration using gestures and speech. J. Manuf. Sci. Eng. 2022, 144, 101007. [Google Scholar]
  7. Chamishka, S.; Madhavi, I.; Nawaratne, R.; Alahakoon, D.; De Silva, D.; Chilamkurti, N.; Nanayakkara, V. A voice-based real-time emotion detection technique using recurrent neural network empowered feature modelling. Multimed. Tools Appl. 2022, 81, 35173–35194. [Google Scholar] [CrossRef]
  8. Zhou, K.; Sisman, B.; Liu, R.; Li, H. Seen and unseen emotional style transfer for voice conversion with a new emotional speech dataset. In Proceedings of the ICASSP 2021—2021 IEEE International Conference on Acoustics, Speech and Signal Processing (ICASSP), Toronto, ON, Canada, 6–11 June 2021; IEEE: New York, NY, USA, 2021; pp. 920–924. [Google Scholar]
  9. Balestrino, R.; Schapira, A. Parkinson disease. Eur. J. Neurol. 2020, 27, 27–42. [Google Scholar]
  10. Perlmutter, J.S. Assessment of Parkinson disease manifestations. Curr. Protoc. Neurosci. 2009, 49, 10–11. [Google Scholar]
  11. Postuma, R.B.; Lang, A.; Gagnon, J.; Pelletier, A.; Montplaisir, J. How does parkinsonism start? Prodromal parkinsonism motor changes in idiopathic REM sleep behaviour disorder. Brain 2012, 135, 1860–1870. [Google Scholar]
  12. Malik, A.; Abdullah, M.; Chaudhry, M.; Murtaza, A.; Kanwal, A. Unilateral Vocal Cord Paralysis in a Patient with Acute Viral Hepatitis. Cureus 2021, 13, e13399. [Google Scholar] [PubMed]
  13. Dickerson, L.K.; Rouhizadeh, M.; Korotkaya, Y.; Bowring, M.G.; Massie, A.B.; McAdams-Demarco, M.A.; Segev, D.L.; Cannon, A.; Guerrerio, A.L.; Chen, P.H.; et al. Language impairment in adults with end-stage liver disease: Application of natural language processing towards patient-generated health records. npj Digit. Med. 2019, 2, 106. [Google Scholar] [PubMed]
  14. Saeed, A.M.; Riad, N.M.; Osman, N.M.; Khattab, A.N.; Mohammed, S.E. Study of voice disorders in patients with bronchial asthma and chronic obstructive pulmonary disease. Egypt. J. Bronchol. 2018, 12, 20–26. [Google Scholar] [CrossRef]
  15. Kallvik, E.; Toivonen, L.; Peltola, V.; Kaljonen, A.; Simberg, S. Respiratory tract infections and voice quality in 4-year-old children in the STEPS study. J. Voice 2019, 33, 801.e21–801.e25. [Google Scholar] [PubMed]
  16. Alam, M.Z.; Simonetti, A.; Brillantino, R.; Tayler, N.; Grainge, C.; Siribaddana, P.; Nouraei, S.R.; Batchelor, J.; Rahman, M.S.; Mancuzo, E.V.; et al. Predicting pulmonary function from the analysis of voice: A machine learning approach. Front. Digit. Health 2022, 4, 750226. [Google Scholar] [CrossRef]
  17. Reilly, K.J.; Moore, C.A. Respiratory sinus arrhythmia during speech production. J. Speech Lang. Hear. Res. 2003, 46, 164–177. [Google Scholar]
  18. Bourouhou, A.; Jilbab, A.; Nacir, C.; Hammouch, A. Classification of cardiovascular diseases using dysphonia measurement in speech. Diagnostyka 2021, 22, 31–37. [Google Scholar]
  19. Porges, S.W.; Macellaio, M.; Stanfill, S.D.; McCue, K.; Lewis, G.F.; Harden, E.R.; Handelman, M.; Denver, J.; Bazhenova, O.V.; Heilman, K.J. Respiratory sinus arrhythmia and auditory processing in autism: Modifiable deficits of an integrated social engagement system? Int. J. Psychophysiol. 2013, 88, 261–270. [Google Scholar] [CrossRef]
  20. Gandhi, S.M.; Paal, E.; Nylen, E.S. An Atypical Cause of Hoarseness in a Patient with Thyroid Nodules. Mil. Med. 2024, 189, e414–e416. [Google Scholar]
  21. Farag, H.M.; Hady, A.F.A.; Hamid, A.A.; Soliman, H. The effect of receiving thyroid hormone replacement on the dysphonia severity index for congenital hypothyroid children. Egypt. J. Otolaryngol. 2022, 38, 11. [Google Scholar]
  22. Fagherazzi, G.; Fischer, A.; Ismael, M.; Despotovic, V. Voice for health: The use of vocal biomarkers from research to clinical practice. Digit. Biomarkers 2021, 5, 78–88. [Google Scholar] [CrossRef] [PubMed]
  23. Lamba, R.; Gulati, T.; Alharbi, H.F.; Jain, A. A hybrid system for Parkinson’s disease diagnosis using machine learning techniques. Int. J. Speech Technol. 2022, 25, 583–593. [Google Scholar] [CrossRef]
  24. Senturk, Z.K. Early diagnosis of Parkinson’s disease using machine learning algorithms. Med. Hypotheses 2020, 138, 109603. [Google Scholar]
  25. Aich, S.; Kim, H.C.; Hui, K.L.; Al-Absi, A.A.; Sain, M. A supervised machine learning approach using different feature selection techniques on voice datasets for prediction of Parkinson’s disease. In Proceedings of the 2019 21st International Conference on Advanced Communication Technology (ICACT), PyeongChang, Republic of Korea, 17–20 February 2019; IEEE: New York, NY, USA, 2019; pp. 1116–1121. [Google Scholar]
  26. Almeida, J.S.; Rebouças Filho, P.P.; Carneiro, T.; Wei, W.; Damaševičius, R.; Maskeliūnas, R.; de Albuquerque, V.H.C. Detecting Parkinson’s disease with sustained phonation and speech signals using machine learning techniques. Pattern Recognit. Lett. 2019, 125, 55–62. [Google Scholar]
  27. Ali, L.; Khan, S.U.; Arshad, M.; Ali, S.; Anwar, M. A multi-model framework for evaluating type of speech samples having complementary information about Parkinson’s disease. In Proceedings of the 2019 International Conference on Electrical, Communication, and Computer Engineering (ICECCE), Swat, Pakistan, 24–25 July 2019; IEEE: New York, NY, USA, 2019; pp. 1–5. [Google Scholar]
  28. Gonzalez-Moreira, E.; Torres-Boza, D.; Kairuz, H.A.; Ferrer, C.; Garcia-Zamora, M.; Espinoza-Cuadros, F.; Hernandez-Gómez, L.A. Automatic prosodic analysis to identify mild dementia. BioMed Res. Int. 2015, 2015, 916356. [Google Scholar]
  29. Nasrolahzadeh, M.; Mohammadpoory, Z.; Haddadnia, J. Higher-order spectral analysis of spontaneous speech signals in Alzheimer’s disease. Cogn. Neurodynamics 2018, 12, 583–596. [Google Scholar]
  30. Al-Hameed, S.; Benaissa, M.; Christensen, H.; Mirheidari, B.; Blackburn, D.; Reuber, M. A new diagnostic approach for the identification of patients with neurodegenerative cognitive complaints. PLoS ONE 2019, 14, e0217388. [Google Scholar]
  31. Gao, X.; Ma, K.; Yang, H.; Wang, K.; Fu, B.; Zhu, Y.; She, X.; Cui, B. A rapid, non-invasive method for fatigue detection based on voice information. Front. Cell Dev. Biol. 2022, 10, 994001. [Google Scholar]
  32. de Oliveira Florencio, V.; Almeida, A.A.; Balata, P.; Nascimento, S.; Brockmann-Bauser, M.; Lopes, L.W. Differences and reliability of linear and nonlinear acoustic measures as a function of vocal intensity in individuals with voice disorders. J. Voice 2023, 37, 663–681. [Google Scholar] [CrossRef]
  33. Henríquez, P.; Alonso, J.B.; Ferrer, M.A.; Travieso, C.M.; Godino-Llorente, J.I.; Díaz-de María, F. Characterization of healthy and pathological voice through measures based on nonlinear dynamics. IEEE Trans. Audio, Speech, Lang. Process. 2009, 17, 1186–1195. [Google Scholar] [CrossRef]
  34. Quan, C.; Ren, K.; Luo, Z. A deep learning based method for Parkinson’s disease detection using dynamic features of speech. IEEE Access 2021, 9, 10239–10252. [Google Scholar] [CrossRef]
  35. Nagasubramanian, G.; Sankayya, M. Multi-variate vocal data analysis for detection of Parkinson disease using deep learning. Neural Comput. Appl. 2021, 33, 4849–4864. [Google Scholar]
  36. Rehman, A.; Saba, T.; Mujahid, M.; Alamri, F.S.; ElHakim, N. Parkinson’s disease detection using hybrid LSTM-GRU deep learning model. Electronics 2023, 12, 2856. [Google Scholar] [CrossRef]
  37. Saltos, K.; Zhinin-Vera, L.; Godoy, C.; Chachalo, R.; Almeida-Galárraga, D.; Cadena-Morejón, C.; Tirado-Espín, A.; Cruz-Varela, J.; Villalba Meneses, F. Detecting Parkinson’s Disease with Convolutional Neural Networks: Voice Analysis and Deep Learning. In Proceedings of the Conference on Information and Communication Technologies of Ecuador, Cuenca, Ecuador, 18–20 October 2023; Springer: Cham, Switzerland, 2023; pp. 324–336. [Google Scholar]
  38. Eguchi, K.; Yaguchi, H.; Kudo, I.; Kimura, I.; Nabekura, T.; Kumagai, R.; Fujita, K.; Nakashiro, Y.; Iida, Y.; Hamada, S.; et al. Differentiation of speech in Parkinson’s disease and spinocerebellar degeneration using deep neural networks. J. Neurol. 2024, 271, 1004–1012. [Google Scholar] [PubMed]
  39. Dar, J.A.; Srivastava, K.K.; Lone, S.A. Design and development of hybrid optimization enabled deep learning model for COVID-19 detection with comparative analysis with DCNN, BIAT-GRU, XGBoost. Comput. Biol. Med. 2022, 150, 106123. [Google Scholar] [CrossRef]
  40. Agbavor, F.; Liang, H. Artificial Intelligence-enabled end-to-end detection and assessment of alzheimer’s disease using voice. Brain Sci. 2022, 13, 28. [Google Scholar] [CrossRef]
  41. Luz, S.; Haider, F.; de la Fuente, S.; Fromm, D.; MacWhinney, B. Detecting cognitive decline using speech only: The adresso challenge. arXiv 2021, arXiv:2104.09356. [Google Scholar]
  42. Pérez-Toro, P.A.; Rodríguez-Salas, D.; Arias-Vergara, T.; Klumpp, P.; Schuster, M.; Nöth, E.; Orozco-Arroyave, J.R.; Maier, A.K. Interpreting acoustic features for the assessment of Alzheimer’s disease using ForestNet. Smart Health 2022, 26, 100347. [Google Scholar]
  43. Lin, Y.; Liyanage, B.N.; Sun, Y.; Lu, T.; Zhu, Z.; Liao, Y.; Wang, Q.; Shi, C.; Yue, W. A deep learning-based model for detecting depression in senior population. Front. Psychiatry 2022, 13, 1016676. [Google Scholar]
  44. Ma, X.; Yang, H.; Chen, Q.; Huang, D.; Wang, Y. Depaudionet: An efficient deep model for audio based depression classification. In Proceedings of the 6th International Workshop on Audio/Visual Emotion Challenge, Amsterdam, The Netherlands, 15–19 October 2016; pp. 35–42. [Google Scholar]
  45. Dang, T.; Han, J.; Xia, T.; Spathis, D.; Bondareva, E.; Siegele-Brown, C.; Chauhan, J.; Grammenos, A.; Hasthanasombat, A.; Floto, R.A.; et al. Exploring longitudinal cough, breath, and voice data for COVID-19 progression prediction via sequential deep learning: Model development and validation. J. Med. Internet Res. 2022, 24, e37004. [Google Scholar]
  46. Ye, W.; Jiang, Z.; Li, Q.; Liu, Y.; Mou, Z. A hybrid model for pathological voice recognition of post-stroke dysarthria by using 1DCNN and double-LSTM networks. Appl. Acoust. 2022, 197, 108934. [Google Scholar] [CrossRef]
  47. Zhang, D.; Wu, K. Pathological Voice Analysis; Springer: Singapore, 2020. [Google Scholar]
  48. Pandey, A.; Wang, D. TCNN: Temporal convolutional neural network for real-time speech enhancement in the time domain. In Proceedings of the ICASSP 2019—2019 IEEE International Conference on Acoustics, Speech and Signal Processing (ICASSP), Brighton, UK, 12–17 May 2019; IEEE: New York, NY, USA, 2019; pp. 6875–6879. [Google Scholar]
  49. Simonyan, K. Very deep convolutional networks for large-scale image recognition. arXiv 2014, arXiv:1409.1556. [Google Scholar]
  50. He, K.; Zhang, X.; Ren, S.; Sun, J. Deep residual learning for image recognition. In Proceedings of the IEEE Conference on Computer Vision and Pattern Recognition, Las Vegas, NV, USA, 27–30 June 2016; pp. 770–778. [Google Scholar]
  51. Mehta, S.; Rastegari, M. Mobilevit: Light-weight, general-purpose, and mobile-friendly vision transformer. arXiv 2021, arXiv:2110.02178. [Google Scholar]
  52. Jordan, M.I. Serial order: A parallel distributed processing approach. Adv. Psychol. 1997, 121, 471–495. [Google Scholar]
  53. Wang, J.; Yang, Y.; Mao, J.; Huang, Z.; Huang, C.; Xu, W. Cnn-rnn: A unified framework for multi-label image classification. In Proceedings of the IEEE Conference on Computer Vision and Pattern Recognition, Las Vegas, NV, USA, 27–30 June 2016; pp. 2285–2294. [Google Scholar]
Figure 1. Overall framework of our proposed multi-disease diagnosis system.
Ai 06 00068 g001
Figure 2. Use case of our proposed multi-disease diagnosis system.
Ai 06 00068 g002
Figure 3. (a) An example of the origin waveform for a healthy sample. (b) An example of the origin waveform for a disease sample. (c) An example of the conversion to Mel spectrogram for a healthy sample. (d) An example of the conversion to Mel spectrogram for a disease sample.
Ai 06 00068 g003
Figure 4. Structure of Voice-AttentionNet with lightweight SE attention.
Ai 06 00068 g004
Figure 5. Structure of SE attention.
Ai 06 00068 g005
Figure 6. (a) Soundproof room. (b) Hardware equipment. More details can be found in [47].
Ai 06 00068 g006
Figure 7. Classification accuracy of each category on test set.
Ai 06 00068 g007
Figure 8. Confusion matrix of Voice-AttentionNet+ L V on test set.
Ai 06 00068 g008
Figure 9. Results of average test accuracy for different weight combinations.
Ai 06 00068 g009
Table 1. Label distribution for cases and samples.
HealthyLiver ComplaintLung DiseaseParkinson’s DiseaseSinus ArrhythmiaThyroid DiseaseTotal
Cases44625342294973892
Samples17,84010,120158610971929292035,492
Table 2. Label distribution for train, validation, and test sets.
HealthyLiver ComplaintLung DiseaseParkinson’s DiseaseSinus ArrhythmiaThyroid DiseaseTotal
Train set11,418647610147021236186822,714
Validation set285416202541753084685679
Test set356820243182203855847099
Table 3. Precision, recall, and F1-score produced by different methods in identifying healthy samples on validation set.
ModelsPrecisionRecallF1-Score
CNN0.80060.91030.8519
RNN0.87930.93900.9082
CNN-RNN0.89190.96250.9259
MobileViT0.90740.82760.8657
VGG160.85590.90540.8800
Resnet180.92440.90850.9164
TCNN0.89220.97440.9315
Voice-AttentionNet0.93650.92570.9311
Voice-AttentionNet+ L V 0.94660.92500.9357
Bold represents the highest value; underline represents the second-highest value.
Table 4. Precision, recall, and F1-score produced by different methods in identifying liver complaint samples on validation set.
ModelsPrecisionRecallF1-Score
CNN0.78140.71910.7490
RNN0.87170.83890.8550
CNN-RNN0.91170.84810.8788
MobileViT0.73980.89140.8085
VGG160.80710.82410.8155
Resnet180.85900.88770.8731
TCNN0.95390.81790.8807
Voice-AttentionNet0.89610.88400.8900
Voice-AttentionNet+ L V 0.88030.92160.9005
Bold represents the highest value; underline represents the second-highest value.
Table 5. Precision, recall, and F1-score produced by different methods in identifying lung disease samples on validation set.
ModelsPrecisionRecallF1-Score
CNN0.85660.94090.8968
RNN0.93020.94490.9375
CNN-RNN0.97500.92130.9474
MobileViT0.98700.89370.9380
VGG160.95780.89370.9246
Resnet180.92690.94880.9377
TCNN0.97520.92910.9516
Voice-AttentionNet0.97100.92130.9455
Voice-AttentionNet+ L V 0.94940.96060.9550
Bold represents the highest value; underline represents the second-highest value.
Table 6. Precision, recall, and F1-score produced by different methods in identifying PD samples on validation set.
ModelsPrecisionRecallF1-Score
CNN0.93870.87430.9053
RNN0.92470.98290.9529
CNN-RNN0.92270.95430.9382
MobileViT0.96630.98290.9745
VGG160.99350.86860.9268
Resnet180.85000.97140.9067
TCNN0.99360.89140.9398
Voice-AttentionNet0.93550.99430.9640
Voice-AttentionNet+ L V 0.89230.99430.9405
Bold represents the highest value; underline represents the second-highest value.
Table 7. Precision, recall, and F1-score produced by different methods in identifying sinus arrhythmia samples on validation set.
ModelsPrecisionRecallF1-Score
CNN0.85630.46430.6021
RNN0.92180.72730.8131
CNN-RNN0.89440.82470.8581
MobileViT0.85370.79550.8235
VGG160.79460.57790.6692
Resnet180.90640.78570.8417
TCNN0.86800.85390.8609
Voice-AttentionNet0.81210.87010.8401
Voice-AttentionNet+ L V 0.91530.87660.8955
Bold represents the highest value; underline represents the second-highest value.
Table 8. Precision, recall, and F1-score produced by different methods in identifying thyroid disease samples on validation set.
ModelsPrecisionRecallF1-Score
CNN0.72160.51500.6010
RNN0.84680.69660.7644
CNN-RNN0.93020.76920.8421
MobileViT0.74830.68590.7157
VGG160.78570.65810.7163
Resnet180.82240.83120.8268
TCNN0.84930.85470.8520
Voice-AttentionNet0.81510.87610.8445
Voice-AttentionNet+ L V 0.90380.86320.8831
Bold represents the highest value; underline represents the second-highest value.
Table 9. Average accuracy and best accuracy on test set.
ModelsAverage AccuracyBest Accuracy
CNN78.4779.49
RNN88.0889.22
CNN-RNN89.9690.78
MobileViT84.8987.01
VGG1680.3383.54
Resnet1891.1992.09
TCNN90.9491.98
Voice-AttentionNet91.3491.89
Voice-AttentionNet+ L V 91.6192.63
Bold represents the highest value; underline represents the second-highest value.
Table 10. GPU training time per epoch.
ModelsCNNRNNCNN-RNNMoblieViTVGG16Resnet18TCNNVoice-AttentionNetVoice-AttentionNet+ L V
Time (s/epoch)142.14138.2486.42234.86321.97152.1385.81227.54109.19
Disclaimer/Publisher’s Note: The statements, opinions and data contained in all publications are solely those of the individual author(s) and contributor(s) and not of MDPI and/or the editor(s). MDPI and/or the editor(s) disclaim responsibility for any injury to people or property resulting from any ideas, methods, instructions or products referred to in the content.

