1. Introduction
The accelerating pace of global population aging has made promoting healthy aging among older adults an urgent public health priority [
1,
2]. Within this context, the co-occurrence and interaction between physical frailty and mental health disorders represent a central challenge in geriatric health. Sarcopenia—a syndrome characterized by progressive and generalized loss of skeletal muscle mass, strength, and function [
3]—and depression, a prevalent affective disorder, are highly common and closely interrelated in the older population [
4]. Numerous cross-sectional and longitudinal studies have established a significant association between depression and sarcopenia [
5,
6,
7]. These conditions frequently present as “psychosomatic comorbidities,” collectively exacerbating the risks of disability, hospitalization, and mortality [
8].
However, prevailing research paradigms exhibit notable limitations. First, the vast majority of studies treat depression as a static baseline condition, examining its association with sarcopenia based solely on severity at a single time point [
9,
10,
11]. This approach overlooks the inherent dynamic nature and heterogeneity of depression. In its natural course, symptoms often follow distinct trajectory patterns such as ‘persistent high,’ ‘worsening,’ or ‘remitting-relapsing’ [
12,
13]. This simplified, static perspective substantially limits the ability to prospectively predict future physical risk. Second, although potential biological mechanisms (e.g., hypothalamic–pituitary–adrenal axis dysregulation, chronic inflammation) have been extensively explored [
14,
15,
16], the role of observable and modifiable behavioral and lifestyle factors (such as reduced physical activity, social withdrawal, and sleep disturbances) in linking depression to sarcopenia has received less attention, and they consequently remain poorly represented in existing predictive models [
17]. Finally, clinical practice lacks effective tools to accurately identify individuals with depression who are at the highest risk of developing sarcopenia before substantial, often irreversible, muscle loss occurs, thereby missing the critical window for early intervention.
To address these gaps and meet the pressing need for proactive public health interventions, this study introduces a novel AI-driven approach. We hypothesize that the dynamic trajectory of depressive symptoms, rather than a single time-point assessment, serves as a more powerful and clinically realistic indicator for predicting future sarcopenia risk. Recent years have seen machine learning (ML) algorithms demonstrate significant potential in leveraging longitudinal data for disease prediction [
18,
19]. Building on this, our study aims to develop and validate an ML-based risk prediction model using large-scale, long-term longitudinal cohort data. The core innovation of our model lies in its use of long-term depression trajectory patterns as key predictors. Our primary aims are to:
- (1)
develop an AI-powered early-warning system for sarcopenia in older adults by identifying high-risk individuals with specific depressive symptom trajectories;
- (2)
systematically demonstrate the predictive superiority of longitudinal trajectory data over conventional single-point assessments;
- (3)
identify core predictors of sarcopenia risk linked to depressive states, thereby pinpointing precise targets for designing subsequent multi-dimensional, personalized non-pharmacological interventions, thereby paving the way for cost-effective, population-level screening.
In parallel with conventional statistical approaches, artificial intelligence and machine learning (ML) have emerged as powerful tools for disease prediction. Several studies have begun to explore ML models for sarcopenia risk assessment. For instance, recent research has successfully employed algorithms such as Random Forests, XGBoost, and Support Vector Machines, primarily utilizing static, cross-sectional data encompassing anthropometric measurements, physical performance tests, and blood biomarkers [
20,
21]. While these studies demonstrate the feasibility of AI in this domain, a common limitation persists: the reliance on single-time-point assessments of risk factors. This approach fails to capture the temporal dynamics and heterogeneous progression of key modifiable predictors, such as depressive symptoms. Consequently, our study introduces a novel paradigm by integrating longitudinal trajectories of depressive symptoms, identified via Group-Based Trajectory Modeling, as core predictors within an ML framework. We hypothesize that this dynamic representation of mental health will provide superior predictive power for incident sarcopenia compared to models using only static assessments.
To our knowledge, this is the first study to attempt stratifying the risk of sarcopenia in older adults based on the long-term dynamic trajectories of depressive symptoms using machine learning. The findings from this research have the potential to provide a low-cost, scalable risk-stratification tool for geriatric medicine and psychiatry, facilitating a paradigm shift in clinical practice from reactive treatment towards proactive, preventive management.
2. Methods
2.1. Data Resource
This analysis leverages data from the China Health and Retirement Longitudinal Study (CHARLS), a longitudinal survey with national representation that commenced in 2011. To ensure the sample accurately reflects the national population of middle-aged and elderly Chinese, the study design utilized a multi-stage, probability-proportional-to-size sampling approach, with analytical weights provided for generating national estimates. All study procedures complied with the ethical standards of the Declaration of Helsinki and were approved by the Biomedical Ethics Committee of Peking University (IRB00001052-11015). Prior publications detail the full cohort profile, and all participants provided written informed consent [
22]. The baseline survey in 2011 enrolled 17,708 individuals from 28 provinces through structured, in-person interviews that gathered extensive demographic, health, and biomarker data. Follow-up data are collected every two to three years. An additional recruitment wave in 2015 expanded the total sample size to 21,095 participants.
2.2. Study Participants
Based on the CHARLS 2011 wave, participants were included as the baseline cohort and subsequently excluded if they met any of the following criteria: (1) unavailable sarcopenia assessment data; (2) incomplete physical performance measures, including handgrip strength (HGS), five-repetition sit-to-stand test (5-CST), or the 6-min walk test (6-WT)—noting that individuals under 60 years of age were exempt from the 6-WT per protocol and were classified as having normal results for this component; (3) missing data on age, sex, height, or weight; (4) lack of follow-up depression data.
2.3. Sarcopenia Assessment
Sarcopenia was defined according to the algorithm derived from the Asian Working Group for Sarcopenia (AWGS) criteria [
23], as operationalized in the CHARLS dataset. The diagnosis was based on three components: low muscle strength, low physical performance, and low muscle mass.
Low Muscle Strength: Was assessed by handgrip strength (HGS). The maximum value from the left and right hands was averaged. Low muscle strength was defined as an average grip strength of <28 kg for men and <18 kg for women.
Low Physical Performance: Was assessed using the 5-time chair stand test (5-CST). Low physical performance was defined as a time taken to complete five stands ≥12 s.
Low Muscle Mass: Was determined by the appendicular skeletal muscle mass index (ASM/height2). The ASM was estimated using a validated anthropometric equation. Low muscle mass was defined as an ASM/height2 <6.88 kg/m2 for men and <5.69 kg/m2 for women.
Participants were then categorized into four mutually exclusive groups based on these components: (1) No Sarcopenia: Participants with normal muscle mass. (2) Possible Sarcopenia: Participants with low muscle mass, but with normal muscle strength and normal physical performance. (3) Sarcopenia: Participants with low muscle mass, plus either low muscle strength or low physical performance. (4) Severe Sarcopenia: Participants with low muscle mass, low muscle strength, and low physical performance.
2.4. Depression Assessment
Depressive symptoms were evaluated with the 10-item Center for Epidemiologic Studies Depression Scale (CESD-10), an instrument designed to measure the frequency of depressive experiences during the previous week. The CESD-10 includes ten questions, categorized into eight items reflecting negative feelings or behaviors and two items indicating positive feelings or behaviors. Responses for negative items were scored according to their frequency: 0 points for less than 1 day, 1 point for 1–2 days, 2 points for 3–4 days, and 3 points for 5–7 days. The two positive items were scored in reverse. Summing all item scores yielded a total score ranging from 0 to 30, where a higher total score corresponds to greater depressive severity. The psychometric properties, including reliability and validity, of the CESD-10 have been confirmed in prior research [
24]. Consistent with methodological precedents [
25], a cut-off score of 10 was applied to define depression as a binary variable. Accordingly, participants with a total CESD-10 score ≥ 10 were categorized as having clinically significant depressive symptoms.
2.5. Other Input Variables
Other input variables were selected at baseline (Wave 1), collected primarily through questionnaires and physical measurements. These variables were categorized as follows: demographic factors (sex, age, residence/province, marital status), lifestyle factors (nocturnal sleep duration, smoking, alcohol consumption, life satisfaction, social activity, exercise), health status (pain, self-rated health), disease-related factors (activities of daily living, hypertension, dyslipidemia, diabetes, disability, tooth loss, fracture, chronic disease status, cognitive function), socioeconomic factors (education level, income), and physical examination data (waist circumference, body mass index). To minimize bias due to extensive missing data, participants with more than 20% missing information across the input variables at Wave 1 were excluded from the analysis.
2.6. Trajectory Analysis
We employed Group-Based Trajectory Modeling (GBTM) on CESD-10 scores from Waves 1 to 4 to identify distinct subgroups of older adults with similar long-term depressive symptom patterns. We estimated models with one to six trajectory classes. The optimal number of latent trajectories was determined by comparing these models using several key metrics: (1) Information Criteria: The Bayesian Information Criterion (BIC) and the Akaike Information Criterion (AIC) were used as the primary statistical criteria. Lower values indicate a better model fit, with BIC placing a stronger penalty on model complexity. (2) Classification Quality: The Average Posterior Probability (AvePP) for each class was examined to assess the accuracy of class assignment. AvePP values above 0.70 for all classes are considered indicative of good classification certainty. (3) Class Proportions and Interpretability: The substantive meaning and clinical relevance of the trajectories, along with the proportion of individuals in each class, were critically evaluated. We required that the final solution yield distinct, interpretable patterns with all class proportions being substantively meaningful. We primarily employed the Group-Based Trajectory Modeling (GBTM) approach, specifically the Latent Class Growth Model (LCGM) which assumes homogeneity within classes, for its parsimony and clinical interpretability. To justify this choice, we conducted a sensitivity analysis comparing LCGM with the more flexible Growth Mixture Model (GMM), which allows for within-class variation. As presented in
Supplementary Table S1, for the optimal class 3 solution, the GMM did not yield a superior fit compared to the LCGM (SABIC values were identical: 46,742.96), while the LCGM solution demonstrated high classification accuracy (Entropy = 0.80). Given the comparable fit and our primary goal of identifying distinct, interpretable subgroups for downstream prediction, the more parsimonious LCGM was selected for all subsequent analyses.
The comprehensive results of this model comparison are presented in
Section 3.2. Based on this assessment, the three-class trajectory model was selected as the optimal solution. The trajectory group assigned to each individual was subsequently used as a key stratification variable in the prediction models for sarcopenia.
To address the potential sensitivity of downstream predictive models to the number of trajectory classes, we conducted a sensitivity analysis by estimating GBTM solutions with two to five classes. While models with four or five classes showed comparable statistical fit in terms of BIC (e.g., the five-class model achieved a BIC of −20,076.19), the three-class solution was ultimately selected as the optimal model. This decision was based on its superior balance of statistical fit, high classification certainty (all Average Posterior Probabilities > 0.79), and, most critically, its clearer clinical interpretability and the substantive meaning of the resulting trajectories (‘Persistently Low’, ‘Persistently Moderate’, and ‘Persistently High’). The trajectories and cross-dataset model performance for the five-class solution are provided in the
Supplementary Figures S1 and S2 for reference. This approach of aligning the structural assumptions of the trajectory model with the requirements of the downstream predictive task is consistent with best practices in hybrid analytical frameworks [
26].
2.7. Predictive Model Development and Evaluation
We addressed the issues of missing data and class imbalance with the following rigorous protocol. First, to handle missing values in the 28 input variables, we applied a comprehensive, adaptive multiple imputation strategy. The imputation was performed using the IterativeImputer from the scikit-learn library, which employs a chained equations approach. A RandomForestRegressor (with n_estimators = 20) was used as the underlying predictive model for continuous variables within the iterative imputer, which was run for max_iter = 10 iterations to achieve convergence. To enhance the biological plausibility of the imputations, we tailored the strategy for different variable categories based on their epidemiological characteristics: Health status variables (e.g., hypertension, diabetes, chronic disease) were imputed using a combination of individual historical data (forward/backward filling where available) followed by mode imputation; Lifestyle variables (e.g., smoking, alcohol consumption) were imputed using longitudinal patterns; Cognitive function variables (e.g., total cognition score) were imputed based on linear regression models incorporating age; Socioeconomic variables (e.g., income) were imputed using stratified means/modes based on geographical region; Categorical variables were imputed using the mode. We generated m = 5 complete datasets, each with a different random seed (42 + i for i = 1 to 5). The final analysis used the aggregated results from these five datasets. The imputation process was successful, with a 100% imputation rate, reducing the missingness from the original count to zero across all 28 processed variables.
To assess the potential impact of selection bias introduced by our inclusion criteria (which required complete data across waves), we conducted a sensitivity analysis. We compared the baseline characteristics of participants included in the final analytical sample (n = 6125) with those who were excluded due to missing data (n = 5481). As presented in
Supplementary Table S2, the two groups differed significantly in a number of demographic, socioeconomic, and health-related characteristics. The excluded participants were, on average, younger, more likely to be female, had a lower BMI, and had a lower prevalence of chronic conditions such as high blood pressure. However, critically, the two groups did not differ significantly in the levels of the key exposure variable, depressive symptoms (CESD-10 score,
p = 0.795), or in cognitive function (total cognition score,
p = 0.104). This pattern suggests that while our analytical sample is not fully representative of the entire baseline cohort on some covariates, the core relationships under investigation between mental trajectory and physical outcome may be less affected.
Second, to mitigate the significant class imbalance arising from the lower prevalence of sarcopenia (which can compromise model performance), we implemented the Synthetic Minority Over-sampling Technique (SMOTETomek). Crucially, this resampling was applied exclusively during the training phase of the 10-fold cross-validation, ensuring that the final model evaluation was performed on a pristine, unaltered test set. This strict separation, combined with the inherent robustness of tree-based ensembles like Random Forest and XGBoost, effectively guards against overfitting and provides a reliable estimate of model generalizability to new, imbalanced data. Consequently, we employed the weighted F1-score as our primary evaluation metric to ensure a balanced assessment of precision and recall across all classes.
In this study, seven machine learning algorithms were employed to develop predictive models for sarcopenia risk based on dynamic depression trajectories, including logistic regression (LR), random forest (RF), XGBoost, multilayer perceptron (MLP), recurrent neural network (RNN), long short-term memory (LSTM), and Transformer. Among them, LR serves as a classical statistical baseline model offering high interpretability [
27]. RF and XGBoost represent powerful ensemble methods based on bagging and boosting principles, respectively, which enhance predictive performance by combining multiple decision trees while mitigating overfitting [
28,
29]. To capture complex temporal patterns in longitudinal depression data, we also implemented several deep learning architectures: MLP as a foundational feedforward network [
30], RNN and LSTM for modeling sequential dependencies, and the Transformer model to leverage self-attention mechanisms for capturing long-range interactions in symptom progression [
31,
32].
To ensure robust model development and evaluation, the dataset was randomly partitioned into a temporary training set (80%) and a held-out test set (20%) [
33]. We adhered to standard machine learning protocols, employing 10-fold cross-validation on the training set for hyperparameter optimization [
34]. Model performance was comprehensively evaluated on the independent test set using multiple metrics: accuracy to assess overall predictive performance, the weighted F1-score, along with precision and recall individually to provide detailed insights into the model’s predictive characteristics. Given the class imbalance in our dataset, we used the weighted F1-score as the primary metric to balance precision and recall across classes. The 95% confidence intervals for test accuracy were calculated and reported to quantify the uncertainty of the performance estimates. Statistical significance was determined through hypothesis testing to confirm that model performances were better than random chance. Furthermore, we analyzed feature importance patterns from the best-performing classifiers across different trajectory groups to identify key predictors.
3. Results
3.1. Population Demographics
The baseline characteristics of the study participants, stratified by their depressive symptom trajectories, are presented in
Table 1. Based on the depressive symptom trajectories, Group 1 (persistently low depressive symptom group) was characterized by a higher proportion of males, urban residents, and individuals with higher income and education levels. In contrast, Groups 2 and 3 (persistently moderate and persistently high depressive symptom groups) showed a higher prevalence of females, rural residents, lower socioeconomic status, poorer self-reported health, and higher rates of comorbidities, body pain, ADL disorders, and disabilities. Additionally, more severe depressive symptoms were associated with shorter sleep duration and lower cognitive scores.
3.2. Heterogeneous Trajectories of Depressive Symptoms
Based on the model fit statistics (
Table 2), the three-class solution was selected as the optimal trajectory model for depressive symptoms. While the Bayesian Information Criterion (BIC) continued to decrease through the five-class model, indicating potential statistical improvement, the three-class model was chosen based on a superior balance of statistical fit and clinical utility. Crucially, the three-class solution demonstrated excellent classification accuracy, with all Average Posterior Probabilities (APP) exceeding 0.79, well above the 0.70 threshold that indicates clear and reliable class separation. In contrast, models with four or more classes contained at least one trajectory group with an APP below 0.70 (e.g., APP = 0.69 for a class in the 4-class model), signifying deteriorating classification certainty. Furthermore, the three-class structure—identified as Group 1 (Persistently Low), Group 2 (Persistently Moderate), and Group 3 (Persistently High)—yielded substantively meaningful, distinct trajectories with robust class proportions (all > 18%), thereby ensuring clear interpretability and clinical relevance for subsequent risk prediction. Heterogeneous trajectory classes of depressive symptoms are shown in
Figure 1. The final three-group trajectory model of depressive symptoms in middle-aged and older adults from CHARLS is presented in
Table 3.
3.3. Cross-Dataset Performance Benchmarking of Machine Learning Models
To comprehensively evaluate the predictive performance and generalizability of our approach, we benchmarked seven machine learning algorithms across three independent datasets derived from distinct depressive symptom trajectories. The models included both classical and advanced architectures: Logistic Regression (LR) as an interpretable baseline, tree-based ensemble methods (Random Forest [RF], XGBoost), and deep learning models (Multilayer Perceptron [MLP], Recurrent Neural Network [RNN], Long Short-Term Memory [LSTM], and Transformer).
The aggregated performance metrics (Accuracy and Weighted F1-score) for all models across the three datasets are summarized in
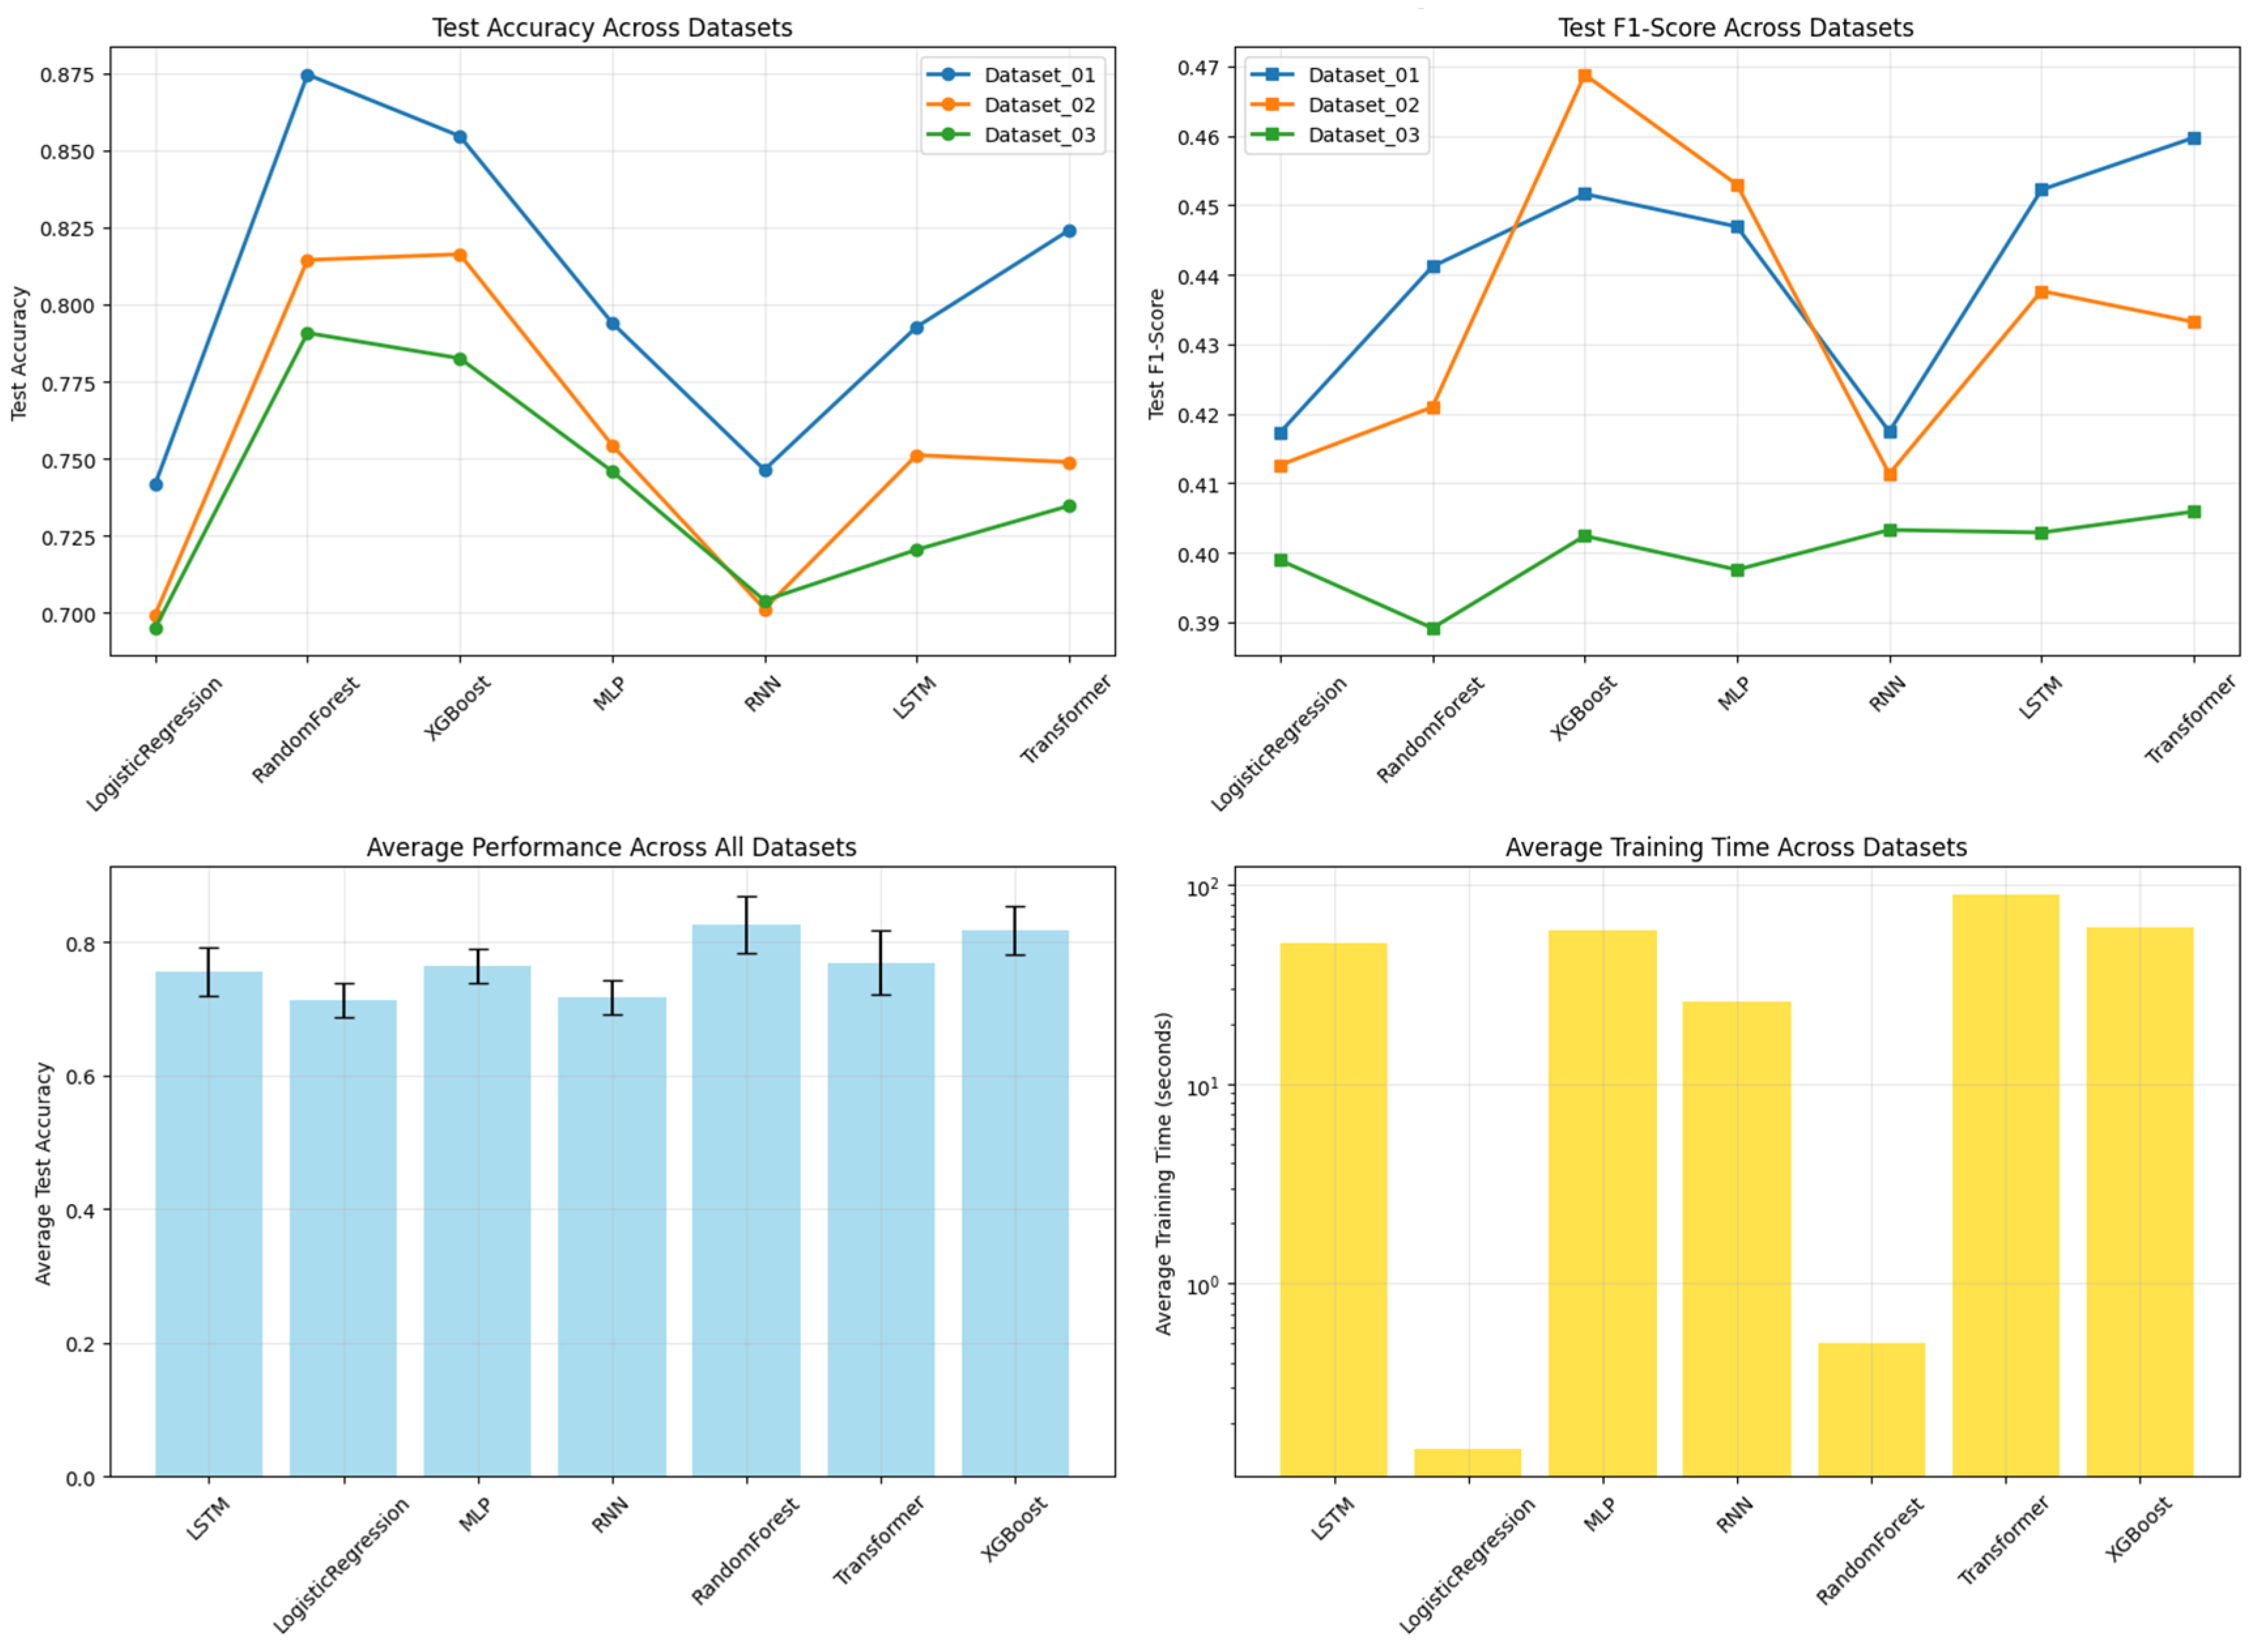
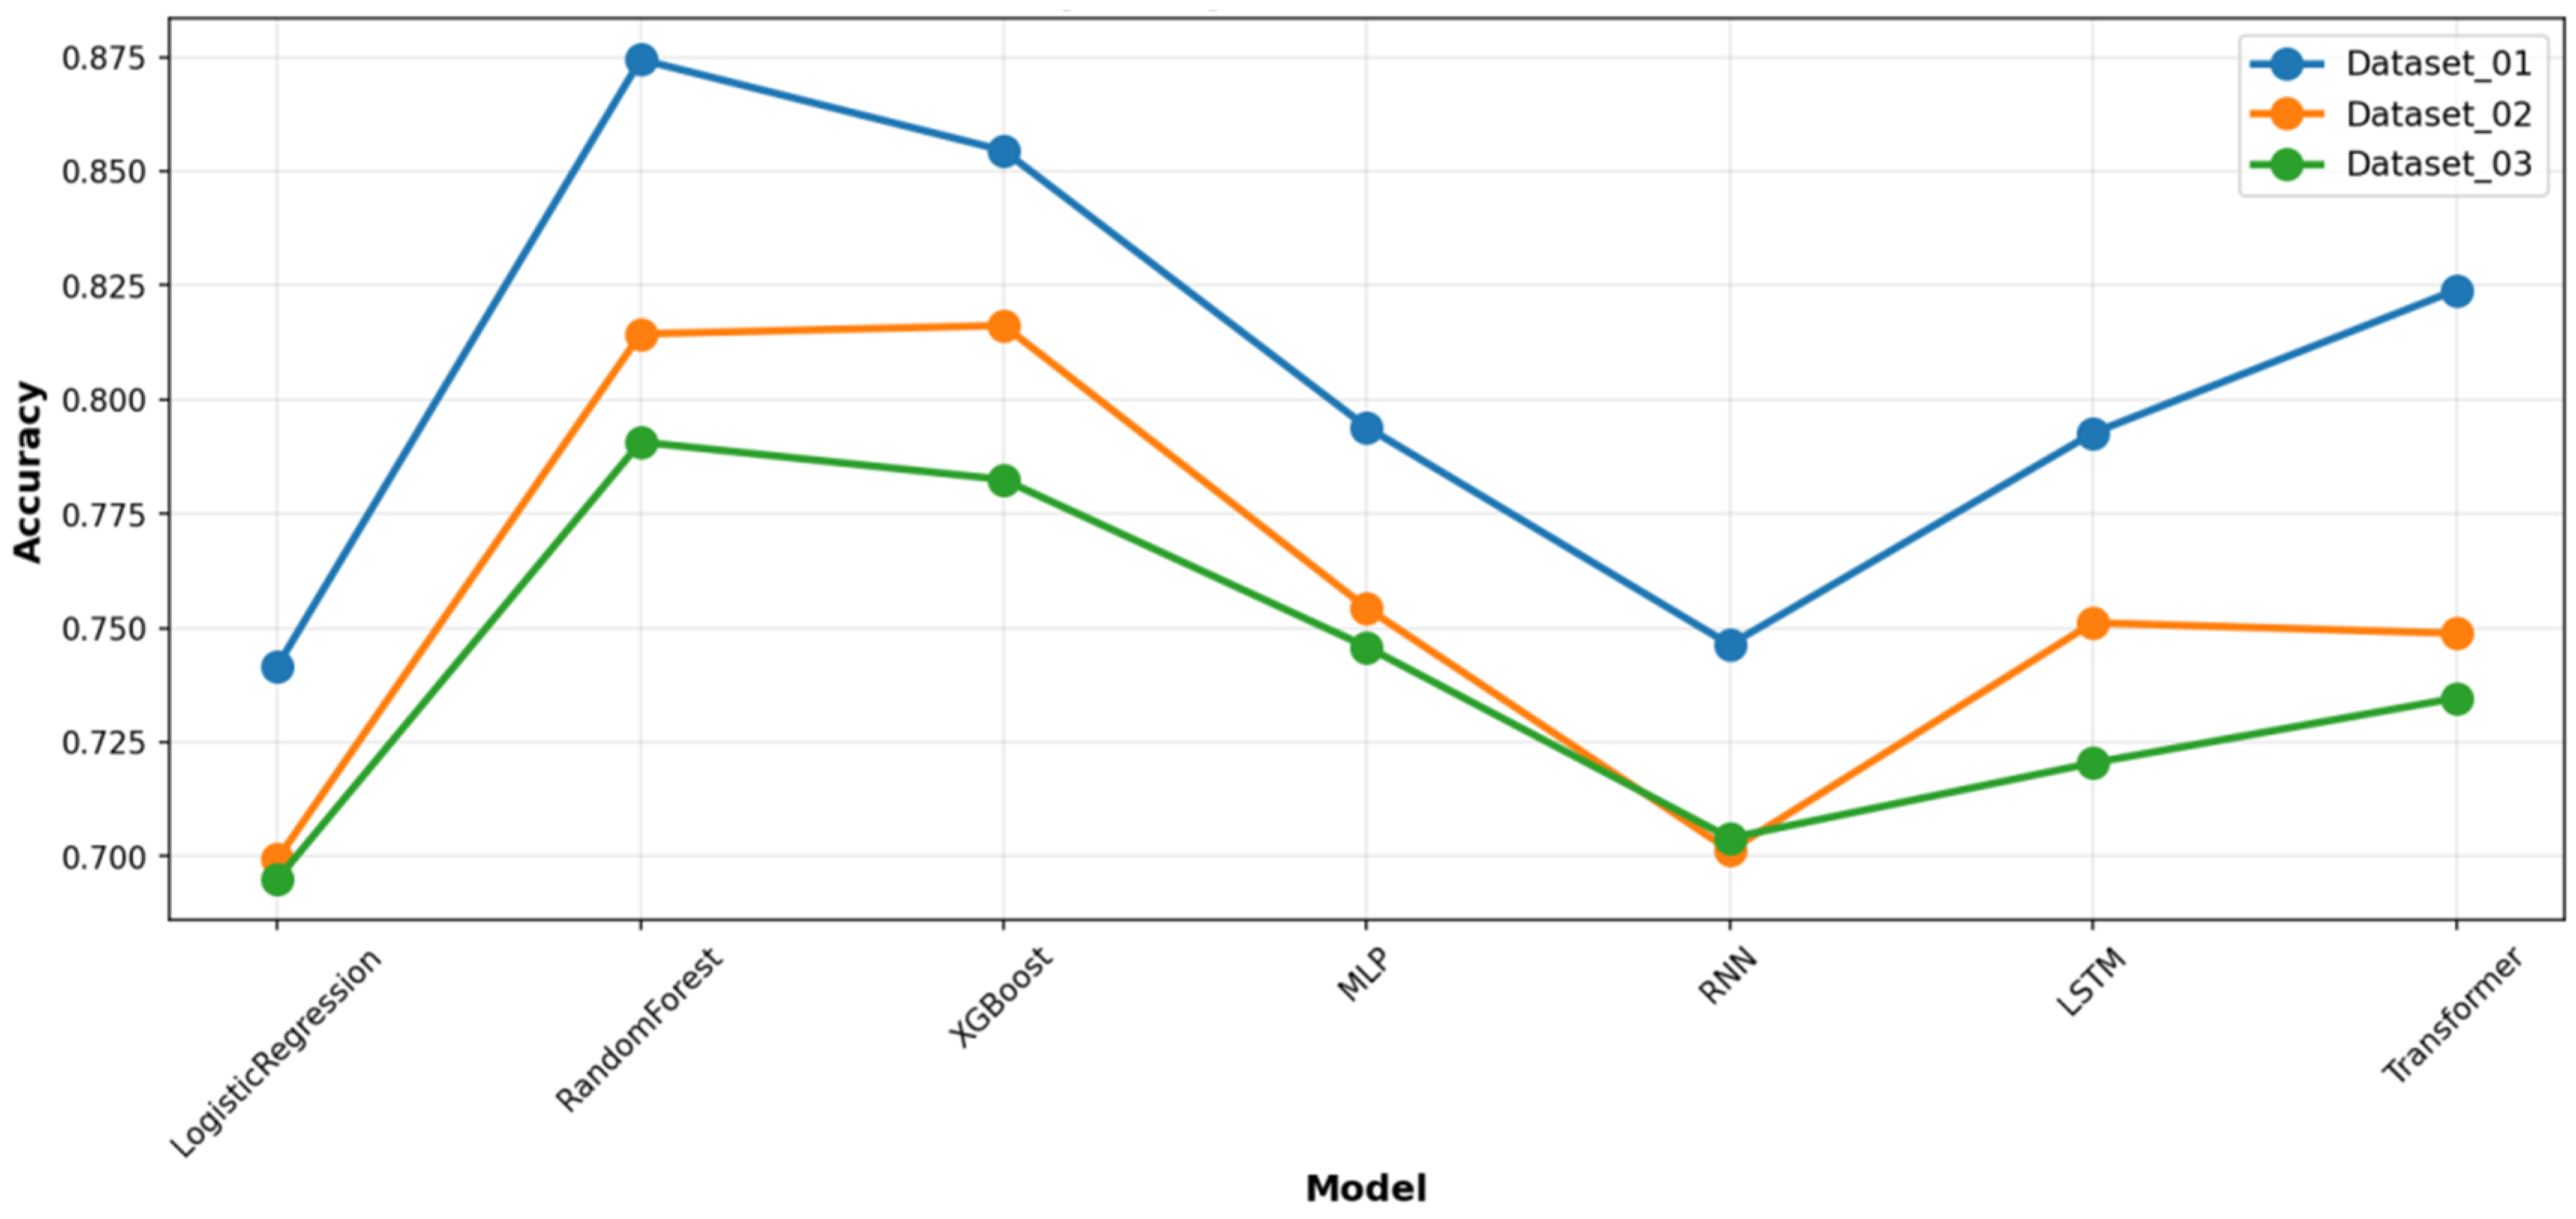
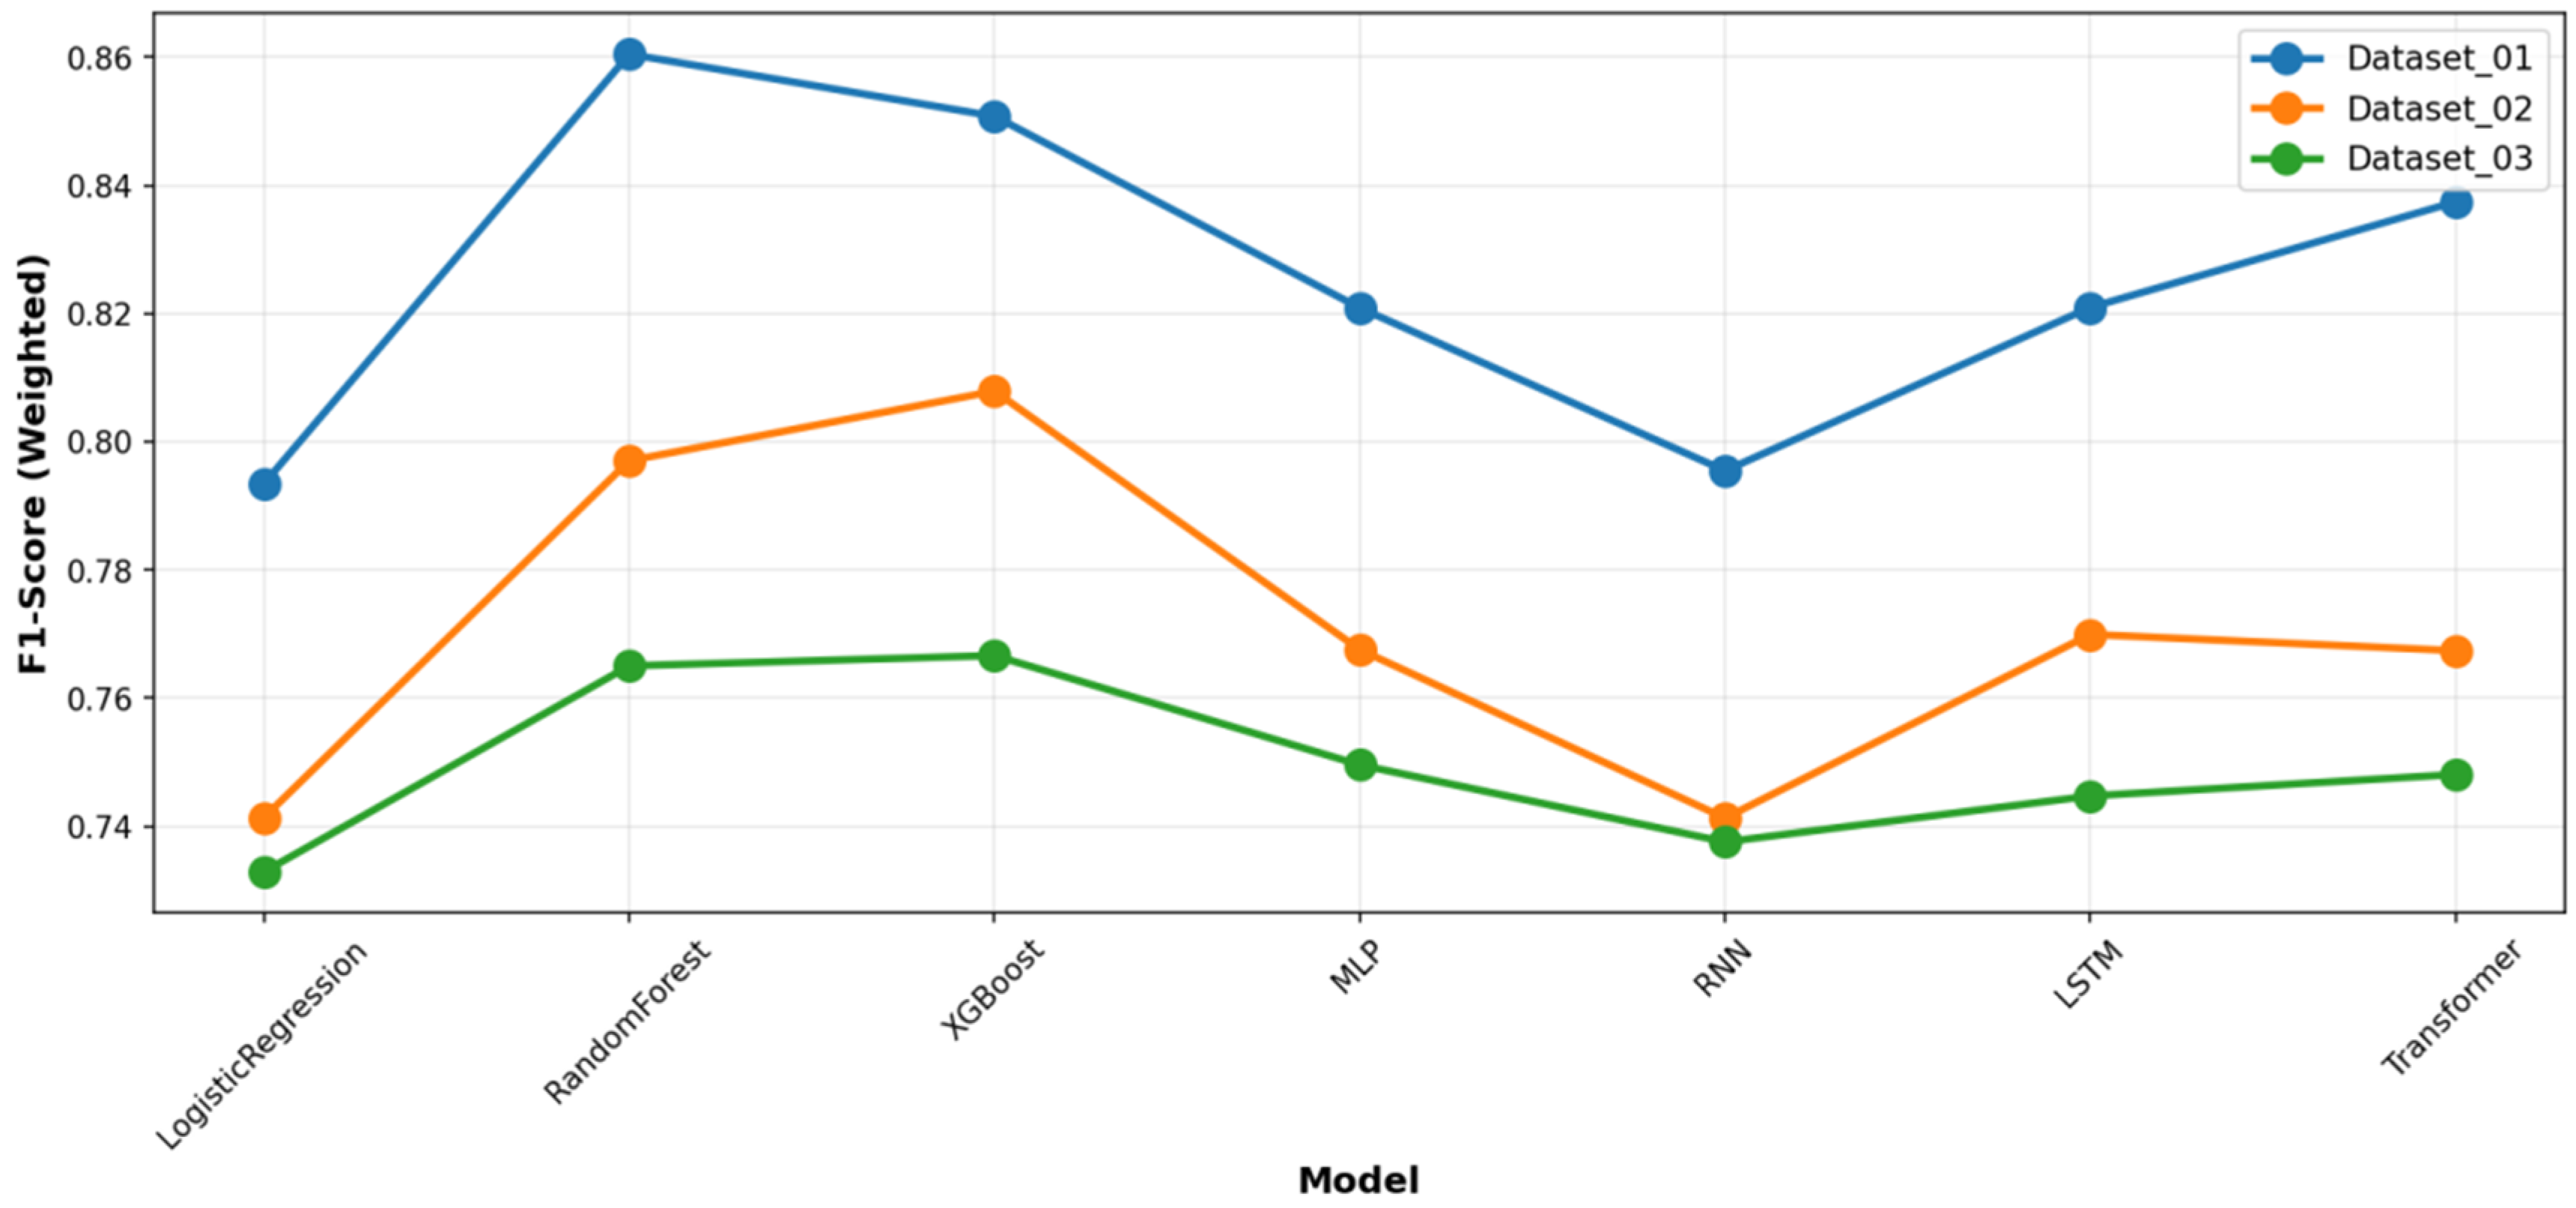
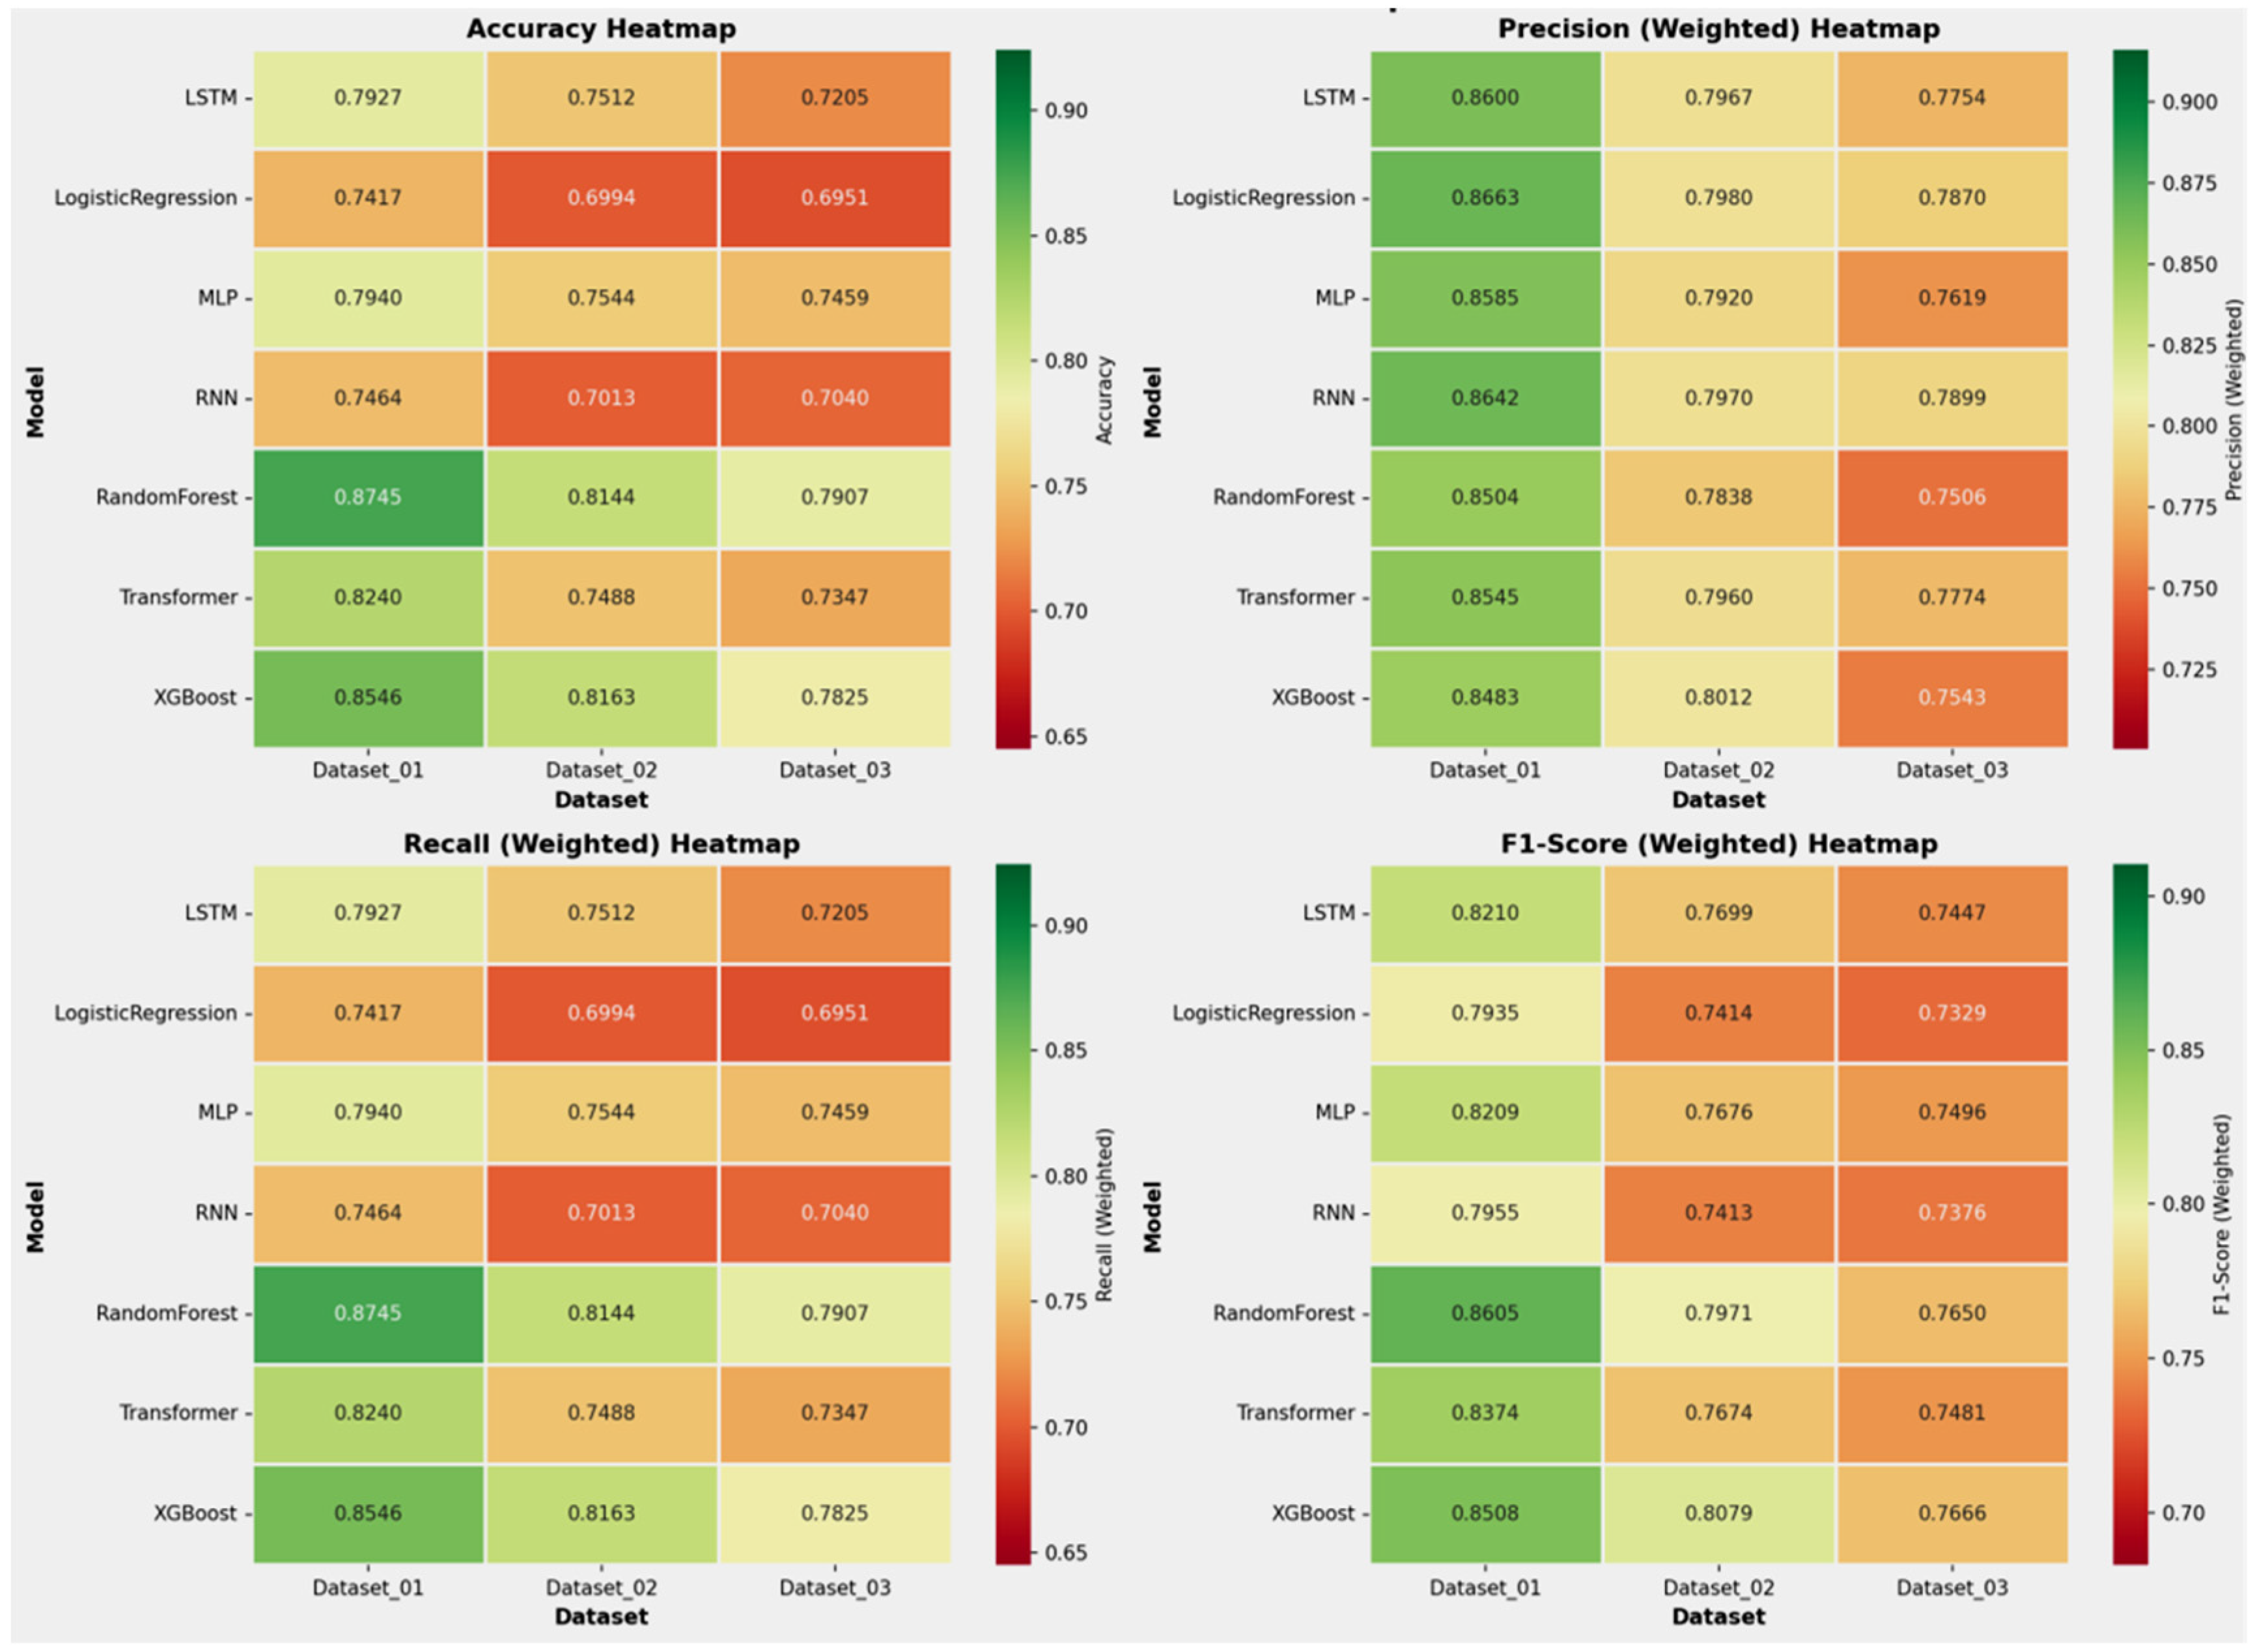
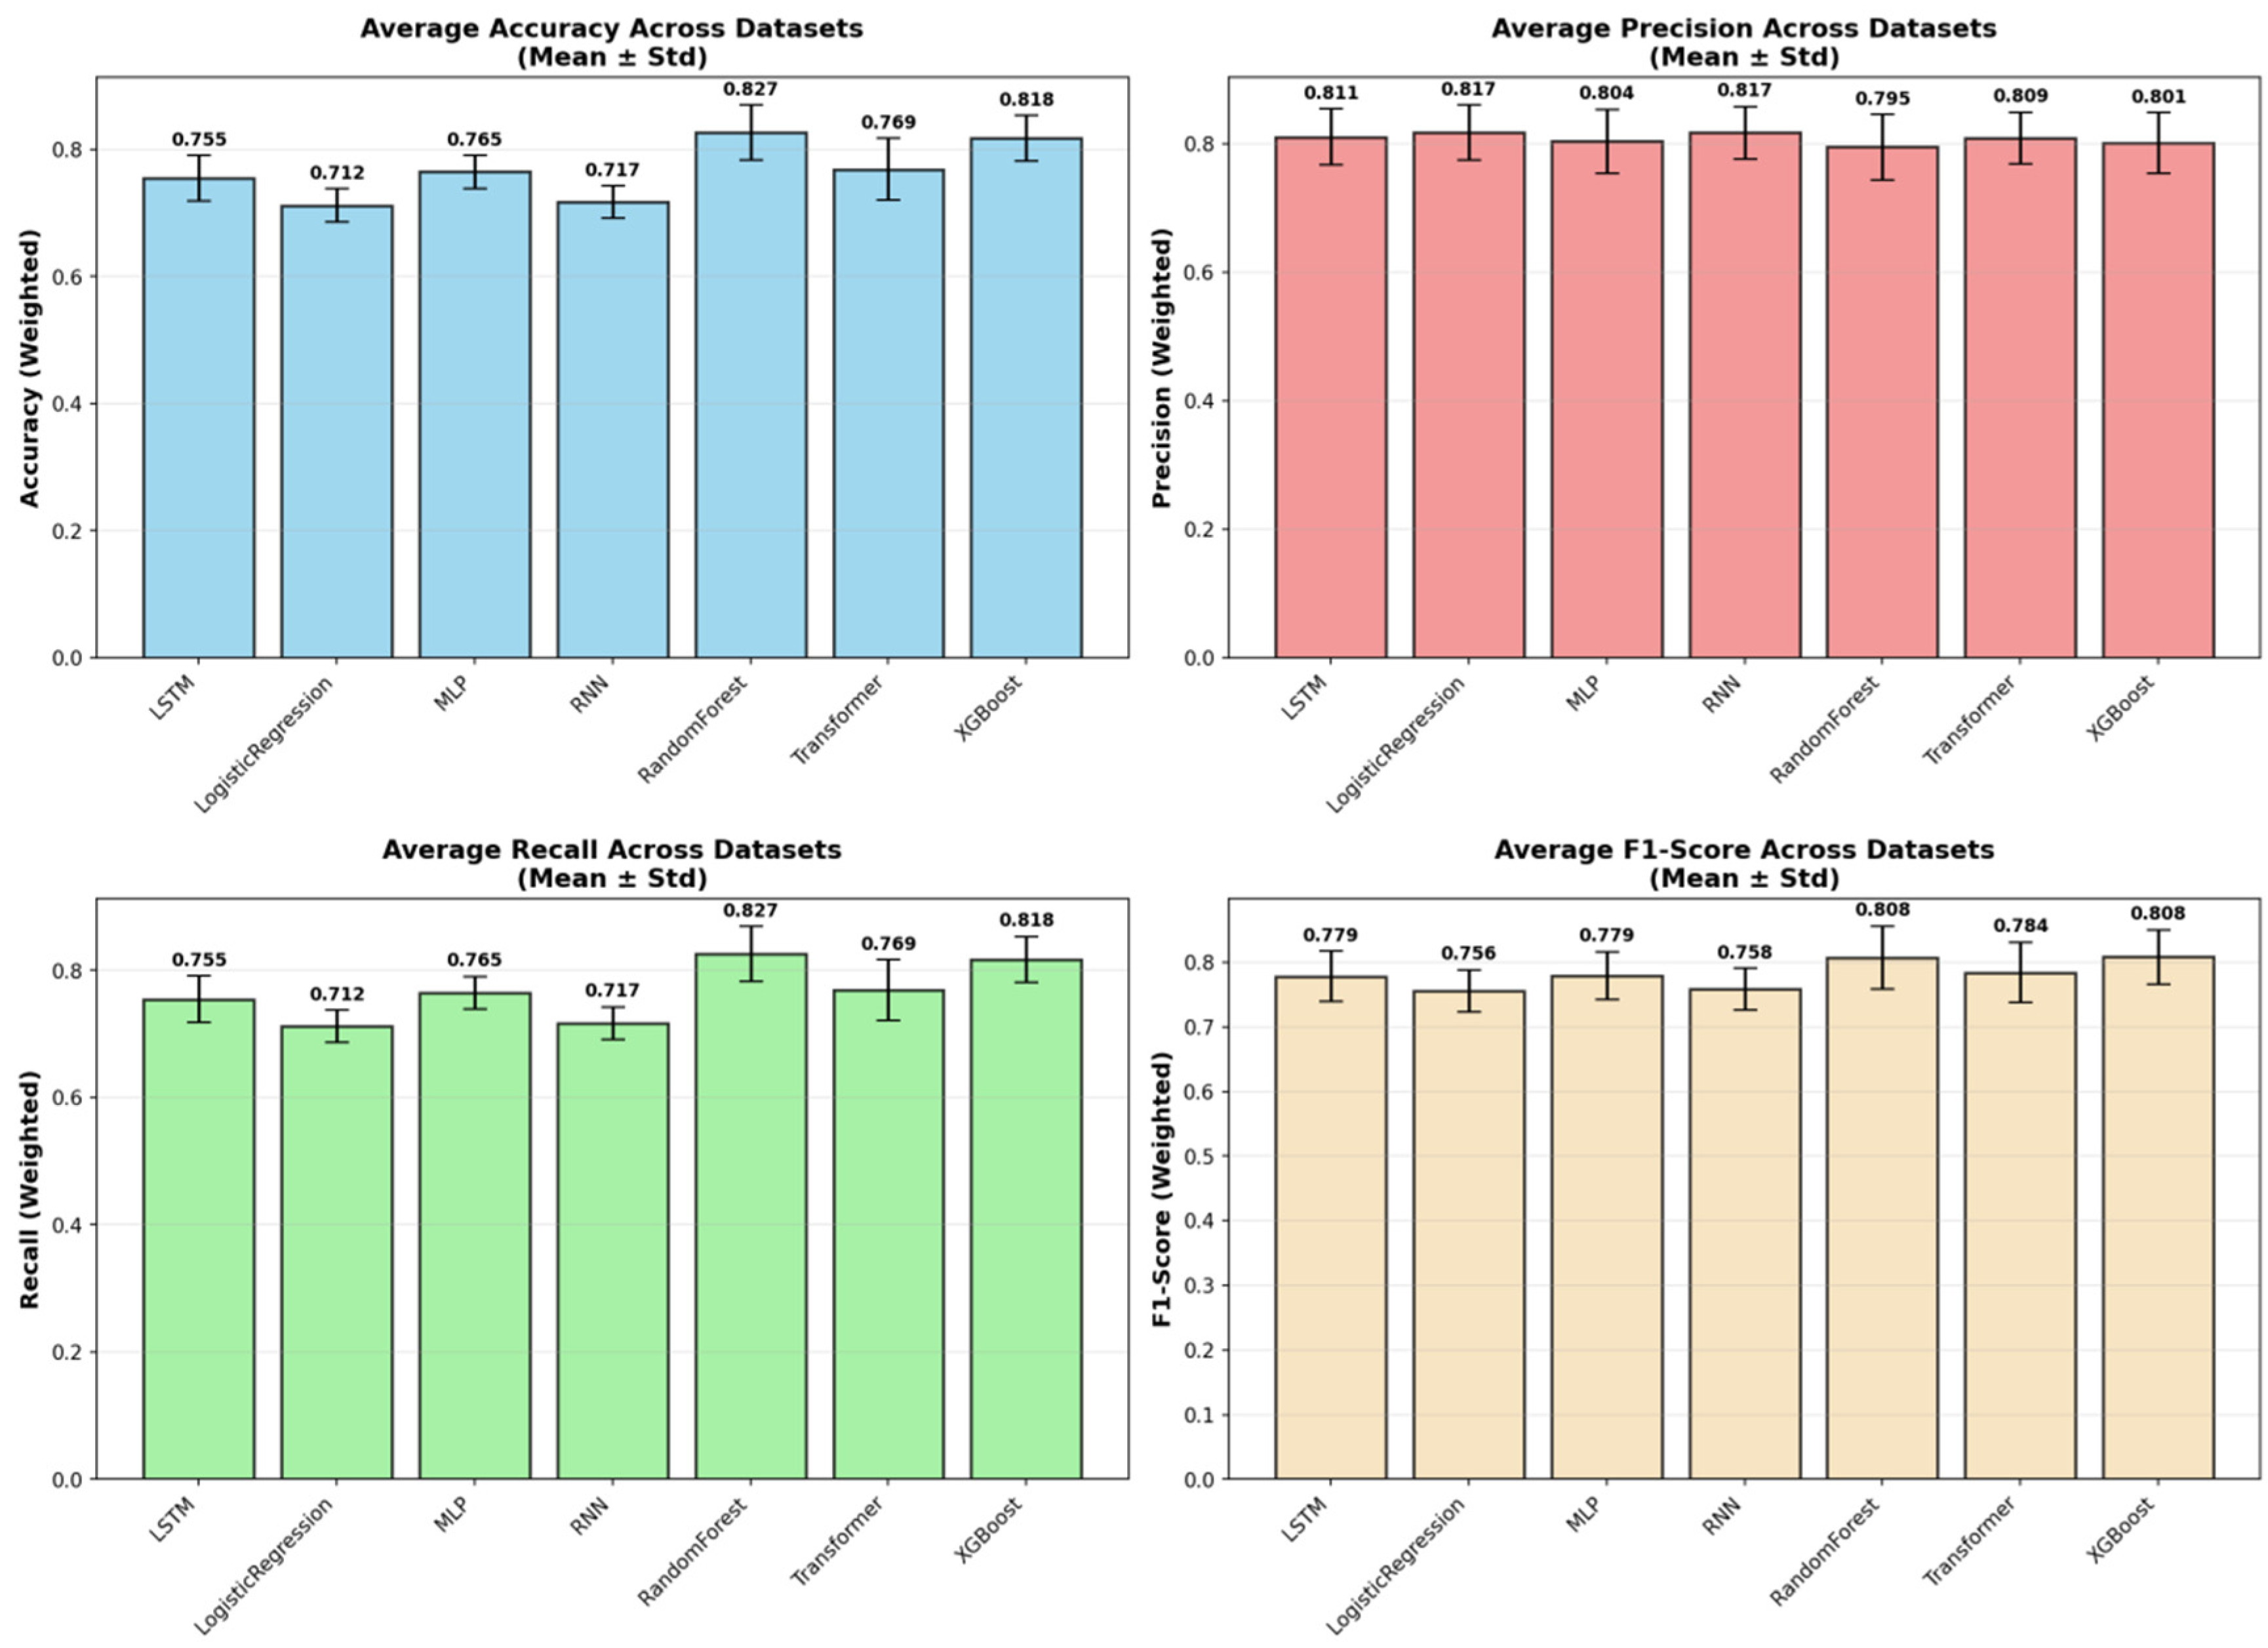
Table 4. Across all benchmarks, the tree-based ensemble methods, RF and XGBoost, consistently demonstrated superior and robust performance. RF achieved the highest mean accuracy (0.8265), while XGBoost attained the highest mean Weighted F1-score (0.8084), a critical metric given the class imbalance in our data. The consistent superiority of these two models across all three datasets is visually apparent in the overall performance comparison (
Figure 2), as well as in the detailed accuracy and F1-score comparisons (
Figure 3 and
Figure 4, respectively). A detailed analysis of class-wise performance, as visualized in the detailed heatmaps (
Figure 5), revealed a consistent challenge: the accurate identification of the minority class (Class 2). The overall stability and variability of each model across all evaluation metrics are further visualized in
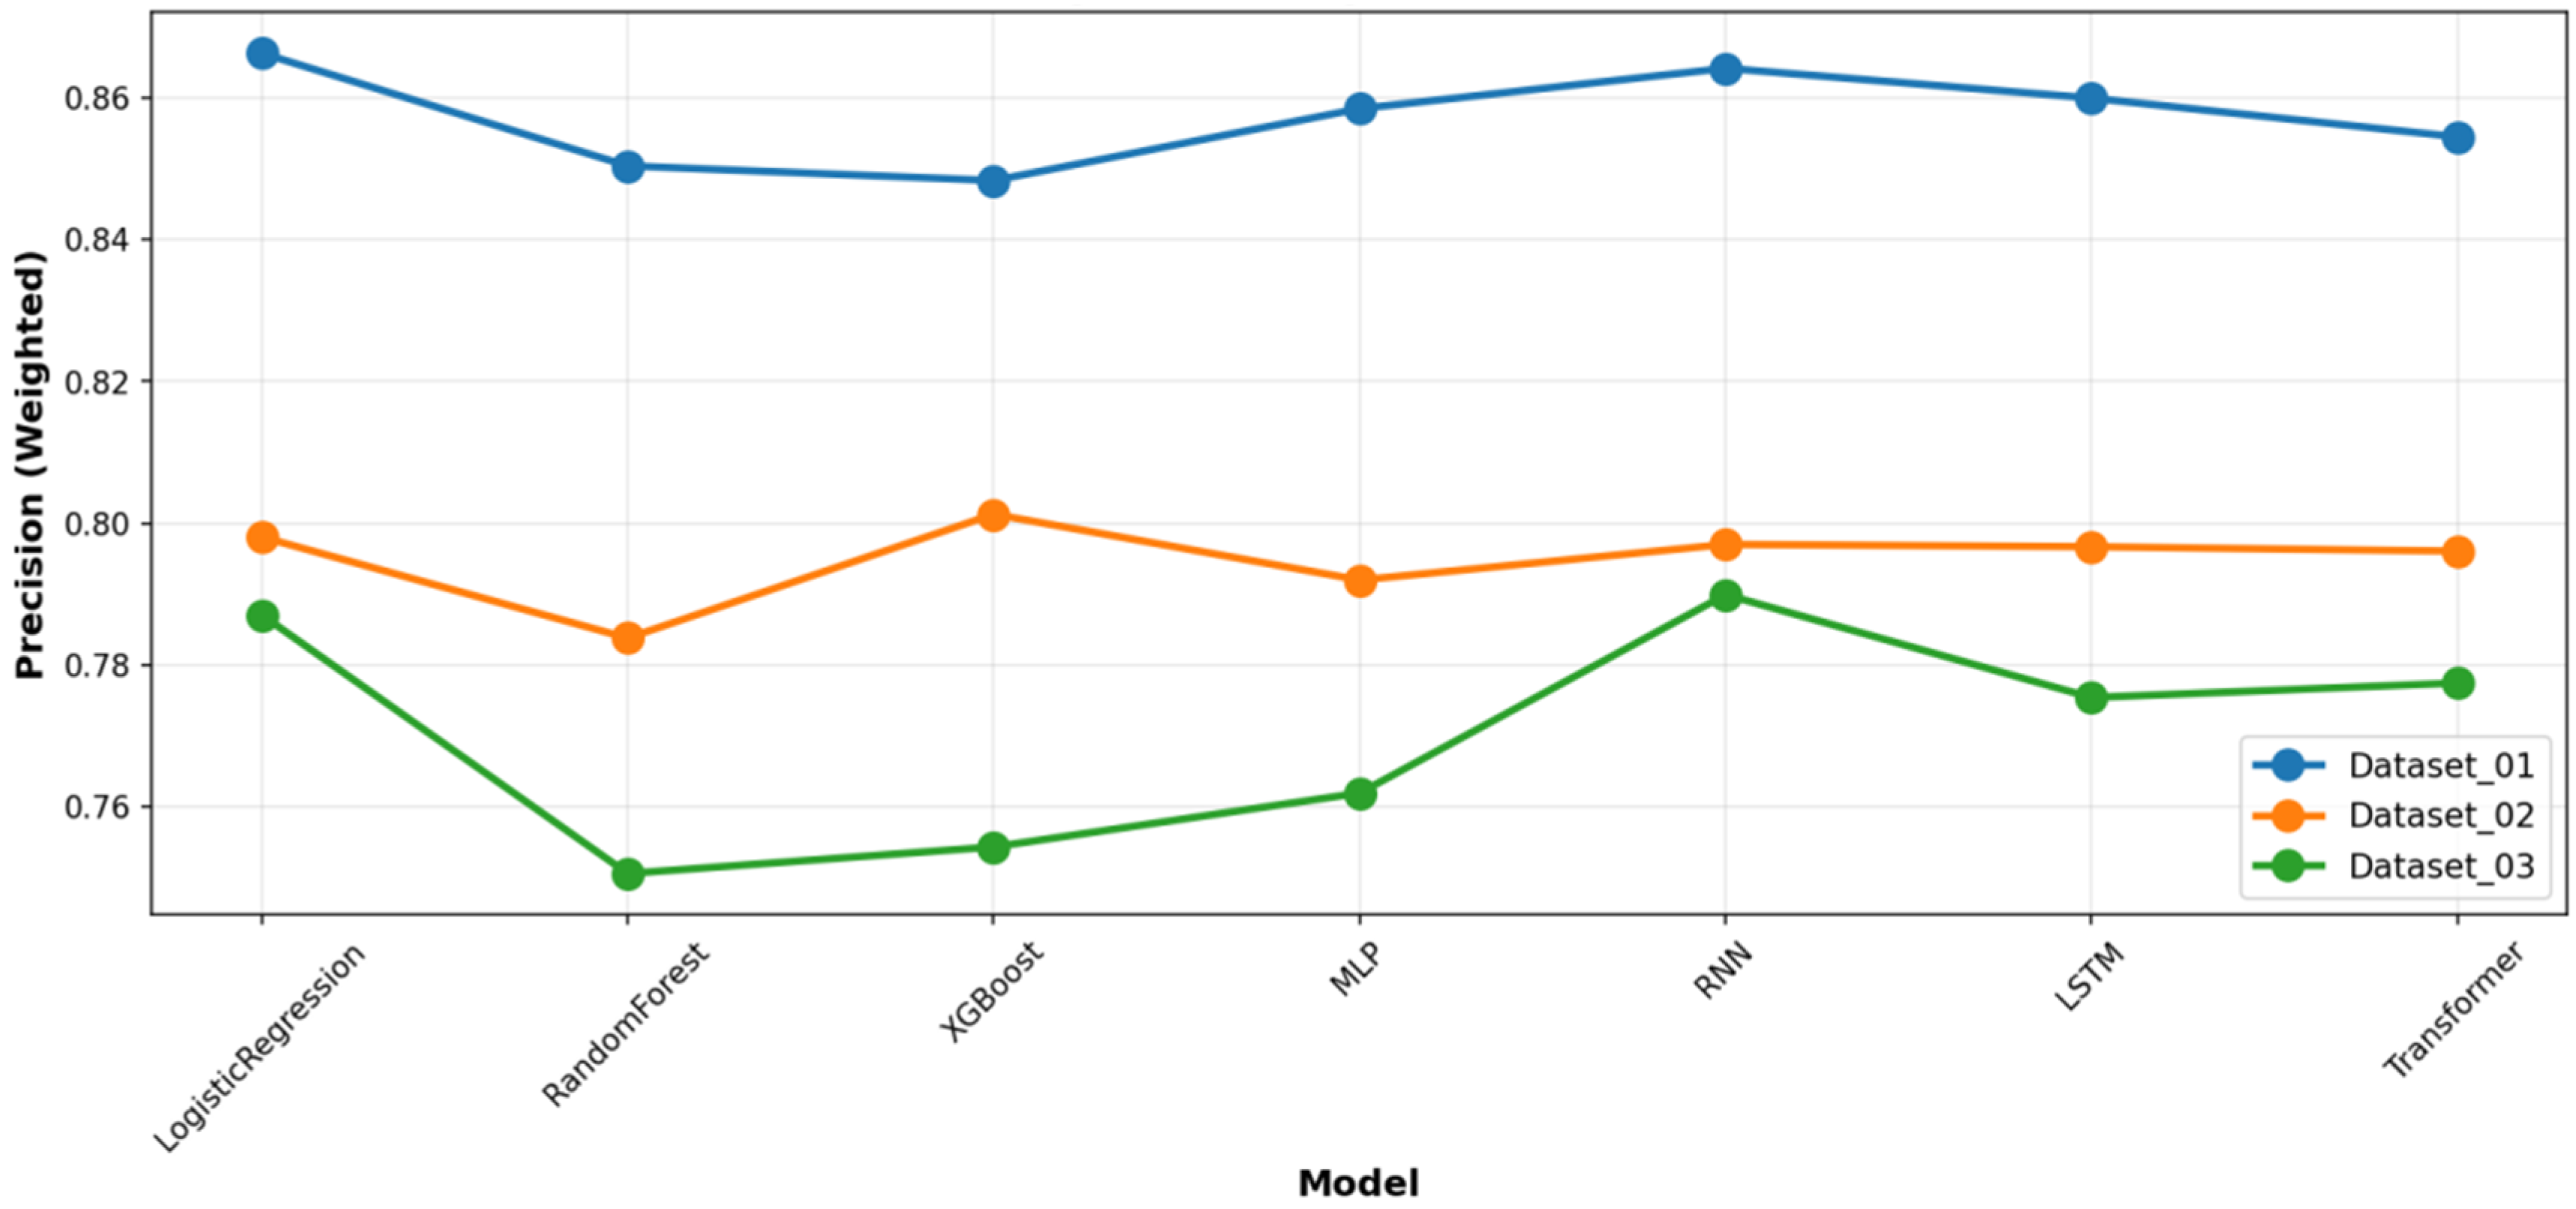
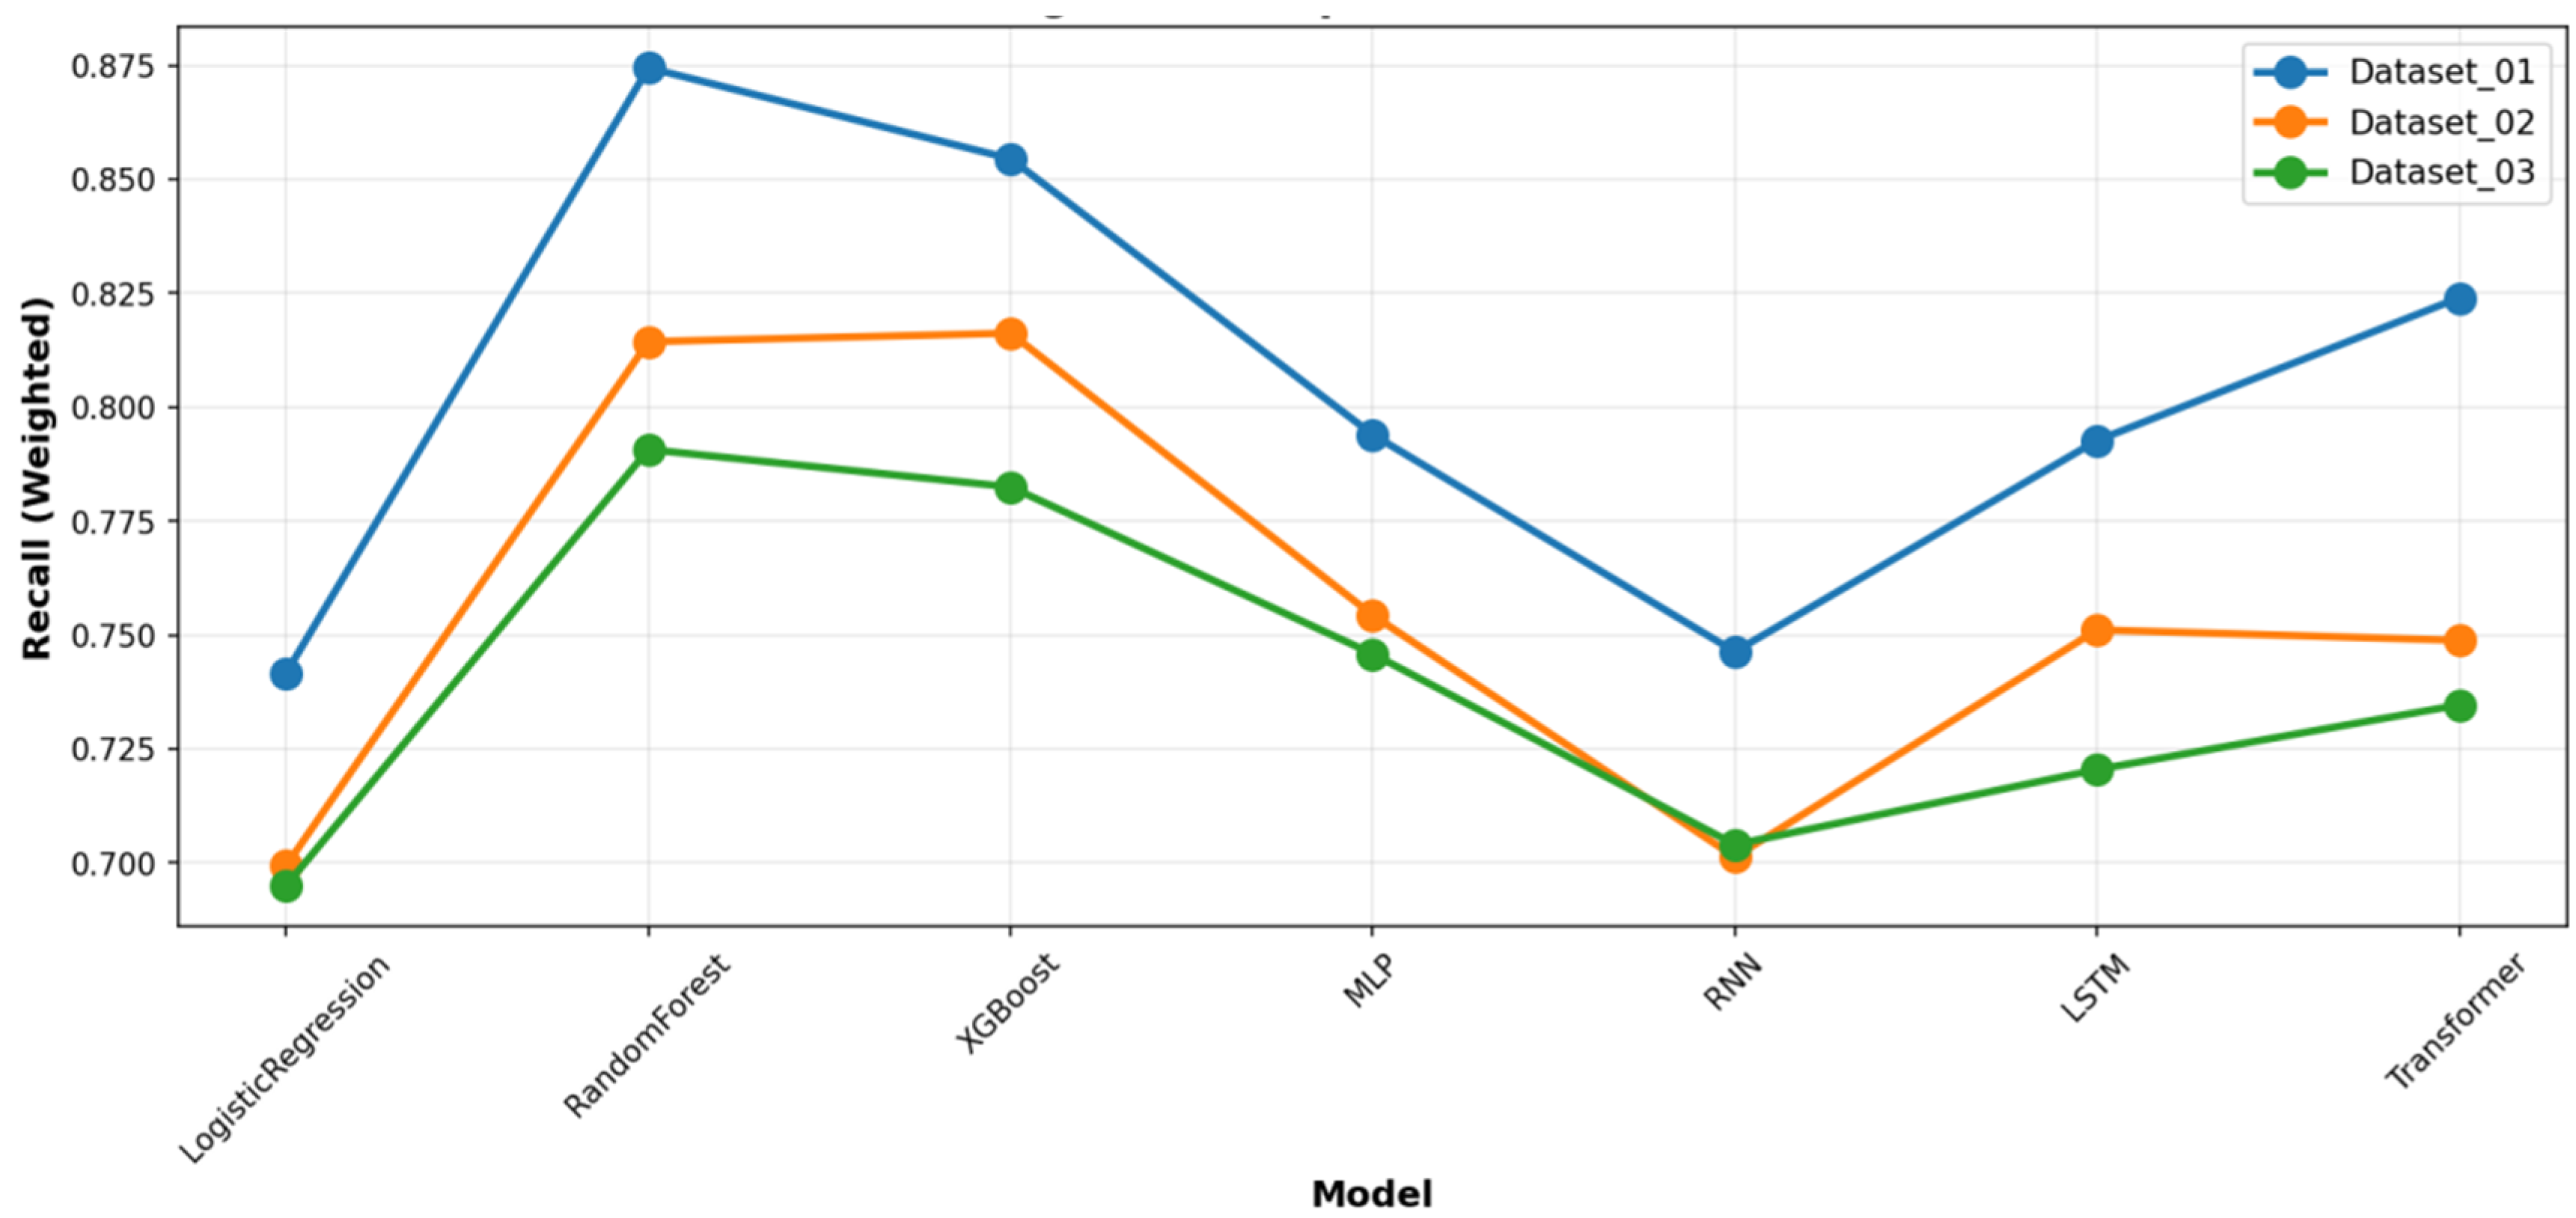
Figure 6, which presents the mean and standard deviation of the results. To provide a complete picture of the models’ predictive characteristics, we also compared their weighted precision (
Figure 7) and weighted recall (
Figure 8) across the datasets. The performance ranking remained remarkably stable: RF and XGBoost occupied the top two positions in all three datasets.
Despite their capacity to model complex temporal patterns, deep learning models (MLP, RNN, LSTM, Transformer) were, on average, outperformed by the ensemble methods (
Figure 2,
Figure 3,
Figure 4 and
Figure 5). Notably, the Transformer model achieved competitive accuracy on Dataset_01 (0.824), suggesting an aptitude for capturing specific long-term temporal dependencies in depressive symptoms. However, its performance exhibited greater variability across datasets compared to the more stable tree-based ensembles. The deep learning models showed clear signs of overfitting and demonstrated poor generalization capability. Furthermore, all deep learning models required substantially greater computational resources for training. This establishes the practical superiority of tree-based ensembles for this specific prediction task.
As indicated in
Figure 4 and detailed in
Supplementary Table S3, a consistent challenge was the accurate identification of the minority class (Class 2), which represented the smallest patient subgroup across all datasets. This is a known limitation in machine learning with highly imbalanced data. However, for the larger and clinically significant classes (Class 1, 3, and 4), RF and XGBoost provided reliable and substantially better discrimination than other models, as evidenced by their higher performance in the relevant metrics.
This comprehensive cross-dataset benchmarking, synthesizing evidence from all performance metrics and visualizations (
Figure 2,
Figure 3,
Figure 4,
Figure 5,
Figure 6,
Figure 7 and
Figure 8,
Table 4), confirms that the ensemble methods, particularly RF and XGBoost, deliver the most robust and effective performance for predicting sarcopenia risk based on dynamic depression trajectories. They successfully balance high predictive power with computational efficiency, making them the most suitable candidates for practical deployment in this context. The overall performance statistics summary of each dataset is detailed in
Supplementary Table S4.
To evaluate the clinical utility of our predictive models beyond conventional performance metrics, we conducted a comprehensive Decision Curve Analysis (DCA) across all outcome classes and models (
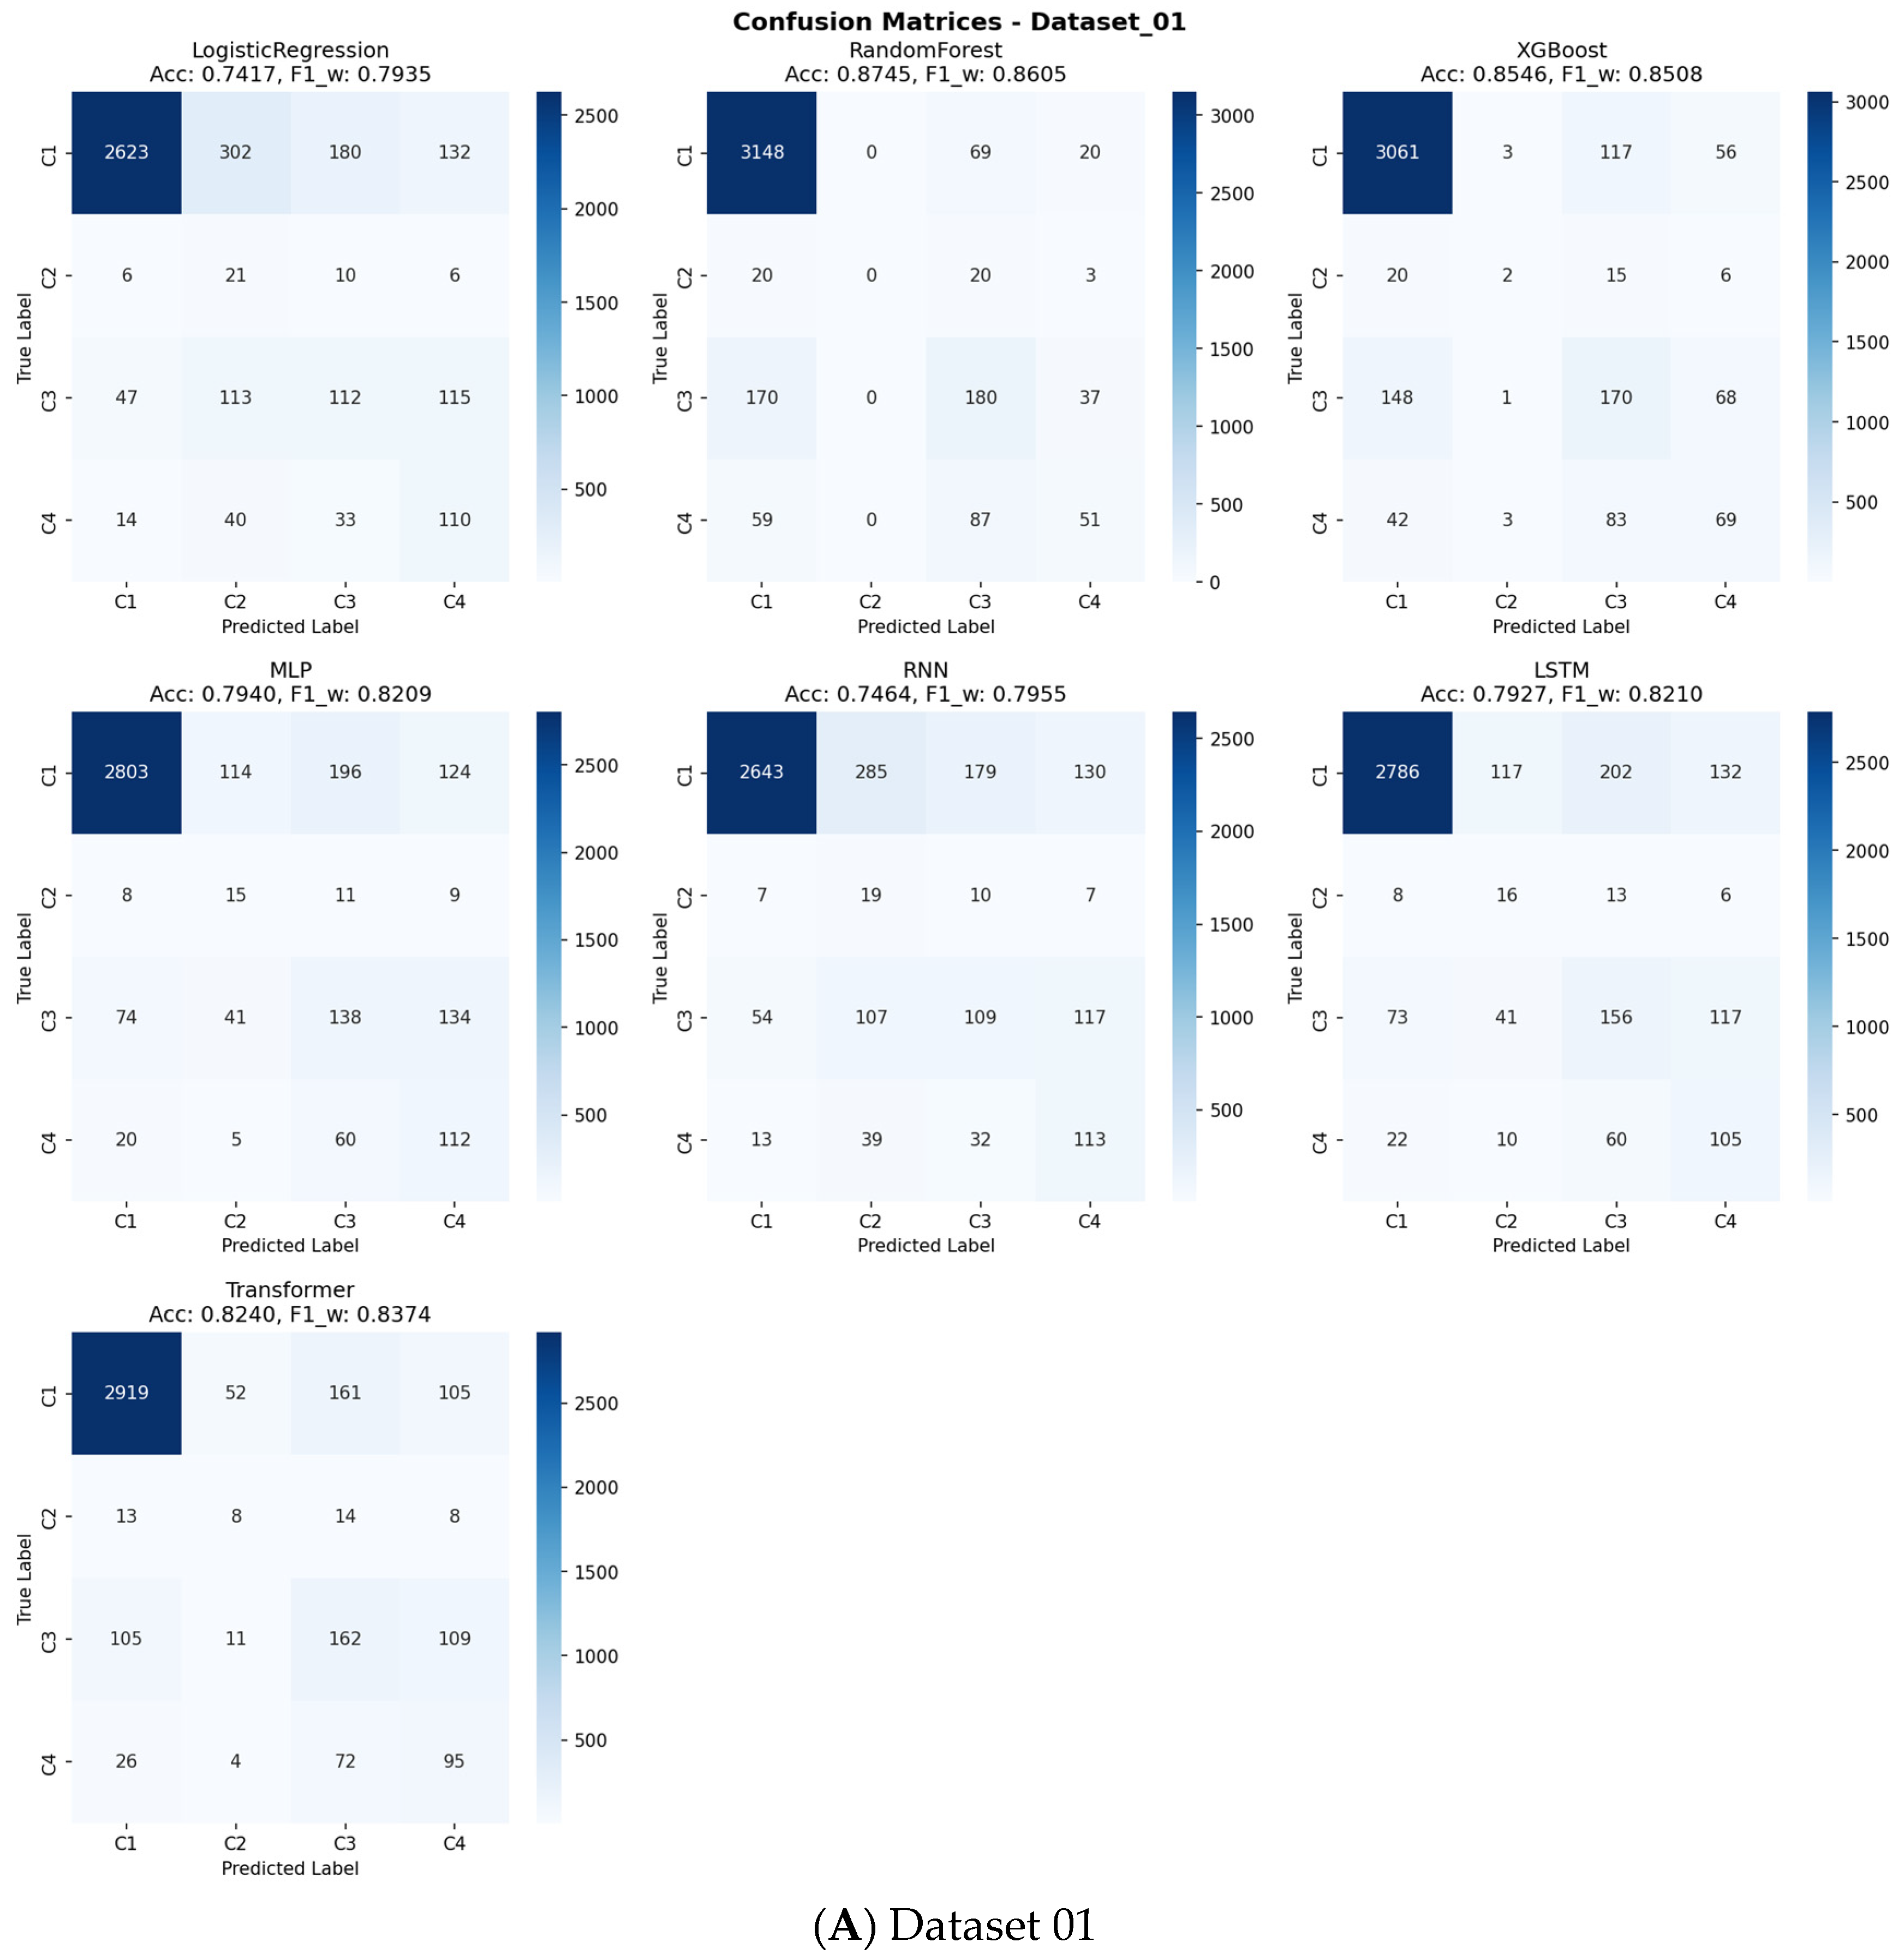
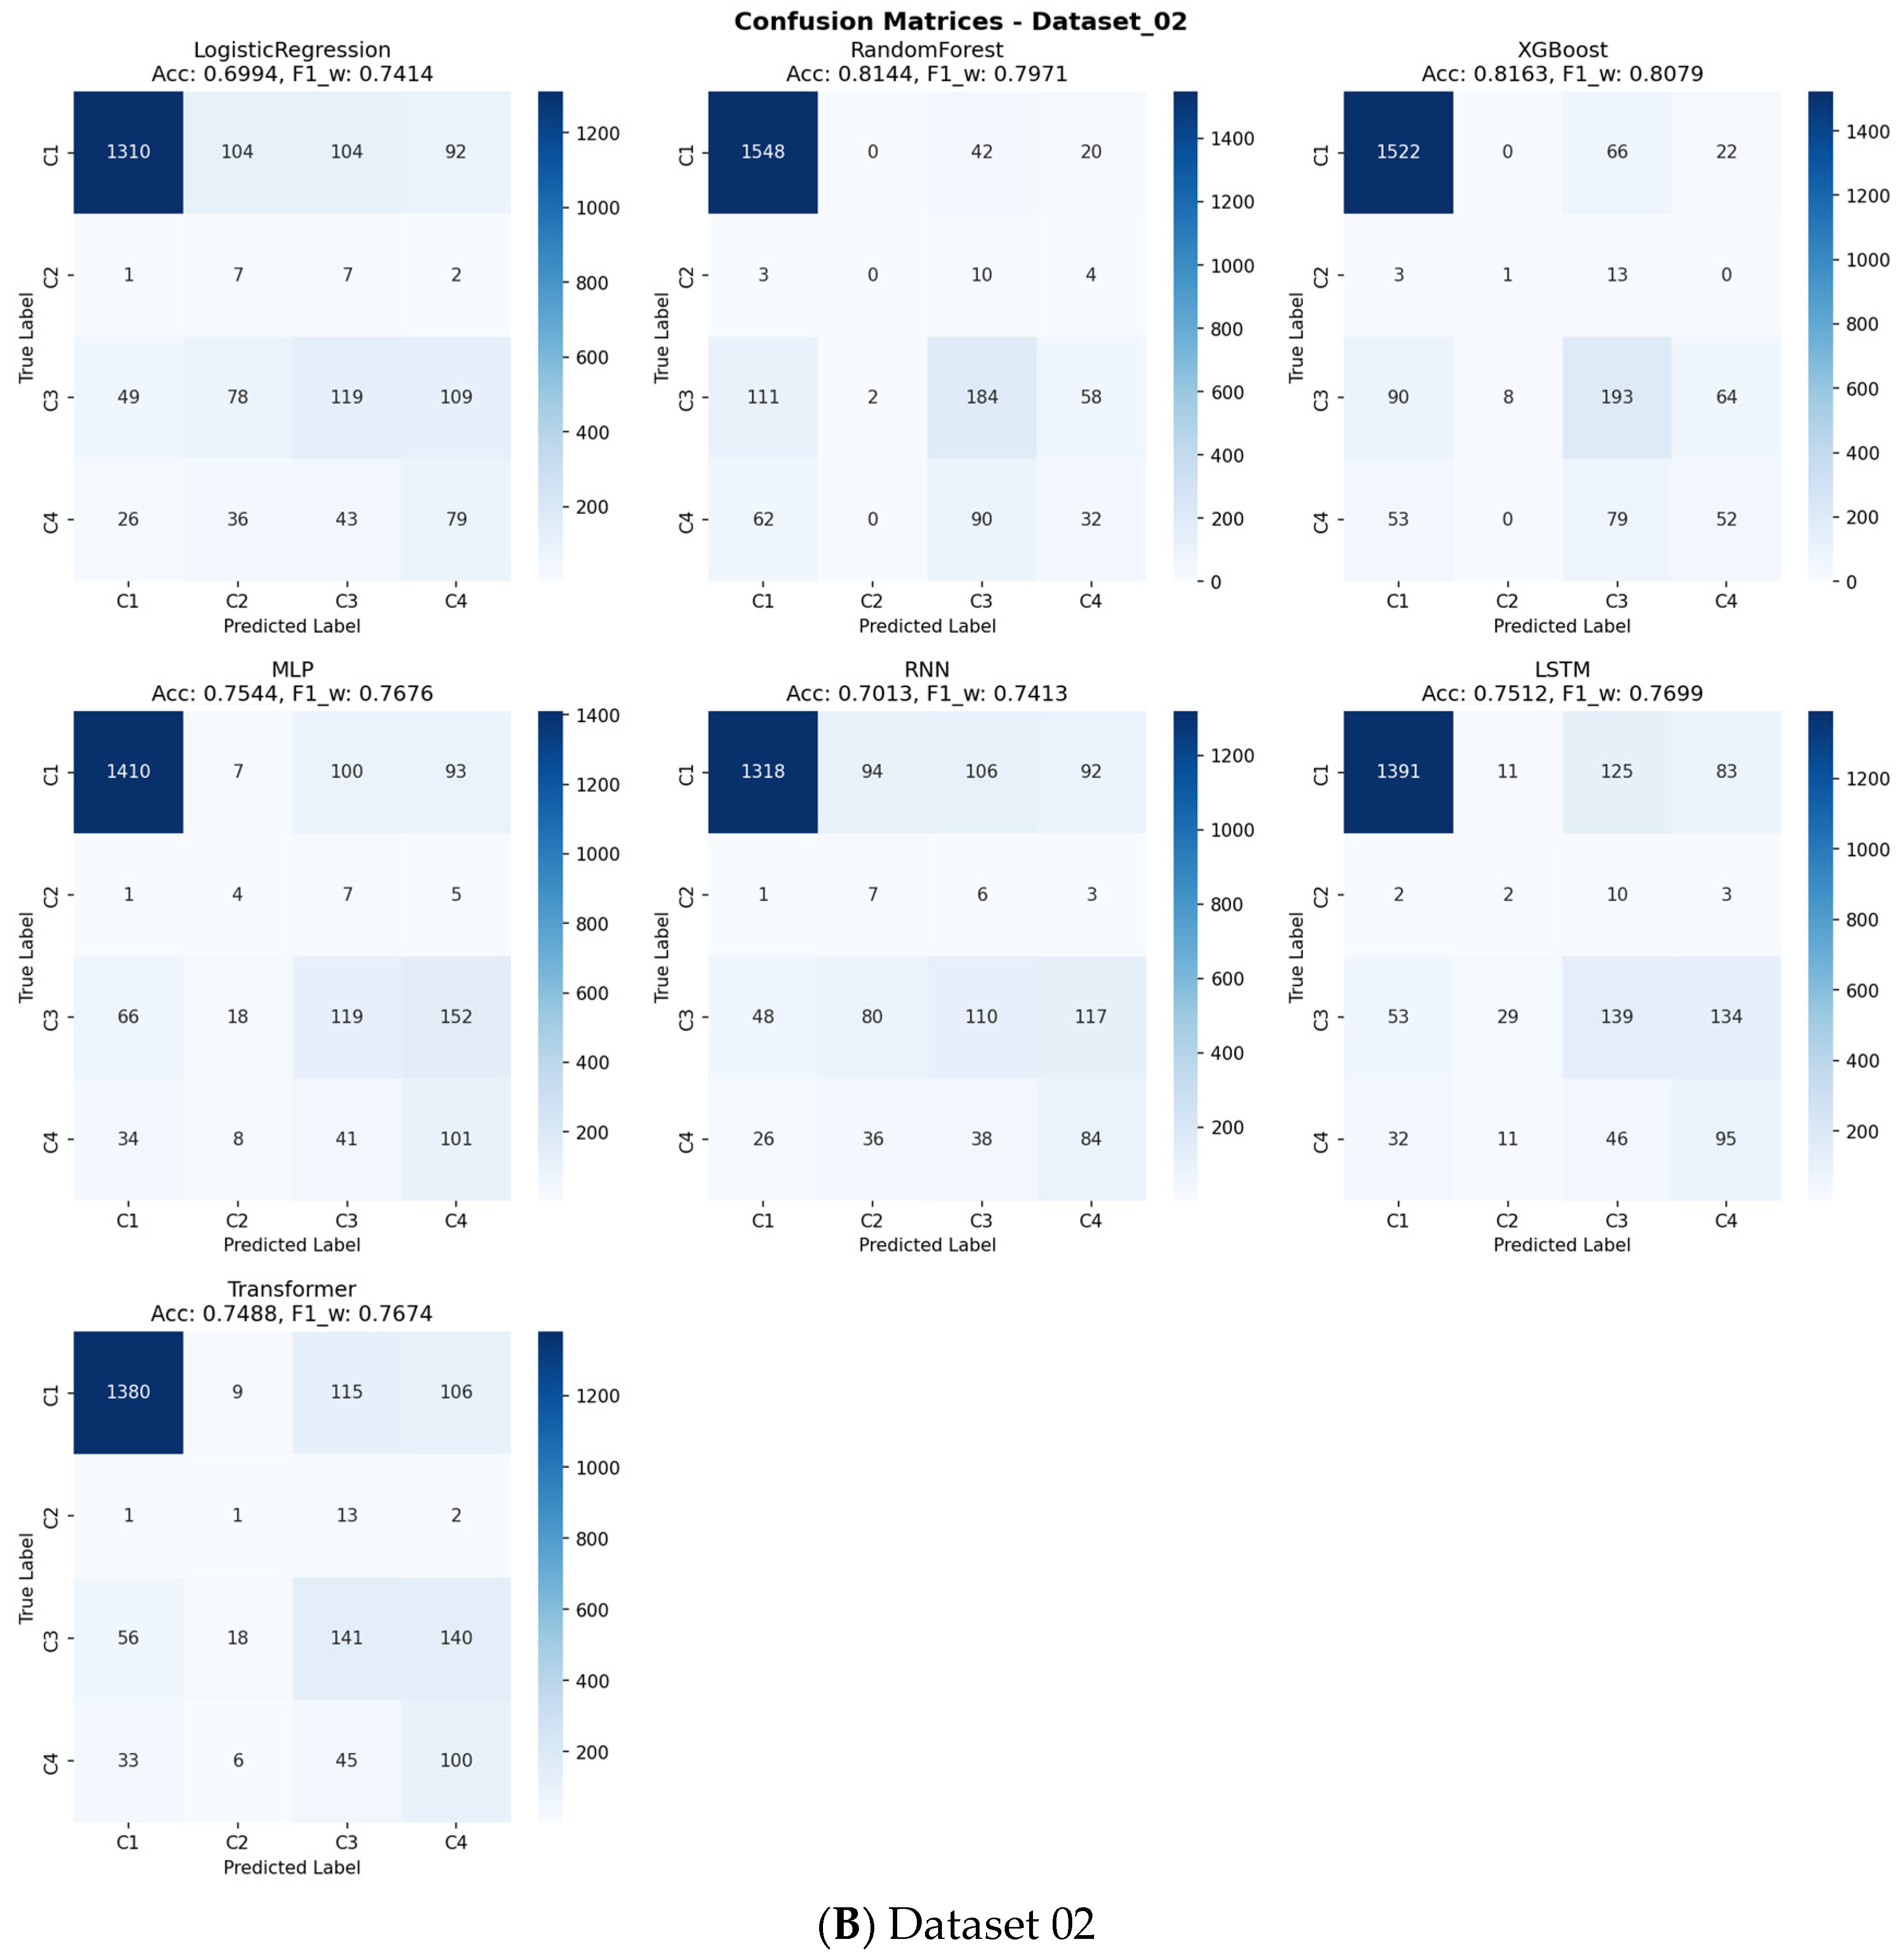
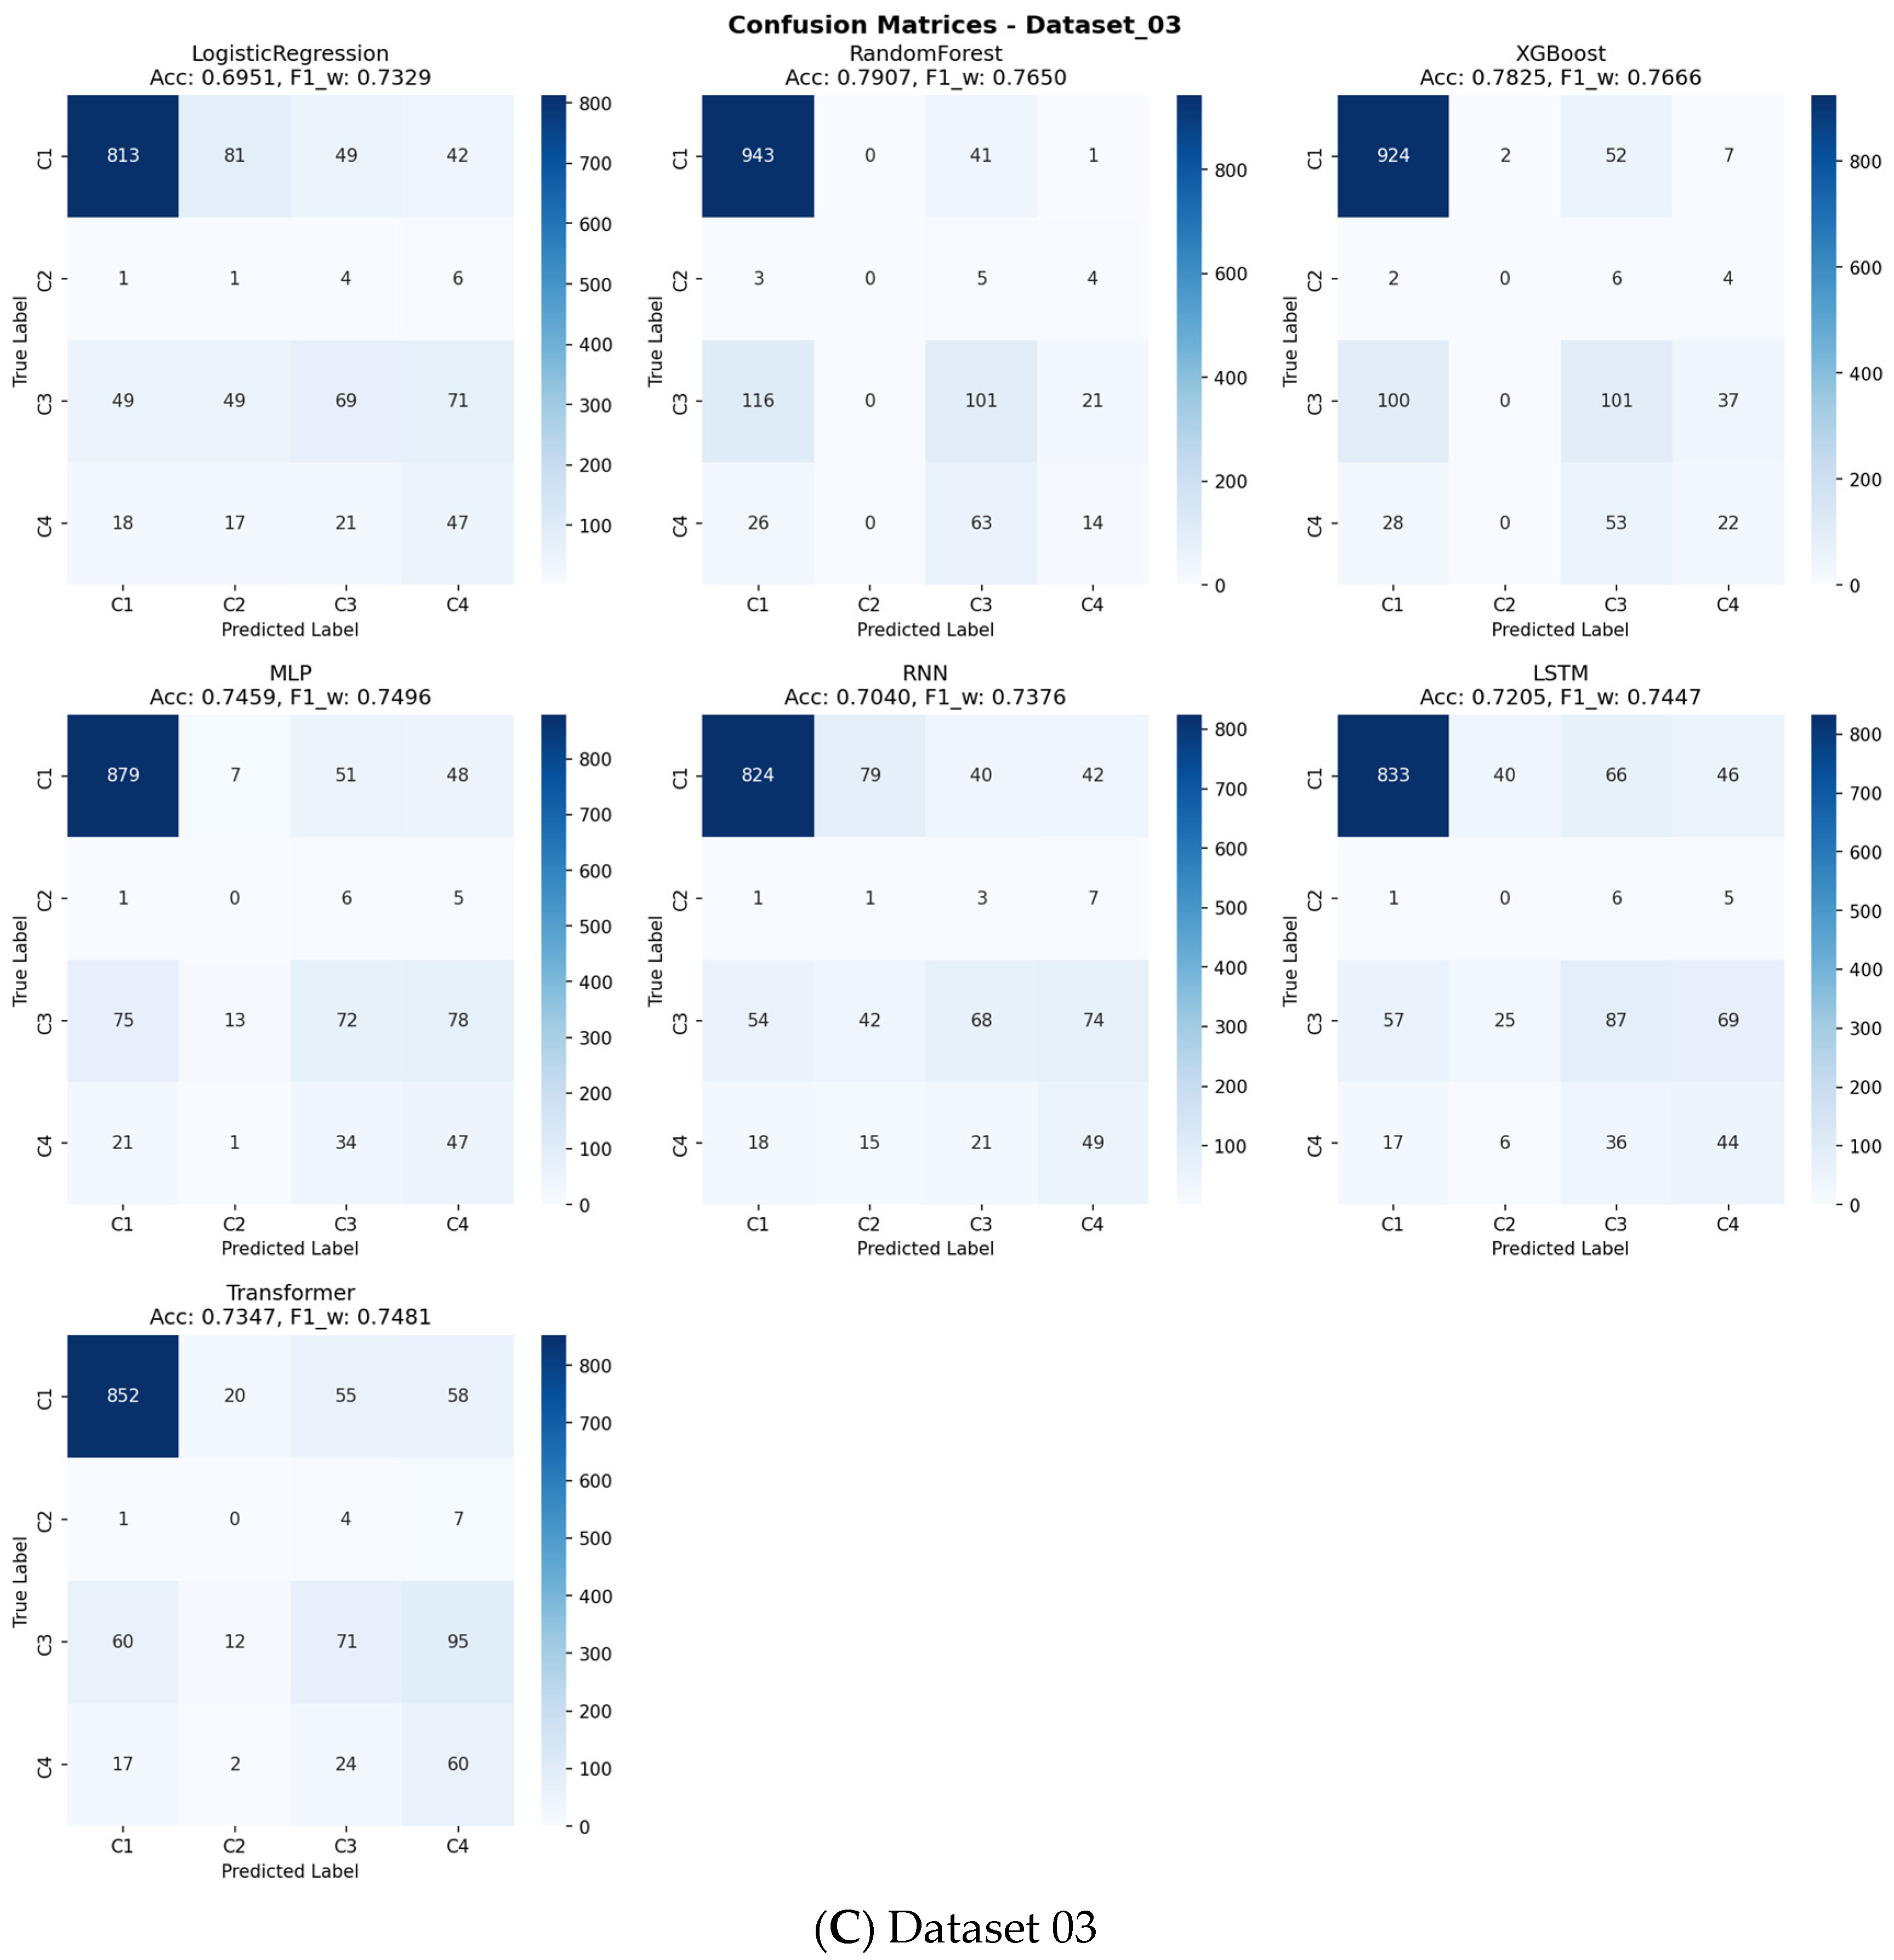
Supplementary Figures S3–S13). The analysis revealed that the top-performing tree-based ensemble models, particularly Random Forest and XGBoost, demonstrated superior net benefit compared to both “Treat All” and “Treat None” strategies across a wide range of clinically relevant threshold probabilities (approximately 10–50%). The confusion matrices presented in
Figure 9 offer detailed insights into each model’s classification performance across all sarcopenia outcome classes, revealing specific patterns of correct and incorrect predictions.
For the primary sarcopenia outcome classes (Class 3 “Sarcopenia” and Class 4 “Severe Sarcopenia”), these models maintained a positive net benefit throughout most threshold ranges, indicating their practical value in clinical decision-making. This DCA confirms that using our best-performing models to guide intervention decisions would lead to better clinical outcomes by appropriately balancing true positives against false positives across varying risk thresholds and clinical preferences.
3.4. Feature Importance
To identify the key drivers of sarcopenia risk and validate the central hypothesis of our study, we performed a comprehensive feature importance analysis across all seven machine learning models. The results robustly affirm that depressive symptoms are a core, independent predictor of sarcopenia, while also delineating a comprehensive multidimensional risk profile.
As summarized in
Table 5, depressive symptoms (CES-D-10 score) consistently ranked as one of the most significant predictors. This finding was most pronounced in the tree-based ensemble models, which demonstrated superior overall performance. In the Random Forest model, depressive symptoms were the third most important predictor (5.7% importance), trailing only the established physiological factors of BMI and cognitive function. This places depressive symptom severity ahead of other critical metrics, such as age, waist circumference, and all other lifestyle factors, in predicting sarcopenia risk.
The critical role of mental health was further embedded within a broader pathophysiological context. The dominance of body composition metrics (BMI and waist circumference) across all models underscores the interplay between metabolic health and musculoskeletal integrity. Similarly, the prominence of age and gender aligns with established epidemiological evidence for sarcopenia.
Furthermore, the feature importance patterns reveal potential mechanistic pathways linking depression to sarcopenia. The high ranking of cognitive function in the Random Forest model suggests a shared neurobiological pathway, supporting the “mind–body connection” in physical frailty. Concurrently, modifiable lifestyle factors such as smoking and alcohol consumption appeared among the top predictors in several models, indicating that depression may influence sarcopenia risk through behavioral pathways involving health-compromising behaviors.
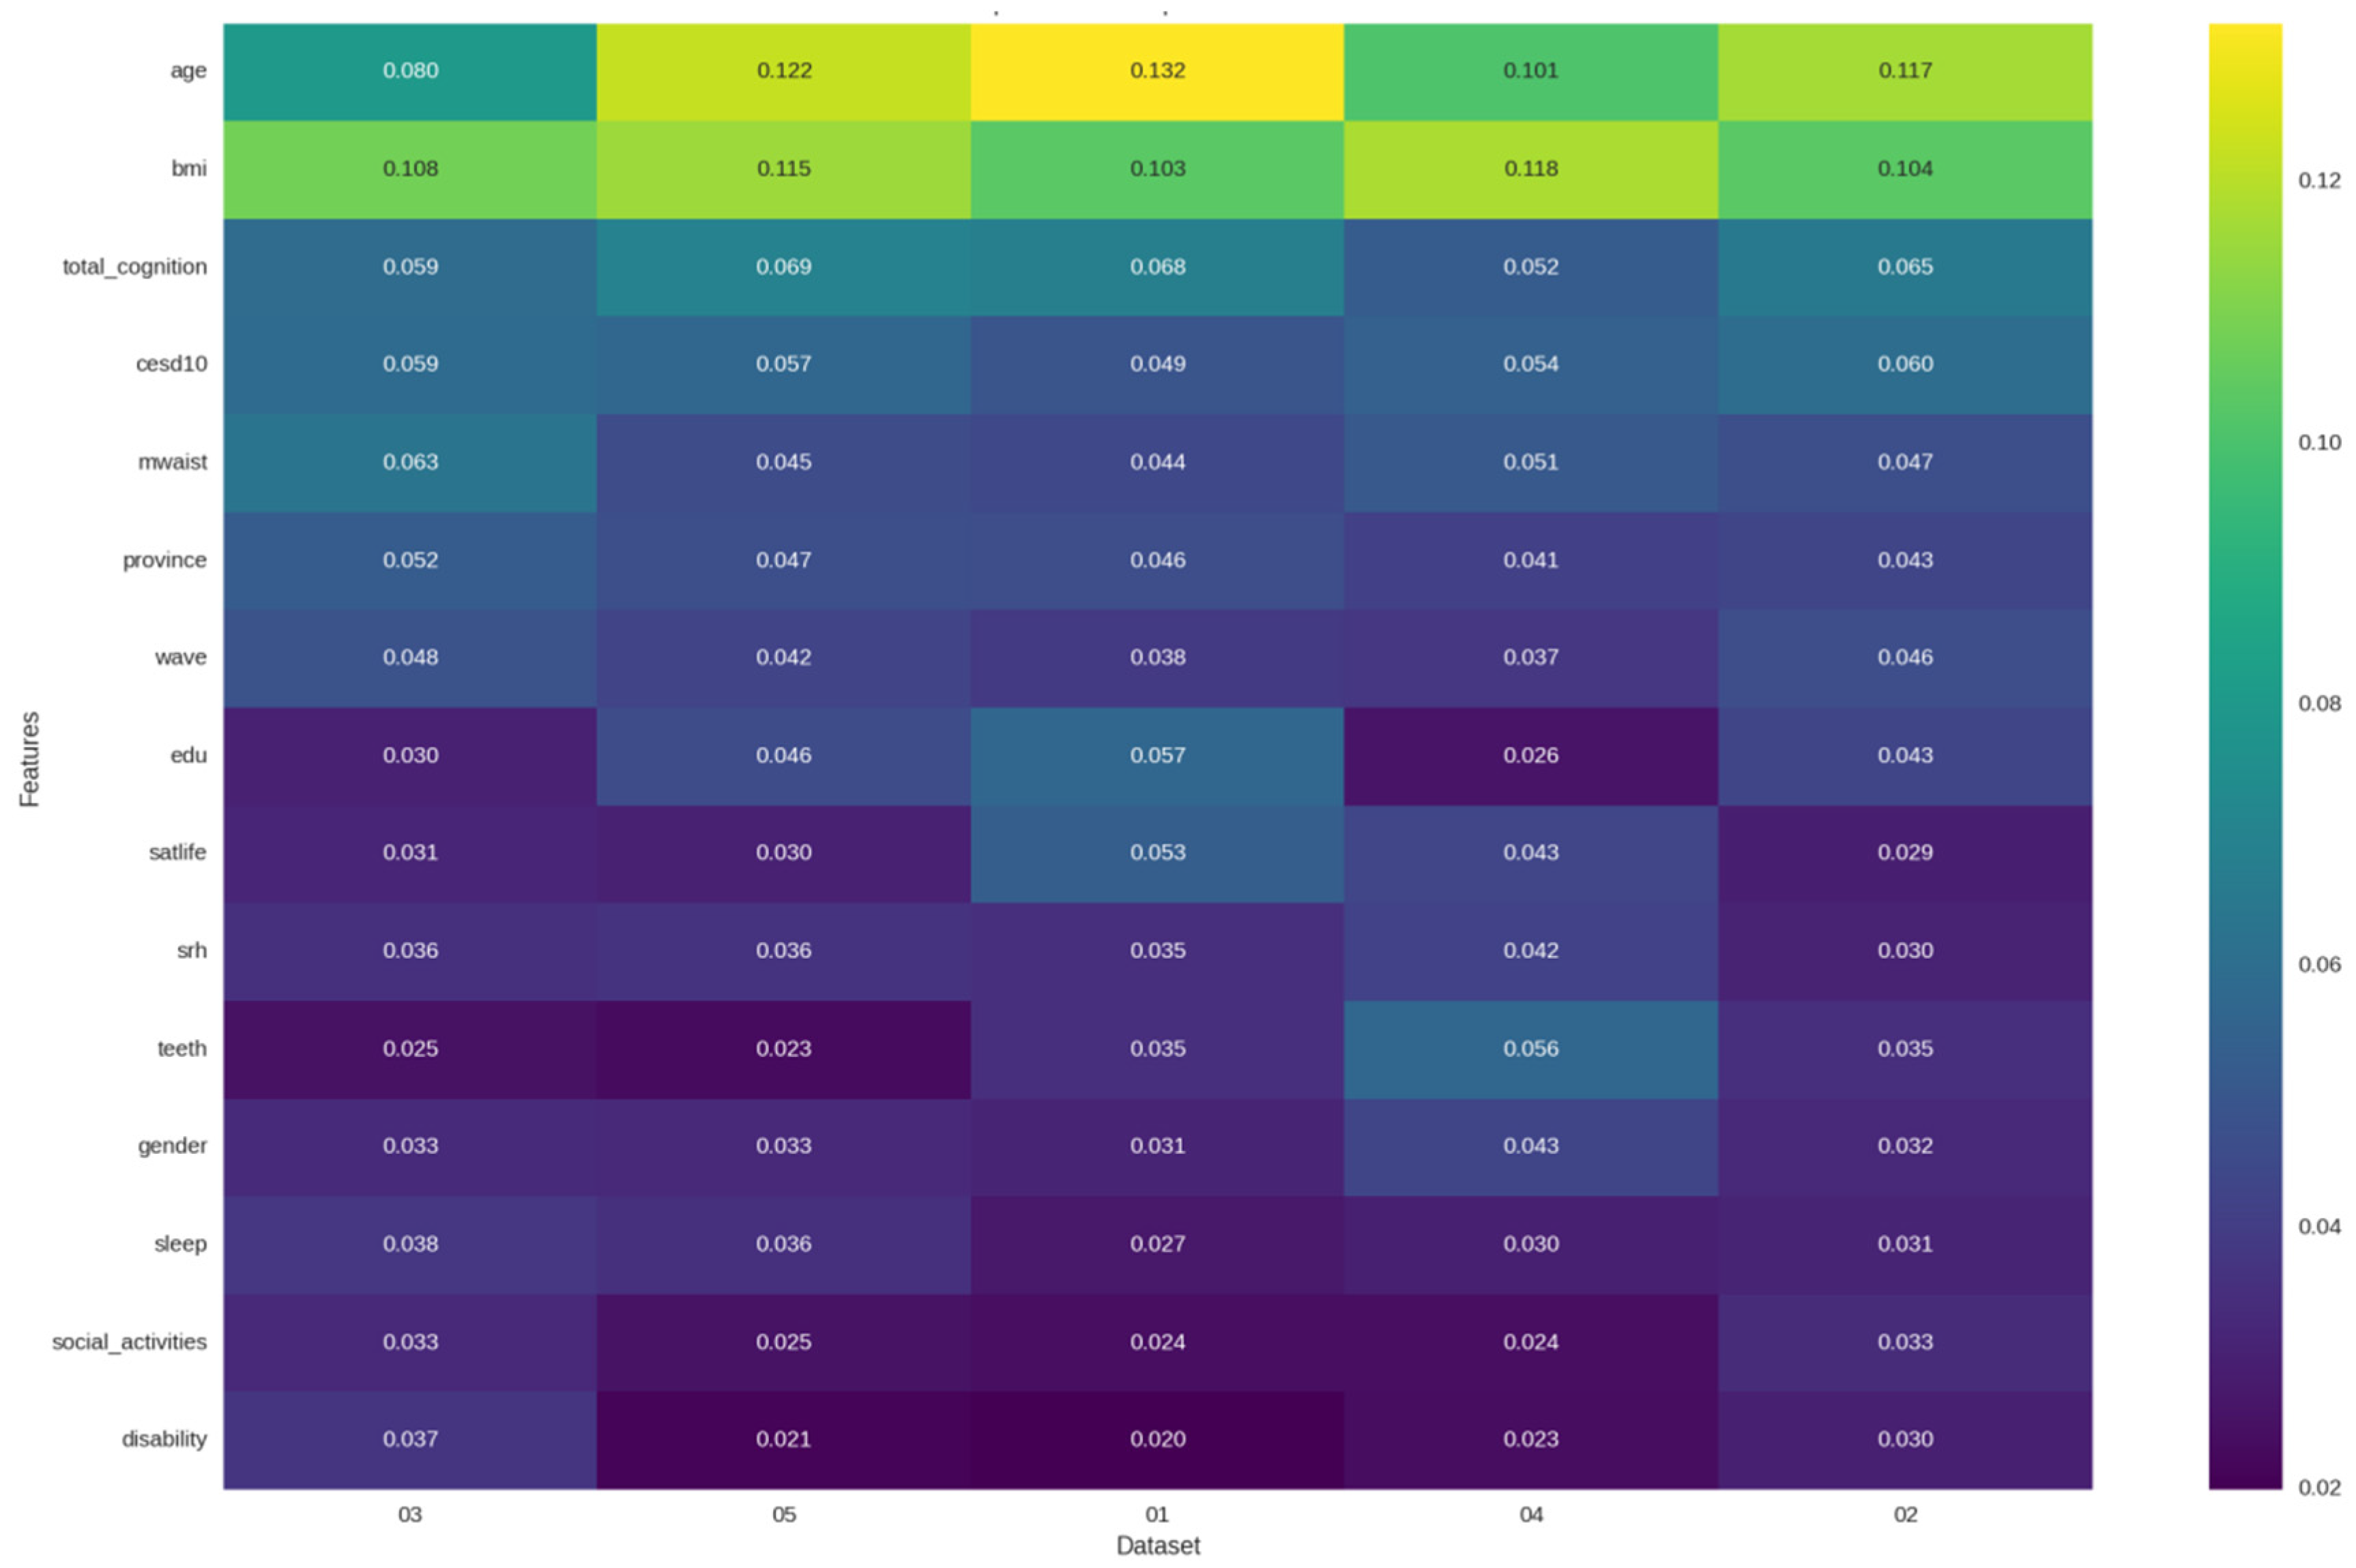
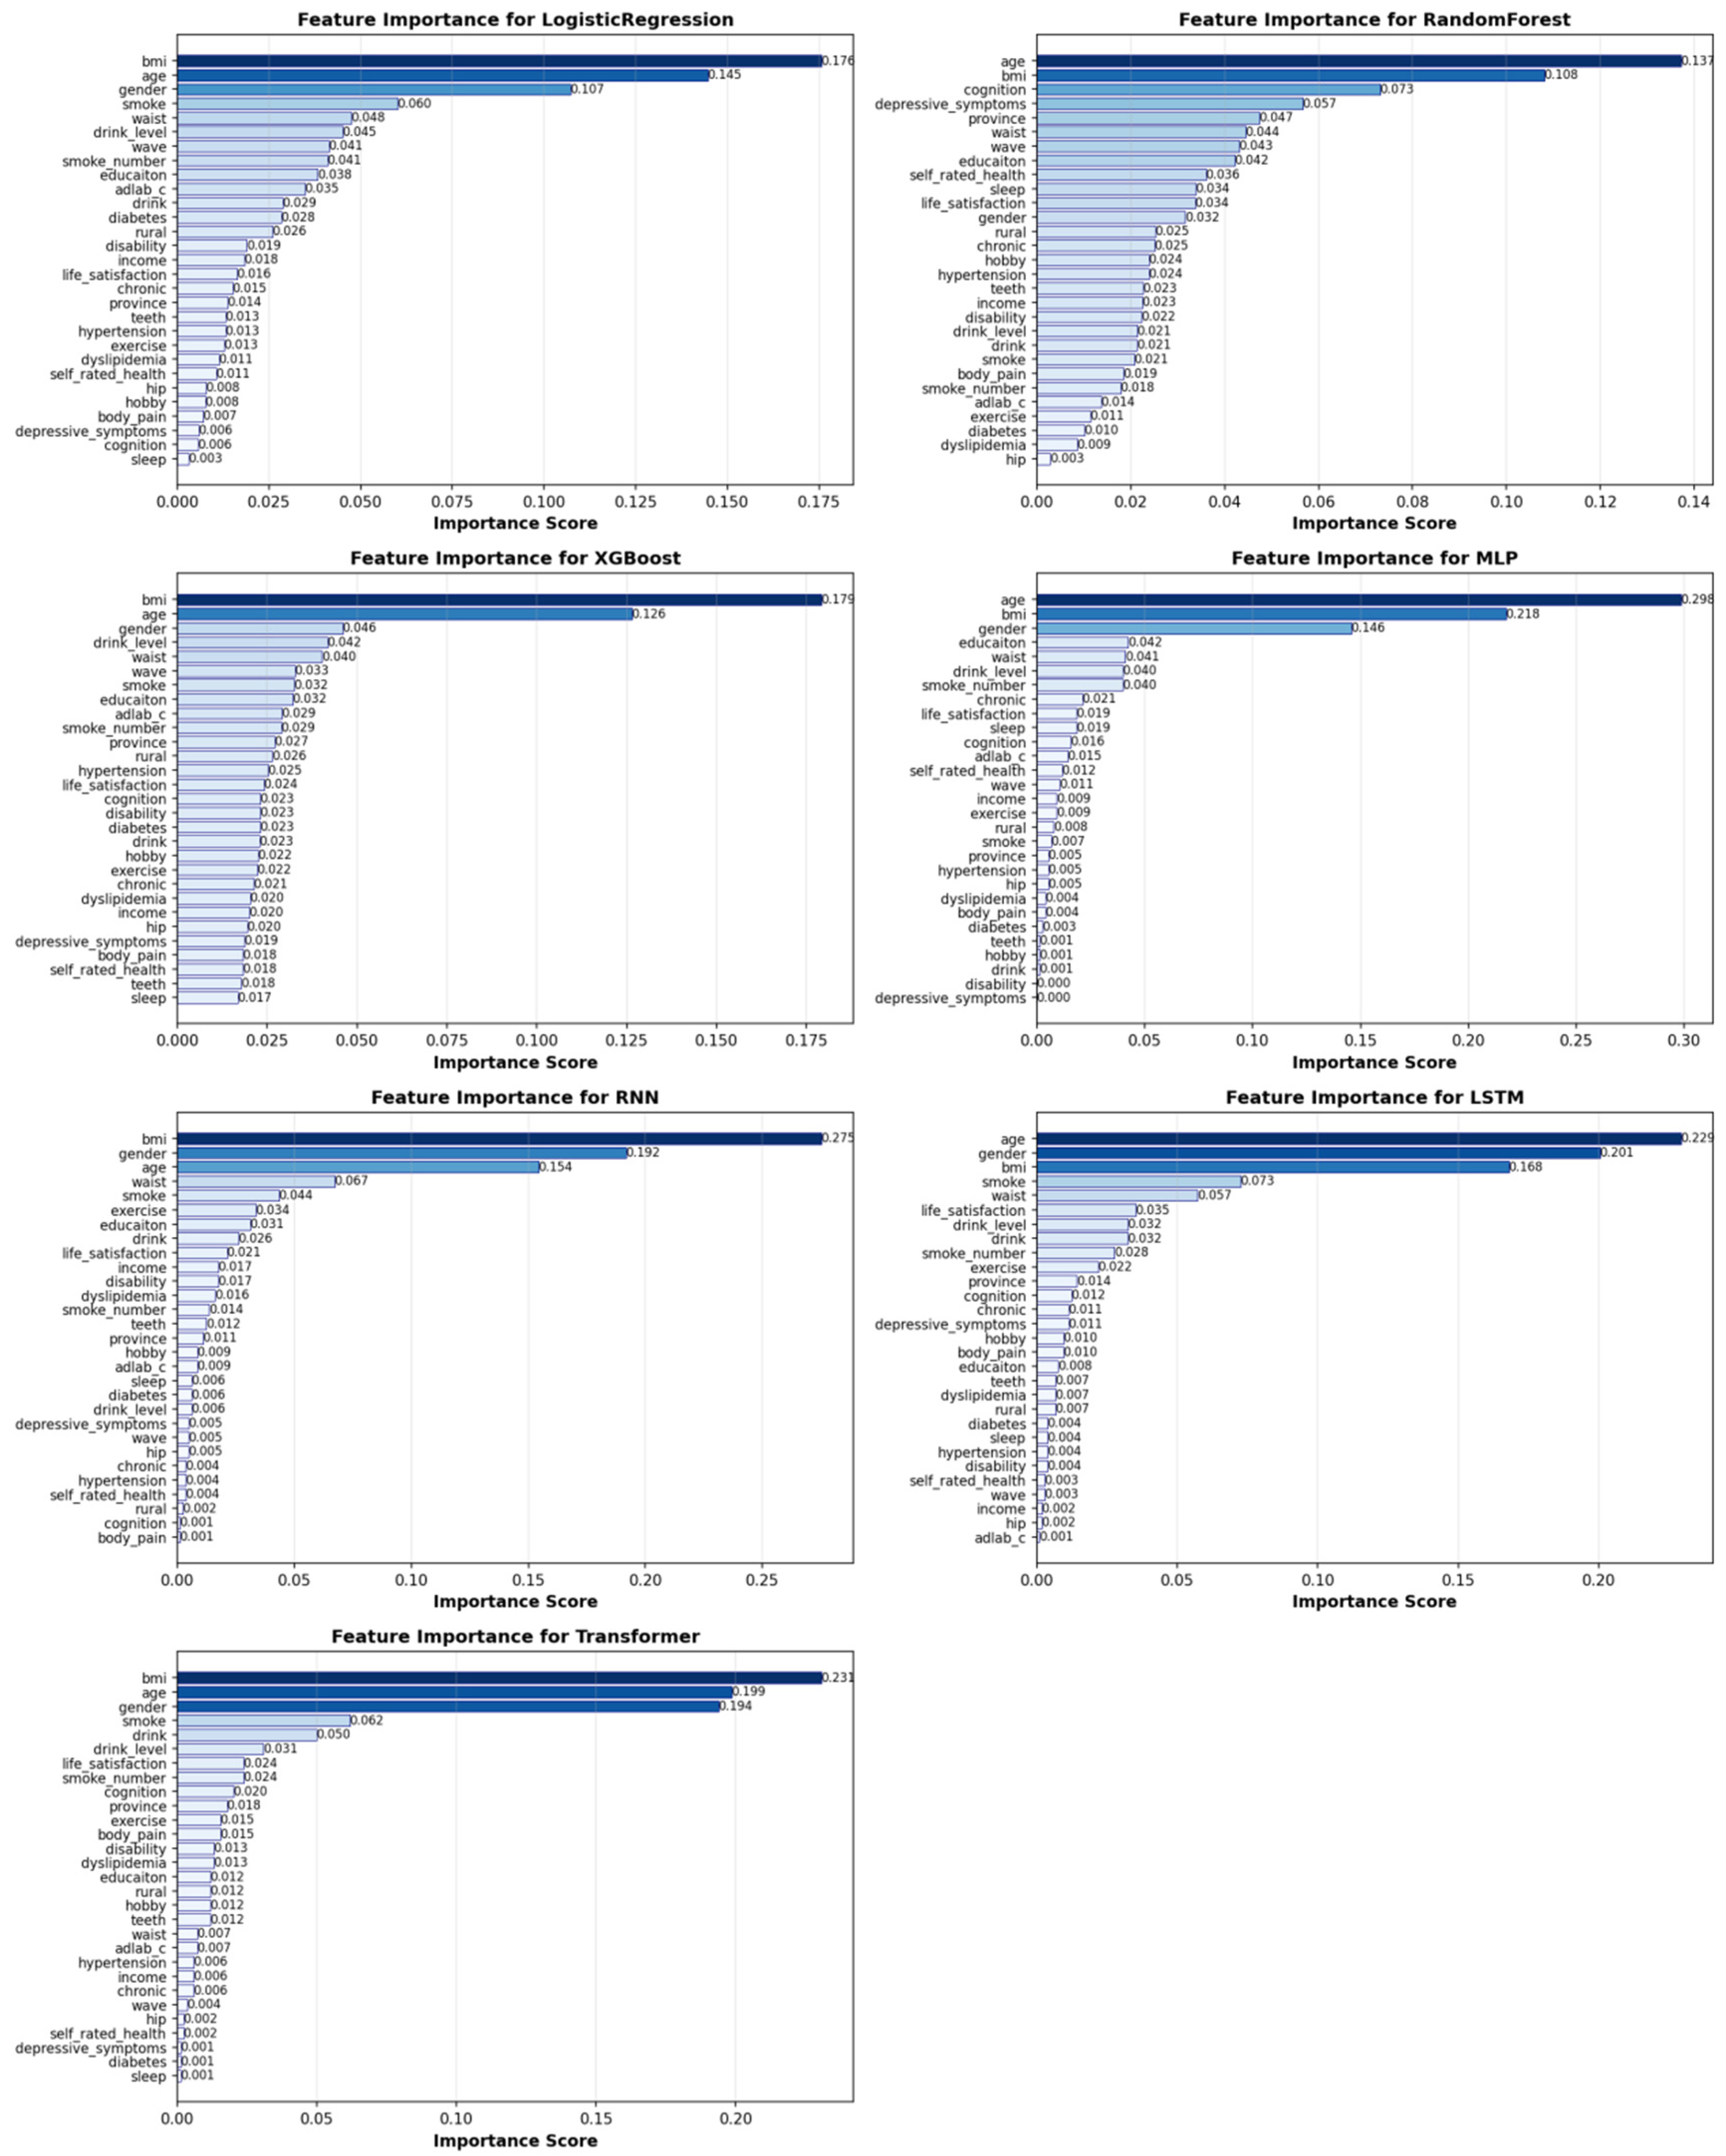
It is noteworthy that the importance of depressive symptoms was more consistently captured by the tree-based models (Random Forest and XGBoost) than by the deep learning architectures. This suggests that the relationship between depression and sarcopenia may be more effectively modeled through explicit feature interactions rather than the implicit representations learned by deep neural networks. This finding further reinforces the practical superiority of tree-based ensembles for this specific clinical prediction task, as they provide both robust performance and clinically interpretable insights. The feature importance patterns are visualized in detail in
Figure 10, which compares the top predictors across the seven models. A further detailed ranking of feature importance for each individual model is provided in
Figure 11.
In conclusion, this feature importance analysis provides compelling evidence that depressive symptoms serve as a powerful and independent predictor of sarcopenia risk, operating within a complex network of physiological, cognitive, and behavioral factors. This finding crucially validates our core methodological innovation—using dynamic depression trajectories rather than single-point assessments—by confirming that mental health status contains unique and significant information for predicting future physical frailty. This multidimensional risk profile, uncovered by AI, not only predicts risk but also points to actionable targets for public health interventions, such as promoting cognitive activities and smoking cessation alongside mental health care. It is important to emphasize that the feature importance analysis presented here identifies predictive associations rather than establishes causality. The models highlight which variables, including depressive symptoms, are most informative for predicting sarcopenia risk within our dataset. The observed associations may be influenced by unmeasured confounding factors or complex bidirectional relationships.
4. Discussion
This study exemplifies the application of Artificial Intelligence in Public Health by establishing the dynamic trajectories of depressive symptoms as a powerful predictor of sarcopenia risk in older adults. To our knowledge, this is one of the few investigations to integrate longitudinal mental health patterns with multiple machine learning algorithms for sarcopenia prediction. While previous AI studies have primarily relied on static features [
35,
36], our findings provide compelling evidence that the temporal evolution of depressive symptoms offers superior predictive power compared to conventional single-point assessments [
37]. The decision to employ a discrete 3-class model was driven by the necessity to derive clinically interpretable risk strata for potential public health intervention, a principle that aligns with hybrid modelling approaches which emphasize the integration of domain knowledge for downstream predictive robustness [
26].
The exceptional performance of tree-based ensemble methods, particularly Random Forest and XGBoost, across all benchmarking datasets establishes their practical utility for this prediction task [
38,
39]. While deep learning architectures demonstrated capacity for capturing complex temporal patterns, their higher computational demands and inconsistent cross-dataset performance rendered them less suitable for clinical deployment in this context [
40]. The remarkable stability of RF and XGBoost across diverse depressive trajectory groups underscores their robustness for real-world implementation.
Crucially, our feature importance analysis provides insights into the predictive relationship between depression and sarcopenia. The consistent ranking of depressive symptoms among the top predictors, particularly in the best-performing Random Forest model, robustly affirms mental health as a core, independent predictive marker for sarcopenia risk. This finding aligns with emerging evidence of the bidirectional mind–body connection in age-related frailty [
41,
42]. The prominence of depressive symptoms ahead of established risk factors such as waist circumference and lifestyle behaviors highlights the critical importance of integrating mental health assessment into sarcopenia screening protocols. This finding provides a data-driven mandate for clinicians to view persistent depression not merely as a comorbid condition, but as a potent, independent risk factor for physical frailty. For instance, an older adult exhibiting a ‘Persistently High’ depression trajectory should be considered for proactive muscle health assessments, even in the absence of other traditional risk factors.
Our findings reveal a complex multidimensional risk profile that extends beyond conventional physiological factors. The dominance of body composition indicators (BMI and waist circumference) across all models reaffirms their fundamental role in musculoskeletal health [
43]. Meanwhile, the high importance of cognitive function suggests shared neurobiological pathways between mental and physical frailty, possibly involving inflammatory processes or hypothalamic–pituitary–adrenal axis dysregulation [
44,
45]. The appearance of modifiable lifestyle factors, including smoking and alcohol consumption, as significant predictors indicates potential behavioral mechanisms through which depression influences sarcopenia risk, possibly via reduced physical activity, poor nutrition, or social withdrawal [
17].
From a clinical perspective, our ML framework enables a paradigm shift toward proactive prevention. By identifying older adults with high-risk depression trajectories (e.g., “persistently high”), healthcare providers can initiate early, multidimensional interventions targeting the identified risk factors [
46,
47]. This might include combined approaches addressing psychological distress through therapy, cognitive engagement through mentally stimulating activities, and physical exercise to preserve muscle mass—all before significant, often irreversible muscle loss occurs.
The Decision Curve Analysis further strengthens the clinical relevance of our findings. The demonstrated net benefit of our top-performing models across clinically meaningful threshold probabilities suggests that implementing this prediction framework in practice could lead to tangible improvements in patient outcomes. By providing a favorable balance between identifying true cases and avoiding unnecessary interventions, our models offer a practical tool for risk stratification in resource-constrained healthcare settings.
The clinical translation of our predictive model advocates for a multidisciplinary care approach. Upon identifying high-risk individuals, a coordinated intervention should be initiated. This includes: involving psychologists to address depressive symptoms through evidence-based therapies (e.g., Cognitive Behavioral Therapy); collaborating with dietitians to provide nutritional support targeting muscle health, such as ensuring adequate protein intake and Vitamin D supplementation; and working with physiotherapists to prescribe tailored resistance and balance exercise regimens. This integrated strategy concurrently targets the psychological, behavioral, and physiological pathways linking depression to sarcopenia, thereby enabling proactive and holistic patient care.
The clinical implications of our study are substantial. The robust performance of our models across distinct depression trajectory groups suggests generalizability to diverse clinical populations. The relatively simple implementation requirements of tree-based models make them feasible for integration into existing geriatric assessment workflows, potentially providing a low-cost, scalable risk-stratification tool for both geriatric medicine and psychiatry settings.
Several limitations should be considered when interpreting our findings. First, while the CHARLS cohort is nationally representative, the potential for residual confounding cannot be ruled out, and external validation in other populations is warranted [
22]. Second, the assessment of muscle mass relied on anthropometric equations rather than gold-standard methods like DXA, which might introduce measurement error [
48]. Third, although we employed multiple imputation for missing data, the potential for selection bias remains. Fourth, our sample required complete data across multiple waves and assessments. The sensitivity analysis (
Supplementary Table S1) revealed significant differences in baseline characteristics between the included and excluded participants, indicating that the former were generally older, had a higher burden of chronic disease, and differed in socioeconomic composition. This suggests a potential for selection bias, as participants who were lost to follow-up or had extensive missing data are often systematically less healthy. Consequently, the generalizability of our findings might be somewhat limited to a relatively healthier and more stable segment of the older population. However, it is noteworthy that the key exposure (depressive symptoms) and an important predictor (cognitive function) were balanced between the groups, which strengthens the internal validity of the identified relationship between depression trajectories and sarcopenia risk. External validation in more inclusive cohorts is needed to confirm the generalizability of our model. In addition, the assessment of muscle mass relied on anthropometric prediction equations rather than gold-standard methods like dual-energy X-ray absorptiometry (DXA). This approach, while necessary for large-scale population studies, may introduce measurement error and non-differential misclassification bias in the diagnosis of sarcopenia. Such bias would likely attenuate the observed associations and model performance metrics, suggesting that the true predictive relationship between depressive trajectories and sarcopenia might be stronger than reported here.
Future research should focus on integrating this AI framework into real-world public health workflows and mobile health (mHealth) platforms to enable continuous risk monitoring. Exploring federated learning techniques could also allow for building more generalized models while protecting data privacy across different jurisdictions, representing a key future possibility for AI in public health.
5. Conclusions
This study establishes the significant predictive value of longitudinal depressive symptom trajectories for sarcopenia risk in older adults. Through a comprehensive benchmarking of seven machine learning algorithms, we identified tree-based ensemble methods, particularly Random Forest (RF) and XGBoost, as the most suitable and robust predictors for this task. RF achieved the highest mean accuracy (0.8265), while XGBoost attained the highest mean weighted F1-score (0.8084). Their consistent superiority over other models, including deep learning architectures, combined with computational efficiency and stability across diverse datasets, designates them as the optimal choices for practical deployment in predicting sarcopenia risk based on dynamic depression patterns.
The predictive accuracy of our best model (RF, 0.8265) is highly competitive with the current state-of-the-art. For instance, Kim et al. [
36] reported a top test accuracy of 0.848 using physical factors, while Seok et al. [
20] achieved 78.8% accuracy with socioeconomic data. Although Ozgur et al. [
21] reported higher accuracies (RF: 89.4%), their model was developed on a selective sample of female participants from a university hospital, which may limit its generalizability to community-dwelling populations and both genders. In contrast, our model achieved its robust performance on a large, nationally representative cohort of both men and women, using a novel and dynamic predictor, longitudinal depression trajectories. This approach not only delivers competitive accuracy but also captures the temporal evolution of a core, modifiable risk factor, offering a more holistic and clinically informative tool for population-level screening than static assessments.
Beyond model performance, our feature importance analysis yielded a clinically interpretable, multidimensional risk profile, robustly affirming depressive symptoms as a core, independent predictor, ranking ahead of traditional risk factors like age and waist circumference. This finding, coupled with the high importance of cognitive function and modifiable lifestyle factors, provides a mechanistic understanding and actionable targets for intervention.
Looking forward, several avenues for future work emerge. First, external validation in independent and diverse populations, including other national cohorts and prospective clinical settings, is essential to confirm the generalizability and clinical utility of our model. While our internal validation through rigorous cross-validation and the reporting of confidence intervals provides robust performance estimates, validation in external datasets remains a critical next step. Second, future studies could benefit from incorporating gold-standard measures of muscle mass (e.g., DXA). Finally, to facilitate widespread adoption while addressing data privacy and imbalance concerns, we propose integrating this AI framework into real-world public health workflows and exploring federated learning techniques. Federated learning would allow for building more robust and generalizable models across multiple institutions without centralizing sensitive patient data, directly addressing the challenges of data sharing and population-level imbalance.
In summary, this work provides a validated, AI-driven strategy that moves beyond static risk assessment. By mapping dynamic mental health trajectories to physical frailty risk, our framework facilitates a necessary paradigm shift in geriatric care, from reactive treatment to proactive, personalized, and scalable prevention.

