Article

Explainable AI-Driven 1D-CNN with Efficient Wireless Communication System Integration for Multimodal Diabetes Prediction

by
Radwa Ahmed Osman
Basic and Applied Science Institute, College of Engineering, Arab Academy for Science, Technology and Maritime Transport, Alexandria P.O. Box 1029, Egypt
AI 2025, 6(10), 243; https://doi.org/10.3390/ai6100243
Submission received: 17 August 2025 / Revised: 20 September 2025 / Accepted: 23 September 2025 / Published: 25 September 2025

Abstract

The early detection of diabetes risk and effective management of patient data are critical for avoiding serious consequences and improving treatment success. This research describes a two-part architecture that combines an energy-efficient wireless communication technology with an interpretable deep learning model for diabetes categorization. In Phase 1, a unique wireless communication model is created to assure the accurate transfer of real-time patient data from wearable devices to medical centers. Using Lagrange optimization, the model identifies the best transmission distance and power needs, lowering energy usage while preserving communication dependability. This contribution is especially essential since effective data transport is a necessary condition for continuous monitoring in large-scale healthcare systems. In Phase 2, the transmitted multimodal clinical, genetic, and lifestyle data are evaluated using a one-dimensional Convolutional Neural Network (1D-CNN) with Bayesian hyperparameter tuning. The model beat traditional deep learning architectures like LSTM and GRU. To improve interpretability and clinical acceptance, SHAP and LIME were used to find global and patient-specific predictors. This approach tackles technological and medicinal difficulties by integrating energy-efficient wireless communication with interpretable predictive modeling. The system ensures dependable data transfer, strong predictive performance, and transparent decision support, boosting trust in AI-assisted healthcare and enabling individualized diabetes control.

1. Introduction

Diabetes is considered one of the most serious chronic illnesses all over the world, which prevents people from leading a normal life. Many individuals can mitigate the conditions of this illness with early diagnosis, care, and effective treatment [1]. Furthermore, it has a significant impact on people’s quality of life and causes significant expenses due to its high incidence rate and particular consequences, such as eye disease and hypertension [2]. Inactivity and obesity lifestyles are the two main causes of diabetes [3]. Diabetes is a complex metabolic disease greatly influenced by genetic factors, nutrition, and lifestyle; eating habits can also affect glucose concentration [4]. Diabetes is considered a major health issue that affects both developing and industrialized countries globally. An estimated 463 million individuals globally had diabetes in 2019; by 2045, that figure is expected to increase to 700 million [5]. Moreover, 37 million people in the US alone have diabetes, and a sizable fraction of them go undiagnosed. Similarly, the spread of diabetes is expected to increase in countries such as India, from 77 million cases in 2019 to 100 million or more cases by 2030 [6].
The healthcare sector has provided a large volume of data, including diagnostic reports, data from real-time monitoring, and patient records [7,8]. Nowadays, it is crucial to utilize the medical data with sophisticated computational tools, especially for modern medicine, in order to easily detect the degree of severity [9]. Techniques for machine learning and artificial intelligence (AI) have become revolutionary technologies that allow for more accurate diagnosis, economical treatments, and better patient outcomes [10]. Particularly when working with big, complicated datasets, deep learning algorithms have proven to be more predictively accurate than conventional machine learning techniques [11]. The application of AI, deep learning, and data mining to healthcare improves the early detection and diagnosis accuracy of chronic diseases, giving medical professionals useful information to better manage patients [12].
In the medical field, patient monitoring is essential, especially for those who are at risk. Wearable devices, which are used to collect, monitor, and send information, are an important technology for the medical field [13]. Different physiological indicators, such as blood glucose levels, heart rate, blood pressure, physical activity, and other metabolic parameters, could be easily captured in real time by existing wearable technology, such as smart watches, glucose monitors, and biosensor patches. Through wearable devices, specialists will be able to monitor patients who are at risk for diabetes, and based on this information, they will be able to make the appropriate decision [14]. However, the importance of these wearable devices lies not only in their ability to monitor, send, and collect data but also in their ability to send these data to the required material center in an efficient and reliable way [15]. Therefore, developing an efficient wireless communication system model is essential because, based on the sent data, a decision will be made, and based on this decision, a life can be saved [16,17].
The potential to revolutionize diagnosis and treatment has been increasing by integrating machine learning (ML) and artificial intelligence (AI) in the healthcare industry, which has been thoroughly investigated [18]. Additionally, improving data quality, standardization, and collaborations are key for helping AI models effectively predict diabetes early [19]. Furthermore, Ref. [20] highlighted the role of AI in the early detection of Alzheimer’s diagnosis (AI), predicting disease progression, identifying high-risk patients, and determining the suitable treatment, which improves their quality of life. Ref. [21] developed a deep learning model to diagnose cancer and predict tumor origin in both hydrothorax and ascites. DeepNetX2 had been presented by [22] to predict diabetes; this model had implemented XAI with SHAP and Lime to make its decision transparent and accurate. Furthermore, Ref. [23] reviewed how AI models play an important role in healthcare diagnostics, covering imaging-based, pathology-based, and preventive techniques. It is also shown how AI tools such as NLP, ML, and RPA have improved EHR management and decision making.
The importance of hyperparameter optimization tuning is also worth mentioning, which makes the prediction more accurate and reliable. Ref. [24] had proposed a deep learning optimization model using Bayesian optimization. The aim of this proposed model was to diagnose breast cancer using a 1D-CNN with Bayesian optimization. Furthermore, Ref. [25] addressed the Liver Patients Detection Strategy (LPDS) for diagnosing liver disease using an improved Binary Butterfly Optimization Algorithm (IB2OA) to improve liver disease prediction. The technique employed SMOTE to balance the dataset and outlier identification to fill in missing data. Additionally, Ref. [26] proposed a custom Adam-inspired optimizer, which was considered a hybrid AI system for classifying kidney stones, cysts, and tumors. The aim of this proposed model is to increase the system accuracy, precision, and recall to enhance performance, while an emphasis on interpretability supports clinical adoption. Moreover, [27] explored integrating bio-inspired optimization techniques such as genetic algorithms, particle swarm optimization, and ant colony optimization with deep learning to improve the diagnosis of medical disease. This study showed how these optimization techniques can improve system accuracy and model robustness.
Enhancing wireless communication for wearable devices to send the required data for diagnosis prediction is essential for decision making. Ref. [28] proposed a BLE-5-based wearable device for real-time patient monitoring. The proposed model aimed to propose a hybrid PHY algorithm with adapted modes to balance power and reliability for medical sectors. Furthermore, Ref. [29] presented an energy-efficient real-time electrocardiogram (ECG) acquisition system that used near-data processing for prediagnosis and controlled the frequency of wireless communication. Additionally, Ref. [30] presented a multi-layered WBAN framework that increased energy efficiency and security for healthcare monitoring. The proposed model was able to decrease latency and increase real-time accuracy for data transmission. The vital sign monitoring system, which combined sensors, wireless communication, and machine learning, was proposed in [31] to classify the health conditions of patients’ health. The proposed model was able to enhance diabetes prediction to enhance the real-time monitoring of patient health through a reliable and efficient system. Furthermore, Ref. [32] reviewed the low-power technique for wearable devices required for chronic disease monitoring. This study offered a good guide for improving energy management in wearables, reliable physiological monitoring, and continuous support.
The creation of an AI-driven system for early diabetes prediction in addition to sending the patient data effectively to the medical centers is investigated in this research. This study proposes an efficient wireless communication system for patient monitoring and accurate diabetes risk prediction. The proposed deep learning model used for diabetes risk prediction is built based on using Bayesian optimization for a 1D Convolutional Neural Network (CNN) with XAI to predict diabetes risk based on a comprehensive dataset that includes genetic, environmental, lifestyle, and clinical factors. Three primary elements comprise the methodology: model architecture, data preparation, and dataset characteristics. This paper is divided into two phases. The first phase examines how the integration of optimization techniques with machine learning methods, namely Bayesian optimization and a 1D Convolutional Neural Network (CNN) with explainable AI (XAI), can predict diabetes risk using a large dataset. Numerous elements, including family history, lifestyle factors, genetic markers, and clinical indicators, are included in this dataset. To guarantee that the data are transmitted effectively to the medical centers, Phase 2 is introduced. Phase two investigates the wireless communication system of the patient wearable device to show how the patient data can be sent effectively. Different conditions have been considered when examining the wireless communication system, such as required signal-to-interference-plus-noise (SINR), transmission power, interference transmission power, path loss, and interference transmission distances. Although the suggested wireless communication architecture is generalizable and may be used to monitor a variety of chronic conditions, it can be used and assessed in this study to predict diabetes. This case study was chosen because of the worldwide incidence of diabetes and the availability of rich biological data, making it an excellent choice to illustrate the system’s potential. The contribution of this paper is as follows:
  • Integrates essential preprocessing methods, including feature encoding and normalization.
  • Develops an accurate diabetes prediction tool and reliable communication that can help in early detection and intervention. This can be achieved through finding the optimum required hyperparameters for the 1D-CNN using Bayesian optimization while implementing XAI.
  • Implements XAI in the proposed model to enhance the transparency and the accuracy of the proposed model. A multi-method explainable AI (XAI) framework combining SHAP (SHapley Additive exPlanations), permutation feature importance, and LIME (Local Interpretable Model-agnostic Explanations) is implemented.
  • Uses Lagrange optimization to find the optimum required transmission distance between the medical centers and the wearable devices to effectively send the patient information.
  • Uses the obtained results as a dataset for a 1D-CNN, which will be able to predict the optimum required distance under different environmental conditions such as required signal-to-interference-plus-noise (SINR), transmission power, interference transmission power, path loss, and interference transmission distances.
  • Implements Bayesian optimization as well for the 1D-CNN used for predicting the required transmission distance to enhance the system performance in terms of energy efficiency.
The presented paper is structured as follows: Section 2 contains the suggested methodology, including data preprocessing, model architecture, and evaluation criteria, which are described in depth. The results of the proposed model are presented in Section 3, which offers a full assessment of the performance of the proposed model in terms of system accuracy. The conclusion and future works are presented in Section 4.

2. Materials and Methods

The proposed wireless communication model and the diabetes prediction are proposed in this section. The proposed model is divided into two phases, as shown in Figure 1. In Phase 1, the proposed efficient wireless communication is built based on using Lagrange optimization to determine the best required transmission distance to ensure that the data are effectively received at the medical centers. The results of the proposed wireless communication system are used as a dataset to build a new 1D-CNN to predict the required transmission distance and enhance the system performance in terms of energy efficiency (EE). Phase 2 features the proposed diabetes risk prediction, and the dataset used for diabetes risk prediction is available online at Kaggle [33]. This dataset offers a thorough foundation for predictive modeling since it contains a variety of variables, including blood glucose, cholesterol, and BMI. Data quality and modeling preparedness are guaranteed by preprocessing procedures such as addressing missing values, normalization, and encoding categorical variables. In order to maximize accuracy and computational efficiency, Bayesian optimization has been implemented for the CNN architecture with the implementation of XAI, which was created for sequential and structured data, combining dense layers for prediction with convolutional layers for feature extraction.
Bayesian optimization is employed to find the optimum required hyperparameters of the proposed 1D-CNN model in order to achieve optimal performance while maintaining computational efficiency. Unlike manual or grid search methods, Bayesian optimization constructs a probabilistic model of the objective function and uses it to guide the search toward the most promising regions of the hyperparameter space. In this study, the Gaussian Process (GP) serves as the surrogate model, balancing the exploration of new parameter values with the exploitation of areas already known to yield good results. Key hyperparameters optimized include the number of convolutional filters, kernel sizes, learning rate, batch size, and dropout rate. The optimization objective was defined to minimize validation loss while improving generalization. The process iteratively updates the surrogate model based on previous trials and selects the next set of hyperparameters using an acquisition function. This approach enabled the efficient identification of a robust 1D-CNN configuration, reducing overfitting risks and improving predictive accuracy compared to baseline models.

2.1. Proposed Wireless Communication Model

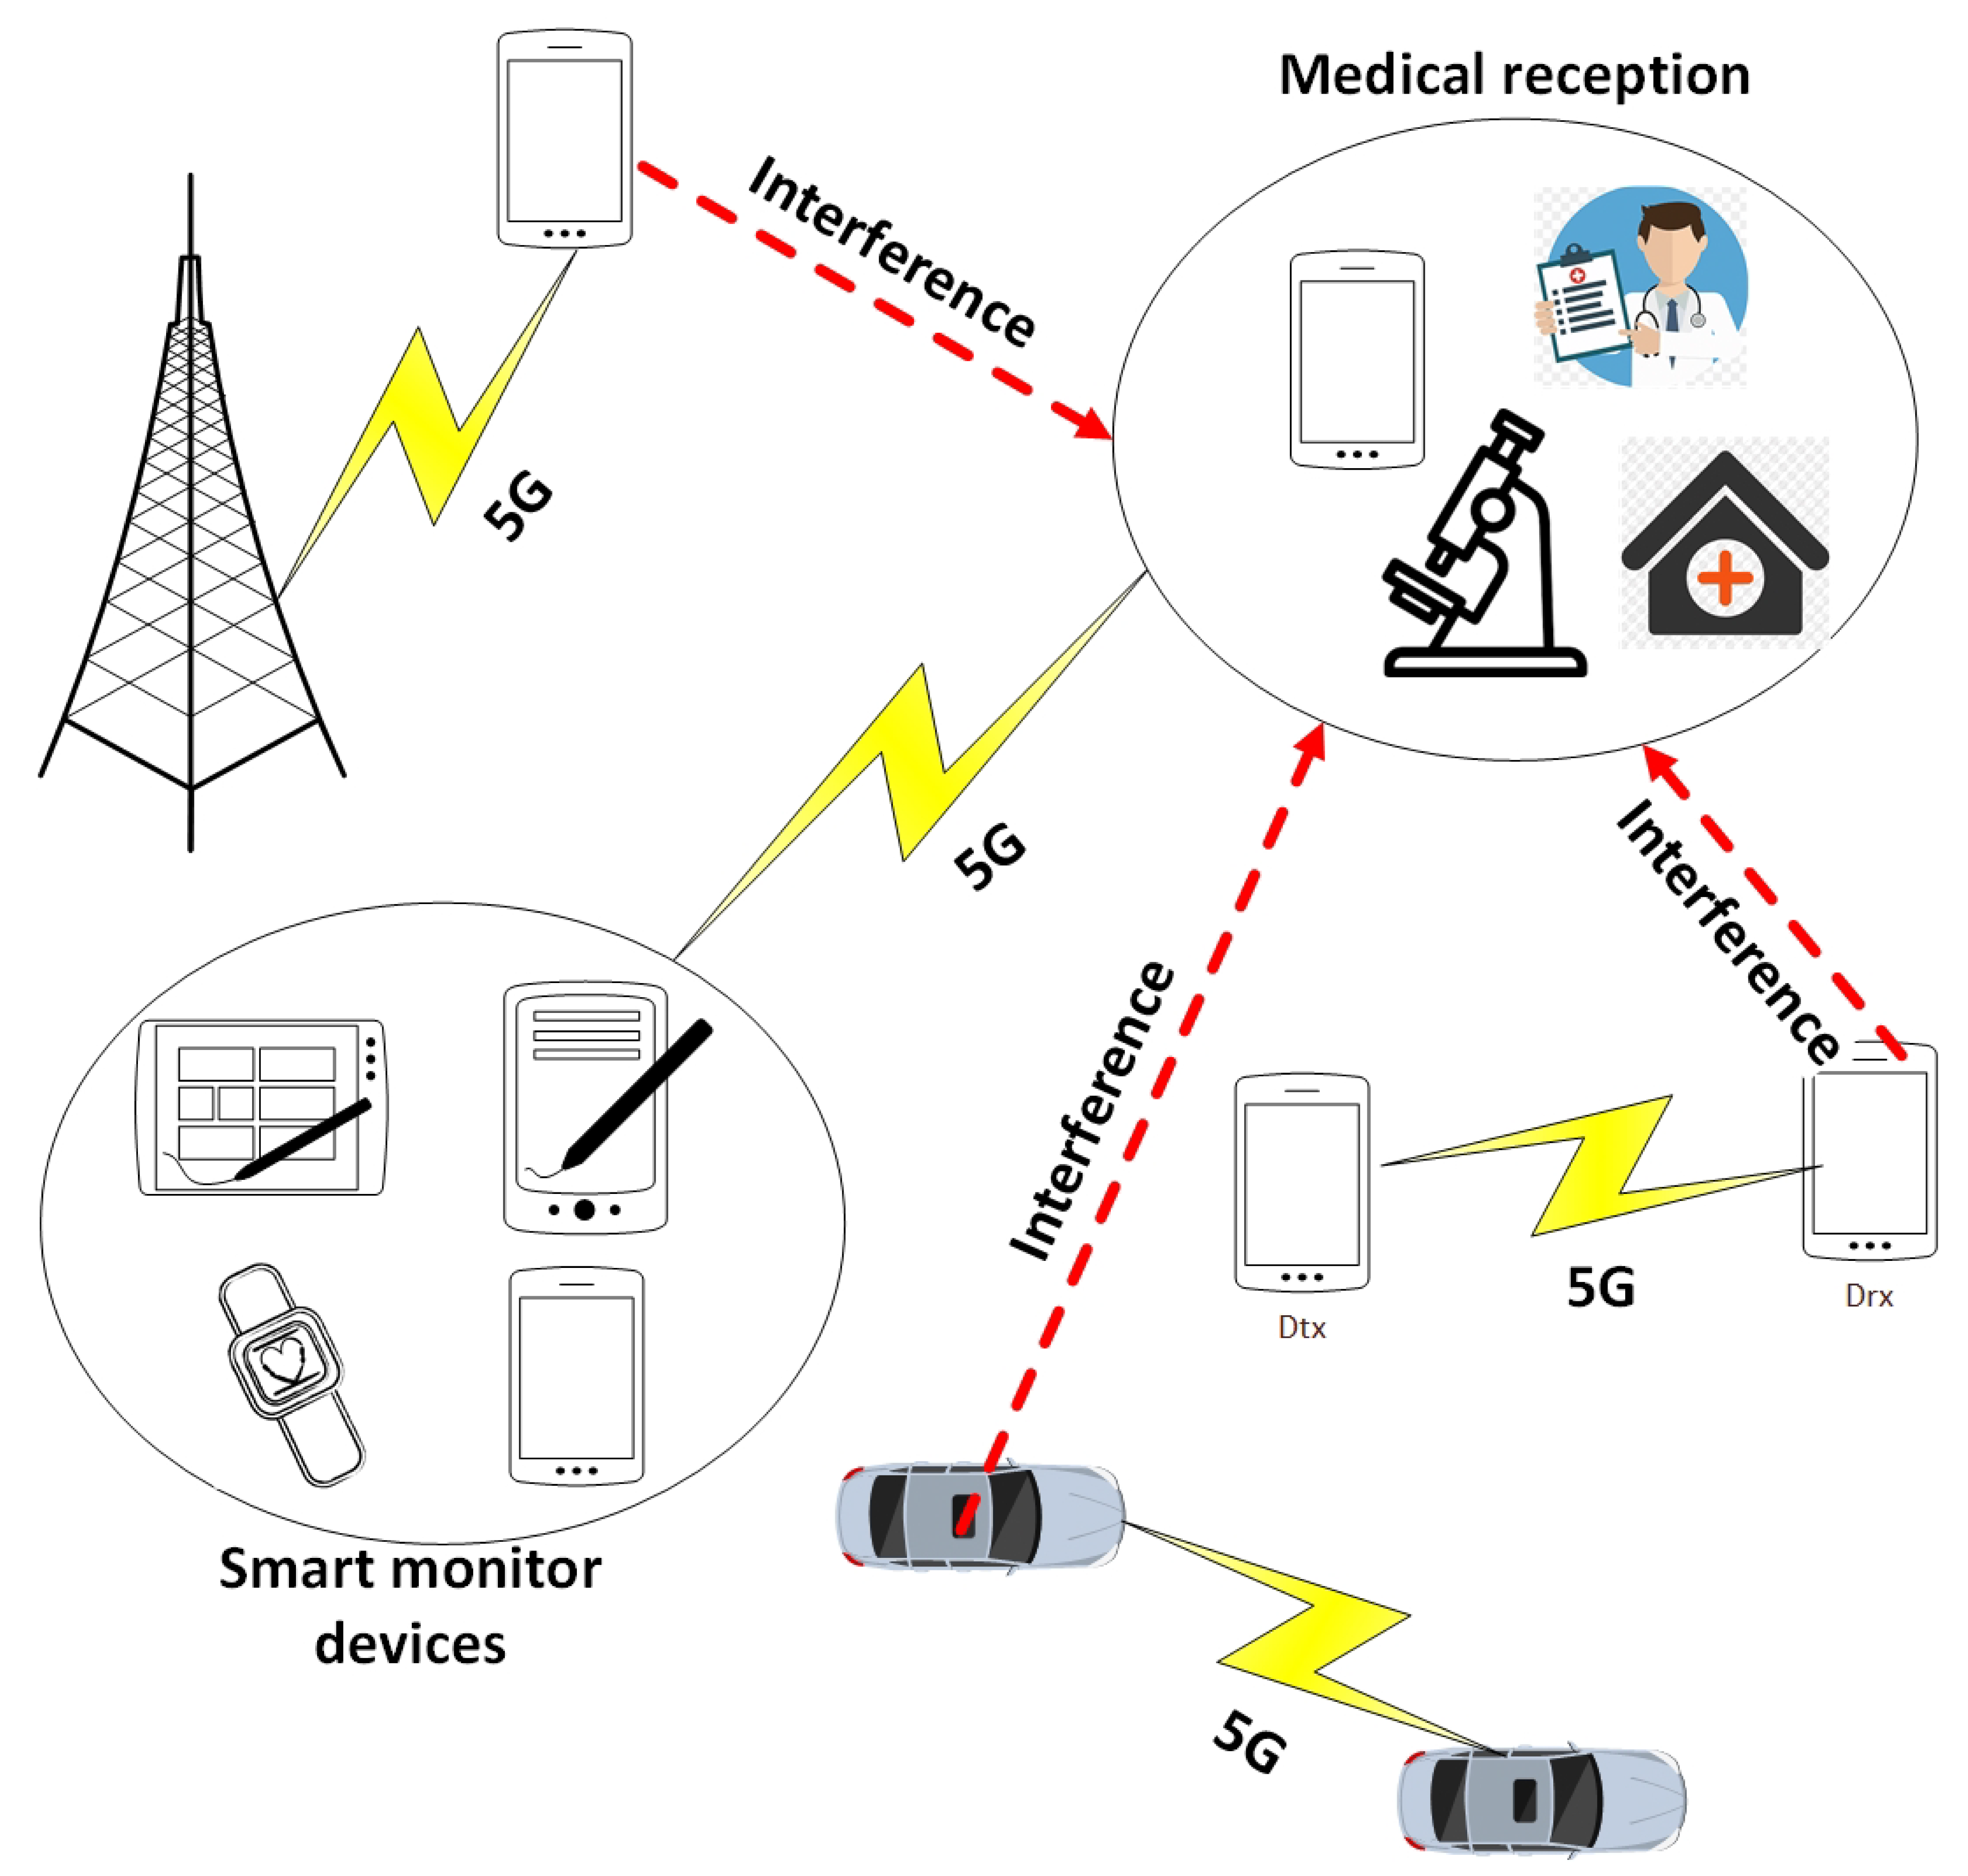
The proposed wireless system model for patients assumes that the wearable devices monitor, collect, and send data to the medical centers under various wireless environmental conditions. The data sent to the medical centers may be affected by the interference devices that share the same spectrum as the wearable patient devices and then may affect the quality of the transmitted data. Figure 2 shows the common spectrum where the wearable devices send data to the medical center, alongside CUEs that send data to the base station (BS), communication between D2D devices (Dtx and Drx), and communication between V2V vehicles (Vtx and Vrx). This proposed approach aims to improve communication between wearable patient devices and medical centers through implementing Lagrange optimization to determine the best required transmission distance to enhance the system performance in terms of energy efficiency, which can be expressed as shown below:
Maximize w = 1 W E E w Subject to E E w : = f 1 ( SINR , P W , P I ) with SINR S I N R min , P W P Wmax
where SINR min is the minimum required system signal-to-interference-plus-noise, P W and P Wmax represent the transmission power and the maximum transmission power of wearable devices, and P I and P Imax represent the interference transmission power and the maximum interference transmission power of wearable devices.
Non-Orthogonal Multiple Access (NOMA) is assumed for the proposed model to enable the efficient sharing of spectrum resources among multiple users, thereby supporting scalable and adaptive communication in wearable device environments [34]. Furthermore, the proposed model operates in a Rayleigh fading channel with additive white Gaussian noise (AWGN) [35]. The system energy efficiency is expressed by the following expressions:
EE = R P W + P o = B · log 2 1 + P W h WM σ 2 + k = 1 K P C h C k M + d = 1 D P D h D d M + v = 1 V P V h V v M P W + P o
where P o represents the internal circuitry power consumption. h C k M , h D d M , and h V v M are the direct channel gain from the interfering CUE, interfering transmitter D2D, and the interfering transmitter V2V and medical centers, respectively.
The objective is to determine the maximum required transmission distance d WM to enhance the wireless system performance in terms of EE while satisfying power and QoS constraints. Consequently, the Lagrangian for the optimization problem represented by Equation (1) is the following formula:
L ( P W , P I , λ 1 , λ 2 ) = E E λ 1 ( SINR min SINR ) λ 2 ( P W P Wmax )
where the non-negative Lagrange multipliers are represented by λ 1 and λ 2 . For simplicity, it has been assumed that all the interference transmission power ( P C , P D , and P V ) have the same value, which is presented by P I . The derivative of Equation (3) has been taken with respect to λ 1 and λ 2 , and the following expressions are obtained:
P W = P Wmax
d WM = [ P Wmax p l o SINR min ( σ 2 + k = 1 K P C h C k M + d = 1 D P D h D d M + v = 1 V P V h V v M ) ] ( 1 / α )
where α is the path loss exponent and p l o represents the constant path loss between wearable devices and the medical center.
To ensure reliable and efficient data transfer between wearable devices (WDs) and medical centers (MCs), a wireless communication model is integrated as the first phase of the proposed framework. The multimodal patient data are collected by the wearable devices continuously. These collected data should be transmitted in real time to the clinical center for processing by the predictive model. Due to sharing all the transmitted devices in the same spectrum, wireless communication is often subject to interference, which degrades the signal quality. If not properly addressed, such interference may result in delayed or incomplete transmission, thereby limiting the accuracy and clinical applicability of the predictive model.
To mitigate these challenges, Lagrange optimization is applied to determine the optimal transmission distance and power allocation between WDs and MCs. The objective is to maximize energy efficiency while ensuring that the transmitted data maintain the required reliability and quality for clinical use. The solution derived from the Lagrangian function provides the optimal communication parameters, which are then used to generate a dataset representing the best transmission conditions. The obtained results are used as input data for the second phase of the framework, where the predictive model is applied. By integrating the wireless communication model with the predictive model, we establish a seamless pipeline from data collection to AI-driven risk prediction. Phase 1 ensures the data are sent using an efficient and reliable wireless communication system. Phase 2 (the 1D-CNN with Bayesian optimization and XAI) processes these data to provide accurate and interpretable predictions of diabetes risk. Thus, the wireless communication model is a foundational enabler that guarantees the practical deployment and robustness of the overall framework.

2.1.1. Data Generation

The required dataset is generated through the analytical model explained in Section 2.1. The analytical model is implemented using Python to find the needed transmission distance between wearable devices and medical centers to enhance the wireless communication system. Table 1 represents the simulation parameters implemented in this proposed model. The obtained dataset comprises a total of 12,779 records, each representing a different combination of key parameters: the distance between all interfering devices and medical centers ( d C M ), ( d D M ), and ( d V M ), the required signal-to-interference-plus-noise ratio threshold ( SINR min ); the required wearable devices transmission power transmission powers ( P W ); and the interference transmission power transmission powers ( P I ).
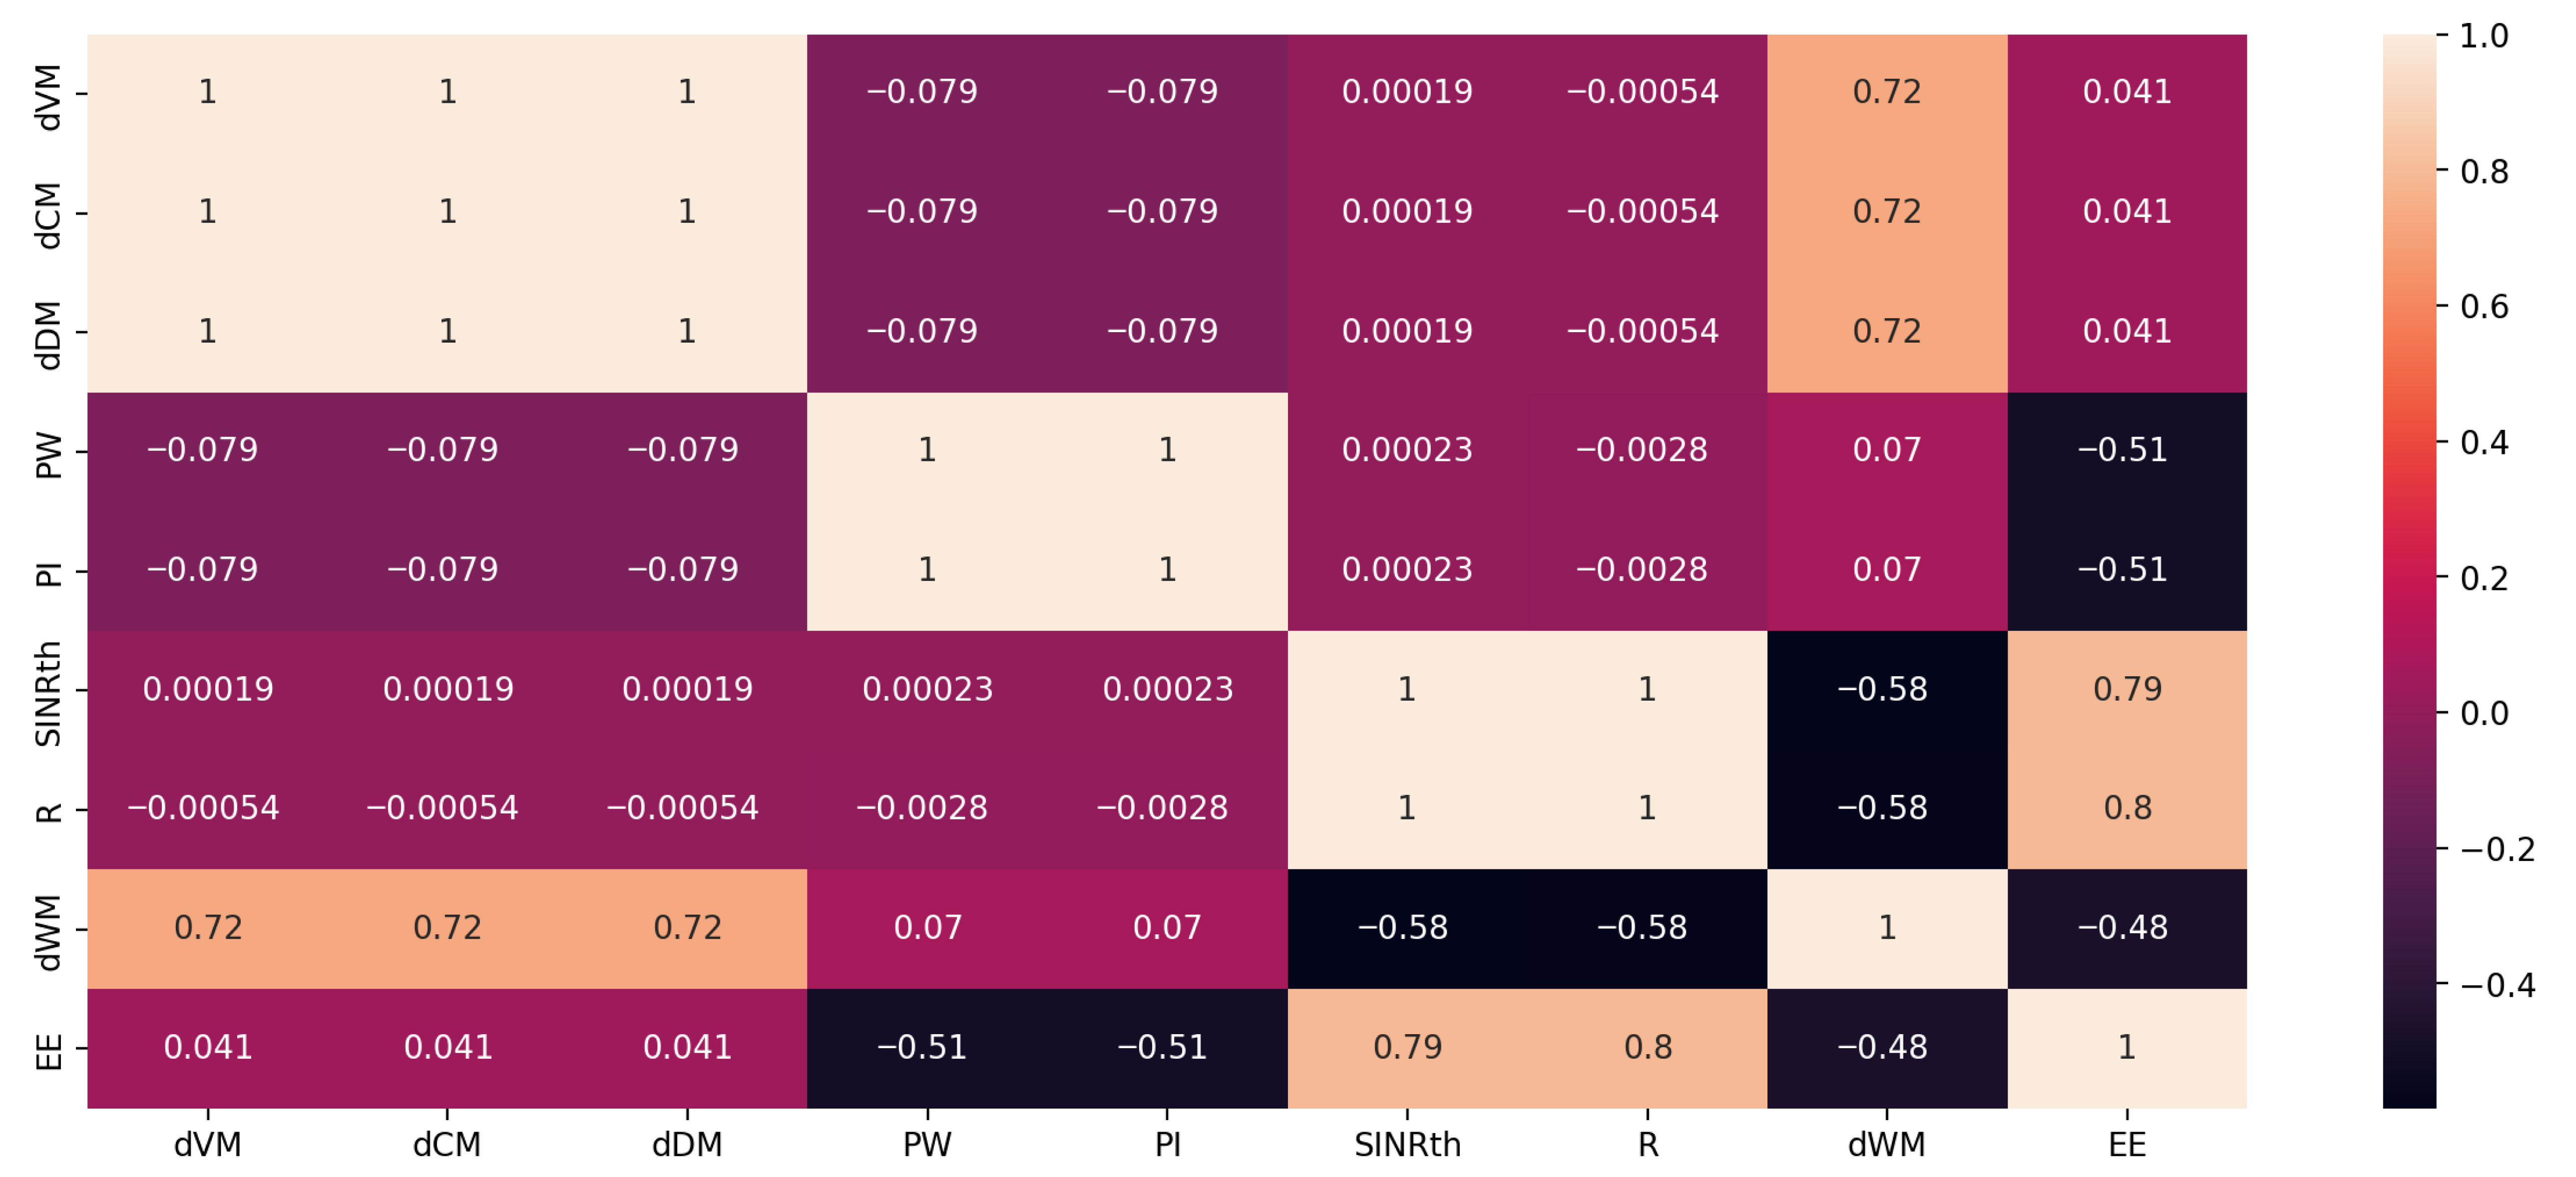
Energy efficiency (EE) and the required transmission distance between the wearable device and the medical center ( d V M ) are the two important matrices of the proposed model and the performance indicators. The Pearson correlation matrix in Figure 3 shows the linear correlations of these two matrices. Figure 3 shows that all the transmission distances ( d D M , d C M , and d V M ) have a strong positive correlation with d W M (around 0.72) and are perfectly correlated with each other. The wearable transmission power ( P W ) has a moderate positive correlation with EE (0.51), while the interference transmission power ( P I ) has a moderate negative correlation with EE (−0.51), which aligns with the fact that higher transmission power leads to reduced energy efficiency. Additionally, SINR min and R show a strong positive correlation with EE (0.79 and 0.8), which means that increasing SINR min and R leads to increased EE. Finally, d W M has a moderate negative correlation between EE (−0.48) and a positive moderate correlation with SINR min R (−0.58). This indicates that at short or long transmission distances, the energy efficiency may be affected either by interference or transmission power.

2.1.2. Proposed Wireless Communication Deep Learning Model

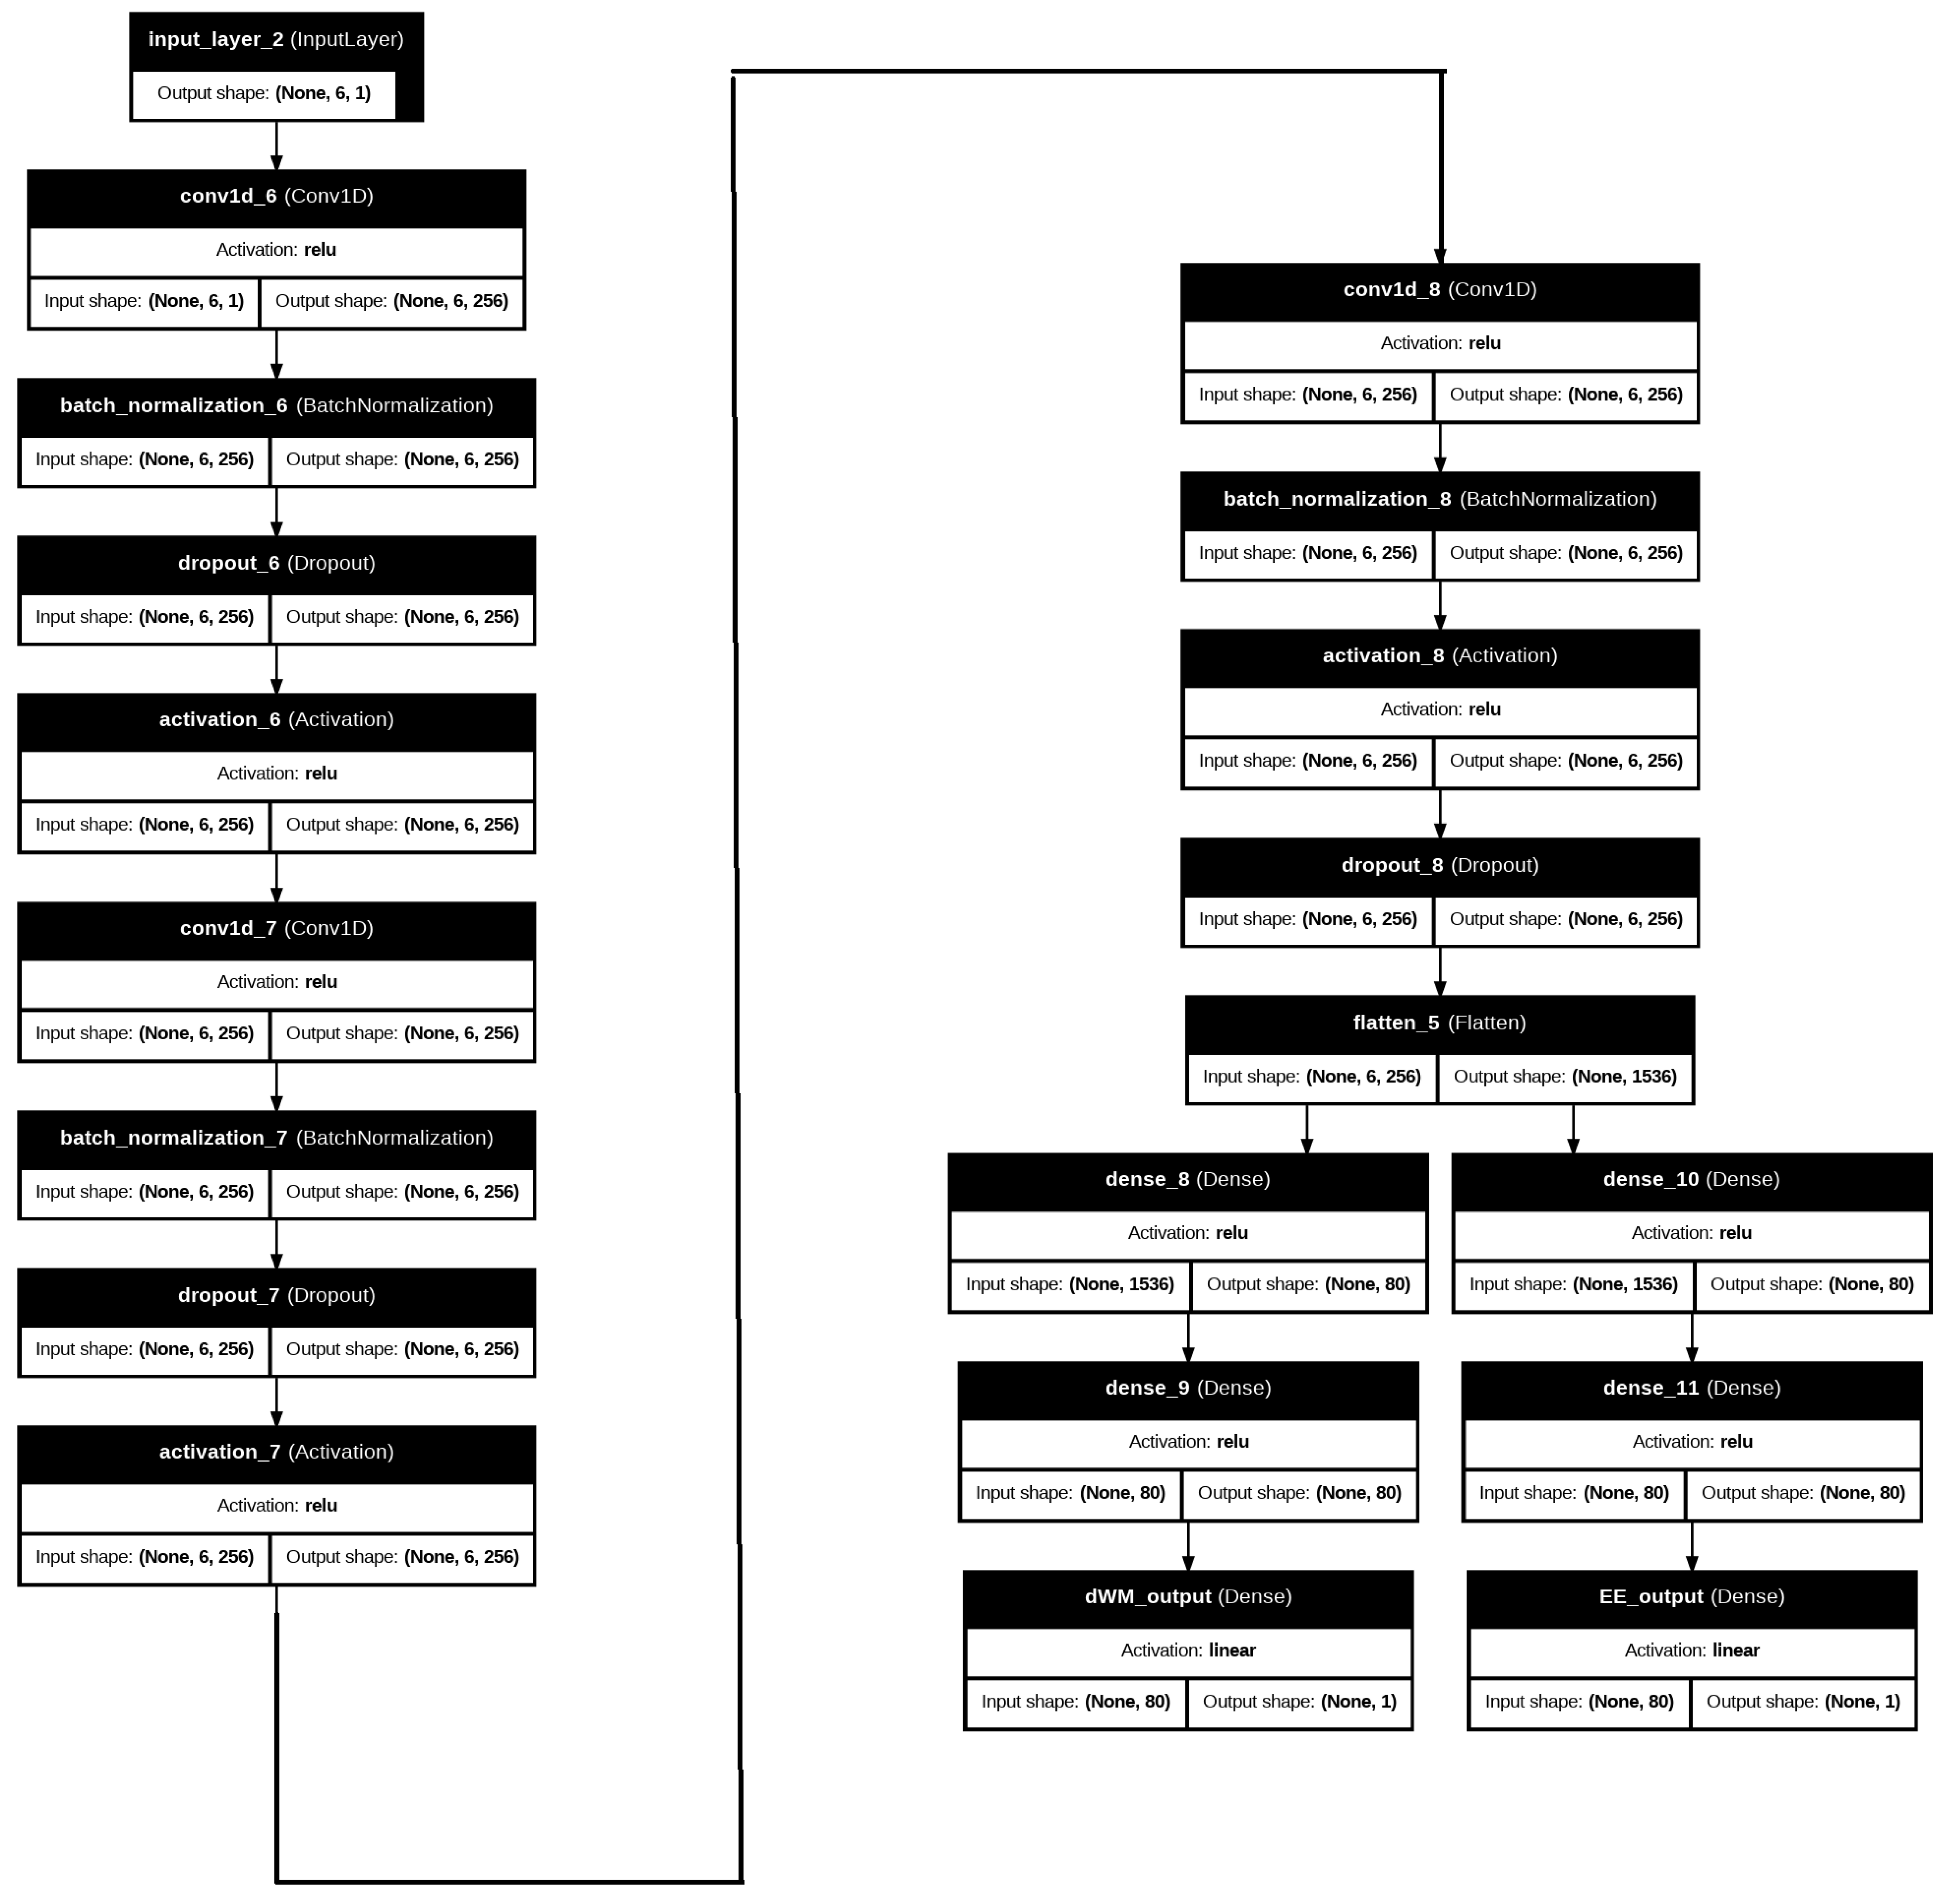
This section proposed the suggested deep learning model for the proposed wireless communication system. A normalization step needs to be completed before adding the variables to the proposed deep learning model to help with the learning of the model weights. The min–max scaling procedure is implemented for each variable before being included in the model. The seven input variables, d D M , d C M , d V M , SINR min , P W , P I , and R, are used to predict the two outputs, which are EE and d W M , from the final dense layer. Figure 4 shows the three important phases of the proposed model, which are thick layers, flattening, and the 1D-CNN. The required hyperparameters for the 1D-CNN are obtained by implementing Bayesian optimization. To find the optimum required hyperparameters for the proposed 1D-CNN, 20 trials have been implemented, each with 20 epochs, and the required kernel size is 1, with 256 filters, 80 dense layers, a learning rate of 0.001, and a dropout equal to 0.1.
The proposed deep learning model shows through normalization the importance of preprocessing to prevent any variable from affecting the model’s learning process and also to guarantee that all input features are scaled to a consistent range. Furthermore, it is worth mentioning that through using Bayesian optimization for the proposed model for hyperparameter tuning, the model will be able to effectively predict the outputs. Additionally, the adaptive moment (Adam) has been used as an optimizer for the proposed deep learning model. To show the effectiveness of the proposed model, four different metrics have been used to measure the accuracy of the proposed model. These four metrics are the Mean Absolute Error (MAE), Mean Squared Error (MSE), Root Mean Squared Error (RMSE), and Coefficient of Determination ( r 2 ), which can be defined, respectively, as follows:
MAE = j = 1 n | y j x j | n
MSE = j = 1 n ( y j x j ) 2 n
RMSE = j = 1 n ( y j x j ) 2 n
r 2 = 1 i = 1 n ( y i y ^ i ) 2 i = 1 n ( y i y ¯ ) 2
where n represents the total amount of the obtained data, y j represents the actual data, and x j represents the predicted data. In the next section, all the experiments that were implemented to evaluate, test, and train the proposed deep learning model will be described.

2.2. Proposed Diabetes Risk Prediction

This section describes the proposed model for accurate and effective diabetes prediction. The proposed deep learning model is built using Explainable AI (XAI) with a 1D-CNN. Explainable AI (XAI) is important in modern machine learning applications, especially in the healthcare sector, because it provides transparency, trust, and accuracy for the system. The traditional black-box models, such as deep neural networks, often achieve high predictive performance without understanding the reason behind these results. The lack of transparency leads to adoption in critical decision-making processes and loss of user trust. SHAP, LIME, and Permutation Importance have been assigned for the proposed model because they provide complementary insights into model behavior.
SHAP (SHapley Additive exPlanations) shows the importance of each feature and how it will affect the output prediction. LIME (Local Interpretable Model-agnostic Explanations) generates alternative surrogate models around specific instances, making it more ideal for understanding each prediction, and based on it, an action will be taken at the patient or sample level. Permutation importance evaluates the model performance when the random shuffling of features occurs; also, it highlights the features on which the model relies the most and offers a straightforward global measure of feature relevance. Overall, XAI bridges the gap between predictive accuracy and transparency, ensuring that AI systems are not only powerful but also trustworthy and ethical and can help to make trustworthy decisions.
For example, in healthcare, XAI enables clinicians to make the right decision based on understanding why a model predicts a patient is at risk for a certain disease [38]. In addition to all that was mentioned, Bayesian optimization has been implemented to achieve the optimum required hyperparameter for the proposed 1D-CNN and for this dataset, which increases the system accuracy.
The ultimate purpose of the suggested framework is to offer doctors a dependable and interpretable tool for assisting with early diabetes diagnosis and lowering the risk of severe consequences.

2.2.1. Dataset Description

The dataset used in this study is extracted from the popular data science competition and open dataset platform Kaggle, as mentioned earlier. It contains 70,000 rows and 34 columns with 34 carefully chosen elements that describe the complex nature of diabetes risk. Predictive modeling is made possible by these elements, which cover genetic, environmental, lifestyle, and clinical aspects. The elements of the dataset are outlined below:
  • Genetic Markers: diabetes genetic signs that allow the model to take family risk factors into consideration.
  • Body Mass Index, or BMI: a commonly used metric that evaluates body fat based on height and weight and is strongly linked to metabolic diseases.
  • Blood Glucose Levels: a very important marker to treat and diagnose diabetes, such as postprandial and fasting glucose levels.
  • Cholesterol Levels: contains measurements of total cholesterol, HDL (high-density lipoprotein), and LDL (low-density lipoprotein); all these are important indicators of metabolic and cardiovascular health.
  • Lifestyle Factors: characteristics of people’s habits that can be changed to reduce the risk of diabetes, such as levels of physical activity, eating patterns, smoking status, and alcohol intake.
The proposed model target is enhancing the accuracy of the proposed deep learning model to help clinicians make the right decision and at the same time decrease the risk of diabetes.

2.2.2. Data Preprocessing

Data preparation is essential for the dataset in order to guarantee the accuracy and dependability of the model’s predictions. The dataset was cleaned, normalized, and encoded for this study using a number of preprocessing procedures to make sure it was appropriate for machine learning model training. The actions listed below were taken:
  • Handling Missing Data: In real-world datasets, missing values are a very common issue that may affect model performance. The imputation approach is the implemented method for handling the missing values in this dataset based on the distribution of each feature. The mean and median are used to impute continuous variables such as blood glucose, cholesterol, and BMI. The data distribution should be taken into account when choosing between mean and median imputation. However, only the median is used for skewed distributions to avoid bias from extreme findings. To maintain consistency across instances, the mode is used to impute missing values for categorical variables. This approach ensured little information loss while maintaining the integrity of the dataset.
  • Normalization: The normalization of continuous features is essential to guarantee that the model can effectively learn from the data without being impacted by the magnitude of any one characteristic. Variables like blood glucose, cholesterol, and BMI should be subjected to min–max normalization. This method improves the numerical stability during training by scaling the data to a range between 0 and 1 to guarantee that the input values fall within a consistent scale. Given that significant differences in feature values can impede learning and slow convergence, this transformation is particularly crucial for neural networks. We guarantee that every feature makes an equal contribution to the model’s learning process by normalizing the data.
  • Categorical Encoding: The dataset contains a number of categorical variables that cannot be used in machine learning models because they are not numeric values, such as alcohol consumption, physical activity, and smoking status. One-hot and label encoding were used to transform these variables into a machine-readable format. Therefore, label encoding is used to transfer the non-numeric categorical variables (such as smoking status: yes/no) to numeric values by giving a distinct integer value for each variable. One-hot encoding is used for the multi-class categorical variables such as physical activity levels or target. This change maintains the data’s fundamental structure while enabling the model to handle each category separately.
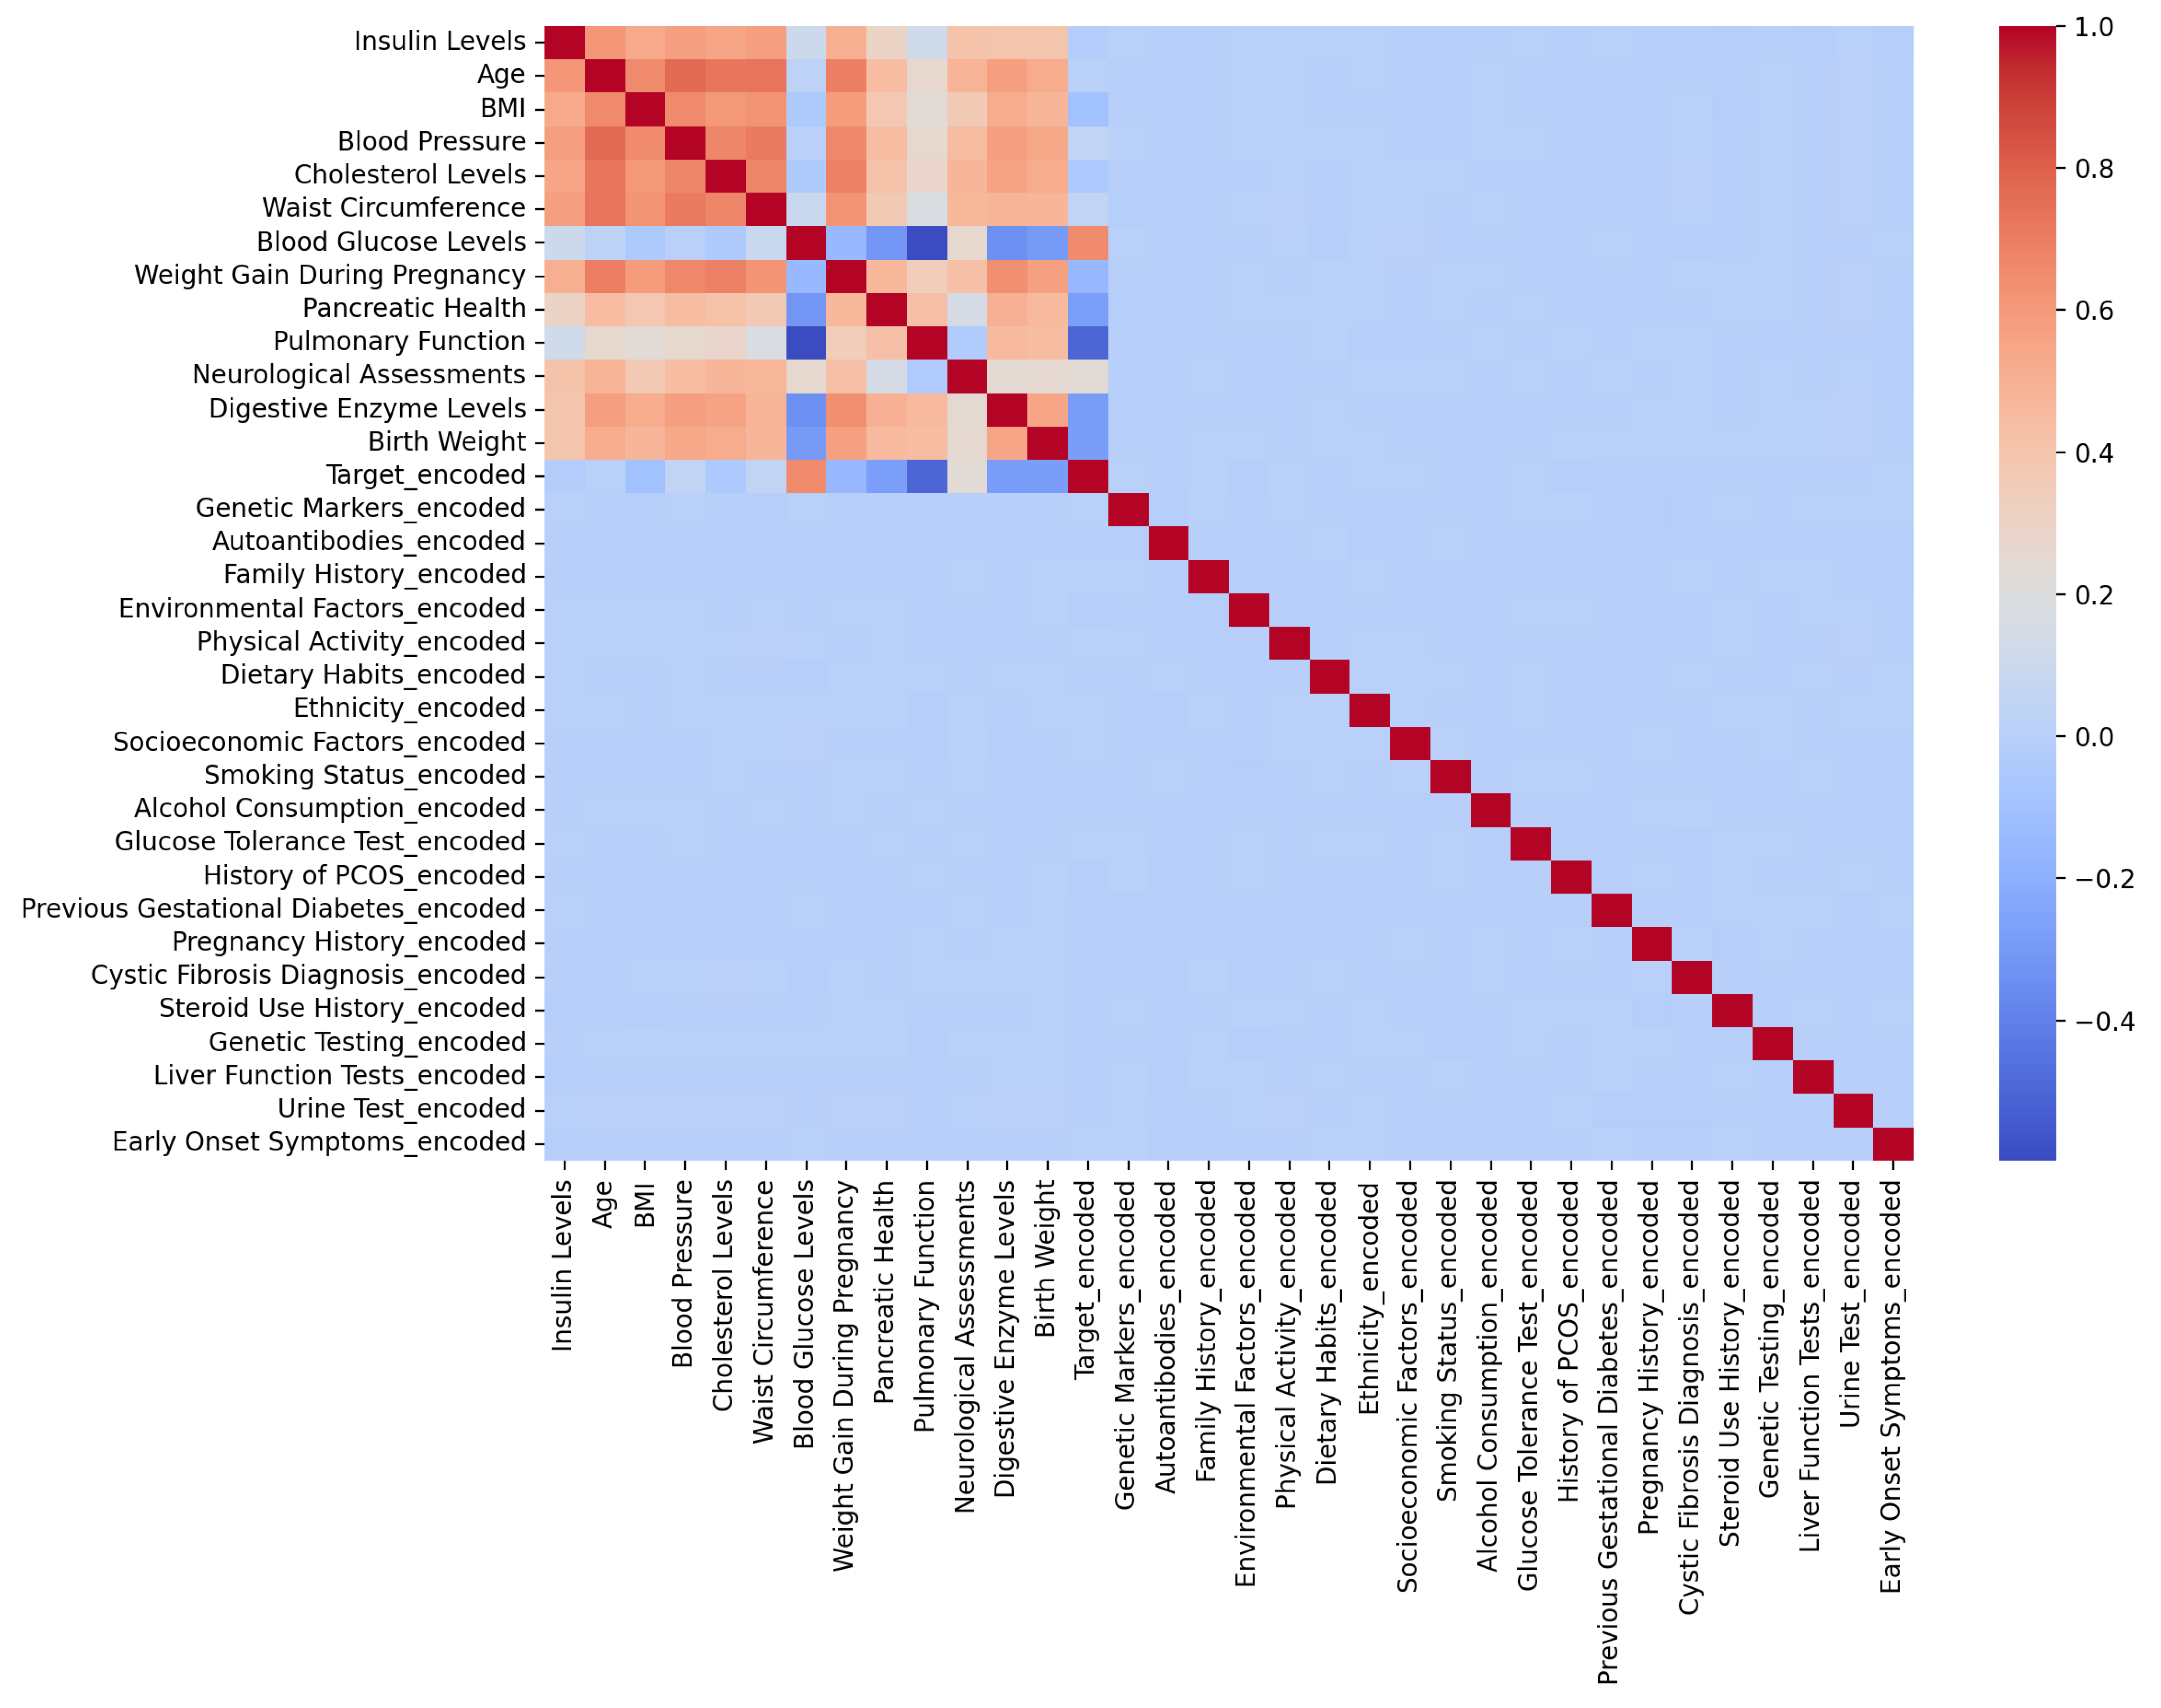
After data processing, a correlation analysis is carried out to examine the dataset in more detail and with a better understanding of the relationships between all the features. The correlation between all the features is displayed in Figure 5. Figure 5 shows that features including “blood glucose levels,” “insulin levels,” and “BMI” have significant positive correlations with the target output; this positive correlation depicts their significance in predicting the risk of diabetes. On the other hand, certain features exhibit weak or insignificant associations, which helped choose which factors to omit when choosing features. Finding multicollinearity and guaranteeing the model’s resilience required this investigation. Furthermore, it can be mentioned that there are some features that have approximately a very weak correlation with the target outcome, which means that these features have no significant effect on the diabetes risk prediction.

2.2.3. Proposed Diabetes Prediction Deep Learning Model

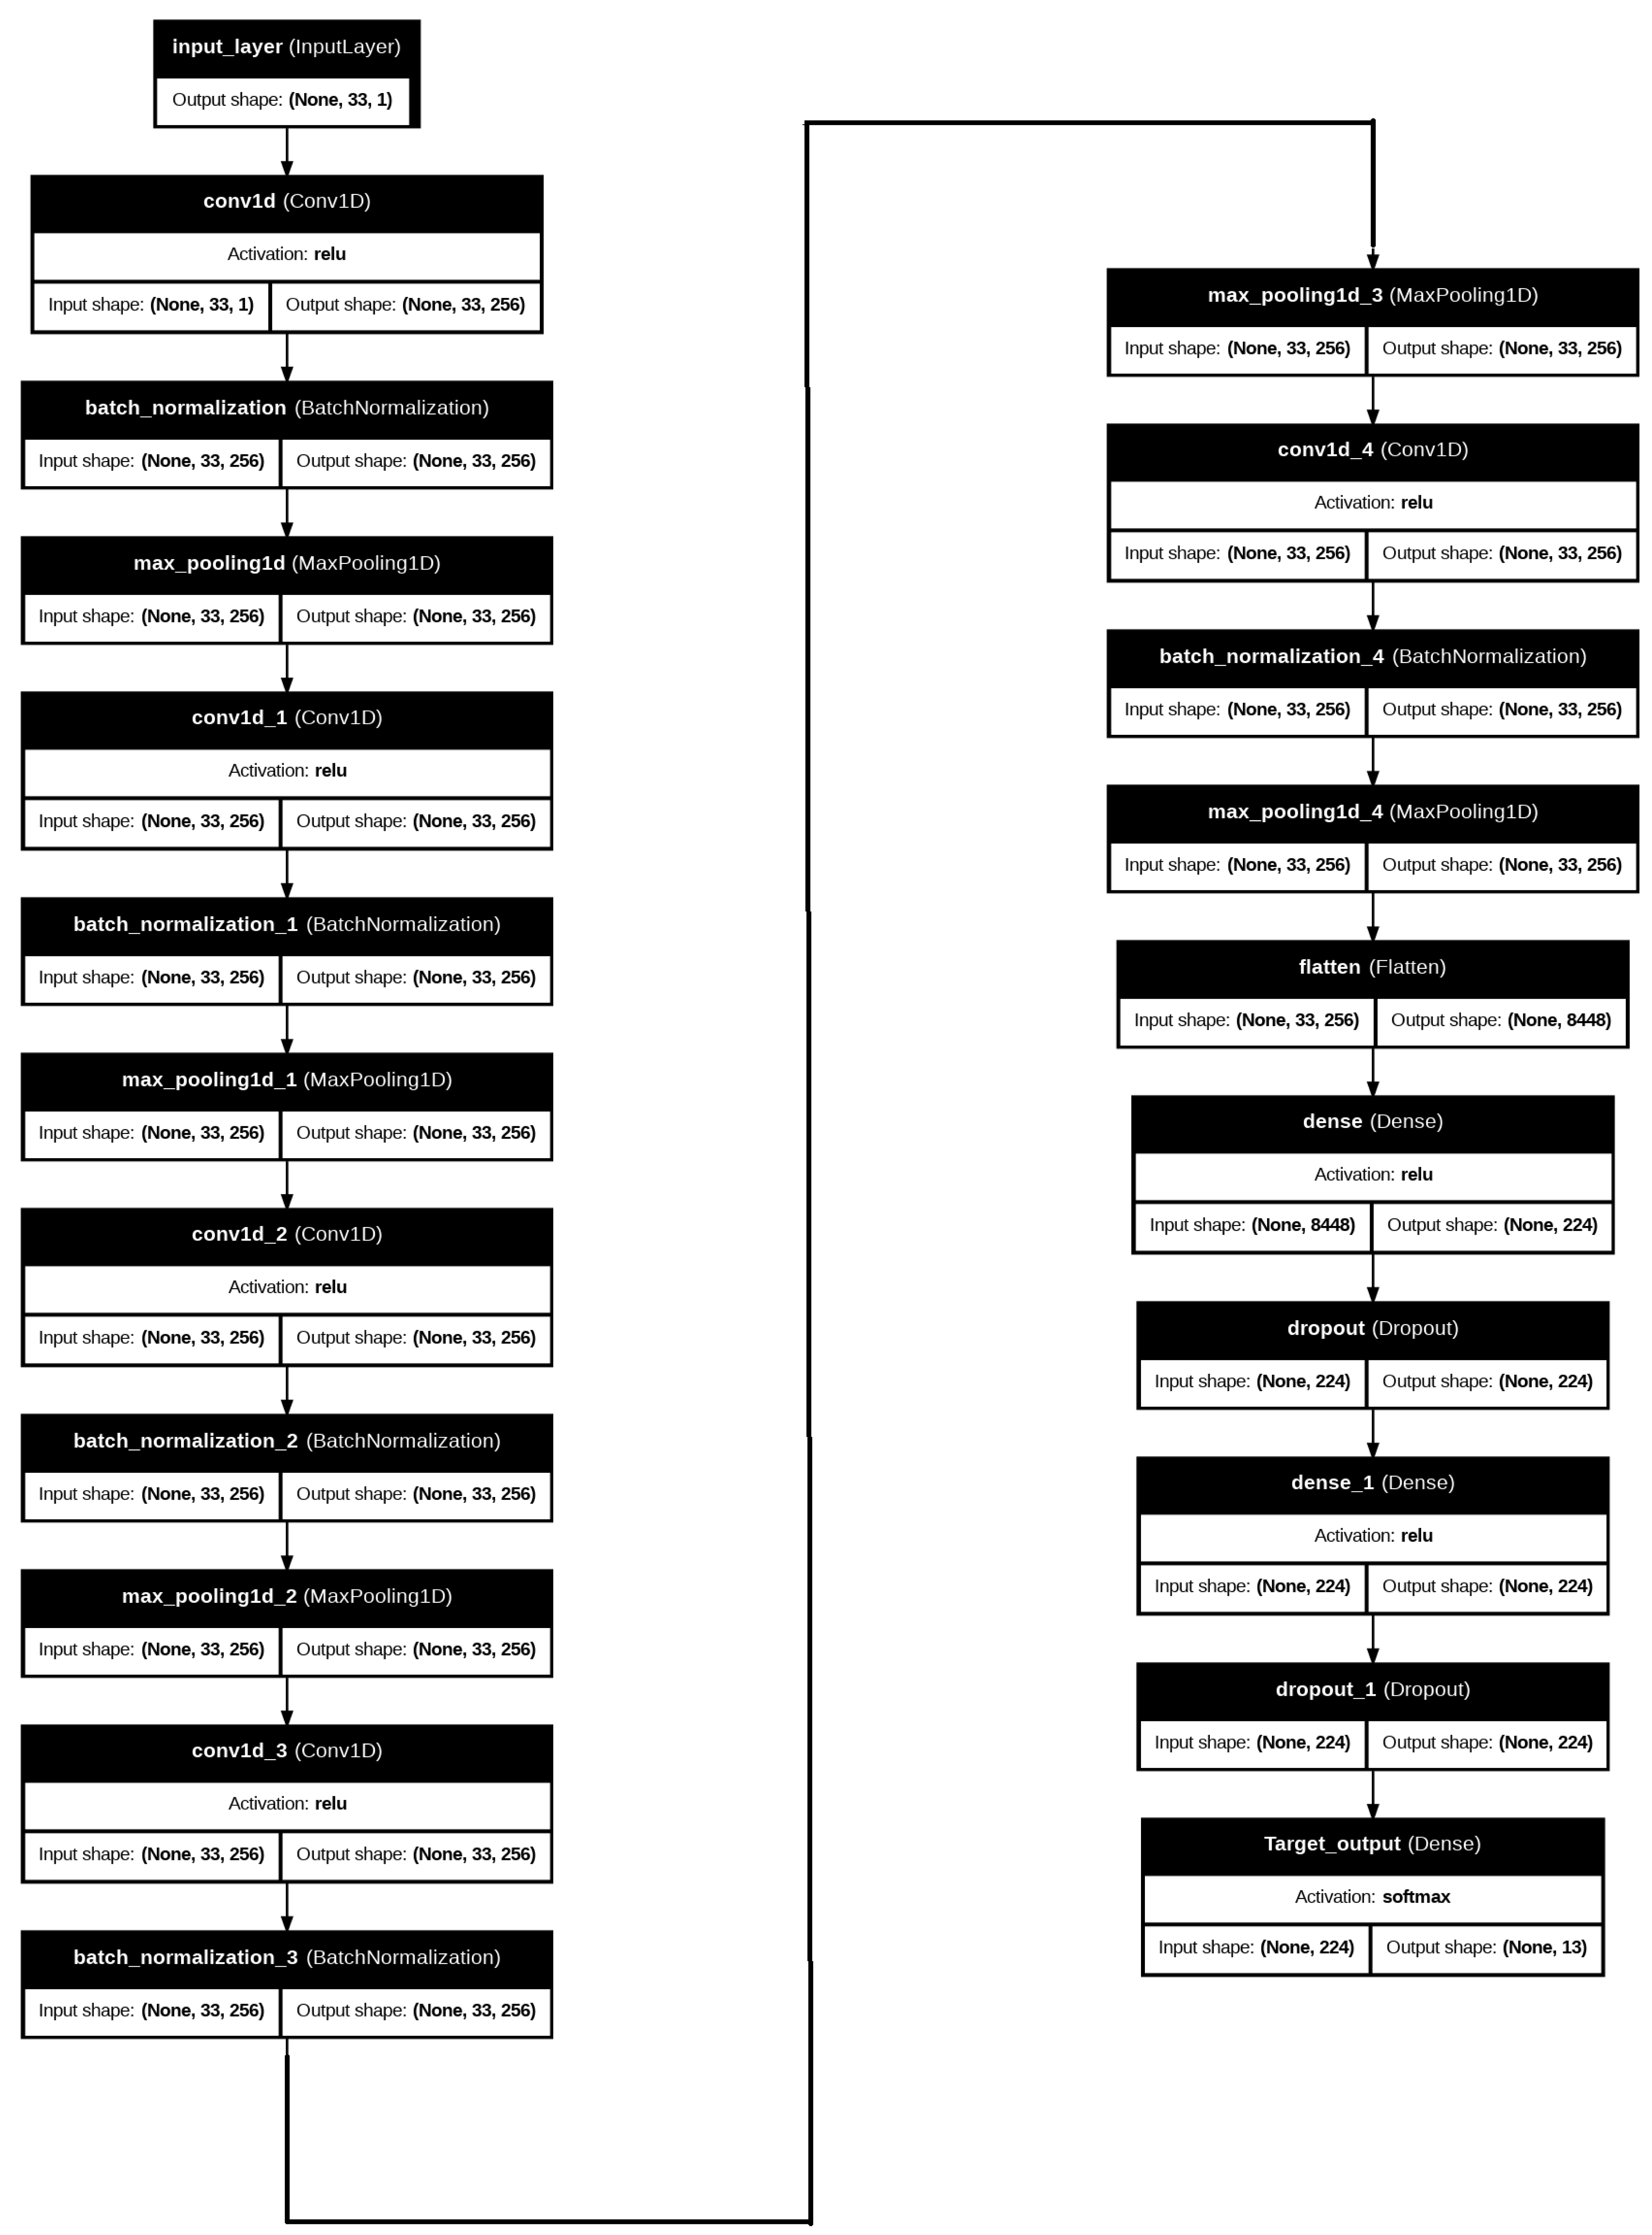
The 1D Convolutional Neural Network (CNN) used in the proposed predictive model created for this study is especially well suited to processing sequential and structured data, such as the diabetes-related variables in the dataset. The 1D-CNN model is designed to effectively predict diabetes risk and also capture intricate interactions between input variables. Figure 6 depicts the proposed 1D-CNN model, highlighting each layer with the required parameters for system accuracy. Table 2 illustrates the optimum required hyperparameters obtained from Bayesian optimization. These optimum hyperparameters and the extra procedures, such as XAI, are compiled to effectively enhance the system accuracy. The layers of the model are as follows:
  • The input layer takes in a dataset that has 34 normalized characteristics per instance, each of which represents a different genetic, lifestyle, clinical, and environmental component associated with diabetes. With each element representing a normalized value of one of the 34 qualities, these features are organized as a vector. In order to improve the stability and effectiveness of the learning process, the dataset has been preprocessed and normalized to guarantee that all values fall within a consistent range.
  • Convolutional Layers: At the heart of the CNN design, the convolutional layers are in charge of extracting high-level feature representations and local patterns from the input data. To capture local relationships and hierarchical patterns between adjacent features, each convolutional layer employs filters (kernels) that move over the data while carrying out a convolution operation. The CNN layer has the ability to uncover intricate relationships between the input features when the dataset contains interactions between several variables.
  • Activation Functions: The Rectified Linear Unit (ReLU) activation function is implemented after each convolutional layer. The ReLU function helps the model discover more complex patterns that a straightforward linear model is unable to grasp. The ReLU function allows the features to handle both negative and positive values in the data. This can improve the capacity of the model to discover complex relationships and decision boundaries between the features.
  • Dense Layers: The data pass through fully connected (dense) layers, where every neuron is coupled to every other neuron in the preceding layer, following the convolutional layers. Dense layers aid in preparing the final output by integrating the learned information from the convolutional layers. These layers enable the model to integrate data from many features and identify more complex patterns that are essential for precise diabetes risk assessment.
  • Output Layer: The forecasts based on diabetes risk scores are produced by the output layer. This output layer, which usually consists of a single neuron for regression tasks, generates a continuous value that is equivalent to the anticipated diabetes risk score. The likelihood that each person in the sample will acquire diabetes may then be estimated from this score.
  • Optimizer and Loss Function: The optimizer used in this proposed model is the most well-known optimization, the Adam optimizer. Adam, known for its effectiveness and resilience in deep learning model training, is used to optimize the model. During training, Adam has the ability to modify the learning rate, facilitating a quicker and more efficient convergence of the model.
  • XAI With SHAP and LIME: To enhance the transparency and the accuracy of the proposed deep learning model, a multi-method explainable AI (XAI) framework combining SHAP (SHapley Additive exPlanations), permutation feature importance, and LIME (Local Interpretable Model-agnostic Explanations) is implemented. SHAP is used to compute both global and local feature attributions, identifying the most important input variables for each output target class across the entire dataset. The top-ranked features, based on mean absolute SHAP values, were then selected for retraining the model to reduce complexity while maintaining predictive performance. Permutation feature importance is applied using a surrogate Random Forest model trained on these selected features, identifying the impact of each feature on model accuracy when shuffled. Additionally, LIME is implemented to provide a clean explanation for individual predictions, showing the contribution of each feature for a specific test instance.
The architecture is particularly useful for managing high-dimensional, structured datasets, such as the one used in this work, because of its design, which allows it to autonomously learn feature representations. Because complicated, nonlinear interactions between variables are typical in diabetes risk prediction, the ability of CNN to automatically capture detailed correlations between characteristics without the requirement for manual feature extraction makes it very powerful.
Because of the prediction task’s constraints and the nature of the dataset employed, the suggested framework must use a one-dimensional Convolutional Neural Network (1D-CNN). The dataset consists of multimodal clinical, genetic, and lifestyle information organized systematically and sequentially. Compared with other ML approaches, the 1D-CNN is suitable for this sort of data because of its ability to quickly capture local feature relationships and hierarchical representations. This makes the 1D-CNN ideal for healthcare applications that require high computational efficiency and scalability. Furthermore, previous research in biomedical informatics has shown that 1D-CNNs perform competitively for tasks such as disease risk prediction, patient monitoring, and biosignal analysis, frequently outperforming fully connected neural networks and training faster than recurrent architectures. The proposed 1D-CNN’s specific configuration (number of layers, kernel sizes, filters, activation functions, dropout rates, and dense layers) was carefully chosen and optimized using Bayesian optimization. This method allowed us to search a broad hyperparameter space and choose the configuration that increased validation accuracy while reducing overfitting. By using a data-driven optimization technique rather than manual tuning, we can directly support the final model design with empirical information from our tests.
The suggested model’s decision-making process was better understood after conducting a feature significance analysis using SHAP and LIME. Blood glucose levels were the most important predictor, which is consistent with clinical practice, where fasting glucose and HbA1c are the key diagnostic indications of diabetes. BMI and cholesterol levels also had a significant impact on the predictions, owing to their well-documented connections with insulin resistance, metabolic syndrome, and cardiovascular comorbidities. Aside from clinical signs, lifestyle factors such as physical activity, food habits, and smoking status were identified as essential, proving the model’s capacity to identify modifiable risk factors that might inform preventative actions. The addition of genetic markers improved the model’s interpretability, corroborating the conclusion that heritable variables play a key role in diabetes susceptibility. Importantly, these findings not only confirm the robustness of the proposed prediction paradigm but also highlight its potential therapeutic relevance. By identifying both non-modifiable (genetics, family history) and modifiable (lifestyle, food, BMI) variables, the approach provides doctors with actionable insights, allowing for tailored risk assessment, early intervention, and patient counseling. This combination of predictive modeling and explainable AI guarantees that the findings are both statistically sound and therapeutically useful, bridging the gap between machine learning results and real-world healthcare applications.

2.2.4. Evaluation Metrics for the Proposed Diabetes Risk Prediction Model

To show the effectiveness of the proposed performance of the proposed model, the model has been evaluated through different metrics, which are F1-score, accuracy, precision, recall, ROC-AUC, and Matthews Correlation Coefficient. All these metrics prove how the proposed model is efficient and can help clinicians make a trustworthy decision, and also it can help protect people who are under high risk. These metrics are measured as follows:
Accuracy = TP + TN TP + TN + FP + FN
where the following apply:
TP ( True Positives ) : the number of positive cases which are predicted correctly . TN ( True Negatives ) : the number of negative cases which are predicted correctly . FP ( False Positives ) : the number of negative cases classified as positive incorrectly . FN ( False Negatives ) : the number of positive cases classified as negative incorrectly .
Recall = TP TP + FN
Precision = TP TP + FP
F 1 - Score = 2 · Precision · Recall Precision + Recall
In order to ensure the dependability of the proposed model for practical applications, these criteria were chosen to offer a thorough and impartial assessment of its prediction skills. The test, validation, and training experiments for the suggested model are described in detail in the following sections.

2.2.5. Computational Environment

All simulations, including the simulation of the proposed wireless communication optimization and the diabetes risk prediction models, are implemented using Google Colab. The environment provides access to cloud-based GPUs and TPUs, ensuring efficient model training and evaluation. The implementation is carried out in Python (version 3.10) with TensorFlow (2.13) and Keras (2.11) for deep learning models such as the proposed optimized 1D-CNN, 1D-CNN, GRU, and LSTM. Traditional machine learning classifiers, including Logistic Regression, Random Forest, and Support Vector Machine, were implemented using Scikit-learn (1.3.0). Data preprocessing and visualization are performed with Pandas (1.5.3), NumPy (1.24.2), and Matplotlib (3.7.0). Bayesian optimization was applied using Optuna (3.0).
Google Colab has been chosen based on its accessibility, free availability of GPU resources, and standardized environment, which facilitate both efficient experimentation and reproducibility. This ensures that other researchers can easily replicate the proposed framework using the same cloud-based setup without requiring specialized hardware. While Colab’s environment imposes limitations such as session timeouts (12–24 h) and restricted RAM, these were effectively managed by segmenting training into multiple sessions, saving intermediate checkpoints, and reducing batch sizes where necessary.

3. Results

This section proposes the performance evaluation of the two phases explained previously, which are the proposed wireless communication model for sending accurate data through wearable devices and the proposed diabetes risk prediction. The wireless communication system is assessed using different environmental conditions using Lagrange optimization. Therefore, based on the obtained data, a 1D-CNN is implemented using Bayesian optimization to find the optimum system hyperparameter for the proposed dataset to effectively predict the required transmission distance between wearable devices and medical centers to ensure that the data are effectively received.
Additionally, the form of the proposed diabetes prediction risk is assessed using a variety of criteria to provide a fair appraisal of its predictive power. The model’s performance across all classes, especially the minority ones, was better understood by using important metrics like precision, recall, and F1-score in addition to accuracy, which can be deceptive in unbalanced datasets. Additionally, loss and mean square error were examined to evaluate the model’s training error minimization and convergence. A thorough analysis of the dataset and model outputs was conducted, and the experimental evaluations are provided step by step. These findings are further corroborated by thorough tables that emphasize the main conclusions and by elaborate visualizations that include confusion matrices, loss curves, and performance summaries.
The simulation parameters for training the proposed 1D-CNN model, including the learning rate, number of filters, kernel size, dropout rate, and batch size, are not fixed. Instead, they are optimized using Bayesian optimization. This approach systematically explores the hyperparameter space by modeling the objective function as a probabilistic Gaussian process and selecting configurations that balance exploration and exploitation. By applying Bayesian optimization, we obtained the optimal set of hyperparameters that minimized the validation loss and maximized classification accuracy, thereby ensuring both the efficiency and robustness of the proposed framework.

3.1. Performance Evaluation for the Proposed Wireless Communication Model

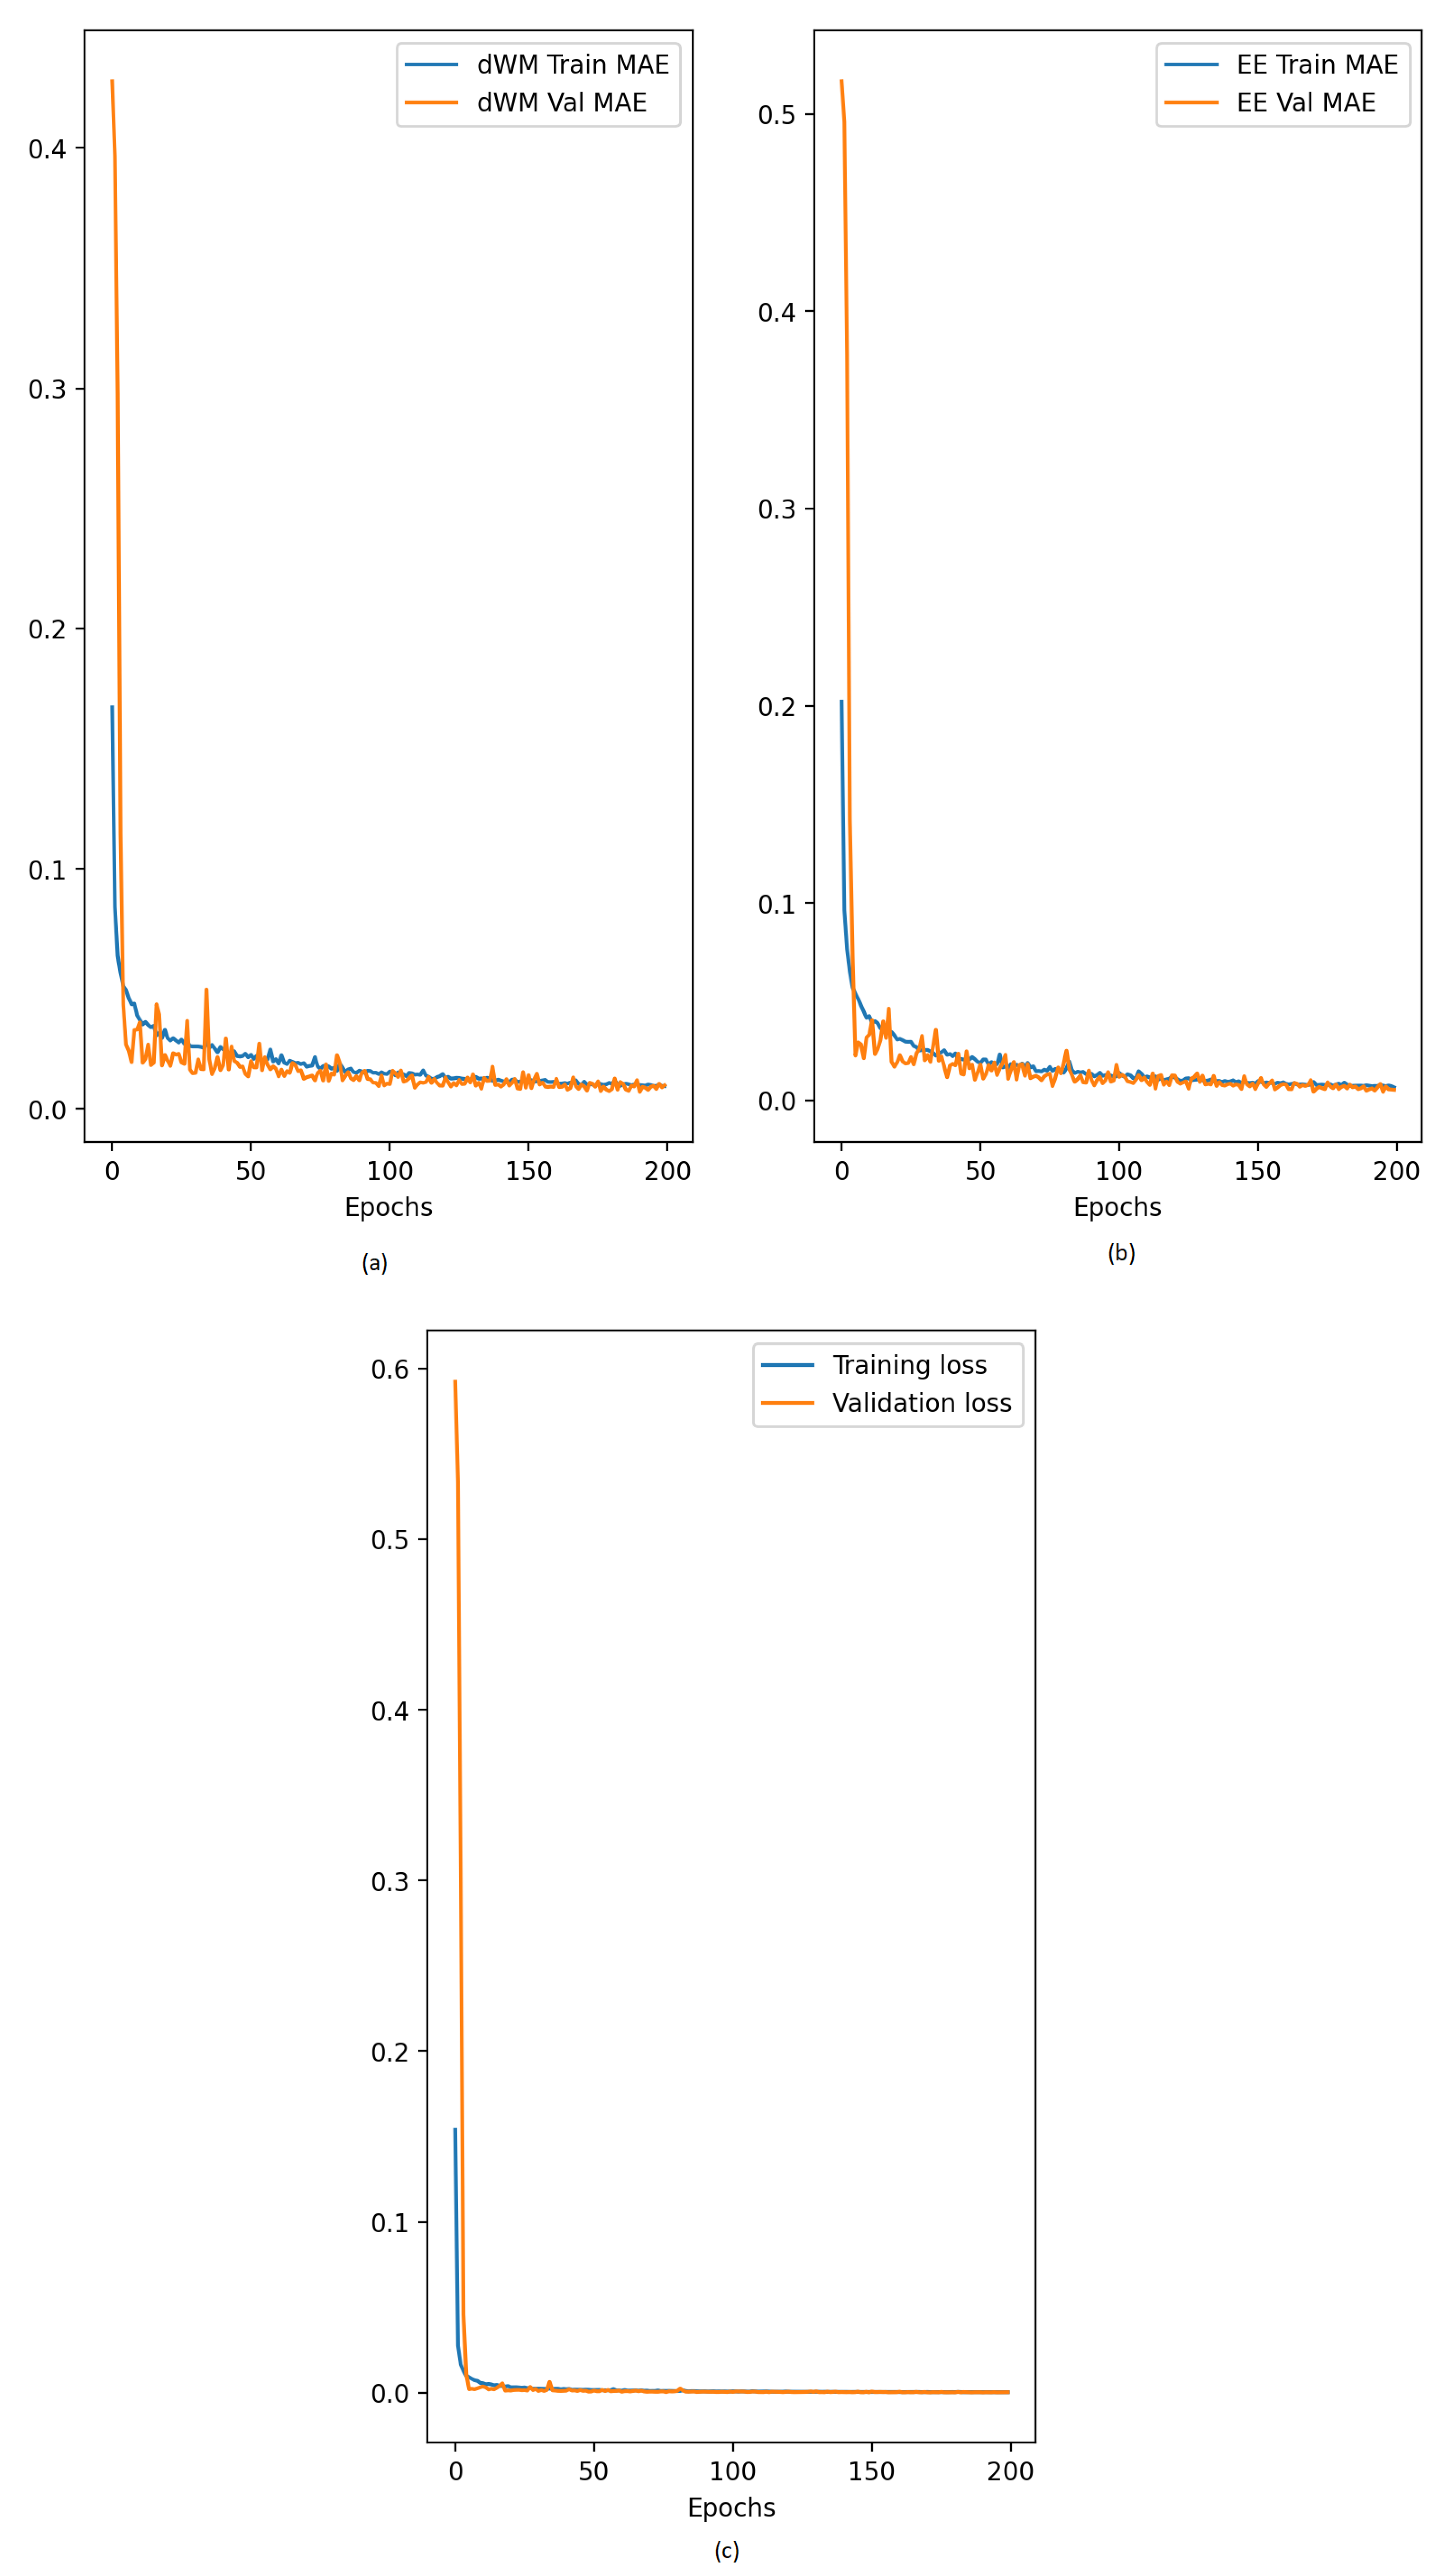
This subsection presents the performance evaluation of the proposed wireless communication model and its proposed deep learning model. Energy efficiency is evaluated under various environmental conditions such as maximum interference transmission power, path loss, interference transmission distance, and minimum required SINR. Figure 7 demonstrates the testing and validation of the proposed deep learning model mentioned in Section 2.1.2. The dataset has been splited into a 20% test set and an 80% training set. Figure 7a,b depict the training and validation Mean Absolute Errors for d WM and EE, respectively. The validation and training curves presented in Figure 7a experience a sharp decrease in the first few episodes before stabilizing when reaching approximately the 100th epoch. No overfitting occurs, as the two curves stay close together. Figure 7 shows good convergence, where the validation MAE is slightly lower than the training MAE for the majority of epochs. Additionally, the batch-level variability causes a small spike in the validation curve, but this does not explain overfitting. Last but not least, the small difference between validation and training loss in Figure 7c indicates that the Bayesian optimization implemented has successfully assigned the best required hyperparameters for this dataset to enhance the deep learning system performance; also, it shows that the model is learning well and has low bias, low variance, and is well trained.
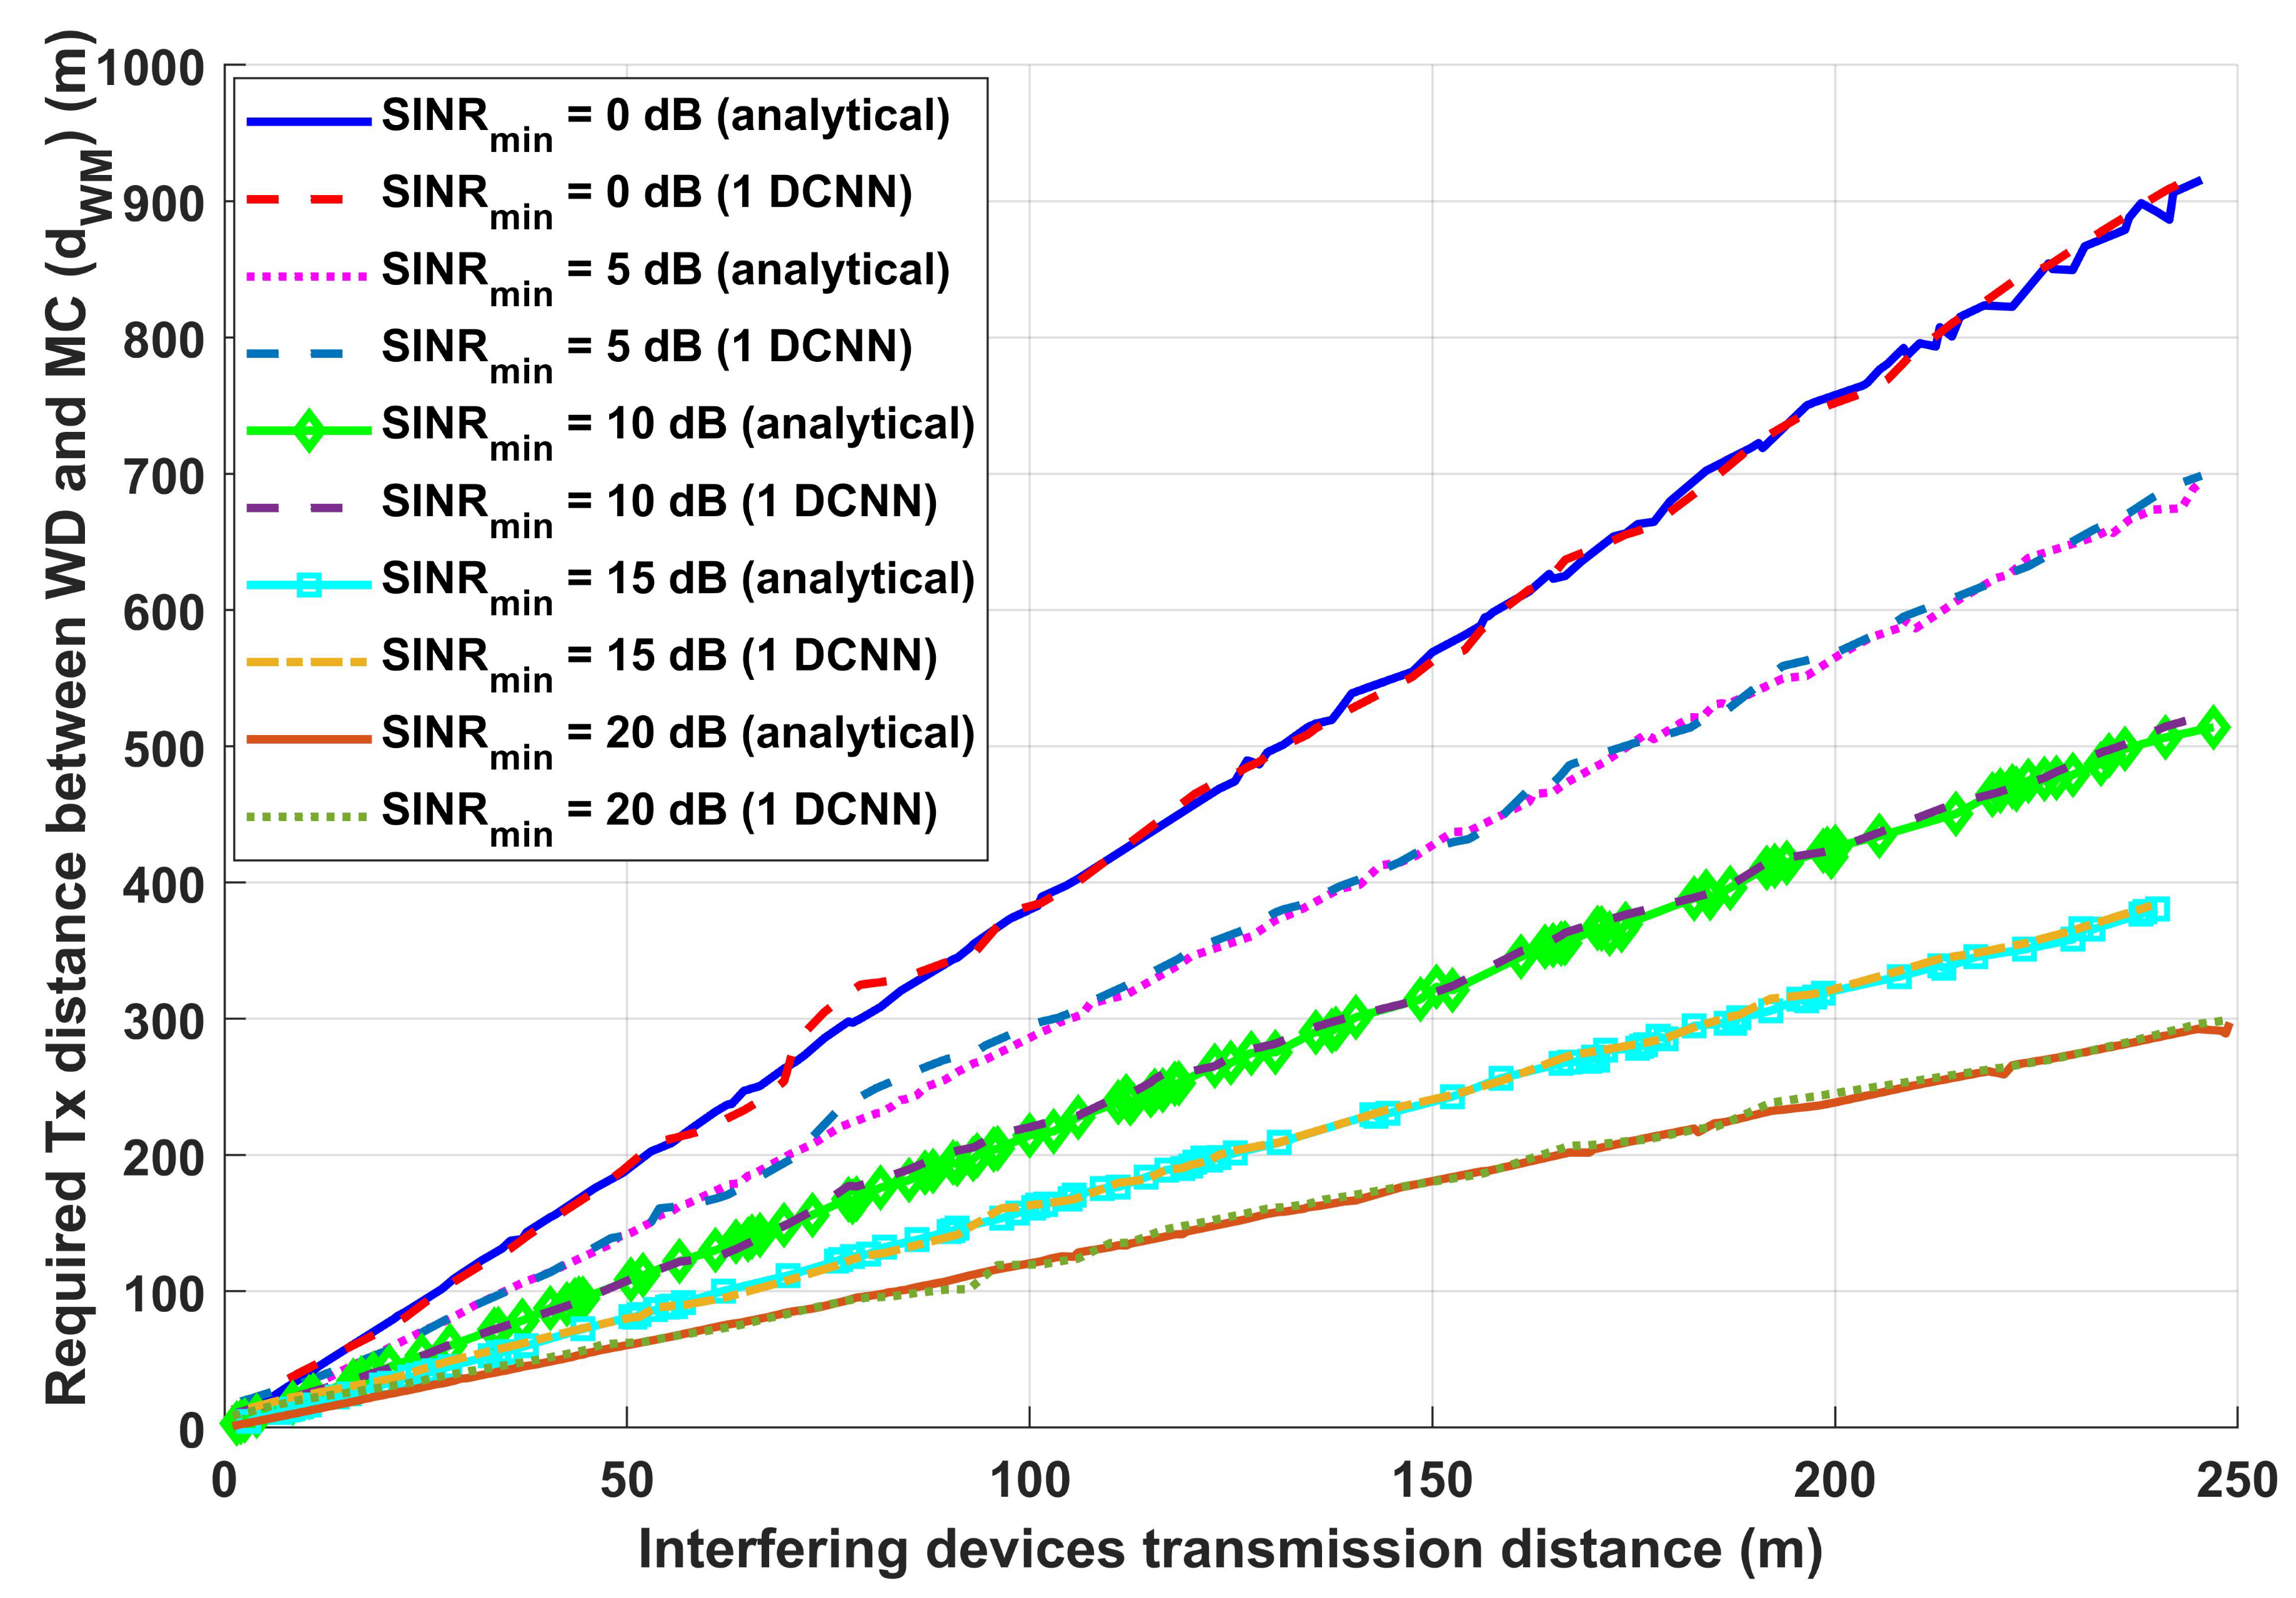
Figure 8 depicts the relation between interference transmission distance and required wearable devices (WDs) to medical center (MC) transmission power with different required signal-to-interference-plus-noise ratios ( SINR min ) and with wearable device transmission power ( P W ) equals to 23 dBm. It can be observed from Figure 8 that increasing the distance between interfering devices allows the WDs to send the data over a longer distance. This is because increasing the interference transmission distance leads to a decrease in the effect of the interference on the received message, resulting in more accurate received data. Additionally, it can also be mentioned that increasing the required system ( SINR min ) leads to decreasing the required transmission distance between the WD and MC to reach the required system performance. Furthermore, it has been noticed that the results obtained from the analytical proposed model are identical to the ones obtained from the optimized 1D-CNN. This reflects how the proposed optimized 1D-CNN is accurate and can be used to predict the optimum required transmission distance between the WD and MC.
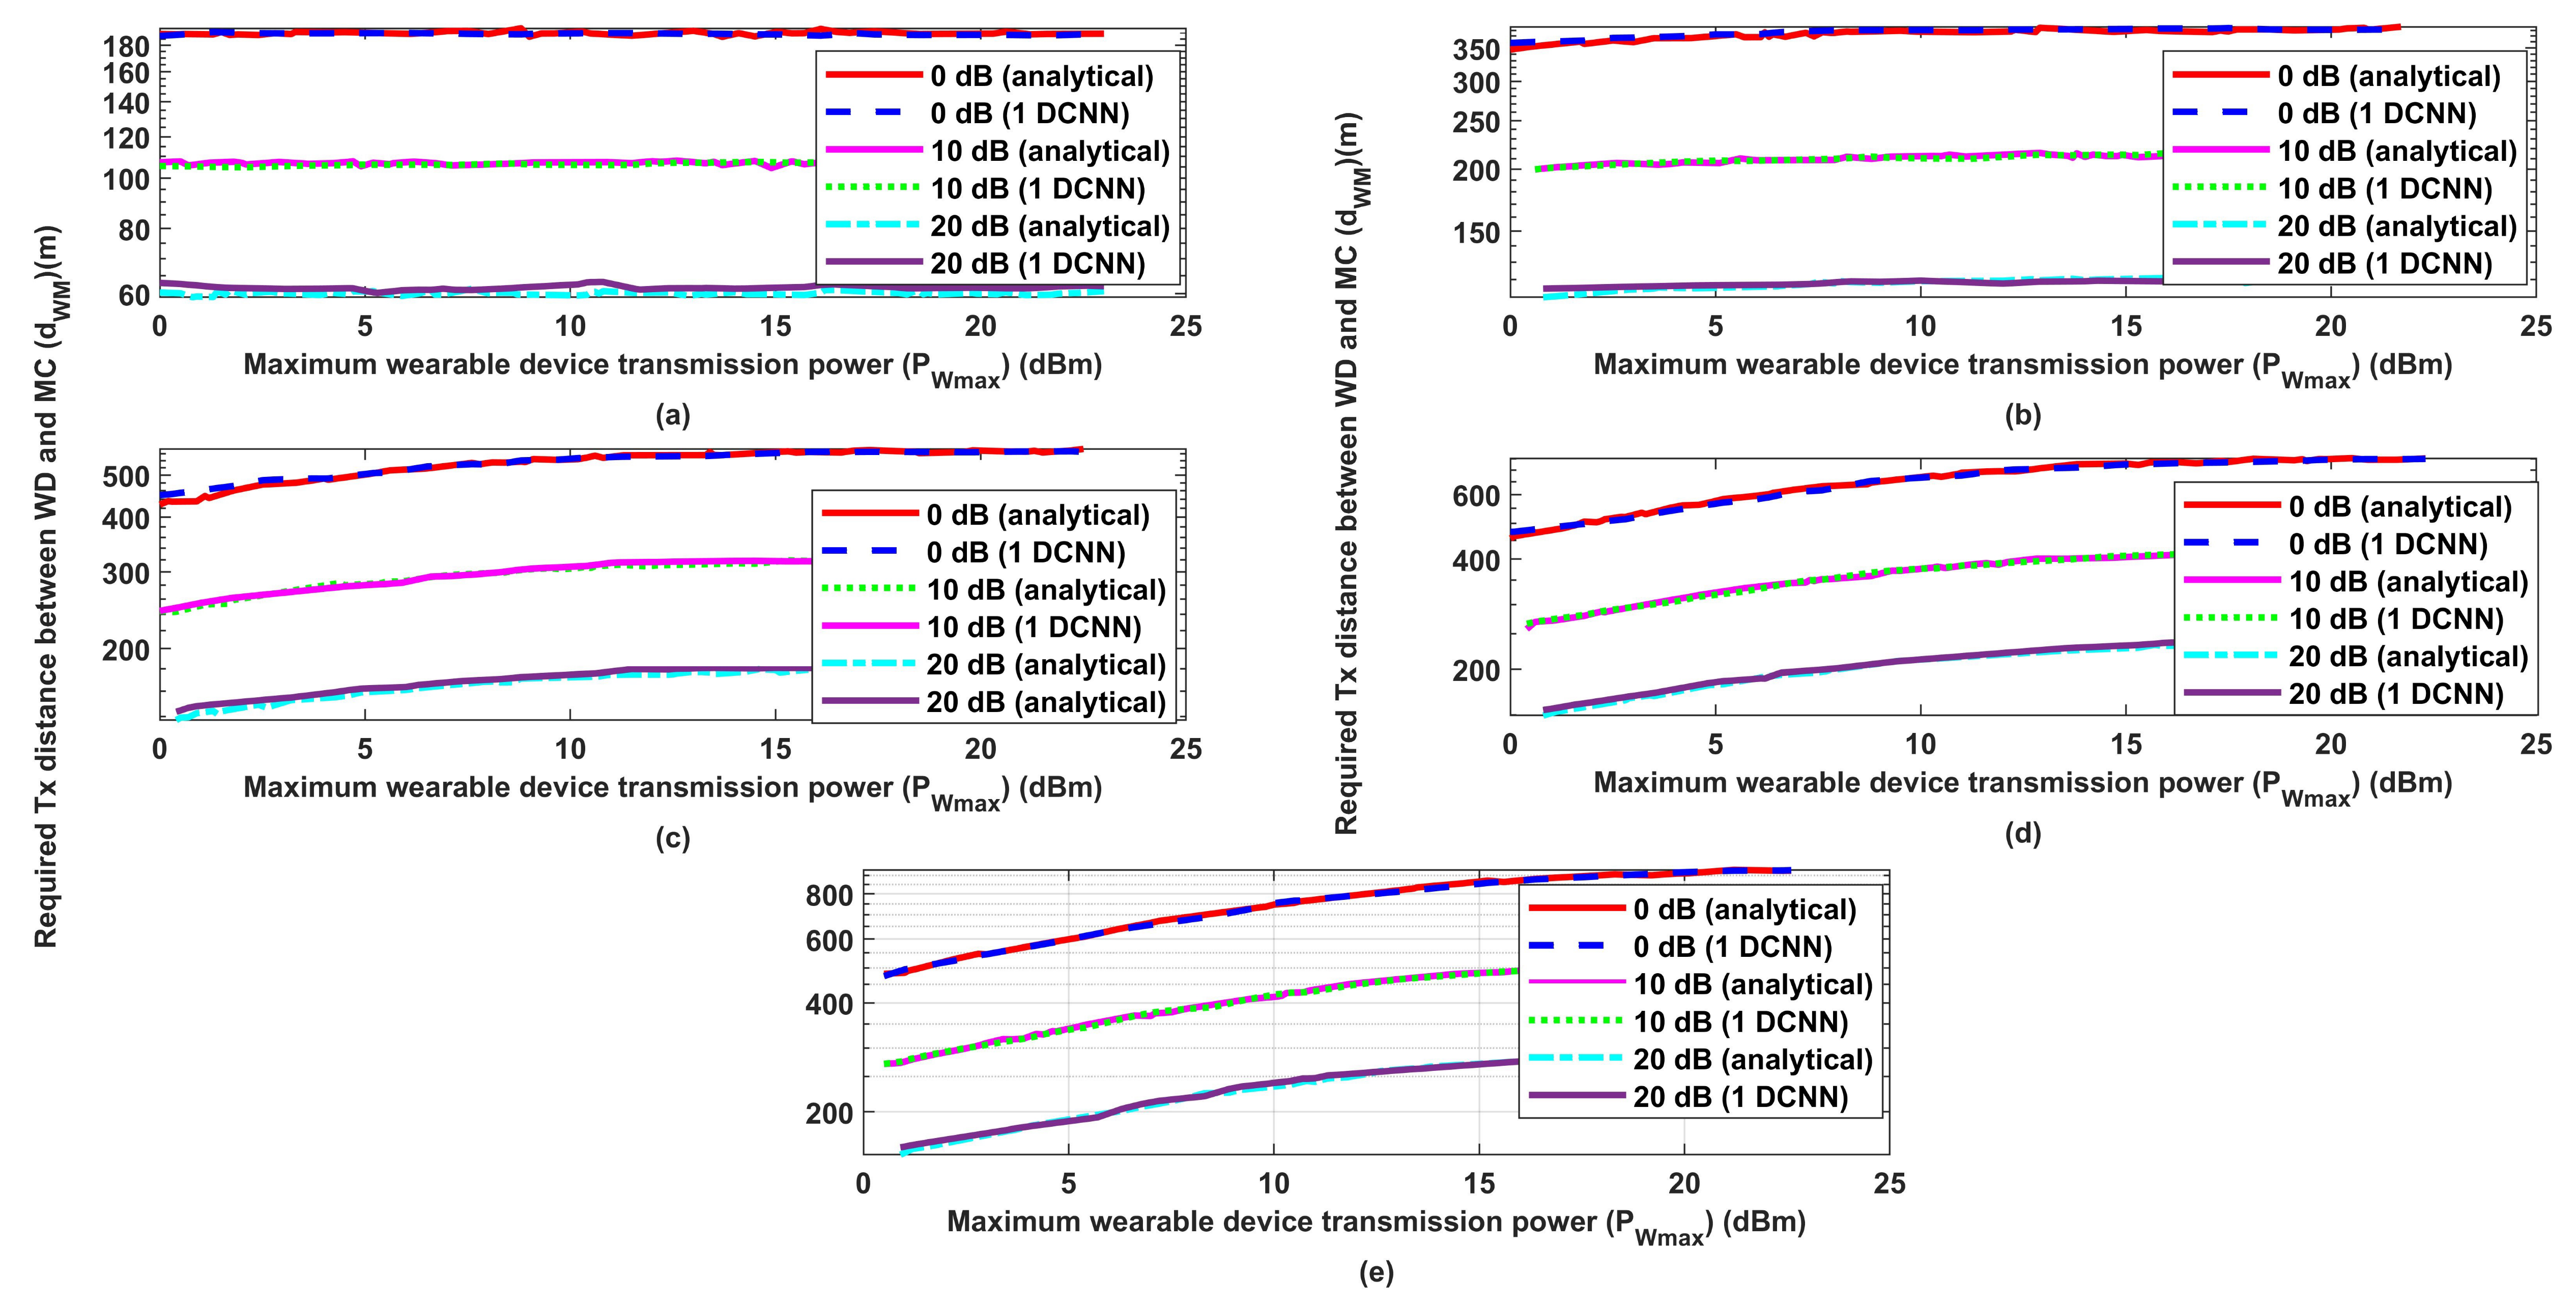
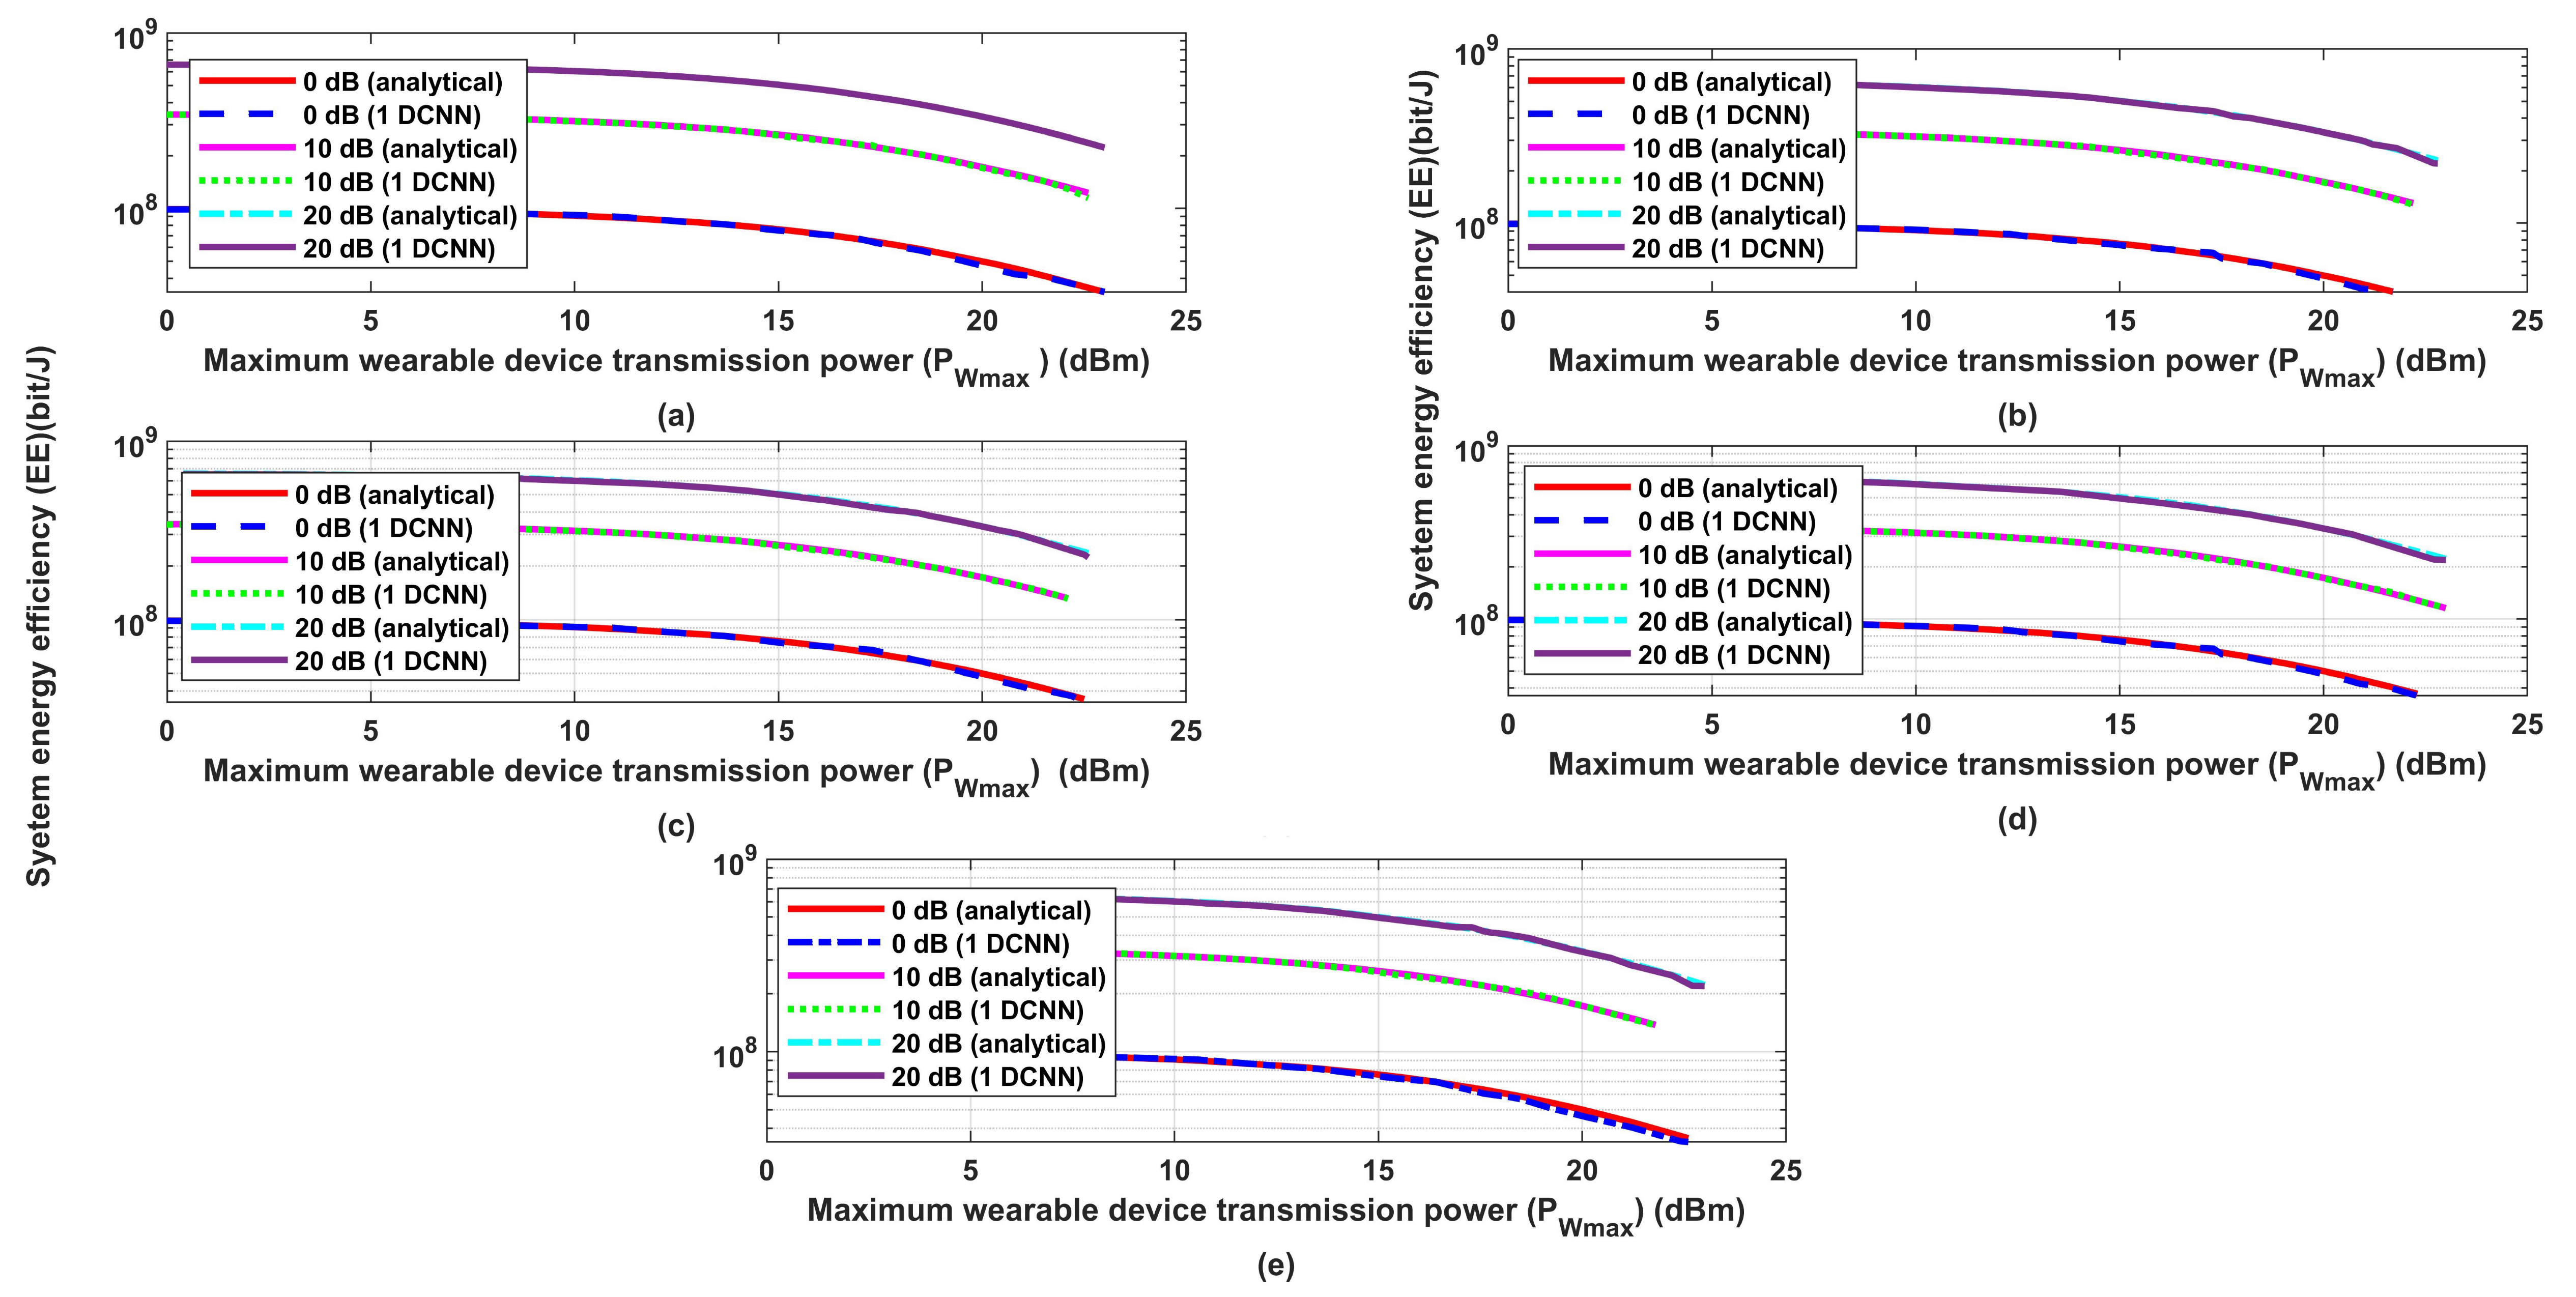
For more evaluation of the proposed model, the model has been evaluated for five different interference transmission distances between the WD and MC, which are 50, 100, 150, 200, and 250 m, as shown in Figure 9 against different maximum wearable device transmission power ( P Wmax ). Each distance has been evaluated with three different SINR min , which are 0, 10, and 20 dB. Figure 9a represents the interference transmission distance of 50 m, and it can be observed from this figure that, as mentioned earlier, decreasing the SINR min leads to a longer transmission distance. When the SINR min equals 20 dB, the transmission distance between the WD and MC should not be less than 60 m; otherwise, the signal will be received with low quality. Furthermore, the same performance is obtained for the four other interference transmission distances, 100, 150, 200, and 250 m, as represented in Figure 9b–e, respectively. Additionally, it can be mentioned that increasing the P Wmax increases the required transmission distance between the WD and MC, as increasing the transmission power leads to overcoming the effect of the interference that occurs during data transmission. Also, the similarity between the results obtained from the analytical model and the proposed optimized 1D-CNN model has to be mentioned.
The previous scenario is assigned again to evaluate the proposed model but this time in terms of system energy efficiency (EE), as shown in Figure 10. Figure 10a–e represent the performance evaluation of the proposed model when the interference transmission is 50, 100, 150, 200, and 250, respectively. It has been noticed from this figure that decreasing the SINR min decreases the EE; this is due to the fact that decreasing the SINR min decreases the achievable data rate, and this is the main reason for the decrement of the EE. Also, it has been found that increasing the P Wmax decreases the EE, as the EE is the ratio between the achievable data rate and transmission power, which means that decreasing the achievable data rate with an increase in transmission power should cause a decrease in EE. Additionally, both the analytical and the deep learning models seem identical, which proves the effectiveness of the proposed deep learning approach.
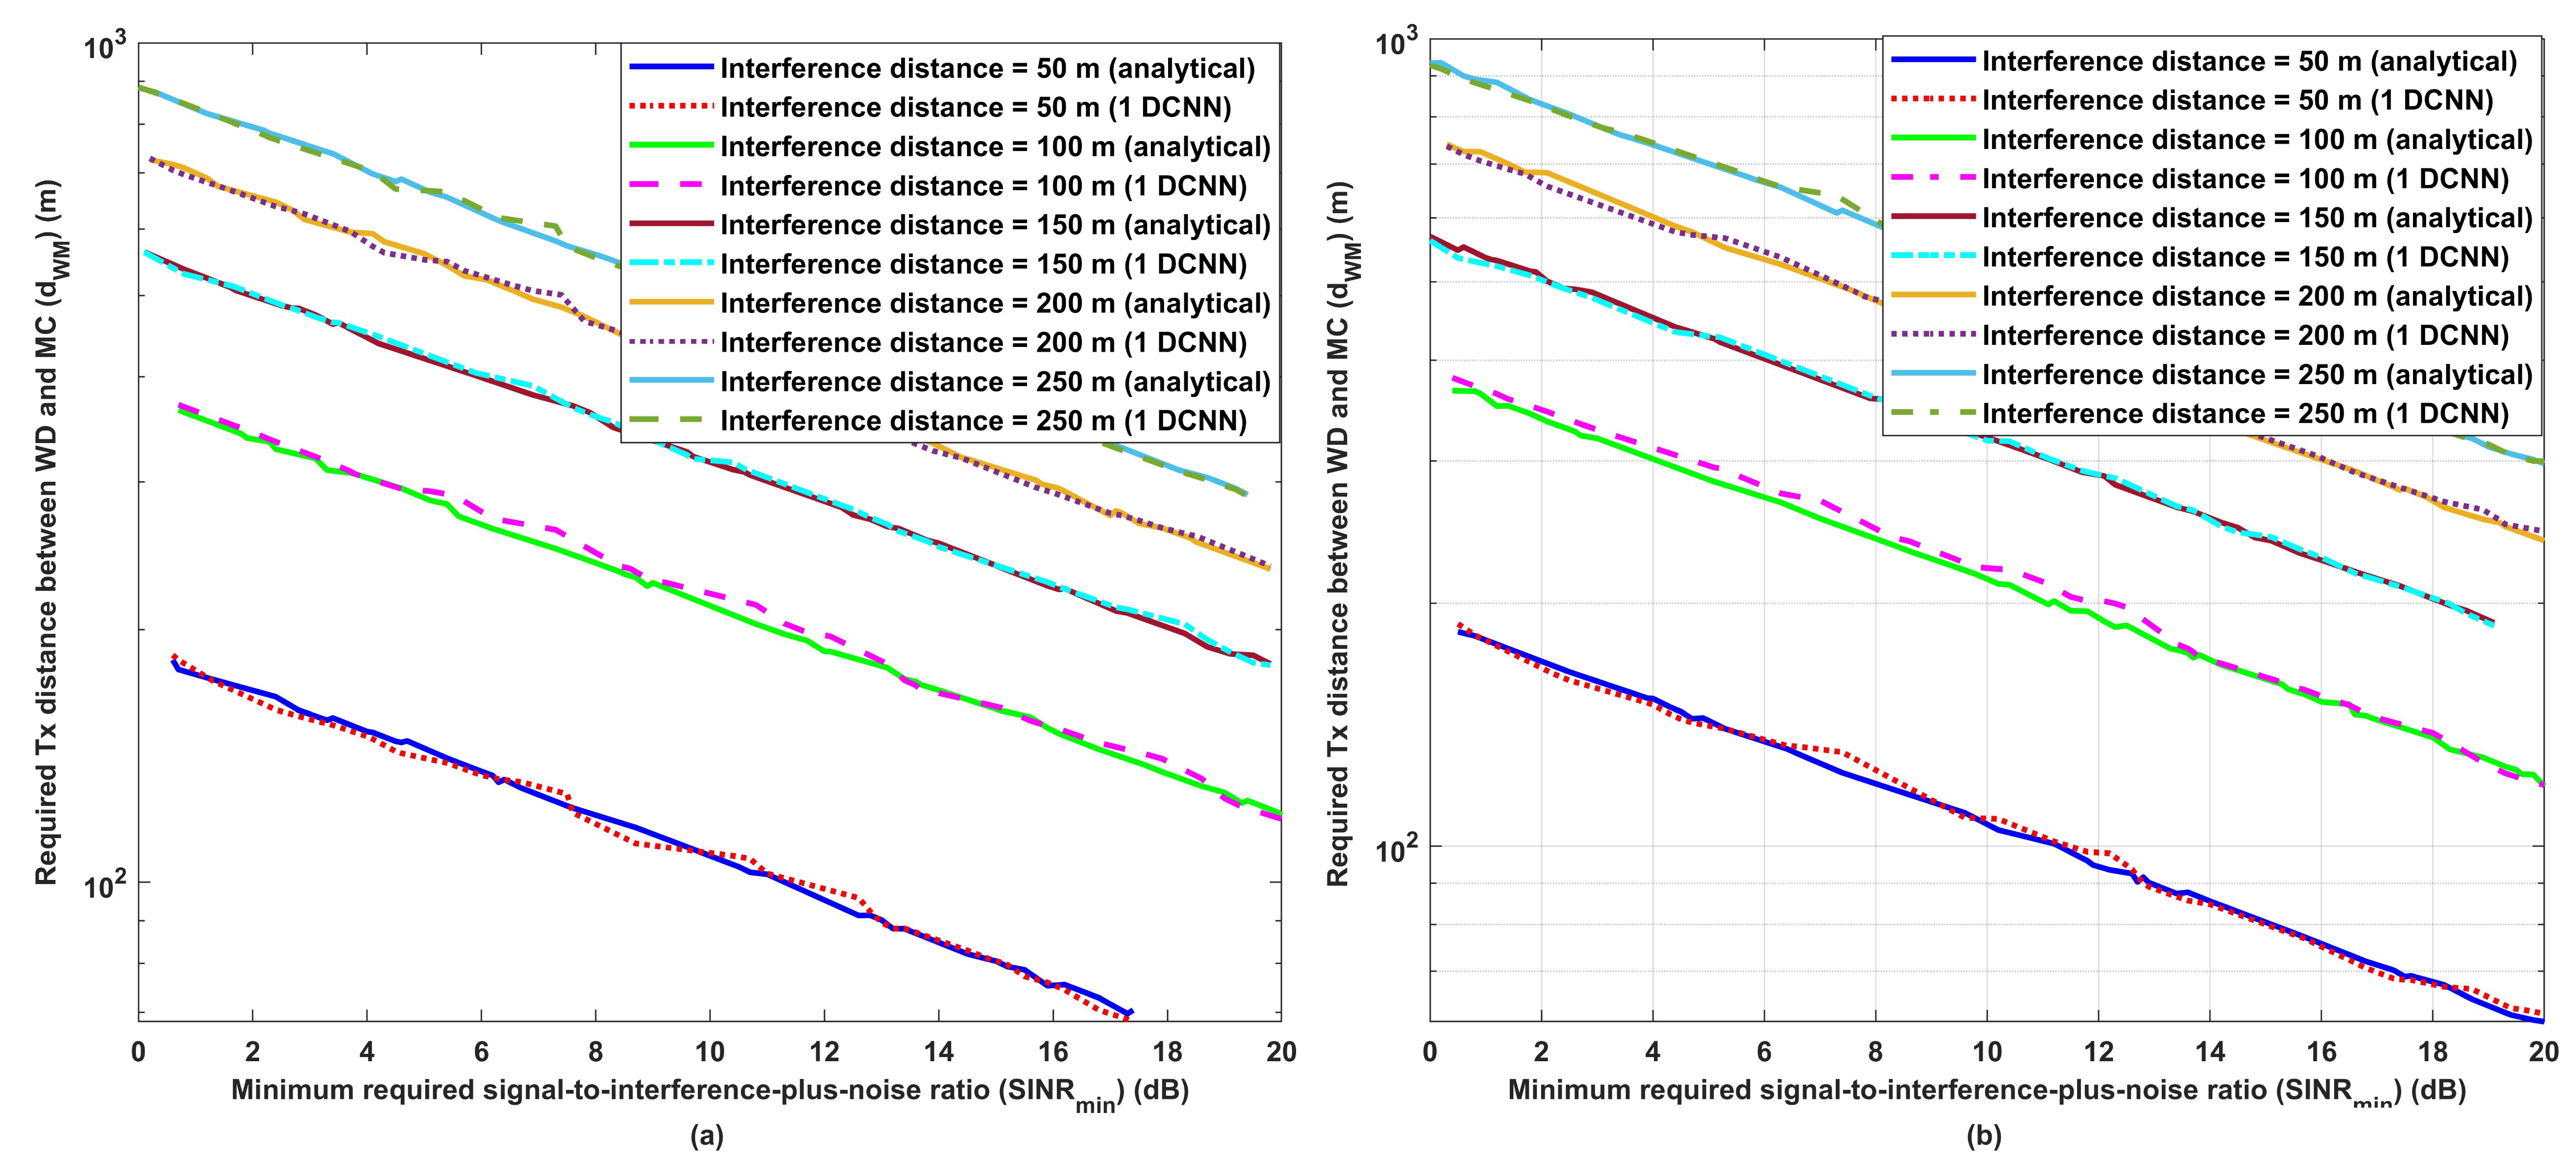
Figure 11 shows the effect of the change of the required signal-to-interference-plus-noise-ratio ( SINR min ) on the required transmission distance between the WD and MC. We assume two wearable device transmission powers, P W 17 dBm and 23 dBm, as shown in Figure 11a,b for the five assumed interference transmission powers. Figure 11 depicts that both the analytical and deep learning models have the same performance, which increases the SINR min , leading to a decrease in the required transmission distance between the WD and MC. Additionally, it has been noticed that for both models, increasing interference transmission distances increases the required transmission distance between the WD and MC. These obtained results prove the effectiveness of the results obtained previously.
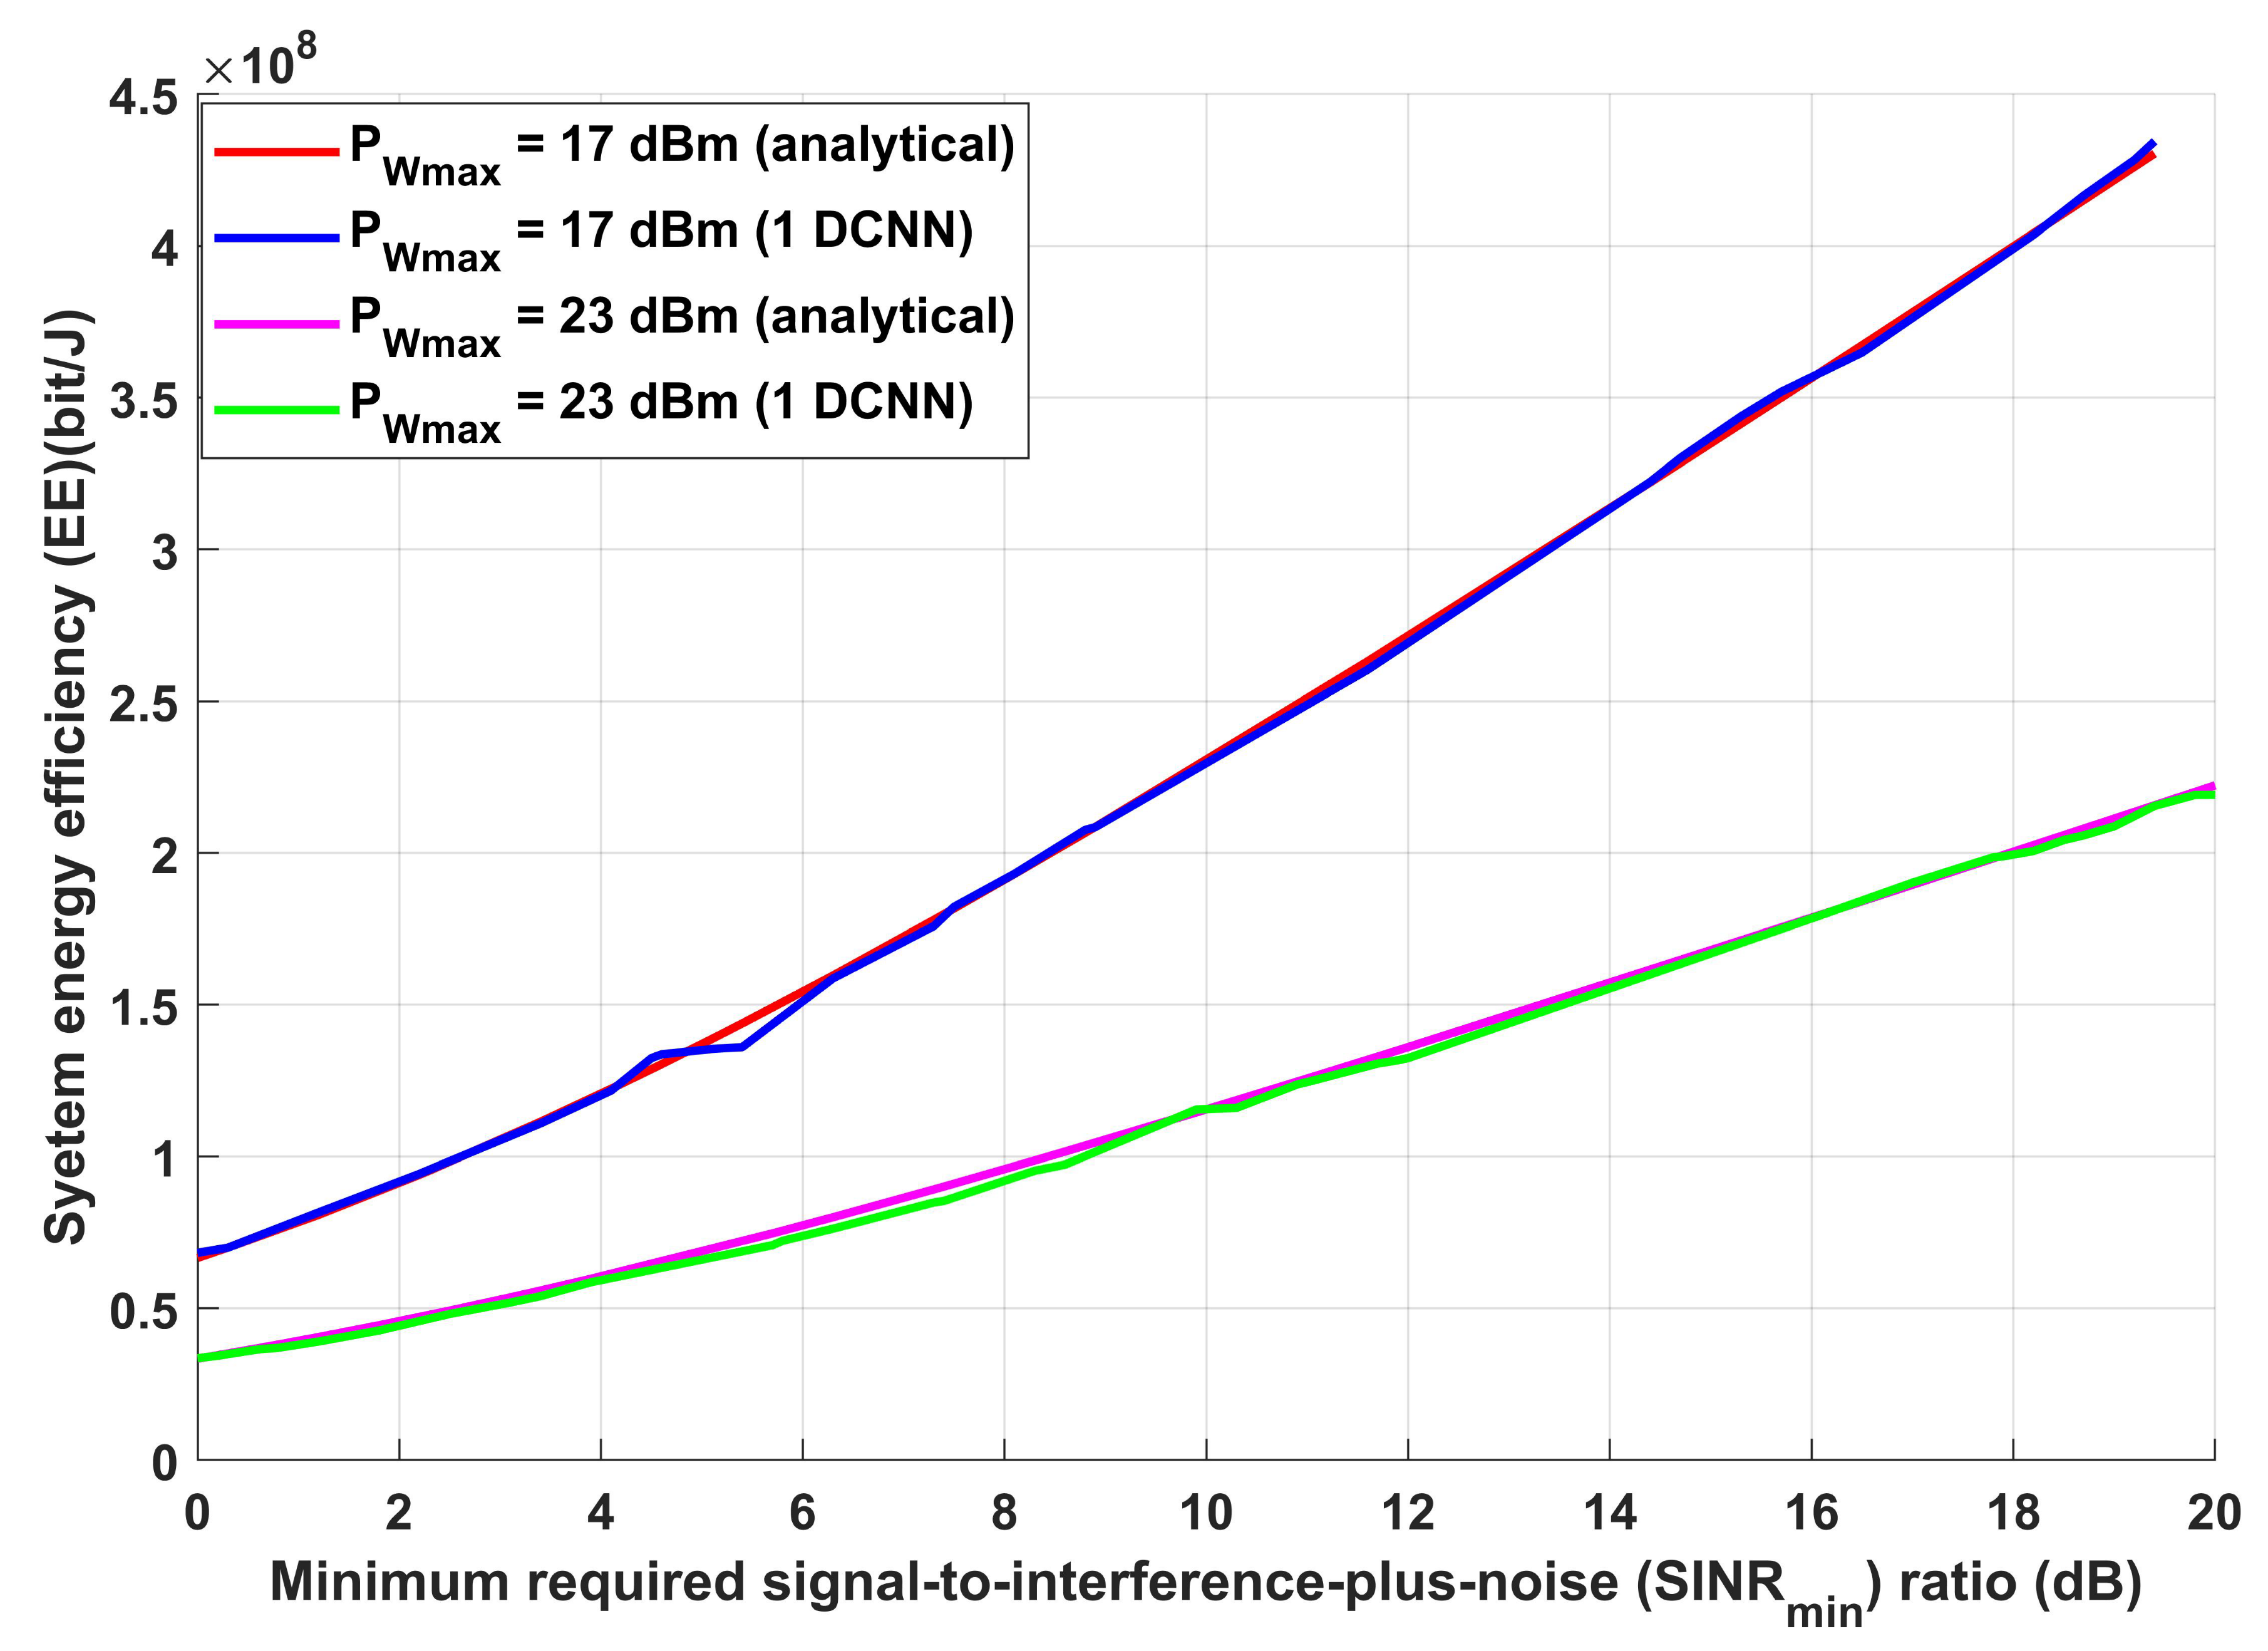
Moreover, the proposed model has been evaluated once again in terms of EE against the minimum required signal-to-interference-plus-noise-ratio ( SINR min ) for two wearable device transmission powers (17 dBm and 23 dBm), as shown in Figure 12. Figure 12 depicts that increasing the transmission power causes a decrease in the EE values for both analytical and deep learning models. It is also mentioned that increasing the SINR min causes an increase in the EE value. This is due to the fact that increasing the SINR min leads to an increase in the achievable data rate, which increases the EE. Additionally, it has been noticed that both analytical and deep learning models have the same results, and this reflects the accuracy of the proposed optimized 1D-CNN.
To show the effectiveness of the proposed optimized 1D-CNN, a comparison with benchmarks has been made and presented in Table 3. The comparison was with four different deep learning models, which are GRU, LSTM, a 1D-CNN, and the proposed optimized 1D-CNN in terms of four metrics (MSE, RMSE, MAE, and R 2 ). Table 3 shows the performance of the proposed model in predicting d WC and EE. It has been noticed that the proposed optimized 1D-CNN model outperforms the other benchmarks, as the proposed 1D-CNN reduces the MAE by 99% compared with the traditional 1D-CNN and surpasses GRU and LSTM. Additionally, the proposed model shows its effectiveness and robustness as it achieved R 2 with 0.9995, which indicates a perfect fit. It is worth mentioning also that due to finding the optimum required system hyperparameters, this helps reduce the computation time and reach the best prediction results.

3.2. Performance Evaluation for the Proposed Diabetes Prediction Risk

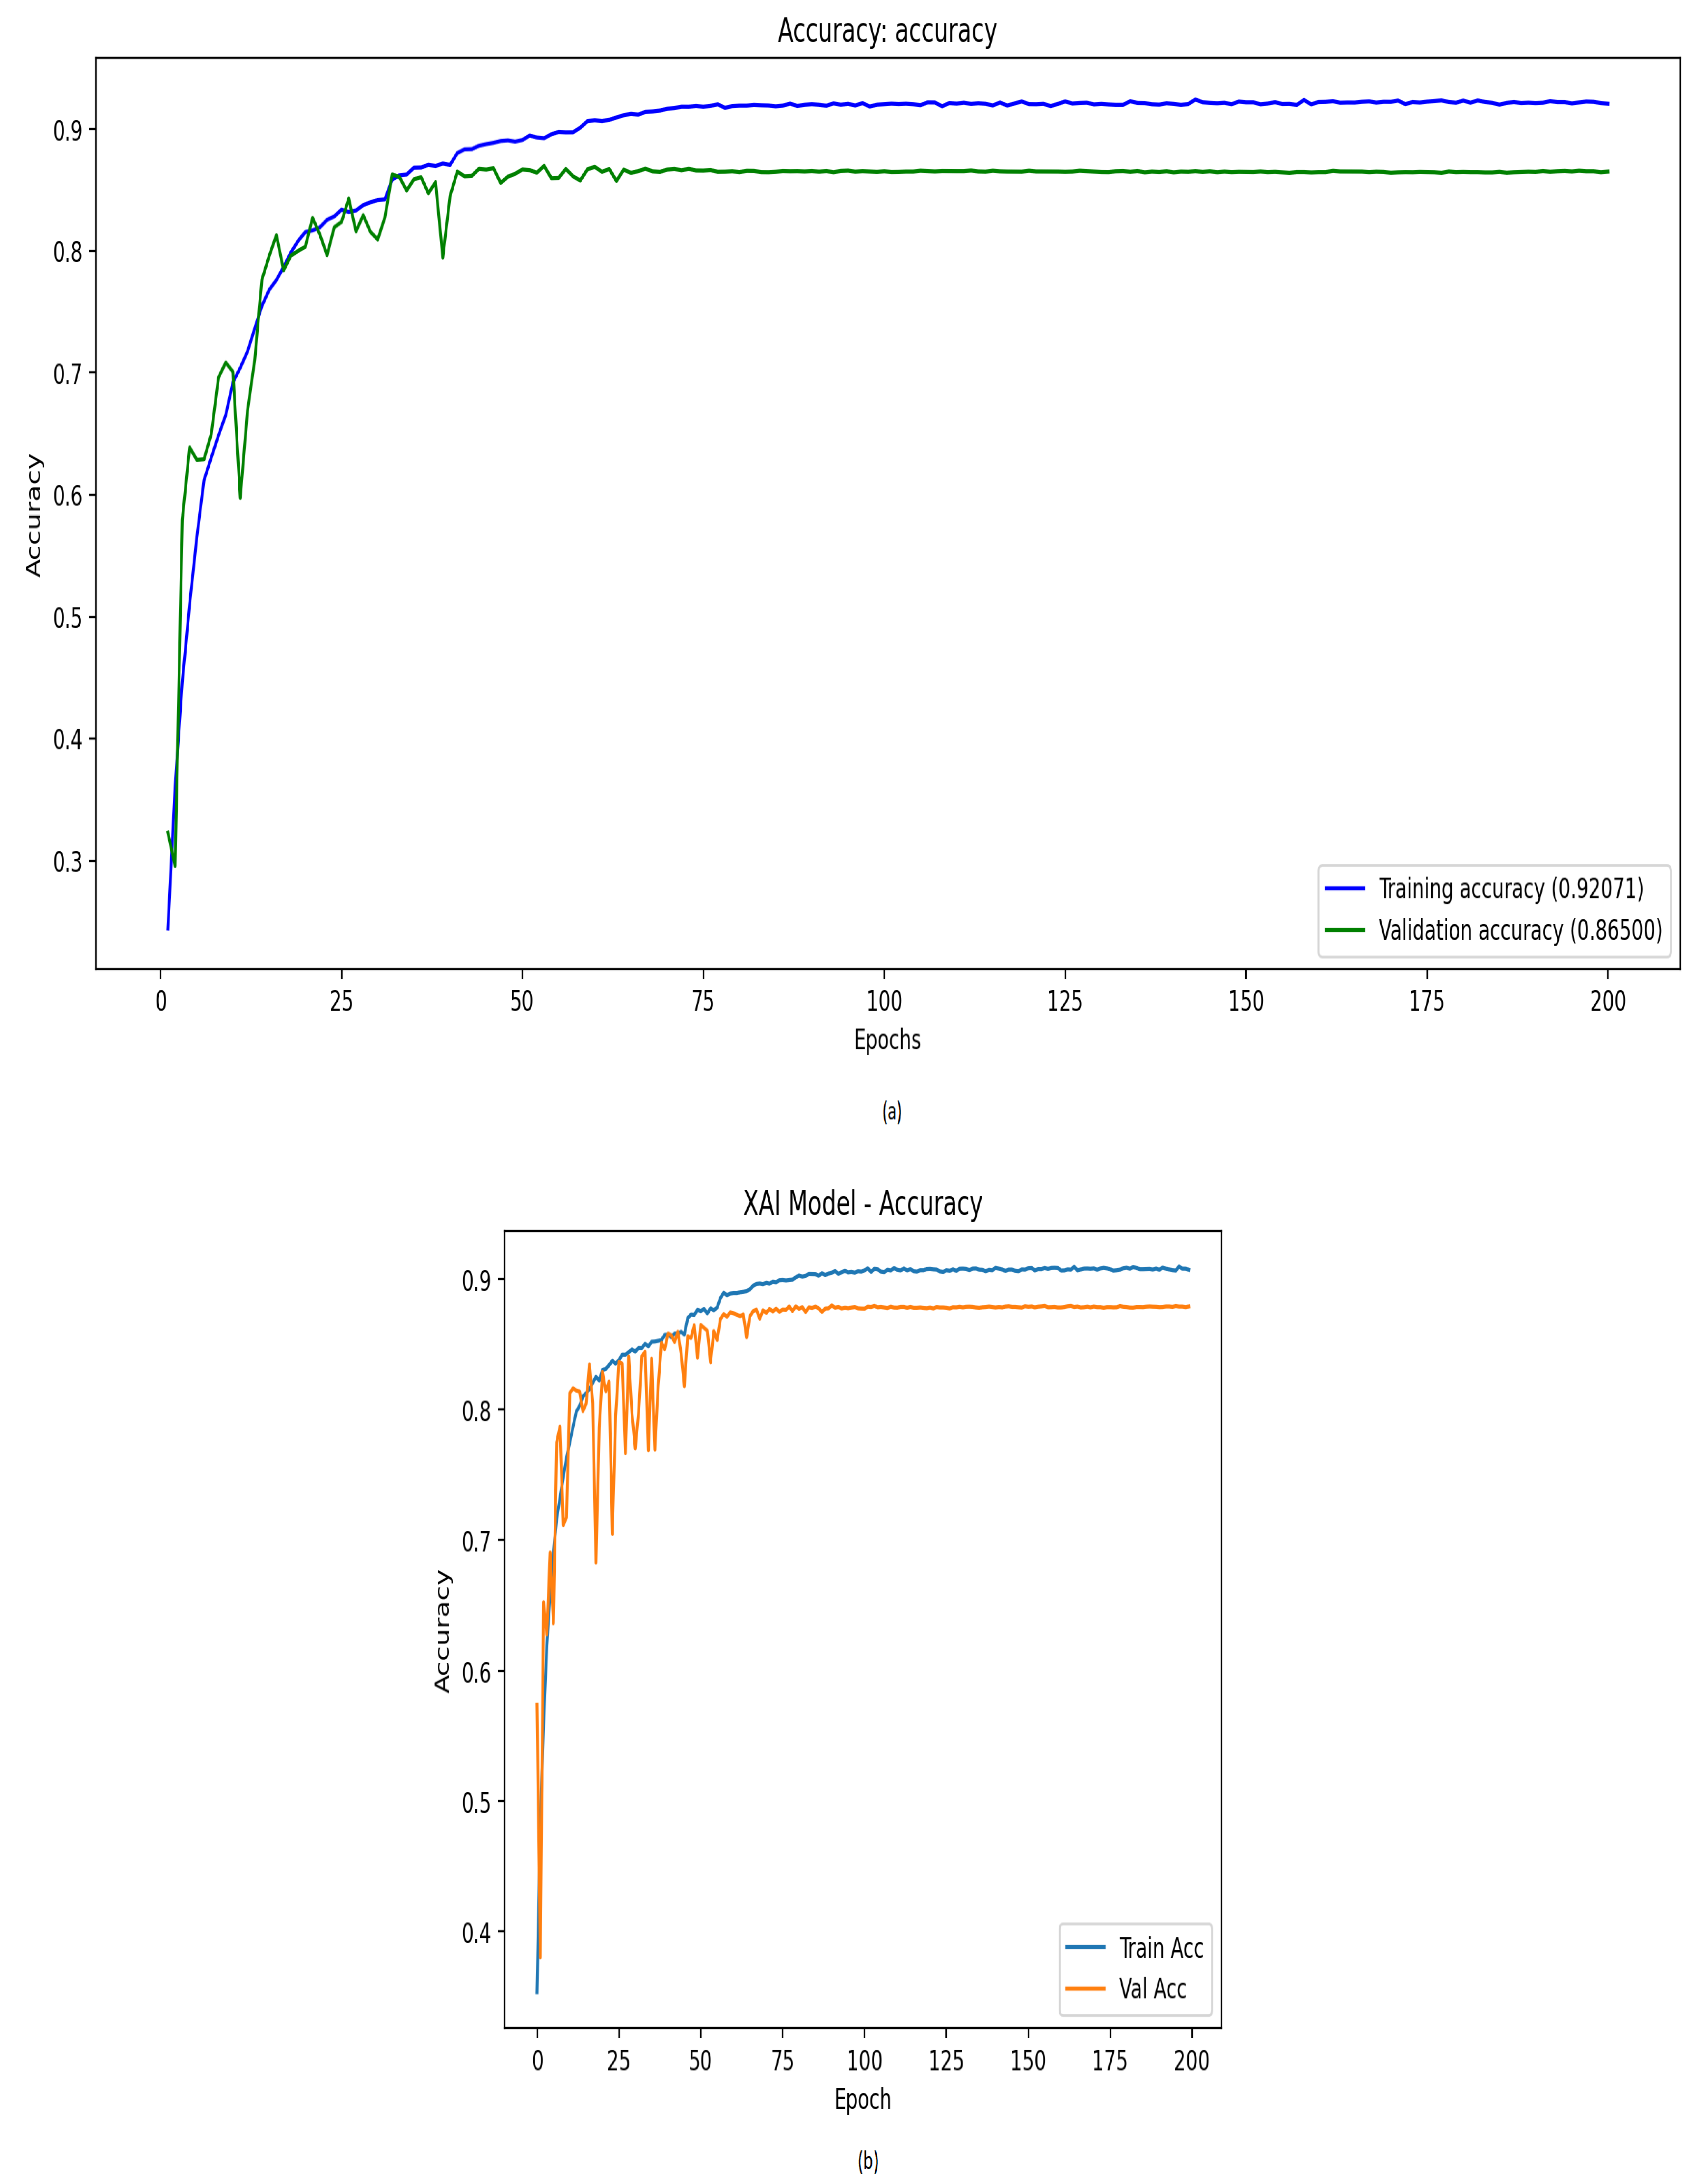
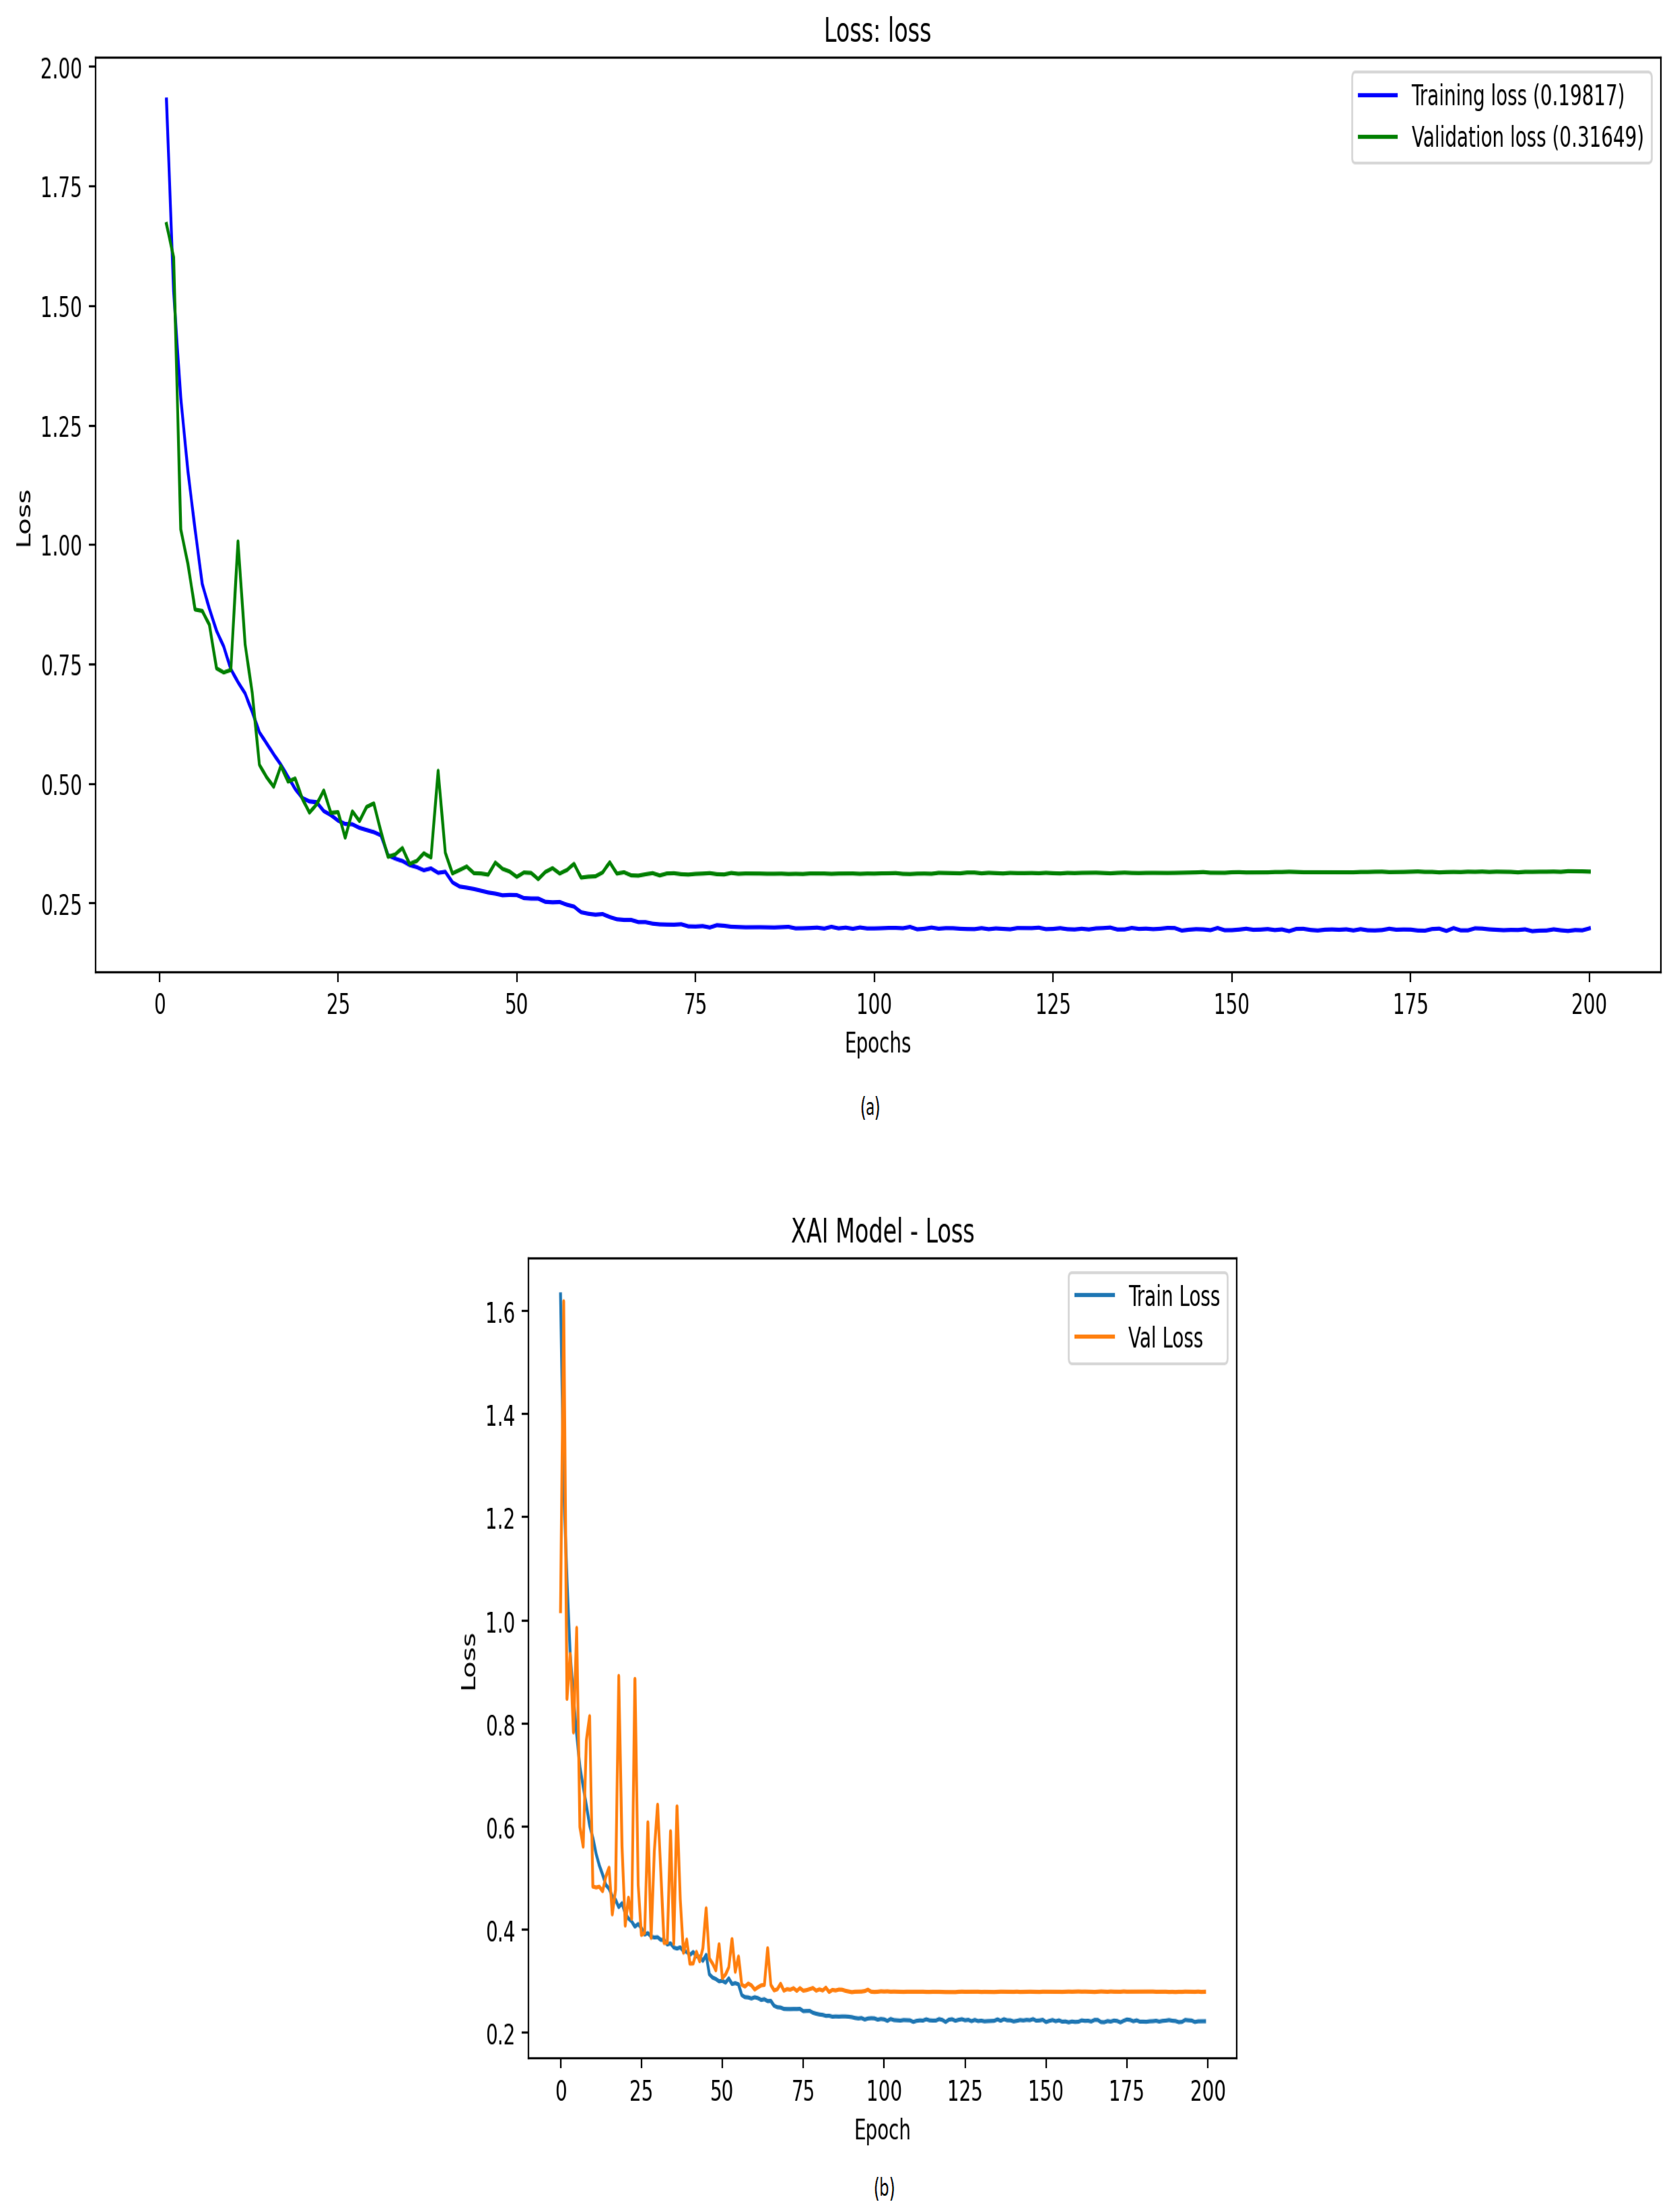
The findings of the experiments carried out to assess the effectiveness of the proposed optimized 1D Convolutional Neural Network (CNN) model using XAI with SHAP and LIME for diabetes risk prediction are presented in this subsection. To evaluate the performance of the proposed model, different numbers of assessment metrics have been implemented, such as accuracy, precision, recall, F1-score, ROC-AUC, and Matthews Correlation Coefficient. Figure 13 and Figure 14 show the accuracy and loss of the training and validation of the proposed optimized 1D-CNN before and after using XAI. Accuracy is shown in Figure 13, and it can be found that the accuracy when using XAI slightly improves the proposed system accuracy, as shown in Figure 13b compared with the system without implementing XAI, which is presented in Figure 13a. The same performance is obtained when comparing the training and validation of the loss curve before and after using XAI, as shown in Figure 14a,b. It can be found from Figure 14b that the optimized proposed 1D-CNN model using XAI has lower loss compared with the optimized 1D-CNN model without using XAI, as depicted in Figure 14a. These results prove that XAI can enhance system transparency through identifying which features are important to the model and which are irrelevant. As a result, the model can be more efficient and accurate during the prediction process, which increases the model’s precision.
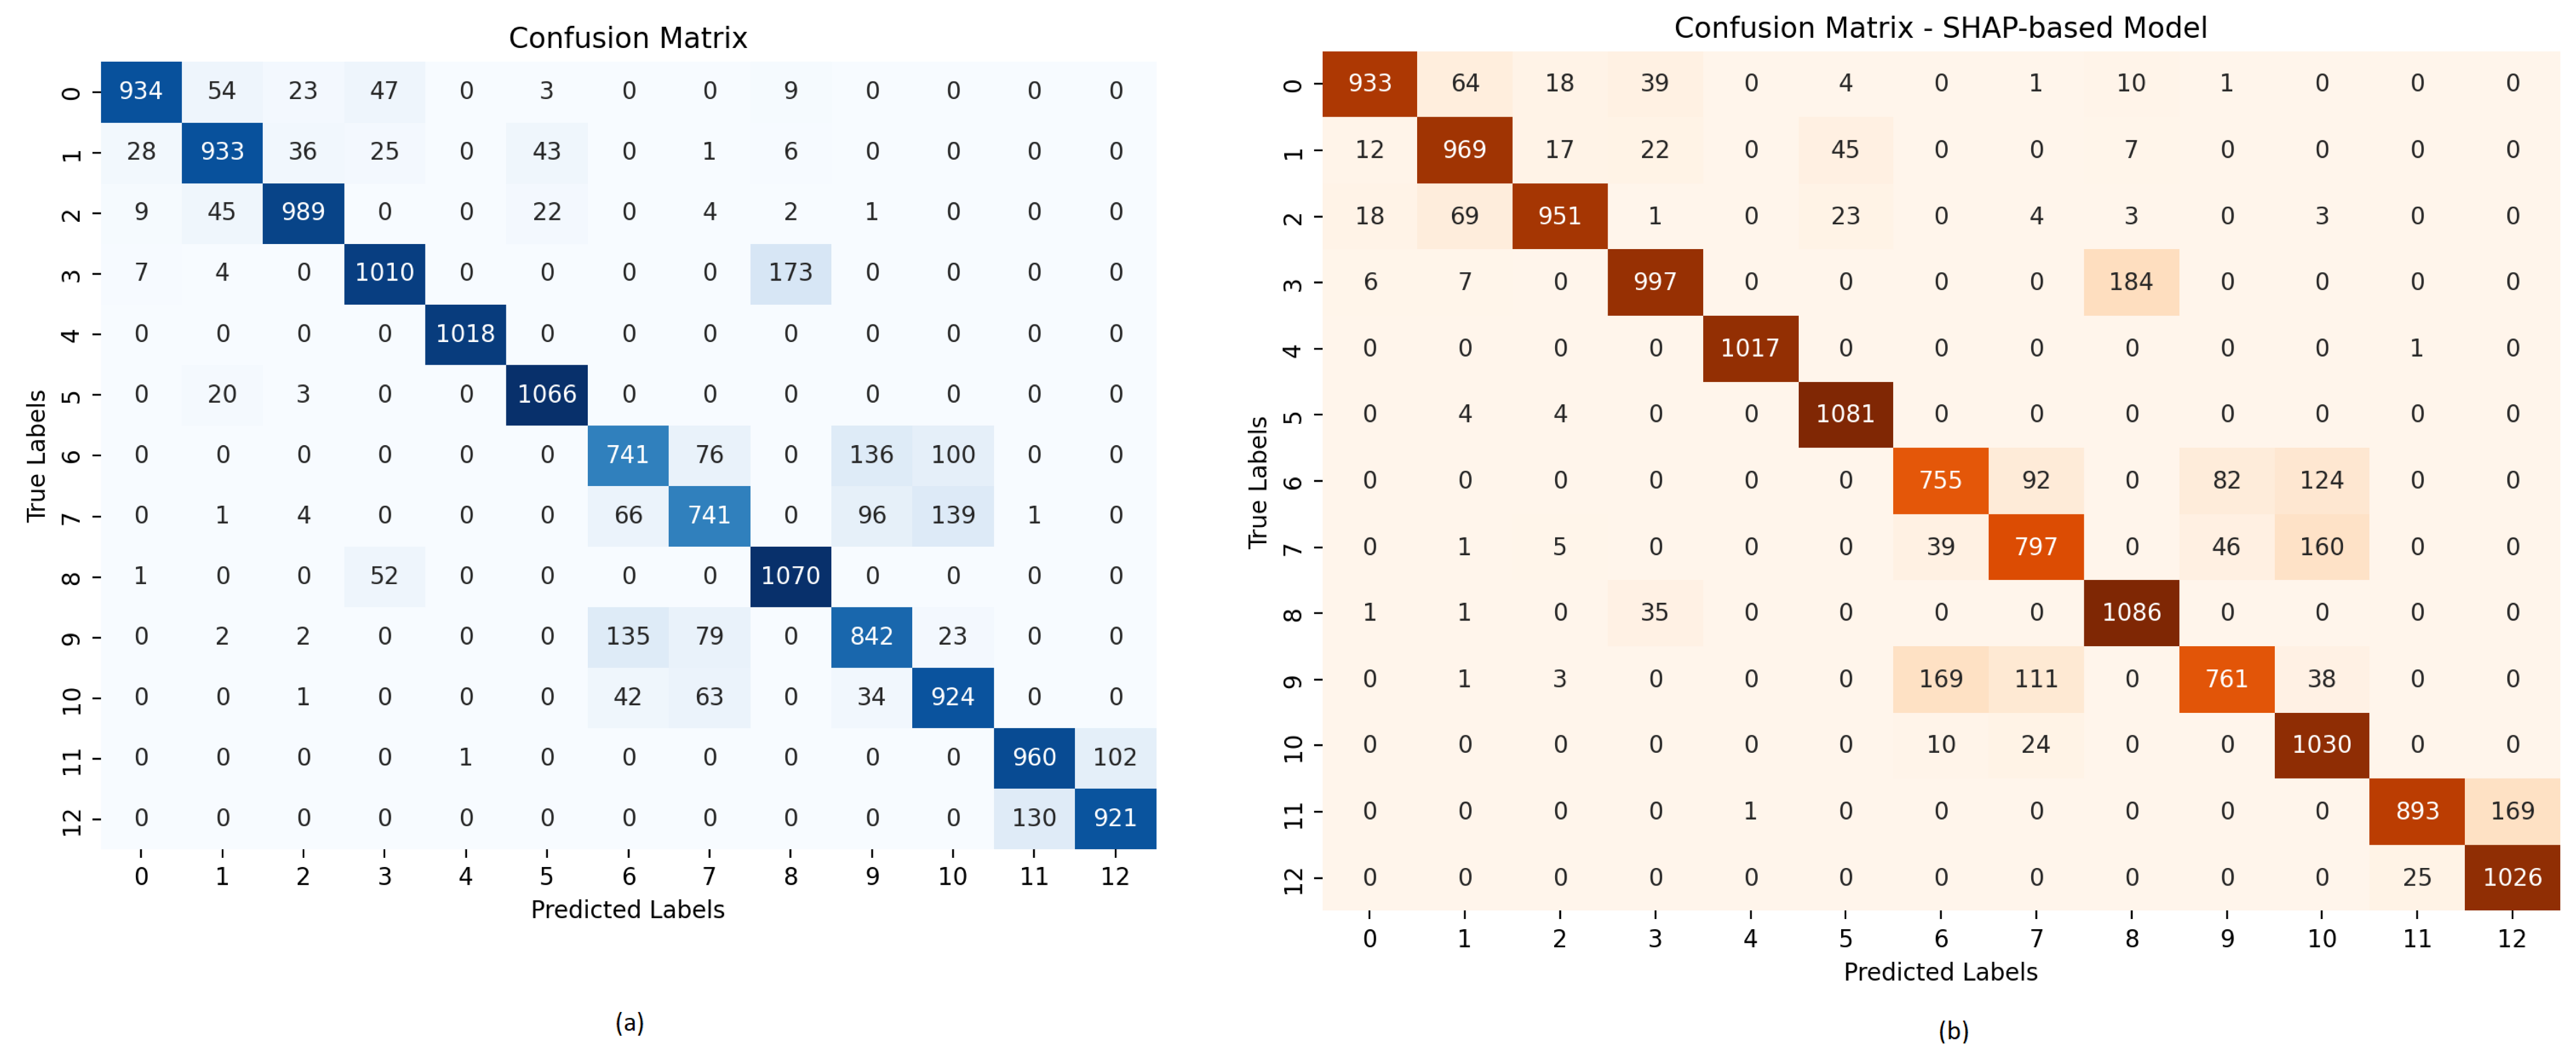
Figure 15 demonstrates the confusion matrix for the optimized 1D-CNN and the optimized 1D-CNN with XAI SHAP. Figure 15a,b represent the confusion matrix for the optimized 1D-CNN and the optimized 1D-CNN with XAI, respectively. As can be observed from Figure 15, when comparing Figure 15a,b, the model when using XAI has a better confusion matrix, as XAI SHAP helps illustrate which features are relevant per class. The irrelevant features will be down-weighted, so the wrong correlation will be avoided by the classifier. The improvement is not dramatic since they have the same architecture, but the decision boundaries will be cleaner, and the model will make fewer mistakes. Figure 15 shows that both models are accurate, but XAI SHAP may help the model be more accurate by defining which features are more important for the output target.
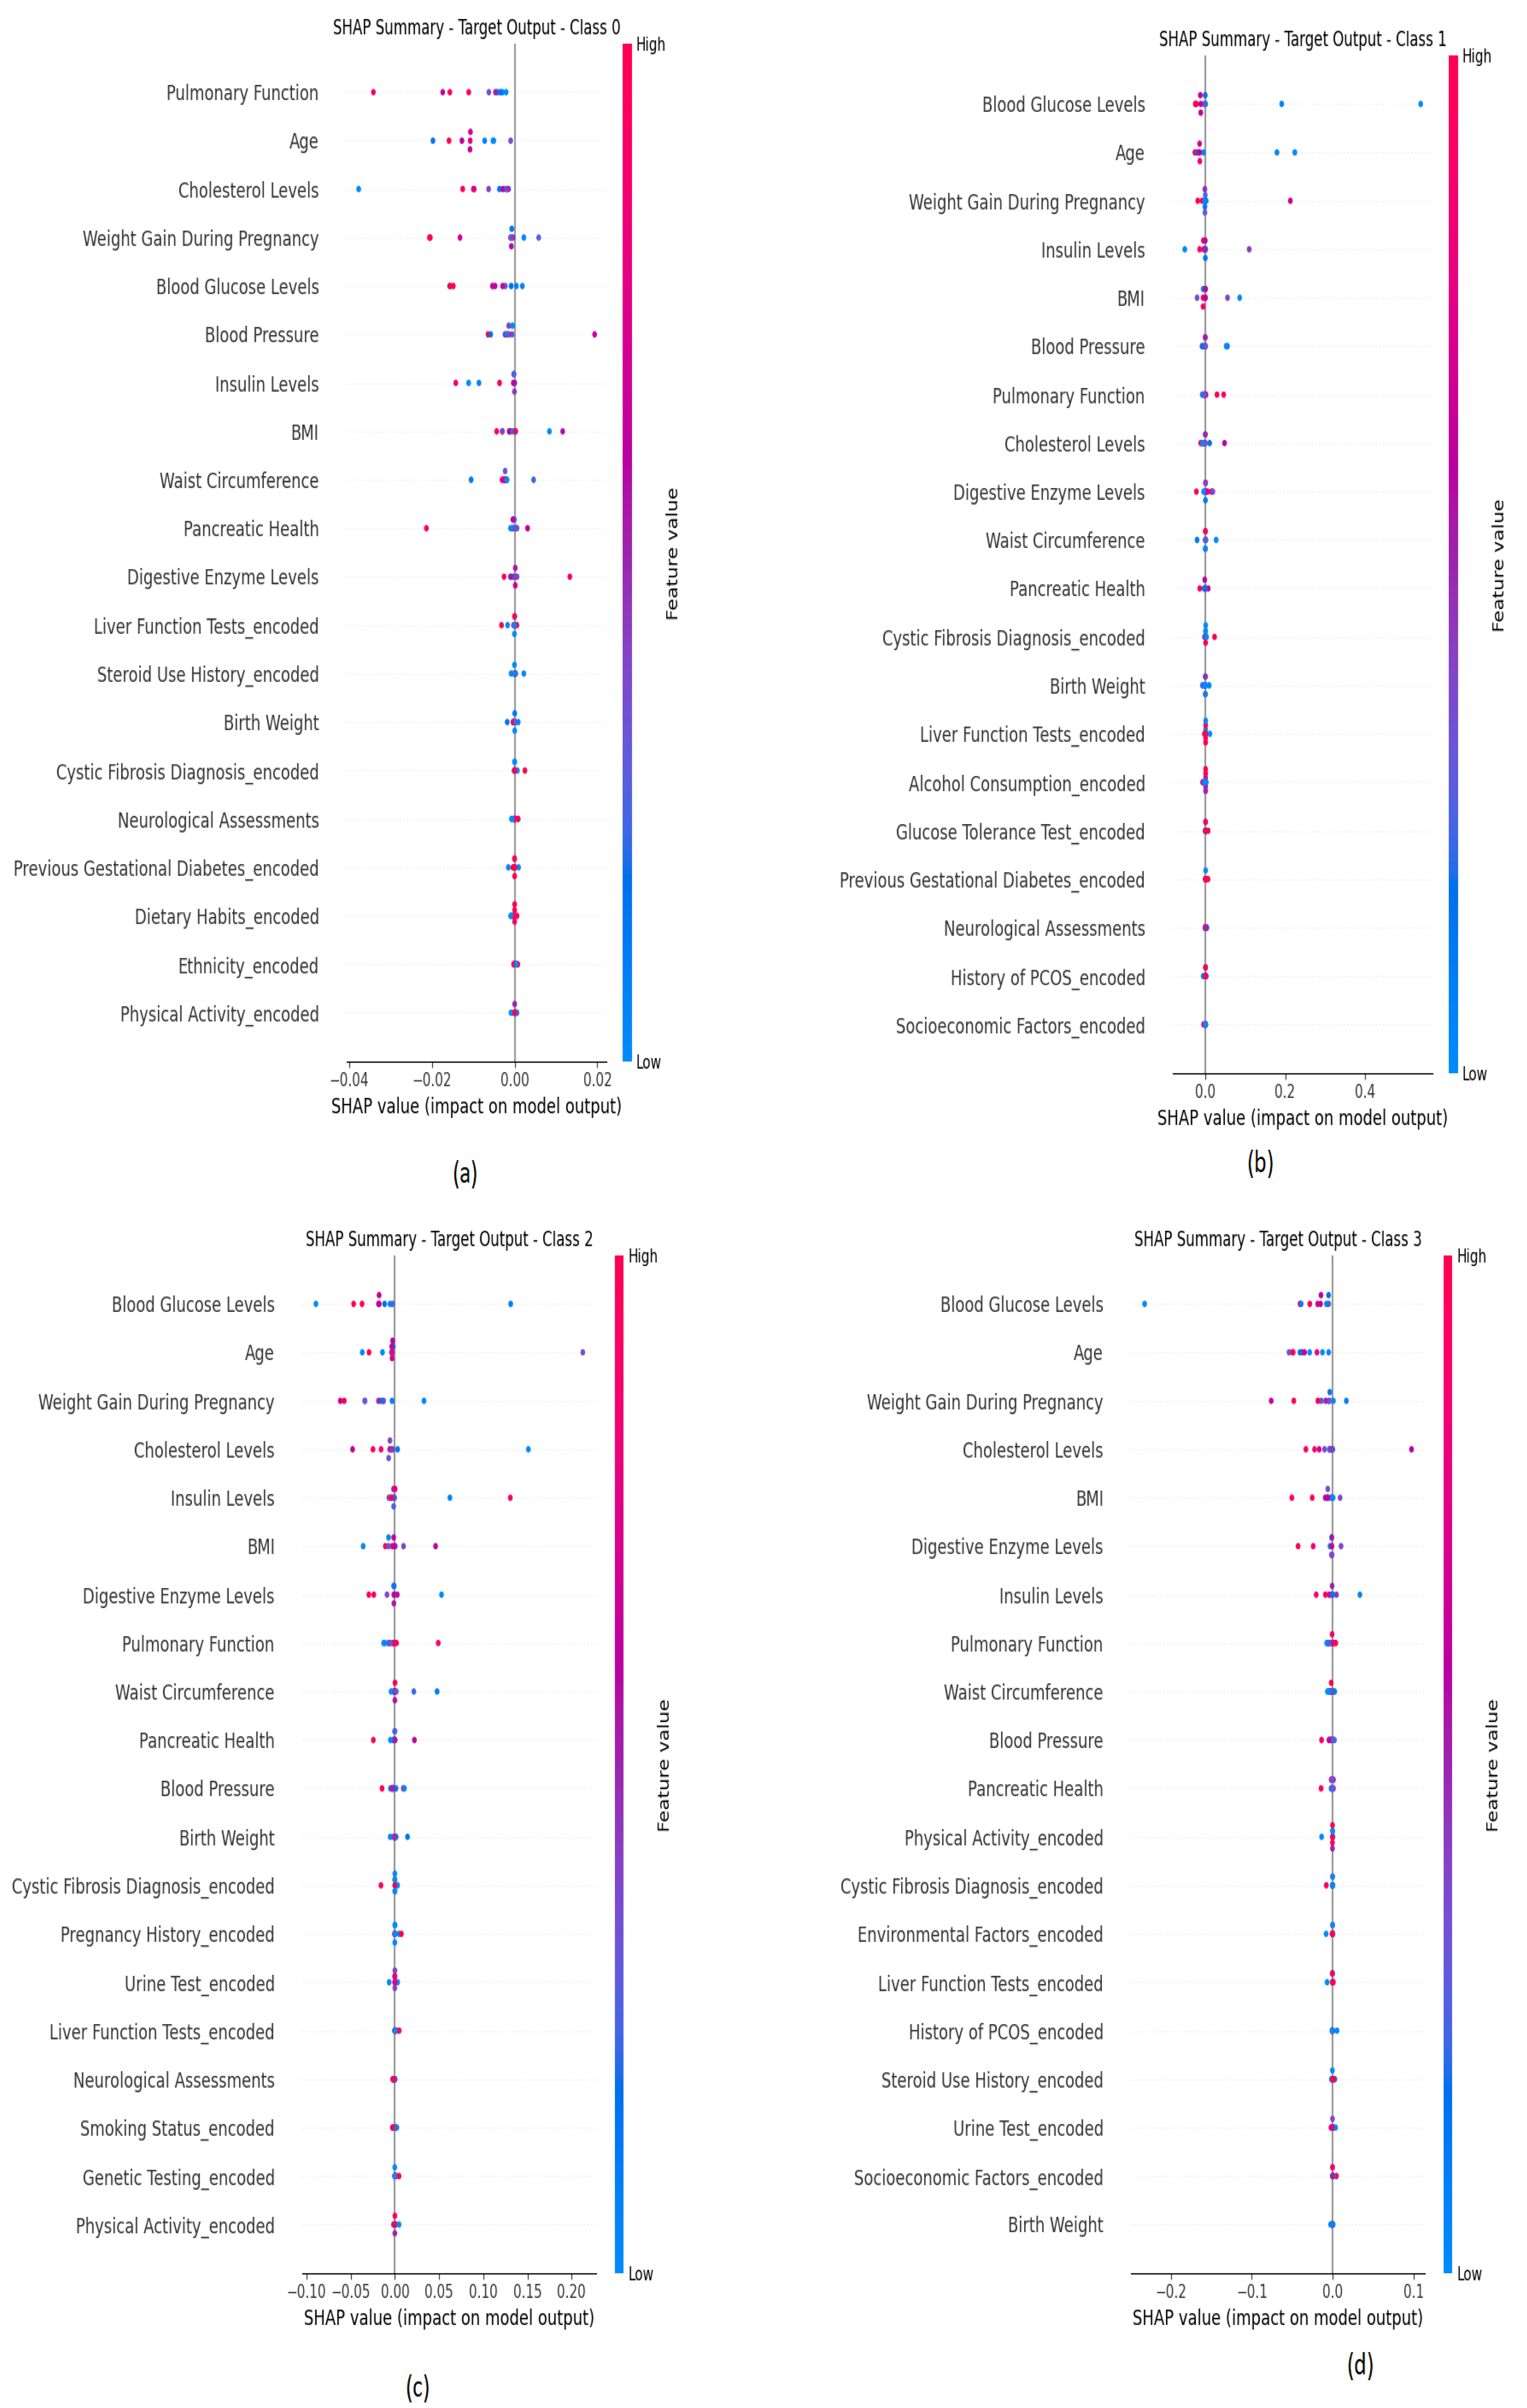
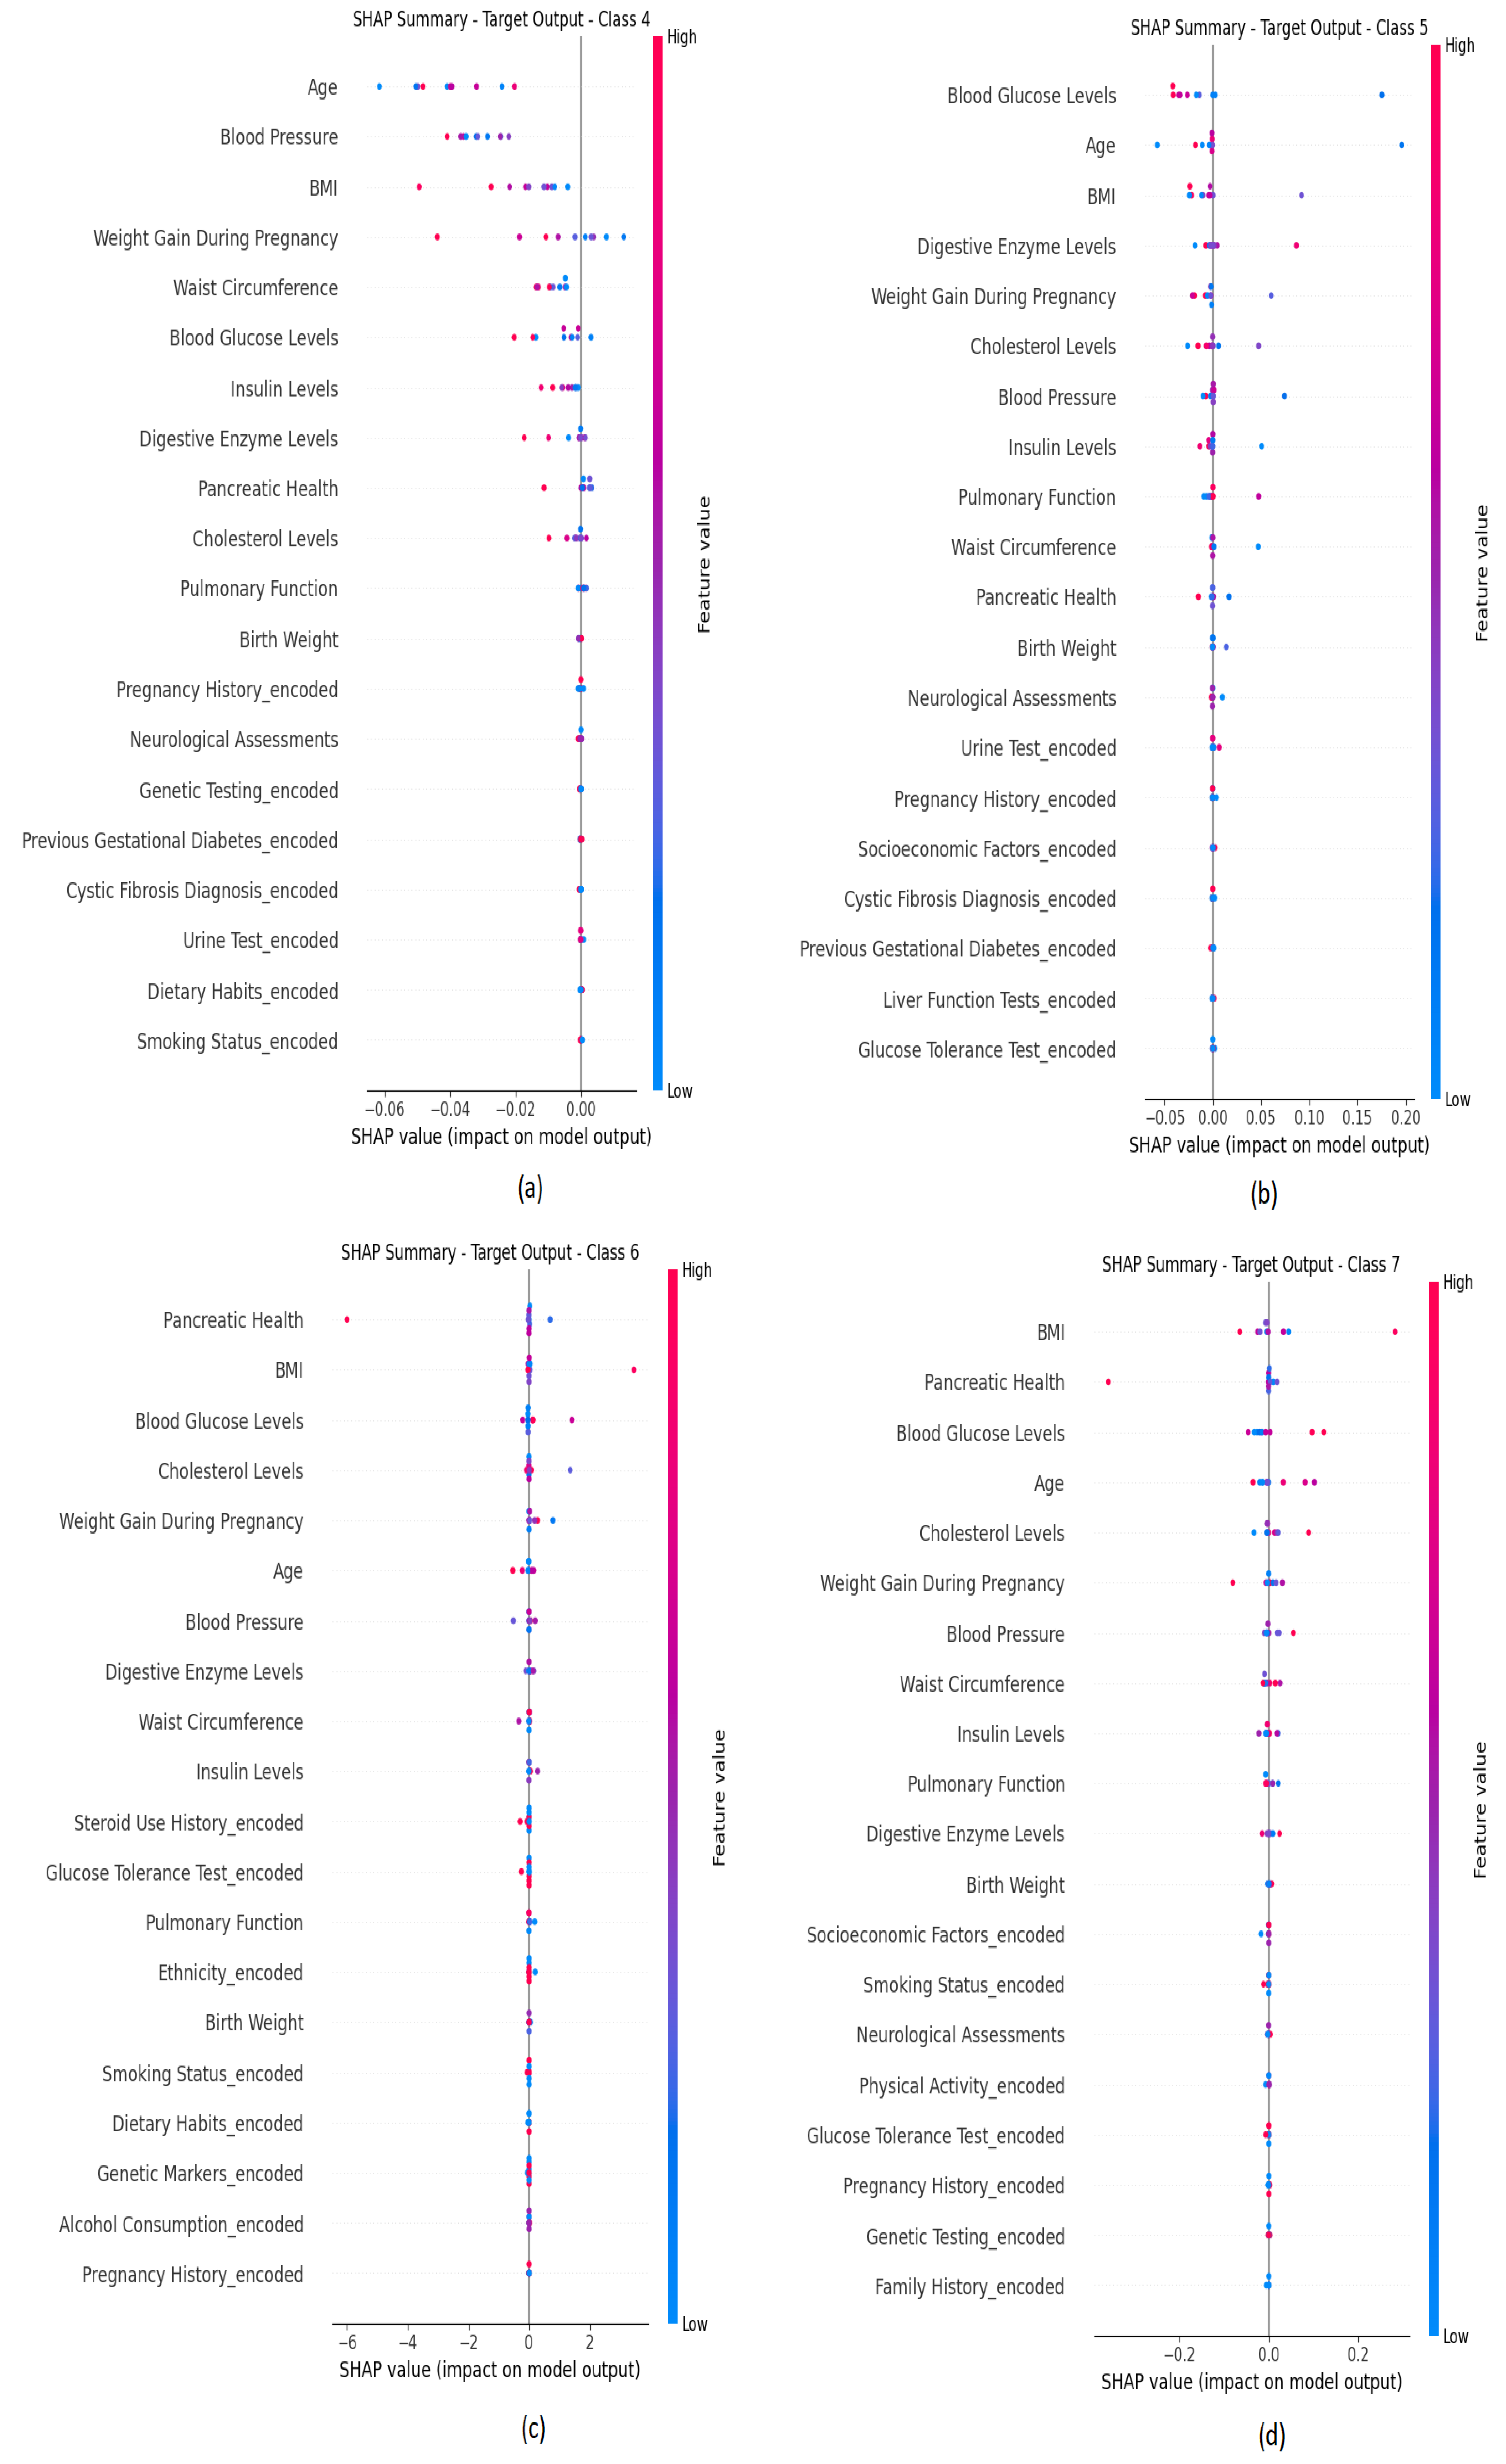
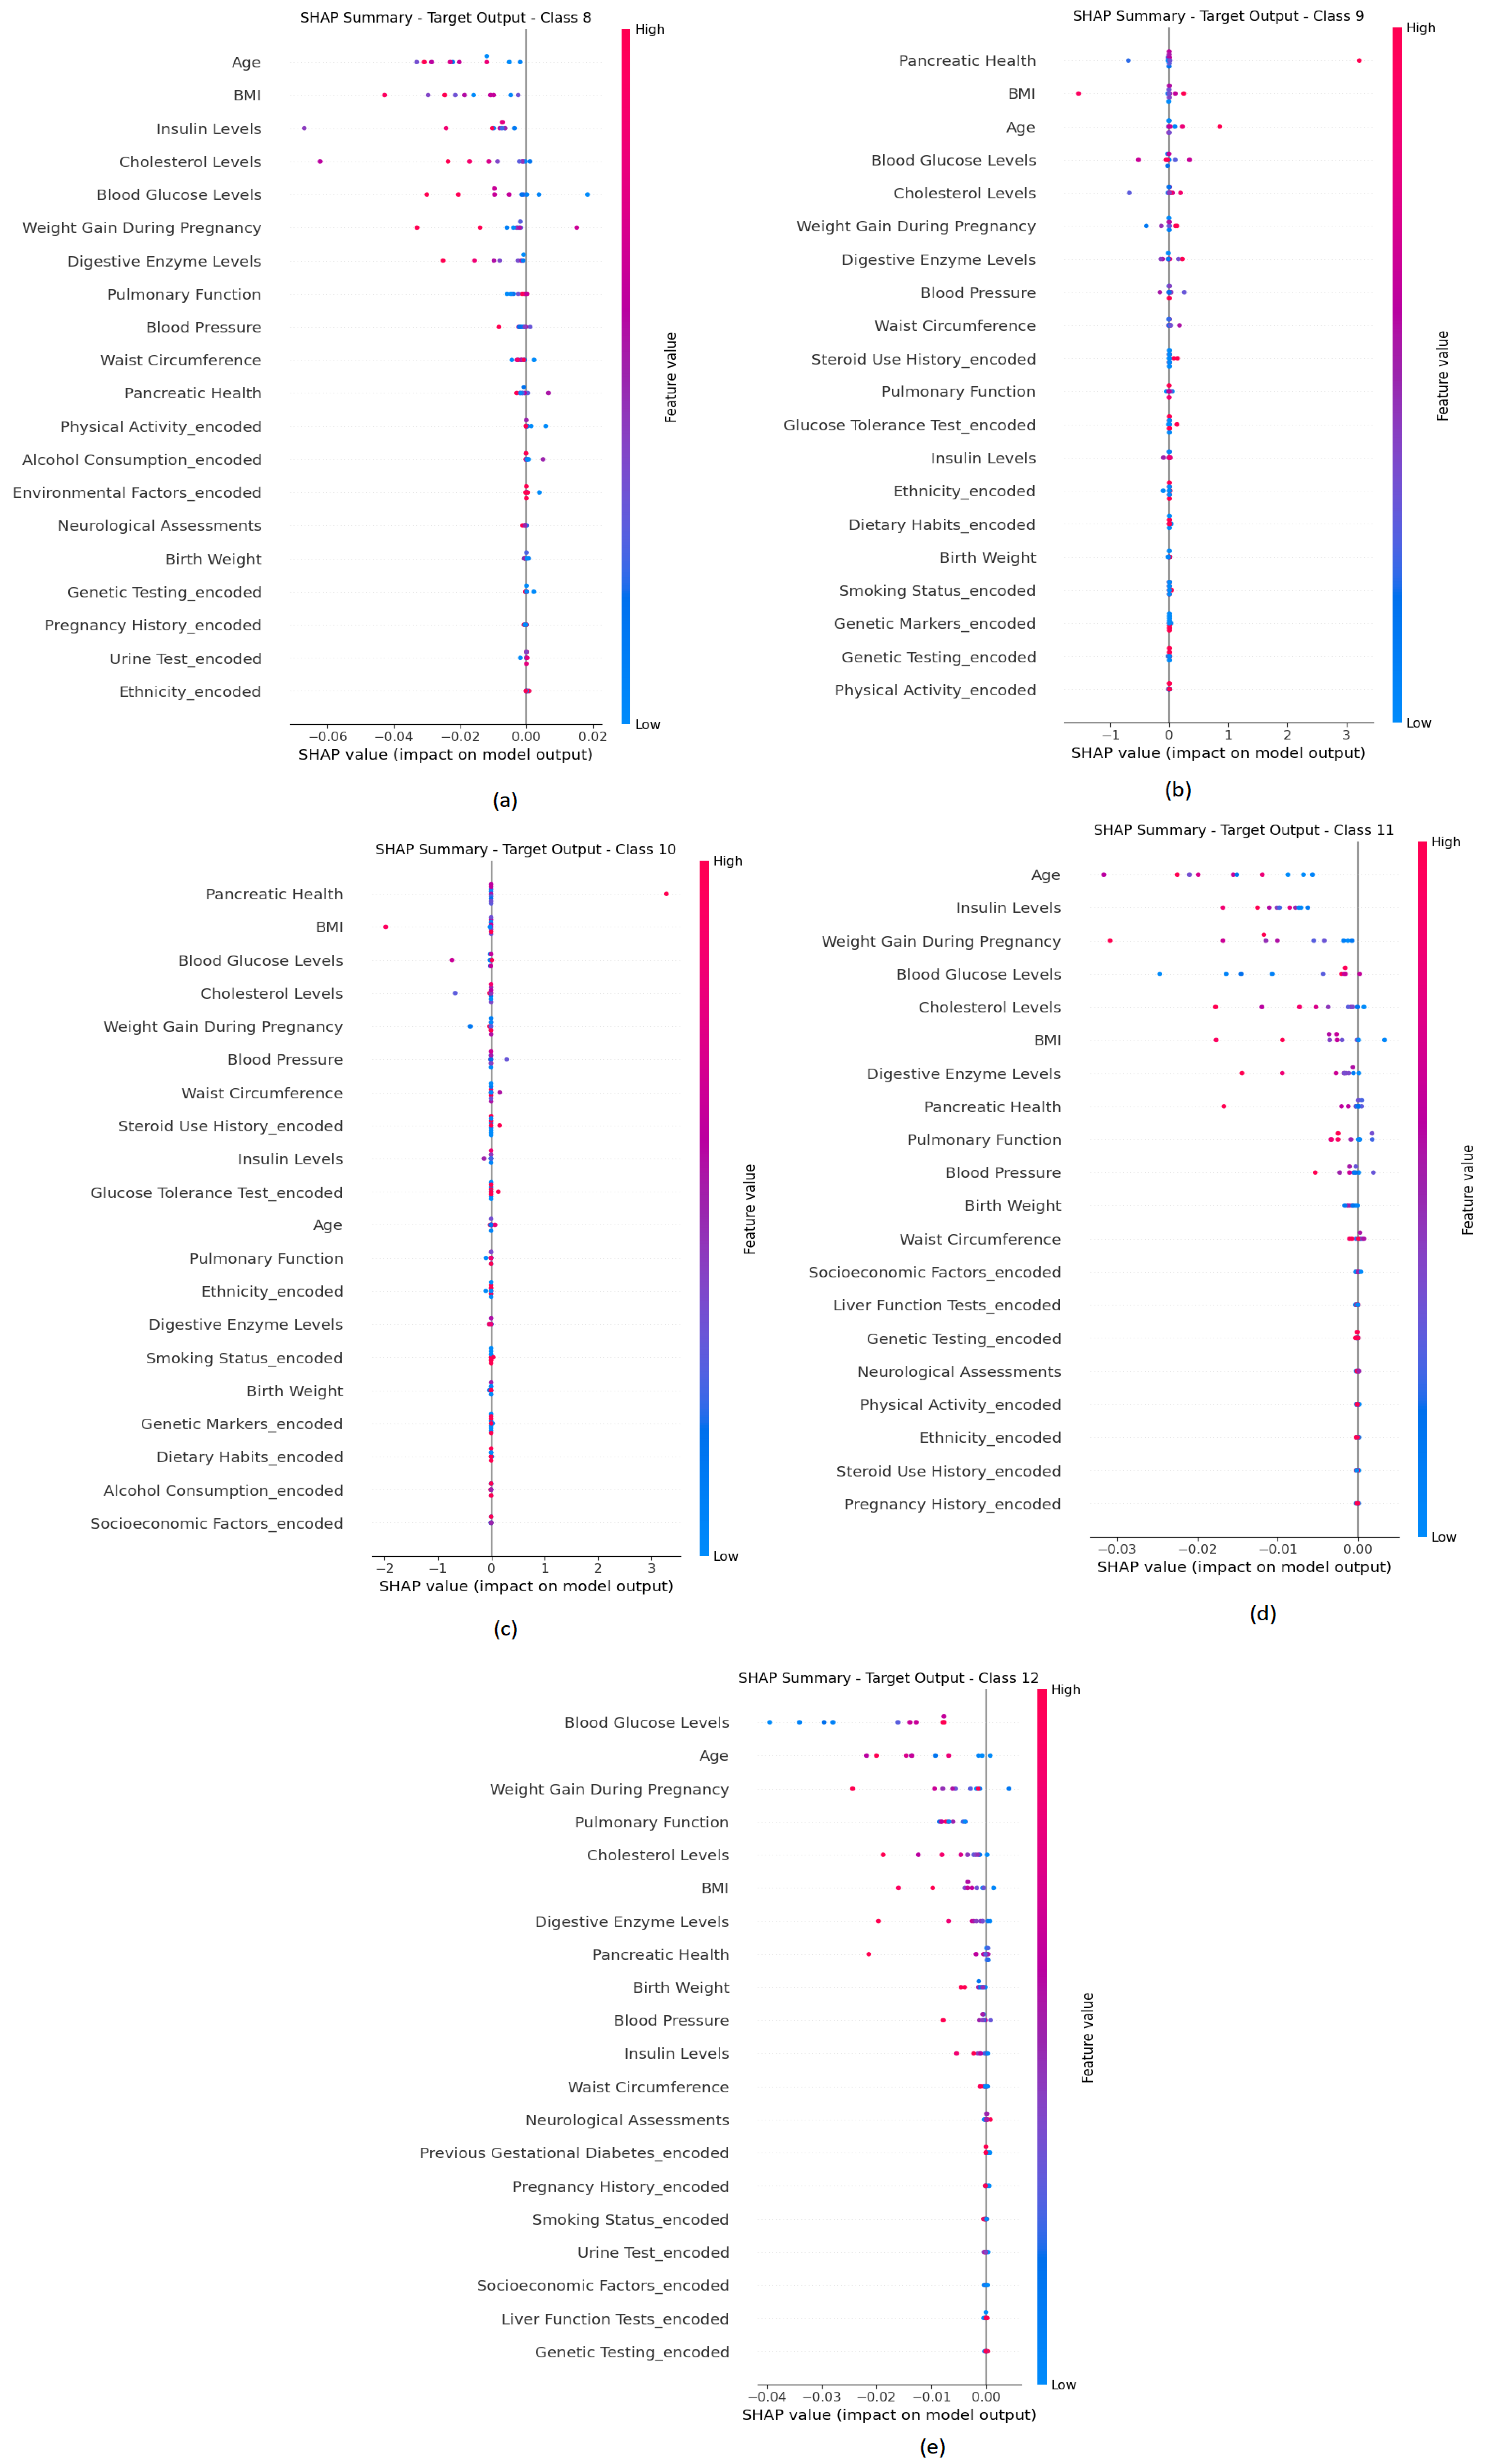
Figure 16, Figure 17 and Figure 18 represent the explanation of the SAHP summary plot for the 13 output targets. Classes 0, 1, 2, 3, 4, 5, 6, 7, 8, 9, 10, 11, and 12 represent the MODY, secondary diabetes, cystic fibrosis-related diabetes (CFRD), type 1 diabetes, neonatal diabetes mellitus (NDM), Wolcott–Rallison syndrome, type 2 diabetes, prediabetes, gestational diabetes, type 3c diabetes (pancreatogenic diabetes), Wolfram syndrome, steroid-induced diabetes, and LADA, respectively. Figure 16a–d represent the most influential feature for classes 0, 1, 2, and 3, respectively. Figure 17a–d represent the most influential feature for classes 4, 5, 6, and 7, respectively. Lastly, Figure 18a–e represent the most influential feature for classes 8, 9, 10, 11, and 12, respectively. The x-axis represents the magnitude and direction of each feature. The y-axis indicates the positive and negative SHAP values. The positive values push the prediction toward that class, while the negative values push the prediction far away from that class. Additionally, the red values mean high featured values, and the blue ones mean low featured values. For example, it can be mentioned from Figure 16a that the most important influential features for the accurate prediction for class 0 are pulmonary function, age, cholesterol levels, weight gain during pregnancy, pancreatic health, digestive enzyme level, BMI, and blood glucose levels. However, Figure 16b depicts that the most influential features for class 1 are pulmonary function, cholesterol levels, and weight gain during pregnancy. Figure 16c shows that blood glucose levels, pulmonary function, age, cholesterol levels, insulin level, weight gain during pregnancy, pancreatic health, BMI, digestive enzyme level, blood pressure, and cystic fibrosis diagnosis are the most important features for predicting class 2. It has been mentioned that across all the classes, blood glucose levels, age, weight gain during pregnancy, insulin levels, and BMI are considered the most important features to predict each class. This shows that while the same set of clinical variables is broadly influential, they may shift decision boundaries based on the specific outcome class.
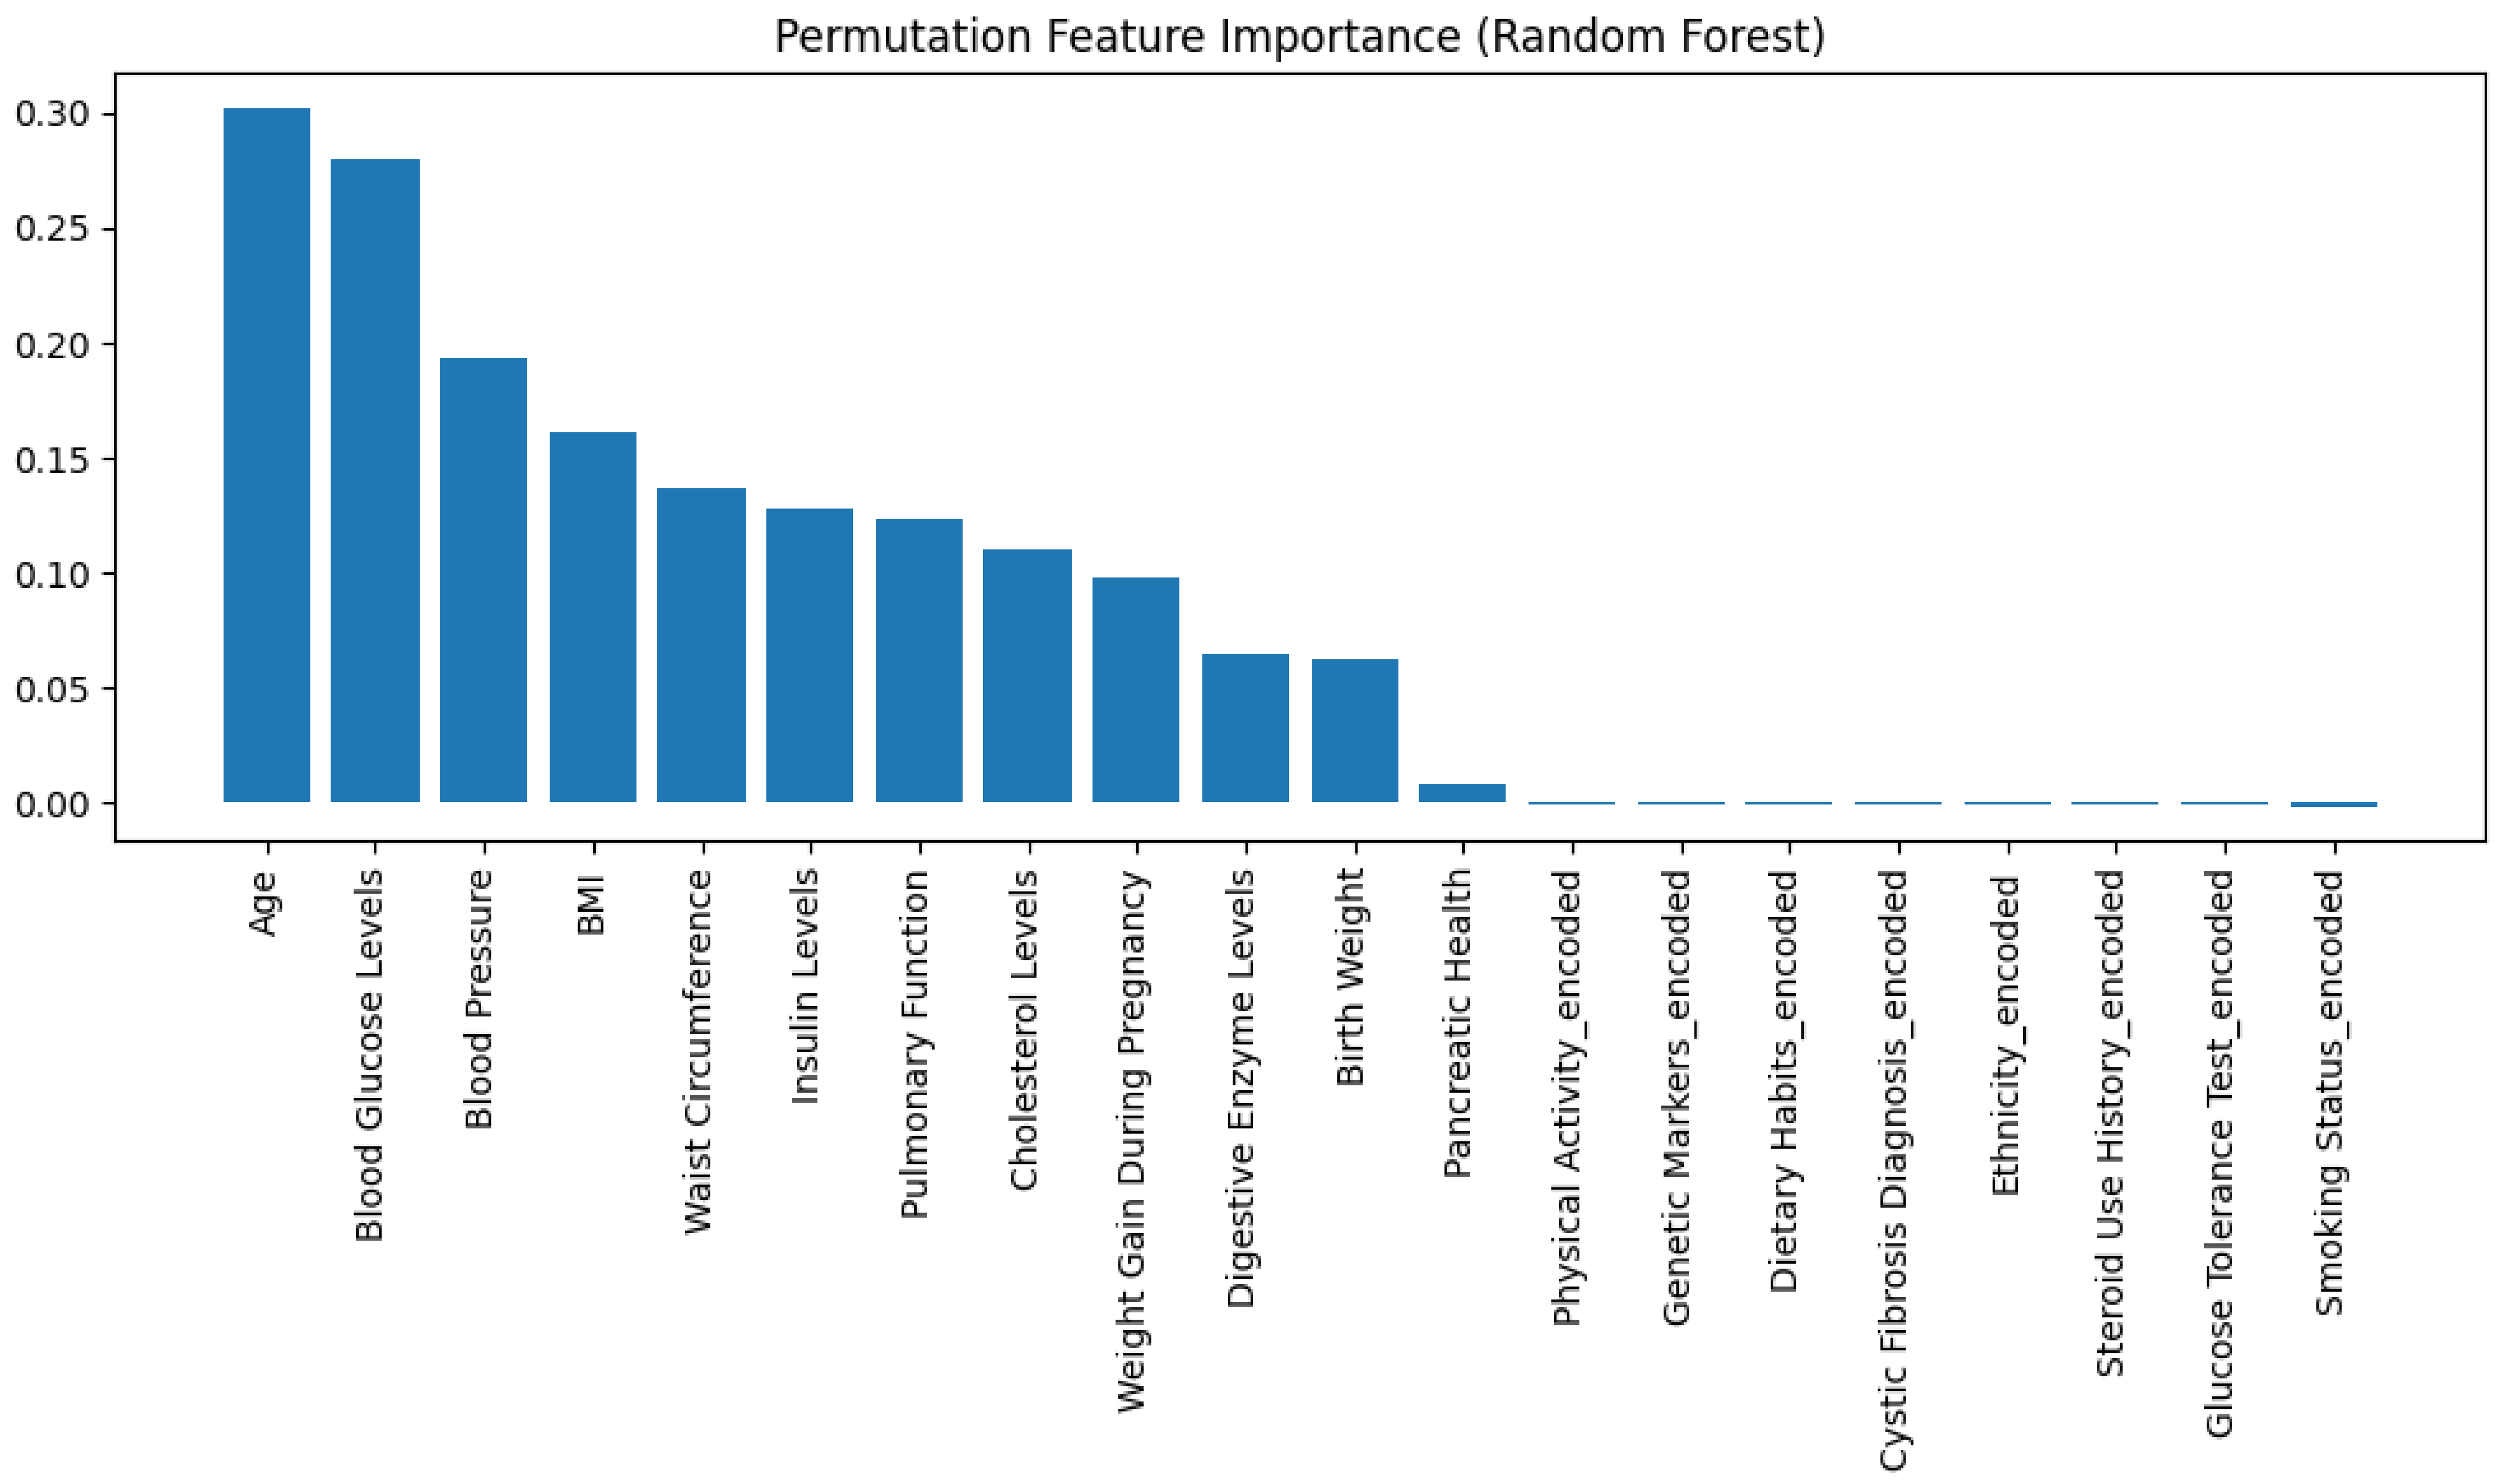
Figure 19 shows the permutation feature importance for the Random Forest model. This figure measures how much each feature can contribute to the prediction performance of the model. The x-axis shows the name of each input feature, and the y-axis shows the importance of this feature in the prediction process; higher values indicate more critical features. The most important features for the prediction are age, blood glucose levels, blood pressure, BMI, waist circumference, and insulin levels. Pulmonary function, cholesterol levels, weight gain during pregnancy, and digestive enzyme levels are considered moderate features. However, the least important features are genetic markers and smoking status. These results can align with medical knowledge to understand that age, glucose, BMI, blood pressure, and insulin are more important for chronic disease diagnosis, while lifestyle factors have less effect on predicting chronic disease.
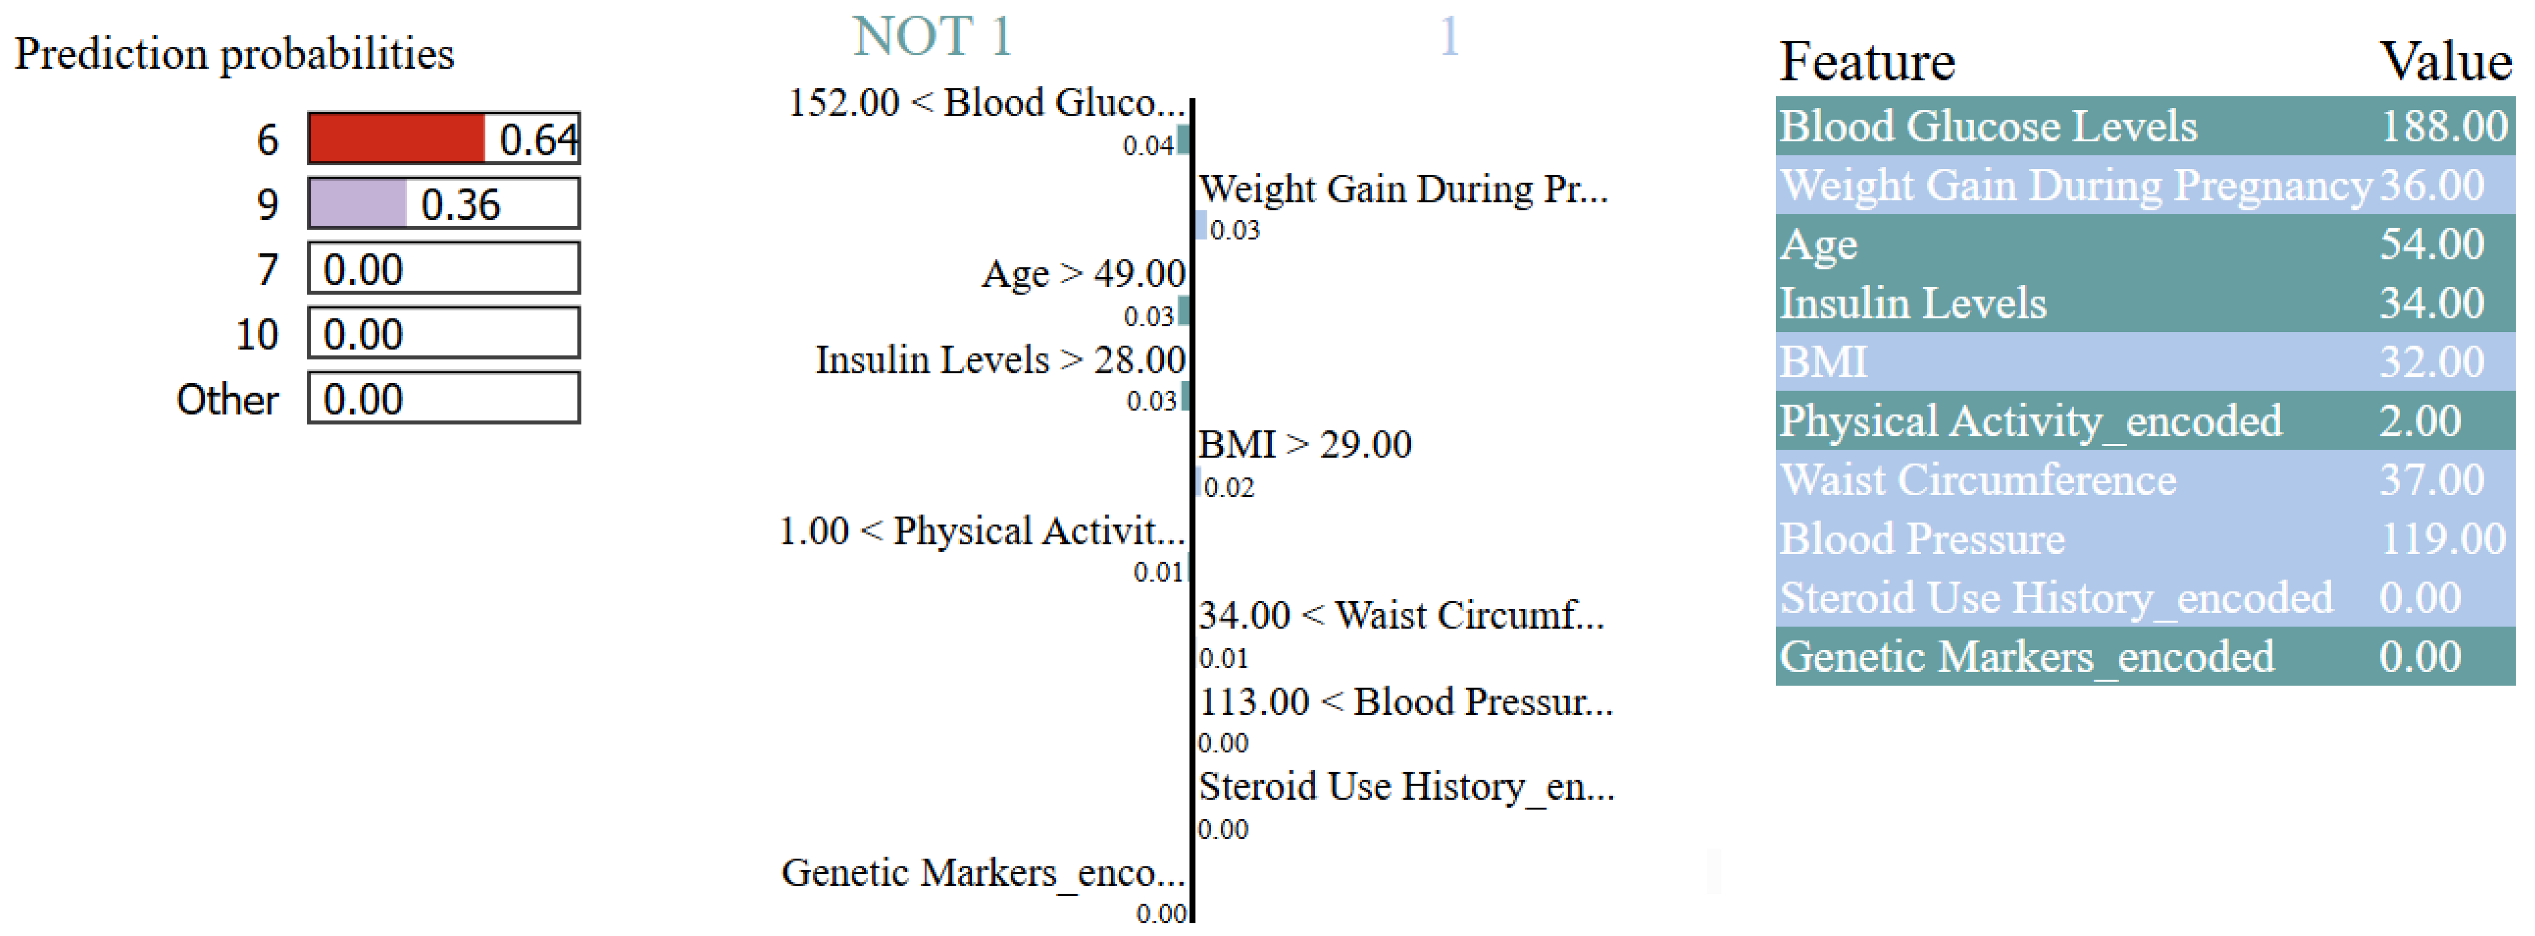
Figure 20 shows the LIME explanation for the optimized proposed 1D-CNN with XAI. A single patient instance for local explanation is presented in Figure 20. Figure 20 shows that specific features may affect the prediction of the model. A 64% and 36% probability have been assigned to class 6 and class 9, respectively, with negligible probabilities for the other classes. This assumption means that the model is confident that the assigned patient belongs to class 6, but it also shows some overlap with class 9. Additionally, the most important and influential features to drive the prediction toward class 6 are weight gain during pregnancy (36 kg), age (54 years), insulin level (34 μ U/mL), blood glucose level (188 mg/dL), and BMI (32 kg/ m 2 ). Meanwhile, steroid and genetic markers have no influence on the prediction process. However, some other factors, such as blood pressure, physical activity, waist circumference, and blood pressure, have moderate contributions to the prediction process. This example explanation observes how the model can integrate multiple indicators for any patient to make a classification decision. Additionally, by identifying which features are important and contribute the most, clinicians and researchers can understand more of the reasons behind the predictions. It also shows that the system can be aligned with medical knowledge and can build a trustworthy system for good decision making.
A comparison of the accuracy, precision, recall, F1-score, ROC-AUC, and Matthews correlation matrix for the proposed model with different other machine learning techniques, which are GRU, LSTM, and a 1D-CNN, is presented in Table 4. These parameters are important for evaluating the performance of the proposed optimized 1D-CNN deep learning with XAI, especially when working with an unbalanced dataset. Table 4 shows that LSTM is the weakest deep learning model in terms of all the measured parameters. While the traditional 1D-CNN outperforms LSTM and GRU, it still cannot beat the optimized 1D-CNN or the optimized 1D-CNN with XAI. Also, it can be observed that the optimized 1D-CNN combined with XAI achieves the best performance in terms of all the measured parameters. This result proves that XAI not only improves system transparency but also makes the model more robust and accurate. Based on the results presented in Table 4, it is important to interpret these results from a clinical perspective. The key priorities for diabetes specialists are minimizing false negatives, indicating which patients at risk are not detected, and ensuring the reliable identification of high-risk cases. Thus, recall or sensitivity is very critical, as the misdiagnosis of a diabetic patient could delay treatment and lead to severe complications. At the same time, precision is important to avoid false alarms that could burden healthcare providers and cause unnecessary anxiety for patients. The F1-score balances these two aspects, while the ROC-AUC reflects the model’s overall ability to distinguish between patients with and without risk. The MCC adds robustness by accounting for all prediction categories, making it useful in imbalanced datasets. By aligning these metrics with clinical priorities, the proposed model demonstrates not only technical strength but also practical value for medical decision making in diabetes care. The results obtained from Table 4 confirm that the optimized 1D-CNN consistently outperforms these alternatives across multiple evaluation metrics, justifying both the choice of architecture and the adopted configuration. Additionally, future work will extend this study by exploring architectural variations and feature ablation to further validate the design decisions.
In addition to deep learning benchmarks, the proposed model is compared to various popular conventional machine learning classifiers, as described in [39] and as shown in Table 5. Logistic Regression, Random Forest, and Support Vector Machine (SVM) all demonstrated good prediction ability, with accuracies of 77.0%, 75.0%, and 77.0%, respectively. Among these methods, SVM achieved the strongest balance between precision (0.87) and recall (0.77), while Logistic Regression offered a more balanced trade-off across recall (0.70) and F1-score (0.66). Other methods have been used, such as bagging (75.0% accuracy, F1 = 0.81) and AdaBoost (73.0% accuracy, F1 = 0.78), which produced moderate results, whereas XGBoost outperformed classical approaches with 83.1% accuracy and an F1-score of 0.76, confirming its reputation as a strong gradient boosting algorithm. Despite the dataset’s complexity, Naïve Bayes fared well, with an accuracy of 81.2% and an F1-score of 0.72, thanks to its probabilistic framework. K-Nearest Neighbors (KNN) fell behind with just 64.0% accuracy, illustrating its limited scalability and sensitivity to feature distribution in high-dimensional medical data. Decision tree classifiers (72.0% accuracy, F1 = 0.78) were more interpretable than ensemble approaches, although they suffered from overfitting.
When comparing the proposed model with these baselines, it can be found that the proposed optimized 1D-CNN with Explainable AI (XAI) substantially outperformed all classical methods, achieving an accuracy of 87.8%, precision of 0.8822, recall of 0.8768, and F1-score of 0.8773. This demonstrates that the integration of Bayesian hyperparameter optimization and XAI methods (SHAP, LIME, and permutation importance) enhanced both the predictive accuracy and interpretability of the 1D-CNN. These findings clearly highlight the benefits of integrating Bayesian hyperparameter optimization with XAI approaches (SHAP, LIME, and permutation importance), which increased both predicted accuracy and interpretability. The proposed framework outperforms both traditional machine learning models and advanced deep learning approaches such as LSTM and GRU, establishing itself as a robust and practical solution for diabetes risk prediction in healthcare, where reliability and explainability are critical. Unlike previous research, our approach combines predictive modeling with a wireless communication optimization component to provide a comprehensive system that offers both accurate diagnosis support and efficient real-world deployment in connected healthcare contexts.
The findings of this study reinforce the initial assumption that an integrated approach combining an efficient wireless communication model with an optimized 1D-CNN can significantly improve both the reliability of medical data transmission and the accuracy of diabetes risk prediction. The Lagrange-optimized wireless communication system allows for consistent and energy-efficient data flow from wearable devices to medical facilities, addressing a significant bottleneck in real-world healthcare applications. On the other hand, the optimized 1D-CNN with Bayesian tuning and XAI outperformed standard models, demonstrating its ability to capture the complexity of multimodal diabetes risk variables. When taken together, these findings support our suggested framework: communication reliability and prediction accuracy are not separate but complementary components, and combining them gives a scalable and clinically relevant solution for remote healthcare monitoring.
The proposed approach is unique in that it combines wireless communication optimization with explainable deep learning to forecast diabetes risk. Unlike existing techniques, which emphasize exclusively classification accuracy or wireless efficiency, our system handles both issues concurrently. The use of Bayesian optimization guarantees that the prediction model is both accurate and computationally economical, making it acceptable for real-world use. Furthermore, the use of XAI approaches (SHAP and LIME) is a considerable improvement over black-box models since it provides physicians with visible insights into why predictions are generated. This simultaneous emphasis on performance and interpretability distinguishes the framework as both scientifically innovative and therapeutically applicable. Practically, the system may be embedded in wearable devices to continually communicate patient health data, anticipate hazards in real time, and provide doctors with actionable explanations, therefore enhancing early detection, treatment planning, and patient outcomes. While the proposed strategy combines predictive modeling and wireless transmission optimization, it has been recognized that real-world deployment may present additional obstacles such as mobility, unanticipated interference, and large-scale heterogeneous data. These elements will be considered in future extensions.

4. Conclusions

This paper focused on two important fields nowadays: tracking, monitoring, and sending the patient data in an efficient way and predicting diabetes risk to protect people and save lives. This paper is divided into two phases. Phase 1 proposes an efficient wireless communication system based on finding the best transmission distance between the WD and MC to ensure that the sent data are accurate. The optimum transmission distance is found using Lagrange optimization. The model is assessed under different channel conditions such as interference distance, path loss, maximum wearable device transmission power, and minimum required signal-to-noise-plus interference ratio. The aim of finding the optimum transmission distance is decreasing the effect of interference that may occur due to the existence of other devices sharing the same spectrum with the WD and then enhancing the system performance in terms of EE. Based on the results obtained from the analytical model, an optimized 1D-CNN based on using Bayesian optimization is implemented to find the optimum required hyperparameters for accurate model prediction. In Phase 2, an optimized 1D-CNN using Bayesian optimization combined with XAI is implemented to tune the required hyperparameters for the 1D-CNN to achieve the best performance. The results obtained for the tuned model demonstrated superior performance compared to baseline machine learning approaches, achieving high classification accuracy, macro-F1 score, and area under the ROC curve (AUC) values. To support clinical adoption and enhance model interpretability, LIME (Local Interpretable Model-agnostic Explanations) and SHAP (SHapley Additive exPlanations) are implemented. SHAP provides a global view of the importance of the feature importance and how it influences the prediction, while LIME offers local explanations for individual patient predictions. The proposed model, which combines deep learning, automated hyperparameter tuning, and explainability, addresses the “black-box” nature of neural networks and helps enable the high accuracy and transparency in medical AI systems. This framework helps foster trust in AI-assisted healthcare solutions, helps clinicians in diabetes diagnosis, and improves patient-specific decision making. The results obtained from the two phases show the effectiveness and the accuracy of the proposed model. While the current research uses diabetes as an example to show the framework, the suggested wireless communication model and prediction pipeline are intended to be applicable to other chronic illnesses as well. Future study will look at adapting the approach to various disorders, confirming its broad usefulness in healthcare settings.

Funding

This research did not receive any specific funds.

Institutional Review Board Statement

Not applicable.

Informed Consent Statement

Not applicable.

Data Availability Statement

The dataset used in this study is openly available in the Diabetes Dataset on Kaggle (https://www.kaggle.com/datasets/ankitbatra1210/diabetes-dataset/data, accessed on 21 March 2025).

Conflicts of Interest

The author declares no conflicts of interest.

Abbreviations

The following abbreviations are used in this manuscript:
ParameterDefinition
P W Wearable device transmission power
P W m a x Maximum wearable device transmission power
P I Interference transmission power
P I m a x Maximum interference transmission power
P D Dtx transmission power
P C CUE transmission power
P V Vtx transmission power
P o Internal circuitry power consumption
EEEnergy efficiency
1 D-CNN1D Convolutional Neural Network
LSTMLong Short-Term Memory
GRUGated Recurrent Unit
SHAPSHapley Additive exPlanations
LIMELocal Interpretable Model Agnostic Explanation
AIArtificial intelligence
MLMachine learning
NLPNatural Language Processing
RPARobotic Process Automation
EHRElectronic Health Record
XAIExplainable AI
LPDSLiver Patients Detection Strategy
IB2OAImproved Binary Butterfly Optimization Algorithm
PHYPhysical layer
ECGElectrocardiogram
BLE-5-basedBluetooth Low Energy version 5
WBANWireless Body Area Network
SINRSignal-to-interference-plus-noise
SINR min Minimum signal-to-interference-plus-noise
CUECellular user equipments
D2DDevice-to-device
V2VVehicle-to-vehicle
WDWearable device
MCMedical centers
nThe additive white Gaussian noise
σ 2 The noise power
IInterference
h C k M Direct channel gain from CUE–MC
h D d M Direct channel gain from Drx–MC
h V v M Direct channel gain from Vtx–MC
d C M Transmission distance CUE–MC
d D M Transmission distance Dtx–MC
d V M Transmission distance Vtx–MC
d W M Transmission distance WD–MC
AWGNAdditive white Gaussian noise
NOMANon-Orthogonal Multiple Access
λ 1 , and  λ 2    The non-negative Lagrange multiplier
MAEMean Absolute Error
MSEMean Square Error
TPThe number of True Positives
TNThe number of True Negatives
FPThe number of False Positives
FNThe number of False Negatives
RMSERoot Mean Square Error
r 2 Coefficient of Determination
QoSQuality-of-service
ReLURectified Linear Unit
PReLUParametric Rectified Linear Unit

References

  1. Setyawati, R.; Astuti, A.; Utami, T.P.; Adiwijaya, S.; Hasyim, D.M. The importance of early detection in disease management. J. World Future Med. Health Nurs. 2024, 2, 51–63. [Google Scholar]
  2. Pennisi, F.; Gentile, L.; Borlini, S.; Gianfredi, V.; Signorelli, C. Direct and indirect healthcare costs of ocular diseases in Italy: A literature review on glaucoma, diabetic retinopathy, and macular degeneration. Ann. Ig. 2025, 10, 532–555. [Google Scholar]
  3. Kovács, N.; Shahin, B.; Andrade, C.A.S.; Mahrouseh, N.; Varga, O. Lifestyle and metabolic risk factors, and diabetes mellitus prevalence in European countries from three waves of the European Health Interview Survey. Sci. Rep. 2024, 14, 11623. [Google Scholar] [CrossRef]
  4. Górczyńska-Kosiorz, S.; Kosiorz, M.; Dzięgielewska-Gęsiak, S. Exploring the interplay of genetics and nutrition in the rising epidemic of obesity and metabolic diseases. Nutrients 2024, 16, 3562. [Google Scholar] [CrossRef]
  5. Siddiqui, M.N.I. Global epidemic of diabetes, growing burden of young-onset diabetes, and regional perspective. J. Assoc. Clin. Endocrinol. Diabetol. Bangladesh 2025, 4, 1–3. [Google Scholar] [CrossRef]
  6. Al-Busafi, S.A.; Alwassief, A. Global perspectives on the hepatitis B vaccination: Challenges, achievements, and the road to elimination by 2030. Vaccines 2024, 12, 288. [Google Scholar] [CrossRef] [PubMed]
  7. Alubaie, M.A.; Sayed, M.Y.; Alnakhli, R.E.; Alshaia, F.I.N.; Aldossary, S.B.; Alsubaie, N.M.; Mubarek, S.A.A.; Raeedi, W.A.; Alhamdan, A.M.; Hassani, A.H.; et al. The efficiency and accuracy gains of real-time health data integration in healthcare management: A comprehensive review of current practices and future directions. Egypt. J. Chem. 2024, 67, 1725–1729. [Google Scholar] [CrossRef]
  8. Alharbe, N.; Almalki, M. IoT-enabled healthcare transformation leveraging deep learning for advanced patient monitoring and diagnosis. Multimed. Tools Appl. 2025, 84, 21331–21344. [Google Scholar] [CrossRef]
  9. Asif, S.; Wenhui, Y.; ur-Rehman, S.; ul-Ain, Q.; Amjad, K.; Yueyang, Y.; Awais, M. Advancements and prospects of machine learning in medical diagnostics: Unveiling the future of diagnostic precision. Arch. Comput. Methods Eng. 2025, 32, 853–883. [Google Scholar] [CrossRef]
  10. Faiyazuddin, M.; Rahman, S.J.Q.; Anand, G.; Siddiqui, R.K.; Mehta, R.; Khatib, M.N.; Gaidhane, S.; Zahiruddin, Q.S.; Hussain, A.; Sah, R. The impact of artificial intelligence on healthcare: A comprehensive. Health Sci. Rep. 2025, 8, e70312. [Google Scholar] [CrossRef]
  11. El-Kenawy, E.-S.M.; Alhussan, A.A.; Khodadadi, N.; Mirjalili, S.; Eid, M.M. Predicting potato crop yield with machine learning and deep learning for sustainable agriculture. Potato Res. 2025, 68, 759–792. [Google Scholar] [CrossRef]
  12. Zhou, X.; Leung, C.K.; Kevin, I.; Wang, K.; Fortino, G. Editorial deep learning-empowered big data analytics in biomedical applications and digital healthcare. IEEE/ACM Trans. Comput. Biol. Bioinform. 2024, 21, 516–520. [Google Scholar] [CrossRef]
  13. Osman, R.A. Internet of Medical Things (IoMT) optimization for healthcare: A deep learning-based interference avoidance model. Comput. Netw. 2024, 248, 110491. [Google Scholar] [CrossRef]
  14. Kothinti, R.R. Deep learning in healthcare: Transforming disease diagnosis, personalized treatment, and clinical decision-making through AI-driven innovations. World J. Adv. Res. Rev. 2024, 24, 2841–2856. [Google Scholar] [CrossRef]
  15. Van Roosmale, S.; Hellinckx, P.; Meysman, J.; Verbeke, S.; Audenaert, A. Building automation and control systems for office buildings: Technical insights for effective facility management—A literature review. J. Build. Eng. 2024, 97, 110943. [Google Scholar] [CrossRef]
  16. Osman, R.A. Energy-efficient IoT-based tracking and management system for patients with cognitive diseases. J. Netw. Comput. Appl. 2025, 243, 104289. [Google Scholar] [CrossRef]
  17. Osman, R.A. Energy-efficient communication between IoMT devices and emergency vehicles for improved patient care. PLoS ONE 2025, 20, e0330695. [Google Scholar] [CrossRef] [PubMed]
  18. Butt, A.U.R.; Saba, T.; Khan, I.; Mahmood, T.; Khan, A.R.; Singh, S.K.; Daradkeh, Y.I.; Ullah, I. Proactive and data-centric internet of things-based fog computing architecture for effective. Comput. Electr. Eng. 2025, 123, p.110030. [Google Scholar] [CrossRef]
  19. Wang, S.C.; Nickel, G.; Venkatesh, K.P.; Raza, M.M.; Kvedar, J.C. AI-based diabetes care: Risk prediction models and implementation concerns. NPJ Digit. Med. 2024, 7, 36. [Google Scholar] [CrossRef]
  20. Angelucci, F.; Ai, A.R.; Piendel, L.; Cerman, J.; Hort, J. Integrating AI in fighting advancing Alzheimer: Diagnosis, prevention, treatment, monitoring, mechanisms, and clinical trials. Curr. Opin. Struct. Biol. 2024, 87, 102857. [Google Scholar] [CrossRef]
  21. Tian, F.; Liu, D.; Wei, N.; Fu, Q.; Sun, L.; Liu, W.; Sui, X.; Tian, K.; Nemeth, G.; Feng, J. Prediction of tumor origin in cancers of unknown primary origin with cytology-based deep learning. Nat. Med. 2024, 30, 1309–1319. [Google Scholar] [CrossRef] [PubMed]
  22. Tanim, S.A.; Shrestha, T.E.; Emon, M.R.I.; Mridha, M.F.; Miah, M.S.U. Explainable deep learning for diabetes diagnosis with DeepNetX2. Biomed. Signal Process. Control 2025, 99, 106902. [Google Scholar] [CrossRef]
  23. Kalra, N.; Verma, P.; Verma, S. Advancements in AI based healthcare techniques with focus on diagnostic techniques. Comput. Biol. Med. 2024, 179, 108917. [Google Scholar] [CrossRef]
  24. Jabeen, K.; Khan, M.A.; Damaševičius, R.; Alsenan, S.; Baili, J.; Zhang, Y.-D.; Verma, A. An intelligent healthcare framework for breast cancer diagnosis based on the information fusion of novel deep learning architectures and improved optimization algorithm. Eng. Appl. Artif. Intell. 2024, 137, 109152. [Google Scholar] [CrossRef]
  25. Shaban, W.M. Early diagnosis of liver disease using improved binary butterfly optimization and machine learning algorithms. Multimed. Tools Appl. 2024, 83, 30867–30895. [Google Scholar] [CrossRef]
  26. Elbedwehy, S.; Hassan, E.; Saber, A.; Elmonier, R. Integrating neural networks with advanced optimization techniques for accurate kidney disease diagnosis. Sci. Rep. 2024, 14, 21740. [Google Scholar] [CrossRef]
  27. Ashwini, A.; Chirchi, V.; Balasubramaniam, S.; Shah, M.A. Bio inspired optimization techniques for disease detection in deep learning systems. Sci. Rep. 2025, 15, 18202. [Google Scholar] [CrossRef] [PubMed]
  28. Verma, R.; Gautam, S.; Bal, N.S.; Kumar, S.; Saeed, N. IoT-enabled energy-efficient and long-range solution for remote patient monitoring using Bluetooth low energy 5.x. IEEE J. Radio Freq. Identif. 2025, 9, 527–541. [Google Scholar] [CrossRef]
  29. Choi, S.H.; Kang, M.; Kwon, K.W.; Kim, J.S.; Jung, J.M.; Lee, H.M. An energy-efficient real-time wearable ECG acquisition system with near-data pre-diagnosis for mobile applications. IEEE Trans. Instrum. Meas. 2025, 74, 2003711. [Google Scholar] [CrossRef]
  30. Alatawi, M.N. Optimizing security and energy efficiency in IoT-based health monitoring systems for wireless body area networks. Sci. Rep. 2025, 15, 24921. [Google Scholar] [CrossRef]
  31. Meftah, E.H.; Benmahmoud, S.; Rabehi, A. Innovative wireless solutions for real-time ECG monitoring: Leveraging BLE, Wi-Fi, and LoRa technologies. In Proceedings of the 2024 International Conference on Telecommunications and Intelligent Systems (ICTIS), Djelfa, Algeria, 14–15 December 2024; pp. 1–6. [Google Scholar]
  32. Tesema, W.; Jimma, W.; Khan, M.I.; Stiens, J.; da Silva, B. A taxonomy of low-power techniques in wearable medical devices for healthcare applications. Electronics 2024, 13, 3097. [Google Scholar] [CrossRef]
  33. Ankitbatra1210. Diabetes Dataset. Kaggle. 2025. Available online: https://www.kaggle.com/datasets/ankitbatra1210/diabetes-dataset/data (accessed on 21 March 2025).
  34. Abuajwa, O.; Muhammad, S.; Ambak, Z.; Mitani, S.; Tiang, J.-J. Energy efficiency techniques in non-orthogonal multiple access (NOMA) in 5G network: An overview and outlook. Wirel. Pers. Commun. 2025, 140, 971–1013. [Google Scholar] [CrossRef]
  35. Kakavand, M.; Hassannejad Bibalan, M.; Baghani, M. Capacity analysis over fractional order Rayleigh fading channel under additive white generalized Gaussian noise. IET Commun. 2024, 18, 1391–1402. [Google Scholar] [CrossRef]
  36. Xu, Y.; Zheng, L.; Wu, X.; Tang, Y.; Liu, W.; Sun, D. Energy-Efficient Resource Allocation for V2X Communications. IEEE Internet Things J. 2024, 11, 30014–30026. [Google Scholar] [CrossRef]
  37. Cao, X.; Wang, S.; Ren, X. IRS-Enhanced V2X Communication and Computation Systems: Resource Allocation and Performance Optimization. IEEE Internet Things J. 2024, 12, 9180–9194. [Google Scholar] [CrossRef]
  38. Alkhanbouli, R.; Almadhaani, H.M.A.; Alhosani, F.; Simsekler, M.C.E. The role of explainable artificial intelligence in disease prediction: A systematic literature review and future research directions. BMC Med. Inform. Decis. Mak. 2025, 25, 110. [Google Scholar] [CrossRef] [PubMed]
  39. El-Sofany, H.; El-Seoud, S.A.; Karam, O.H.; Abd El-Latif, Y.M.; Taj-Eddin, I.A. A proposed technique using machine learning for the prediction of diabetes disease through a mobile app. Int. J. Intell. Syst. 2024, 2024, 6688934. [Google Scholar] [CrossRef]
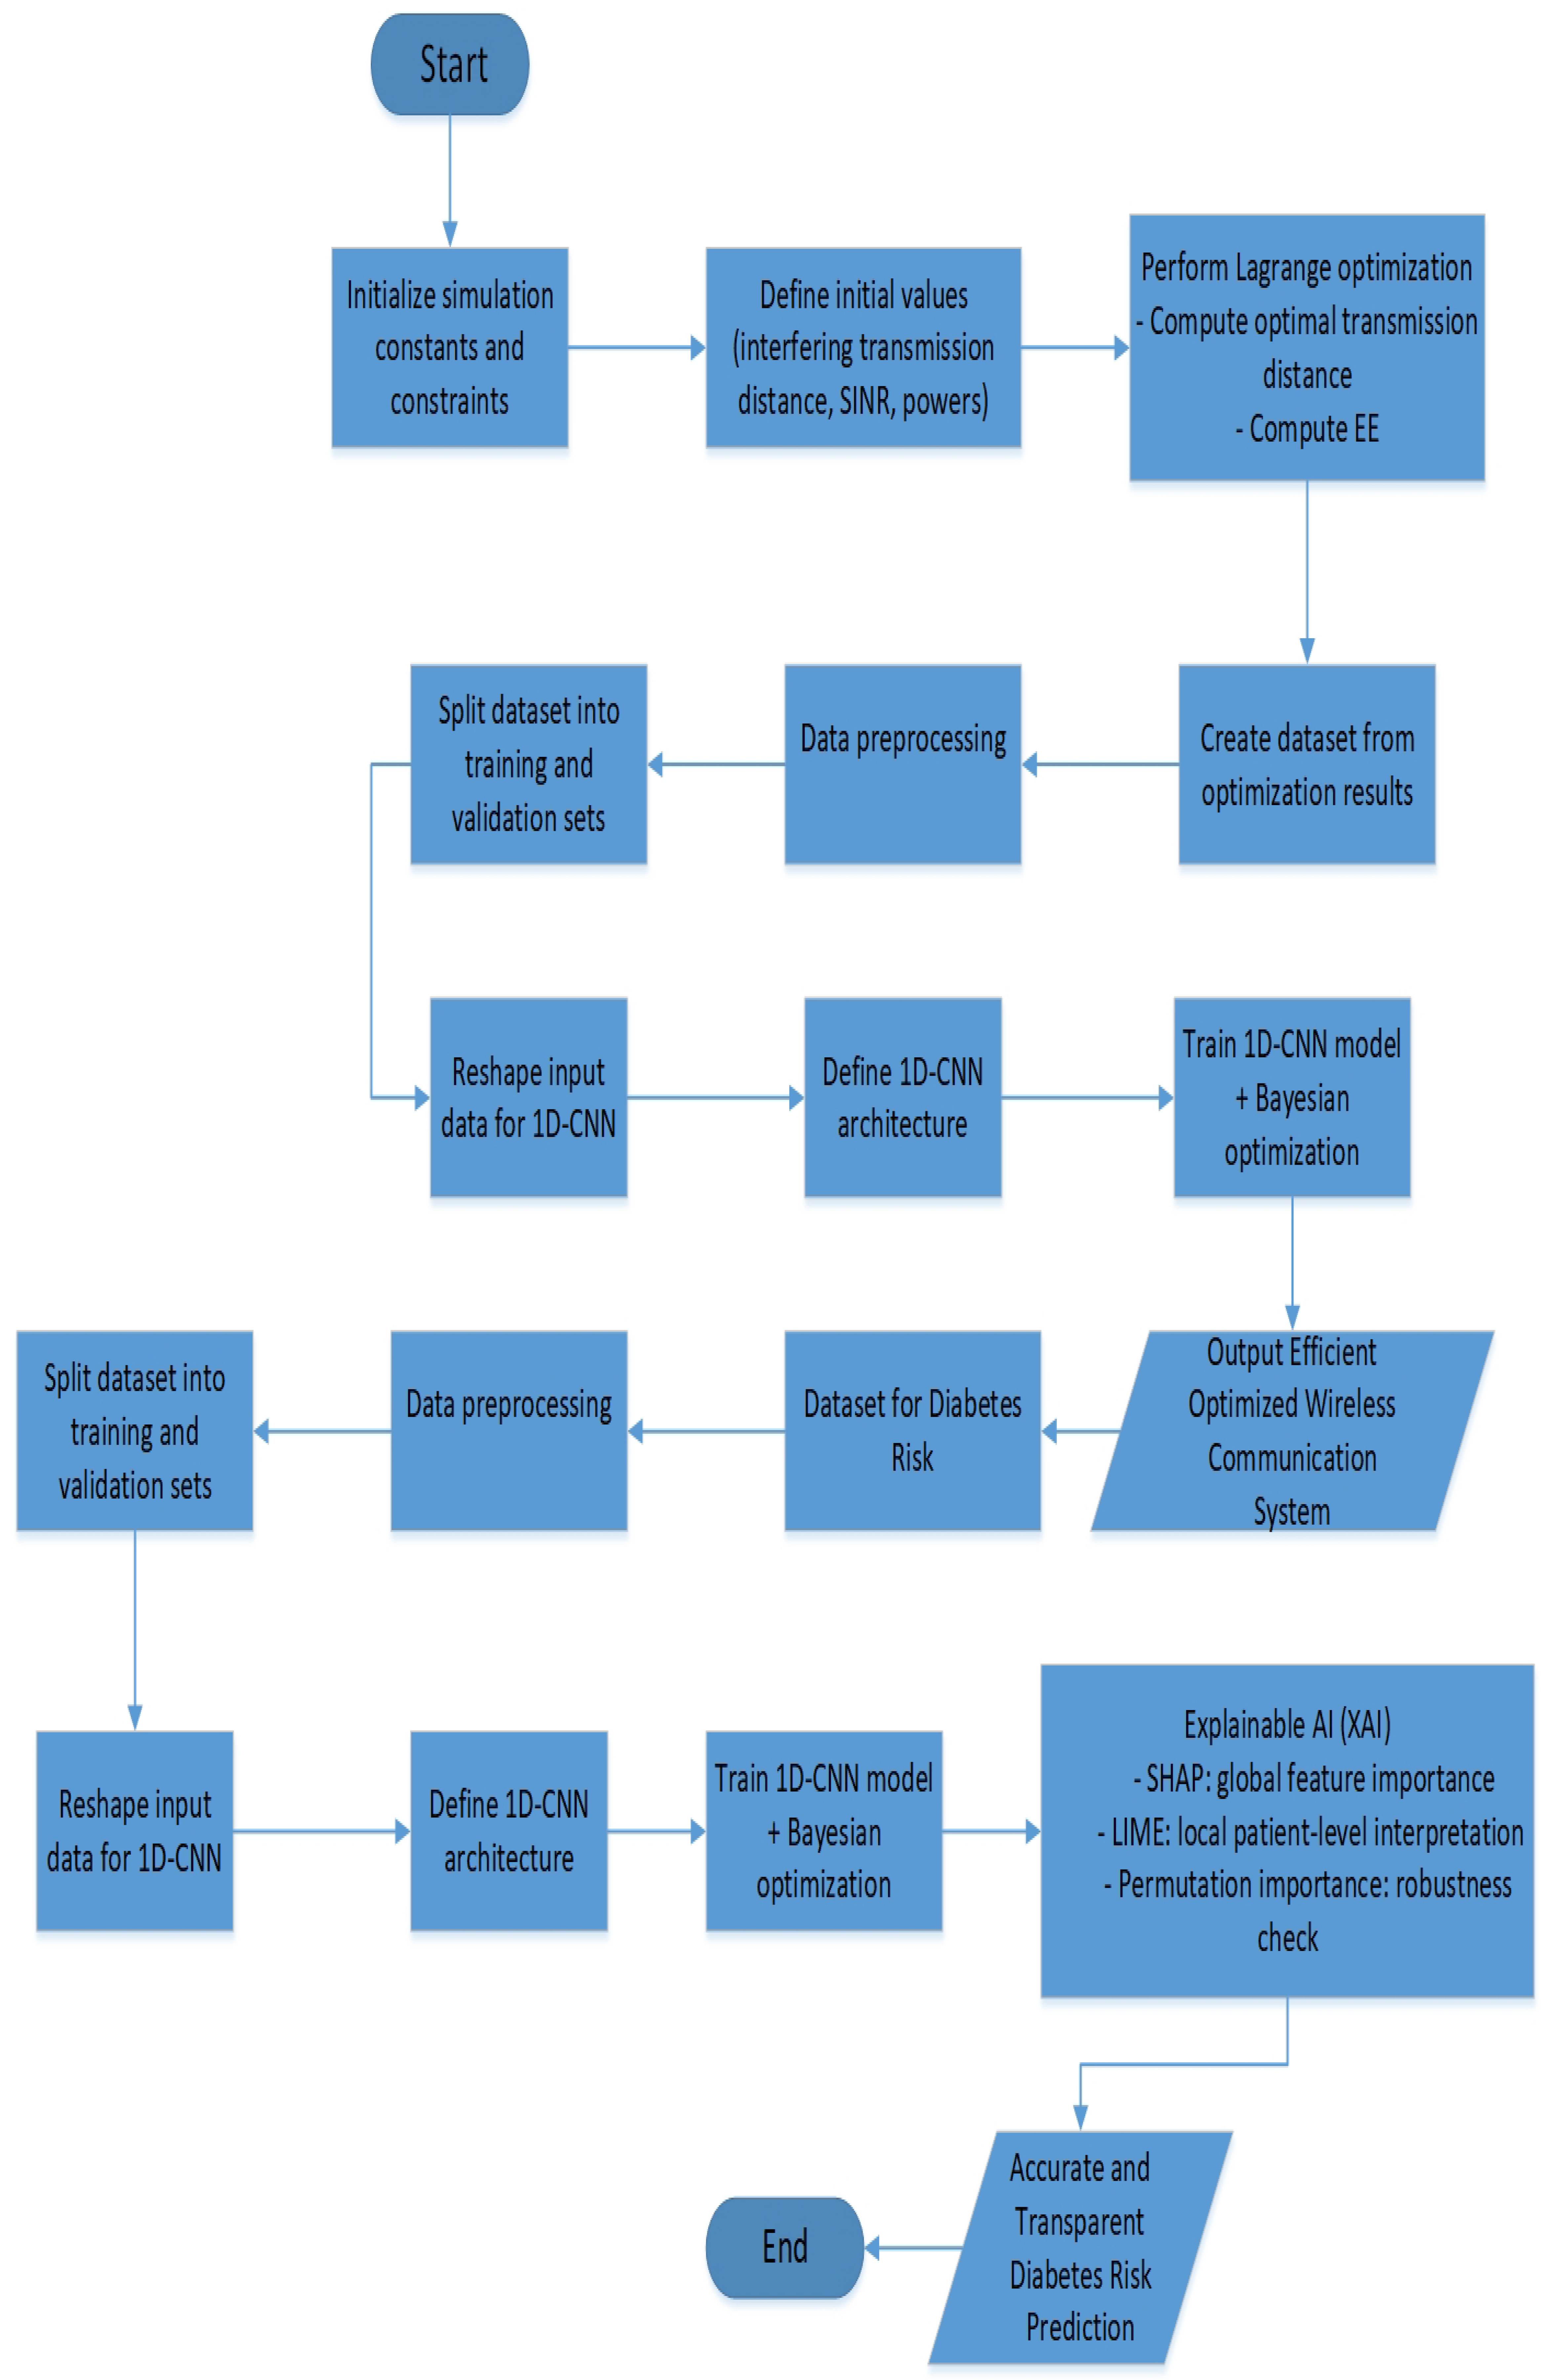
Figure 1. Integrated pipeline of the proposed framework showing Phase 1 (wireless optimization) and Phase 2 (diabetes prediction).
Ai 06 00243 g001
Figure 2. Proposed wireless communication model.
Ai 06 00243 g002
Figure 3. Correlation matrix of the proposed wireless communication model.
Ai 06 00243 g003
Figure 4. Proposed deep learning model for wireless communication system.
Ai 06 00243 g004
Figure 5. Correlation matrix of the diabetes prediction model.
Ai 06 00243 g005
Figure 6. Proposed optimum deep learning for diabetes prediction model.
Ai 06 00243 g006
Figure 7. Test and Validation loss for the proposed wireless communication model (a) training and validation Mean Absolute Errors for d WM (b) training and validation Mean Absolute Errors for EE (c) training and validation Mean Absolute Errors for the deep learning model.
Ai 06 00243 g007
Figure 8. Interference transmission distance vs. required Tx distance between WD and MC ( d WC ) (m).
Ai 06 00243 g008
Figure 9. Maximum wearable devices transmission power ( P Wmax ) (dBm) vs. required Tx distance between WD and MC ( d WC ) (a) interference distance 50 m (b) interference distance 100 m (c) interference distance 150 m (d) interference distance 200 m (e) interference distance 250 m.
Ai 06 00243 g009
Figure 10. Maximum wearable devices transmission power ( P Wmax ) (dBm) vs. system energy efficiency (EE) (bit/J) (a) interference distance 50 m (b) interference distance 100 m (c) interference distance 150 m (d) interference distance 200 m (e) interference distance 250 m.
Ai 06 00243 g010
Figure 11. Minimum required signal-to interference-plus-noise-ratio ( SINR min ) (dB) vs. required Tx distance between WD and MC ( d WC ) (a) P W 17 dBm (b) P W 23 dBm.
Ai 06 00243 g011
Figure 12. Minimum required signal-to interference-plus-noise-ratio ( SINR min ) (dB) vs. system energy efficiency (EE) (bit/J).
Ai 06 00243 g012
Figure 13. Training and validation accuracy for the proposed model: (a) optimized 1D-CNN; (b) optimized 1D-CNN with XAI.
Ai 06 00243 g013
Figure 14. Training and validation loss for the proposed model: (a) optimized 1D-CNN (b); optimized 1D-CNN with XAI SHAP.
Ai 06 00243 g014
Figure 15. Confusion matrix: (a) optimized 1D-CNN; (b) optimized 1D-CNN with XAI.
Ai 06 00243 g015
Figure 16. SHAP summary for class outputs: (a) Class 0; (b) Class 1; (c) Class 2; (d) Class 3.
Ai 06 00243 g016
Figure 17. SHAP summary for class outputs: (a) Class 4; (b) Class 5; (c) Class 6; (d) Class 7.
Ai 06 00243 g017
Figure 18. SHAP summary for class outputs: (a) Class 8; (b) Class 9; (c) Class 10; (d) Class 11; (e) Class 12.
Ai 06 00243 g018
Figure 19. Permutation feature importance.
Ai 06 00243 g019
Figure 20. LIME explanation for the proposed 1D-CNN with XAI.
Ai 06 00243 g020
Table 1. Proposed model simulation parameters.
ParameterValue
B10 Mbit/s [36]
N−174 dBm/Hz [36]
P o 0.1 W
α 4
P Wmax 17–23 dBm [37]
SINR min 20 dB
P L C M 140 + 40 log 10 ( d C M ) dB [37]
P L D M 140 + 40 log 10 ( d D M ) dB [37]
P L V M 140 + 40 log 10 ( d V M ) dB [37]
Table 2. Optimum hyperparameters of the proposed 1D-CNN model.
Layer TypeHyperparameterValue
Input LayerInput Shape(None, 33, 1)
Conv1DFilters256
Kernel Size3
Dropout0.4
Activation FunctionReLU
Batch Normalization--
ActivationActivation FunctionReLU
DenseUnits224
Activation FunctionReLU
Output Layer (Target)Units1
Adam
Learning Rate0.001
Batch Size50
Epochs200
Loss Functionsparse categorical crossentropy
Validation Split0.2
Random Forest Regressor
n_estimators100
max_depth10
random_state42
Table 3. Comparison between benchmarks and the proposed 1D-CNN model.
AlgorithmMSERMSEMAE R 2 MSERMSEMAE R 2
Parameter d WC EE
GRU0.001280.035740.02780.9920.001150.0340.026470.995
LSTM0.001540.040.0310.99140.001430.0380.031230.9945
1D-CNN0.0540.23210.19340.6660.10080.31750.26650.615
Proposed 1D-CNN0.0003720.01930.014530.9990.000130.0114040.00810.9995
Table 4. Comparison between the proposed model with benchmarks.
AlgorithmAccuracyPrecisionRecallF-1 ScoreROC-AUCMatthews Correlation Matrix
GRU0.77460.79450.77390.77270.9830.7572
LSTM0.69170.70070.69140.66710.97260.6708
1D-CNN0.84870.85770.84870.84780.99180.8370
Optimized 1D-CNN0.86780.86840.86670.86720.99410.8569
Optimized 1D-CNN with XAI0.87830.88220.87680.87730.99450.8687
Table 5. Comparison between the proposed model and benchmark classifiers.
AlgorithmAccuracyPrecisionRecallF-1 Score
Logistic Regression0.77000.63000.70000.6600
Random Forest0.75000.60000.66000.6300
KNN0.64000.49000.73000.5900
Decision Tree0.72000.79000.77000.7800
Bagging0.75000.81000.81000.8100
AdaBoost0.73000.80000.77000.7800
XGBoost0.83100.70000.84000.7600
Voting0.75000.83000.76000.7900
SVM0.77000.87000.77000.8200
Naïve Bayes0.81200.73000.71000.7200
Optimized 1D-CNN + XAI0.87830.88220.87680.8773
Disclaimer/Publisher’s Note: The statements, opinions and data contained in all publications are solely those of the individual author(s) and contributor(s) and not of MDPI and/or the editor(s). MDPI and/or the editor(s) disclaim responsibility for any injury to people or property resulting from any ideas, methods, instructions or products referred to in the content.