1. Introduction
War-gaming is a technique for exploring complex problems [
1] (p. 7), is a tool for exploring decision-making possibilities in an environment with incomplete and imperfect information [
1] (p. 3). War game participants may make decisions and take actions in a game that even they would not have anticipated, if not for the game environment [
1] (p. 3). War-gaming provides structured but intellectually liberating safe-to-fail environments to help explore what works and what does not, at relatively low cost, and is usually umpired or adjudicated [
2] (p. 5). Military wargaming was largely abandoned after World War II and was revived in the early 1970s, inspired by commercial wargames [
3] (p. 11).
A wargame is a combination of ‘game’, history and science [
3] (p. 13). It offers unique perspectives and insights that complement other forms of analysis or training on decision-making in complex contexts when faced with a dynamic opponent [
2] (p. 11). The value of the war game is that decisions are not constrained by safety, rules of engagement, real-world territorial boundaries, or training objectives. It is different from a training exercise, which uses real forces [
1] (p. 4). In a scenario-based warfare model, the outcome and sequence of events affect and are affected by the decisions made by the players [
4]. War games are a pre-conflict way to test strategy. Experiential war games provide value to game participants, while experimental war games provide value through the testing of plans [
1] (p. 2).
There has been an age-old debate about whether war games are a simulated exercise on military confrontation as realistically as possible, or merely a game to be played and enjoyed for its own sake [
5] (p. 16). NATO defines a war game as a simulation of military operation by whatever means, using specific rules, data, methods, and procedures [
2] (p. 5). Ever booming PC capabilities facilitate computer war-games for entertainment, which also drive a tide of viewing war games as a simulation, like other genres of games [
3] (p. 7).
War games can be used to inform decisions by raising questions and insights, not to provide a definitive answer [
2] (p. 12). More robust conclusions can be drawn by playing multiple games, perhaps with different scenarios and starting conditions [
2] (p. 12).
War games immerse participants in an environment with the required level of realism to improve their decision-making skills [
2] (p. 5). A simulation might provide the engine that determines outcomes, but is not the war game [
2] (p. 7). The elements of a war game include aims and objectives, an immersive gameplay scenario, data and sources to build the setting, scenario and episodes within the war game, simulation of computer-assisted, computerized or manual type to execute episodes, robust rules and procedures, adjudication to determine the outcomes, analysis reliant on data and outcomes to help understand what has happened during a war game and consolidate the benefits of war-gaming [
2] (pp. 7–8).
In this work, we design and simulate a war game between two matched fleets with equal size and equal capability. Both fleets are equipped with the same weaponry and follow the same rules of engagement. Each fleet has three strategical goal options to choose, and the tactical parameters are optimized accordingly. Multiple games are then played between the two fleets, and the simulation results are analyzed statistically to gain insights and lessons. In this section, we will review references on tactical maneuvers and episodes that are indispensable to the implementation of game simulation. Typical episodes in the proposed game scenarios include target assignment, path planning, interception, chase between pursuer(s) and evader(s), and simultaneous attack. War games between two opposing parties will be reviewed in more details in the next section of Related Works.
Tactical maneuvering between pursuers and evaders has been widely studied in the literature. In Reference [
6], a multiagent pursuit-evasion (MPE) game was developed to derive an optimal distributive control strategy for each agent. A graph-theoretic method was used to model the interaction between agents. A mini–max strategy was developed to derive robust control strategies at reduced complexity rather than solving the Hamilton–Jacobi–Isaacs (HJI) equations of Nash equilibrium. In Reference [
7], a guidance law for a pursuer to chase multiple evaders was developed. The pursuer ran after all evaders over a given period, then picked its target evader labeled the highest priority. The guidance law significantly minimized the control effort of the pursuer, but this method does not work if an interceptor is launched against the pursuer. In Reference [
8], an autonomous maneuver decision-making method for two cooperative unmanned aerial vehicles (UAVs) in air combat was proposed. The situation or threat was assessed from the real-time positions of target and UAVs. The training was conducted in a 13-dimensional air-combat state space, supported with 15 optional action commands. Both the real-time maneuver gain and the win–lose gain were included in the reward function. A hybrid autonomous maneuver decision strategy in air combat was demonstrated on dual-UAV olive formation, capable of obstacle avoidance, formation, and confrontation. In Reference [
9], a particle swarm optimization algorithm was enhanced with simulated annealing for path planning of unmanned surface vehicle (USV), but only static obstacles were considered. Chase between pursuer(s) and evader(s) is a common episode in a war game. In this work, different types of intercepting missiles are fired to chase enemy fighters and different types of attacking missiles.
Interception of a moving target is an important element of defense tactics. In Reference [
10], an integrated guidance and control (IGC) design method was proposed to guide a suicide unmanned combat air vehicle (UCAV) against a moving target during the terminal attack stage. A trajectory linearization control (TLC) and a non-linear disturbance observer (NDO) were used to control the accuracy and stability, respectively, of the system. In Reference [
11], a swarm of multi-rotor UAVs were dispatched to intercept a moving target while maintaining a predetermined formation. An enhanced three-dimensional pure-pursuit guidance law was used for controlling the trajectories of UAVs, a Kuhn–Munkres (KM) optimal matching algorithm was used to avoid redundancy or failure in searching for the look-ahead time, and a virtual force-based algorithm was used to avoid collision between UAVs. The proposed method claimed to decrease the length of UAV trajectories, facilitate the interception process, and enhance the formation integrity. In Reference [
12], an optimal midcourse trajectory planning based on a Gauss pseudo-spectral method (GPM) was proposed to intercept a hypersonic target, considering the path, terminal and physical constraints. Proportional guidance was used in the terminal phase to meet the challenges on high maneuverability of target, unpredictable trajectory, and detection error. In Reference [
13], a team of cooperative interceptors were dispatched from different intercept angles against a moving target in a linear quadratic zero-sum two-party differential game. The cooperative guidance law was used for maneuvering the interceptors to reduce the evasion probability of the target. The proposed guidance law was claimed better than the optimal-control-based cooperative guidance law when the target is unpredictable. In Reference [
14], an extended differential geometric guidance law (EDGGL) was developed for guiding a missile to intercept an arbitrarily maneuvering target without foreknowing their motions. A modified EDGGL was developed to determine the direction of missile acceleration without prior knowledge of the target acceleration. Interception of a moving target is a critical tactical action in our game scenario, including the use of missiles to bust enemy fighters or missiles, as well as close-in weapon system (CIWS) as the last defense measure of ships.
Simultaneous attack has been considered an effective tactical movement. In Reference [
15], a model-predictive-control (MPC) cooperative guidance law was developed to synchronize the states of all the missiles to achieve simultaneous attack. The salvo coordination was based on the consensus of ranges and range rates of individual missiles to the static target rather than impact time or time-to-go. In Reference [
16], an impact-time-control guidance (ITCG) law was developed for hypersonic missiles to simultaneously hit a static target. The ITCG law was applied in the vertical plane, based on the proportional navigation guidance (PNG) law. In References [
15,
16], simultaneous attack became more difficult to achieve if many missiles were used to intercept the attacking missiles, forcing them to reroute. In this work, kill probability of intercepting missile, time gap between consecutive missile launches, and transit time of CIWS engagement are potential weak points that can be broken through with salvo, which will be verified in the simulations.
Target assignment among friendly agents may significantly affect the outcome of a game. In Reference [
17], a static weapon target assignment (SWTA) problem was studied to minimize the target lethality and the total missile cost, constrained by the kill probability of missile to target. A combinatorial optimization problem was formed and solved by using an improved artificial fish swarm algorithm-improved harmony search (IAFSA-IHS). In Reference [
18], a problem of assigning several cooperative air combat units to attack different targets was studied. Each air combat unit could be assigned to sequentially attack different targets, with specific weapon for each target. A large-scale integer programming problem was formulated, with constraints on flight route, damage cost, weapon cost, and execution time. Target or task assignment is always required to initiate a tactical operation with a team of agents. In this work, target assignment is guided by the goal option, and each agent takes action based on a set of optimal tactical parameters.
Path planning is typically practiced by an agent before taking tactical operation on a target. In Reference [
19], a real-time path planning method was developed for an UAV to fly through a battlefield, under threats from multiple radar stations and radar-guided surface-to-air missiles (SAMs). A threat netting model was applied to the radars by sharing the UAV information. A model predictive control (MPC) problem was formed by integrating the threat netting model and the SAM models. The best control scheme in the state space of UAV was searched by minimizing an objective function in terms of normal acceleration, prediction horizon, distance cost, and threat cost. In Reference [
20], the impact time for an interceptor to hit a static target within the field-of-view (FOV) was controlled by using a guidance strategy of deviated pursuit (DP) in the early stage, and the terminal lateral acceleration was set to zero in the later stage based on a barrier Lyapunov function. Real-time cooperative tuning parameters of multiple interceptors were adopted to achieve simultaneous attack on the static target. In Reference [
21], an episodic memory Q-network model was applied to train a drone swarm for military confrontation. A local-state target-threat assessment method was designed by using expert knowledge, with a more efficient dynamic weight adjustment strategy applied on the episodic memory. In this work, path planning is conducted by adjusting the initial flying angles of fighters and anti-ship missiles (ASHMs). Their actual flying paths are determined by the interaction with enemy agents on their path and the engagement rules that apply. The ideal salvo on specific enemy target is not planned explicitly. By setting different initial flying angles, we will be able to observe salvo events and verify their efficacy in attacking a heavily defended enemy ship.
A practical agent makes trade-off between attacking target to gain some score and avoiding counterattack to survive. In Reference [
22], an evasive maneuver strategy was proposed for one of two opponent unmanned combat air vehicles (UCAVs) to evade high-performance beyond-visual-range (BVR) air-to-air missiles (AAMs) fired upon each other. A multi-objective optimization problem was formed in a three-level decision space of maneuver time, type, and parameters. A hierarchical multi-objective evolutionary algorithm (HMOEA) was developed, by combining air combat experience and maneuver decision optimization method, to find the Pareto-optimal strategies. Similar situations take place all the time in the games of our work. For example, a fighter tries to launch missiles against an enemy ship while avoiding missiles launched from nearby ships, or a fighter tries to launch AAM against an enemy fighter while avoiding AAMs fired from the latter.
Similar episodes in these references have been included in our game design. In reciprocal, some practical factors considered in our work may also be incorporated into these works, as summarized in
Table 1, to enhance the simulation realism. For example, the impact method and action [
17,
18,
19], evading maneuver of agents [
10,
11], kill probability [
6,
7,
19,
22], maximum flying distance of agents [
18,
19,
20], and counterattack of evader or target [
6,
7,
10,
11,
12,
13,
14,
15,
16,
17,
19,
20,
22].
2. Related Works
In this section, we will review the literature on war games between two parties of agents. There are always an attack force and a defense force in a war game. Each force is formed to achieved a strategical goal, which is implemented via constituent agents and weapons. Each agent or weapon follows a tactical plan to act and react with its own capability, constraint and rules of engagement. Different parties may pursue different goals in different settings to compete with their opponent. Asset-guarding games have been widely discussed. In Reference [
23], several teams of interceptors cooperatively protected a non-maneuvering asset by intercepting maneuverable and non-cooperative attacking missiles. A combinatorial optimization method was first applied to assign each team of interceptors to simultaneously attack one of the missiles. Then, a cooperative guidance law based on linear quadratic dynamic game theory was derived to control the interceptors to hit the missiles as far away as possible from the asset. In Reference [
24], an optimal deployment of missile defense system was proposed to maximize the survivability of the protected assets. A single shot kill probability (SSKP) model for an interceptor was developed by considering the geometry of scenario, trajectories of interceptor and missile, and error models of interceptor and radar. Then, the survivability distribution of protected assets was computed to determine an optimal deployment of the missile defense system.
Target-missile-defender (TMD) games have been widely studied since the cold-war era. In Reference [
25], a homing guidance law with control saturation was proposed for a missile to hit a moving target while avoiding a cooperative defender fired from the latter. A cooperative augmented proportional navigation (APN) was adopted by the defender to minimize its acceleration loading. A performance index based on the miss distance to the target and power consumption was proposed. An analytical solution was derived, considering control saturation and minimum power consumption, to guide the missile as close as possible to the target and to evade the defender by at least a specific miss distance. The guidance law was claimed to achieve high precision and reliability, compared to the optimal differential game guidance (ODGG) and combined minimum effort guidance (CMEG). In Reference [
26], an optimal online defender launch-time selection method in a TMD game was proposed. A missile tried to hit an evading target while the latter picked an optimal moment to launch a defender against the missile. An autonomous switched-system optimization problem was formed and a deep neutral network (DNN) was proposed to solve the problem with two launch strategies, wait-and-decide or assess-and-decide. This method could deliver accurate prediction of optimal launch-time with little computational load.
Proper task assignment plan for agents can effectively facilitate the tactical operation. In Reference [
27], a dynamic task assignment problem was studied between an attack force and a defense force of UCAVs, with each UCAV equipped with different combat platforms and weapons. The defense force cooperatively transported military supplements from its base to the battlefront, while the attack force tried to bash the defense force. A predator–prey particle swarm optimization (PP-PSO) algorithm was developed to search for a mixed Nash equilibrium as the optimal assignment scheme. In Reference [
28], an antagonistic game WTA (AGWTA) in a cooperative aerial warfare (CAW) was studied. A non-cooperative zero-sum game was played between two teams of fighters, with fire assault and electronic interference to weaken the opponents and preserve themselves. A decomposition co-evolution algorithm (DCEA)-AGWTA was proposed to derive a non-cooperative Nash equilibrium (NCNE) strategy, by dividing the problem into several subproblems and redistributing the objective functions of both teams to different subproblems. In Reference [
29], a group of fighters were assigned to attack an integrated air defense system (IADS). Payoff functions on both parties were defined in terms of value, threat, attacking probability, jamming probability, weapon consumption, and decision vectors for attacking and jamming. An improved chaotic particle swarm optimization (I-CPSO) algorithm was developed to optimize the decision vectors of both parties. Different constraints on both parties were studied, including weapon consumption, radius of non-escape zone, and jamming distance. Each fighter was assigned off-line, without improvising when the situation changed. However, the attacking and jamming probabilities were adjusted over a given interval, leading to unnecessary complexity. In practice, a single value of probability inducted from previous observations is enough to simulate the scenarios. In Reference [
30], an algorithm was proposed to simulate a within-visual-range (WVR) air combat between two opponent teams of UCAVs. Each team was divided into several groups, with cooperation only among UCAVs in the same group. Then, different groups were assigned to engage designate enemy groups, with the optimal tactics based on achieving Nash equilibrium.
In Reference [
31], force allocation in the confrontation of UAV swarms was analyzed by using Lanchester law and Nash equilibrium. The UAVs were divided into groups to fight in separate battlefields, regarded as a Colonel Blotto game. A method inspired by the double oracle algorithm was proposed to search for the best force allocation. In Reference [
32], a close formation of multiple missiles was studied in attacking a ship defended with multi-layered defense system. Such formation was intended to camouflage as a single object when observed far away and took the target ship by surprise at close range. In Reference [
33], a description framework of cooperative maritime formation was built on an event graph model, to describe the operations of formation and the evolution of battlefield dynamics. Event-driven task scheduling theory and methods were then proposed to formulate an optimal combat plan.
Denial of intrusion into a designate region is a strategical goal in many war games. In Reference [
34], a state-feedback saddle-point strategy was developed on a pursuit-evasion game (PEG), with two defenders trying to deny a designate area from being intruded by a faster invader. In Reference [
35], a reach-avoid game between an attacker and two defenders bound within a rectangular domain was studied. The optimal strategies for both parties were derived under different conditions that the attacker moved in an attacker dominance region (ADR), a defender dominance region (DDR), and a barrier, respectively. In Reference [
36], a high-dimensional subspace guarding game was studied, with an attacker trying to enter a target subspace protected by two cooperative faster defenders. An attack subspace (AS) method was proposed to form optimal strategies for both defenders and attacker to reach a saddle-point equilibrium, in favor of the defenders. In Reference [
37], a multi-player reach-avoid differential game in 3D space was studied, with two cooperative pursuers protecting a target by capturing an evader moving at the same speed. A barrier surface that enclosed a winning subspace was computed, and the saddle-point strategies for agents were derived by using an Isaacs’ method and a Hamilton–Jacobi–Isaacs (HJI) equation. In Reference [
38], a planar multiagent reach-avoid game was studied, with an evader targeting at a fixed point while avoiding capture by multiple pursuers. A non-linear state feedback strategy based on a risk metric was developed for the evader to reach the target, against pursuers moving under a semi-cooperative strategy. The strategy can be switched by taking different control laws in different state-subspaces.
In Reference [
39], a non-zero-sum Hostility Game with four players was studied, in which blue players intended to navigate freely under the obstruction of red players. A parallel algorithm was proposed to form strategies of reaching Nash equilibrium between blue players and red players. In Reference [
40], a coastal defense problem of deploying unmanned surface vehicle (USV) to intercept enemy targets entering a warning area was studied. The defense objective function included energy consumption for sailing, contingent cost upon opponent capabilities, and reward of successful interception. A hierarchically distributed multi-agent defense system was proposed on a central and distributed system and cooperative agents, which improved the decision-making efficiency and interception rate over conventional centralized architecture.
Missile combat between battleships in navel warfare has been studied. In Reference [
41], a salvo model was developed for exploratory analysis on warship capability and comparison between two naval forces in a naval salvo warfare. The warship capability was composed of combat power and staying power, where the former included the number of force units, number of missiles, scouting effectiveness, training deficiency, enemy distraction chaff, enemy alertness, enemy seduction chaff, and enemy evasion. The percentage of out-of-action units between two forces was compared, without prior knowledge of how and where the warships would fight. The staying power was valuable because a force with weaker combat power but stronger staying power might win the game in the end. In Reference [
42], rescheduling of target assignment was made for ship-to-air missiles (SAMs) launched from a naval task group (TG) to intercept incoming air-to-ship missiles (ASMs). The combat condition may suddenly change due to, for example, destruction of an ASM, breakdown of a SAM system, or an ASM pop out of nowhere, hence rescheduling of SAMs should be made at regular intervals after the initial scheduling. A biobjective mathematical model was built to efficiently maximize the probability of successful defense and minimize the difference between rescheduling and the initial scheduling. Small-size problem was solved by using an augmented
-constraint method and large-size problem was solved by running two fast heuristics procedures to obtain non-dominated solutions.
In Reference [
43], a multi-ship cooperative air defense model against incoming missiles was proposed, which considered missile launch rate, launch direction, flight speed, as well as ship interception rate, interception range, number of fire units. The cooperation among ships was modeled via task assignment. The defense system was designed and analyzed with analytical models, and the penetration probability was estimated with the queuing theory. In Reference [
44], fleet modularity was evaluated via a game theoretical model of the competition between autonomous fleets in an attacker–defender game. Heuristic operational strategies were obtained through fitting a decision tree on simulation results of an intelligent agent-based model. A multi-stage game theoretical model was also built to identify the Nash equilibrium strategy based on military resources and the outcomes of past decisions. In Reference [
45], a framework of consulting air combat of cooperative UAV fleet was studied by using matrix game theory, negotiating theory, and U-solution. The best paring of joint operations between own agents and enemy agents was computed, considering the optimal tactics and situational assessment. NVIDIA graphics processor was used to improve the computing efficiency in solving the equations of motion, consultation, situational assessment, and searching for optimal strategies. In Reference [
46], offense/defense confrontation between two UAV swarms of the same size and capability on an open sea was studied. The UAVs aimed to attack the enemy aircraft carrier, while protecting own aircraft carrier from enemy UAVs. Each UAV made independent decisions based on the behavioral rules, detection radius, and enemy position. A distributed auction-based algorithm was used to guide the UAVs in making their real-time decisions with limited communication capability. The algorithm parameters were optimized to facilitate target allocation and elimination.
There are other relevant issues in the literature. In Reference [
47], a maneuvering plan for beyond-visual-range (BVR) engagement was developed, with two opponent aircrafts taking actions of pursuit, head-on attack, or flee. The goal was to prevent an aircraft from entering the missile attack zone of the opponent, reduce meaningless maneuver of itself, and lure the opponent to its missile attack zone. A long short-term memory-deep Q network (LSTM-DQN) algorithm was proposed for situational awareness and action decision-making. A reward function was defined to account for the threat of enemy missile, reduction in meaningless maneuver, and the boundary of battlefield. In Reference [
48], a mean-field multi-agent reinforcement learning (MARL) method was developed, by modeling the interaction among a large number of agents as a single agent playing against a multi-agent system. A mean-field Q-learning algorithm and a mean-field actor-critic algorithm were applied to a mixed cooperative–competitive battle game, with two teams of agents fighting each other by using different reinforcement learning algorithms. The goal of each team was to collaborate with the allied agents to neutralize as many opponents as possible. In Reference [
49], a multi-UAV cooperative air combat was studied, with a team of UAVs against their targets. The maneuver decision model of each UAV was built on an actor-critic bidirectional recurrent neural network (BRNN), taking all the UAV states concurrently to achieve cooperation, and the reward value was computed with the results in target assignment and air combat situation assessment.
In Reference [
50], an adversarial intelligence and decision-making (RAID) program of the Defense Advanced Research Projects Agency (DARPA) was developed to estimate the enemy’s movements, positions, actions, goals, and deceptions in urban battles. Approximate game-theoretic and deception-sensitive algorithms were used to acquire real-time estimation for the commander to execute and modify tactical operations more effectively. In Reference [
51], an intelligent agent-based model was proposed to optimize fleets of modular military vehicles in order to meet the dynamic demands on real-time response to adversarial actions. A game was played between a modular intelligent fleet and a conventional intelligent fleet, in which the former predicted its adversary’s actions from historical data and optimized its own dispatch decision. In Reference [
52], a partially observable asynchronous multi-agent cooperation challenge (POAC) was built for testing the performance of different multi-agent reinforcement learning (MARL) algorithms in a war game between two armies. Each army was composed of heterogeneous agents, each acting on observations and asynchronously cooperating with other agents. The POAC could be configured to meet various requirements such as a human–AI model and a self-play model.
In Reference [
53], a multi-agent deep deterministic policy gradient (MADDPG) algorithm was built to improve the capability of an UAV swarm in confronting another swarm. A rule-coupled method was proposed to effectively increase the winning rate and reduce the required action time. In Reference [
54], a multi-agent deep reinforcement learning (MADRL) method was used to conduct UAV swarm confrontation. Two non-cooperative game models based on MADRL were built to analyze the dynamic game process and acquire the Nash equilibrium. In Reference [
55], confrontation between two UAV swarms in a territory-defense scenario was studied, in which the UAVs maneuvered by searching for the Nash equilibrium from the measured cost functions without explicit expressions. Each UAV followed second-order fully-actuated dynamics and focused on minimizing the coalition cost.
In Reference [
56], a real-time strategy (RTS) was applied on a bot to navigate an unfamiliar environment with a multi-agent potential field, in order to search and attack enemies. In Reference [
57], a hierarchical multi-agent reinforcement learning framework was proposed to train an AI model in a traditional wargame played on a hexagon grid. A high-level network was used for cooperative agent assignment, and a low-level network was used for path planning. A grouped self-play approach was proposed to enhance the AI model in contending various enemies. In Reference [
58], a distributed interaction campaign model (DICM) was proposed for campaign analysis and asset allocation of geographically distributed naval and air forces. The model accounted for the uncertainty of enemy plan, the factors that boost the force and the factors that disrupt enemy command, control, and surveillance. In Reference [
59], a stochastic diffusion model for two opponent forces in an air combat was proposed to study the trade-off between logistics system and combat success, including factors like lethality, endurance, non-linear effect of logistics, and uncertainty of measurement. In Reference [
60], a high-fidelity simulator was used to optimize the tactical formation of autonomous UAVs in a BVR combat against the other UAV team, considering uncertainties, such as firing range and position error of the enemy.
Similar settings in these references have been included in our work. In reciprocal, some practical factors considered in our work may also be incorporated into these works, as summarized in
Table 2, to enhance the simulation realism. For example, the impact method and action [
28,
29,
41,
42], evading maneuver of agents [
26,
27,
48], kill probability [
23,
30,
35,
36,
41,
48,
49], and maximum flying distance of agents [
30,
38,
48]. The boundary of battlefield in [
35,
47] can be removed, the number of agents in [
25,
26,
34,
35,
36,
37,
38] can be increased, and the optimization scheme in [
23,
24,
26,
38,
47] can be extended to both parties.
In this work, a war game between two matched fleets of equal size and equal capability is developed and played by simulations. The results are analyzed to gain some insights on the risks of different strategical options. The rules of engagement and tactical maneuvers of agents are delineated to set up a credible game environment. The constraint of matched fleets maybe too tight, but the game scenarios and simulation results are already complicated and enlightening. This work will focus on the comparison of goal options and the optimization of tactical parameters to achieve the goal.
To preserve the complexity of the game, three types of vessels (carrier vessel, guided missile cruiser, guided-missile destroyer), four types of missiles (air-to-air, air-to-ship, ship-to-ship, ship-to-air) are included. The numbers of fighters and missiles are large enough to manifest the complicated game scenario, yet not too large to muddle adjudication and lessons that can be learned. The characteristics of the agents are comparable to those in the literature to make the games close to realism, including weaponry parameters, route planning, evading maneuver, and maximum flying distance of fighters and missiles. The imperfect kill probability of missiles against different targets is critical to cast uncertainty in each individual game. With all the stages prepared, we will be able to play games between these two matched fleets, each can pick one out of three distinct goal options. Each fleet will then optimize its tactical parameters, including take-off time delay of fighters, launch time delay of anti-ship missiles (ASHMs), and initial flying directions of fighters and ASHMs. The optimal parameters depend not only the goal option of own fleet, but also that of the opponent fleet. Hence, a particle-pair swarm optimization (PSO) algorithm is proposed to concurrently search the optimal tactical parameters for both fleets. The optimal parameters derived with the PSO algorithm are then used to play multiple games, and the outcomes of all games are analyzed in terms of the payoff distribution and the cumulative distribution of impact scores on carrier vessel (CV), guided missile cruiser (CG), guided-missile destroyer (DDG), and lost fighters. Some interesting outlier games are further inspected to gain more understanding of the tactical operations.
The war game proposed in this work is aimed to mimic real-life wars to some extents, hence appear complex at the first glance. However, all the games are played by the rules, the statistics of multiple games are compact for assessment and some insights could be learned. The most complex and confusing parts maybe the game rules, which are inevitable for the following reasons. Firstly, we try to incorporate more practical factors, such as evasion, flying distance, kill probability, goal options, take-off/landing time gap, missile launching time gap, diverse attack orientation and method, alert radius, attack range, counterattack, impact score, cost, and so on. The simulated scenarios become diverse as many practical factors are included. Secondly, we try to design a matched game, without dominant factors or overwhelming agents, in order to observe subtle nuances that may affect the outcome of a game.
The rest of this work is organized as follows. All the game rules are presented in
Section 3, the principle and implementation scheme of the proposed P
SO algorithm are elaborated in
Section 4. Since the game scenarios are complicated, different goal options are carried out by different sets of rules, and the game rules in different stages of a game and the engagement rules for different vessels are prepared in separate subsections for clarity of presentation.
We propose the P
SO algorithm in
Section 4 to optimize the objective function specified in
Section 3.1 via playing multiple games, following the rules specified in
Section 3.3–
Section 3.7. The optimal tactical operations thus obtained are used to play another set of games, and the payoff specified in
Section 3.2 is computed at the end of each game for statistical analysis.
All six possible contests between goal options are simulated and analyzed in
Section 5, summarized and compared in
Section 6. A few interesting outlier cases are further inspected in
Section 7, more retrospective discussions are presented in
Section 8, and some conclusions are drawn in
Section 9.
Table 3 lists all the symbols used in this work, in an alphabetical order, for the convenience of the readers.
3. Game Rules
The problem in this work is to evaluate possible risk of contest between two matched fleets, each is allowed to choose among three goal options, followed by optimizing the tactical parameters to fulfill the chosen goal option. The tactical parameters include take-off time delay of fighters, launch time delay of anti-ship missiles (ASHMs) and initial flying directions of fighters and ASHMs. The outcome of a game is boiled down to payoffs for both fleets. The commanding officer will pick a goal option, and the payoffs summarized from the war games suggest potential risk to take. The probability distribution of payoffs reveals more nuances for an experienced commanding officer to speculate.
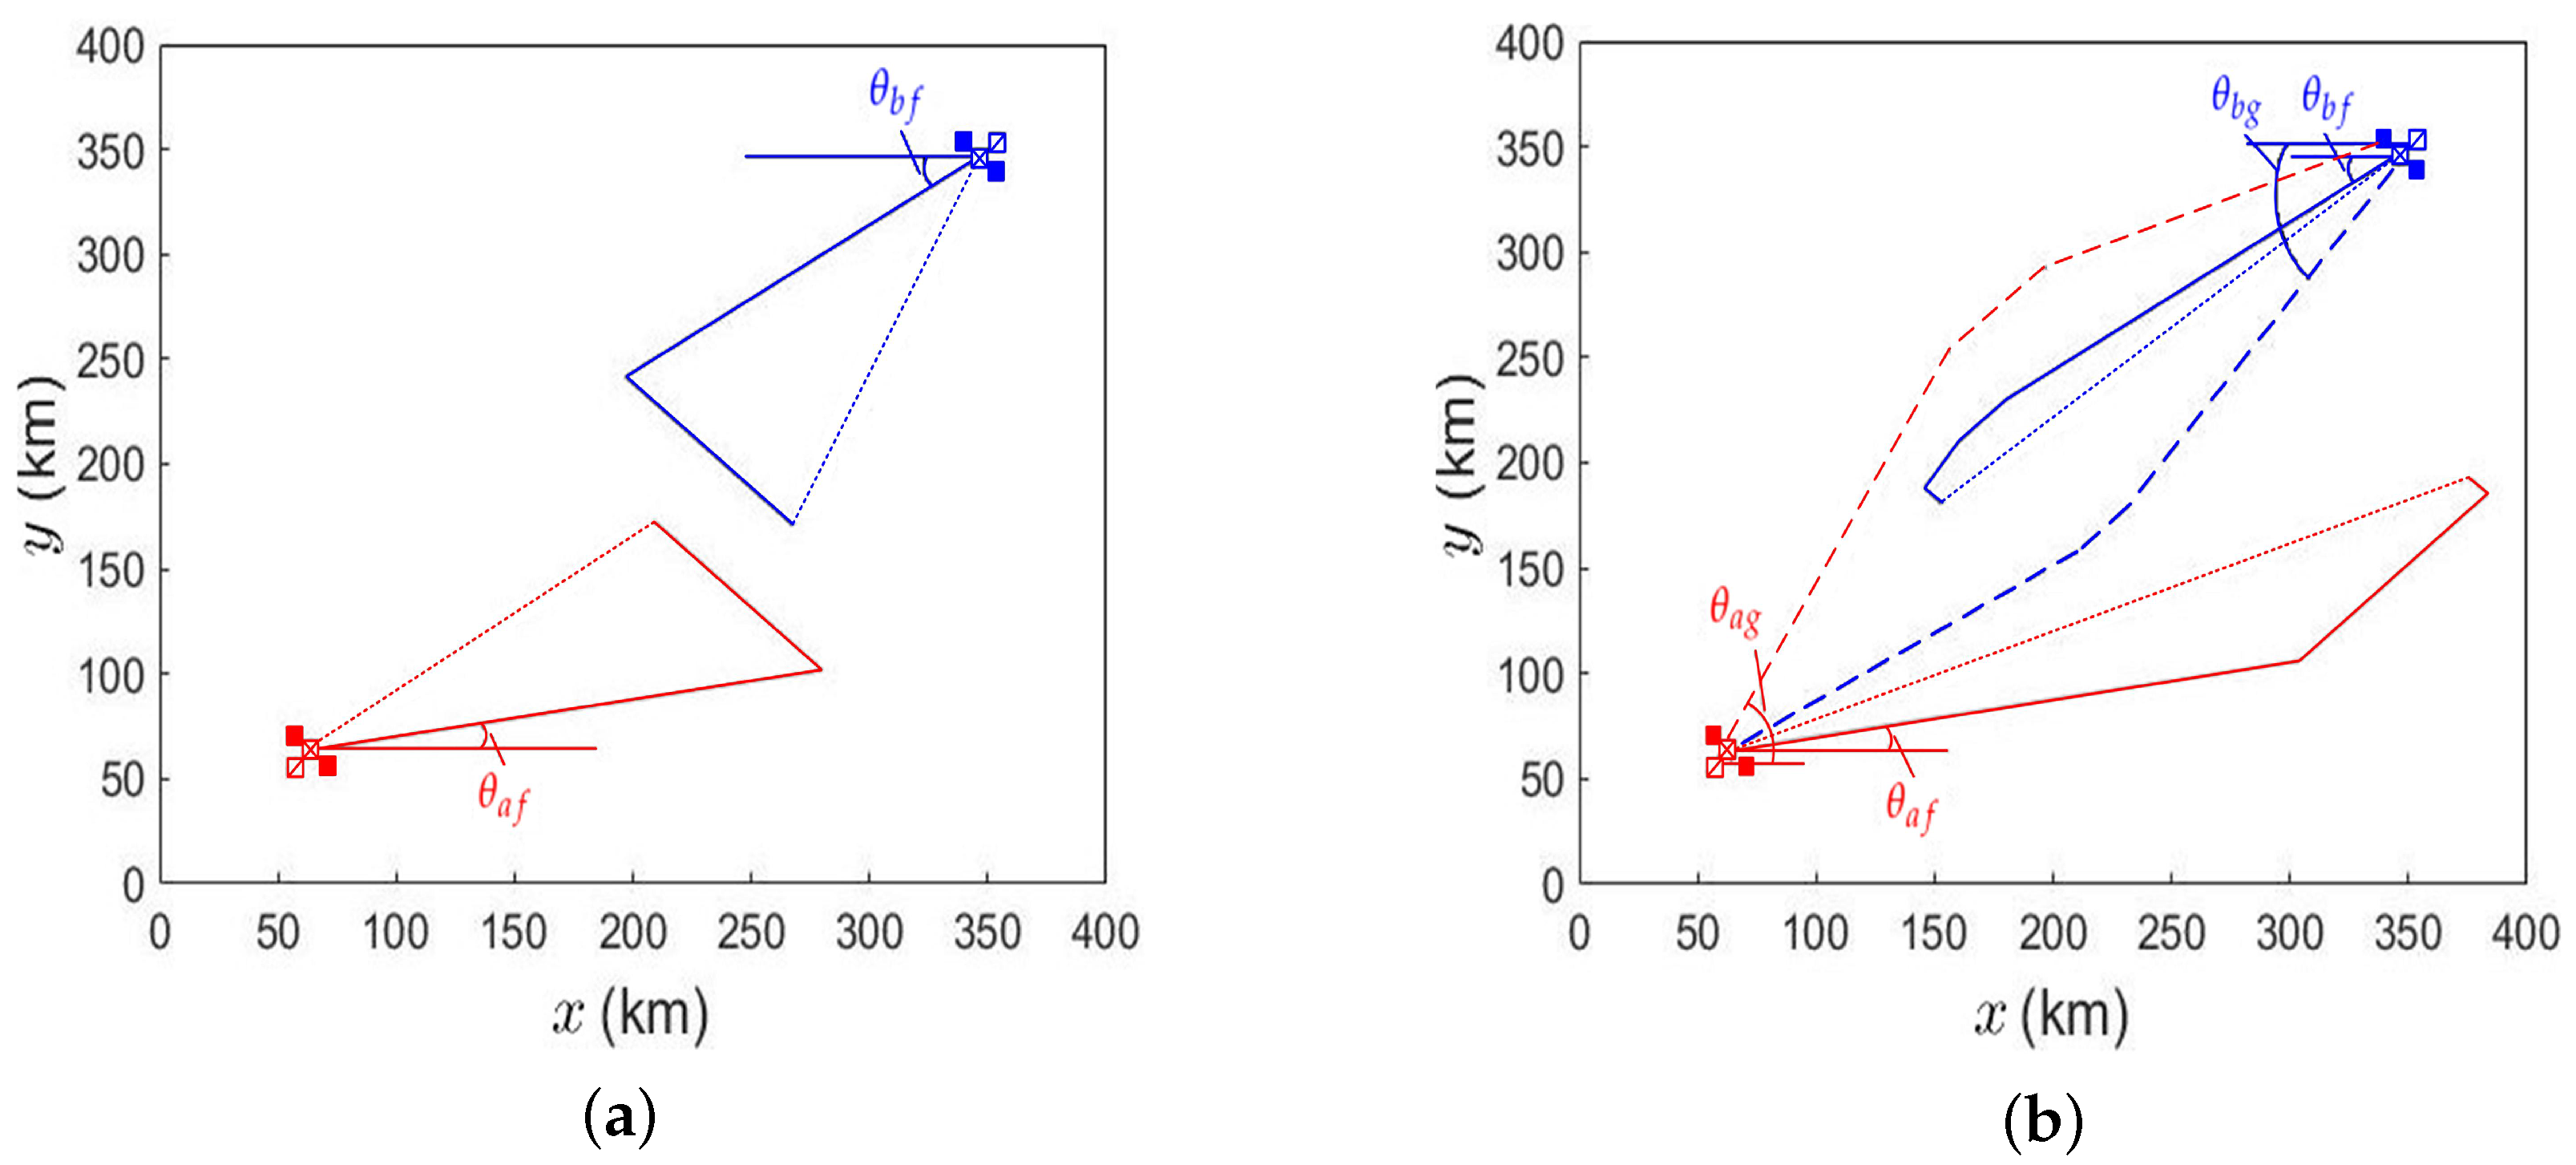
Figure 1 shows examples of game scenario between two fleets, with defense option and attack option, respectively. Each fleet is composed of a carrier vessel (CV), a guided missile cruiser (CG) and two guided missile destroyers (DDGs). The distance between two CVs is 400 km. Each DDG is 10 km beside the CV and the CG is 10 km behind the CV.
Each CV carries 10 fighters, each fighter can carry air-to-ship missiles (ASMs) and air-to-air missiles (AAMs). Note that ASM and ASHM are anti-ship missiles launched from fighters and CG, respectively. The ASMs are used to attack enemy vessels and the AAMs are used to intercept enemy fighters, AAMs and ship-to-air missiles (SAMs). Each fighter carries 4 AAMs under a defense option, or 2 ASMs plus 2 AAMs under an attack option. The speeds of fighter, ASM and AAM are
,
, and
, respectively, and their maximum flying distances are
,
and
, respectively. Each fighter must return to the CV before running out of fuel. The minimum time gap between consecutive take-offs or landings of fighters is
. A CG carries 20 ASHMs to attack enemy vessels. The speed of ASHM is
and its maximum flying distance is
. Each DDG carries 30 SAMs to intercept enemy fighters, ASHMs, ASMs, and SAMs. The speed of SAM is
and its maximum flying distance is
. The minimum time gap between missile launches from the same fighter or vessel is
. The symbols, as listed in
Table 4,
Table 5,
Table 6,
Table 7 and
Table 8, are chosen to comply with the features of the indicated parameters.
Before a game is played, each fleet chooses a goal option, based on which to search for the optimal tactical parameters, including take-off time delay of fighters, launch time delay of ASHMs, and initial flying directions of fighters and ASHMs, in order to achieve the highest possible payoff. Then, a game is played and the outcomes on both fleets are recorded for analysis.
3.1. Goal Options and Objective Functions
Three goal options are considered in this work. A defensive goal option 1 aims to minimize the enemy threat by shooting down the intruding fighters and missiles. Option 2 aims to wreck havoc on enemy CV to significantly cripple the anti-ship threat from enemy fighters. Option 3 aims to paralyze the enemy fleet, including its anti-ship and defending capabilities.
Each option is carried out with an optimal set of tactical parameters acquired by maximizing a corresponding objective function defined as
Option 1 aims to deter enemy threat by shooting down the intruding fighters. Hence, the objective function of option 1 is set to the value accrued from hitting enemy fighters minus the value lost in the hit of own ships. The weighting coefficients on number of enemy fighters lost, total impact scores on own CV, total impact scores on own CG and total impact scores on own DDG are proportional to the cost of one fighter or the construction cost of ships listed in
Table 4,
Table 5 and
Table 6. Option 2 aims to strike only the enemy CV, hence the objective function is proportional to the number of hits on the enemy CV. Option 3 aims to inflict wreck on all enemy ships, hence the objective function is a sum over hits on all enemy ships, with the weighting coefficients on total impact scores on enemy CV, total impact scores on enemy CG, and total impact scores on enemy DDG proportional to their respective construction cost. Intangible values of fighters or ships are not considered in setting the weighting coefficients. The optimal tactical parameters, obtained by applying the P
SO algorithm, are used to play multiple games and derive the statistics of payoff on both fleets.
3.2. Payoff
At the end of each game, payoff is counted on each fleet as
where the total impact scores on own CV is set to 10 if it is greater than 10 (CV is sunk), the total impact scores on own CG is set to 8 if it is greater than 8 (CG is sunk), and the total impact scores on own DDG is set to 8 if it is greater than 8 (DDG is sunk). The weighting coefficients are proportional to the construction cost of the assets listed in
Table 4,
Table 5 and
Table 6. The ammunition cost of CIWS is neglected.
3.3. Rules on CV and Fighters
Fighters take off from CV to engage enemy CV, CG, DDGs, and fighters. If option 1 is taken, all the fighters will try to intercept enemy fighters and missiles. If option 2 is taken, all the fighters will attack the enemy CV. If option 3 is taken, the enemy CV, CG, DDG 1, and DDG 2 will be targeted by 3, 3, 2, and 2 fighters, respectively. The fighters take off in a repeated sequence to target DDG 1, DDG 2, CG, and CV, until all the fighters are launched.
Figure 1a shows an example of game scenario with both fleets taking defense option 1. A fighter from CV-A flies north-east at an initial angle
measured from the east. It flies 90% of the path from CV-A to the middle line between the two CVs, turns parallel to the middle line and flies for 100 km, then returns to CV-A along a straight path. A fighter in CV-B follows the same rule except its initial position is CV-B and its initial angle is
measured from the west.
Figure 1b shows an example of game scenario with both fleets taking attack option 2 or 3. A fighter from CV-A flies north-east at an initial angle
measured from the east. It reaches the middle line first, turns in the direction parallel to the line connecting the two CVs and flies 80% of the distance measured from its position on the middle line to the center point between two CVs, then turns straight towards CV-B. A fighter in CV-B follows the same rule except its initial position is CV-B and its initial angle is
measured from the west. When the distance between a fighter and the enemy CV is shorter than 170 km, the fighter fires its first ASM that flies along a straight path to its designate target. Meanwhile, the fighter turns and flies parallel to the middle line until all the ASMs are fired, then returns to its CV along a straight path.
If an enemy SAM or AAM, labeled as
Q, flies within the alert radius
of the fighter, sited at
, with anticipated intercept point at
, then the fighter fires an AAM against it. At the same time, the velocity vector of the fighter is adjusted to
where
is the fighter speed,
is the fighter maneuverability. The AAM tries to intercept the enemy missile at an intercept point or tailgates the enemy missile if no intercept point is available.
Under option 1, when a fighter detects an enemy fighter within km and an intercept point is available, it will fire an AAM to attack the enemy fighter. If the intercept point is lost track of during pursuit, the AAM will tailgate the targeted enemy fighter. Each enemy fighter can be marked by at most two AAMs, and each enemy SAM and AAM can be marked by only one AAM. If a fighter finds itself being targeted by an enemy missile which is not marked by any AAM, it will fire an AAM against it. When a fighter successfully evades enemy missile, which means no enemy missile within range and no intercept point is found, the fighter will return to its own CV along a straight path.
Under option 2 or 3, when a fighter detects any enemy fighter within km, it will fire an AAM to intercept it if an intercept point is found. If the intercept point is lost track of during pursuit, the AAM will tailgate the marked enemy fighter. Each enemy fighter, SAM and AAM can be marked by only one AAM. If a fighter finds itself being targeted by enemy missile which is not marked by any AAM, it will fire an AAM against it. When a fighter successfully evades enemy missile, which means no enemy missile within range and no intercept point is found, the fighter will fly in a straight path towards the enemy CV if it is farther than 170 km away, or fly parallel to the middle line to fire ASMs if the enemy CV is within 170 km of range.
An ASM on its way to the designate vessel regularly checks if any SAM is fired to intercept itself. If an ASM, sited at
detects an enemy SAM at
Q within an alert radius
and the intercept point
lies between the ASM and its designate vessel, then the ASM will adjust its velocity vector to
where
is the ASM speed,
is the ASM maneuverability. When an ASM successfully evades enemy SAM or no intercept point lies ahead, it will approach its target vessel along a straight path. When a fighter uses up all the ASMs, it will return to its own CV along a straight path. If a fighter finds itself being targeted by enemy missile on the return path, it will fire AAM against it.
Under any circumstance, if it takes longer than for a fighter to fly straight back to its own CV, where is the remaining flight time of the fighter, it will return to its own CV along a straight path. When a fighter finds itself being targeted by enemy missile on its return path, it will fire an AAM against it and remain its original course. When a fighter returns to its own CV earlier than the landing time of the last fighter plus , it will wait around CV for its turn to land.
3.4. Rules on DDG
Under any circumstance, any enemy fighter, ASHM, ASM, or SAM within the alert radius
of a DDG will trigger the latter to fire SAM for interception. Each enemy fighter, ASHM, ASM, and SAM can be marked by only one SAM. If a SAM, sited at
finds an enemy missile (AAM or SAM) at
Q is fired to intercept itself, which means the enemy missile is within the alert radius
of the SAM with intercept point at
, the SAM will adjust its velocity vector to
where
is the speed of SAM,
is the maneuverability of SAM.
3.5. Rules on CG
A CG is equipped with ASHMs to attack enemy CV, CG, and DDGs. Under option 1, no ASHM will be fired. Under option 2, all the ASHMs will be fired against the enemy CV. Under option 3, the enemy CV, CG, DDG 1, and DDG 2 will be targeted with 6, 6, 4, and 4 ASHMs, respectively. The launch sequence is repeated as two ASHMs for enemy DDG 1, two for enemy DDG 2, two for enemy CG, two for enemy CV, until all the ASHMs are fired. The flying path of an ASHM is similar to that of a fighter, as shown in
Figure 1b. It reaches the middle line first, turns in parallel to the line connecting the two CVs and flies 80% of the distance measured from its position on the middle line to the center point between two CVs, then flies straight towards the designate vessel.
If an ASHM at
find itself marked by an enemy SAM at
Q within the alert radius
of the ASHM, with intercept point at
, the ASHM will adjust its velocity vector to
where
is the speed of ASHM,
is the maneuverability of ASHM. When the ASHM evades enemy SAM, it will fly straight to its target vessel.
3.6. Rules on CIWS
Each vessel is equipped with a CIWS to defend against enemy missiles at close range. If an enemy missile flies within the maximum firing range
of a vessel, its CIWS will engage the former. The CIWS can mark only one target at a time and the ammunition can last to the end of the game. The kill probability of CIWS is modeled as
where
t is the progress time,
is the firing period, and
is the time to open fire. At
, the CIWS halts for a period of
to prepare its next engagement. Then, the kill probability of (
9) is resumed.
Table 7 lists the parameters of CIWS and
Table 8 lists other parameters used in the simulations.
3.7. Other Rules
Since the vessels move much slower than fighters or missiles, the vessels are approximated as static objects during the game period of about 3600 s. If a missile, sited at
, moving at speed
, tries to intercept a target, sited at
, moving at velocity vector
, the anticipated intercept time
is computed by solving
and the anticipated intercept point is at
.
A fighter or a missile takes its first priority to react to the nearest enemy missile with the anticipated intercept point falling within the alert radius of the former. Each enemy fighter or enemy missile can not be marked by more than one missile of the same kind, except an enemy fighter under option 1. If a missile or fighter is hit by one of the two intercept missiles, the other one will turn to pursue the nearest enemy fighter or missile of the same kind. If no other enemy fighter or missile is nearby, the intercept missile keeps flying until fuel is burned out.
Impact scores of 1 and 2 are gained if an ASM and an ASHM, respectively, hits a vessel. If the score on a CV is higher than 4, it can no longer launch fighters and the return fighters will dive to the water. If the score on a CV is higher than 9, the CV is sunk, bringing the carried missiles and fighters to the bottom. If the score on a CG or DDG is higher than 4, it can no longer launch missiles. If the score on a CG or DDG is higher than 7, the CG or DDG is sunk, bringing all the carried missiles to the bottom.
4. Particle-Pair Swarm Optimization
The PSO algorithm proposed in this work is designed to search for the optimal solution through a bunch of particle pairs. Each particle pair is consisted of particles A and B, each having its position and velocity. The position of particle A(B) represents a candidate set of tactical parameters for fleet A(B). In each iteration, the velocity of each particle is updated first, which is then used to update the particle position. The velocity is updated in terms of the current particle position, particle’s best position and the global best position (among all the particle positions). By doing so, the updated particle position tends to be closer the particle’s best position (local optimum) or the global best position (global optimum).
After updating the position of a particle pair, a game is played to acquire an objective function for each particle, which is then used to update the particle’s best position and the global best position. The other particle pairs also update their positions, play a game and acquire an objective function to update their best position and the global best position.
Several iterations are taken to approach the global optimum. The performance of each particle pair keeps improving iteration by iteration. Finally, the global best position is mapped to the optimal tactical parameters of each fleet to play another set of games, of which the results are analyzed to gain some insights.
The parameters of each fleet include the take-off time delay of each fighter, the launch time delay of each ASHM and the initial flying angles of fighters and ASHMs, respectively. Denote the particle position of fleet A in the
nth particle pair as
where
is the take-off time delay of the
mth fighter,
is the launch time delay of the
ℓth ASHM,
is the initial flying angle of fighters, and
is the initial flying angle of ASHMs. The particle position
of fleet B is defined in the same manner as (
11), with subscript
a changed to
b.
A swarm of particle pairs are generated, each with random initial position and velocity. The PSO algorithm is applied to update the particle positions, based on the goal options chosen by both fleets and the associated objective functions. The best positions of the nth particle pair are denoted as (, ), and the global best positions of all the particle pairs are denoted as (, ).
In each iteration of the P
SO algorithm, the velocity of the
nth particle for fleet A is updated first as
where
and
are the previous particle position and velocity, respectively,
is the weighting factor on particle velocity,
and
are acceleration constants,
and
are random variables of uniform distribution over
. Its position is updated as
The take-off time of fighters and launch time of ASHMs from fleet A are then set to
Similarly, the velocity of the
nth particle for fleet B is updated as
where
and
are acceleration constants,
and
are random variables of uniform distribution over
. Its position is updated as
The take-off time of fighters and launch time of ASHMs from fleet B are then set to
Then, a game is played with the updated particle positions
and
. Both fleets operate according to the rules described in the last section. At the end of the game, each fleet counts its objective function defined in (
1), (
2) or (
3) to update
,
,
and
. The procedure is repeated for all the particle-pairs to complete one iteration. The P
SO algorithm is completed after a specified number of iterations. The procedure of the P
SO algorithm is listed in Algorithm 1, and is described below.
Input: Weighting factor of velocity
, acceleration constants
, maximum iteration number
, particle-pair number
and game parameters in
Table 4,
Table 5,
Table 6,
Table 7 and
Table 8.
Output:.
step 1: Randomly initialize the position and velocity of the nth particle-pair.
step 2: Use the nth particle-pair to compute take-off time of fighters and launch time of ASHMs for both fleets, and play a game. Then update (, ) and (, ).
step 3: Repeat step 1 and step 2 for all the particle-pairs.
step 4: The velocity and position for fleet A in the
nth particle-pair are updated with (
12) and (
13), respectively. The take-off time of fighters and launch time of ASHMs from fleet A are updated with (
14) and (
15), respectively.
step 5: The velocity and position for fleet B in the
nth particle-pair are updated with (
16) and (
17), respectively. The take-off time of fighters and launch time of ASHMs from fleet B are updated with (
18) and (
19), respectively.
step 6: Play a game with take-off time of fighters and launch time of ASHMs from fleet A in step 5, take-off time of fighters and launch time of ASHMs from fleet B in step 6, as well as , , , and .
step 7: Use the resulting objective functions of fleets A and B in step 7 to update (, ) and (, ).
step 8: Repeat step 4 to step 7 for all the particle-pairs.
step 9: Increment the iteration index. If the index is smaller than
, go to step 4. Otherwise, the algorithm is completed.
Algorithm 1 Pseudocode of PSO algorithm |
Initialize: Particles best objective functions Global best objective functions Output:, for n = 1: do 1. Randomly initialize 2. Use to compute take-off time of fighters and launch time of ASHMs for fleet A and B, respectively, with ( 14), ( 15), ( 18), ( 19). Play a game with the resulting take-off time of fighters, launch time of ASHMs, and in , and in and game parameters to obtain objective functions and . , , if ; end if if ; end if 3. end for for i = 1: do for n = 1: do 4. and are updated with ( 12) and ( 13), respectively Take-off time of fighters and launch time of ASHMs of fleet A are updated with ( 14) and ( 15) 5. and are updated with ( 16) and ( 17), respectively Take-off time of fighters and launch time of ASHMs of fleet B are updated with ( 18) and ( 19) 6. Play a game with the updated take-off time of fighters, launch time of ASHMs, and game parameters to obtain objective functions and 7. if ; if ; end if end if if ; if ; end if end if 8. end for 9. end for |
Table 9 lists the P
SO parameters used in the simulations. The P
SO algorithm concurrently updates the optimal tactical parameters of both fleets. The global best position of one fleet is determined from its objective functions over all games, and both fleets usually receive their global best positions from different particle-pairs. The global best position of one fleet is unknown to the other fleet before a new game, but the outcome of the game may affect both global best positions, which in turn will affect the next game. The simulation results with the optimal tactical parameters of P
SO will be presented in the next section.
The parameters listed in
Table 4,
Table 5,
Table 6,
Table 7 and
Table 8 are roughly estimated with available data collected from public sources, such as Wikipedia. The parameters listed in
Table 9 are tried out and fine-tuned over many runs of simulations, based on the convergence performance, computational time, and the optimization outcomes. For example, increasing the number of particle pairs (
) and the maximum iteration number (
) of the P
SO algorithm may generate tactical parameters that deliver better performance, but the computational load is also increased. The speed, flying distance, alert radius, kill probability and maneuverability of agents are properly chosen to design a matched game without dominant factors or overwhelming agents in order to observe subtle nuances that may affect the outcome of a game. The simulation time step (
) is adjusted to ensure the games are played smoothly with reasonable CPU time. The choice of minimum time gap between missile launches (
) is also constrained by the simulation time step.
Table 9.
Parameters of PSO algorithm.
Table 9.
Parameters of PSO algorithm.
| Parameter | Symbol | Value |
|---|
| weight on particle velocity | | 1 |
| acceleration constants | | 2 |
| number of particle pairs | | 40 |
| maximum iteration number | | 60 |
6. Summary and Comparison
In the last section, it is observed that the highest payoff is inflicted upon a fleet if the opponent fleet chooses option 2 to solely target the most valuable CV. If option 1 is chosen, the own payoff is slightly reduced and more enemy fighters will be lost. If both fleets choose the same option, their payoffs are generally in the same level. If option 3 is chosen, the impact score on DDGs is low because fewer fighters and ASHMs are dispatched to attack them.
In general, different PSO runs deliver similar trend of distributions in payoff and impact score. However, some optimal initial flying angle makes the evasion from enemy missiles more difficult while some makes it easier. This will lead to some interesting results, which will be investigated in the next section.
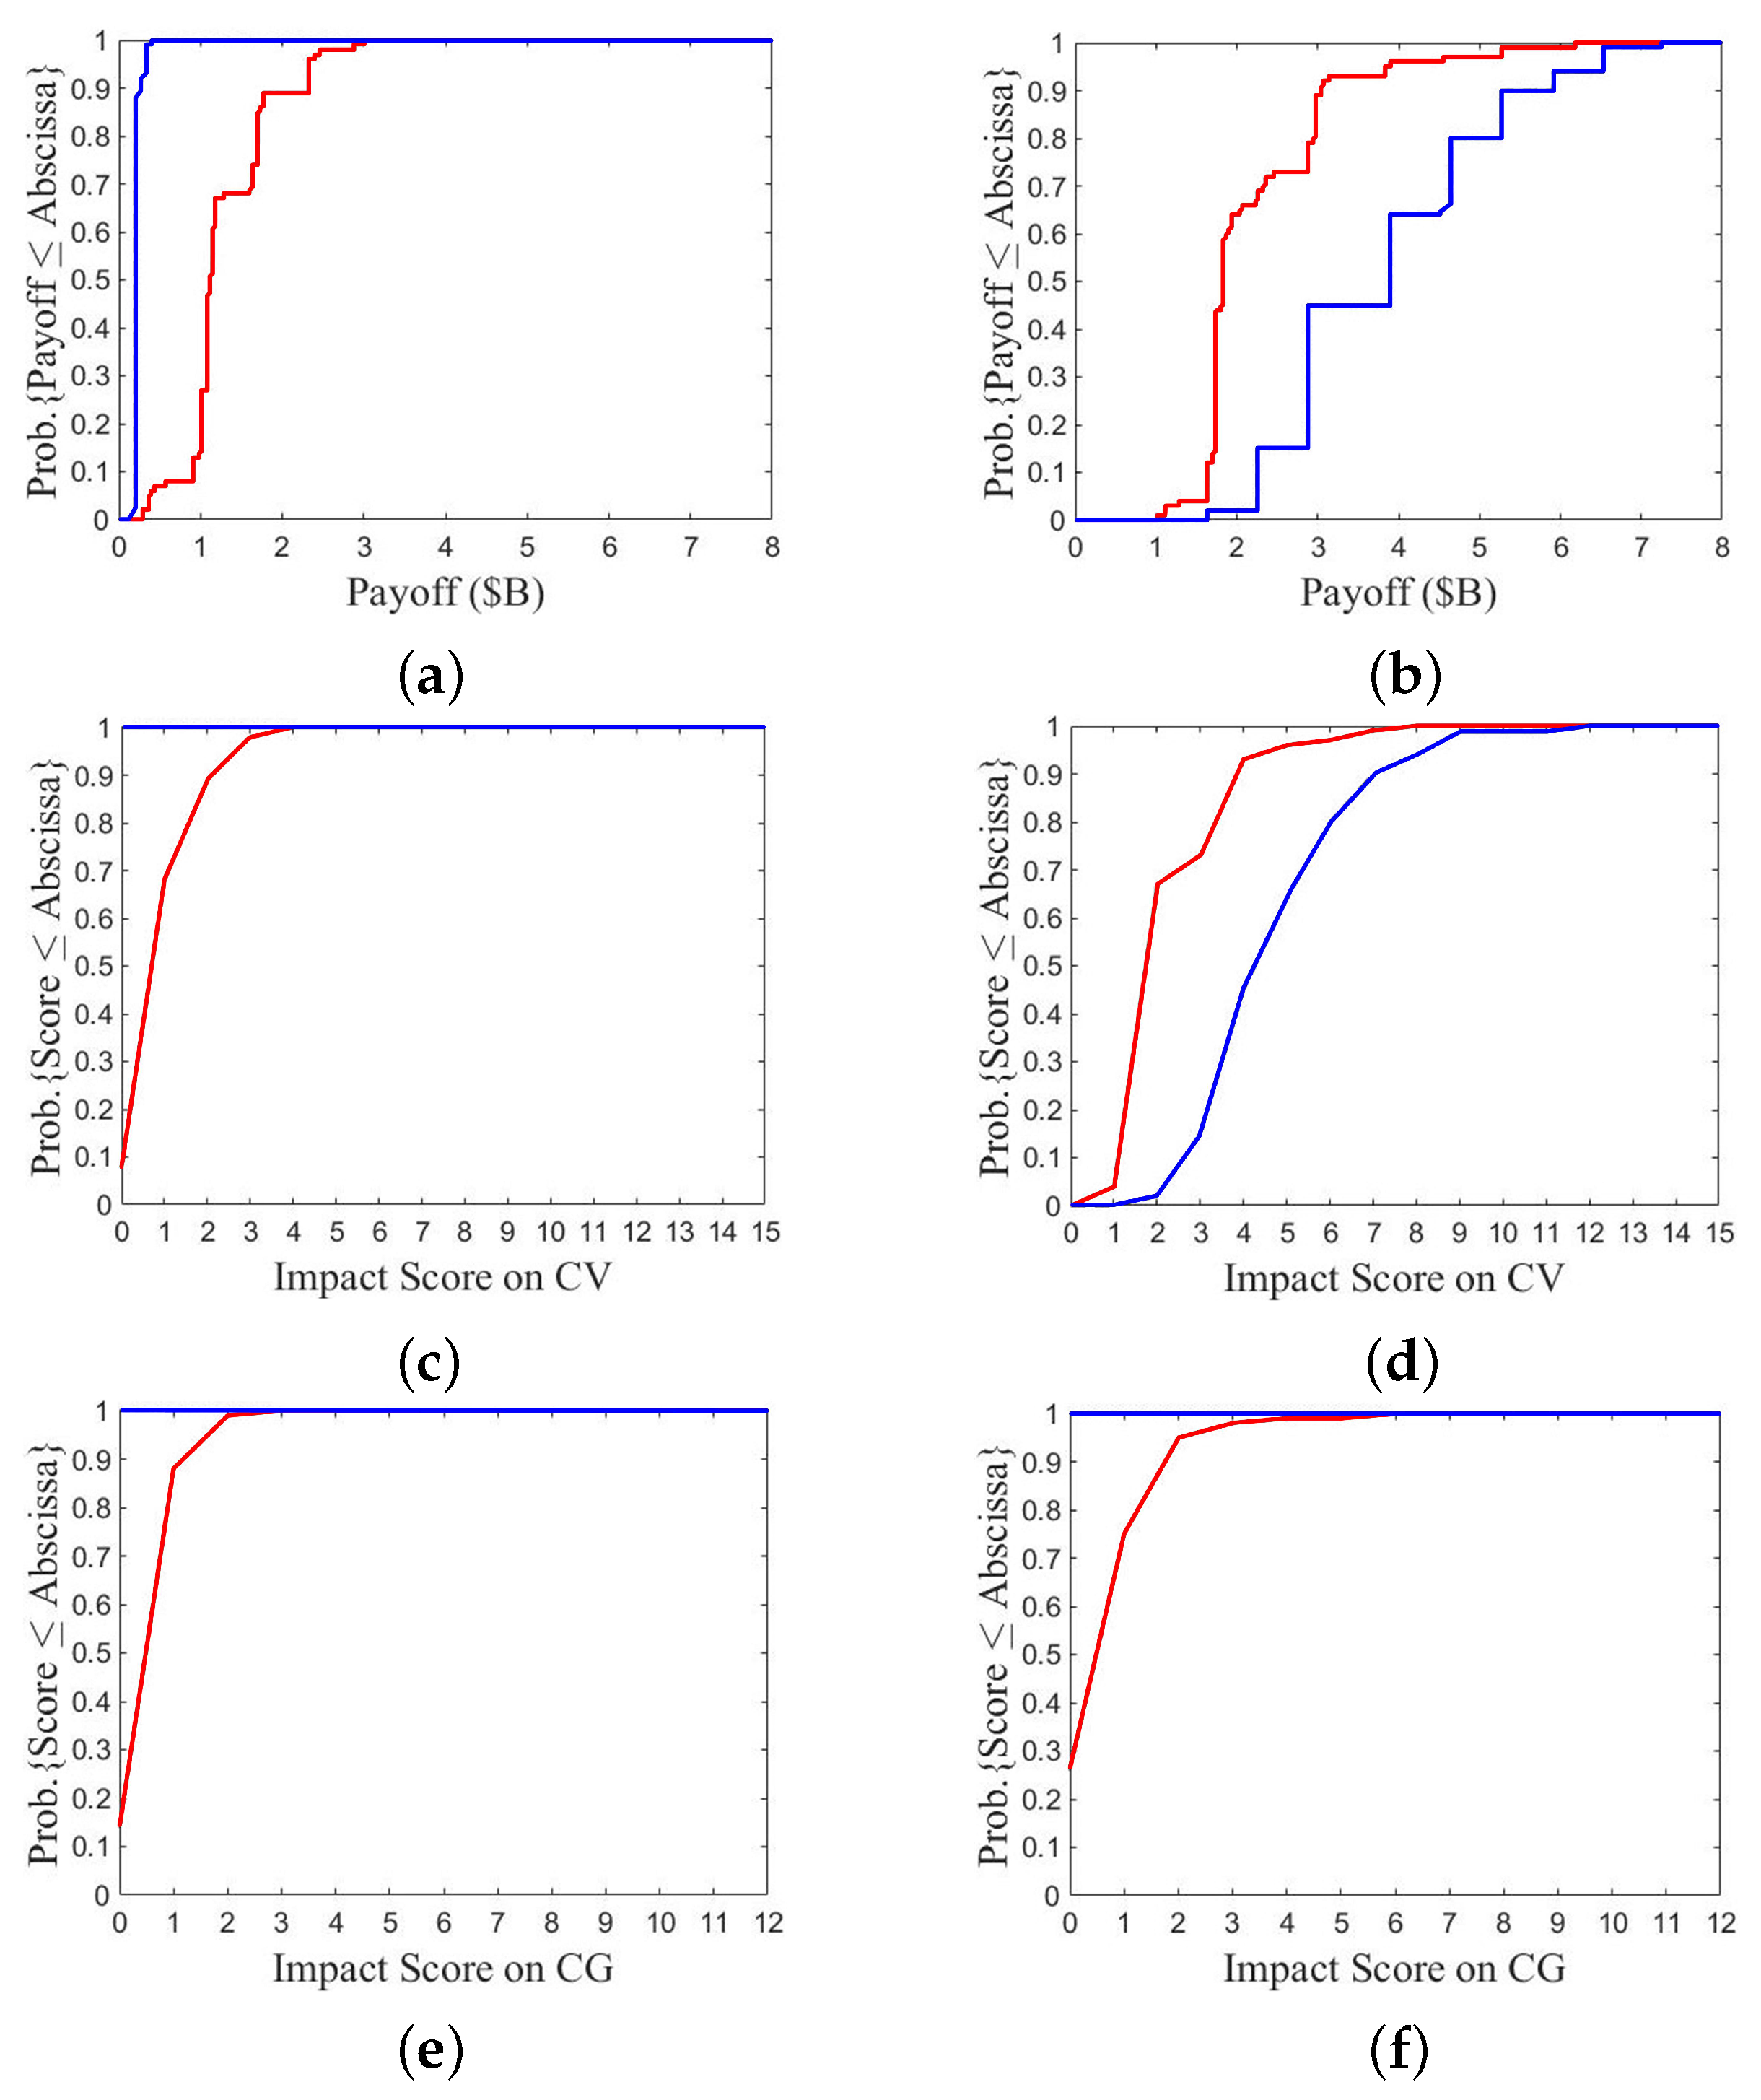
At first, compare the results between A2/B3 and A1/B2, as shown in
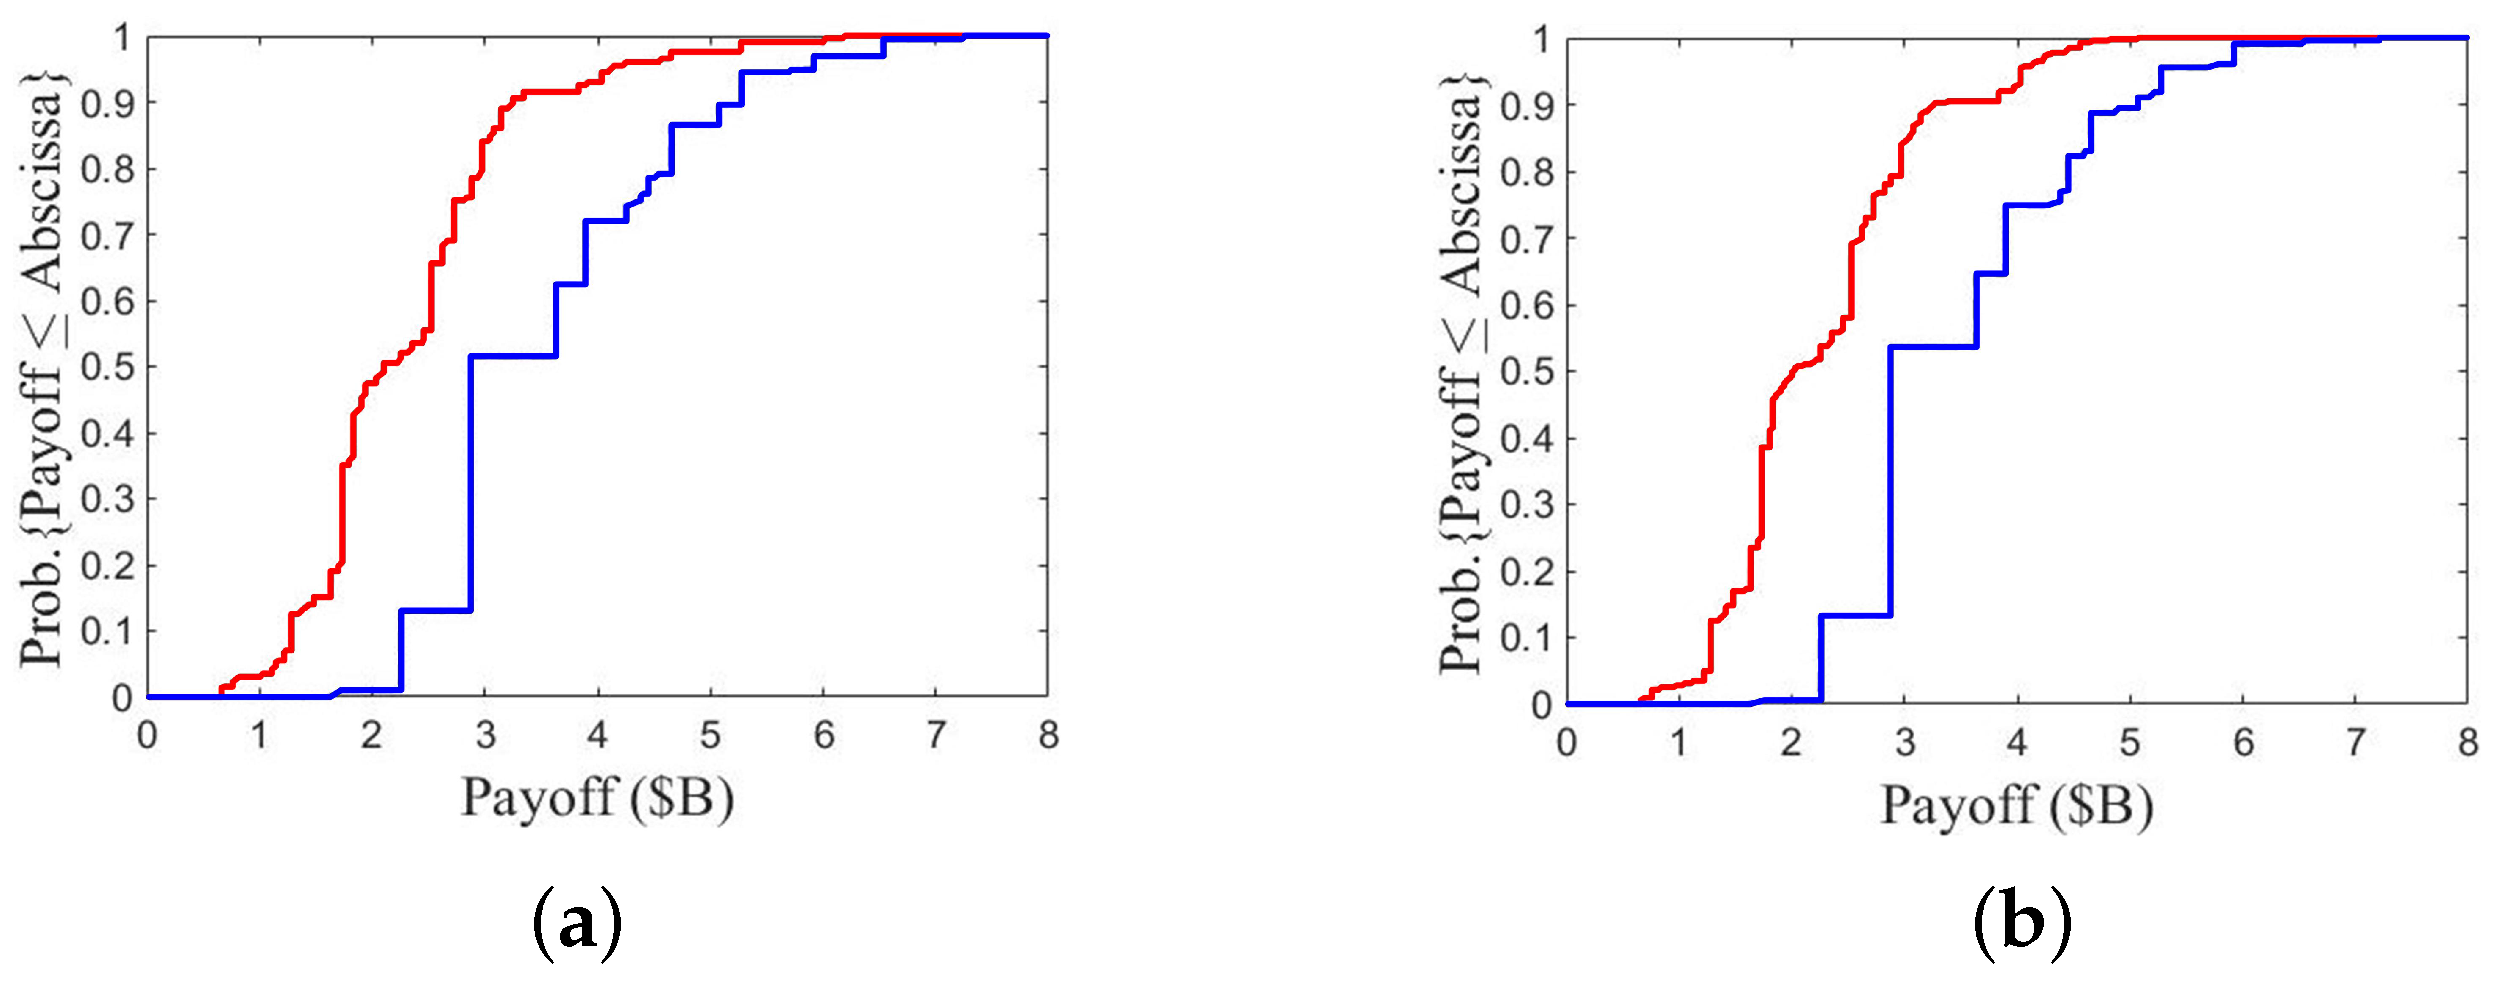
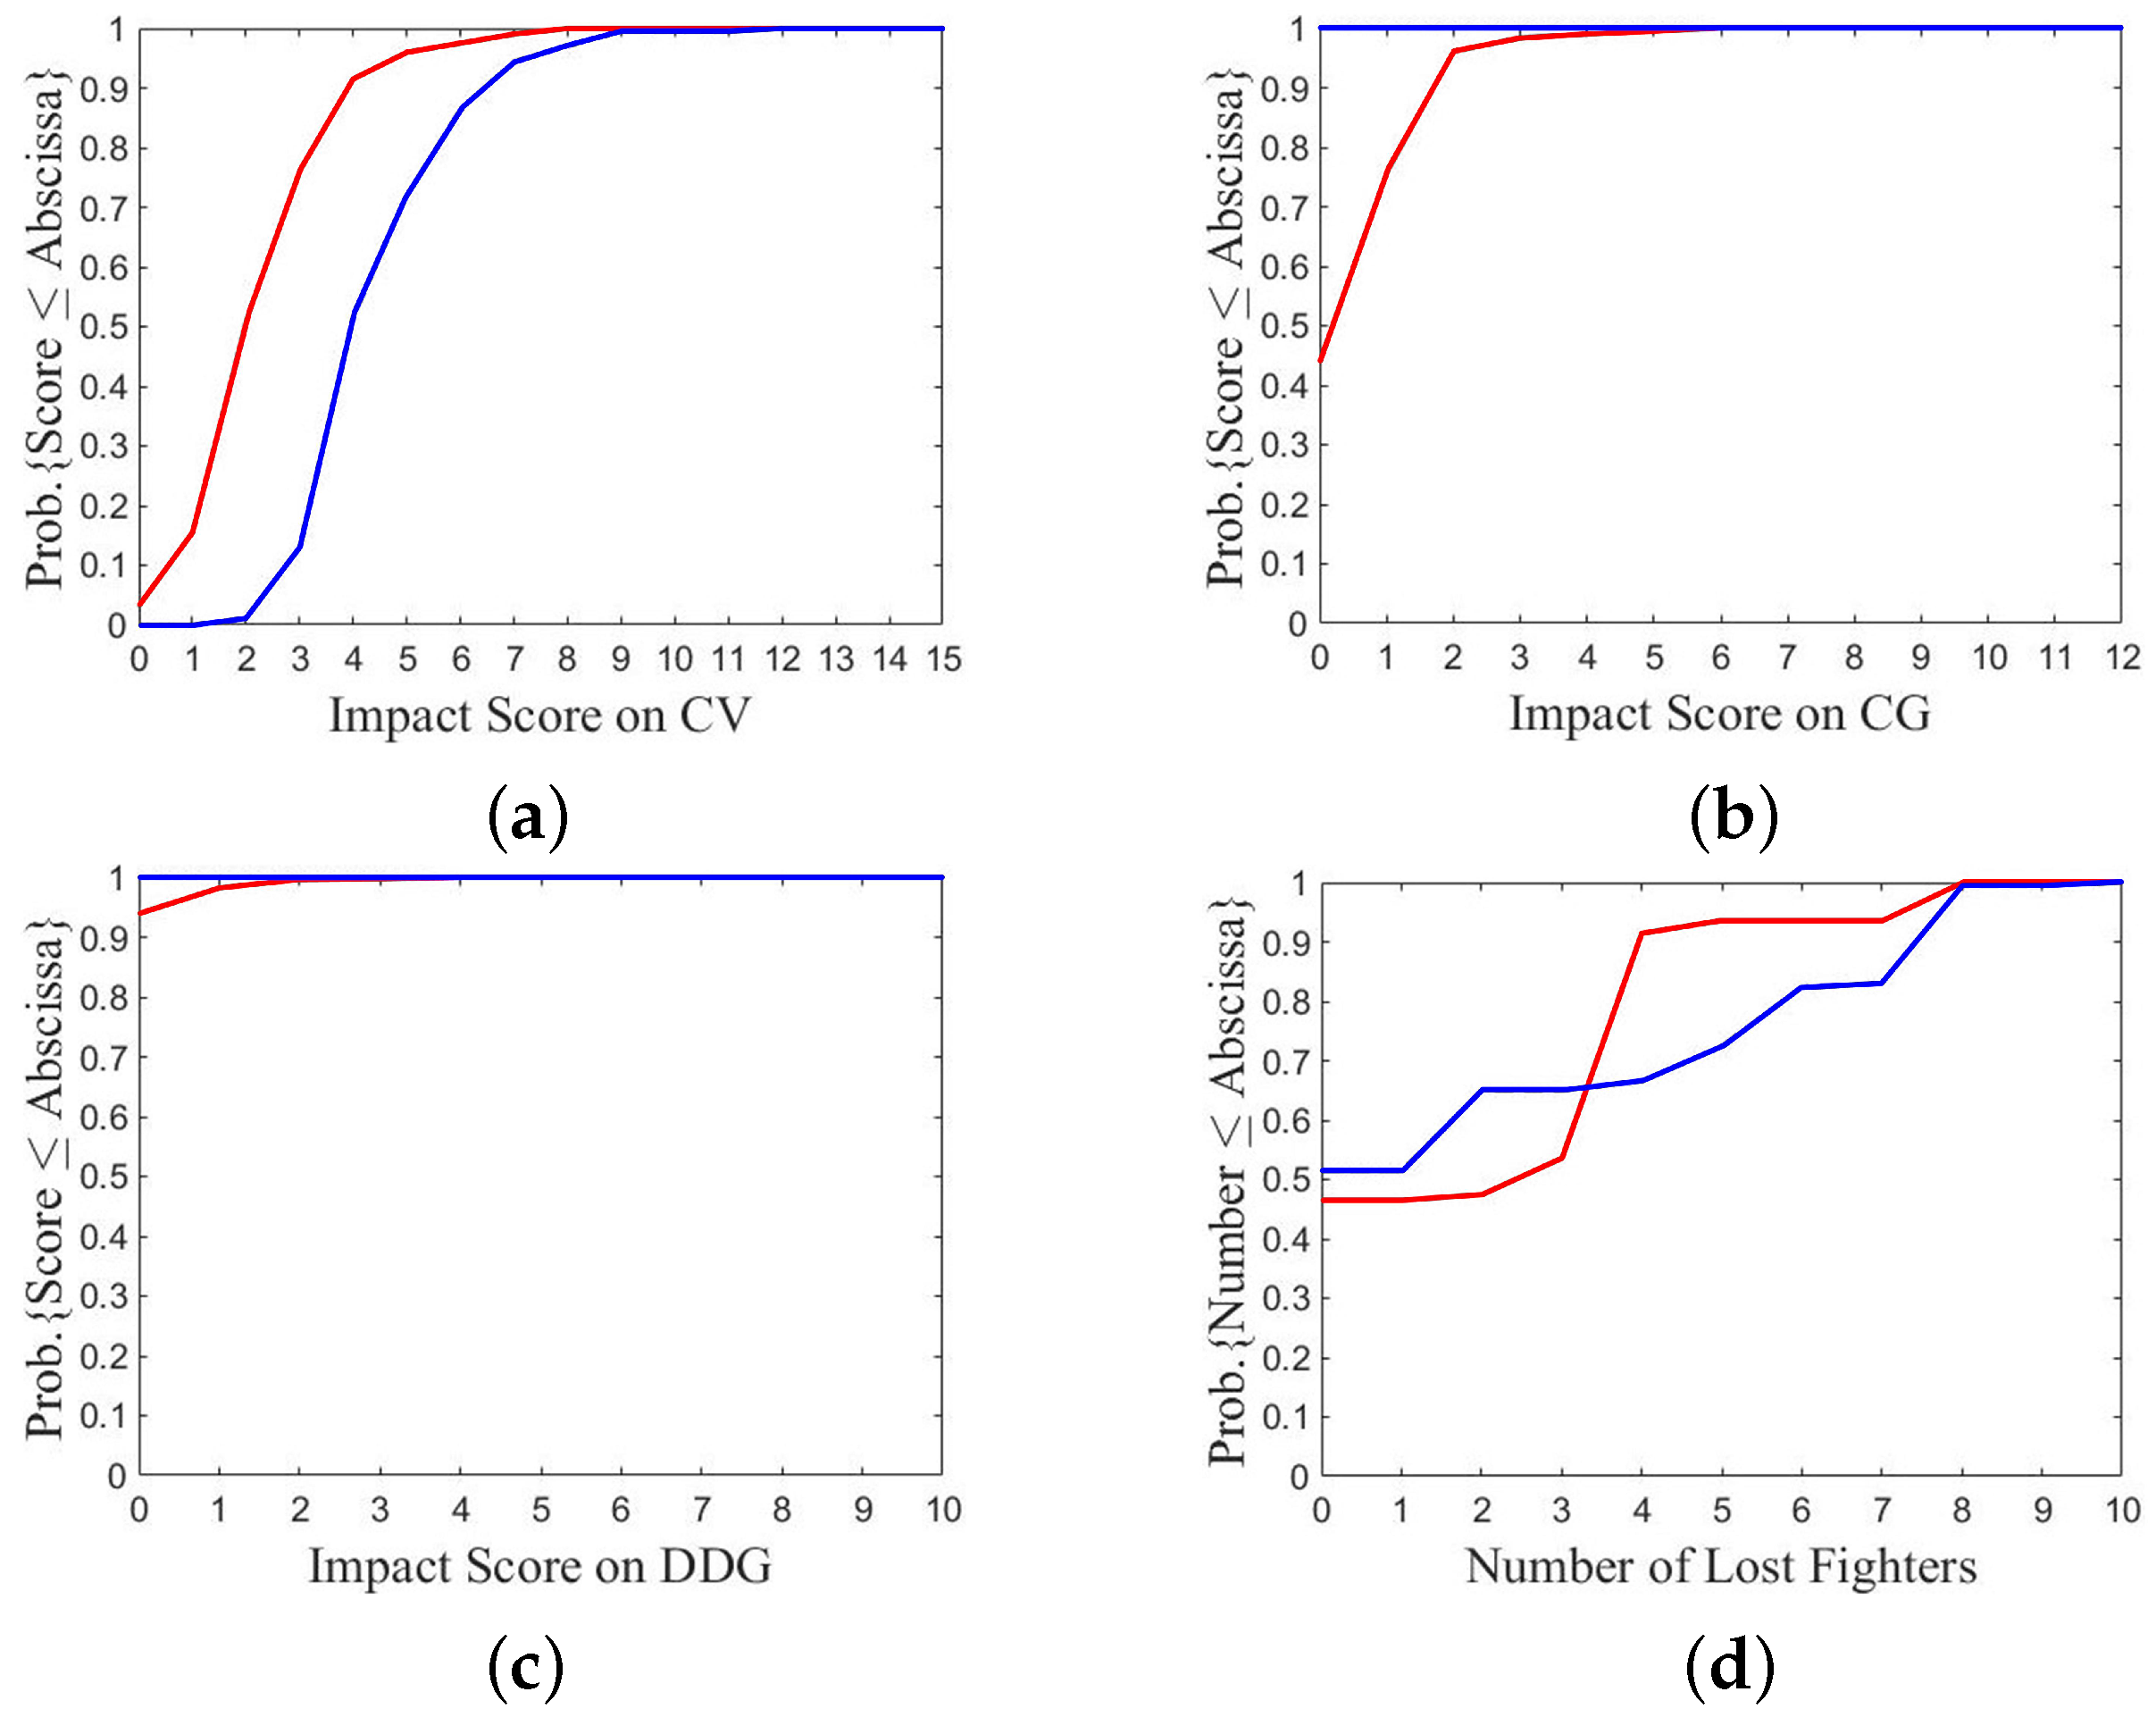
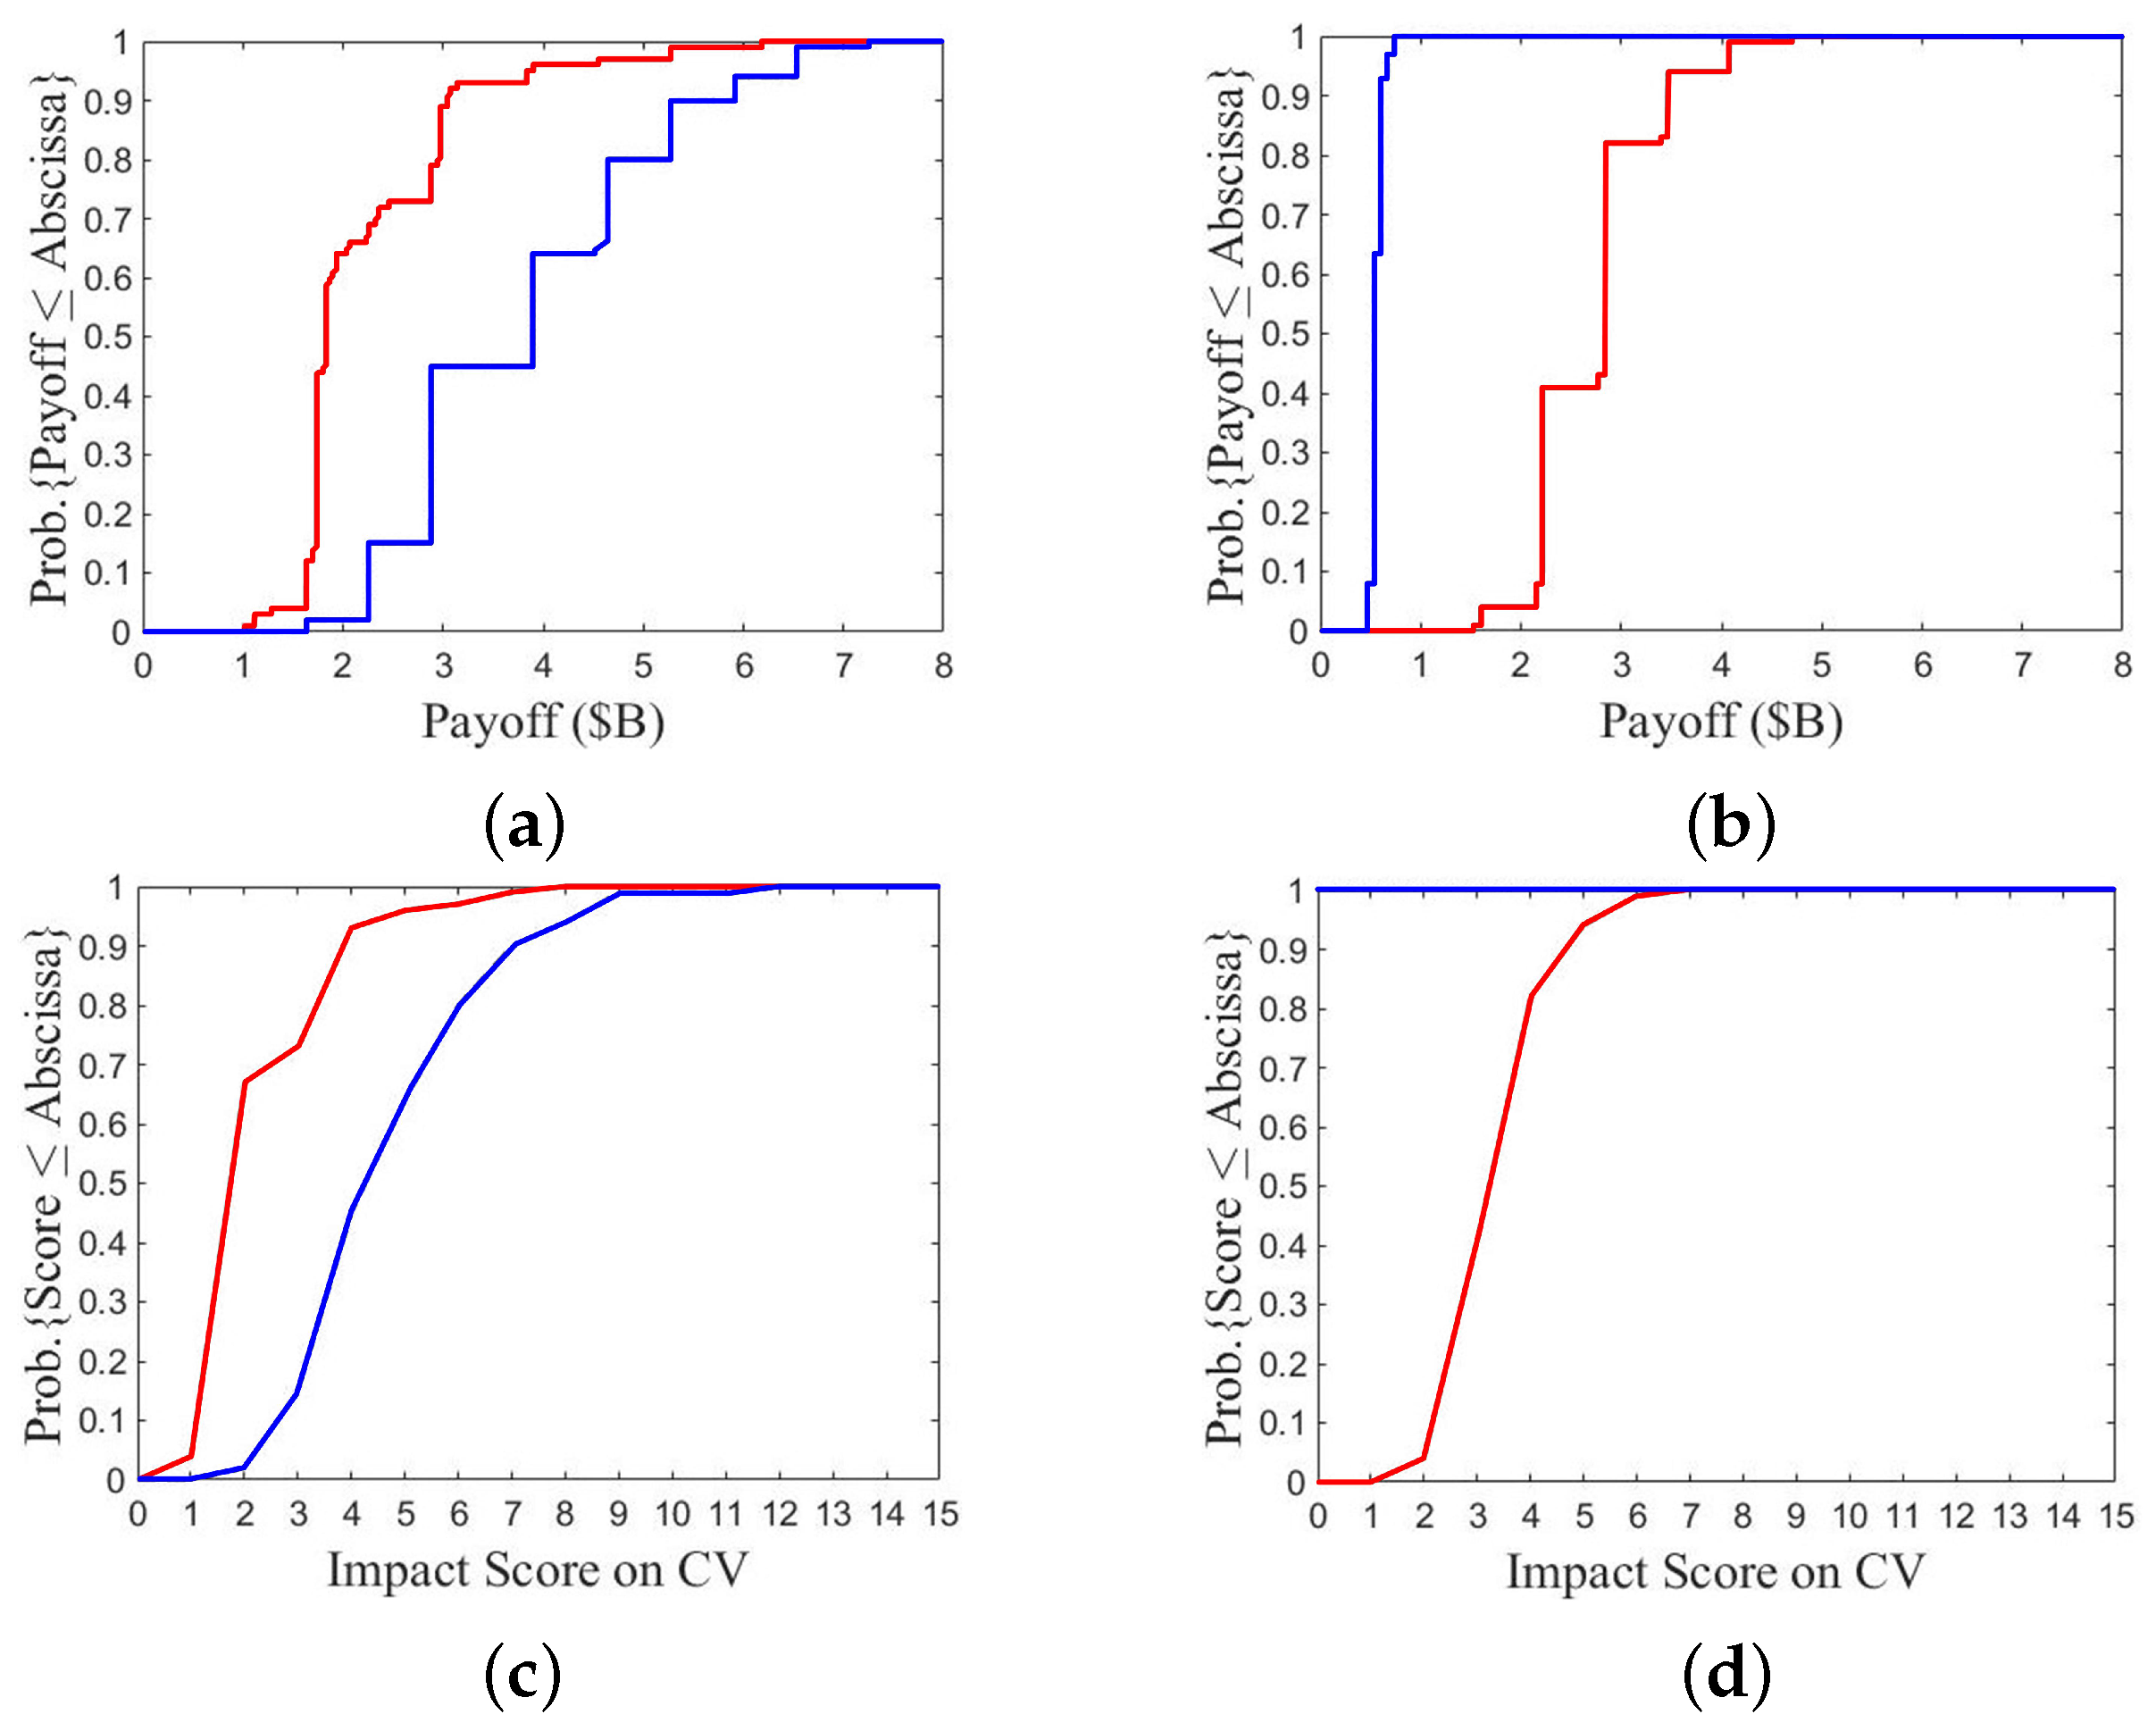
Figure 16. One of the two fleets chooses option 2, while the other chooses either defense option 1 or aggressive option 3.
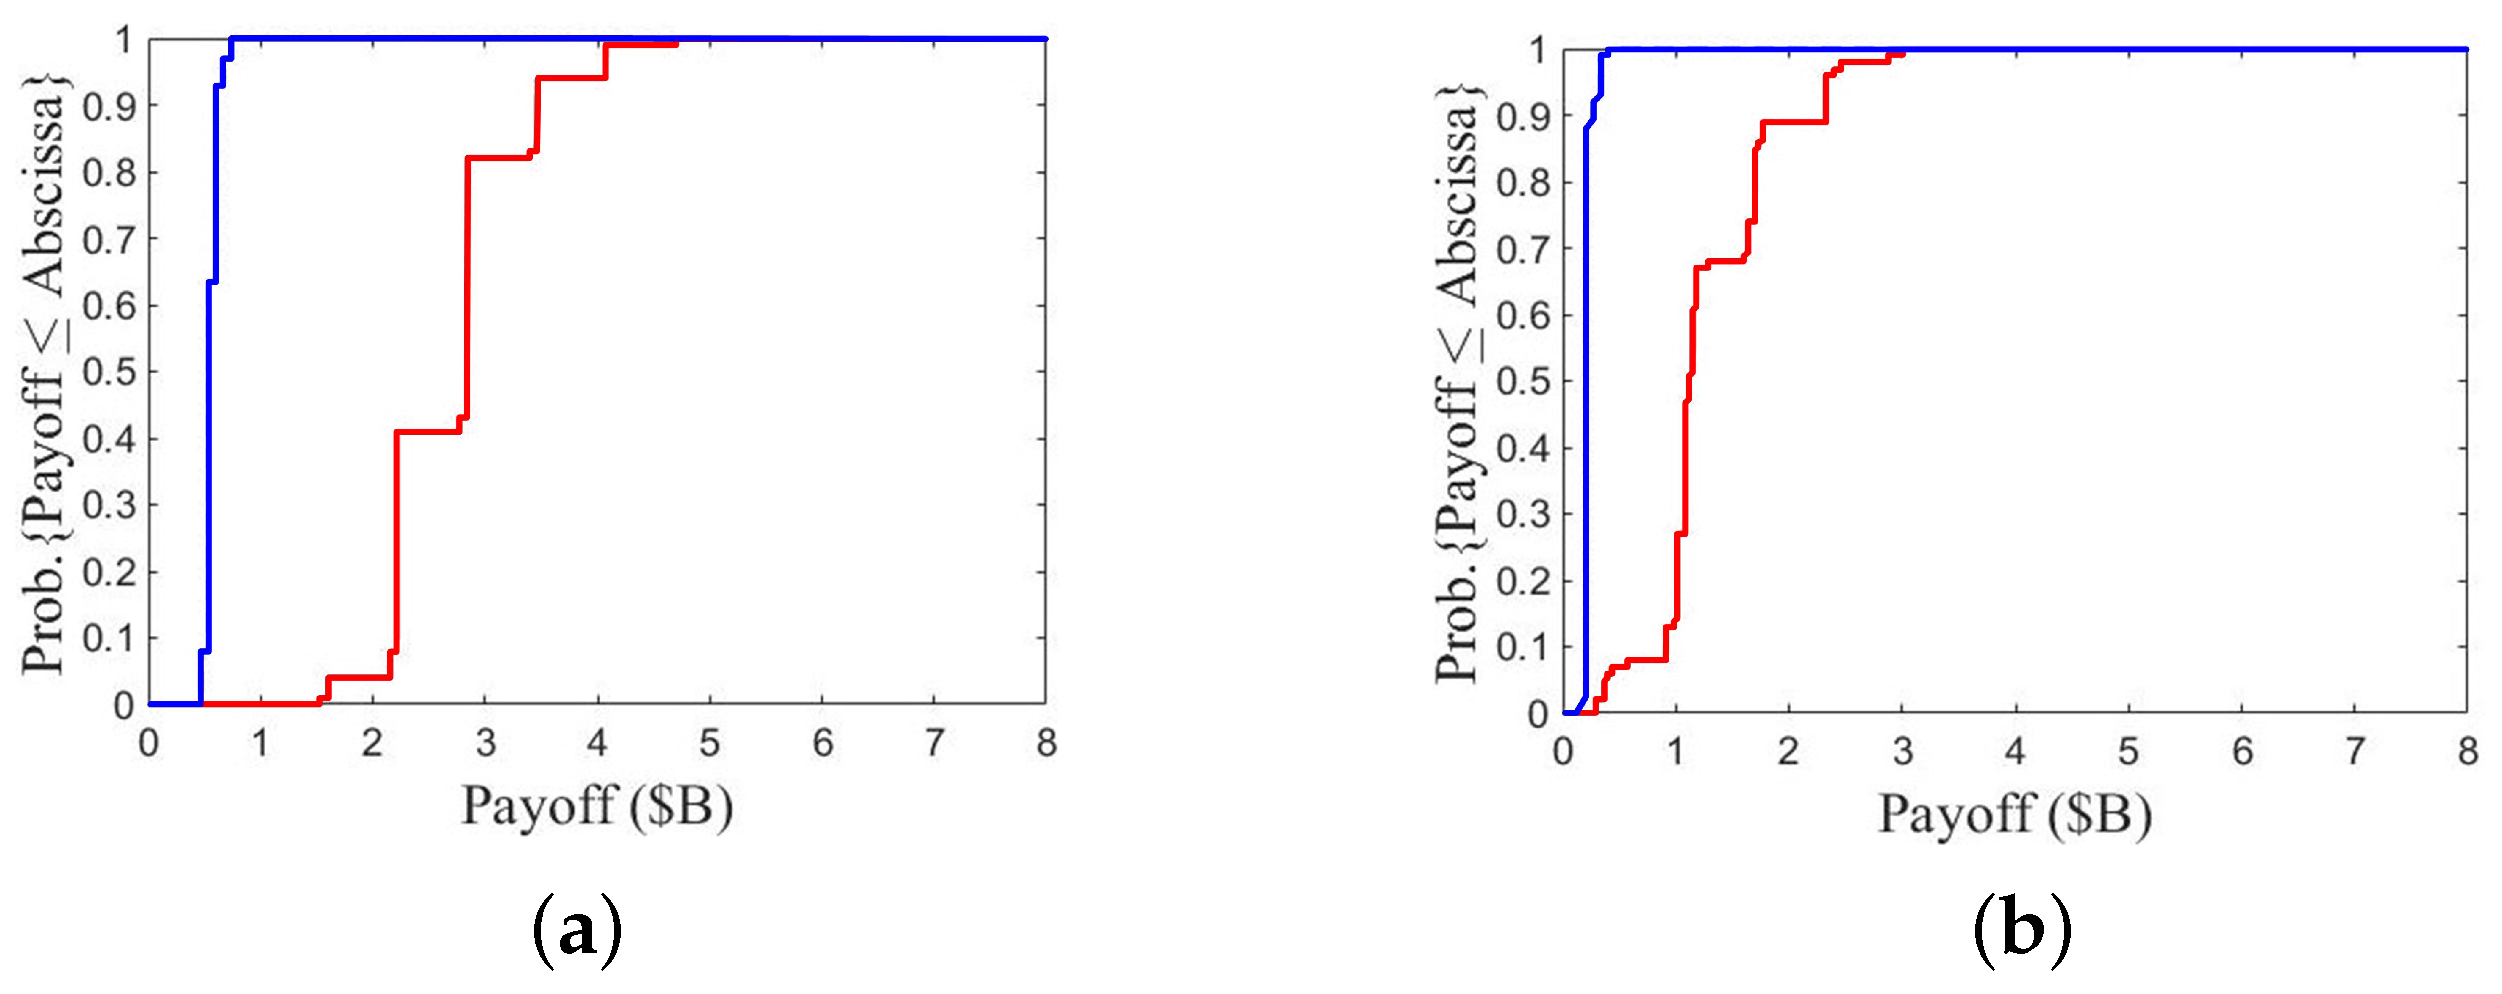
Figure 16a,b show the CDF of payoff over 100 games with one P
SO run. The payoff of fleet A in
Figure 16b is lower than that of fleet B in
Figure 16a. The lowest, median, and highest payoffs of fleet A in
Figure 16b are USD 1.5 B, USD 2.8 B, and USD 4.7 B, respectively, while the lowest, median, and highest payoffs of fleet B in
Figure 16a are USD 1.6 B, USD 3.9 B, and USD 7.2 B, respectively. It suggests that choosing a defense option inflicts lower payoff than choosing a more aggressive one.
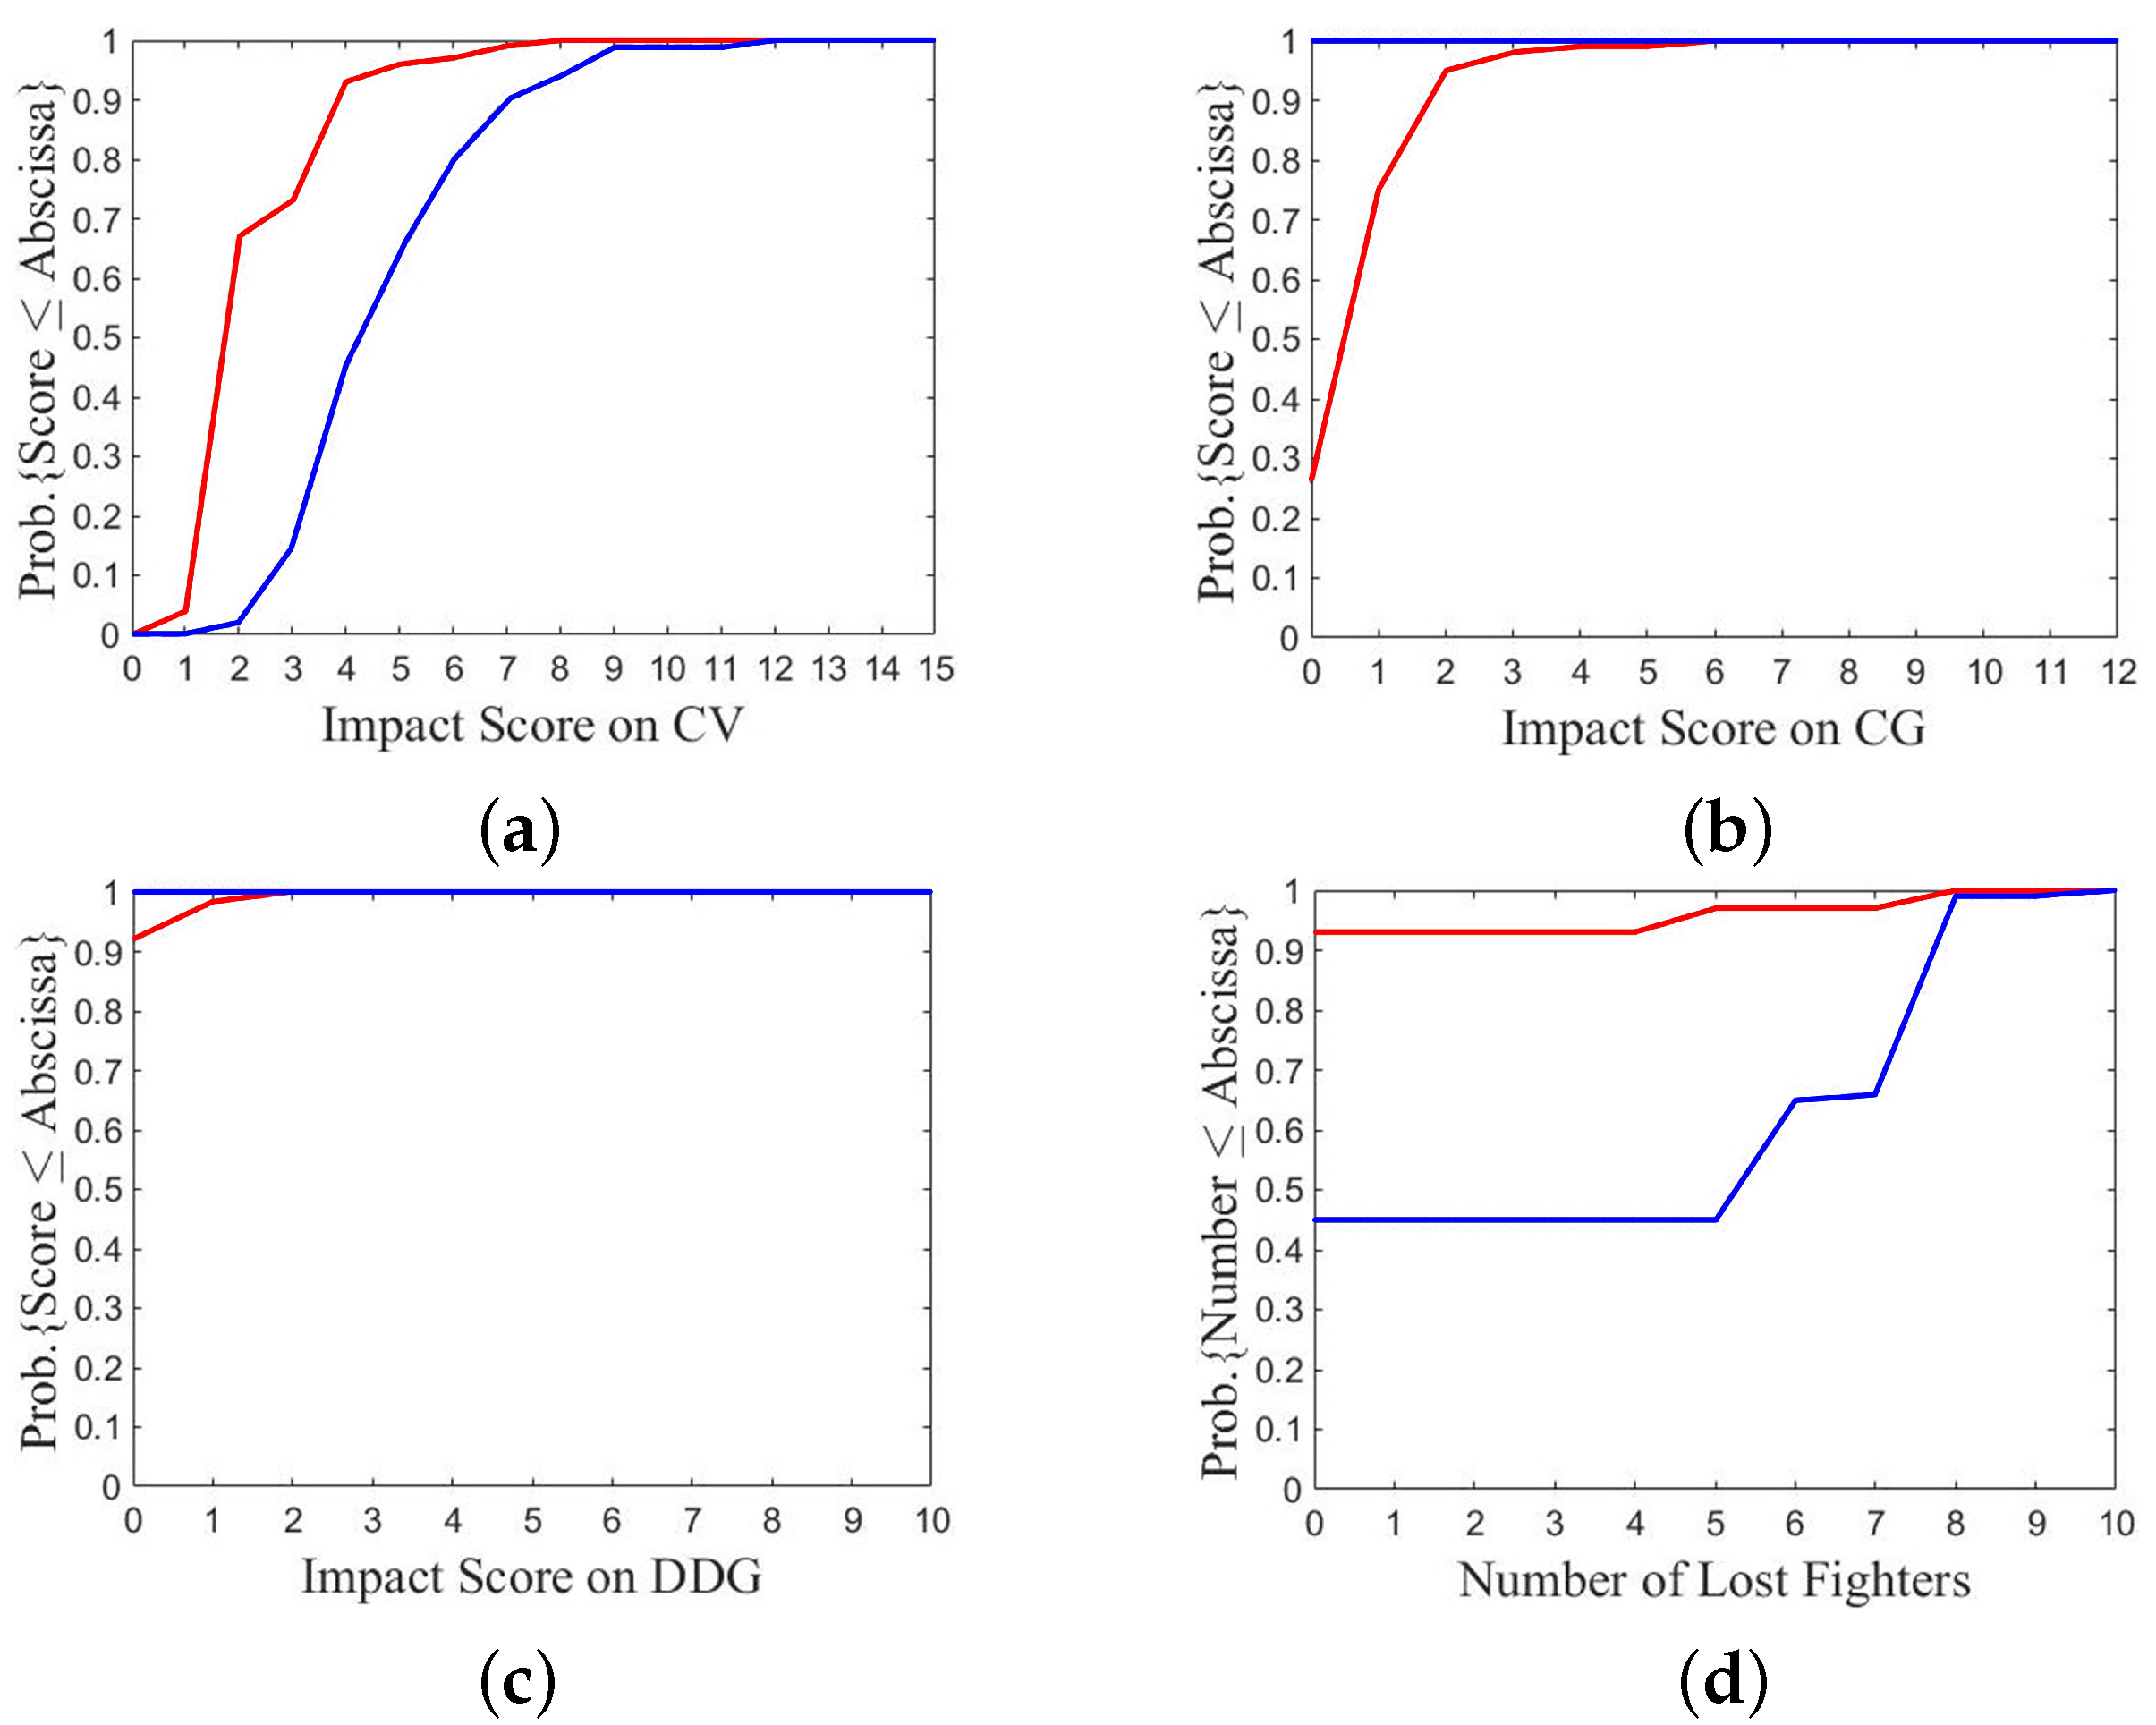
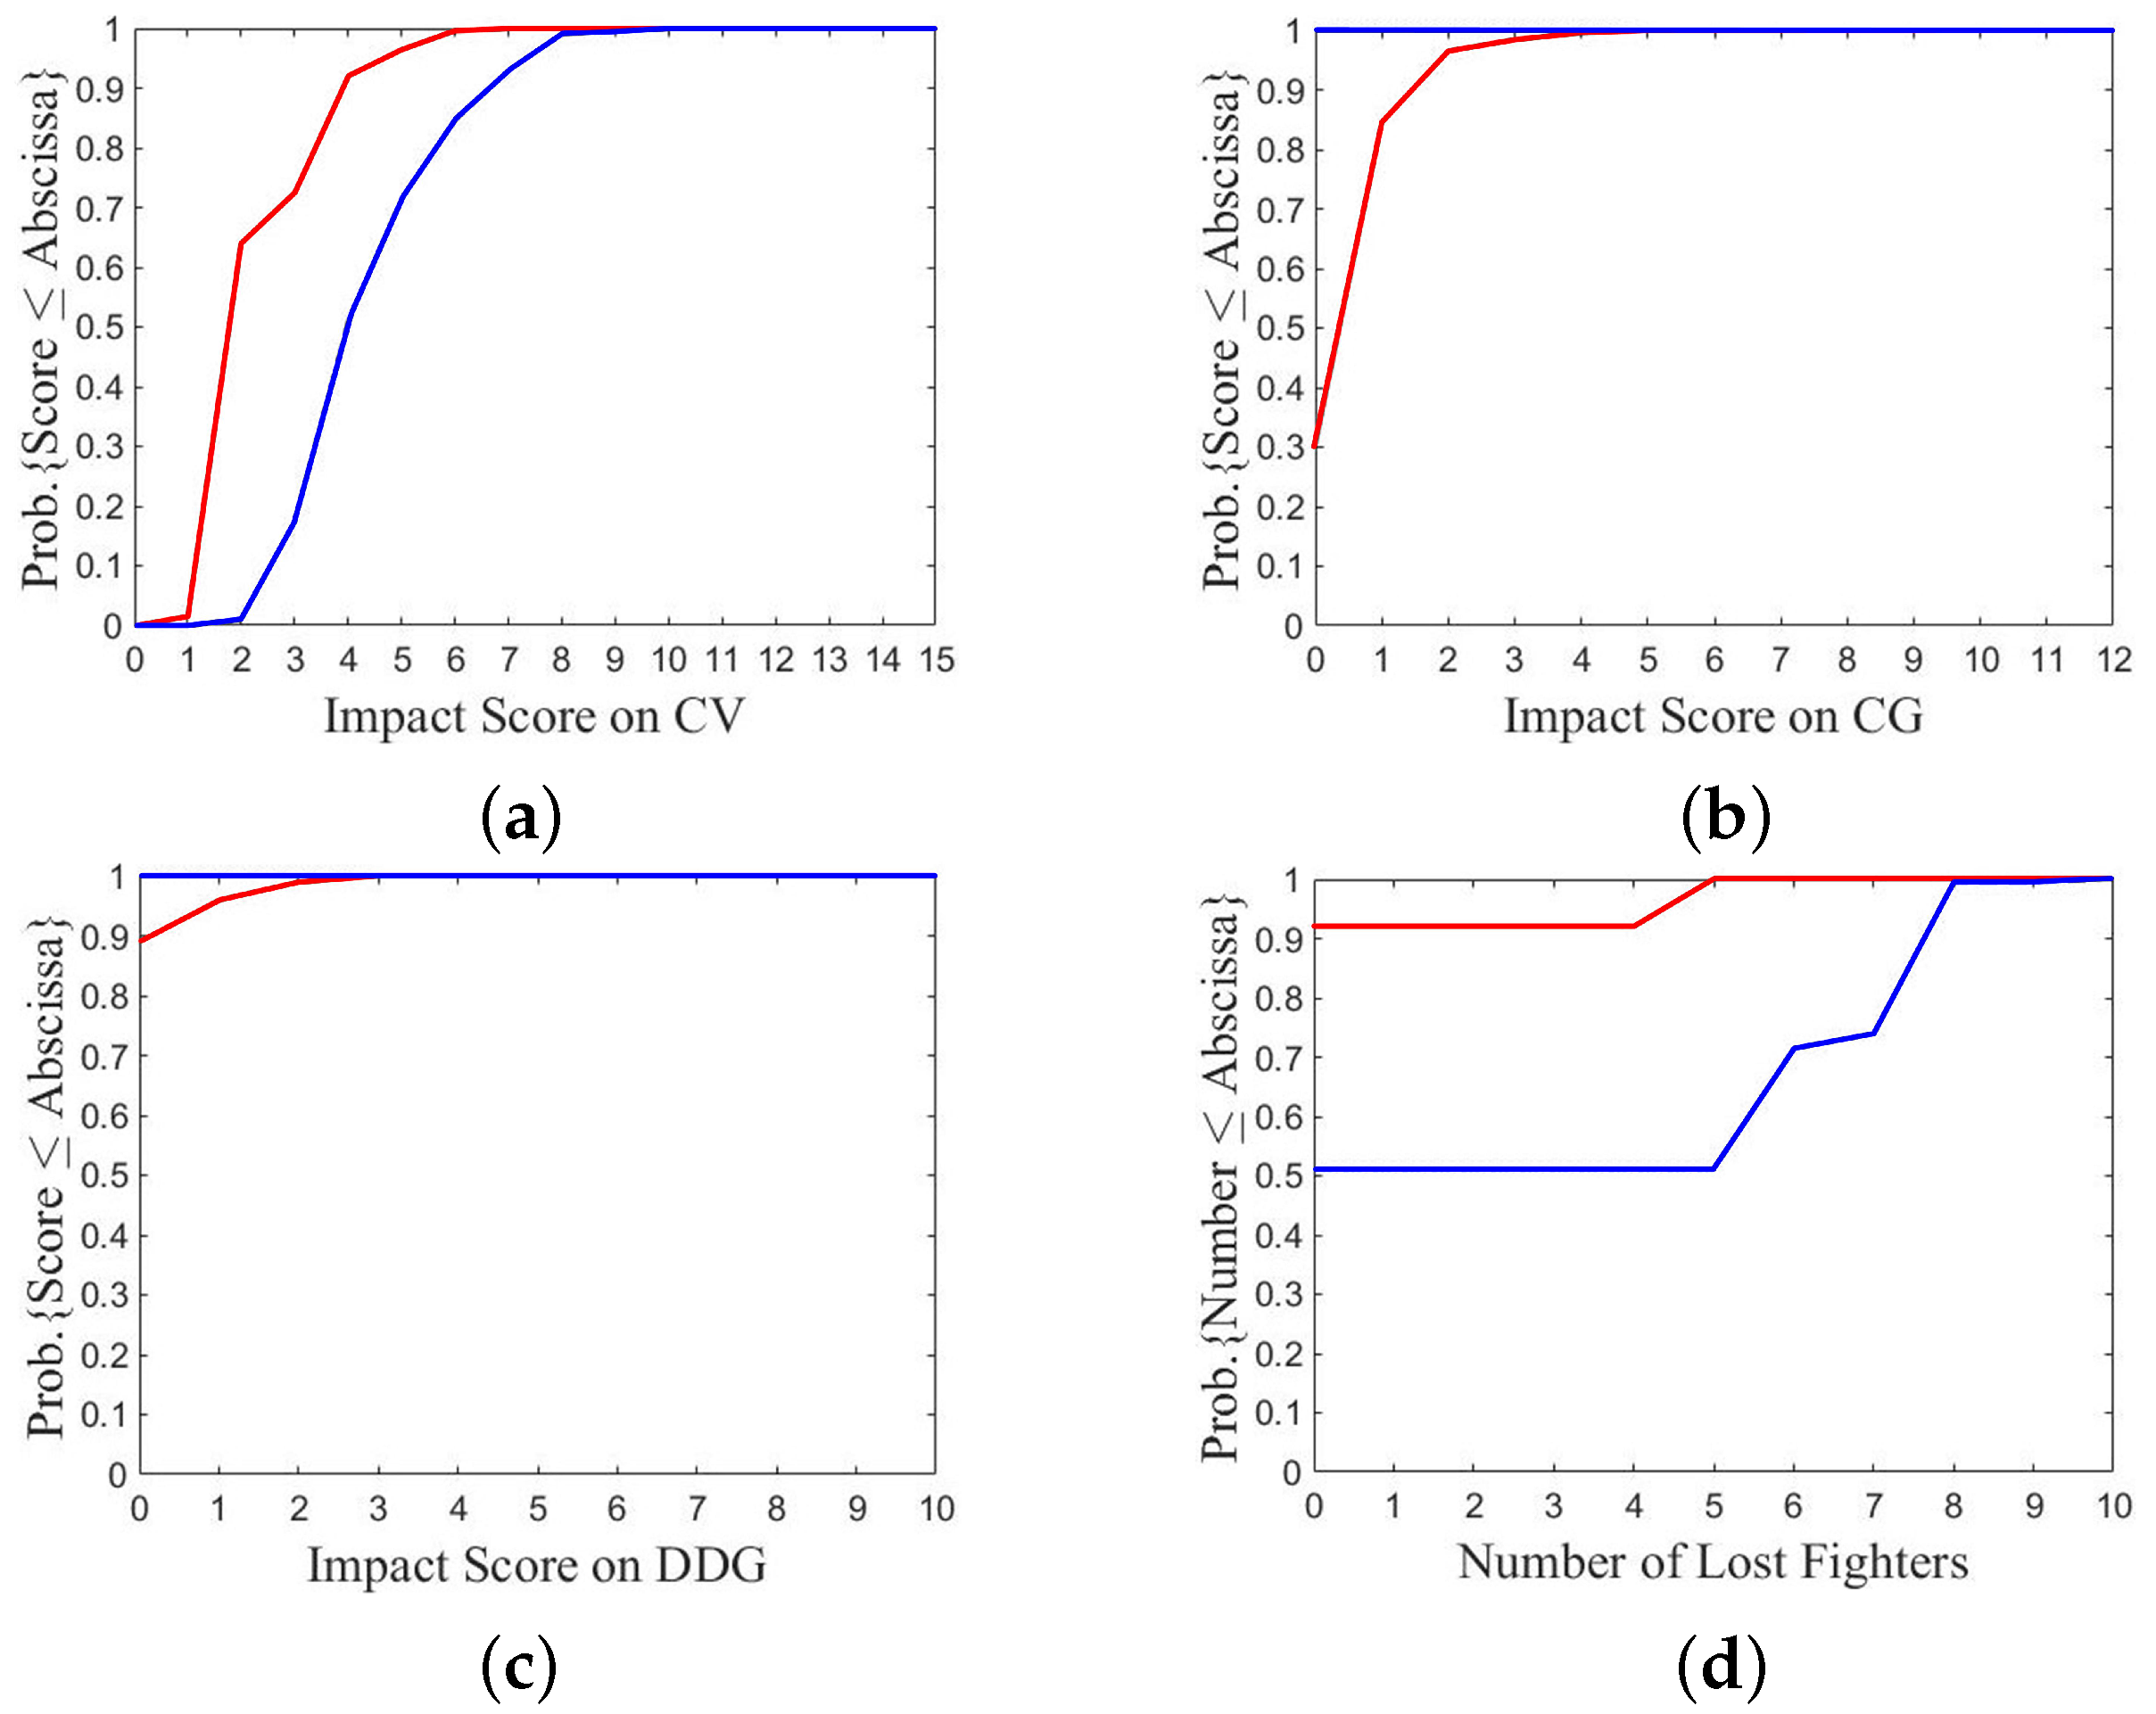
Figure 16c,d show the CDF of impact score on CV. The curve of fleet A in
Figure 16d is steeper than that of fleet B in
Figure 16c, which suggests that choosing a defense option takes lower impact score on the own CV.
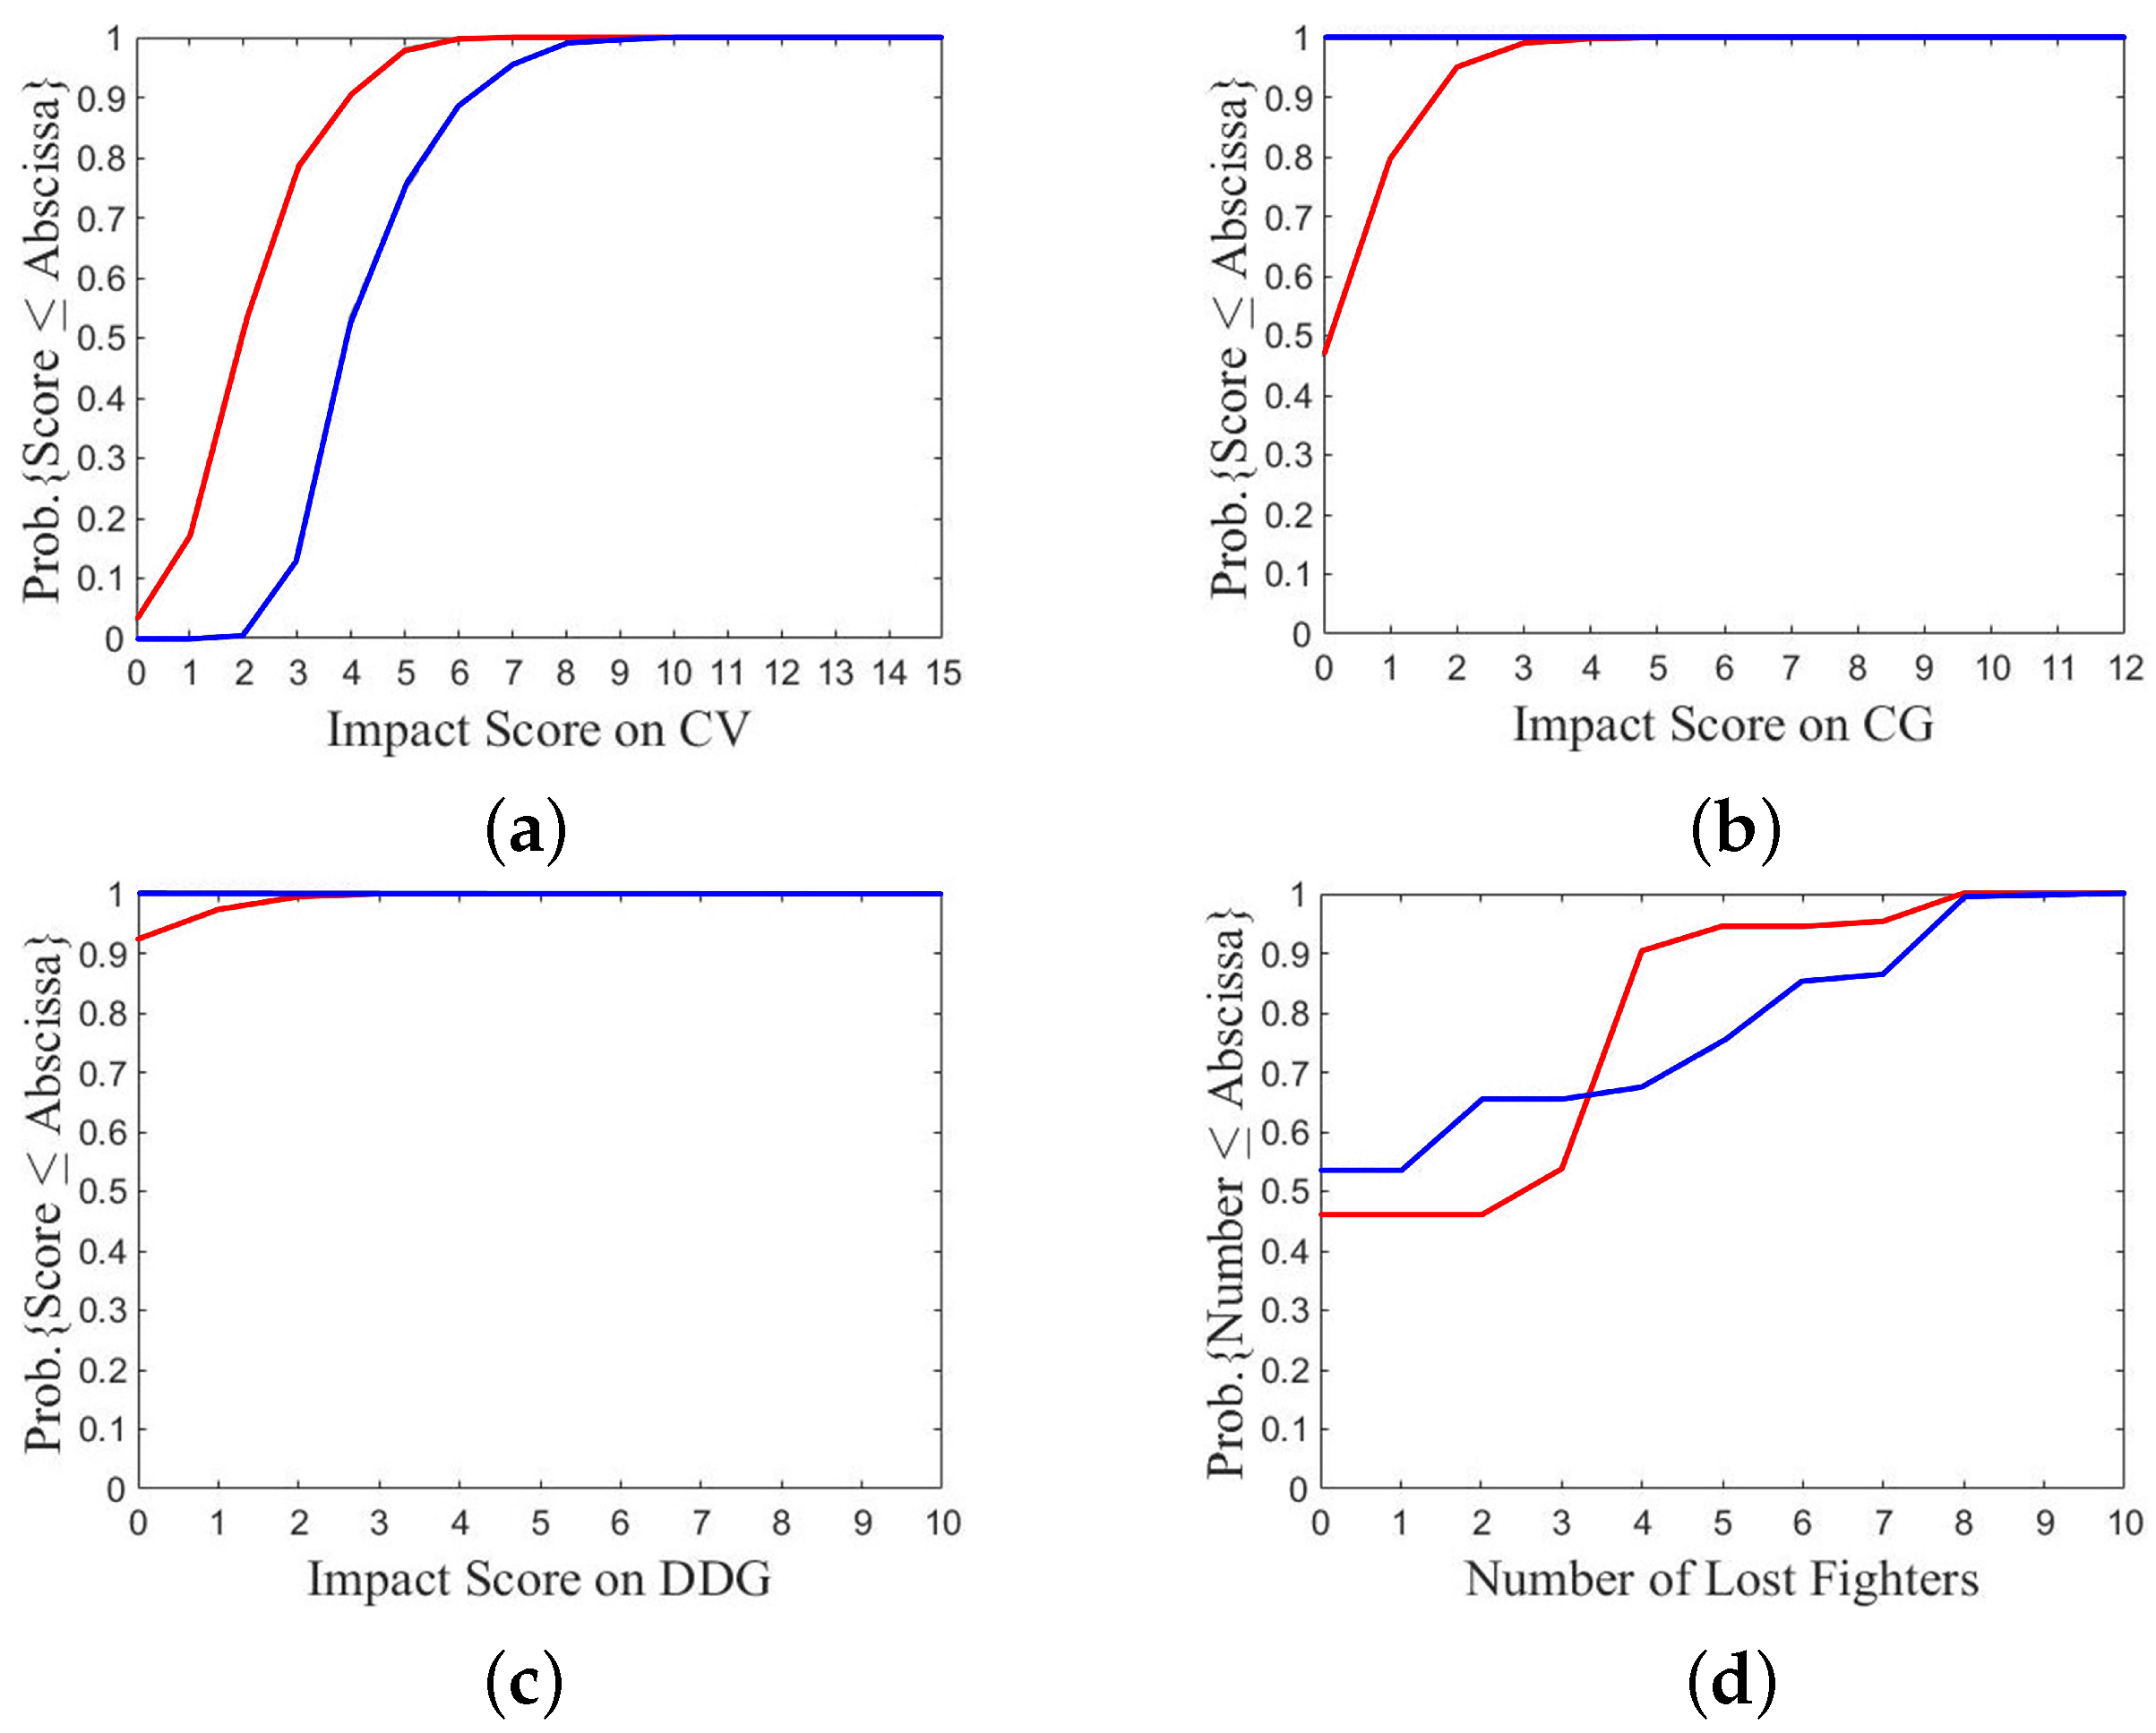
Figure 17 shows the comparison between A1/B3 and A2/B3, where fleet B chooses option 3 while fleet A chooses a defense option (A1) and a more aggressive option (A2), respectively. The payoff of fleet A in
Figure 17a is significantly lower than that in
Figure 17b.
Figure 17a shows that the lowest, median, and highest payoffs of fleet A are USD 0.3 B, USD 1.1 B, and USD 3 B, respectively, and the payoff is lower than or equal to USD 1 B in 13 games.
Figure 17b shows that the lowest, median and highest payoffs of fleet A are USD 1 B, USD 1.9 B, and USD 6.2 B, respectively, and the payoff is higher than or equal to USD 1 B in all games. Fleet A takes payoff lower than USD 2 B in 89 games if option 1 is chosen and in 63 games if option 2 is chosen. It suggests that choosing option 1 inflicts lower payoff than choosing a more aggressive one.
Figure 17c,d show the CDF of impact score on CV. The score on CV-A in
Figure 17c is slightly lower than that in
Figure 17d. The score on CV-A is lower than 3 in 90 games if option 1 is chosen and in 68 games if option 2 is chosen.
Figure 17e,f show the CDF of impact score on CG. The highest score on CG-A is 3 in
Figure 17e and 6 in
Figure 17f. The score on CG-A is lower than 3 in 99 games if option 1 is chosen and 96 games if option 2 is chosen.
The simulations are run with MATLAB R2019a on a PC with i7-3.0 GHz CPU and 32 GB memory. It takes about 13–16 CPU hours to play a typical game with one fleet on aggressive option and the other fleet on aggressive or non-aggressive option, and about 8–10 CPU hours with both fleets on non-aggressive option. The CPU time with aggressive option versus non-aggressive option is not as low as expected, even though ASHMs are not launched from the non-aggressive fleet and almost no SAMs are fired from the aggressive fleet, because the fighters from the non-aggressive fleet fire many more AAMs, requiring longer CPU time to track the aftermath.
7. Investigation on Interesting Outlier Cases
7.1. A1/B1
Figure 18 shows the outcome of a specific P
SO run on A1/B1 over 100 games.
Figure 18a shows that both objective functions have similar magnitude and converge to the maximum value of 1 quickly.
Figure 18b shows the payoff of fleet B is much higher than that of fleet A in most games, which is beyond expectation under A1/B1 scenario. Fleet A takes payoff from USD 0.03 B to USD 0.51 B, and USD 0.18 B in 48 games. Fleet B takes payoff from USD 0.24 B to USD 0.65 B, and USD 0.51 B or USD 0.57 B in 70 games.
Figure 18c shows fleet B loses more fighters than fleet A in most games. Fleet B loses 4 to 9 fighters, with 7 or 8 lost in 70 games, while fleet A loses 0 to 7 fighters, with 2 lost in 50 games.
The cause can be traced back to the global best positions of this specific PSO run that the initial flying angle of fighters is from fleet A and from fleet B. With these initial flying angles, most AAMs from fleet A close in on their targeted fighters more quickly and more difficult to evade. On the other hand, most AAMs from fleet B take longer time to reach their targeted fighters, easier to burn out of fuel before hitting the targets.
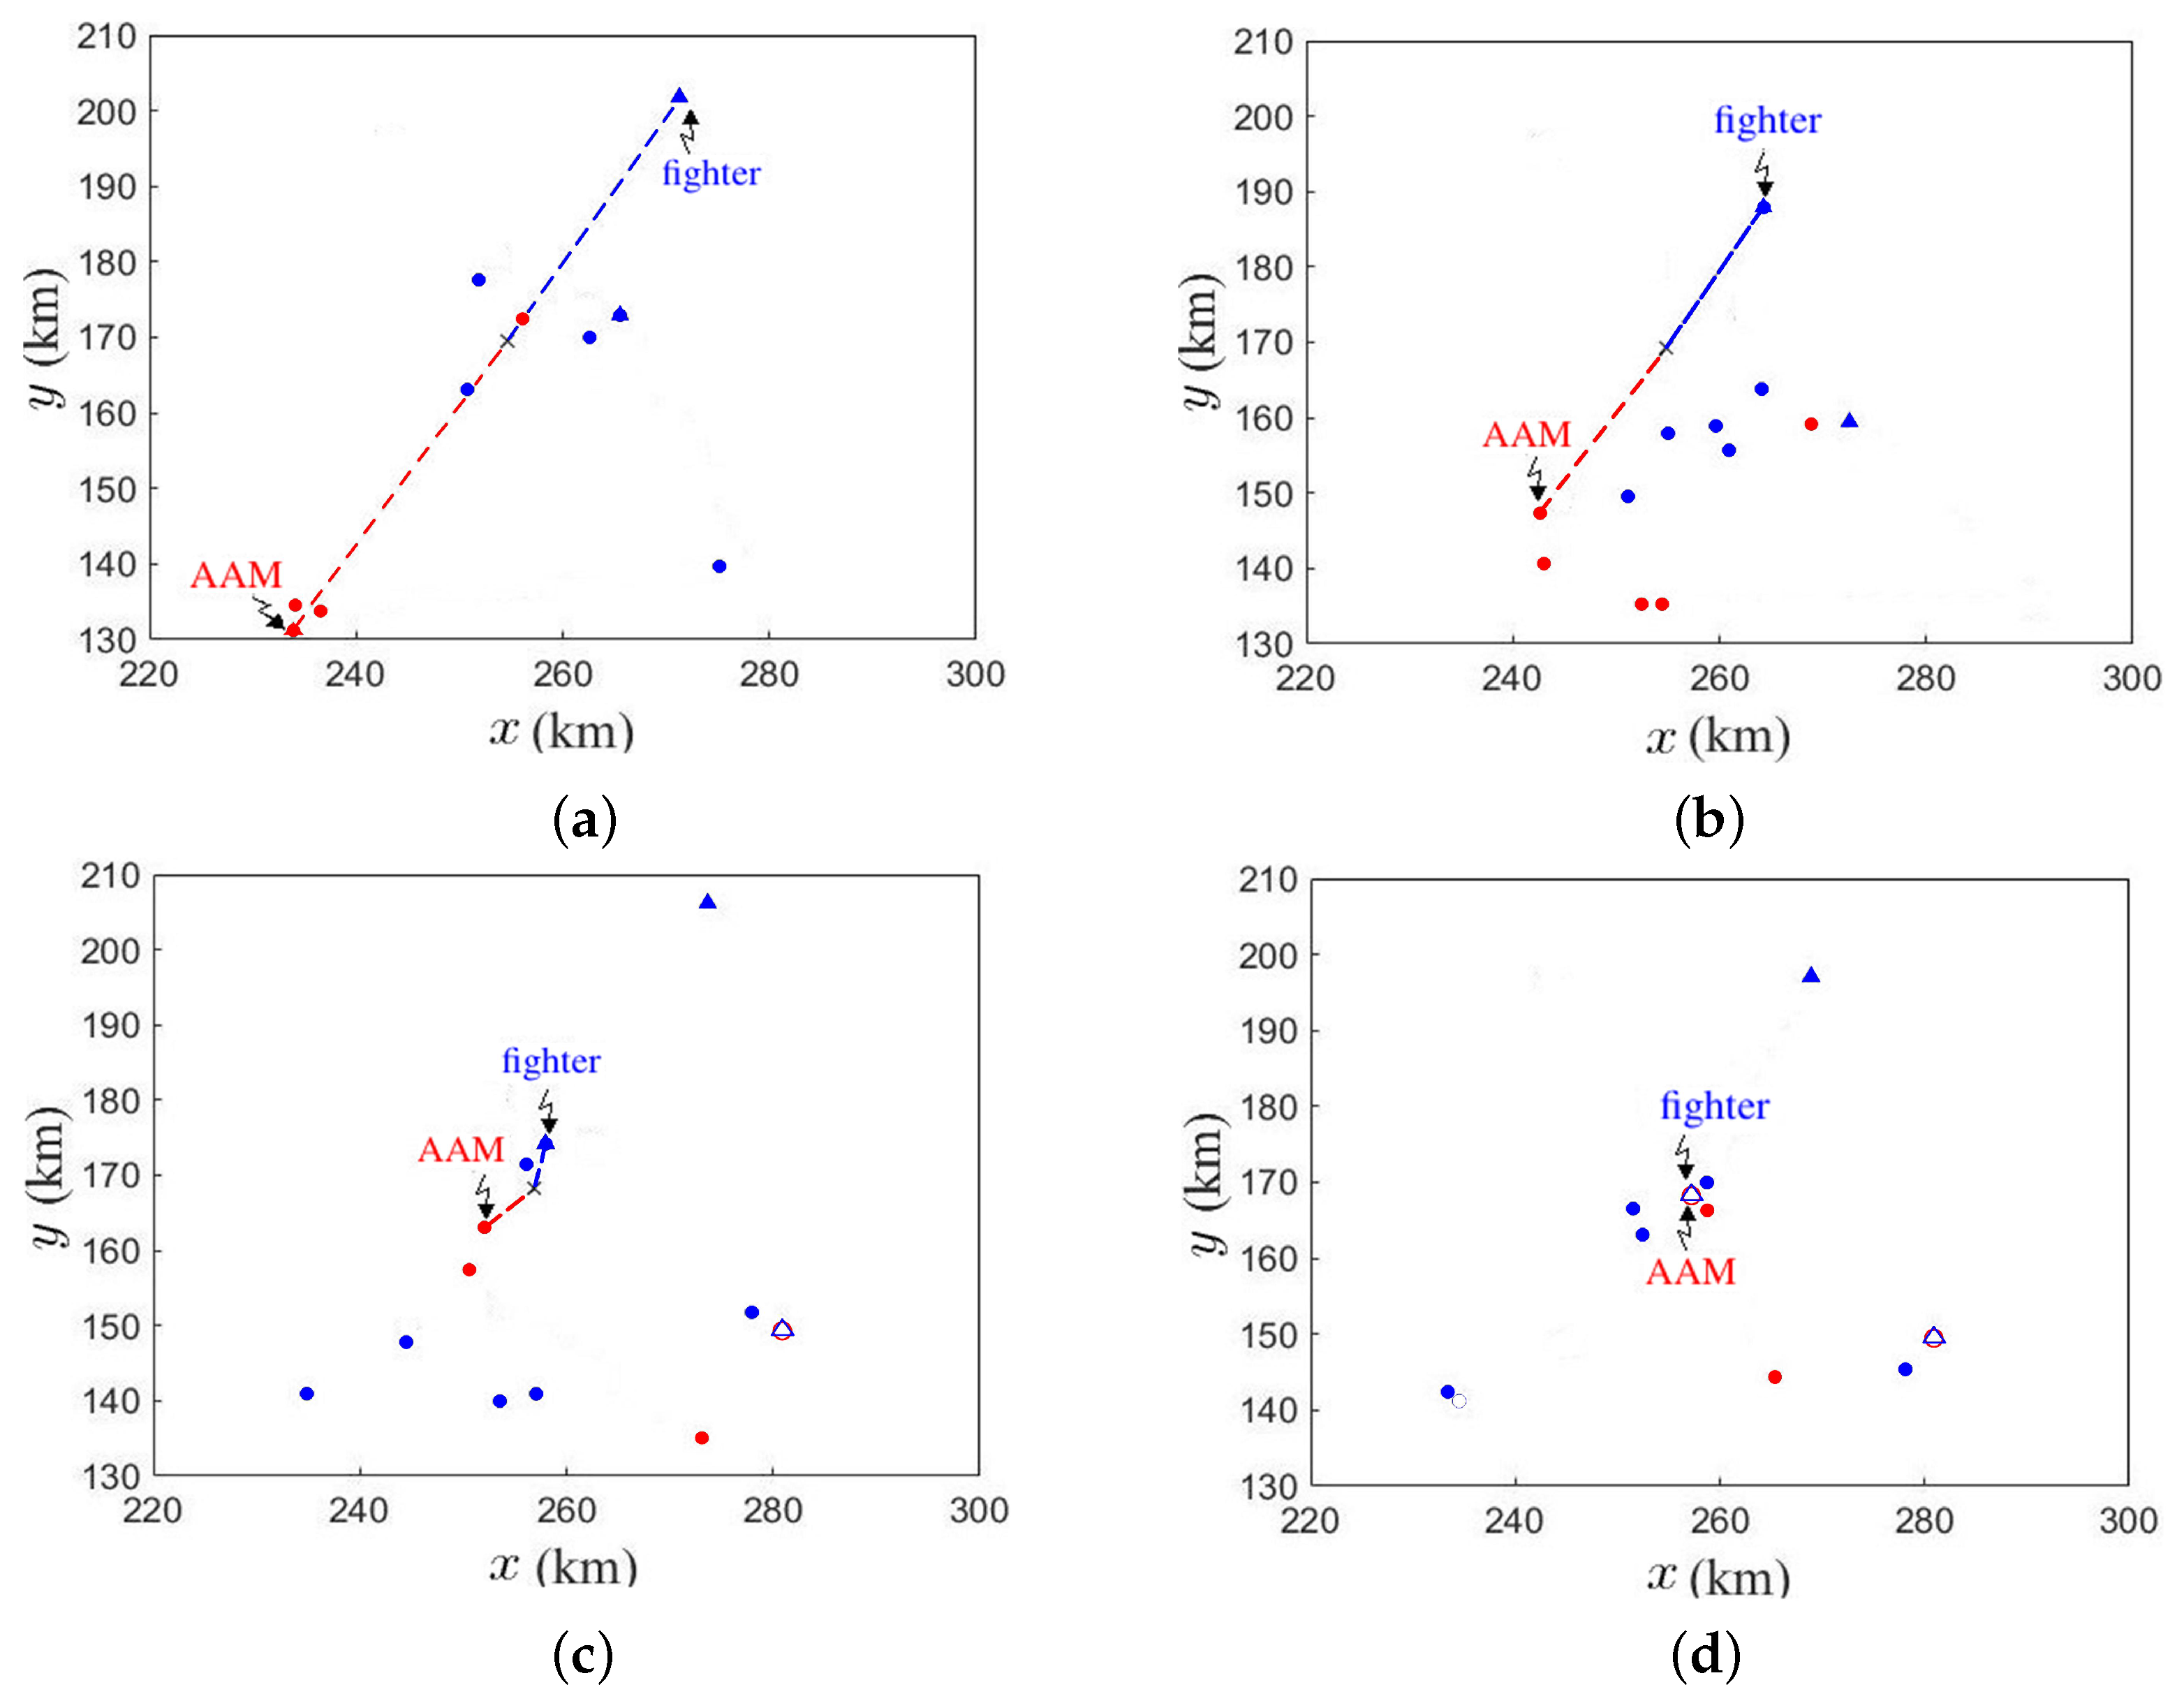
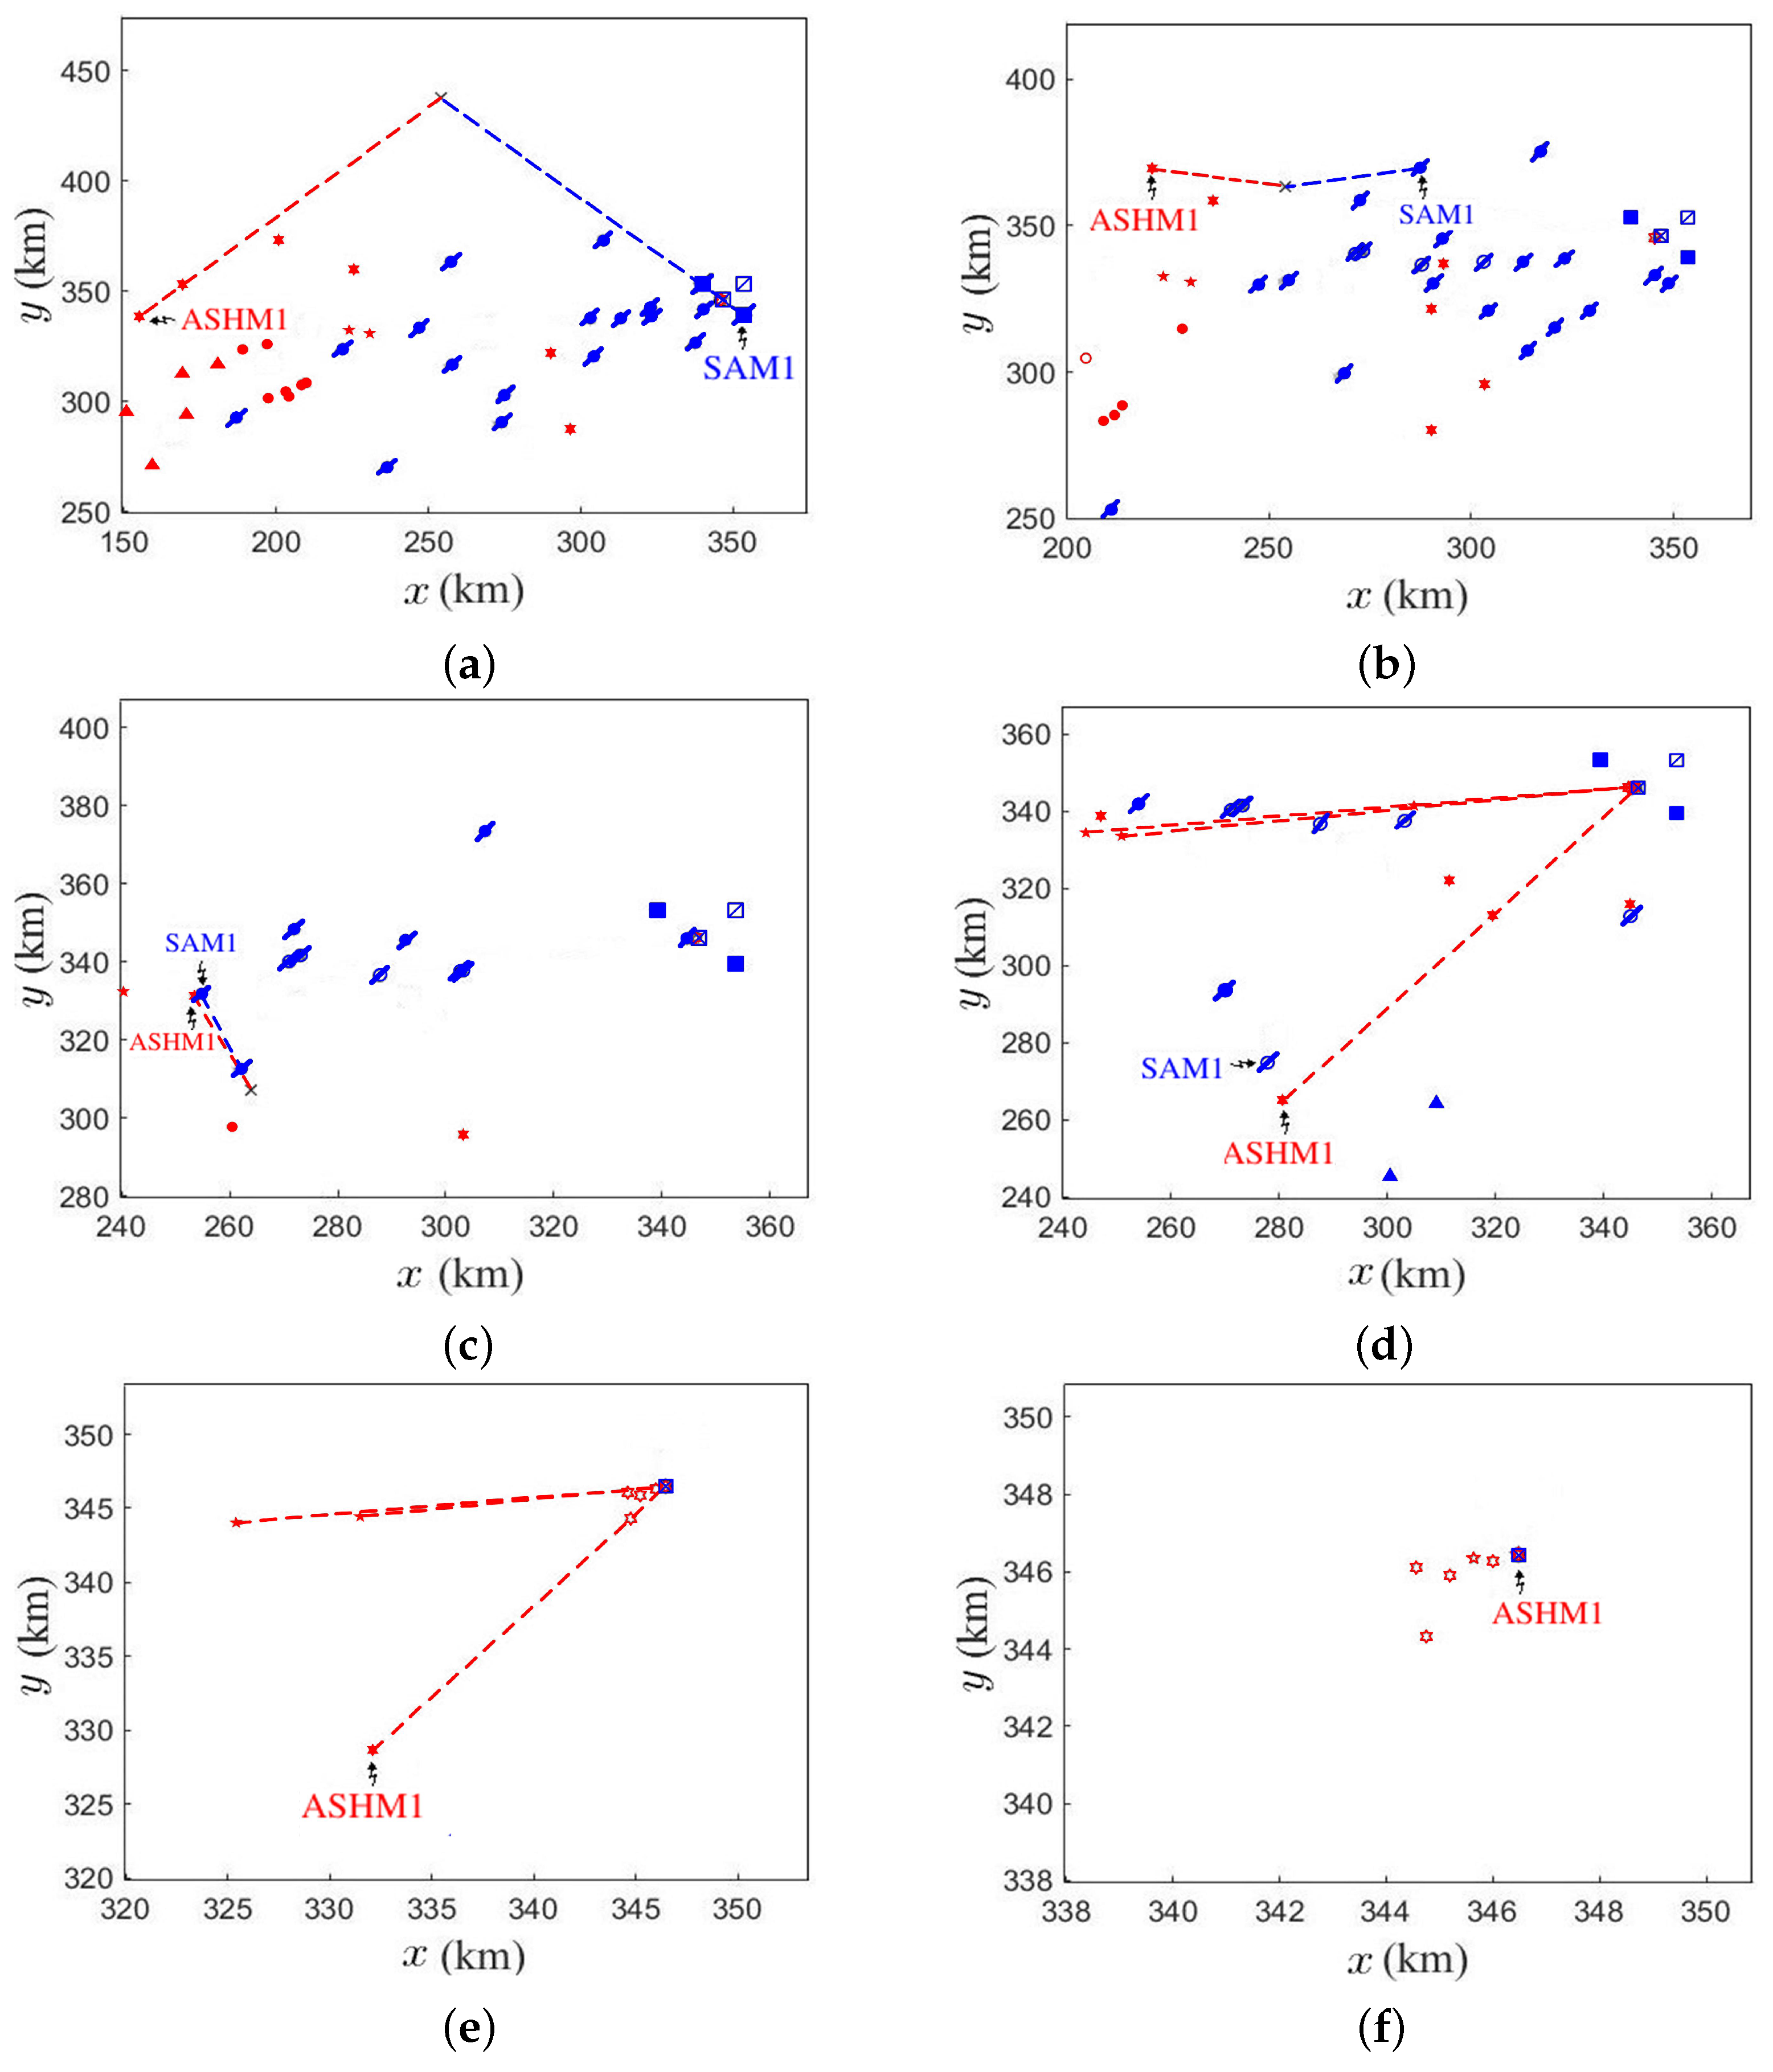
Figure 19 demonstrates a specific game on A1/B1, with an AAM from fleet A intercepting a fighter from fleet B. The symbols defined in the caption apply to all the cases elaborated in this section.
Figure 19a shows that at
s, a fighter from fleet A detects an enemy fighter and launches an AAM to intercept the latter.
Figure 19b shows that at
s, the marked fighter detects the AAM and begins to evade, while the AAM closes in on the marked fighter at high speed.
Figure 19c shows that at
s, the AAM flies close to the marked fighter.
Figure 19d shows that at
s, the AAM successfully hits the target, 120 s after launching.
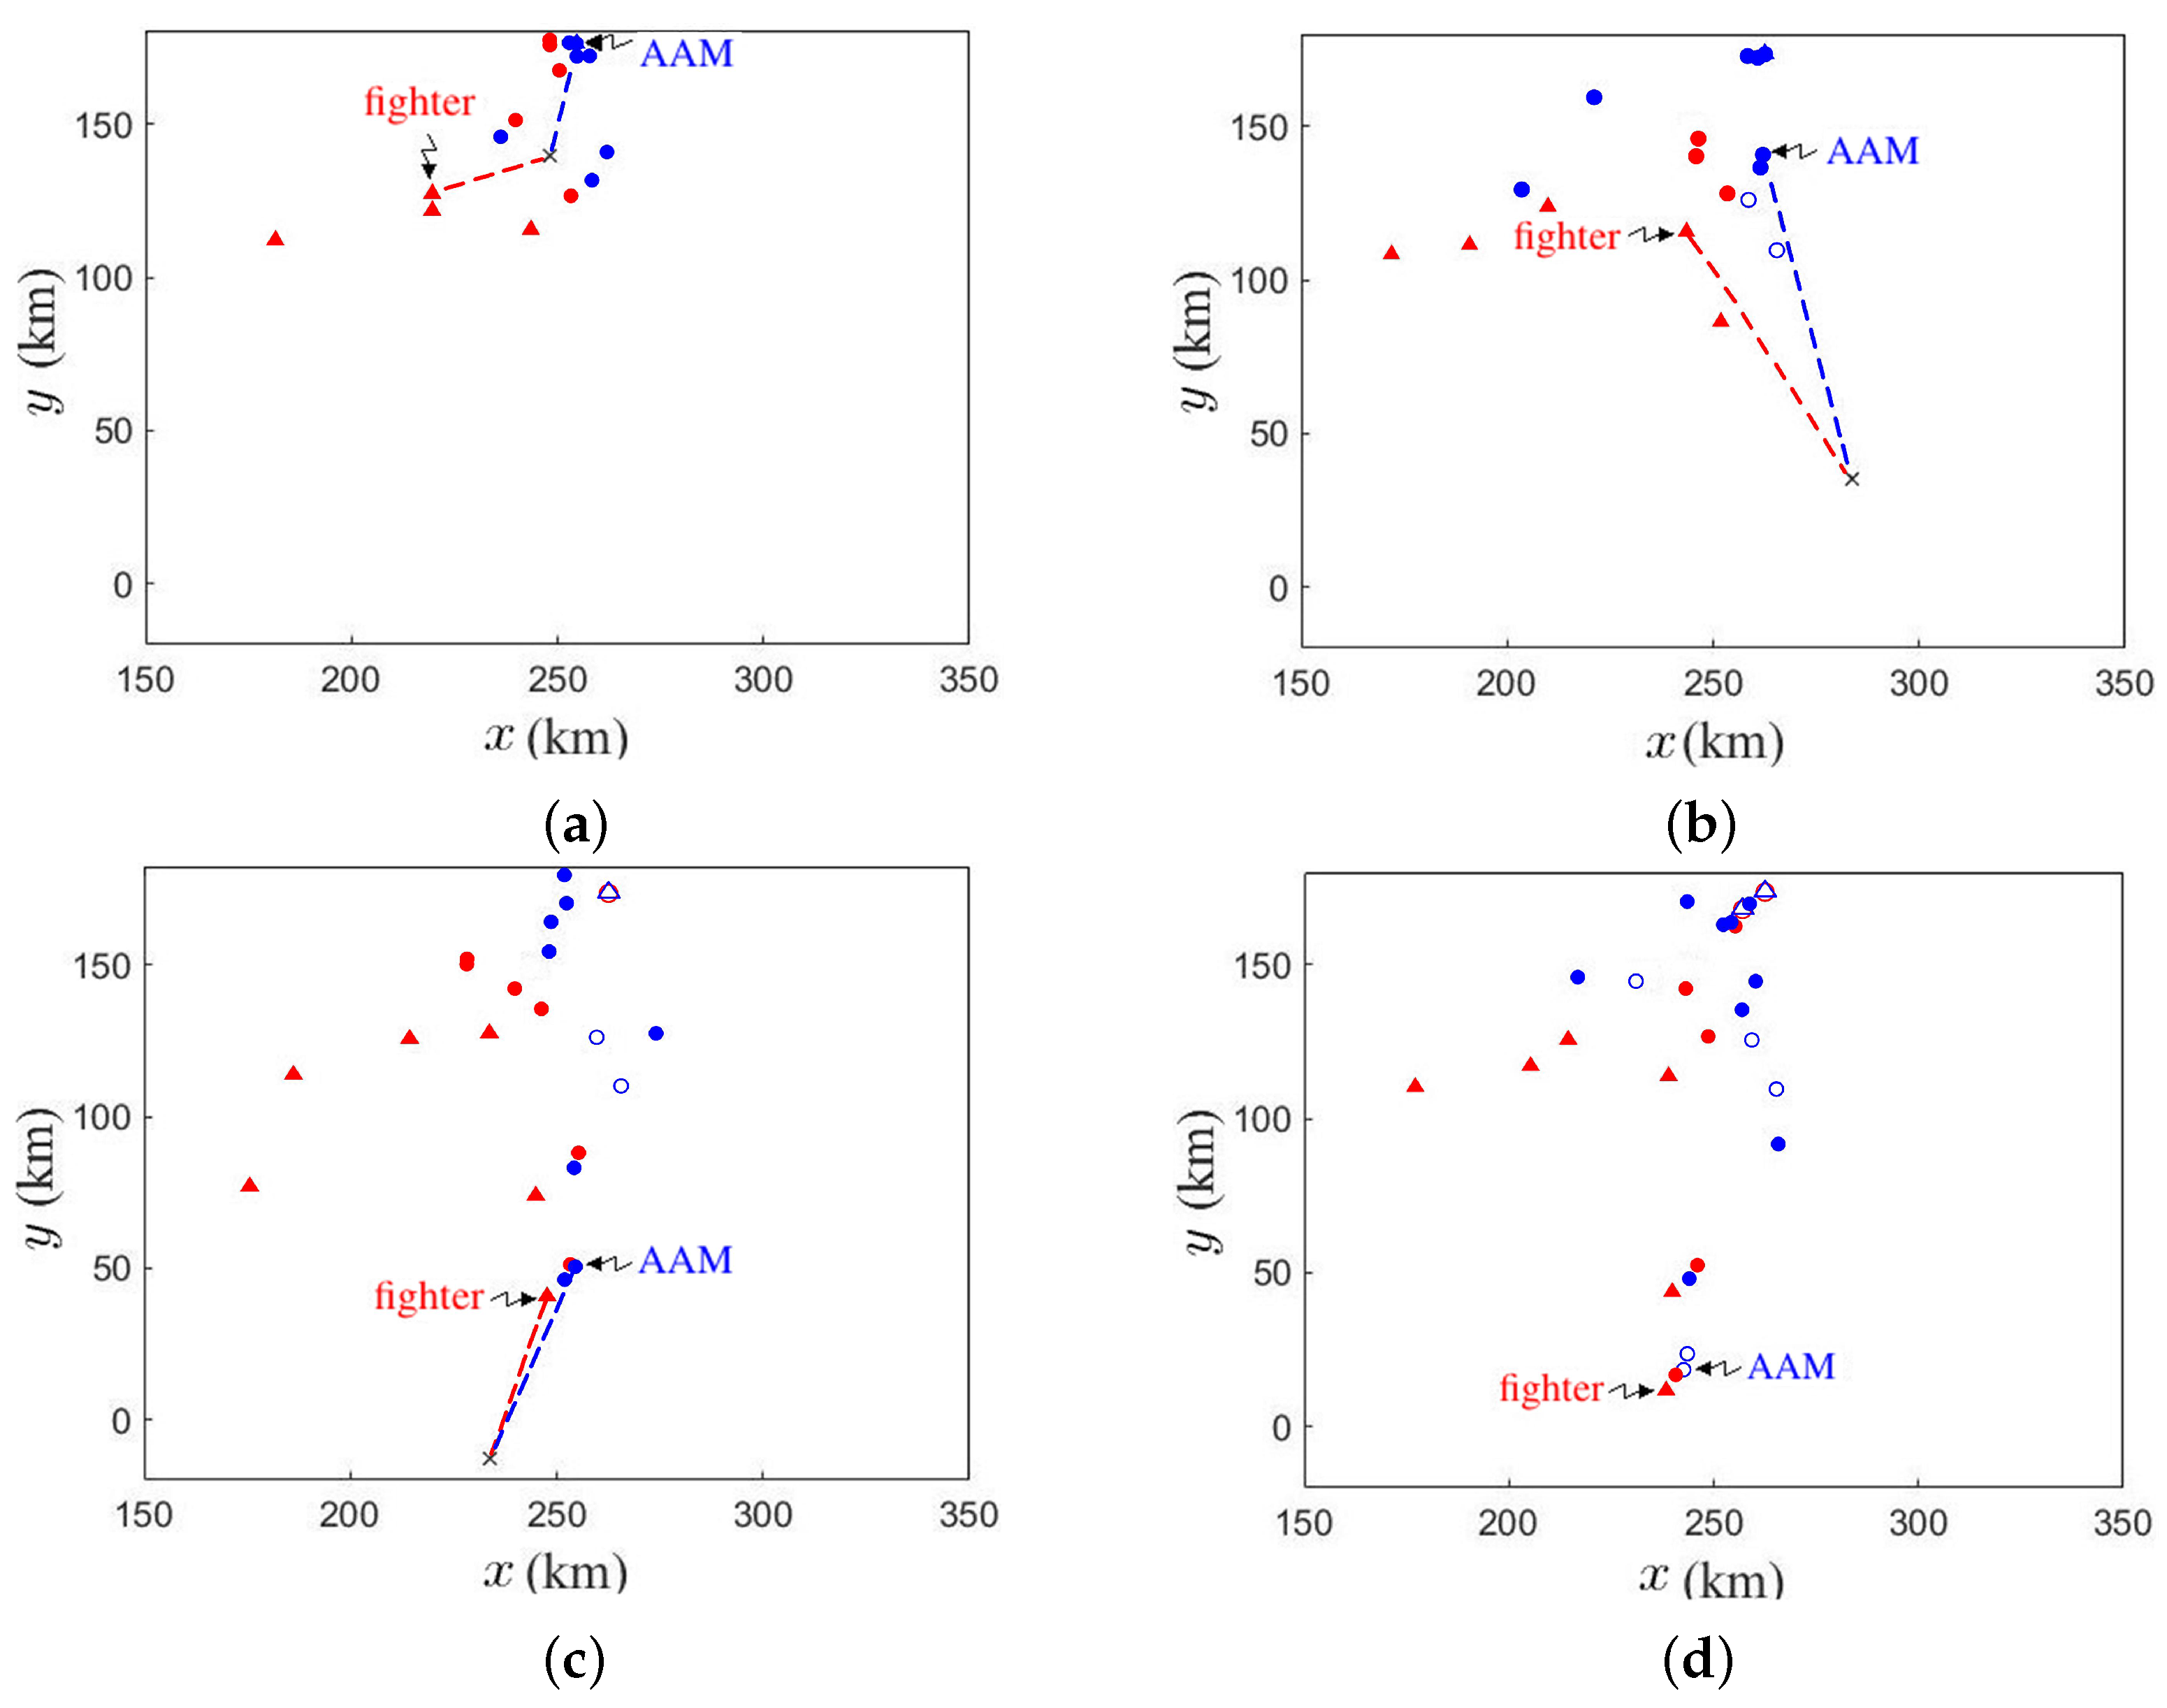
Figure 20 demonstrates a specific game with an AAM from fleet B intercepting a fighter from fleet A.
Figure 20a shows that at
s, a fighter from fleet B detects an enemy fighter and launches an AAM against it. The relative speed between the AAM and the target fighter is lower than that if they fly head on.
Figure 20b shows that at
s, the fighter changes its cause to evade while the AAM flies towards a farther intercept point than that in
Figure 20a.
Figure 20c shows that at
s, even though the AAM is very close to the marked fighter, but the relative speed is too low to hit the latter.
Figure 20d shows that at
s, the AAM burns out fuel and the fighter survives.
7.2. A1/B2
The P
SO objective function of fleet A quickly converges to 1 as option 1 is chosen. The objective function of fleet B converges to a high value of 11 since CV-A is targeted.
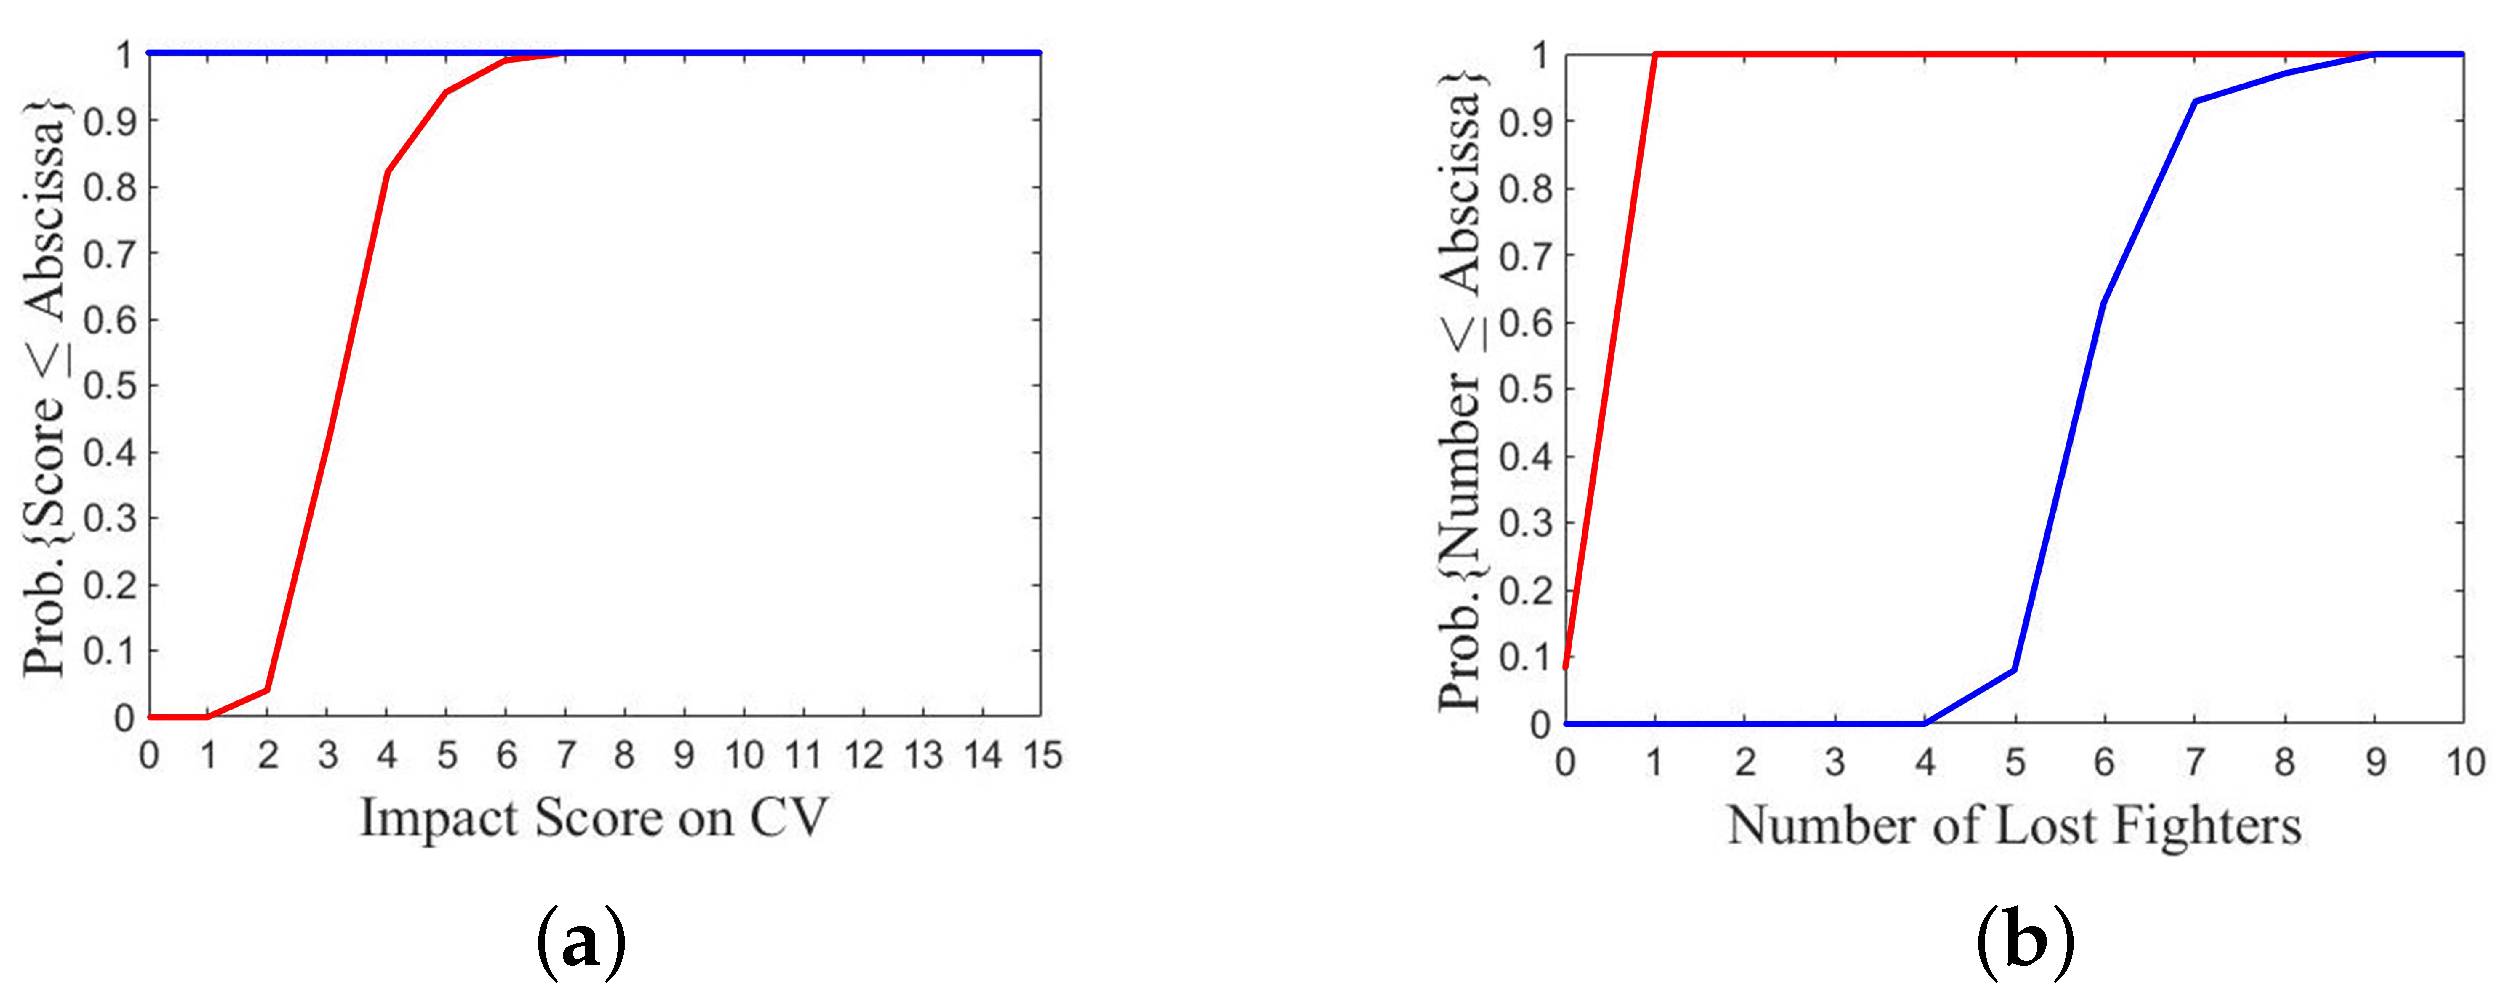
Figure 21 shows the outcome of a specific P
SO run on A1/B2 over 100 games.
Figure 21a shows that fleet B takes payoff from USD 0.4B to USD 0.7B, while fleet A takes payoff from USD 2.2 B to USD 7.2 B, takes higher than USD 3.4 B in 57 games, much higher than anticipated under option 1.
Figure 21b shows that the impact score on CV-A ranges from 3 to 11, and the score is 5 to 7 in 78 games.
Figure 21c shows that fleet A loses no fighter in 97 games, while fleet B loses 4 to 8 fighters, and 6 fighters in 61 games.
A closer examination reveals that the optimal flying angle of ASHMs from CG-B make them difficult to intercept with SAMs from fleet A. The first SAM fired to intercept an approaching ASHM often burns out of fuel in the pursuit, and another SAM has to be fired to intercept the same ASHM. With the optimal flying angles of fighters from both fleets, the AAMs fired by fighters from fleet A chase away the fighters from fleet B, but later either burn out of fuel or are hit by AAM from the marked fighter.
The fighters from fleet A chase the fighters from fleet B far away from the alert radius of DDG-A. Meanwhile, DDG-A quickly uses up all SAMs against the approaching ASHMs. Later, the fighters from fleet B fly towards CV-A after evading the AAMs from fleet A, and each fighter launches two ASMs when it reaches the attacking range. At this stage, all SAMs are used up and CV-B becomes a sitting duck, with CIWS as its last gate keeper. With proper timing, one of ASMs penetrates the CIWS and hits CV-A.
Figure 22 shows the flight path of an ASHM from CG-B.
Figure 22a shows that at
s, one DDG-A fires the first SAM to intercept an approaching ASHM.
Figure 22b shows that at
s, the first SAM is still chasing the ASHM.
Figure 22c shows that at
s, the first SAM burns out of fuel, and the DDG-A fires a second SAM to intercept the same ASHM.
Figure 22d shows that at
s, the second SAM is still chasing the ASHM.
Figure 22e shows that at
s, the second SAM also burns out of fuel, and the DDG-A fires a third SAM to intercept the ASHM.
Figure 22f shows that at
s, the ASHM burns out of fuel. By firing three SAMs to intercept one ASHM, all SAMs will be exhausted quickly.
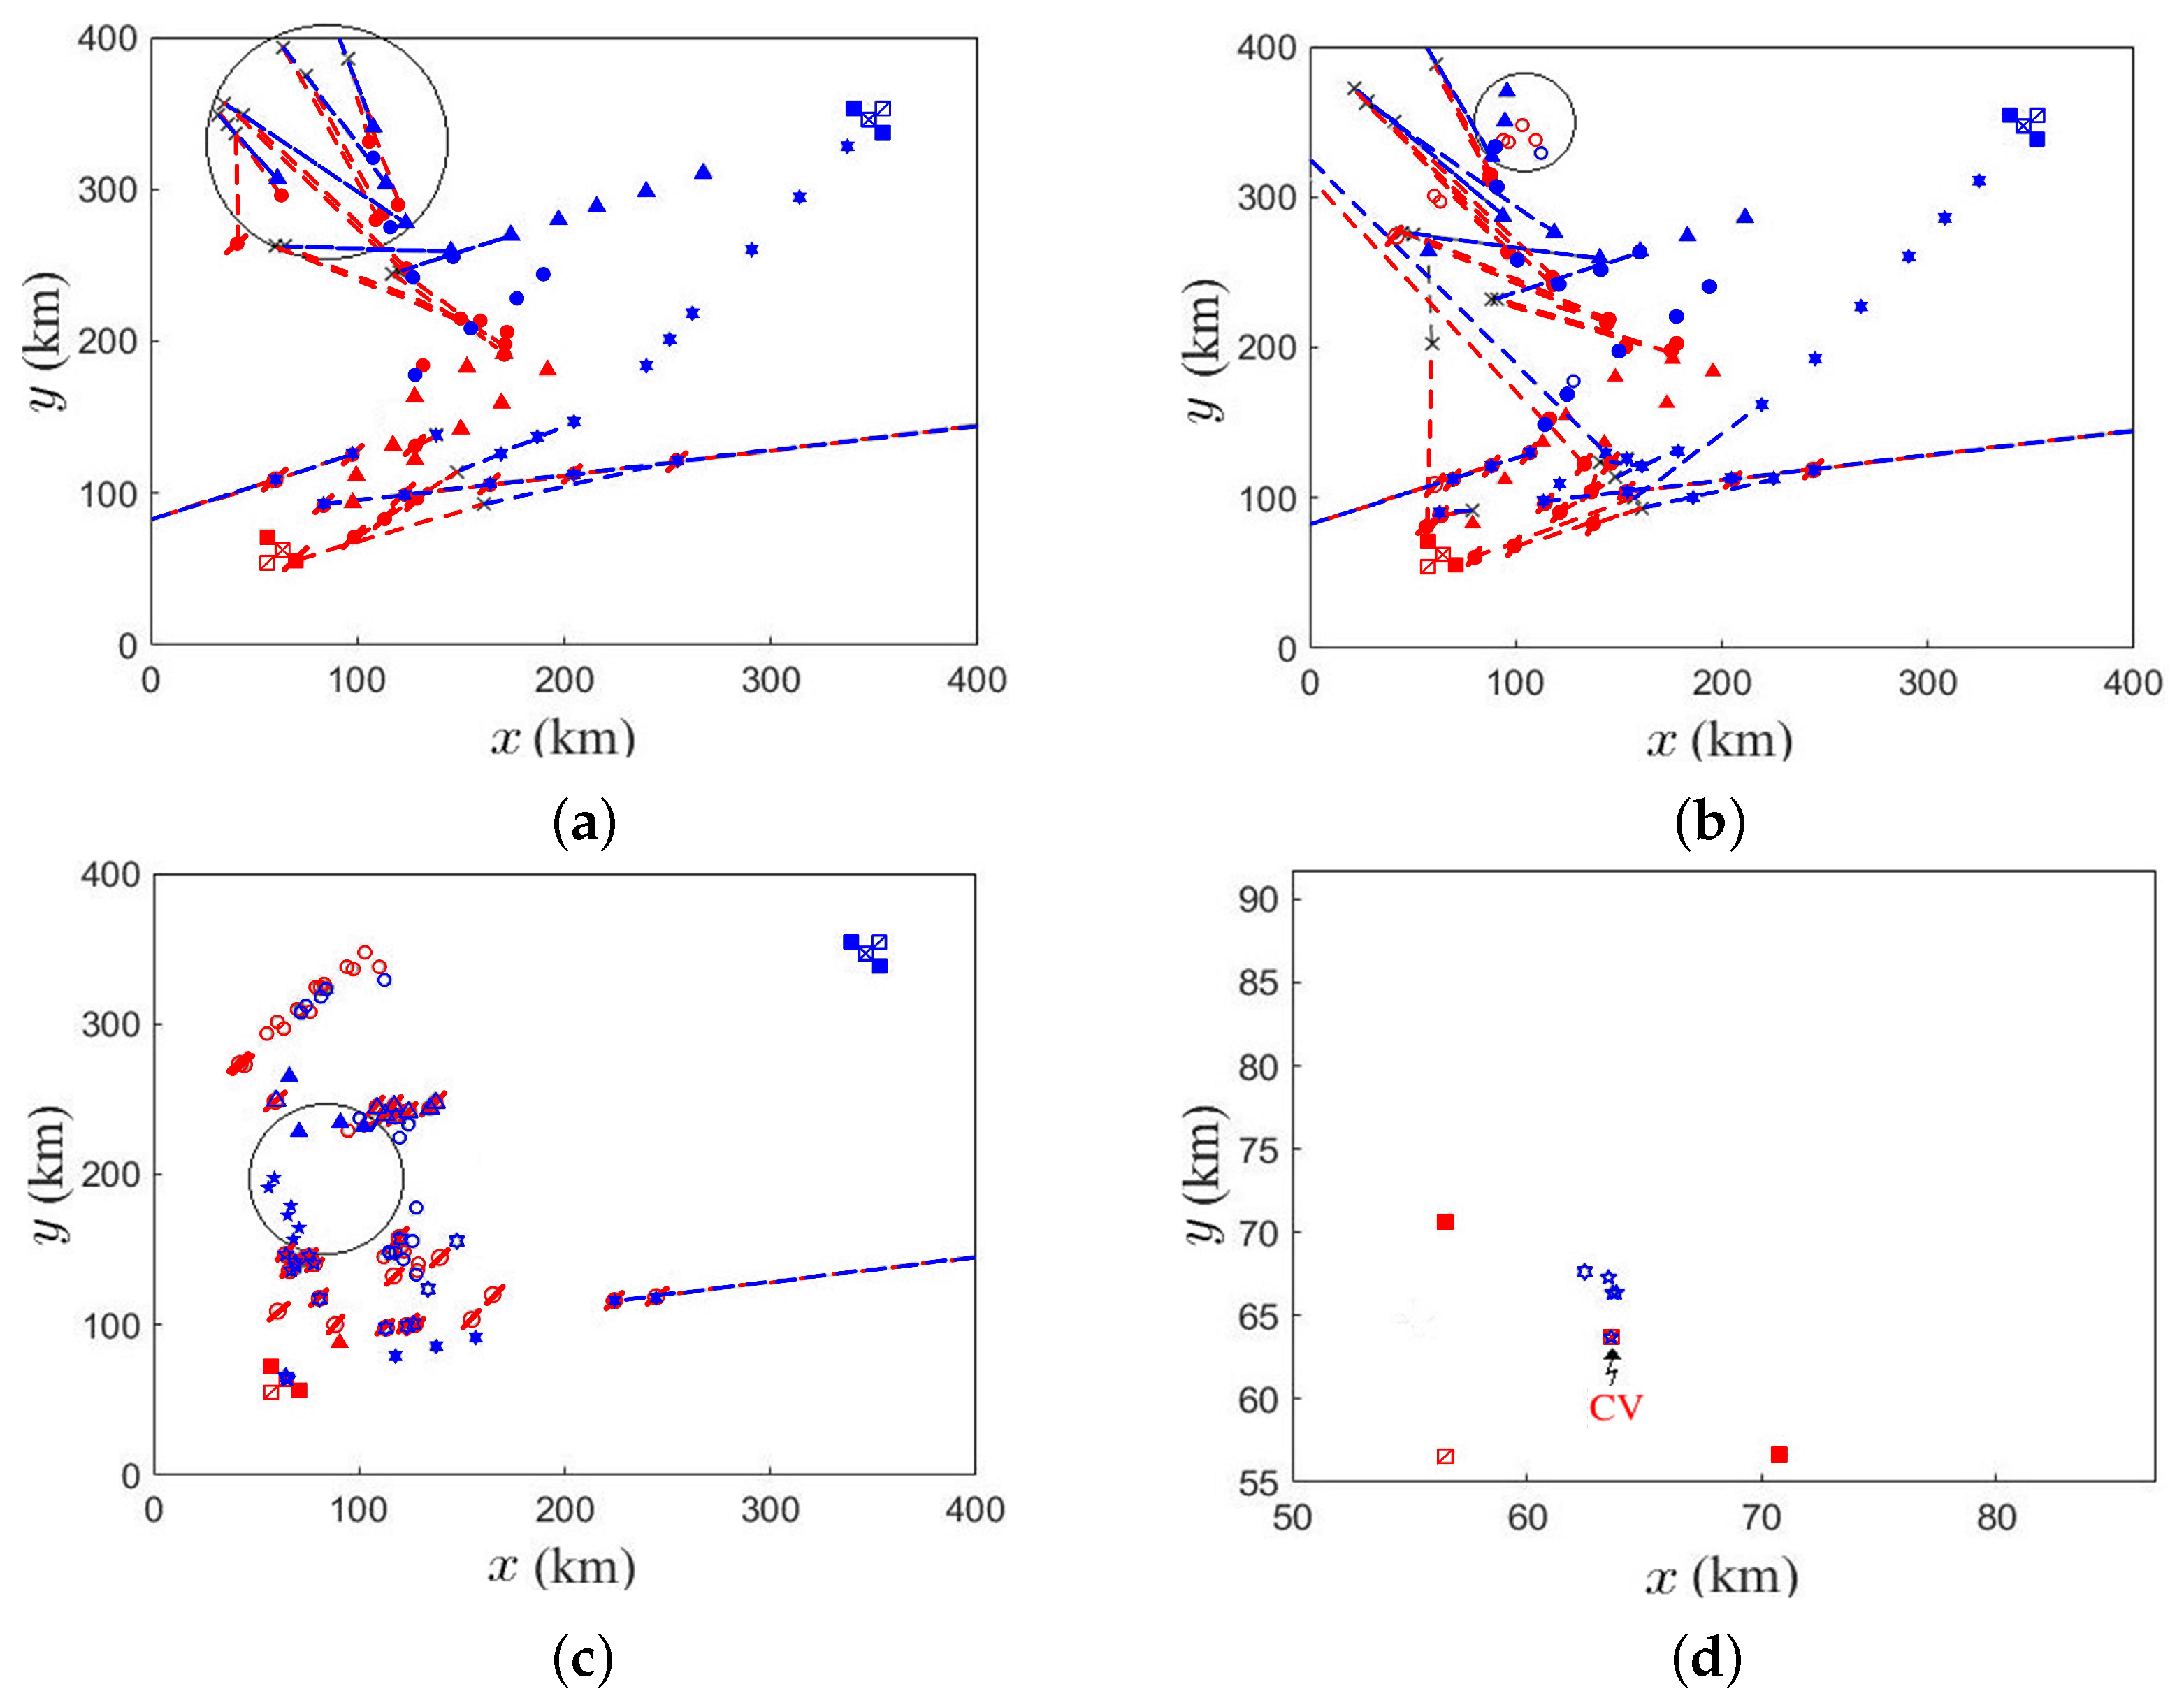
Figure 23 shows the scenario of fighters from fleet B attacking CV-A after DDG-A uses up all SAMs. The circle in
Figure 23a shows that at
s, four fighters from fleet B are chased away to the upper left region by AAMs fired by fighters from fleet A. Meanwhile, several SAMs are fired upon ASHMs from CG-B. The circle in
Figure 23b shows that at
s, the AAMs fail to intercept the enemy fighters because burning out of fuel or hit by the marked fighters. The circle in
Figure 23c shows that at
s, three fighters return from the upper left region, firing six ASMs to attack CV-A. DDG-A now has no spare SAMs to intercept these ASMs.
Figure 23d shows that at
s, CV-A is hit by ASMs.
7.3. A2/B3
The P
SO objective functions of fleets A and B quickly converge to 10 and 7, respectively. The objective function of fleet A is higher because it focuses the attack on CV-B.
Figure 24 shows the results of a specific P
SO run.
Figure 24a shows that the payoff of fleet A looks normal, but that of fleet B is higher than expectation. The lowest, median, and highest payoffs of fleet B are USD 2.3 B, USD 5.4 B, and USD 7.3 B, respectively, and the payoff is higher than USD 4B in 87 games.
Figure 24b shows the impact score on CV-B ranges from 3 to 12, and is higher than 6 in 56 games.
Figure 24c shows that fleet A loses only one fighter in 82 games.
When the ASHMs and fighters from fleet A fly near DDG-B1, SAMs are fired to intercept the fighters. When DDG-B1 runs out of SAMs, the ASHMs from CG-A lure the SAMs fired from DDG-B2 to burn out of fuel in chasing them. In the later stage of the game, a few ASMs from fleet A survive the SAMs or no SAMs are spared for them, the remaining ASMs and ASHMs on the fly can simultaneously attack CV-B.
Figure 25 shows the move of an ASHM from CG-A when DDG-B1 runs out of SAMs.
Figure 25a shows that at
s, a SAM is fired by DDG-B2 to intercept an ASHM from CG-A.
Figure 25b shows that at
s, the SAM moves closer to the ASHM.
Figure 25c shows that at
s, the SAM moves to the proximity of ASHM, but the intercept point is far away.
Figure 25d shows that at
s, the SAM burns out of fuel. No SAM is available to intercept the ASHM, and the latter turns to fly straight towards CV-B.
Figure 25e shows that at
s, the ASHM closes in on CV-B and coordinates simultaneous attack with two near-by ASMs.
Figure 25f shows that at
s, CV-B is hit by one ASM and the ASHM.
7.4. A3/B3 with 100% Kill Probability
The distributions of payoff, impact scores on different vessels and number of lost fighters are affected by the optimal tactical parameters, as well as the kill probability of missiles and CIWS. To highlight the effects of optimal tactical parameters, we set the kill probability of missile and CIWS to 100% in an A3/B3 contest scenario. It is observed that the two objective functions are close to each other and have the same value over more than 30 iterations. The objective function of fleet B increases after the 58th iteration when the its global best position is updated according to the previous game results. The objective functions can be further increased as the iteration moves on.
By using the results of a specific PSO run to play 100 games, with the kill probability of missiles and CIWS set to 100%, it is observed that the payoff and impact scores of both fleets remain the same game after game. For fleet A, the payoff is USD 1.86 B, the impact scores on CV, CG, DDG and fighter are 2, 1, 0, and 2, respectively. For fleet B, the payoff is USD 0.66 B, the impact scores on CV, CG, DDG and fighter are 0, 2, 0, and 1, respectively. In all the previous cases where the kill probability is less than 100%, the distributions of payoff and impact scores of each fleet spread over certain interval, revealing uncertainty of missile or CIWS in hitting its target. When the kill probability is set to 100%, each hit by missile or CIWS on a target within its impact radius or firing range will succeed. Thus, the outcome of a game is solely determined by the tactical parameters optimized with the PSO algorithm.
A large payoff difference between two fleets is mainly attributed to the impact score on CV-A by ASMs. CV-A is hit by two enemy ASMs while CV-B remains intact. The optimal initial flying angles of fighters from fleets A and B are and , respectively. In the early stage of the game, all the ASHMs from both fleets are marked and intercepted by enemy SAMs. In the later stage, only ASMs are used to attack the enemy CV while all the enemy SAMs are used up, leaving CIWS to defend the vessels. If the two ASMs fired by a fighter are about equally distant from the target vessel, the latter can be hit. However, the initial flying angle of fighters from fleet A does not meet the condition for two ASMs from a fighter to simultaneously reach the target vessel, the two ASMs are sequentially hit by the CIWS. In contrast, the initial flying angle of fighters from fleet B renders two ASMs fired by a fighter to simultaneously reach the target vessel, leaving one of the two ASMs to penetrate the CIWS and hit CV-A.
A scenario of two ASMs from the same fighter of fleet B attacking CV-A is closely examined. At s, two ASMs at a separation of 6.15 km close in on CV-A. The CIWS hits ASM2 at s, but is not ready to engage ASM1. Then, ASM1 hits CV-A at s.
Another scenario of two ASMs from a fighter of fleet A attacking CV-B is also closely examined. At s, two ASMs at a separation of 7.11 km close in on CV-B. ASM2 is hit by the CIWS of CV-B at s. At s, ASM1 is also intercepted by CIWS before hitting CV-B. In this case, the separation between two ASMs is wide enough for the CIWS to sequentially engage them.
7.5. Lessons Learned
By inspecting the specific game on A1/B1, if an incoming interceptor or missile moves in opposite direction to that of its target, the former is likely to hit the latter. On the contrary, if an incoming interceptor or missile moves far from opposite to the moving direction of its target, the latter is likely to evade alive.
From the specific game on A1/B2, if an agent turns out to attract many enemy interceptors, the defense capability of the enemy will be weakened in the later stage of the game and become vulnerable to the follow-up attacking agents.
In the specific game on A2/B3, attacking agents can be coordinated effectively to have one group luring and exhausting enemy SAMs from DDGs, followed by another group to close in on the target.
The specific game on A3/B3 with 100% kill probability demonstrates the possibility of firing two ASMs from the same fighter to break through the defense of enemy CIWS, by adjusting the flying angle of fighter for the two ASMs to reach the target simultaneously.
8. Retrospective Discussion
In this work, we try to design a matched game, without dominant factors or overwhelming agents, in order to observe subtle nuances that may affect the outcome of a game. Thus, we make straightforward assumptions that two fleets have equal size and capability, that is, both fleets are the same in number of vessels and weapons, fleet formation, rules of engagement, cost of vessels and weapons, kill probability, optional goals, and objective functions.
The speed of ships is approximated as zero since they move much slower than fighters and missiles, and the fighters and missiles are assumed to move at constant speed in 2D space. The costs of assets are the construction cost or replacement cost.
The weaknesses of this work are directly related to the aforementioned assumptions, which can be remedied by designing the game and algorithms for two fleets with different sizes and capabilities, and extending the game scenario to 3D space. However, this will increase the complexity of game designs and the difficulty of analysis on game outcomes. This work takes a trade-off between complex reality and simple principles of operation, aiming to gain some lessons and insights through the war games.
We have found no comparable game designs or approaches in the literature. A major reason is that our approach integrates many types of episodes in a versatile game scenario. The game rules in each type of episode are clearly specified and each type of episode can find compatible works in the literature, such as evading and pursuing. However, a complete game composed of different types of episode is rare in the literature, ruling out possible performance comparison with existing literature. Instead, we focus on the game results and their implications, which are essential to the purpose of conventional war games.
We do not use analytical methods, such as game-theoretic method and Lanchester’s equations, to derive the solution for comparison, because there are too many factors speculated in the game scenario. The interaction among a large number of agents and the uncertainty aroused by imperfect kill probability create numerous unexpected outcomes, as presented in
Section 5,
Section 6 and
Section 7.
Machine learning methods are versatile, but they require tremendously long training time due to so many factors just mentioned. With all these considerations, we propose a heuristic-oriented variant of PSO algorithm to search for the optimal tactical parameters under given goal options from both fleets. The optimization process requires the outcome of tactical operation after playing a game between both fleets, which adds another dimension of complexity to the game design.
We do not know how the commanding officer of a fleet will act or react on site. They may avoid head-on clash by taking alert poise (close to option 1), or focus on the major target of CV while reducing loss to own fleet (close to option 2), or take an all-out assault at all costs (close to option 3). In this work, three options are devised for contest, and the outcomes of games are presented in terms of payoffs on both fleets, in statistical forms. The simulation results and their statistics should be useful to the commanding officer or decision-makers.
This work tries to encompass as many real-life factors as possible, including prototypical episodes of chase between pursuer(s) and evader(s), interception, simultaneous attack, target assignment, path planning, defense, CIWS as last line of defense, and so on. The strategy or goal-setting of each fleet is boiled down to three goal options, defensive, taking major targets at affordable cost, and all-out at all cost. The tactical parameters required to implement each option, given opponent’s option, are optimized by using the proposed PSO algorithm, which is an extension of conventional PSO algorithm, with affordable computer resources.
An important war game between two fleets has been designed, focusing on the contest between three strategical options and the associated tactical optimization. Many useful prototypical episodes reported in the literature are seamlessly knitted into this work. Since intangible factors beyond these two fleets themselves are capricious, a fair play will be to presume both fleets have equal size and equal capability, and the values of these assets are their tangible construction cost. Assuming all other conditions the same, we can compare the efficacy of these three goal options against one another, as well as the tactical optimization tailored to implement the chosen goal option. The payoffs of both fleets, based on their construction cost, are used to assess the risk of taking one option against the other.
An attempt to design a closer to real-life war game may run the risk of including too many real-life factors or constraints, such as intangible value of fleet or its constituents. The simulation outcomes and their interpretations may become speculative and ambiguous, gaining some insights but losing the clear picture.
