Article

Experimental Study on the Growth Pattern and Flexural Strength Characteristics of Rafted Ice

1
School of Chemical Engineering, Ocean and Life Sciences, Dalian University of Technology, Panjin 124221, China
2
CNOOC Research Institute Ltd., Beijing 100010, China
3
Ningbo Institute of Dalian University of Technology, Ningbo 315000, China
*
Author to whom correspondence should be addressed.
Oceans 2025, 6(4), 62; https://doi.org/10.3390/oceans6040062
Submission received: 7 July 2025 / Revised: 3 September 2025 / Accepted: 9 September 2025 / Published: 29 September 2025
(This article belongs to the Special Issue Oceans in a Changing Climate)

Abstract

As a critical factor in ice load calculation for marine structures in cold regions, the growth mechanism and mechanical properties of rafted ice urgently require clarification. This study systematically investigated the growth patterns and flexural strength characteristics of rafted ice through laboratory-prepared specimens. Experimental results indicate that the thickness of rafted ice exhibits a negative correlation with both ambient temperature and initial ice thickness during growth. Due to the higher porosity of its frozen layer, the density of rafted ice decreases by approximately 8% on average compared to single-layer ice. Three-point bending tests demonstrate that, under the combined effect of high tensile strength in the lower ice layer and energy absorption by the porosity of the frozen layer, the flexural strength of rafted ice ranges from 1.12 to 1.34 times that of single-layer ice.

1. Introduction

In the design of marine engineering structures in cold regions, conical or sloping structures are adopted to transform the traditional crushing failure mode of sea ice against vertical structures into a flexural failure mode, significantly reducing the extreme ice forces on the structure [1]. As the area most severely affected by sea ice disasters in China, ice-resistant oil and gas platforms in the Bohai Sea commonly utilize conical structural designs [2]. Key parameters for ice load calculation on such structures are ice thickness and the flexural strength of sea ice. Rafted ice, as one of the primary ice types in the Bohai Sea, is generally categorized into layered rafted ice and finger rafted ice. Layered rafted ice is formed by an upper ice layer, a lower ice layer, and a frozen layer in between. Finger rafted ice results from the accumulation of internal stresses due to uneven forces within an initially frozen ice skin [3,4,5]. Since layered rafted ice forms more readily than finger rafted ice and can reach thicknesses several times that of level ice, leading to significantly increased ice loads on structures, this paper focuses on layered rafted ice. Given that accurately assessing ice loads is a critical requirement for offshore platform design and maintenance [6], clarifying the growth mechanism and flexural characteristics of rafted ice is particularly crucial.
In recent years, most relevant research on the formation mechanism, thickness, and rafting length of rafted ice has been conducted using field measurement data. Rafted ice generally forms between two level ice sheets of similar thickness [7,8,9]. If the thicknesses of the level ice sheets differ significantly, ice ridge formation becomes more likely [8,9].
Observations of rafted ice in Arctic waters by Weeks et al. [10] and Kovacs et al. [7] revealed that when level ice thickness ranges from 0.15 to 0.3 m, multiple ice floes are more likely to transition from rafted ice to ridges. Due to distinct differences in growth environment temperature and thickness across various sea areas, the thickness and number of layers in rafted ice also vary considerably. Rafted ice in the Southern Ocean, Sea of Okhotsk, Norton Sound, and Tuktoyaktuk can have up to 8 layers, with maximum thicknesses around 9.2 m and horizontal extents reaching several kilometers [11,12,13,14]. In the Bohai Sea, rafted ice typically consists of multiple layers of single-layer ice with thicknesses ranging from 2 cm to 10 cm. The number of overlapping layers decreases as ice thickness increases. Multi-layer overlapping of single-layer ice thicker than 10 cm is rarely observed at sea [15]. Based on an analysis of sea ice mechanical property parameters in the Liaodong Bay, LI et al. [4] concluded that the thickness of individual layers within rafted ice does not exceed 26 cm. Due to the complexity of rafted ice formation, which makes field observation studies challenging, this paper adopts a laboratory-based method for preparing rafted ice to reveal the influence mechanisms of factors such as ambient temperature and single-layer ice thickness on the growth process of rafted ice.
Currently, extensive research has been conducted by domestic and international scholars on the growth mechanism and flexural strength characteristics of single-layer ice, clarifying the influence of physical parameters such as design ice thickness, temperature, and salinity [15,16]. By analyzing the coupled effects of multiple factors like porosity and brine volume, predictive models for the flexural strength of single-layer ice have been established [17,18,19,20,21]. In contrast, research on the mechanical properties of rafted ice has primarily focused on compressive and shear strengths, with studies on its flexural strength still lacking [22]. Poplin et al. [23], using artificially prepared rafted ice in Norton Sound, found that the average strength (2.50 MPa) of rafted ice samples loaded horizontally at a strain rate of 10−3/s was similar to that of shore-fast ice (2.59 MPa). Shafrova et al. [24], studying rafted ice in Adventfjorden and the laboratory, demonstrated that the physical properties of the ice (temperature, salinity, and density) and the size of the ice blocks are key parameters affecting the frozen bond strength. Bailey et al. [3], based on indoor tests, revealed that the shear strength of the frozen layer in rafted ice was 30% lower than that of level ice. Chen et al. [25], in a comparative study using Bohai Sea rafted ice samples, found that the compressive strength of rafted ice and level ice was similar under ductile failure modes, while rafted ice was significantly lower under brittle failure modes. ISO 19906 (2019) [26] does not elaborate on the strength characteristics of rafted ice. Q/HSn 3000 [16] recommends that the extreme flexural strength values for rafted ice in different ice zones and return periods should be taken as 0.8 times the corresponding values for single-layer ice. HY/T 047 [15] suggests that the flexural strength of rafted ice exhibits a linear relationship with its design ice thickness. As these two specifications employ different calculation methods, significant discrepancies exist in the computed flexural strength of rafted ice. Li et al. [27] pointed out that the provisions for rafted ice thickness and strength in Q/HSn 3000 [16] and HY/T 047 [15] differ considerably from actual platform observations. They recommended conducting mechanical property tests on rafted ice near coasts and engineering sea areas, alongside laboratory experiments on rafted ice generation laws and structural failure interaction models, to study the failure mechanisms of rafted ice-structure interaction.
Currently, research on the flexural strength of rafted ice remains unclear, necessitating further experiments to provide more data and theoretical support for the design of ice-resistant structures. To clarify the growth pattern and flexural strength characteristics of rafted ice, this paper artificially prepares rafted ice in a low-temperature laboratory and analyzes the influence of various factors on its growth process from a thermodynamic perspective. Furthermore, based on three-point bending tests, the flexural strength and elastic modulus of rafted ice are investigated, aiming to provide a more accurate theoretical basis for the design of conical and sloping ice-resistant structures in marine engineering.

2. Experimental Methods

2.1. Specimen Preparation

Due to the difficulty in obtaining natural rafted ice, existing research often relies on artificial preparation methods [23,24,25]. In this study, rafted ice was prepared six times, both outdoors and indoors. Outdoor preparation utilized the cold winter environment to simulate natural sea ice formation conditions. Insulating materials were placed around the preparation mold to allow ice to grow and freeze from top to bottom under natural conditions. Indoor preparation was conducted in a low-temperature laboratory. To simulate the natural sea ice environment temperature, which experiences transient warming and cooling cycles during winter growth, the indoor test temperature was set to vary between −10 °C and −3 °C.
Sea salt was weighed using an electronic balance with a precision of 0.01 g to prepare a saline solution with a concentration of 8‰. This solution was injected into the preparation mold, and partitions were added. At the freezing time t0 for a single layer, once the single ice sheet reached the predetermined thickness, the partitions were removed to obtain multiple single-layer ice sheets. These sheets were then pushed underneath each other to stack them. After a freezing time of t1, the brine layer between the stacked ice plates transformed into a granular frozen layer, and the preparation of rafted ice was completed. Its internal multilayer structure (Figure 1a) is consistent with that reported in the literature (Figure 1b).
For each case, a corresponding single-layer ice specimen under the same conditions was prepared as a control Single-layer ice samples under equivalent conditions were prepared as control groups for each scenario. Samples were taken from the ice sheets of each scenario. The measured salinity was 2–4‰ for outdoor scenarios and 4–6‰ for indoor scenarios. Parameters during preparation, including ambient temperature T, single-layer ice freezing time t0, and rafted ice consolidation time t1, are listed in Table 1.

2.2. Rafted Ice Flexural Strength Test Method

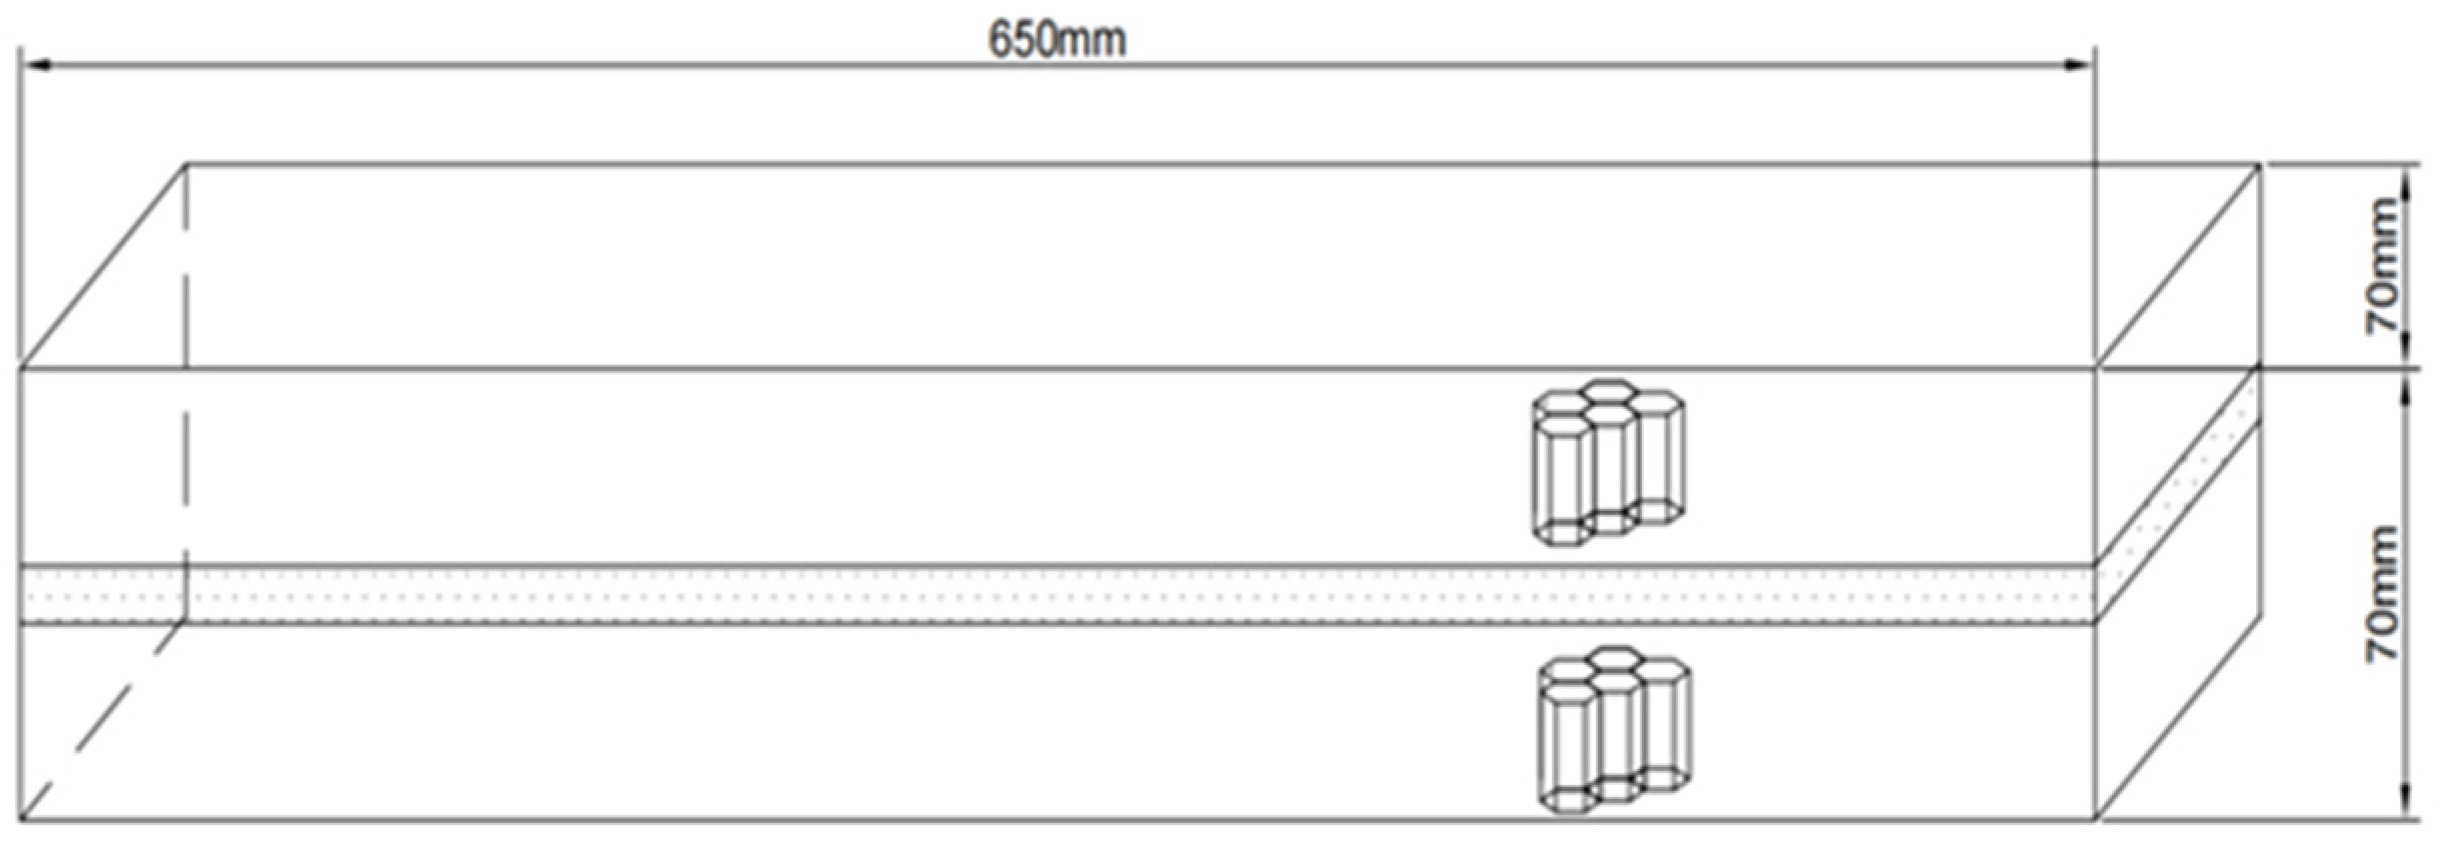
When sea ice interacts with sloping structures, it fails in bending, with the primary force direction perpendicular to the sea surface. Therefore, the long axis of the processed sea ice specimen was parallel to the ice surface, and the upper side corresponded to the top surface of the sea ice [28]. Following the specimen size recommended in HY/T 047 [15], the dimensions for flexural strength testing were 70 mm × 70 mm × 650 mm, as shown in Figure 2. The actual measured dimensions of the specimens were used.
As shown in Figure 3, a universal testing machine was used to conduct three-point bending tests on ice specimens in a low-temperature environment. The maximum loading capacity of the testing machine was 50 kN. Test force data was automatically acquired by a sensor. Flexural strength was determined from the maximum load.
The flexural strength σ f and effective elastic modulus E f of the specimens were calculated using the following formulas:
σ f = 3 2 F max L w d 2
E f = F max L 3 4 w d 3 δ max
where σ f is the flexural strength of the ice specimen (MPa); F max is the maximum bending load (N); L is the span between loading supports (600 mm); w is the width of the ice specimen (mm); d is the height (depth) of the ice specimen (mm); E f is the effective elastic modulus (MPa); δ max is the displacement at the mid-span of the ice beam when the peak force is reached (mm).

3. Analysis of Rafted Ice Growth Phenomena

3.1. Growth Pattern of Rafted Ice Thickness

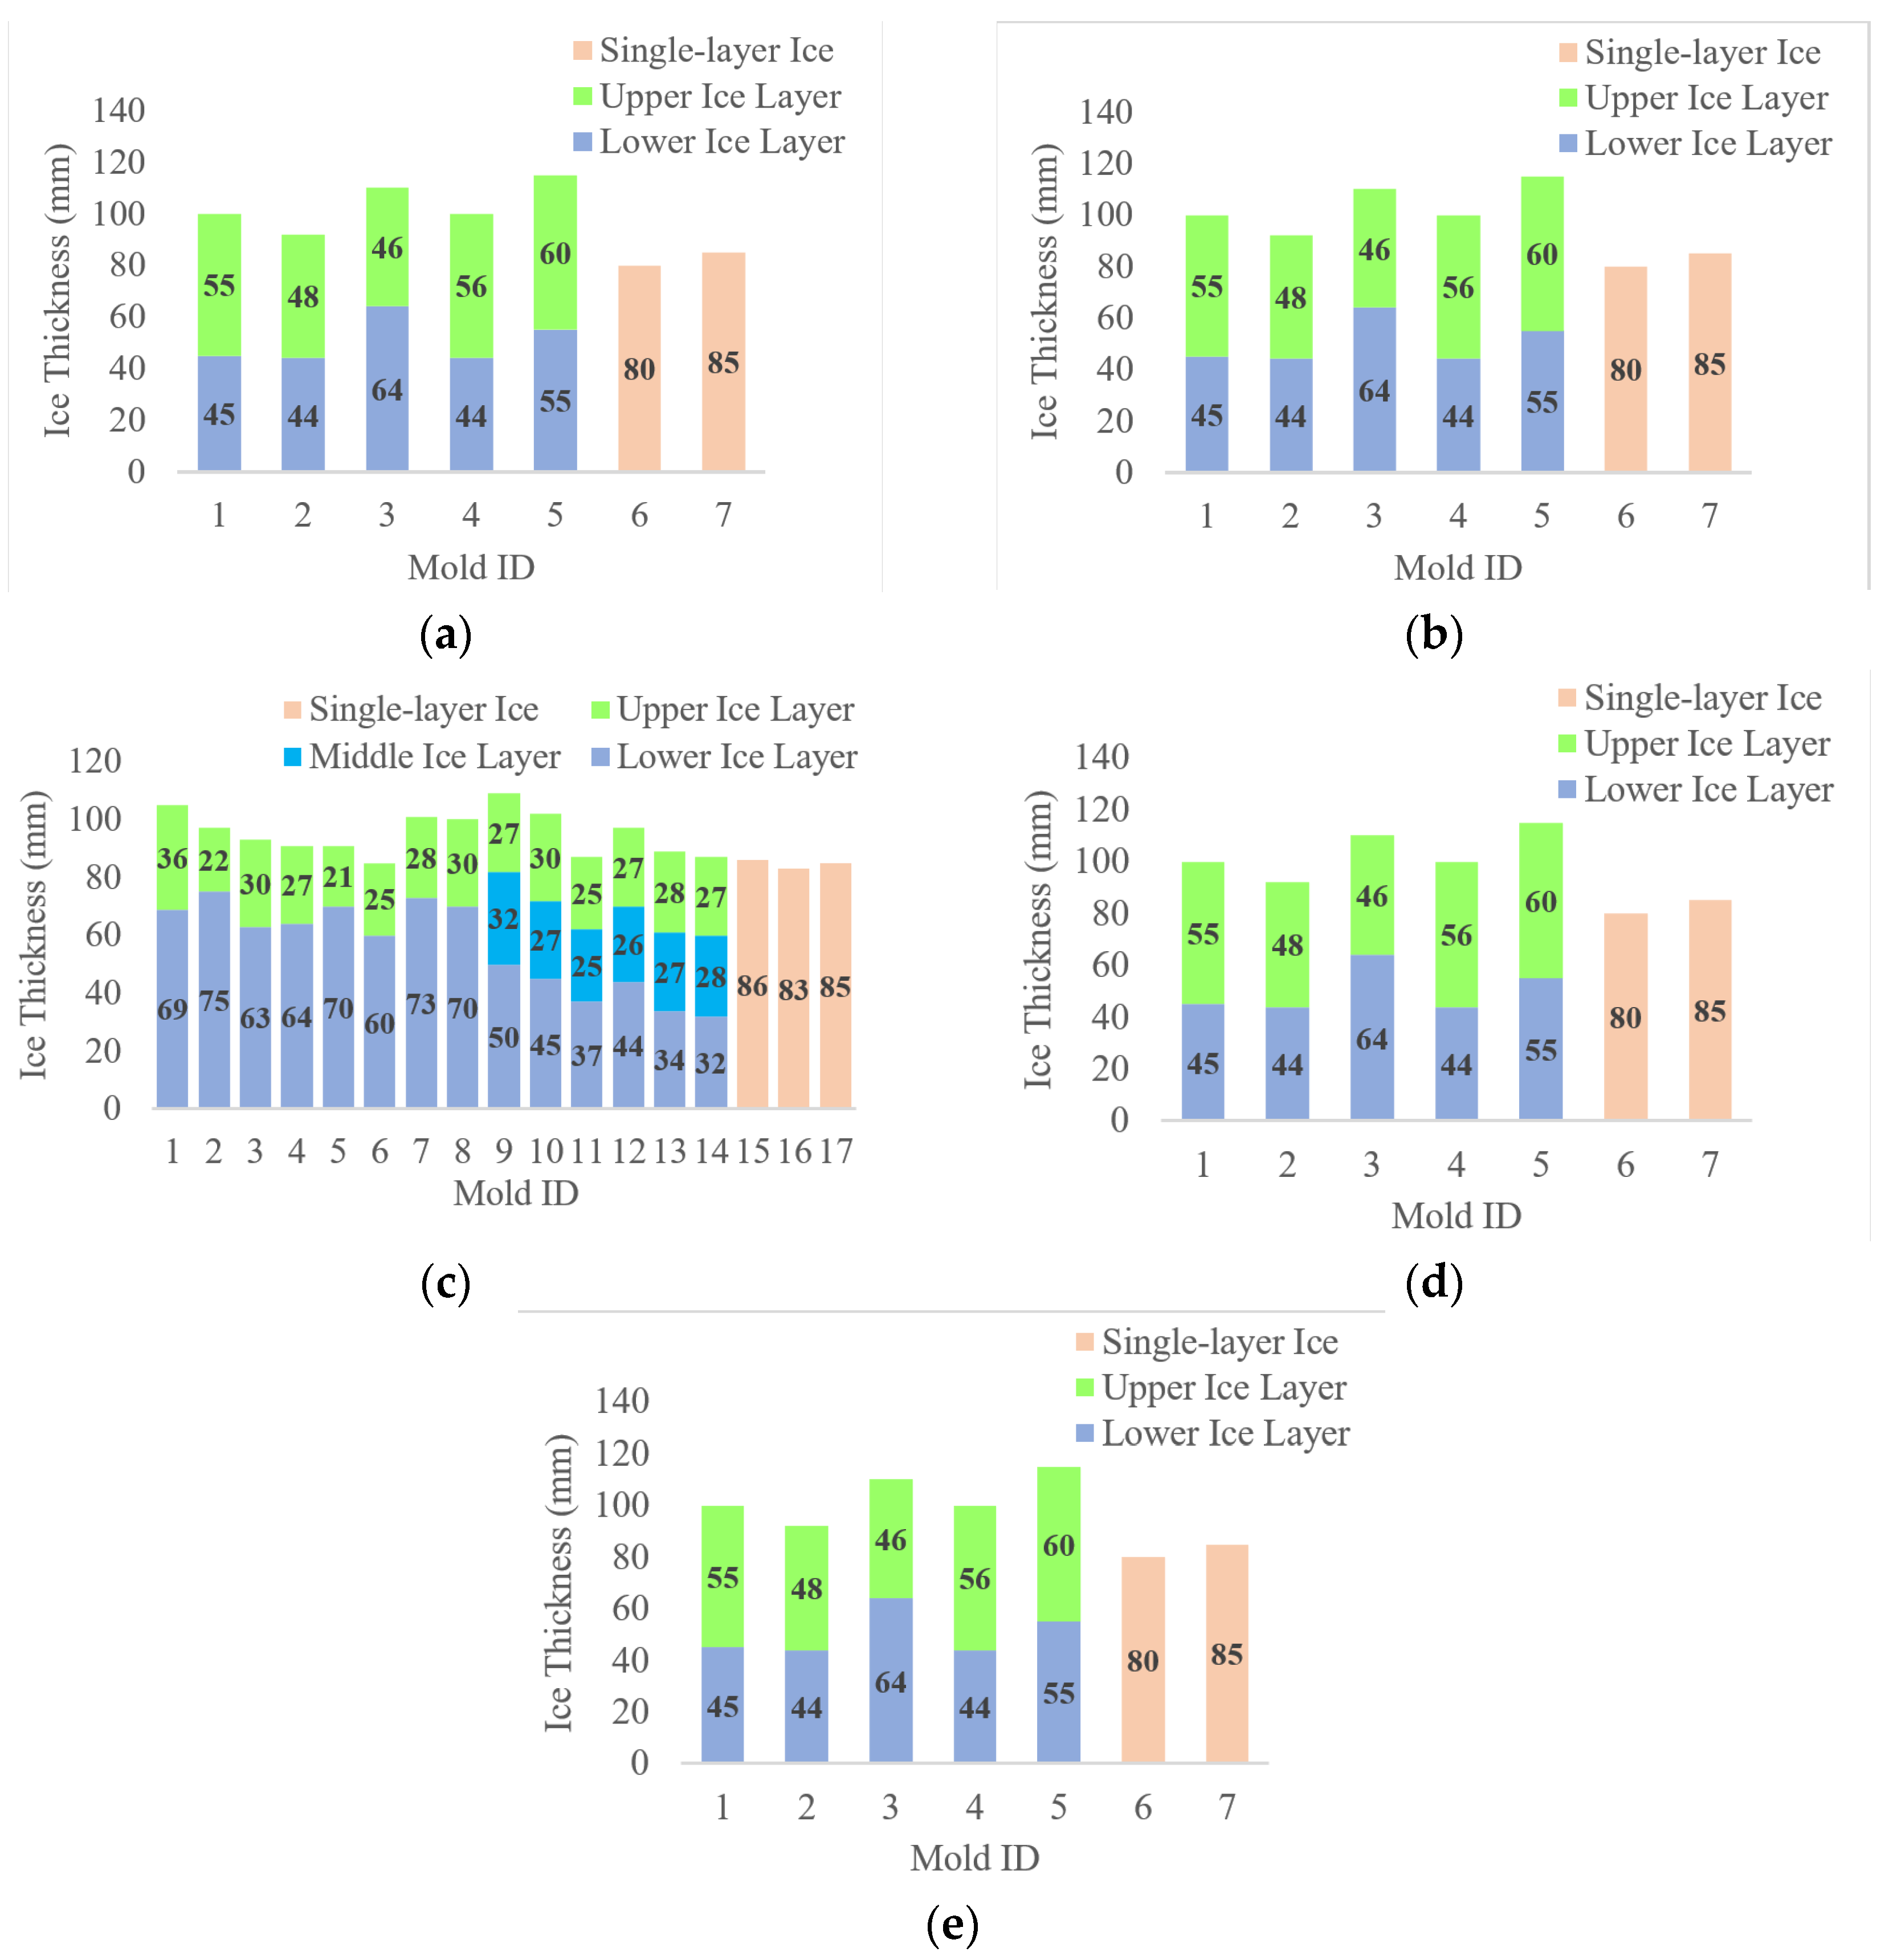
To investigate the influence of ambient temperature and initial ice thickness on the growth process of rafted ice, this paper analyzed the thickness growth patterns and the growth process thickness distribution of rafted ice for scenarios No. 1, No. 2, No. 4, No. 5, and No. 6, shown in Figure 4 and Figure 5 respectively. Scenario No. 4 involved 3-layer rafted ice. Since the frozen layer thickness was thin (3–6 mm, ≈6% of total thickness), its influence was neglected in subsequent analysis, focusing only on the thickness changes of the upper and lower ice layers.
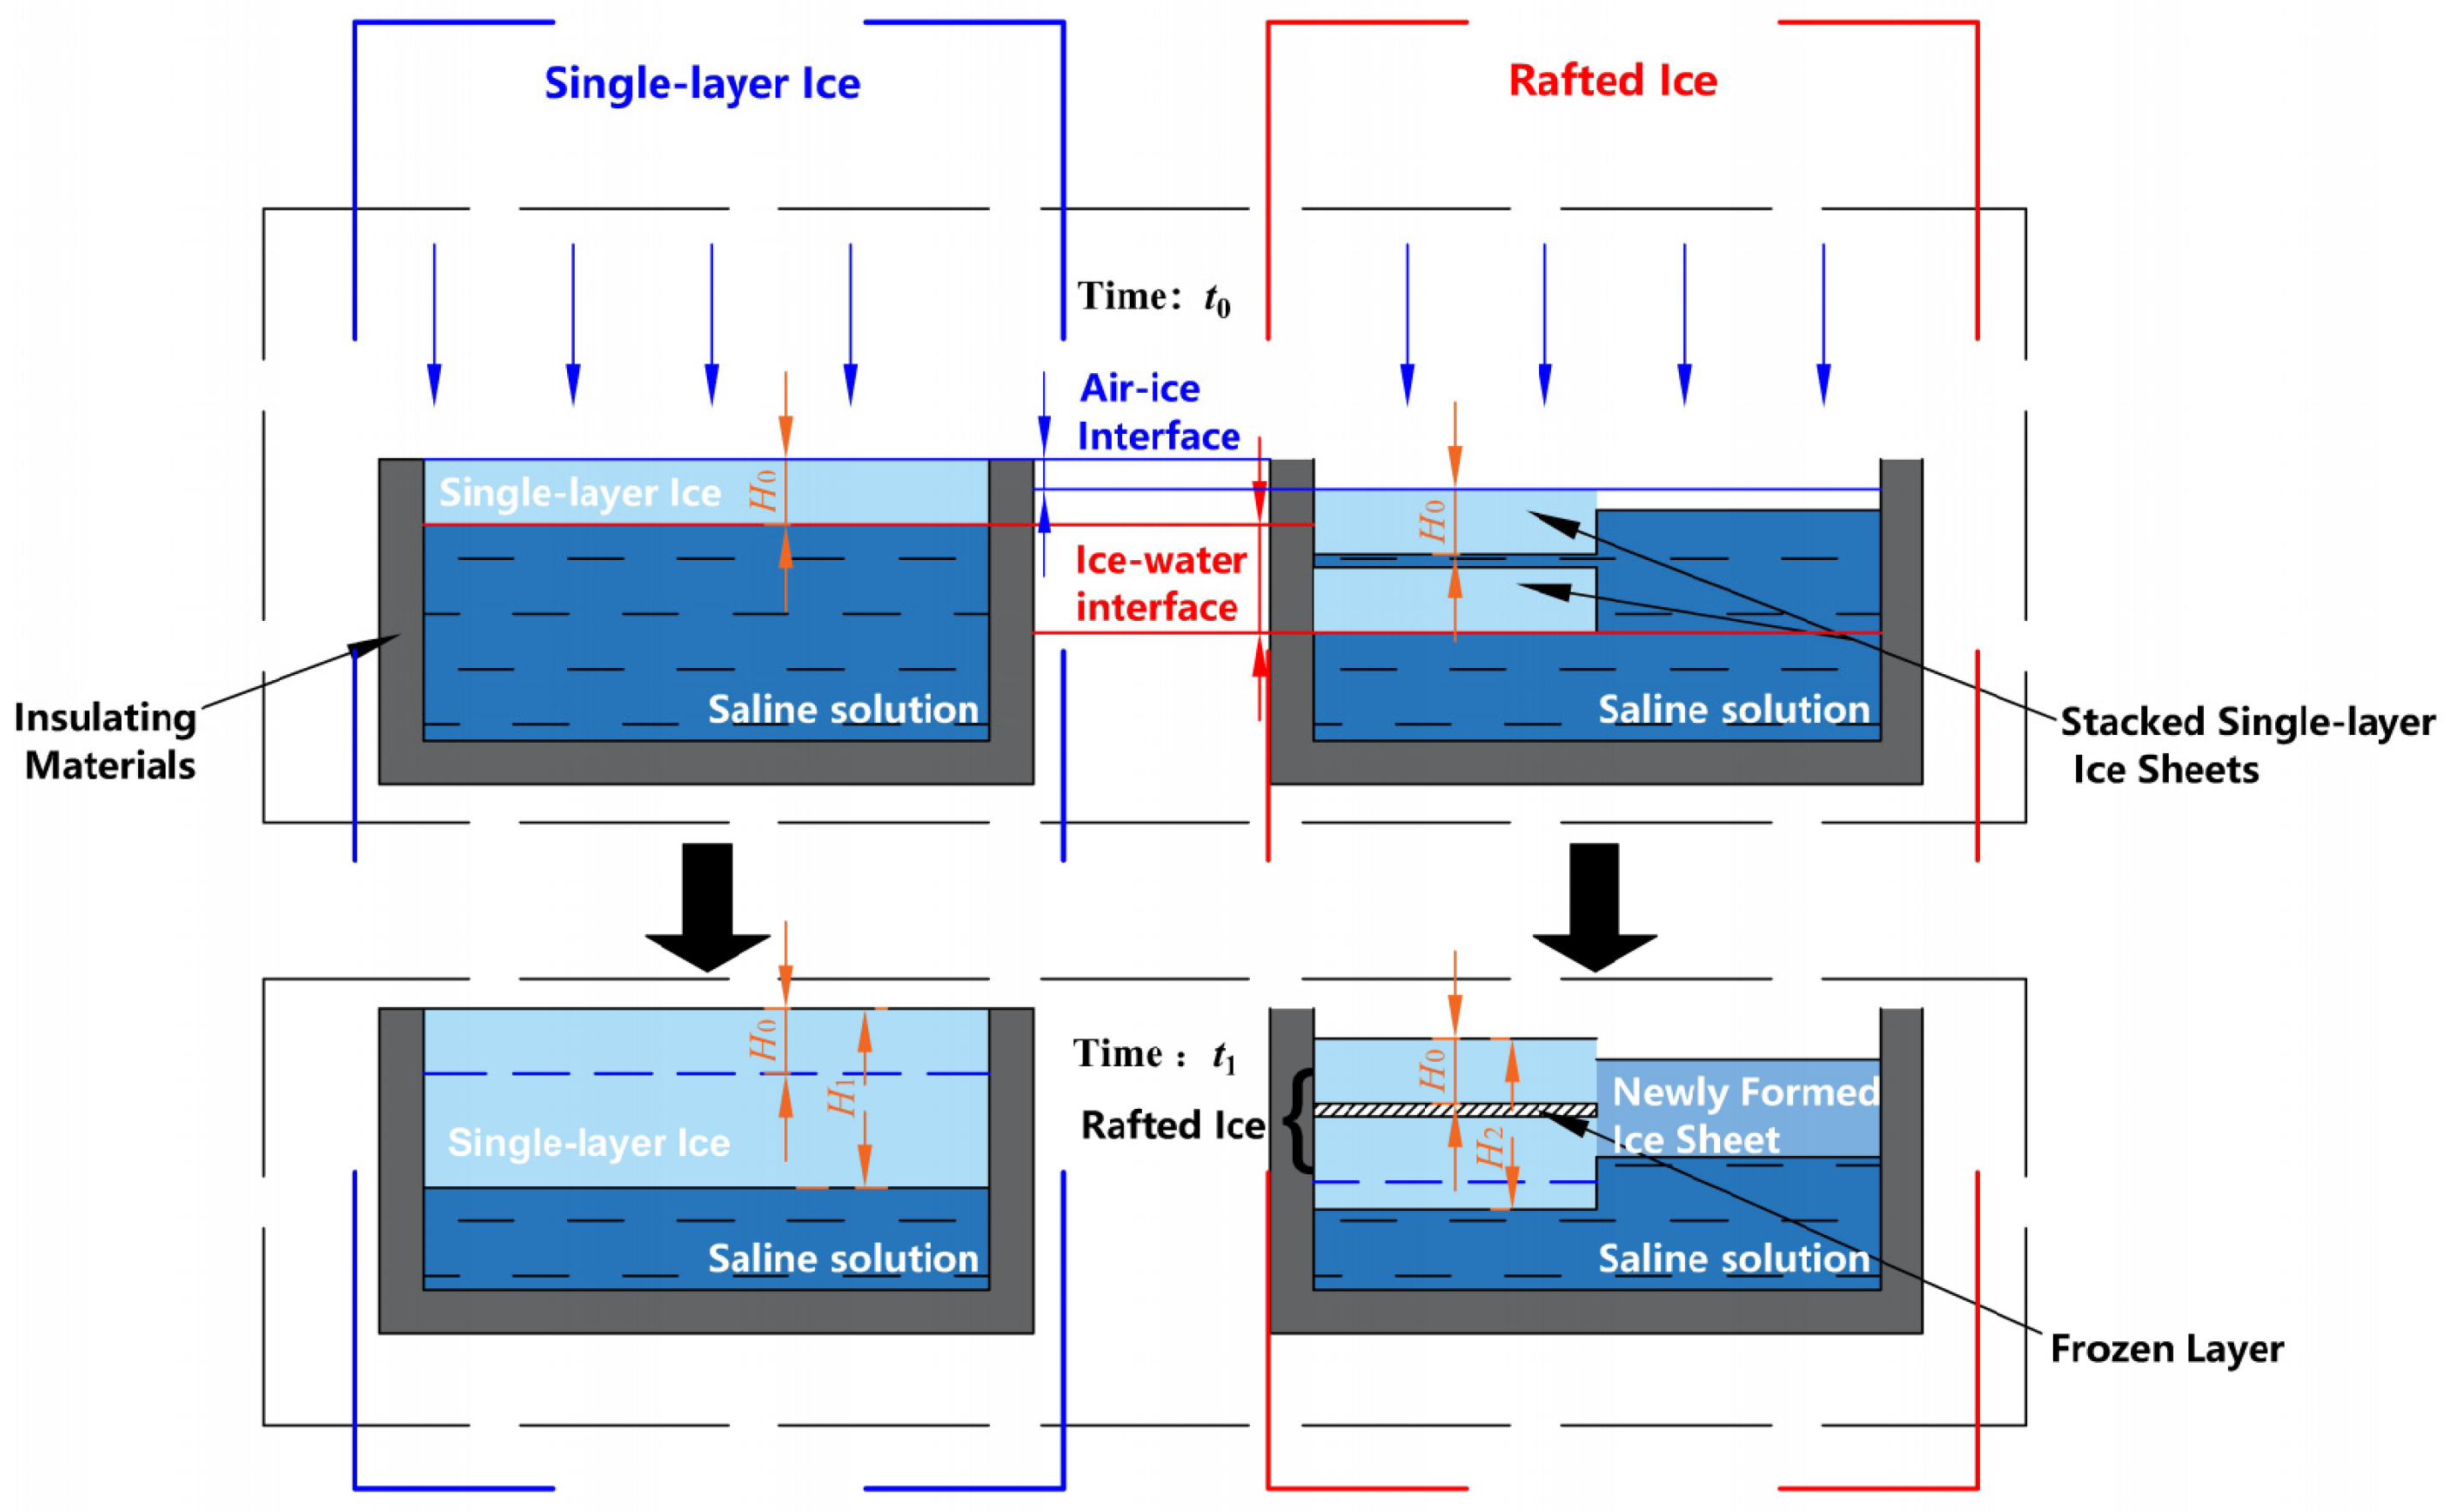
The growth pattern of rafted ice is analyzed from an energy perspective. During ice growth, driven by temperature gradients, convection occurs between air and the saline solution. Cold air exchanges heat via natural convection with the ice’s top surface, while the solution exchanges heat with the ice’s bottom surface. At the ice-water interface, new ice forms, releasing latent energy from phase change. The variation in convective heat transfer energy is linearly related to the temperature difference between the ambient temperature and the ice surface temperature, while the latent energy is linearly related to the increase in ice thickness [29,30]. Measurements revealed that the thickness of the upper ice layer in rafted ice after consolidation was essentially the same as the initial single-layer ice thickness, meaning the latent energy change for the upper layer was negligible. The growth process of single-layer ice and rafted ice is illustrated in Figure 4. At time t0, the initial thickness of the single-layer ice is H0. After stacking, the combined thickness of multiple single layers is nH0, with the gaps between layers fully submerged in the solution. Compared to the single-layer ice (control group), the ice-water interface of the multi-layer ice sheets is farther from the air-ice interface. At time t1, the liquid layer between the ice sheets transforms into a granular frozen layer, completing the consolidation of the rafted ice. The thicknesses of the single-layer ice and rafted ice are H1 and H2, respectively.
In scenarios Figure 5a,c,e, air temperatures were below 0 °C. Strong convective heat exchange occurred between the cold air and the ice’s top surface. Heat conduction lowered the surface temperature at the ice-water interface, creating a large temperature gradient. This resulted in a high convective heat transfer coefficient between the solution and the ice bottom, promoting ice growth and releasing latent energy (H2 > 2H0). Compared to the single-layer ice control, the lower ice layer in the rafted ice is farther from the air-ice interface, leading to a smaller temperature difference at the ice-water interface, weaker convective energy transfer, and slower latent energy increase (H1 > H2), but the difference was small.
In scenario Figure 5b, daytime temperatures rose above 0 °C. Air-ice convective heat transfer weakened. Higher ice growth temperatures and insufficient heat dissipation led to higher ice temperatures at the ice-water interface and a relatively lower heat transfer coefficient, slowing the growth rate. The single-layer ice (control group) H1 grew slowly, while the lower layer of rafted ice melted, absorbing latent energy, resulting in H2 > 2H0. The difference between H1 and H2 was more pronounced than under low-temperature conditions.
The experiment found that under similar low-temperature and consolidation time conditions, the trends in scenarios Figure 5d,e were opposite. This is attributed to the linear increase in temperature from the surface to the bottom within rafted ice [3]. When the average initial ice thickness was large (≈53 mm), the ice-water interface was too far from the air-ice interface. Insufficient heat conduction from the air resulted in a lower convective heat transfer coefficient, causing ablation of the lower ice layer. Consequently, the difference between H1 and H2 was more significant than under thin ice conditions.
In summary: Under low ambient temperatures and small initial ice thickness, the temperature difference drives strong latent energy release, resulting in H2 > 2H0. Under high ambient temperatures or excessively large initial ice thickness, ablation of the lower ice layer causes H2 < 2H0, and the thickness difference between single-layer and rafted ice becomes larger. The energy analysis demonstrates that rafted ice thickness growth is influenced by convective and latent energies and exhibits a negative correlation with ambient temperature and initial ice thickness.

3.2. Density Characteristics of Rafted Ice

Density, as a core indicator characterizing material compactness, directly influences the load-bearing capacity and failure mode of ice. This paper conducted a comparative analysis of the density of rafted ice under six scenarios, as shown in Table 2, where l2 and l1 denote rafted ice and single-layer ice, respectively. Experimental data show that the mean density of rafted ice (830.44–900.75 kg/m3) is lower than that of single-layer ice (885.50–954.18 kg/m3), averaging a reduction of about 8%. The standard deviations of density for both types were relatively similar.
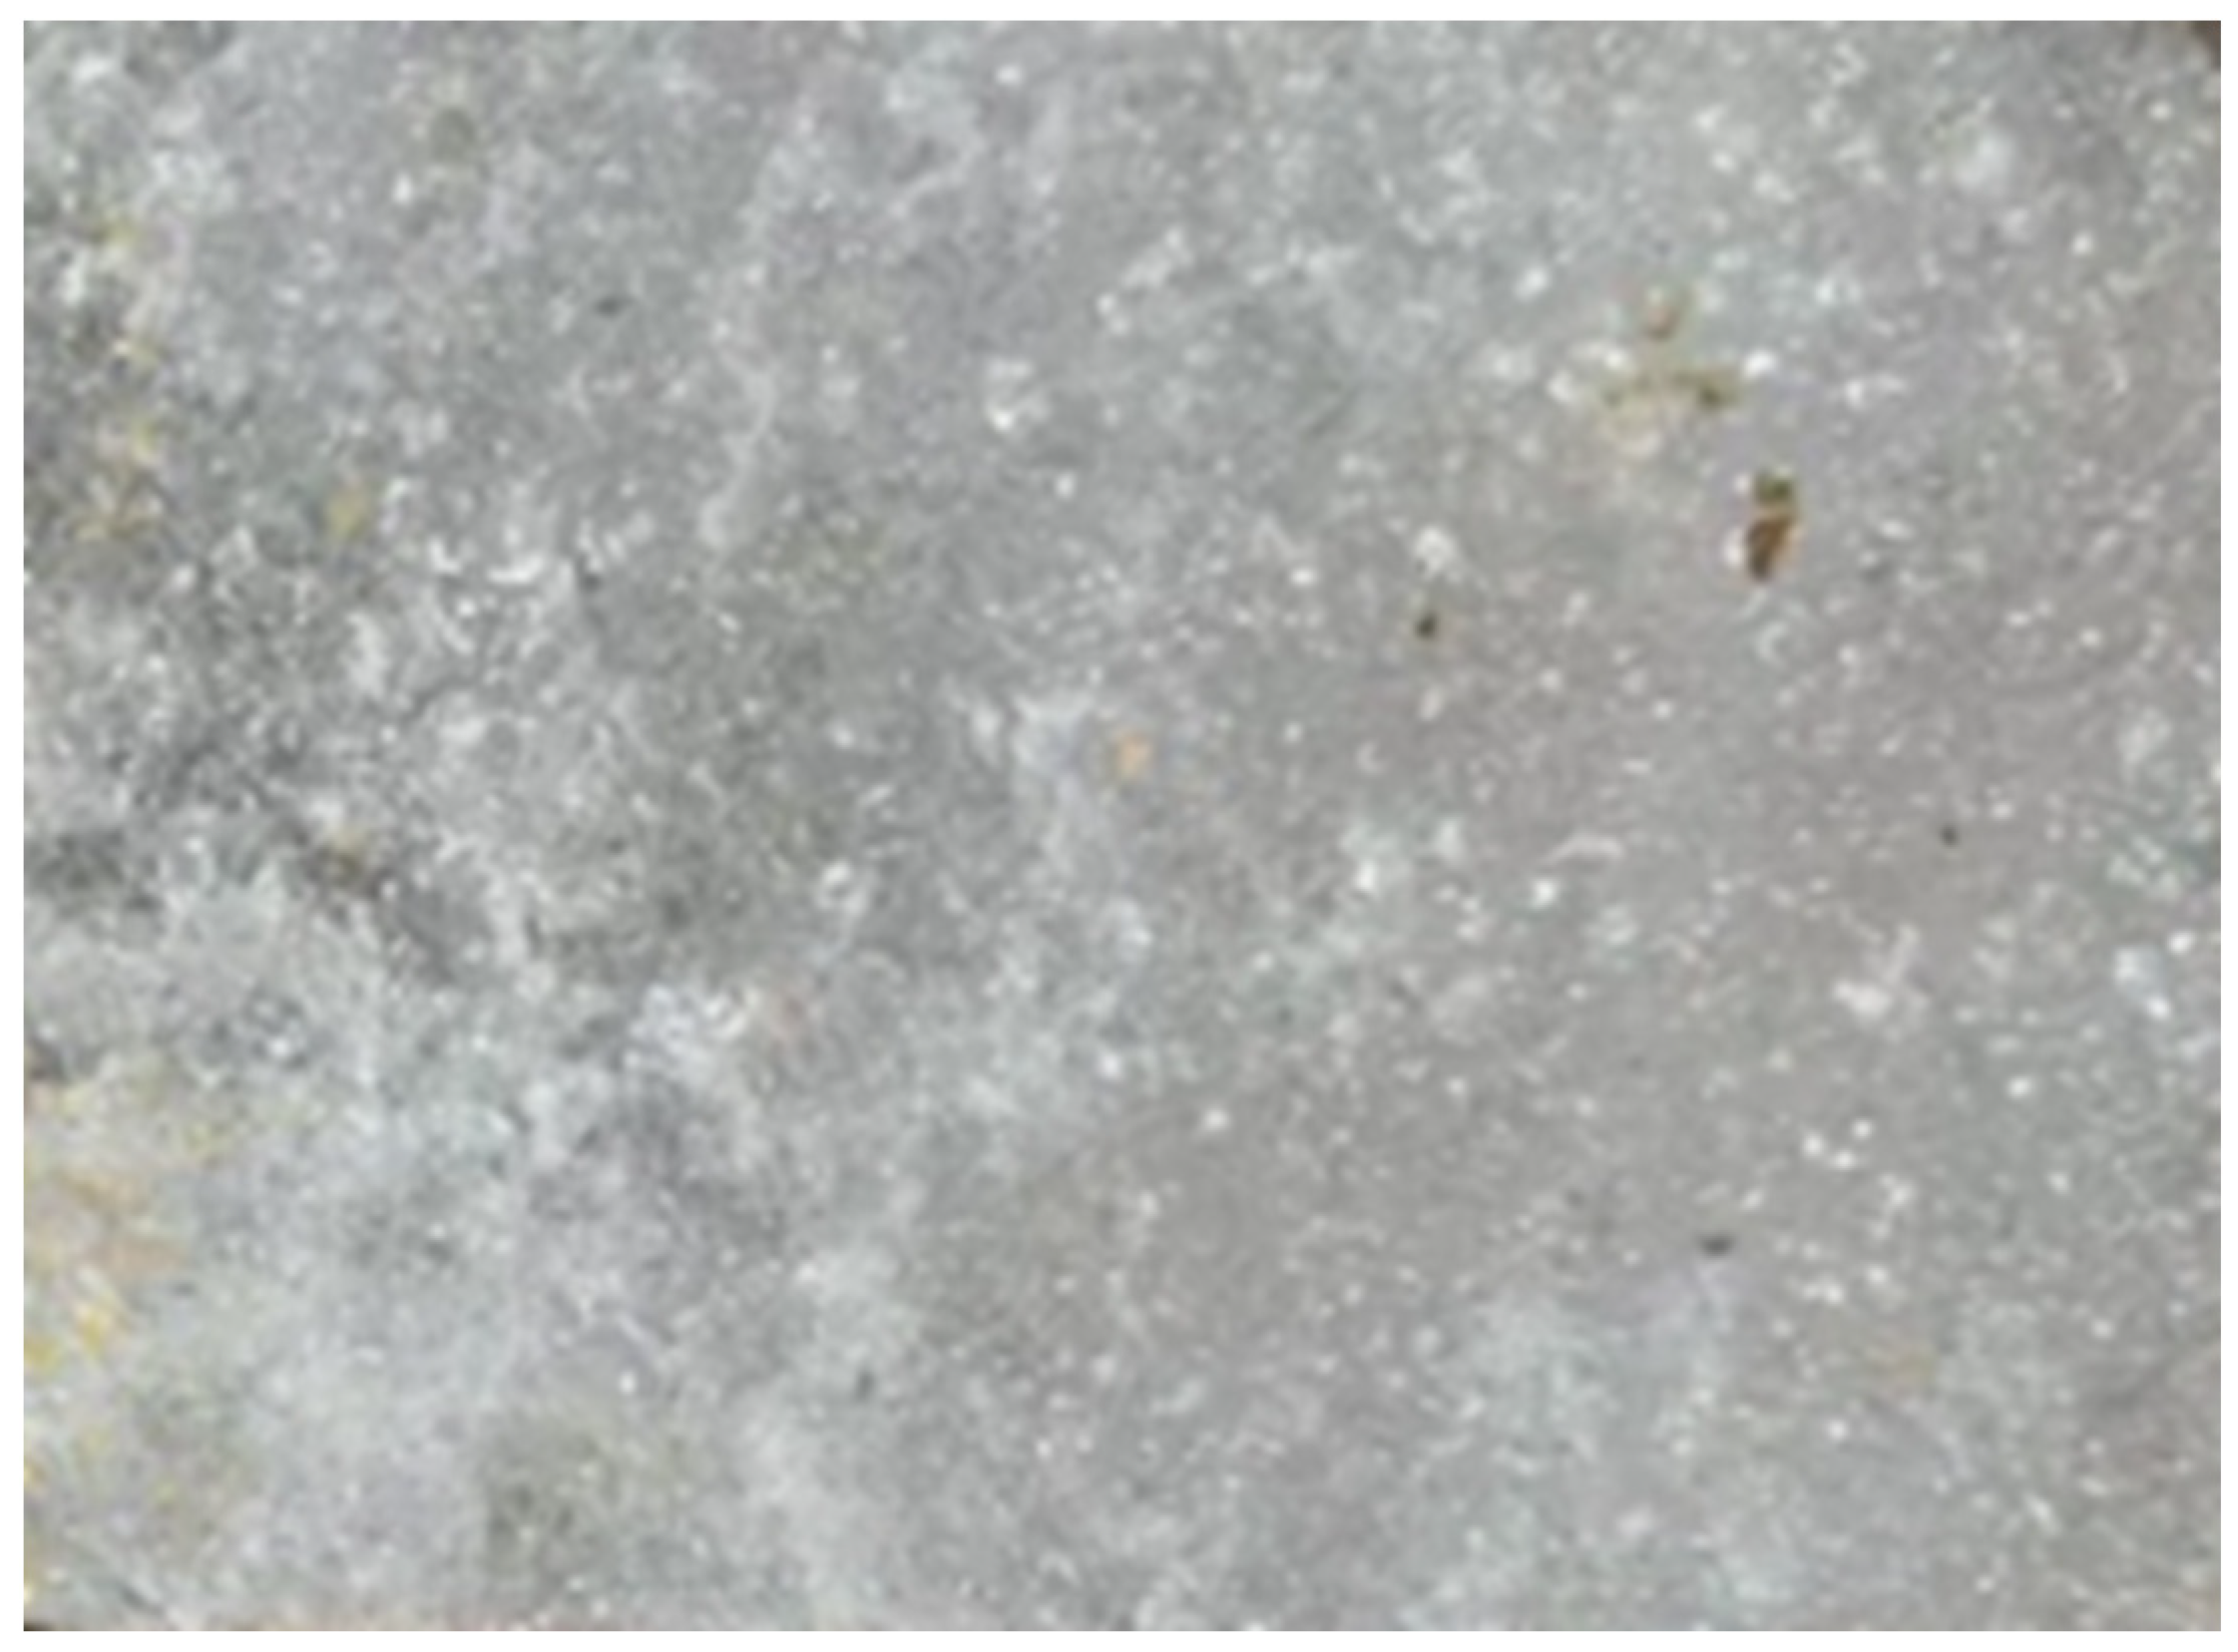
The density difference primarily stems from the distinct microstructures of rafted ice and single-layer ice. Rafted ice is formed by stacking multiple ice layers, prone to microcracks and interfacial defects at the layer boundaries. During the consolidation process, the liquid layer transforms into granular ice crystals within the frozen layer, resulting in higher porosity and lower overall density. The structure of the frozen layer is shown in Figure 6. Single-layer ice grows through continuous crystallization, exhibiting a uniform grain structure without interlayer interfaces or large-scale defects, leading to lower porosity. As consolidation time increases, the grains within the frozen layer become more densely packed, reducing the porosity of the rafted ice and resulting in a denser overall structure. Scenarios No. 2 and No. 6 had shorter consolidation times; the frozen layer was not fully densified, resulting in higher porosity and a greater density reduction.

4. Analysis of Rafted Ice Flexural Strength Characteristics

4.1. Analysis of Failure Characteristics

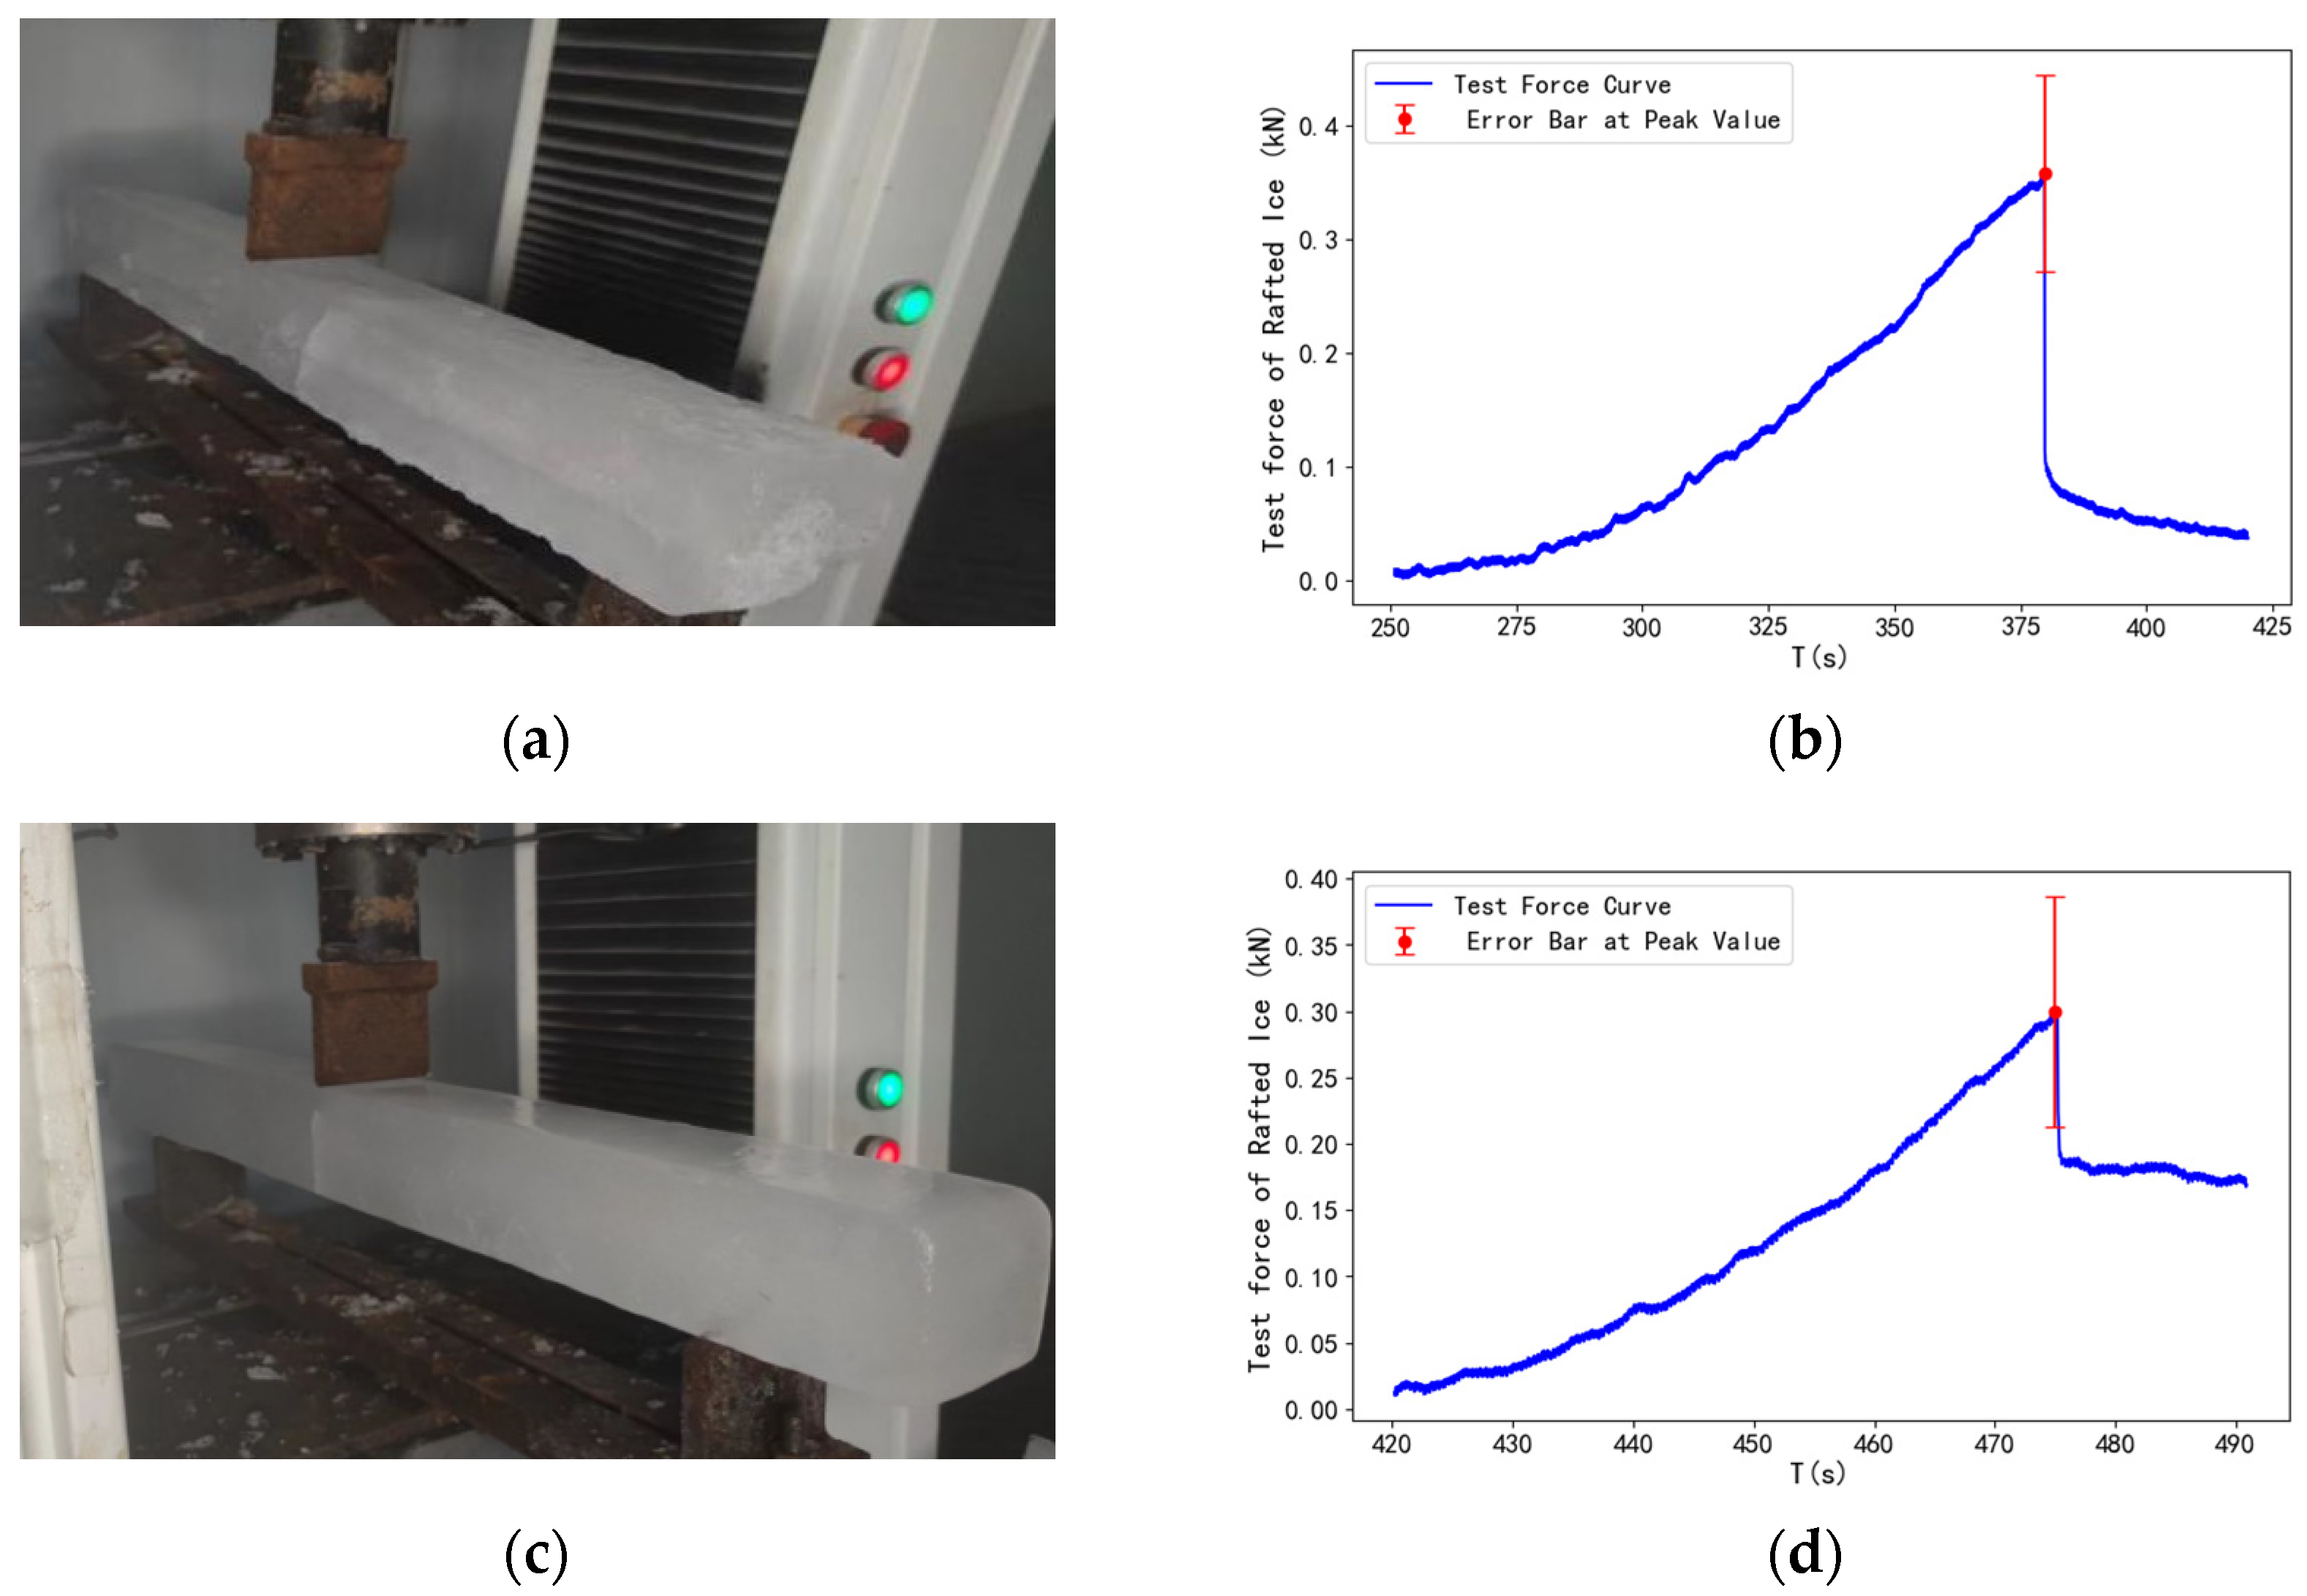
In studying the interaction between sea ice and structures, the failure mode of sea ice is crucial. Flexural failure of sea ice is essentially tensile failure. Since tensile strength shows no significant relationship with strain rate [20,31], strain rate has a minor influence on the flexural strength of sea ice [20]. Therefore, the strain rate for rafted ice flexural strength testing was set to 10−3/s. A total of 42 tests were conducted to analyze the failure characteristics of rafted ice and single-layer ice during bending failure, as shown in Figure 7.
The test results show that some cracks in rafted ice initiated away from the loading point (Figure 7a), whereas cracks in single-layer ice almost always initiated directly under the loading point (Figure 7c). This is attributed to ice layer movement during rafting, which enlarges internal defects; failure initiates at structural weak points, causing crack deviation. During flexural failure of rafted ice, the upper layer is under compression, while the lower layer is under tension. In single-layer ice, the region above the neutral axis is subjected to compression and the region below is in tension. Because ice is much weaker in tension than in compression, failure typically initiates below the neutral axis. Cracks in both types initiate at the bottom of the ice specimen and propagate upwards. The loading force drops abruptly after reaching its peak (Figure 7b,d).

4.2. Analysis of Flexural Strength

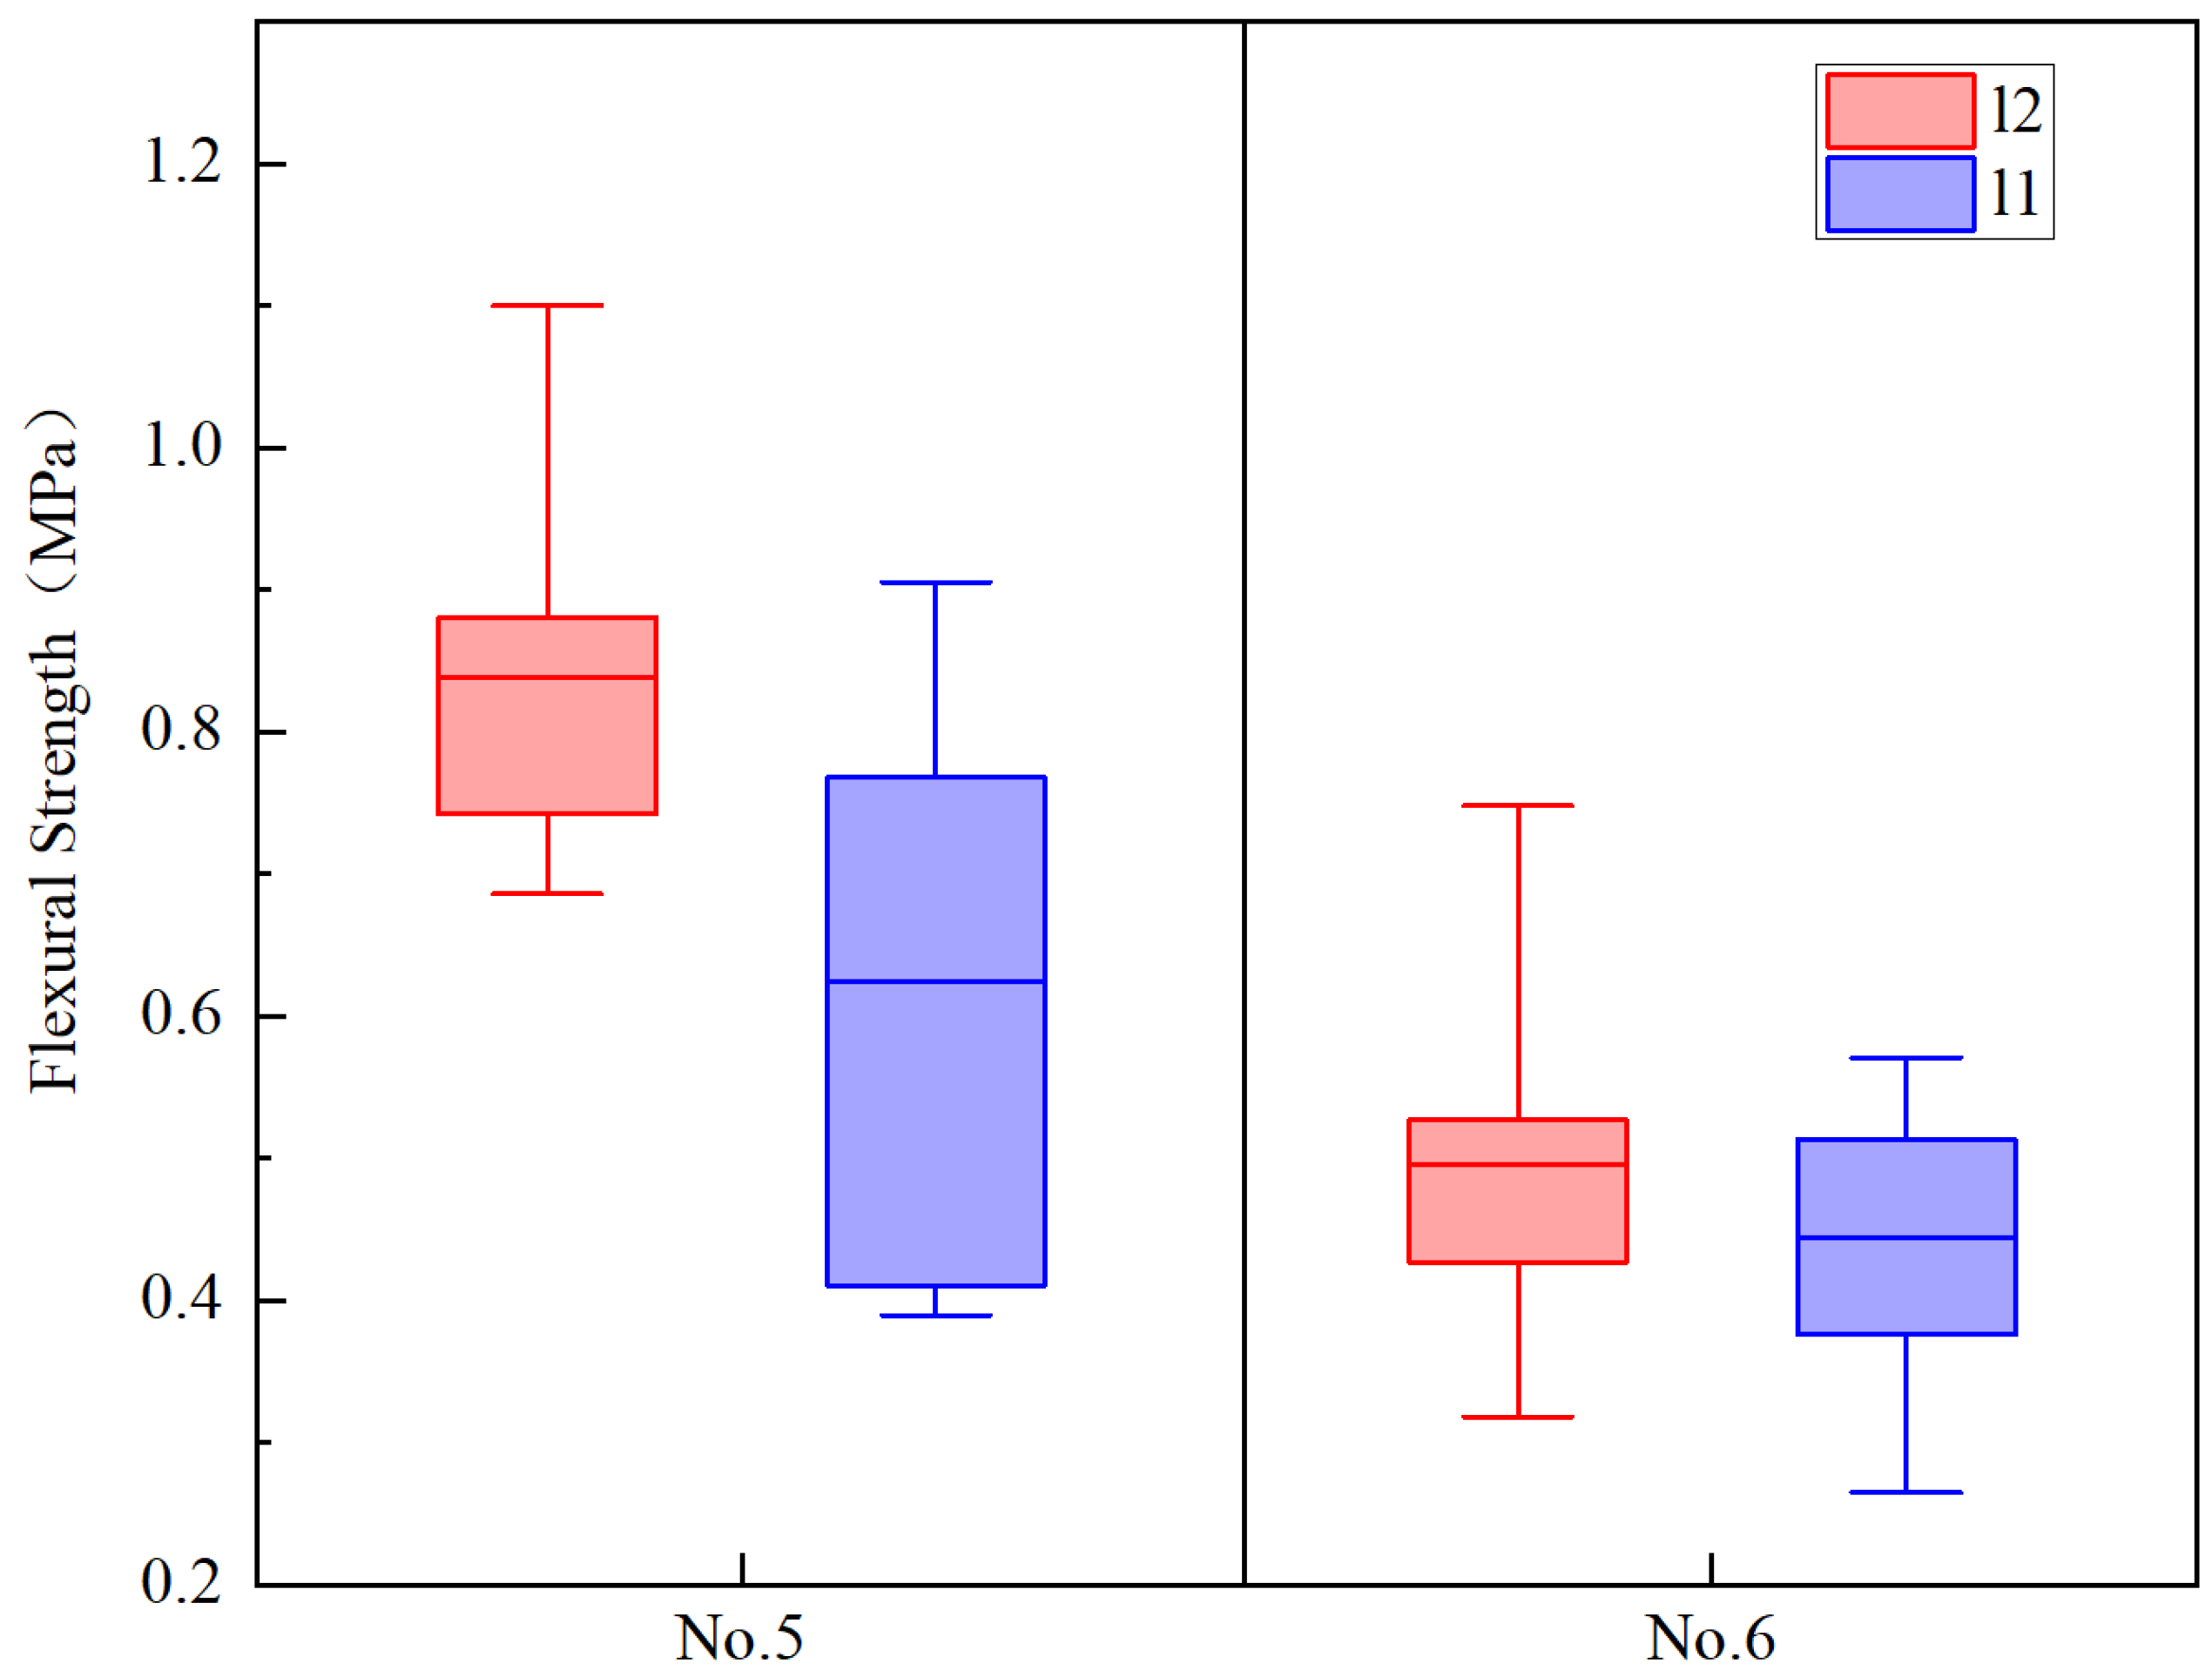
To explore the difference in flexural strength between rafted ice and single-layer ice, three-point bending strength tests were conducted. Results are shown in Table 3 and Figure 8.
The data indicate that the mean flexural strength of rafted ice in Scenario No. 5 (0.84 ± 0.13 MPa) was 1.34 times that of single-layer ice (0.65 ± 0.20 MPa). In Scenario No. 6, the mean flexural strength of rafted ice (0.49 ± 0.12 MPa) was 1.12 times that of single-layer ice (0.44 ± 0.10 MPa). The flexural strength of rafted ice exceeded that of single-layer ice, with similar standard deviations observed for both.
Q/HSn 3000 [16] recommends the flexural strength of rafted ice as 0.8 times that of the corresponding single-layer ice, which contradicts the experimental results of this study (1.12–1.34 times). To further verify the results, this paper applied the flexural strength calculation formulas recommended in HY/T 047 [15] (Equations (3) and (4)), combined with test parameters (ice temperature = −6 °C, salinity = 4‰). The calculated flexural strengths were 1.17 MPa for rafted ice and 0.95 MPa for single-layer ice, consistent with the experimental observations.
The flexural strength formulas for single-layer ice and rafted ice in HY/T 047 [15] are as follows:
σ f = 0.96 0.06 ν b
where σ f is the flexural strength of single-layer ice (MPa);
ν b is the brine volume of single-layer ice (dimensionless).
σ f Ra = 0.518 0.109 T iRa
where σ f Ra is the flexural strength of rafted ice (MPa); T i R a is the design temperature of rafted ice (°C). Given the thinness of the frozen layer in rafted ice, this study simplified it as an equivalent structure formed by bonding two single-layer ice sheets. Equations (1) and (5) yield the maximum normal stress σ max and maximum shear stress τ max for rafted ice and single-layer ice. τ max is calculated as:
τ max = 3 F max 4 w d
where τ max is the maximum shear stress in rafted ice (MPa).
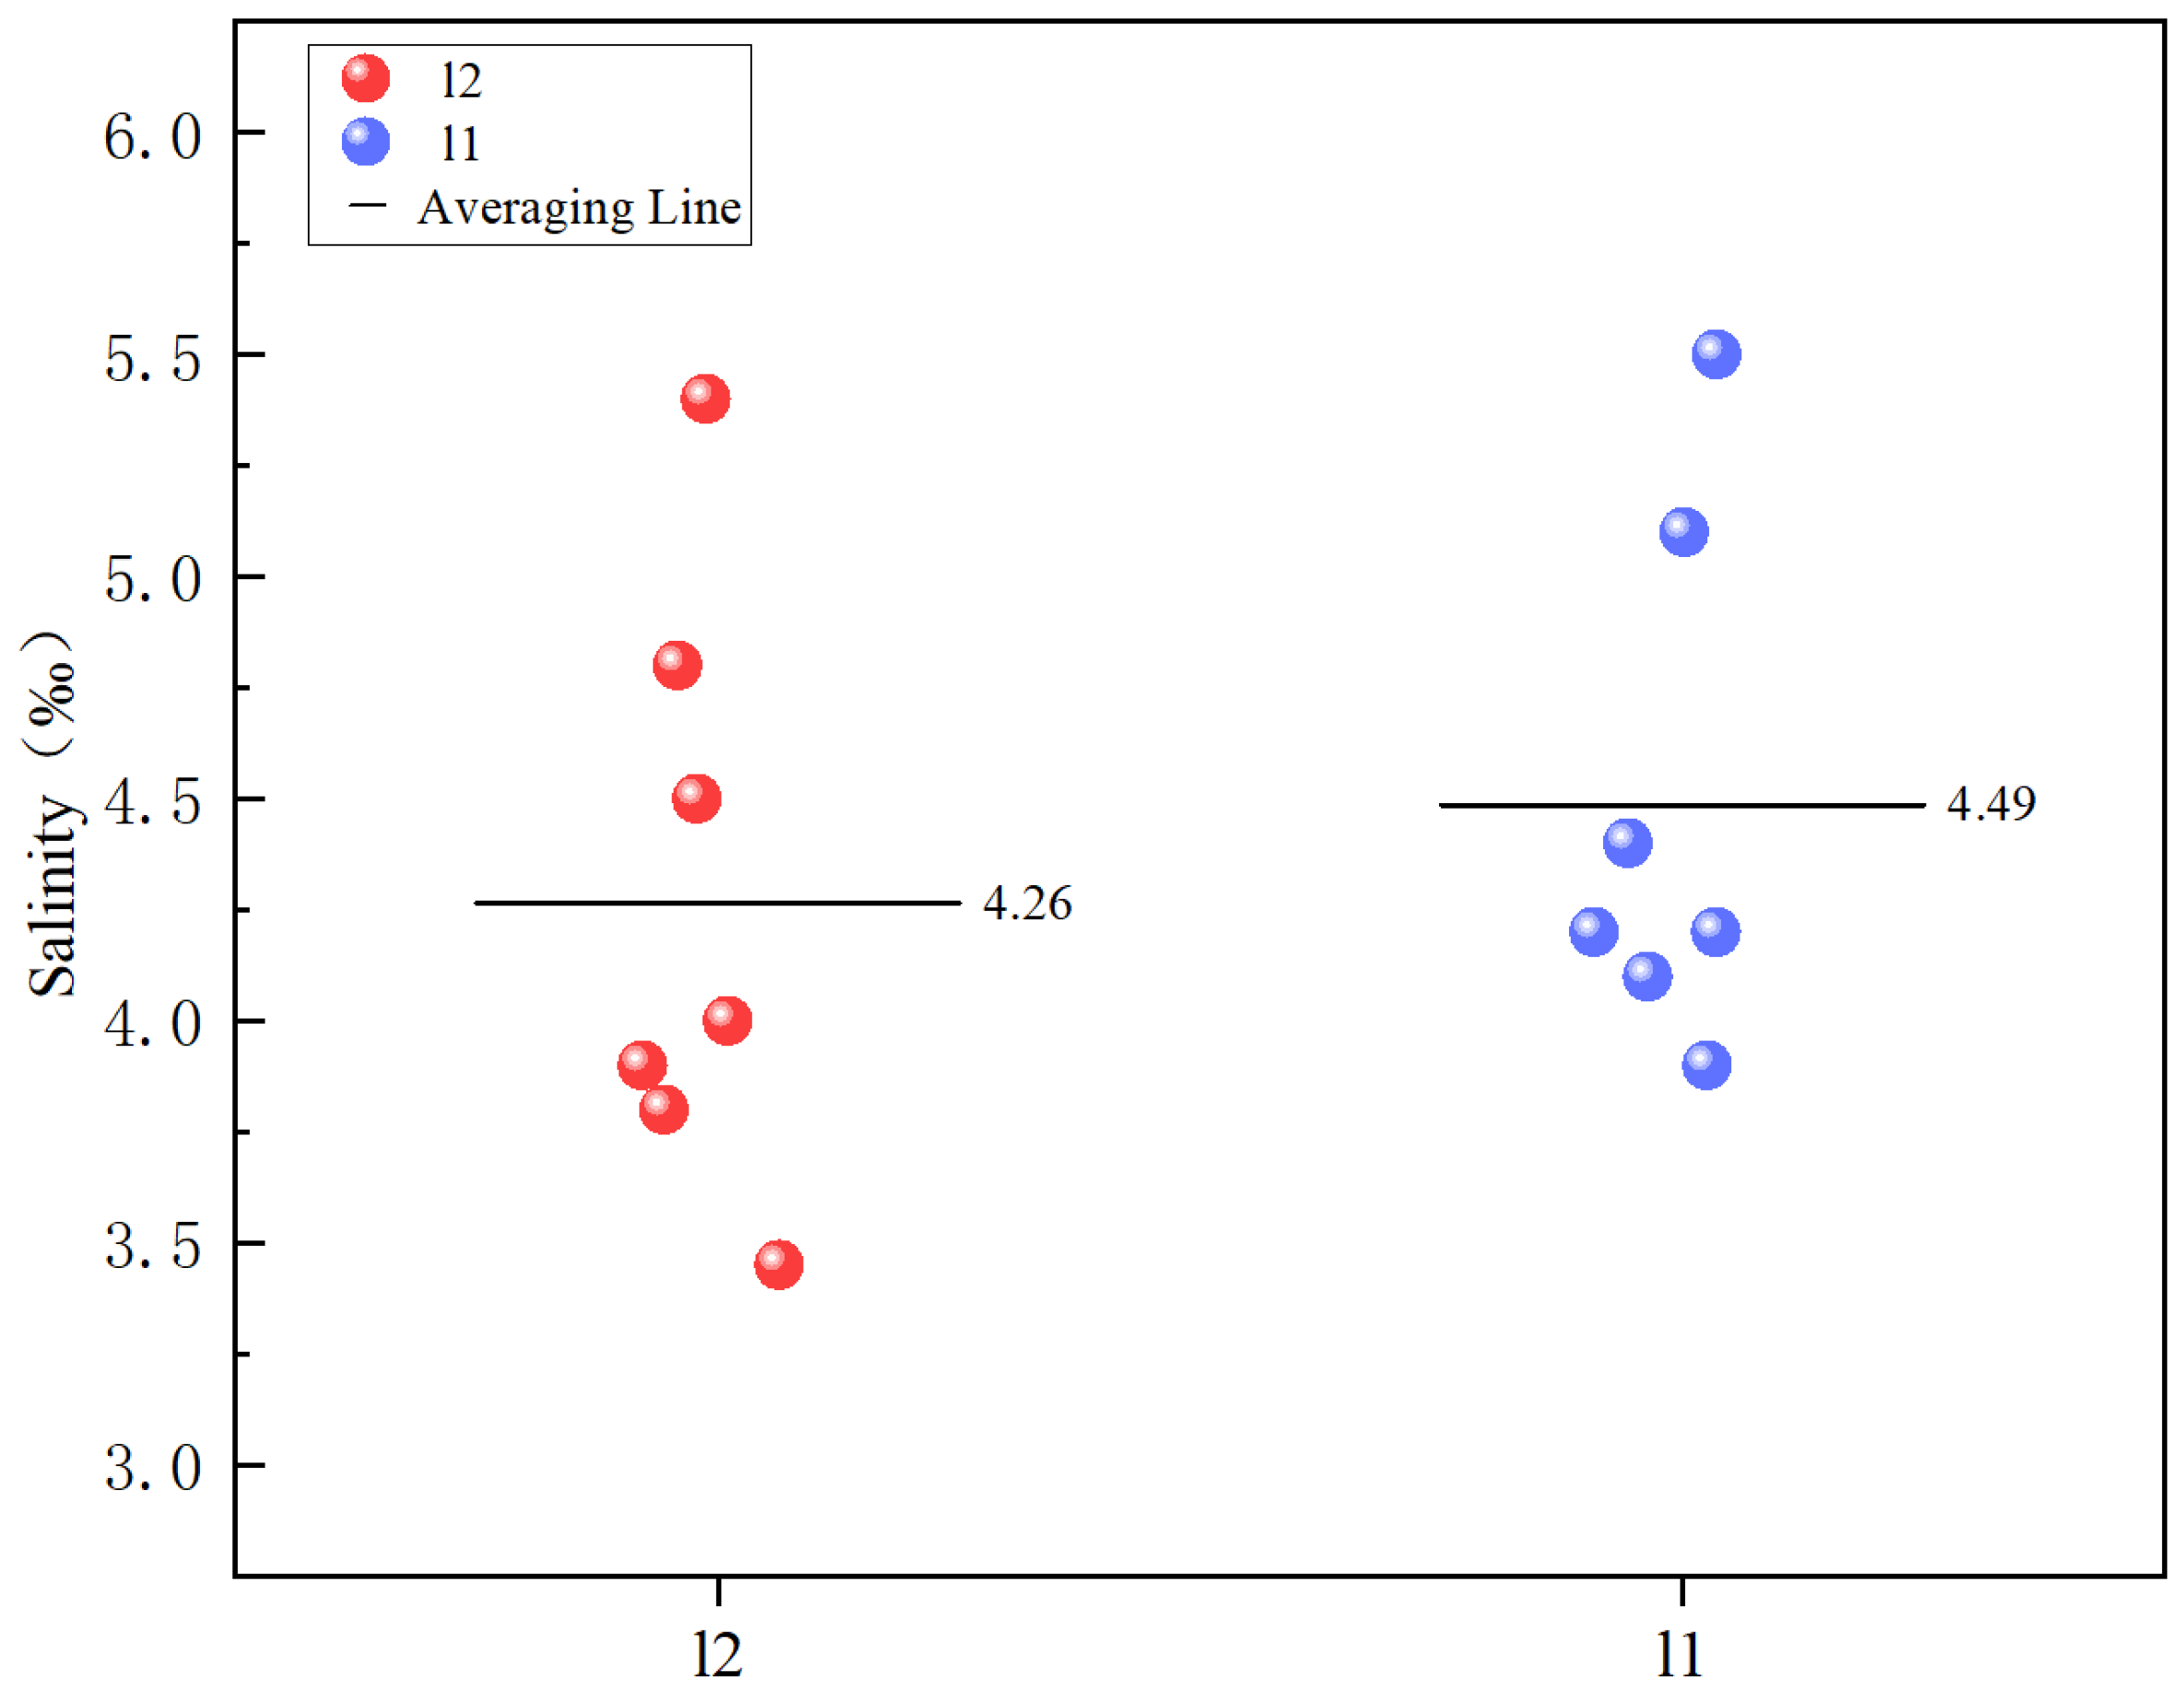
Considering that the specimen dimensions for rafted ice and single-layer ice were identical, their allowable normal and shear stresses are primarily influenced by material properties. Salinity is a crucial factor affecting sea ice strength, and the salinity distribution patterns differ significantly. Single-layer ice exhibits a “C-shaped” salinity profile along its thickness [32]. Rafted ice, as a special composite, existing research shows both upper and lower layers exhibit “C-shaped” profiles; when layer thicknesses are similar, the lower layer’s salinity profile approaches that of the upper layer, resulting in an “ε-shaped” overall salinity profile [3,24]. The total salinity of rafted ice was slightly lower than that of single-layer ice (Figure 9). This is mainly because the high-salinity zone at the bottom of the lower ice layer underwent partial ablation during the freezing process, reducing the overall salinity. In contrast, the bottom of the single-layer ice has higher salinity and porosity, leading to reduced strength. Consequently, the flexural strength of rafted ice exceeded that of single-layer ice. Furthermore, during crack propagation in the frozen layer, its pores can absorb energy, mitigating stress concentration at the crack tip and thereby enhancing the flexural strength of the rafted ice.

4.3. Elastic Modulus of Rafted Ice

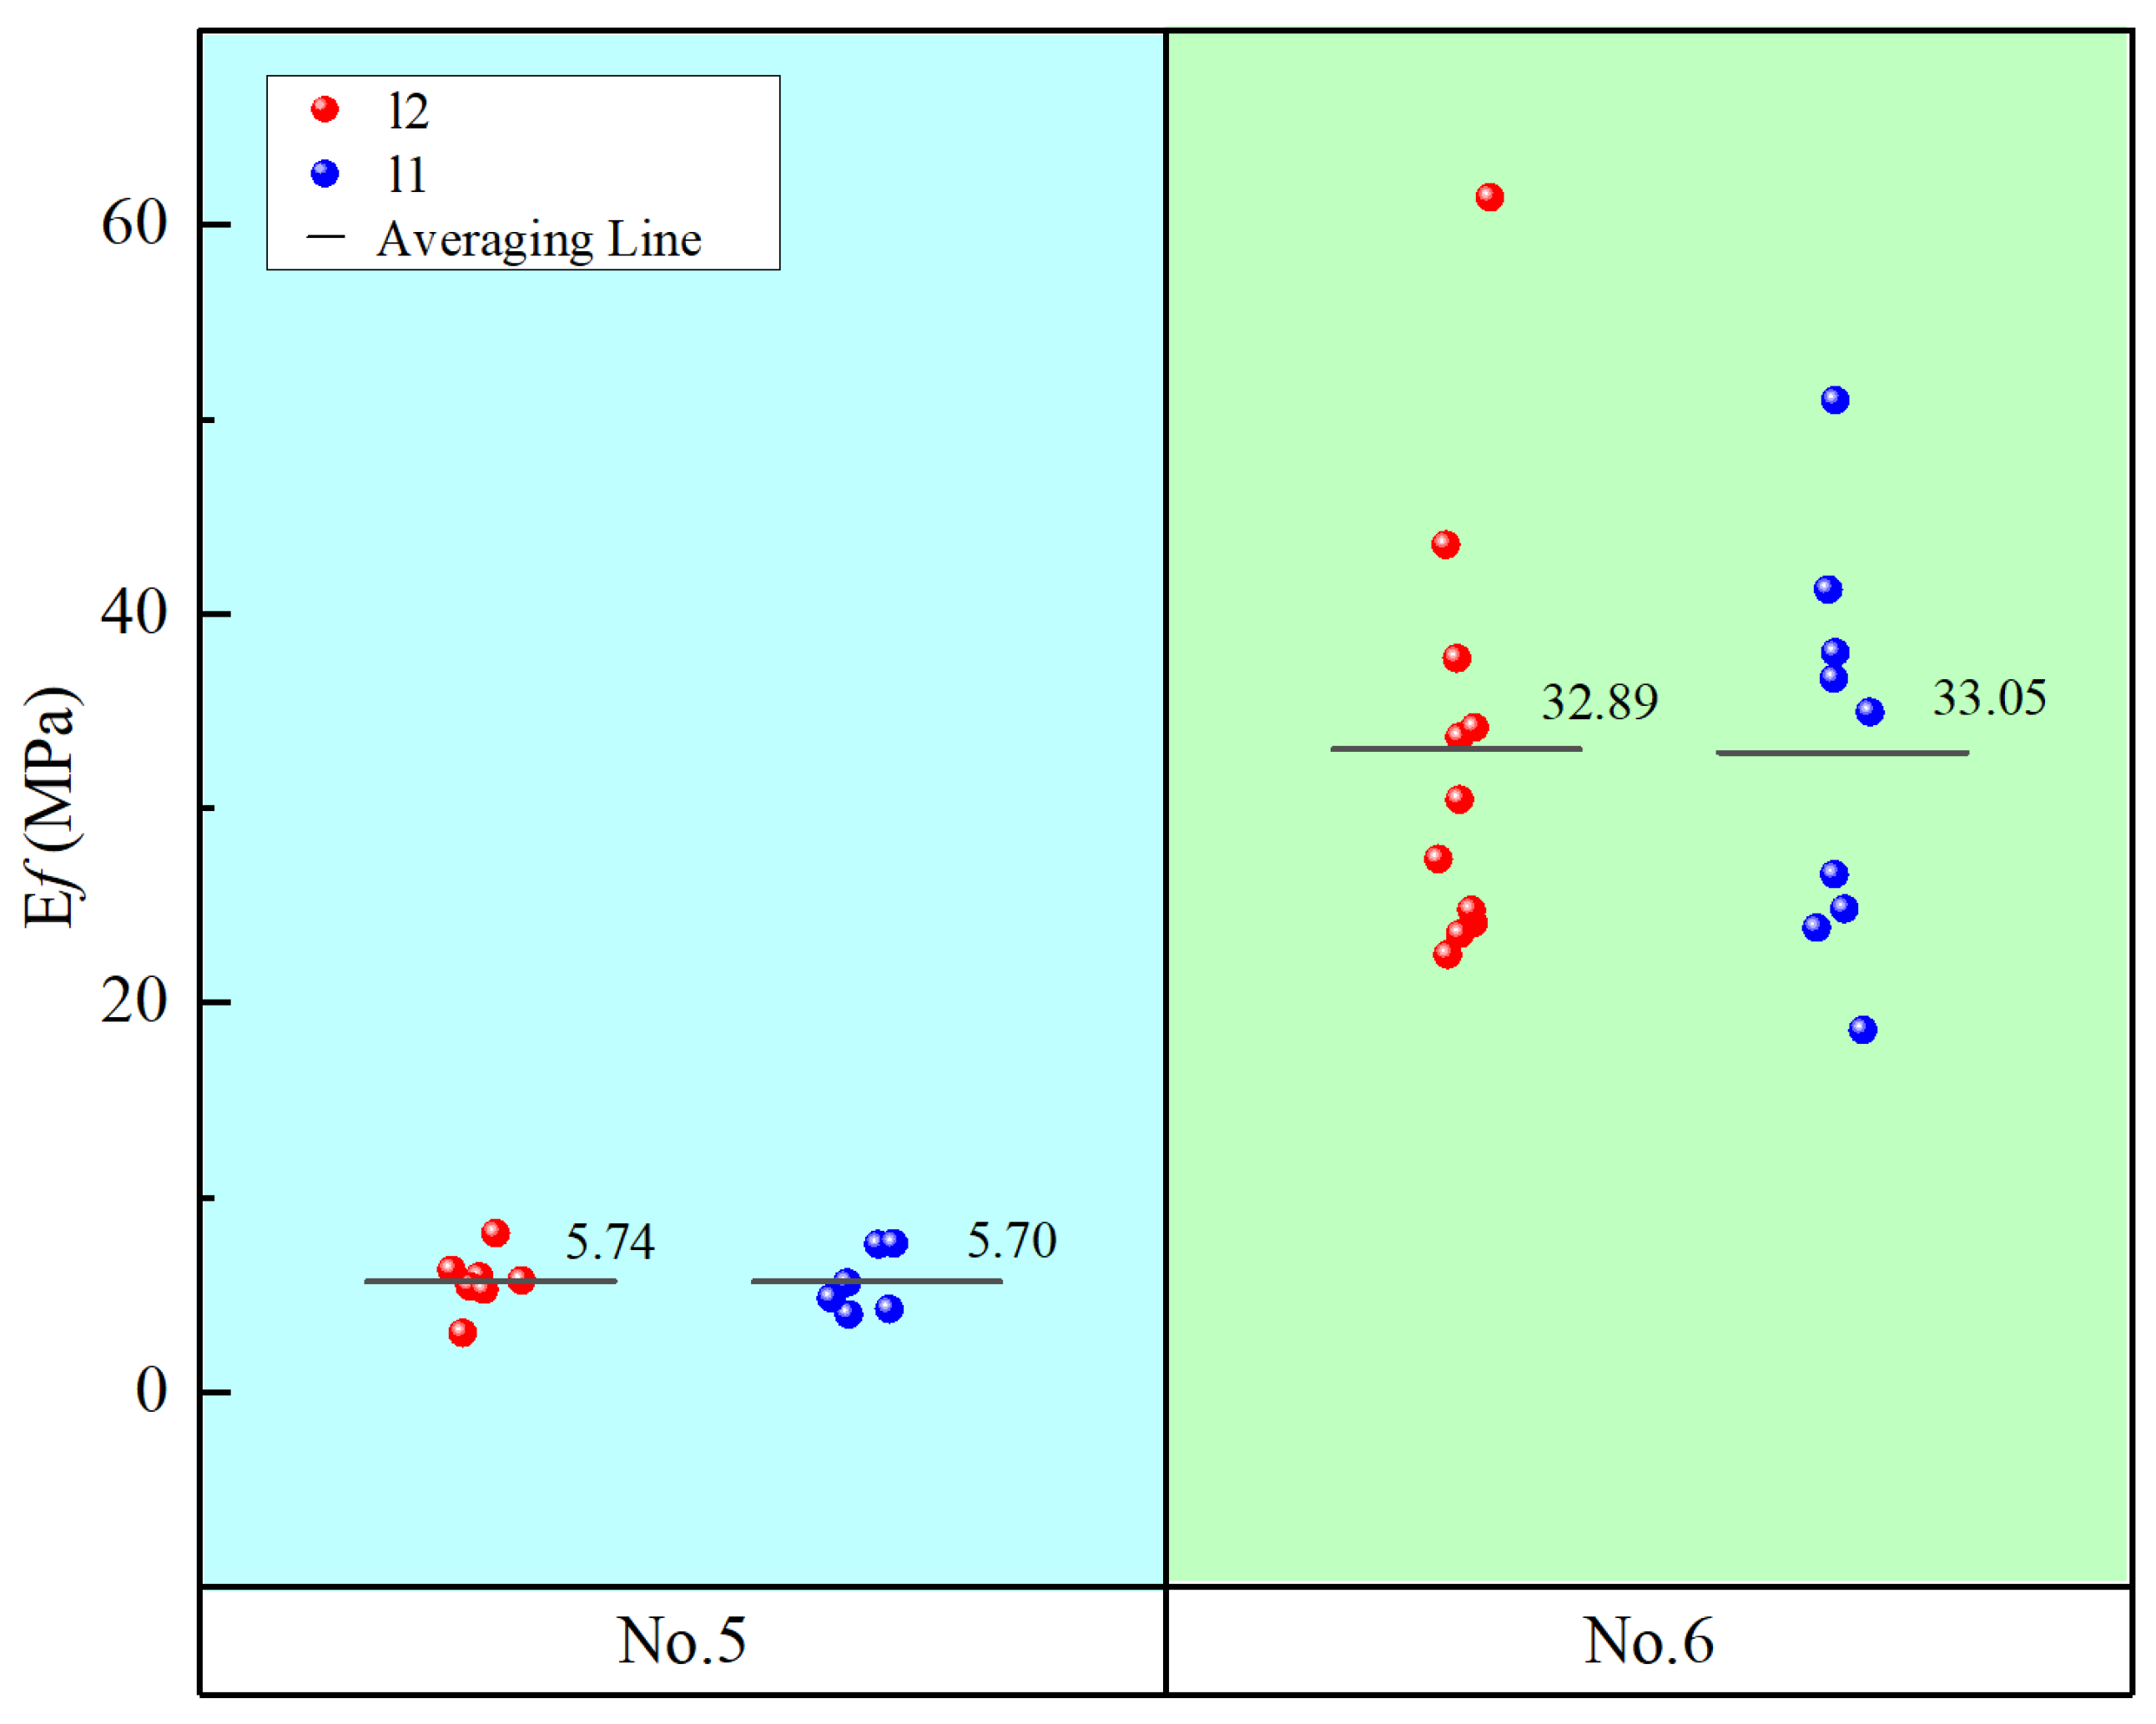
The effective elastic modulus is a key mechanical parameter for sea ice bending failure, particularly important for studying the mechanical behavior leading to failure [20]. This study measured the effective elastic modulus of rafted ice and single-layer ice using the three-point bending test. Results are shown in Table 4 and Figure 10.
Test data indicate that the effective elastic modulus of rafted ice was 1.00 to 1.01 times that of single-layer ice. Previous studies have shown that the effective elastic modulus decreases with increasing salinity or porosity [20,31,33]. An increase in brine pockets and air bubbles reduces the solid ice content, making sea ice more viscous and ductile. Under the same load, this leads to more delayed elastic and inelastic deformation, thereby reducing rigidity [20]. In this study, the upper and lower ice layers of rafted ice had relatively low salinity and porosity, contributing to higher local stiffness. However, the middle frozen layer, influenced by brine migration from the upper layer and residual brine, exhibited relatively higher salinity and porosity, which weakened the overall stiffness of the rafted ice to some extent. Therefore, although rigidity was enhanced in some regions, the overall effective elastic modulus of rafted ice was similar to that of single-layer ice. Additionally, the maximum effective elastic modulus values for rafted ice were generally higher than those of single-layer ice. This is because the crystalline structure of the frozen layer in some rafted ice specimens was denser, reducing porosity and increasing overall stiffness.

5. Conclusions

This paper prepared rafted ice and corresponding single-layer ice specimens under winter outdoor natural conditions and in a low-temperature laboratory environment. The growth pattern of rafted ice was analyzed from an energy perspective, and the differences in flexural strength between rafted ice and single-layer ice were revealed through three-point bending tests. The main conclusions are as follows:
  • During the growth process, the thickness of rafted ice exhibits a negative correlation with ambient temperature and initial single-layer ice thickness. Due to the higher porosity of the frozen layer, its average density is significantly reduced by approximately 8% compared to single-layer ice.
  • Three-point bending tests demonstrate that, under the combined effect of enhanced tensile strength in the lower ice layer and energy absorption by the porosity of the frozen layer, the flexural strength of rafted ice ranges from 1.12 to 1.34 times that of single-layer ice.
  • The effective elastic modulus of rafted ice is similar to that of single-layer ice, indicating that the layered structure does not significantly affect its overall stiffness.
This study provides experimental data to clarify the growth process and flexural strength characteristics of rafted ice compared to single-layer ice, contributing to the optimization of ice-resistant design for marine structures. Future research could integrate field observation data to delve deeper into the physical and mechanical properties of natural rafted ice, enabling a more comprehensive assessment of its impact on marine engineering structures.

Author Contributions

Conceptualization, Y.X. and G.W.; Methodology, Y.X., W.L. and K.W.; Formal analysis, Y.X., W.L. and S.M.; Investigation, Y.X., W.L., K.W., S.M. and Y.L.; Data curation, Y.X. and Y.L.; Writing—original draft, Y.X.; Writing—review & editing, W.L., G.W. and D.Z.; Supervision, G.W. and D.Z.; Project administration, G.W.; Funding acquisition, D.Z. All authors have read and agreed to the published version of the manuscript.

Funding

This work was funded by the National Key Research and Development Program of China (Grant No. 2023YFC2809104), and the Liaoning Provincial Natural Science Foundation Joint Fund (Grant No. DUT24BS031).

Institutional Review Board Statement

Not applicable.

Informed Consent Statement

Not applicable.

Data Availability Statement

The original contributions presented in this study are included in the article. Further inquiries can be directed to the corresponding author.

Conflicts of Interest

Author Wei Li is employed by CNOOC Research Institute Co., Ltd. The company had no role in the design of the study; in the collection, analyses, or interpretation of data; in the writing of the manuscript; or in the decision to publish the results. The authors declare no conflict of interest.

References

  1. Wang, G.; Zhang, D.; Yue, Q.; Yu, S. Study on the dynamic ice load of offshore wind turbines with installed ice-breaking cones in cold regions. Energies 2022, 15, 3357. [Google Scholar] [CrossRef]
  2. Li, Z.; Wang, Y. Design criteria of Bohai Sea ice-control engineering. Ocean Eng. 2000, 18, 61–65. [Google Scholar]
  3. Bailey, E.; Sammonds, P.R.; Feltham, D.L. The consolidation and bond strength of rafted sea ice. Cold Regions Sci. Technol. 2012, 83, 37–48. [Google Scholar] [CrossRef]
  4. Li, Z.; Ding, D.; Sui, J. Theoretical analysis on the rafted ice thickness in Liaodong Bay. J. Mar. Environ. Sci. 1997, 16, 21–25. [Google Scholar]
  5. Kovacs, A. On the Structure of Pressured Sea Ice; Report prepared for the U.S. Coast Guard by U.S.; Army Cold Regions Research and Engineering Laboratory: Hanover, NH, USA, 1970. [Google Scholar]
  6. Li, W.; Guo, Y.; Li, S.; Gao, Y.; Qu, Y. Inversion Method Based on Temporal Convolutional Networks for Random Ice Load on Conical Offshore Platforms. J. Mar. Sci. Eng. 2025, 13, 1000. [Google Scholar] [CrossRef]
  7. Kovacs, A.; Mellor, M. Sea ice morphology and ice as a geologic agent in the southern Beaufort Sea. In Coast and Shelf of the Beaufort Sea; The Arctic Institute of North America: Calgary, AB, Canada, 1974; pp. 113–161. [Google Scholar]
  8. Parmerter, R.E.; Reid, R. A model of simple rafting in sea ice. J. Geophys. Res. 1975, 80, 1948–1952. [Google Scholar] [CrossRef]
  9. Hopkins, M.A.; Tuhkuri, J.; Lensu, M. Rafting and ridging of thin ice sheets. J. Geophys. Res. Oceans 1999, 104, 13605–13613. [Google Scholar] [CrossRef]
  10. Weeks, W.F.; Anderson, D.L. Sea ice thrust structures. J. Glaciol. 1958, 3, 173–175. [Google Scholar] [CrossRef]
  11. Worby, A.P.; Jeffries, M.O.; Weeks, W.F.; Morris, K.; Jaña, R. The thickness distribution of sea ice and snow cover during late winter in the Bellingshausen and Amundsen Seas, Antarctica. J. Geophys. Res. Oceans 1996, 101, 28441–28455. [Google Scholar] [CrossRef]
  12. Melling, H.; Topham, D.R.; Riedel, D. Topography of the upper and lower surfaces of 10 hectares of deformed sea ice. Cold Regions Sci. Technol. 1993, 21, 349–369. [Google Scholar] [CrossRef]
  13. Toyota, T.; Takatsuji, S.; Tateyama, K.; Naoki, K.; Ohshima, K.I. Properties of sea ice and overlying snow in the southern Sea of Okhotsk. J. Oceanogr. 2007, 63, 393–411. [Google Scholar] [CrossRef]
  14. Wang, A.; Poplin, J.P.; Heuer, C.E. Hydrocarbon production concepts for dynamic annual sea ice regions. Hydrotech. Constr. 1994, 28, 472–492. [Google Scholar] [CrossRef]
  15. HY/T 047–2016; The Specification for Engineering Sea Ice Techniques. State Oceanic Administration: Beijing, China, 2016.
  16. Q/HSn 3000–2002; Regulations for Offshore Ice Condition and Application in China Sea. Company Standard of China National Offshore Oil Corporation, China National Offshore Oil Corporation: Beijing, China, 2002. (In Chinese)
  17. Buil, P.; Kellner, L.; Ehlers, S.; Von Bock und Polach, R.U.F. Analyzing flexural strength data of ice: How useful is explainable machine learning? In Proceedings of the International Conference on Offshore Mechanics and Arctic Engineering, Hamburg, Germany, 5–10 June 2022; p. 85918. [Google Scholar]
  18. Wang, Q.; Liu, Y.; Lu, P.; Li, Z. The mechanical properties of gas-enriched sea ice. Cold Reg. Sci. Technol. 2025, 239, 104576. [Google Scholar] [CrossRef]
  19. Meng, D.; Chen, X.; Wei, Z.; Ji, S. Prediction of flexural and uniaxial compressive strengths of sea ice with optimized recurrent neural network. Ocean Eng. 2023, 288, 115921. [Google Scholar] [CrossRef]
  20. Xiu, Y.; Li, Z.; Wang, Q.; Han, H.; Zong, Z.; Zu, Y.; Zhang, Y. Experimental study on flexural strength and effective elastic modulus of granular ice in the Bohai Sea, China. Front. Energy Res. 2022, 10, 970051. [Google Scholar] [CrossRef]
  21. Hornnes, V.; Salganik, E.; Høyland, K.V. Relationship of physical and mechanical properties of sea ice during the freeze-up season in Nansen Basin. Cold Regions Sci. Technol. 2025, 229, 104353. [Google Scholar] [CrossRef]
  22. Tian, Y.; Zhao, W.; Yu, C.; Gang, X.; Lu, P.; Yue, Q. Investigations on flexural strength of a columnar saline model ice under circular plate central loading. Water 2023, 15, 3371. [Google Scholar] [CrossRef]
  23. Poplin, J.P.; Wang, A.T. Mechanical properties of rafted annual sea ice. Cold Regions Sci. Technol. 1994, 23, 41–67. [Google Scholar] [CrossRef]
  24. Shafrova, S.; Høyland, K.V. The freeze-bond strength in first-year ice ridges: Small-scale field and laboratory experiments. Cold Regions Sci. Technol. 2008, 54, 54–71. [Google Scholar] [CrossRef]
  25. Chen, X.; Wang, A.; Ji, S. Comparative study of the brittle-ductile transition between level ice and rafted ice based on uniaxial compression experiments. Int. J. Mater. Struct. Integr. 2021, 14, 255–272. [Google Scholar] [CrossRef]
  26. ISO-19906; Petroleum and Natural Gas Industries—Arctic Offshore Structures. International Organization for Standardization: Geneva, Switzerland, 2019.
  27. Li, W.; Yin, H.; Fu, D.; Sun, S. Key Issues and Suggestions for Ice-Resistant Design of Offshore Platform Structures in China. China Offshore Oil Gas 2024, 36, 199–211. [Google Scholar]
  28. Meng, D.; Chen, X.; Ji, S. Experimental study on the flexural strength and failure process of sea ice. Mar. Sci. Bull. 2021, 40, 12. [Google Scholar]
  29. Chen, X.; Høyland, K.; Wang, A.; Ji, S. Determination of heat transfer coefficient on water-ice interface under free-convection condition. Acta Oceanol. Sin. 2018, 40, 140–148. [Google Scholar]
  30. Chen, X.; Høyland, K.V.; Ji, S. Laboratory tests to investigate the initial phase of ice-ridge consolidation. Cold Regions Sci. Technol. 2020, 176, 103093. [Google Scholar] [CrossRef]
  31. Timco, G.W.; Weeks, W.F. A review of the engineering properties of sea ice. Cold Regions Sci. Technol. 2010, 60, 107–129. [Google Scholar] [CrossRef]
  32. Zhang, J.; Zhu, J.; Yao, Y.; Li, S.; Li, X.; Li, T. Physical and optical properties of the first-year ice in the Amundsen Gulf of the Arctic. Haiyang Xuebao 2021, 43, 138–151. [Google Scholar]
  33. Ji, S.; Wang, A.; Su, J.; Yue, Q. Experimental studies and characteristics analysis of sea ice flexural strength around the Bohai Sea. Adv. Water Sci. 2011, 22, 266–272. [Google Scholar]
Figure 1. Comparison of rafted ice structures. (a) rafted ice prepared in this study; (b) Rafted ice prepared in the literature [3].
Oceans 06 00062 g001
Figure 2. Rafted ice flexural specimen.
Oceans 06 00062 g002
Figure 3. Sea ice flexural strength test.
Oceans 06 00062 g003
Figure 4. Schematic diagram of the growth process of rafted ice and single-layer ice.
Oceans 06 00062 g004
Figure 5. Thickness change of ice and single-layer ice. (a) No. 1, (b) No. 2, (c) No. 4, (d) No. 5, (e) No. 6.
Oceans 06 00062 g005
Figure 6. Frozen layer crystal structure.
Oceans 06 00062 g006
Figure 7. Bending failure and test force curves of rafted ice and single-layer ice. (a) bending failure of rafted ice; (b) force curve for rafted ice bending test; (c) bending failure of single-layer ice; (d) force curve for single-layer ice bending test.
Oceans 06 00062 g007
Figure 8. Comparison of flexural strength between rafted ice (l2, red) and single-layer ice (l1, blue).
Oceans 06 00062 g008
Figure 9. Comparison of total salinity between rafted ice (l2, red) and single-layer ice (l1, blue).
Oceans 06 00062 g009
Figure 10. Comparison of effective elastic modulus between rafted ice (l2, red) and single-layer ice (l1, blue).
Oceans 06 00062 g010
Table 1. Preparation parameters of rafted ice.
Preparation LocationSpecimen No.Ambient
Temperature
T (°C)
Single-Layer Freezing Time
t0 (h)
Rafted Ice
Consolidation Time t1 (h)
OutdoorNo. 1−10~−24032
−10~−2
−14~−8
−13~0
No. 2−13~03826
−10~−3
−14~−1
−9~3
IndoorNo. 3−10~−3936
No. 4838
No. 51236
No. 6924
Table 2. Density relationship between rafted ice (I2) and single-layer ice (I1).
Specimen No.Ice TypeMean Density (kg·m−3)Density Standard Deviation (kg·m−3)
No. 1l2900.7540.44
l1925.7271.9
No. 2l2830.4452.7
l1954.1861.5
No. 3l2867.7643.45
l1922.5741.52
No. 4l286327.37
l1917.1824.82
No. 5l2857.2040.05
l1885.5028.07
No. 6l2879.6324.60
l1946.9048.25
Table 3. Rafted ice (l2) and single-layer ice (l1) flexural strength relationship.
Test Specimen No.Total Tests (Groups)Ice TypeMean Flexural Strength (MPa)Flexural Strength Standard Deviation (MPa)Flexural Strength 95% CI (MPa)
No. 57l20.840.130.73~0.95
6l10.650.200.47~0.83
No. 613l20.490.120.42~0.56
12l10.440.100.38~0.50
Table 4. Rafted ice (l2) and single-layer ice (l1) effective elastic modulus relationship.
Specimen No.Ice TypeMean Effective Elastic Modulus (MPa)Effective Elastic Modulus Standard Deviation (MPa)Effective Elastic Modulus 95% CI (MPa)
No. 1l25.741.514.34~7.14
l15.701.624~7.4
No. 2l232.8911.5225.93~39.85
l133.0510.2026.57~39.53
Disclaimer/Publisher’s Note: The statements, opinions and data contained in all publications are solely those of the individual author(s) and contributor(s) and not of MDPI and/or the editor(s). MDPI and/or the editor(s) disclaim responsibility for any injury to people or property resulting from any ideas, methods, instructions or products referred to in the content.