Article

A Multi-Stage Enhancement Based on the Attenuation Characteristics of X-Band Marine Radar Images for Oil Spill Extraction

1
Navigation College, Dalian Maritime University, Dalian 116026, China
2
Maritime College, Guangdong Ocean University, Zhanjiang 524091, China
*
Author to whom correspondence should be addressed.
Oceans 2025, 6(3), 39; https://doi.org/10.3390/oceans6030039
Submission received: 26 May 2025 / Revised: 13 June 2025 / Accepted: 30 June 2025 / Published: 1 July 2025

Abstract

Marine oil spills cause significant environmental damage worldwide. Marine radar imagery is used for oil spill detection. However, the rapid attenuation of backscatter intensity with increasing distance limits detectable coverage. A multi-stage image enhancement framework integrating background clutter fitting subtraction, Multi-Scale Retinex, and Gamma correction is proposed. Experimental results using marine radar images sampled in the oil spill incident in Dalian 2010 are used to demonstrate the significant improvements. Compared to Contrast-Limited Adaptive Histogram Equalization and Partially Overlapped Sub-block Histogram Equalization, the proposed method enhances image contrast by 24.01% and improves the measurement of enhancement by entropy by 17.11%. Quantitative analysis demonstrates 95% oil spill detection accuracy through visual interpretation, while significantly expanding detectable coverage for oil extraction.

1. Introduction

Oil spills can induce both immediate and prolonged environmental damage [1,2,3,4,5,6,7]. Such impacts encompass not only direct toxic effects but also long-term ecosystem consequences mediated by the accumulation of polycyclic aromatic hydrocarbons (PAHs) in sediments [8]. As a critical component in oil spill response systems, timely detection significantly reduces response latency [9,10]. Maritime vessels are typically equipped with radar systems for navigational operations, and radar imagery acquired from these systems can be repurposed for oil spill surveillance [11,12].
In marine radar images, the backscatter signal intensity from oil spill areas is weaker than that of the surrounding water, a phenomenon that can be leveraged for oil spill detection [13]. Studies have been conducted on oil spill detection using marine radar images. An adaptive thresholding using multi-scale was employed to carry out the oil spill segment in X-band radar data [14]. A semi-automatic method integrating gray-level co-occurrence matrix (GLCM) texture analysis and adaptive thresholding demonstrated robustness against complex sea clutter, and subsequently, the integration of GLCM, support vector machine (SVM), and fuzzy C-means (FCM) clustering provided a robust solution for real-time oil spill identification based on marine radar images [15]. Notably, SVM-based classification has been further validated in SAR remote sensing scenarios, where it effectively distinguishes oil spills from look-alike phenomena (e.g., low-wind areas and biological slicks) by incorporating weather-conditioned backscatter features, demonstrating its adaptability to complex marine environments [16]. A hybrid framework combining histogram of oriented gradients (HOG) with particle swarm optimization (PSO) was designed to achieve a rapid response to oil spill accidents [17]. Subsequent advancements introduced deep learning architectures, such as soft attention segmentation models, which addressed edge ambiguity through multi-scale convolutional feature fusion, achieving pixel-level classification precision. On this basis, YOLO-based models were developed to increase the computational efficiency and real-time applicability [18]. The aforementioned methods achieve oil spill identification primarily within proximal zones of marine radar coverage, where backscatter intensity retains sufficient for threshold-based classification. To expand the detectable areas of marine radar imagery for oil spill extraction without hardware upgrades, image enhancement frameworks should be introduced.
Adaptive Histogram Equalization (AHE) demonstrates the capacity for local detail enhancement, while Weighted Thresholded Histogram Equalization (WTHE) balances contrast through frequency adjustment, representing histogram-based optimization approaches that mitigate over-enhancement issues [19,20,21]. In the domain of Retinex-based approaches, path models (e.g., Random Spray Retinex) emulate human visual perception mechanisms [22,23]. Variational models such as Low-Light Image Enhancement via Illumination Map Estimation and Simultaneous Reflectance and Illumination Estimation employ mathematical optimization frameworks that ensure stability while suppressing noise and halo artifacts, with all mentioned methodologies finding extensive application in low-light image enhancement [24]. Regarding visual cortex neural network models, the Pulse-Coupled Neural Network (PCNN) replicates biological visual synchronization mechanisms to enhance textural and edge features, having demonstrated successful implementation in medical image enhancement and texture analysis domains [25,26]. However, when applied to maritime radar imagery characterized by drastic variations, intense contrast, and weak target signals requiring detection, none of the aforementioned methods can directly produce effective processing outcomes. The proposed marine radar-based oil spill detection method, which integrates image enhancement, YOLOv8 deep learning network, and SA_PSO, achieves accurate identification of oil spill regions. However, the limited availability of navigational radar image datasets results in compromised model generalizability [27]. Therefore, a multi-stage image enhancement framework integrating marine radar background clutter fitting subtraction, Multi-Scale Retinex (MSR), and Gamma correction is proposed. This approach effectively suppresses false oil spill identifications induced by weak backscattering signals from distant waters, while simultaneously enhancing oil–water contrast and expanding detectable coverage for oil extraction.

2. Study Area and Data Sets
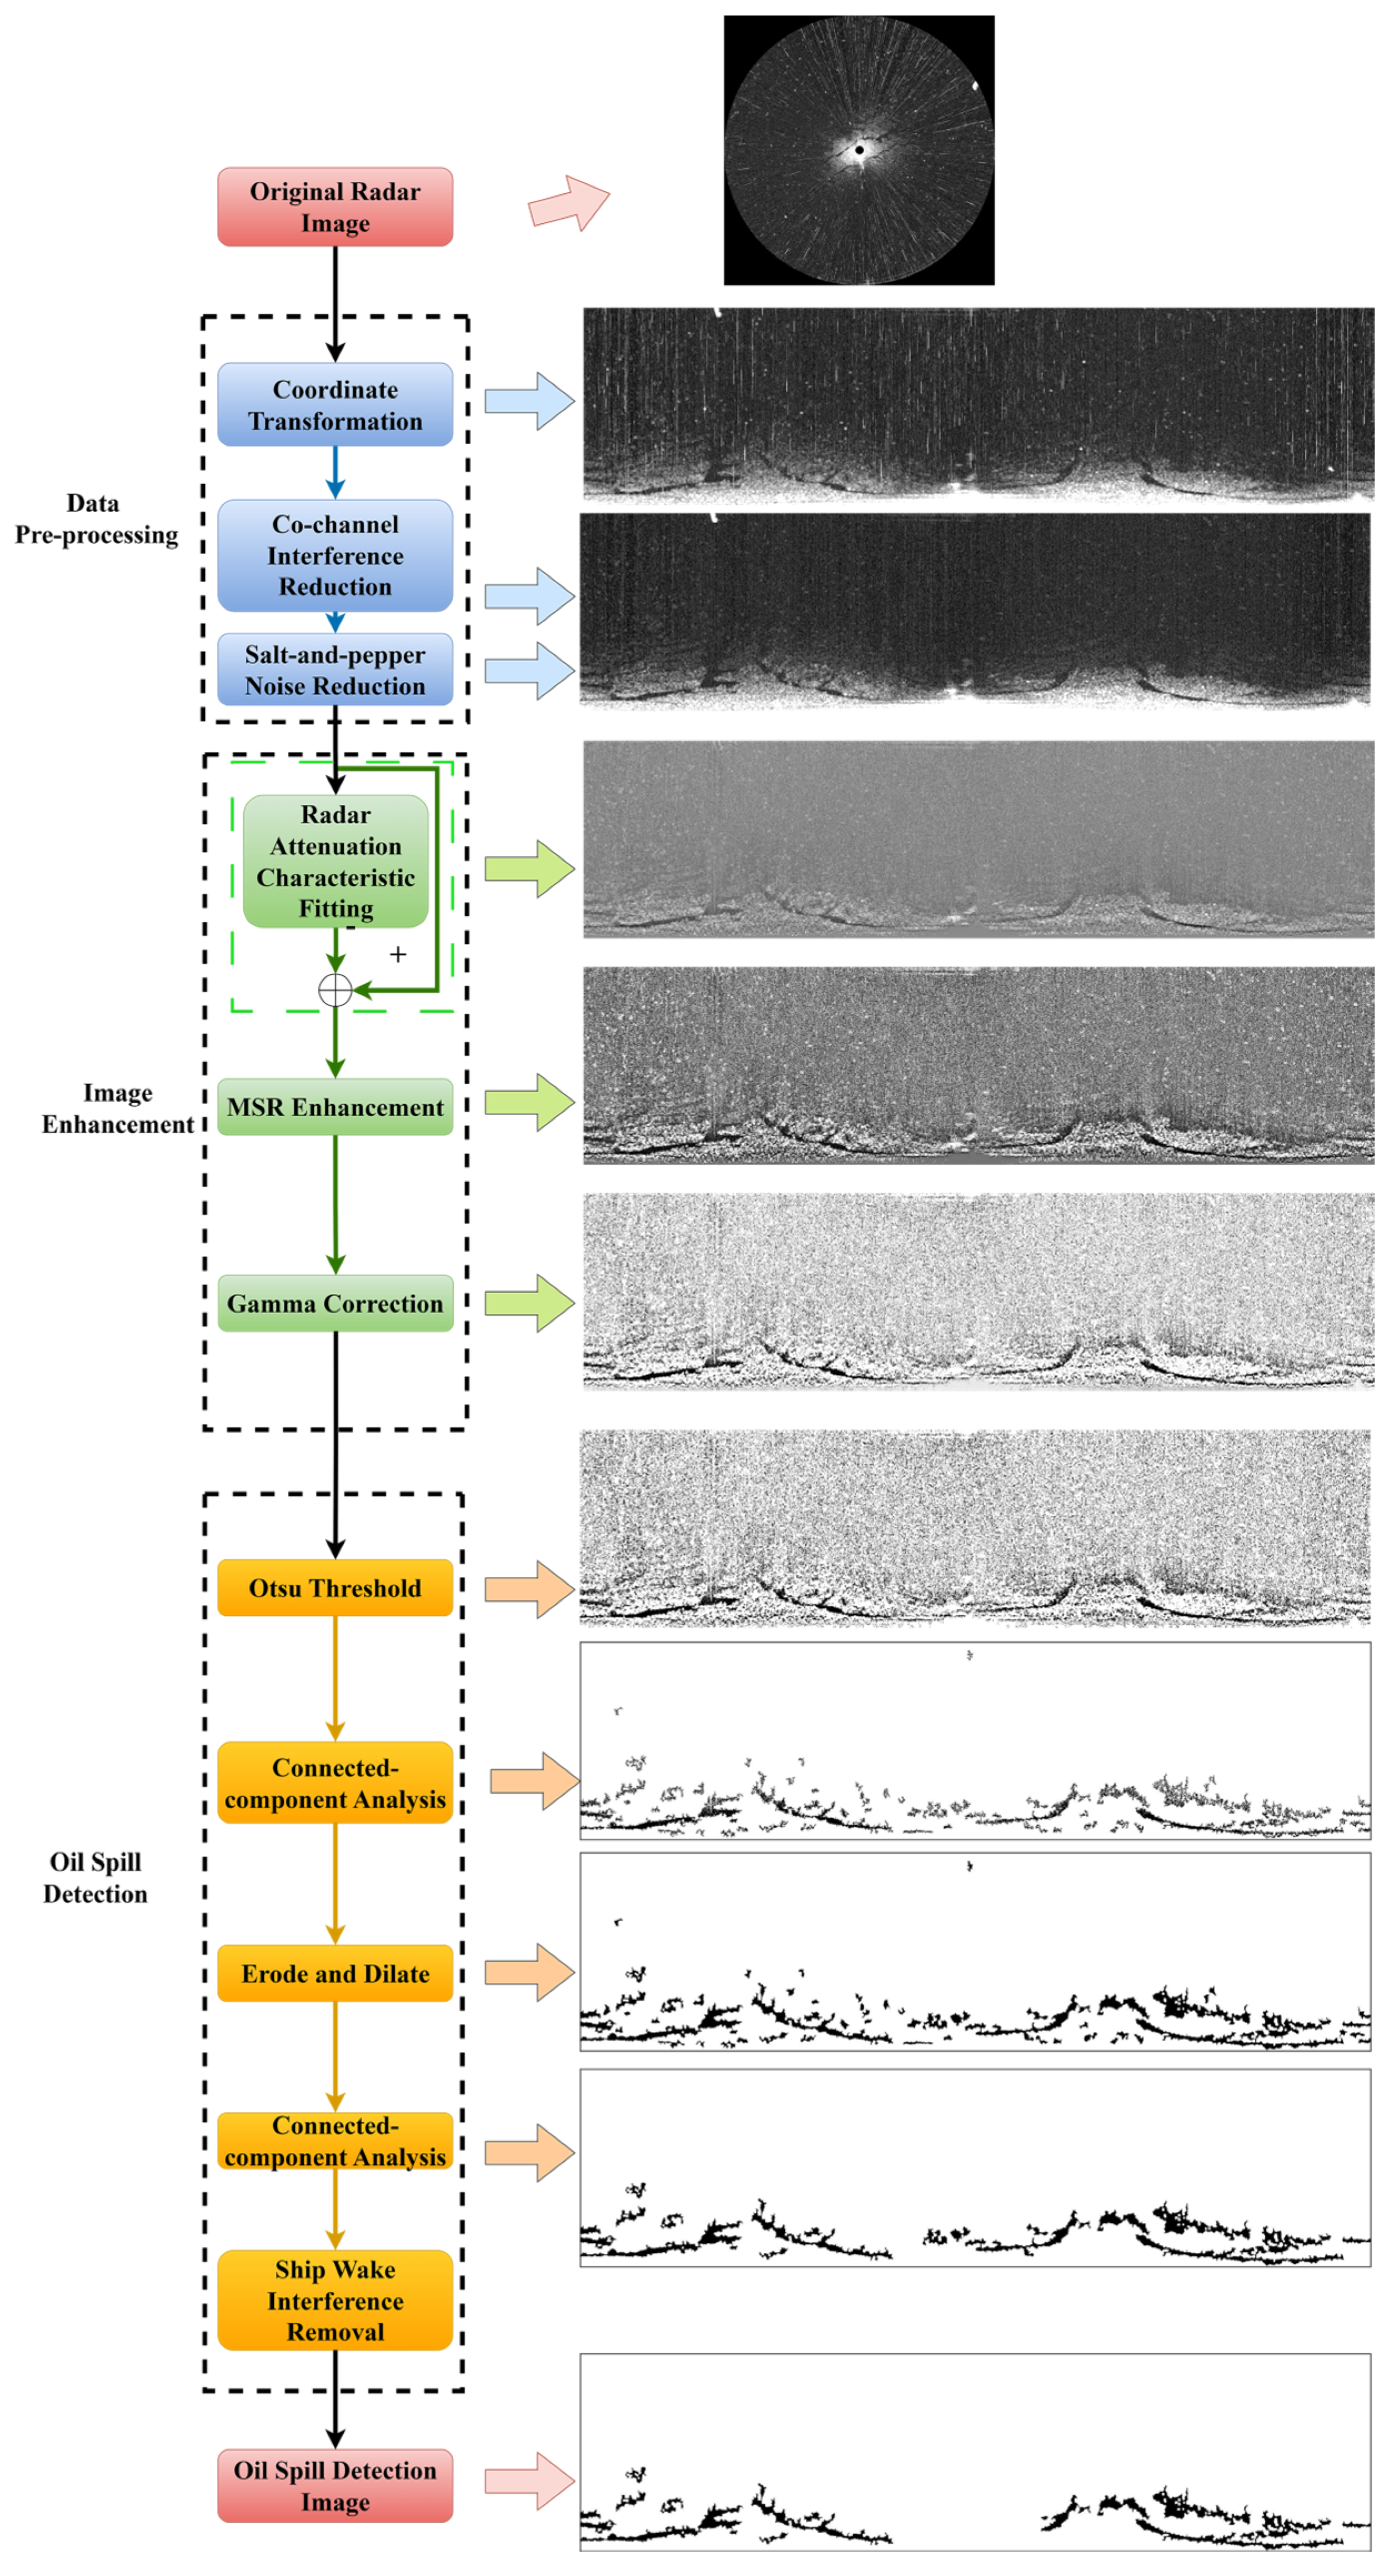
An oil spill incident occurred along the shore of Dalian on 16 July 2010, resulting in a significant amount of oil being discharged into the ocean. The teaching-training ship “YUKUN,” owned by Dalian Maritime University, was tasked with measuring the oil spills in the coastal area. An X-band marine radar (Model: Sperry Marine Vision Master FT) was installed on the “YUKUN,” and radar images were utilized to detect the oil spill. Some parameters of the X-band marine radar are shown in Table 1. The navigation route of the “YUKUN” on 21 July 2010, is shown in Figure 1a, and a sampled radar image at 23:19:45 is shown in Figure 1b. The weather was cloudy, with wind speed at 5 km/h from 130°, temperature of 24 °C, humidity at 92%, atmospheric pressure of 1008.8 h Pa, and sea temperature of 19.8 °C. The backscatter intensity of water surfaces rapidly decays with distance. When exceeding a certain range, the difference between the backscatter intensities of oil spills and water surfaces becomes indistinguishable. Therefore, in practical applications, the radar detection range is typically selected within 1000 m [12,28]. In this study, the maximum detection range of the utilized radar is 1389 m (0.75 nautical mile).
To exclude possible interferences in the marine radar image in Figure 1, a ship-borne thermal infrared sensor was used. The sensor has a wavelength ranging from 7.5 to 13 µm, which is shown in Figure 1c. The thermal infrared image captured at 23:19, 21 July 2010 on “YUKUN” is shown in Figure 1d. Figure 1d confirms the presence of authentic oil spill signatures in the radar-detected area, as opposed to lookalike objects similar to oil spill.

3. Methodology

The flowchart of oil spill detection is shown in Figure 2. Firstly, the original radar images are pre-processed by coordinate transformation and noise reduction. Then the pre-processed radar images are processed by the multi-stage image enhancement framework. Finally, oil spills are extracted by the Otsu method, connected component analysis, and morphological operation.

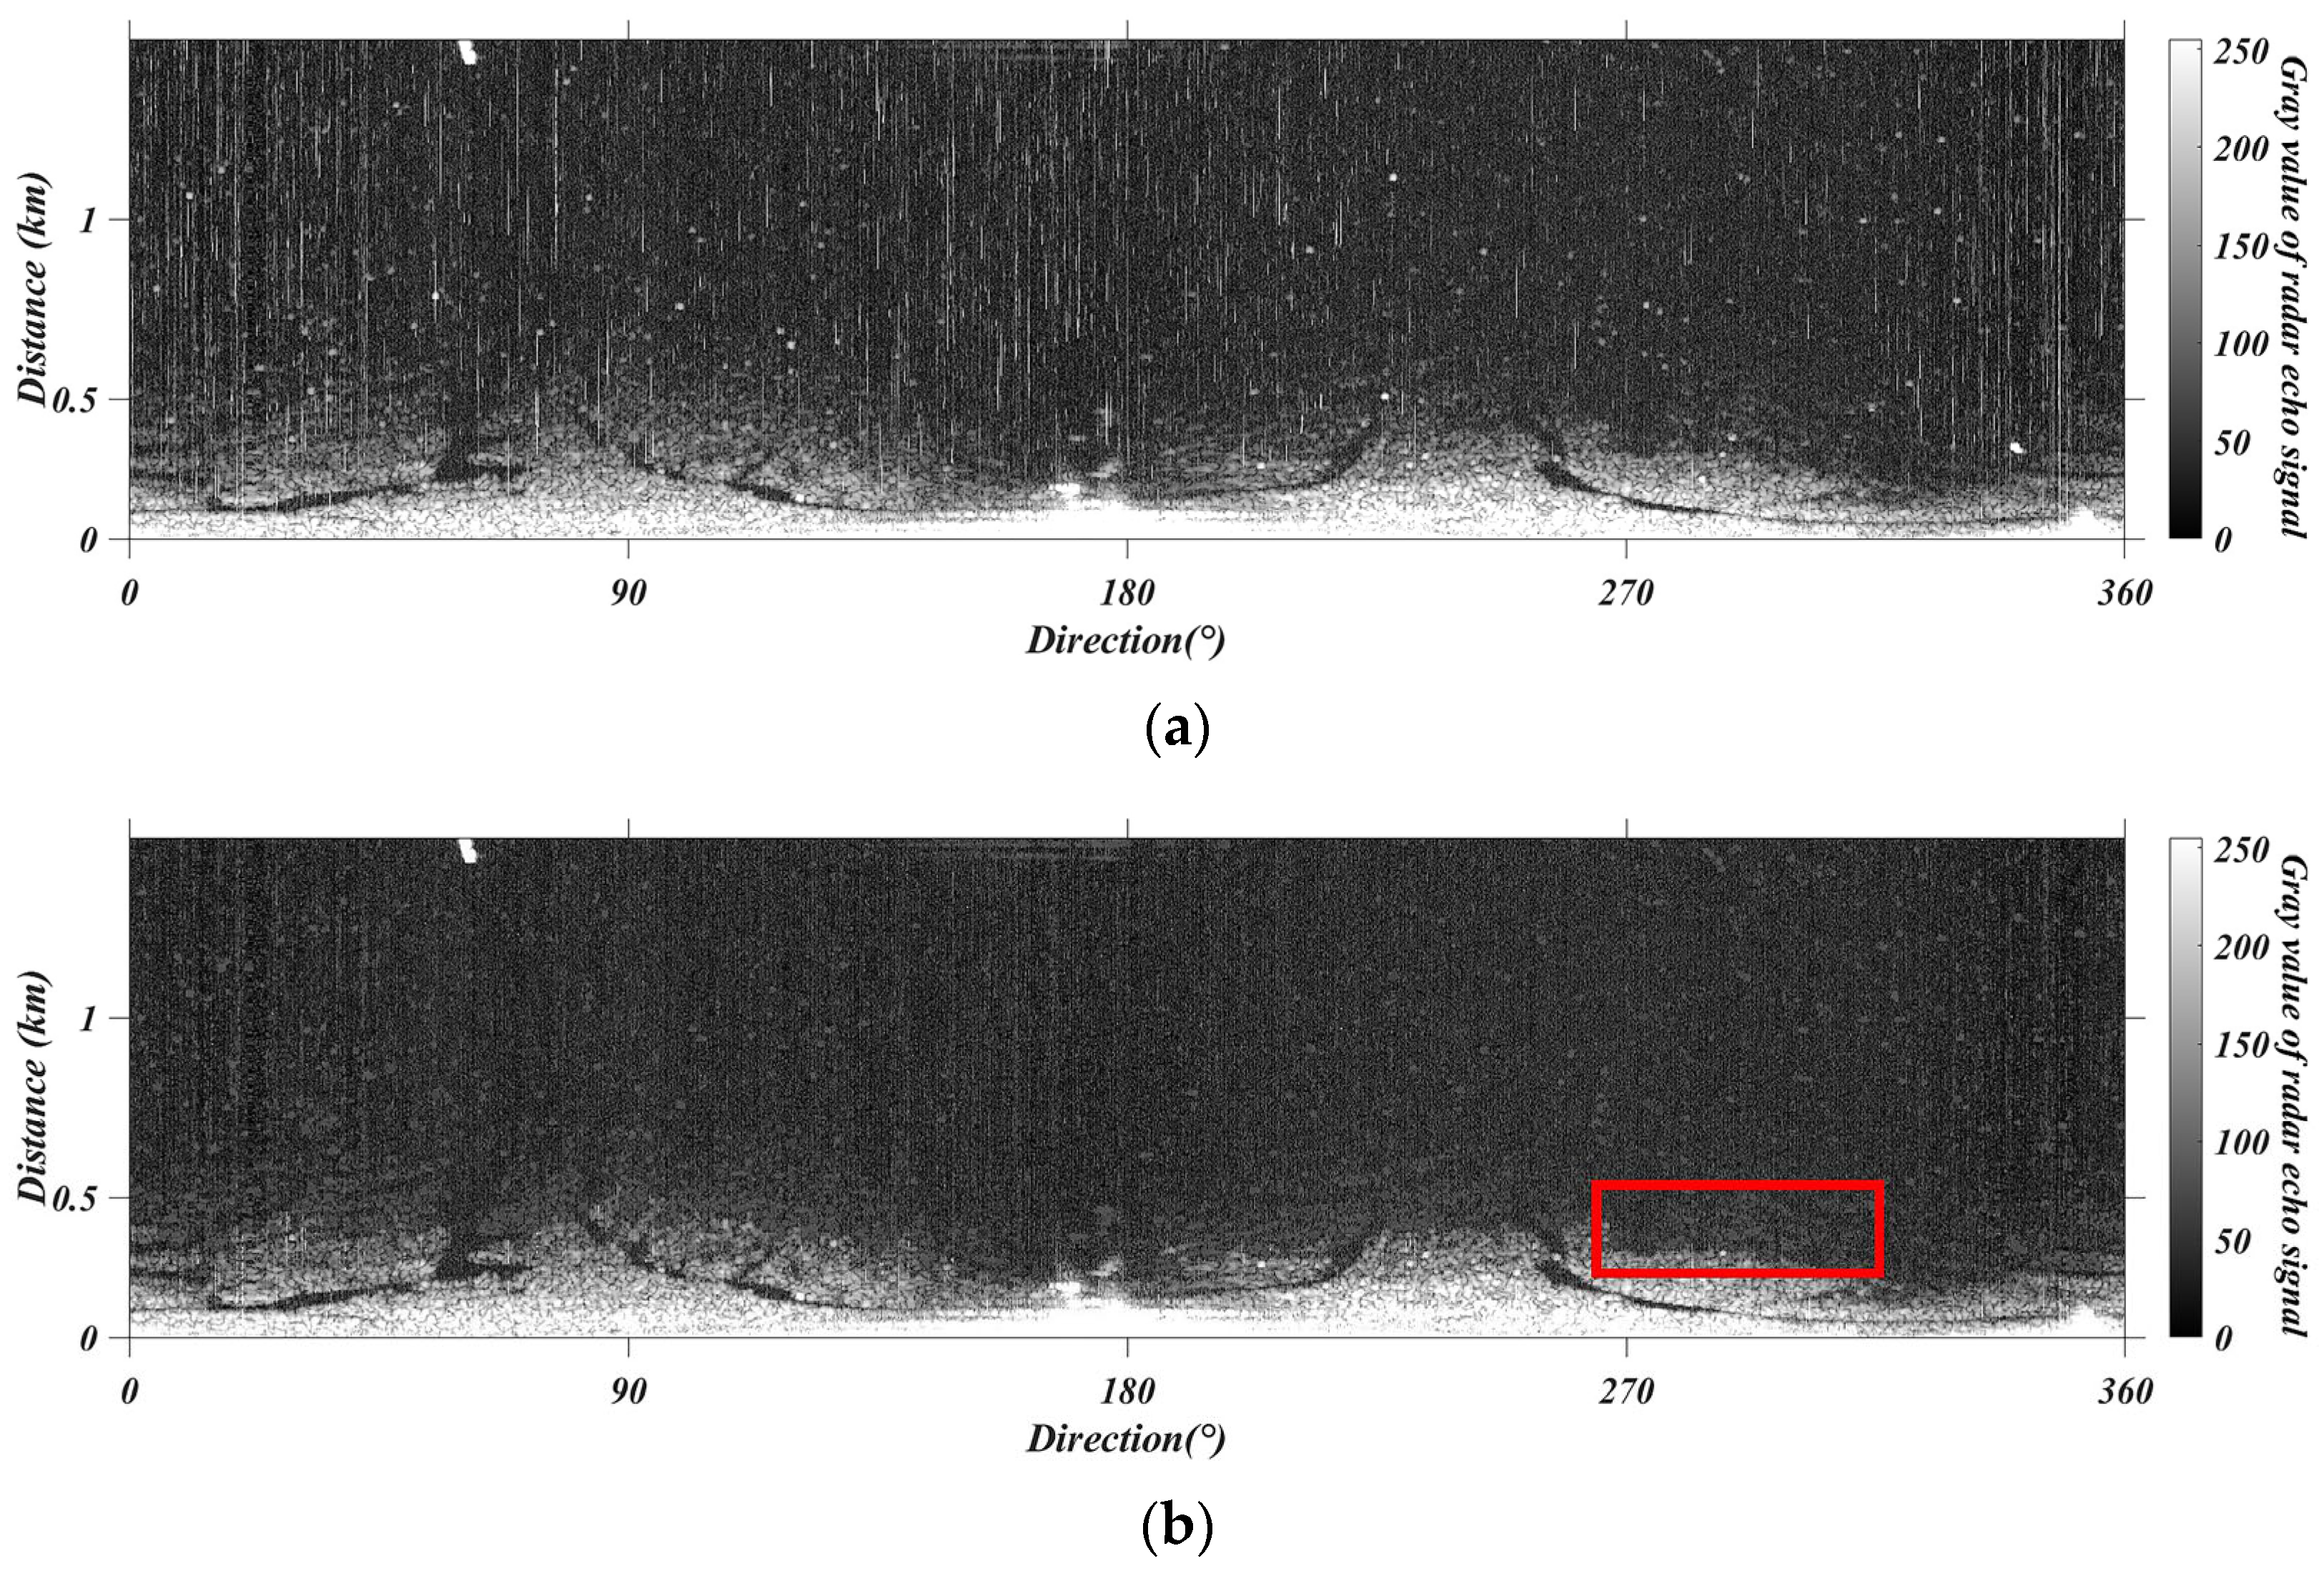
3.1. Data Pre-Processing

The raw radar images acquired by the marine radar system were transformed to the coordinate-aligning azimuth and slant-range axis. Co-channel interference was mitigated by a systematic two-stage filtering process: two orthogonal convolutional operators (1 × N and N × 1 matrices) were implemented to detect co-channel interference, followed by noise suppression using a mean filter [29,30]. For salt-and-pepper noise in high-reflectivity regions, a Field of Experts (FoE) model was applied to constrain anomalous brightness through Markov random field regularization [31]. Based on data pre-processing, radar images with the co-channel interference erased and salt-and-pepper noise reduced were obtained.

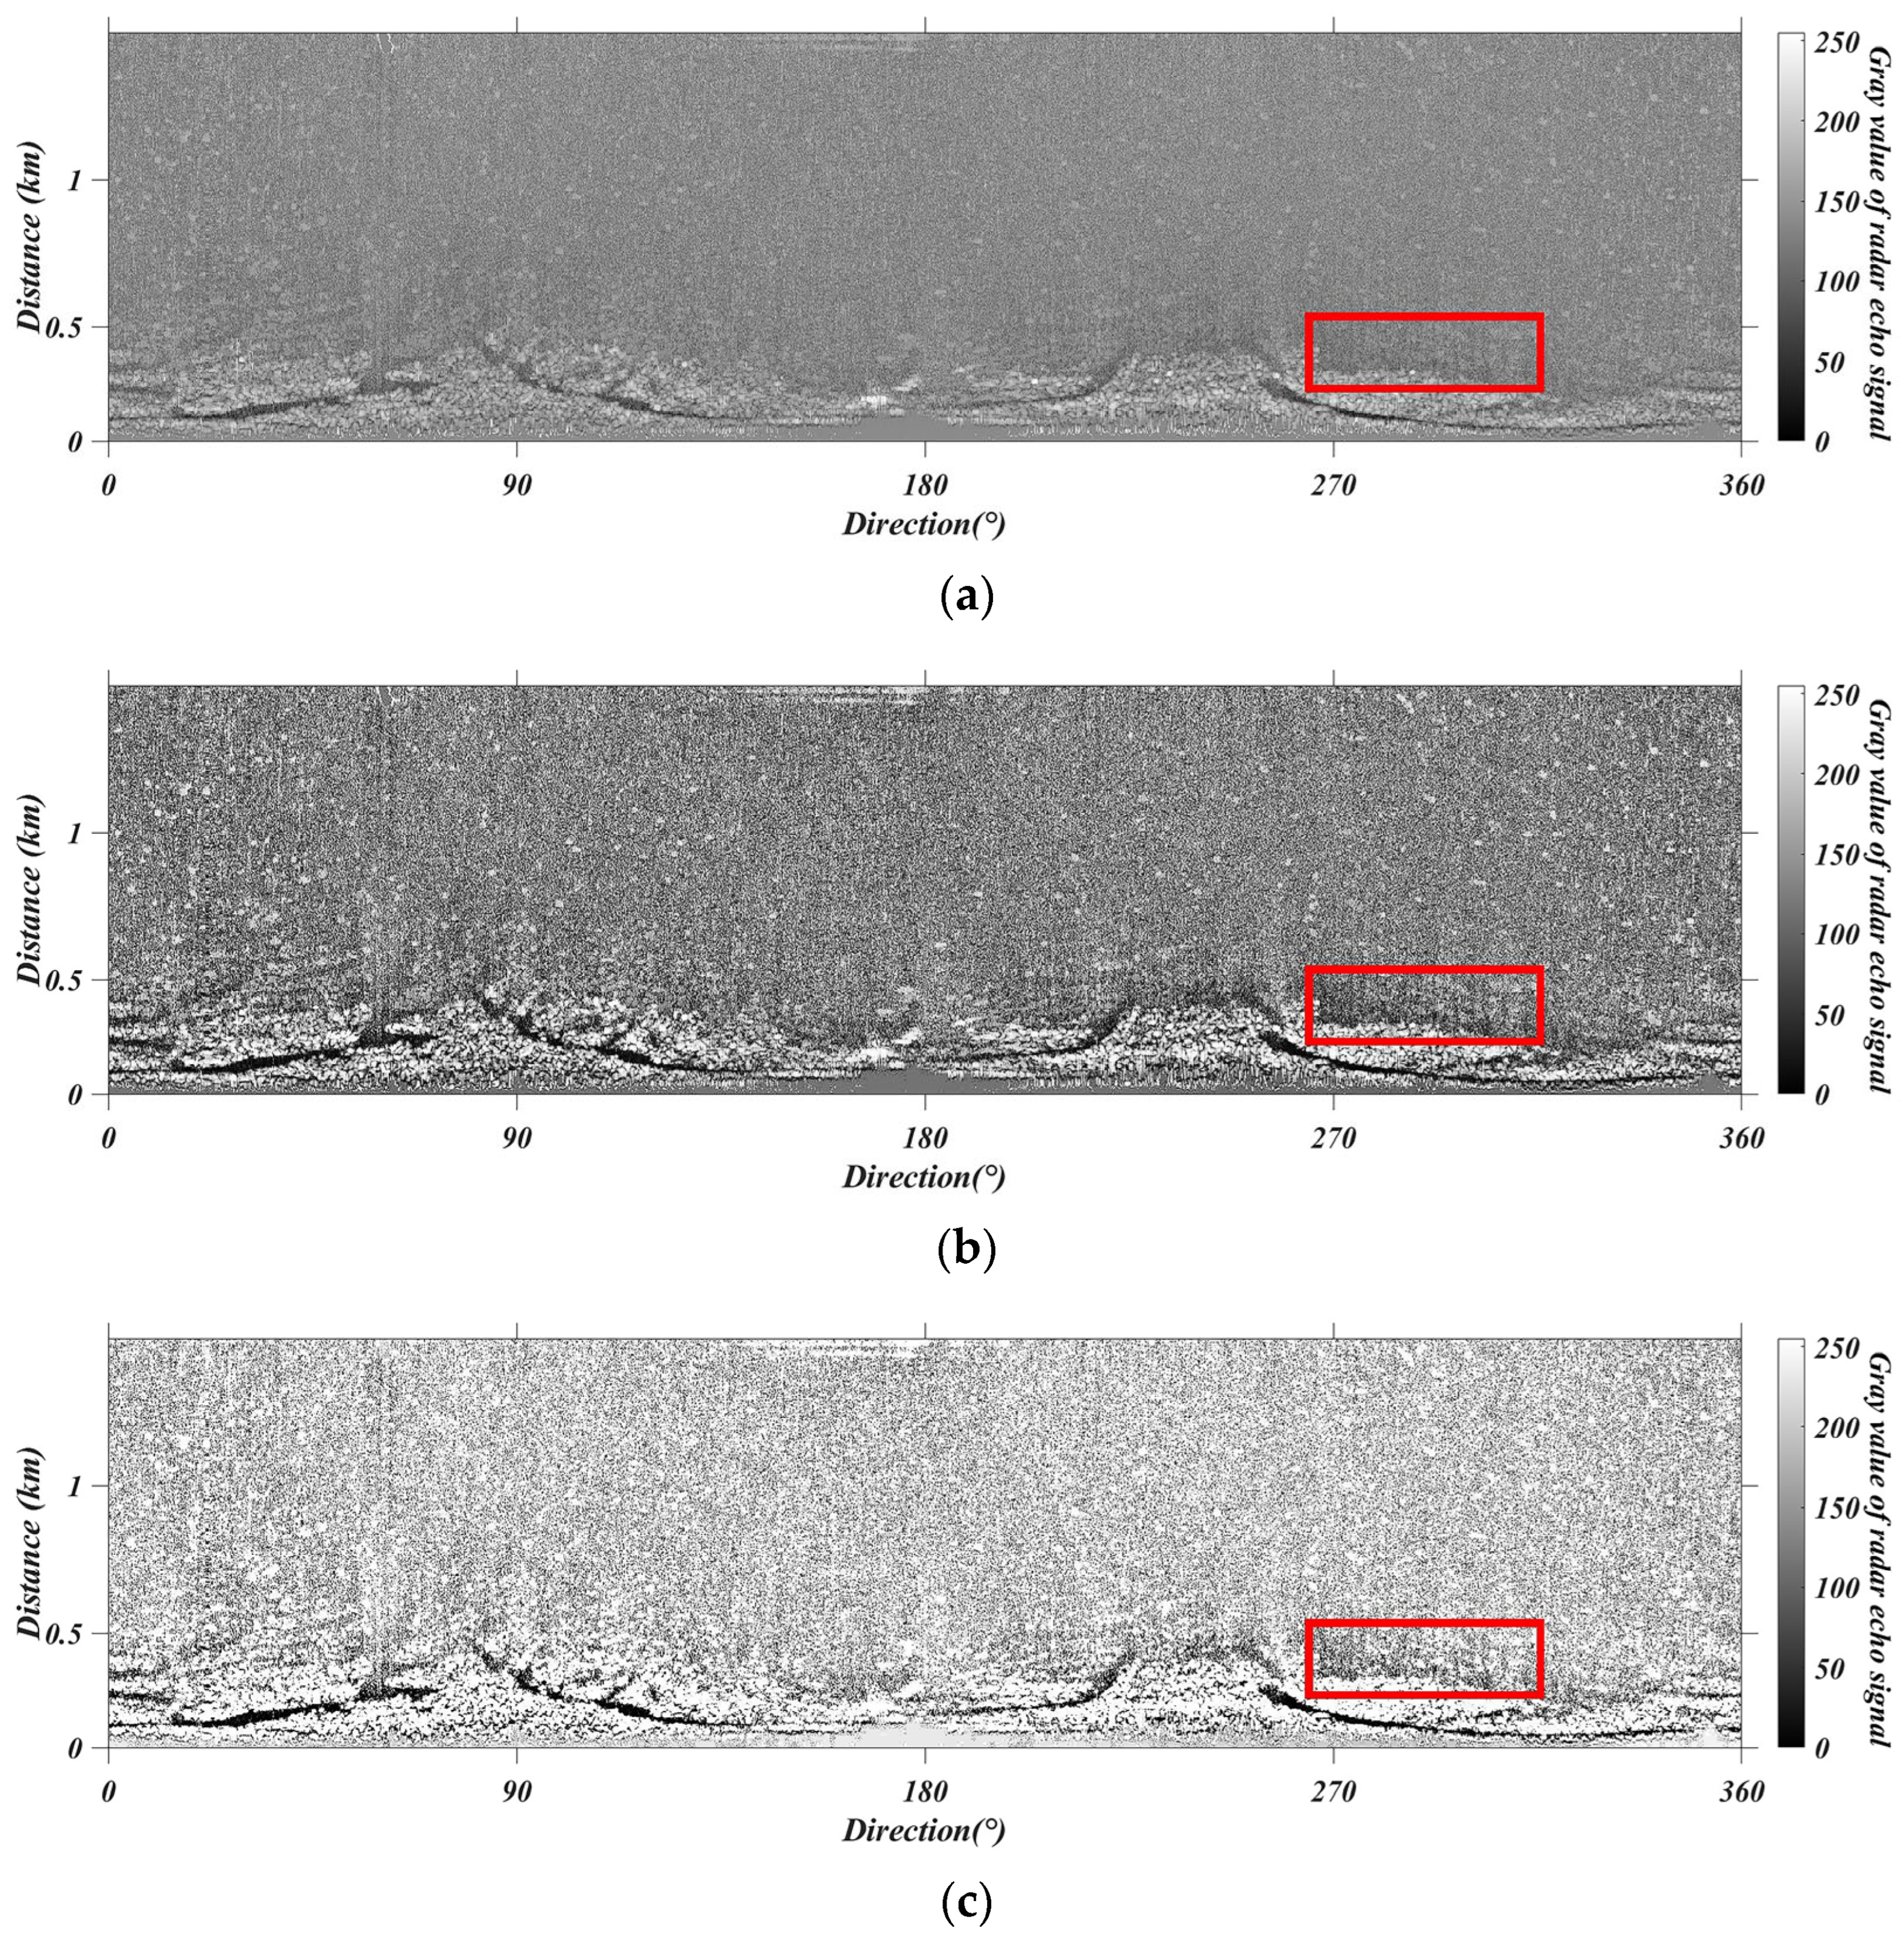
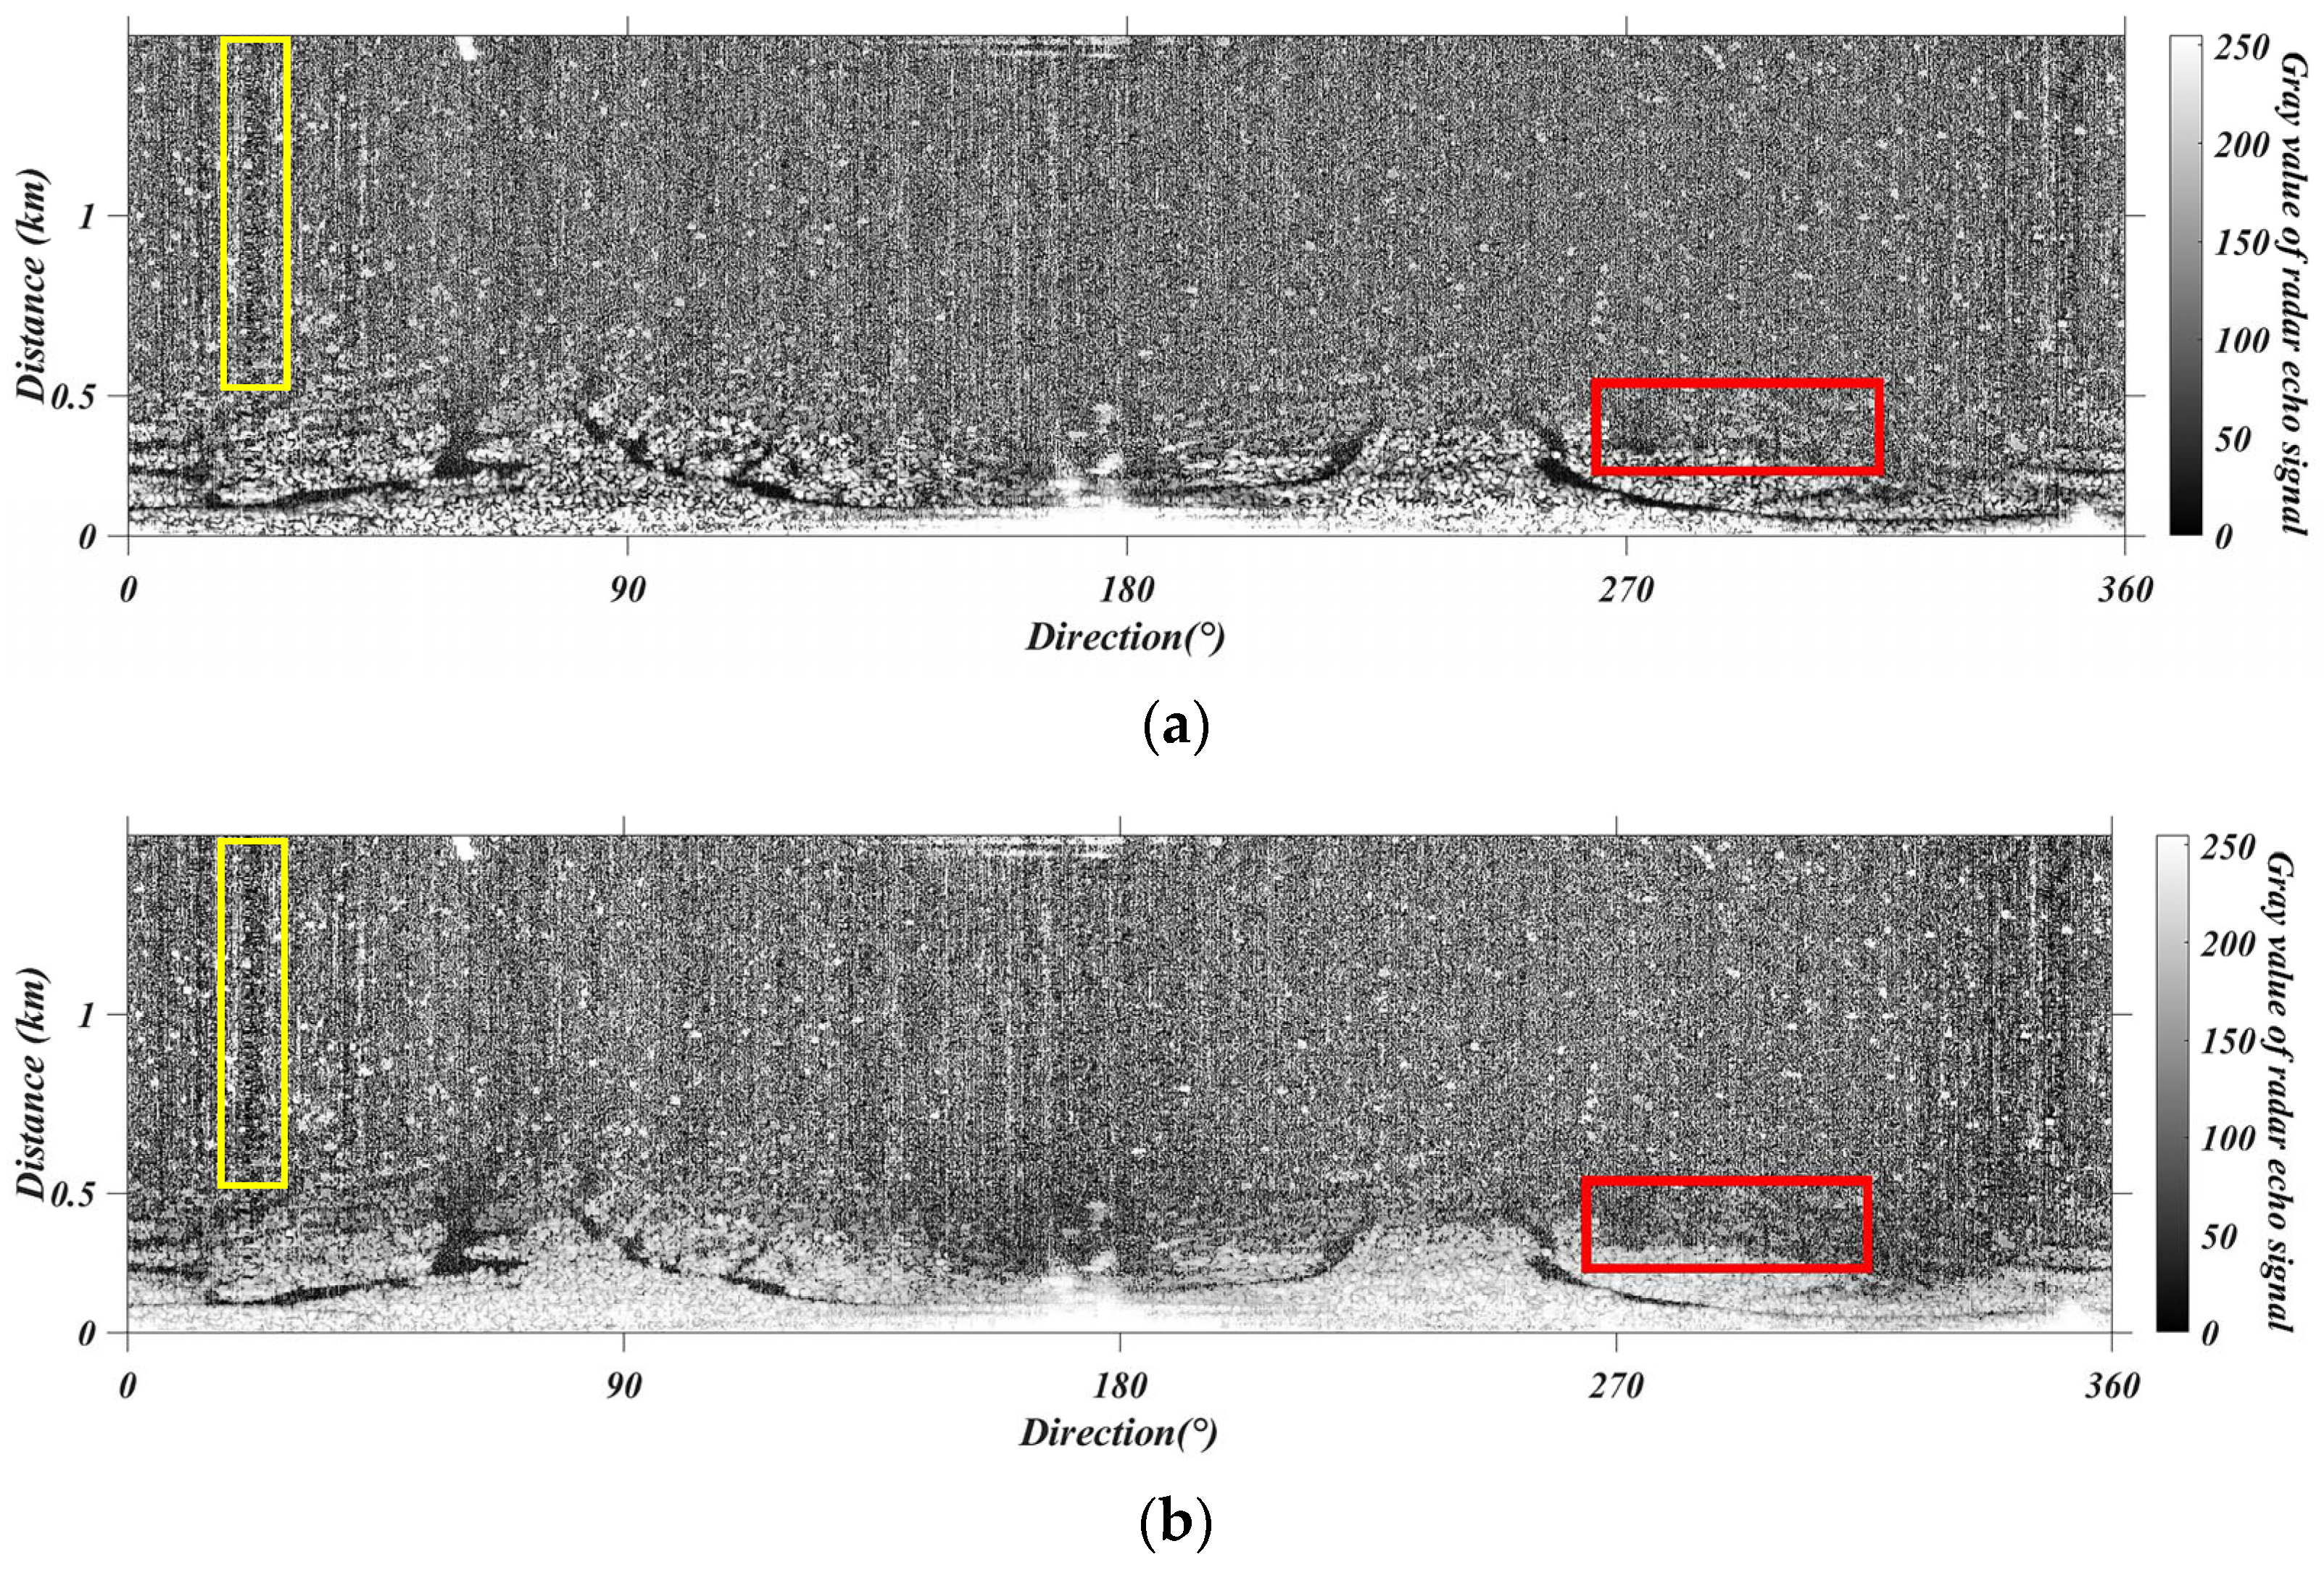
3.2. Image Enhancement

Based on the attenuation characteristics of X-band marine radar images, background clutter fitting of the radar images was performed by applying the following equation [30]:
P r n = η = 4 M 3 D η R n η ,
where P r n denotes the received power of the radar signal along the incident direction at the n th pixel; D η is the coefficient derived from the ordinary least square method [32] in the incident direction; R n corresponds to the signal propagation distance for the n th pixel along the incident direction; and M is the order of Taylor polynomial. The exponent η of the leading term assumes a value of −4 due to the operational principle of marine radar systems as characterized by the following formula:
Q r = Q t G t 4 π L 2 σ A r 4 π L 2 = K p σ L 4 ,
where Q t is the power of the radar transmitter; G t is the power gain of a transmitting antenna; A r is the effective aperture area; L is the range; σ is the radar cross section; and K P is the coefficient calculated as the following:
K P = A r P t G t 4 π 2 .
For an installed navigation radar system, the parameters of antenna are set and known for users. Therefore, Q t , G t , and A r are known, and K P which calculated by Q t , G t , and A r is also known. The received power of navigation radar Q r is inverse proportional to L 4 .
Background clutter fitting compensates for range-dependent backscatter intensity attenuation, thereby improving oil spill identifiability in marine radar imagery. However, the difference between the oil spill and the clutter far from the radar on the radar image is small and difficult to distinguish. Based on the reflected radar signals, the marine radar provides images similar to the optical images with point light source. Therefore, the MSR algorithm was implemented to improve contrast characteristics.
The MSR algorithm is a bio-inspired image enhancement technique derived from human visual perception [33,34,35,36,37]. The MSR algorithm employs multi-scale Gaussian decomposition to decouple structural details from ambient illumination, achieving dynamic range compression and edge-preserving enhancement through logarithmic transformations and weighted fusion of reflectance components across spatial frequencies. By integrating Gaussian kernels with varying bandwidths, MSR balances color constancy (via large-scale filters) and local detail enhancement (via small-scale filters), effectively suppressing high-frequency noise while retaining critical edge. This framework avoids post-processing techniques like histogram equalization, relying instead on multi-scale reflectance recombination to mitigate haloing artifacts and maintain natural tonal consistency. The mathematical formulation is expressed as follows:
F i x , y = k = 1 K W k · log S i x , y log S i x , y M k x , y ,
where F i x , y is the output value of the i -th color channel after MSR processing; S i x , y is the Pixel value of the i -th color channel in the original input image; x , y represent the horizontal and vertical coordinate positions of the image; the subscript i R , G , B specifies spectral bands of red, green, and blue, with grayscale adaptation achieved through triplet replication of monochromatic data across synthetic RGB channels; K represents the cardinality of the scale set k ; and W k assigns normalized weights to Gaussian kernels at distinct scales. The convolutional operators M k x , y are defined as radially symmetric functions with the following:
M k x , y = L k e x p x 2 + y 2 / σ k 2 ,
where σ k parameterizes the Gaussian convolution kernel, characterizing spatial resolution. Scale selection critically modulates Retinex outputs: finer scales σ k 0 exhibit strong tonal compression, whereas coarser scales σ k predominantly govern chromatic consistency. The kernel coefficients L k are constrained by the normalization condition
M k x , y d x d y = 1 ,
which is rigorously enforced through bilateral filtering. This normalization constraint ensures consistent energy preservation across multi-scale Gaussian kernels, which is essential for maintaining balanced contributions between fine-scale tonal compression and coarse-scale chromatic consistency while preventing excessive amplification or attenuation of image details.
Compared to conventional histogram-based enhancement methods, the MSR framework significantly mitigates local over-enhancement through its multi-scale decomposition mechanism. Furthermore, the algorithm optimizes luminance distribution in low-light conditions via logarithmic domain transformations, achieving simultaneous improvements in perceptual clarity and structural contrast [38].
To enhance contrast in low-intensity regions after MSR, Gamma correction was implemented to achieve nonlinear remapping of pixel values while preserving gray gradient coherence in dark tonal ranges. Gamma correction is primarily employed to modulate luminance distribution through nonlinear remapping of pixel values. This transformation enhances feature identifiability in underexposed/overexposed regions while improving global contrast characteristics [39]. The Gamma transformation operates according to the following:
I o u t = I i n γ ,
where I i n denotes the original intensity value in the marine radar image; I o u t represents the Gamma-transformed value; and γ parameterizes the nonlinear transformation, governing the curvature of the tonal redistribution function.

3.3. Oil Spill Detection

With the oil spill regions highlighted following the image enhancement workflow, oil spill detection was carried out.
Firstly, the enhanced marine radar image was binarized using Otsu’s method to obtain rough locations of oil spills [40,41]. The Otsu method (Otsu’s algorithm) is an adaptive threshold segmentation technique based on maximizing inter-class variance, primarily used for image binarization processing. Its core principle involves identifying an optimal threshold to partition an image into foreground and background regions by maximizing the variance between these two classes, thereby achieving optimal segmentation performance. Following multi-stage enhancement processing (including background removal) of marine radar imagery, this method enables crude extraction of oil spill information from the radar images.
Subsequently, a connected component analysis was used to eliminate the small areas of the detected regions in the binary image. Connected component refer to pixel clusters within an image that share identical pixel values and are spatially adjacent. By performing connected component analysis on the binarized oil spill image and applying area threshold filtering, interference regions can be effectively eliminated.
Thirdly, morphological operations of dilate and erode were applied to suppress the internal noise of the identified oil spill areas [42,43,44]. Dilation and erosion represent classical morphological operations. Dilation expands the foreground regions to fill holes, connect adjacent objects, or increase edge width, while erosion shrinks the foreground regions to remove fine noise, separate overlapping objects, or smooth boundaries. The synergistic application of these operations enable suppression of internal noise within identified oil spill regions while preserving their original boundaries.
Fourthly, a secondary connected component analysis was performed to remove larger misidentified regions of the detected oil spills.
Finally, regions potentially misidentified due to ship wake interference were systematically filtered from the radar imagery. Ship wake generates intense water surface disturbances that manifest as distinct brightness variations in radar imagery. These variations are unrelated to oil spills and cannot be eliminated through signal processing. Therefore, in oil spill extraction procedures, regions affected by ship wake are manually excluded, specifically those spanning 30° port side to 30° starboard relative to the stern azimuth.

4. Experiment and Discussion

4.1. Data Processing

The image captured by marine radar in Figure 1b was transformed into the coordinate aligning azimuth and slant-range axis with the dimension of 512 × 2048 shown in Figure 3a. In the transformed coordinate, the horizontal axis denotes the azimuth angle from 0° to 360°, and the vertical axis indicates the detection range of 1389 m (0.75 nautical mile). Following the coordinate transformation of the original radar imagery, co-channel interference was first identified using directional orthogonal convolution kernels of 1 × 7 and 7 × 1 all one vectors and subsequently filled through mean filtering with a row vector. Salt-and-pepper noise was attenuated via the FoE using 3 × 3 square patches with eight filters. Ultimately, the denoised marine radar image is shown in Figure 3b. The red rectangular region is located in the marine radar imagery of a highly dynamic area with intensity variations, which is challenging for image enhancement.
The pre-processed marine radar images were processed sequentially, following the workflow in Figure 1. The parameter configurations implemented in the background clutter fitting, MSR, and Gamma correction are systematically documented in Table 2. All parameters used were determined via a stepping parameter selection process. The enhancements of all processing stages for Figure 3b are presented in Figure 4. The background clutter fitting was subtracted from the pre-processed marine radar image to eliminate background interference, with the resultant output shown in Figure 4a. As displayed in Figure 3b, the pre-processed radar image exhibited a non-uniform grayscale distribution of the background. After background clutter fitting removal, the grayscale distribution demonstrated improved uniformity as visualized in Figure 4a. However, the background fitting procedure induced contrast reduction in the radar image, complicating the differentiation of oil spill regions. Therefore, the MSR algorithm was applied to further process the background-removed maritime radar imagery. With the operational parameters documented in Table 2, the enhanced marine radar image is shown in Figure 4b. Compared with Figure 4a, MSR implementation significantly enhanced image contrast. However, extensive low-grayscale areas persisted in the processed imagery. Since oil spill detection using marine radar imagery relies on identifying regions with low grayscale values, Gamma correction was subsequently implemented. Based on the parameter γ setting as 0.5, the final enhanced marine radar image is presented in Figure 4c, demonstrating grayscale adjustment in non-spill regions.

4.2. Enhancement Analysis

Contrast is a classical parameter for quantitatively evaluating image enhancement methods. Calculating Contrast can effectively assess the enhancement effectiveness, and its computational formula is as follows:
σ = 1 Π ν = 1 Π Ρ ν μ 2 ,
where Ρ ν is the pixel gray value, μ is the mean gray value, and Π is the total pixel count.
Measurement of enhancement by entropy ( E M E ) is a typical quantitative evaluation metric for image enhancement [45]. A high E M E value generally indicate a significant contrast enhancement. The E M E can be expressed as follows:
E M E = 1 a b i = 1 a j = 1 b 20 l o g 10 I max i , j I min i , j + C ,
where a and b denote the row and column dimensions of the image grid partitioning; I max i , j and I min i , j corresponds to the maximum and minimum pixel values within the i , j th subregion; and the constant C (assigned 1 × 10 5 in this experiment) prevents computational singularities during logarithmic transformation.
Contrast and E M E was calculated in the red rectangular regions in Figure 3b and Figure 4a–c. Additionally, gamma correction is applied directly to background-removed images to conduct an ablation study, and the contrast and E M E values of the aforementioned regions are calculated. The calculation results are shown in Table 3.
The results of Contrast and E M E in Table 3 validate the effectiveness of the proposed multi-stage image enhancement framework. The background clutter fitting subtraction reduced contrast characteristics at oil–water interfaces in maritime radar imagery, with the contrast value decreasing by 38.33%, and the E M E value decreased 89.82%. Subsequent application of MSR visually darkens the oil spills and areas similar to oil spills, which improves the contrast value to be 63.47, and the E M E to be 56.14. However, the application of Gamma correction after the background-removed image provides the contrast value of 24.85 and EME of 3.53, which are the minimum values of these methods. Gamma correction enhanced contrast obviously for oil spill detection, with the contrast value increasing to 84.55, and the value of E M E becomes 127.82. Both the qualitative assessment by visual vision and quantitative analysis by Contrast and E M E confirm the methodological efficacy of the applied enhancement techniques.
To enable rigorous validation of the proposed method’s efficacy, Contrast-Limited Adaptive Histogram Equalization (CLAHE) and Partially Overlapped Sub-block Histogram Equalization (POSHE) were introduced for comparative analysis.
CLAHE is an image enhancement technique designed to improve upon Adaptive Histogram Equalization (AHE) by addressing its noise amplification issues [19]. CLAHE divides an image into local contextual regions (e.g., 8 × 8 tiles) and computes histograms for each region. To prevent over-enhancement in homogeneous areas, it imposes a clip limit on the histogram, redistributing excess pixel counts uniformly across all bins. The clipping mechanism ensures controlled contrast enhancement while preserving details in both bright and dark regions. Bilinear interpolation is applied to blend boundaries between regions, minimizing artifacts. Originally developed for medical imaging (e.g., MRI and portal films), CLAHE balances computational efficiency and simplicity, requiring only a single parameter (clip limit) to adjust contrast. The CLAHE processes images rapidly and supports both 8-bit and 16-bit pixel depths, making it versatile for low-contrast image enhancement without significant noise amplification.
POSHE is designed to address the high computational complexity and blocking artifacts of traditional local histogram equalization methods [38,46]. POSHE divides the image into partially overlapped sub-blocks and applies histogram equalization to each sub-block. By overlapping sub-blocks and integrating weighted histograms from neighboring sub-blocks using a low-pass filter, POSHE reduces abrupt transitions between sub-blocks, effectively mitigating blocking effects. Additionally, a Blocking Effect Reduction Filter (BERF) is applied to further smooth residual discontinuities at boundaries. Compared to fully overlapped block-based approaches, POSHE reduces computational overhead while maintaining comparable contrast enhancement. Its efficiency stems from balancing partial overlap and optimized step sizes, enabling real-time processing and hardware-friendly implementation. Therefore, POSHE is particularly suitable for applications like digital cameras and surveillance systems, where high-quality contrast enhancement and computational efficiency are critical.
The enhanced marine radar images by CLAHE and POSHE are shown in Figure 5. Without background clutter fitting subtraction, some typical non-oil spill dark areas (marked in the yellow rectangle in Figure 5a,b) are also enhanced by CLAHE and POSHE. The contrast between the oil spill area and the sea surface by CLAHE and POSHE is weak compared with the proposed enhancement workflow. The Contrast and E M E values computed in the red rectangular boxes in Figure 5 are tabulated in Table 4. The proposed multi-stage enhancement workflow achieves a contrast value of 84.55, demonstrating 35.82% and 24.01% performance improvements over CLAHE (66.25) and POSHE (68.18) methods, respectively. The E M E of the proposed multi-stage enhancement workflow is 127.82, which is 18.53% and 17.11% larger than CLAHE (107.84) and POSHE (109.14), respectively.

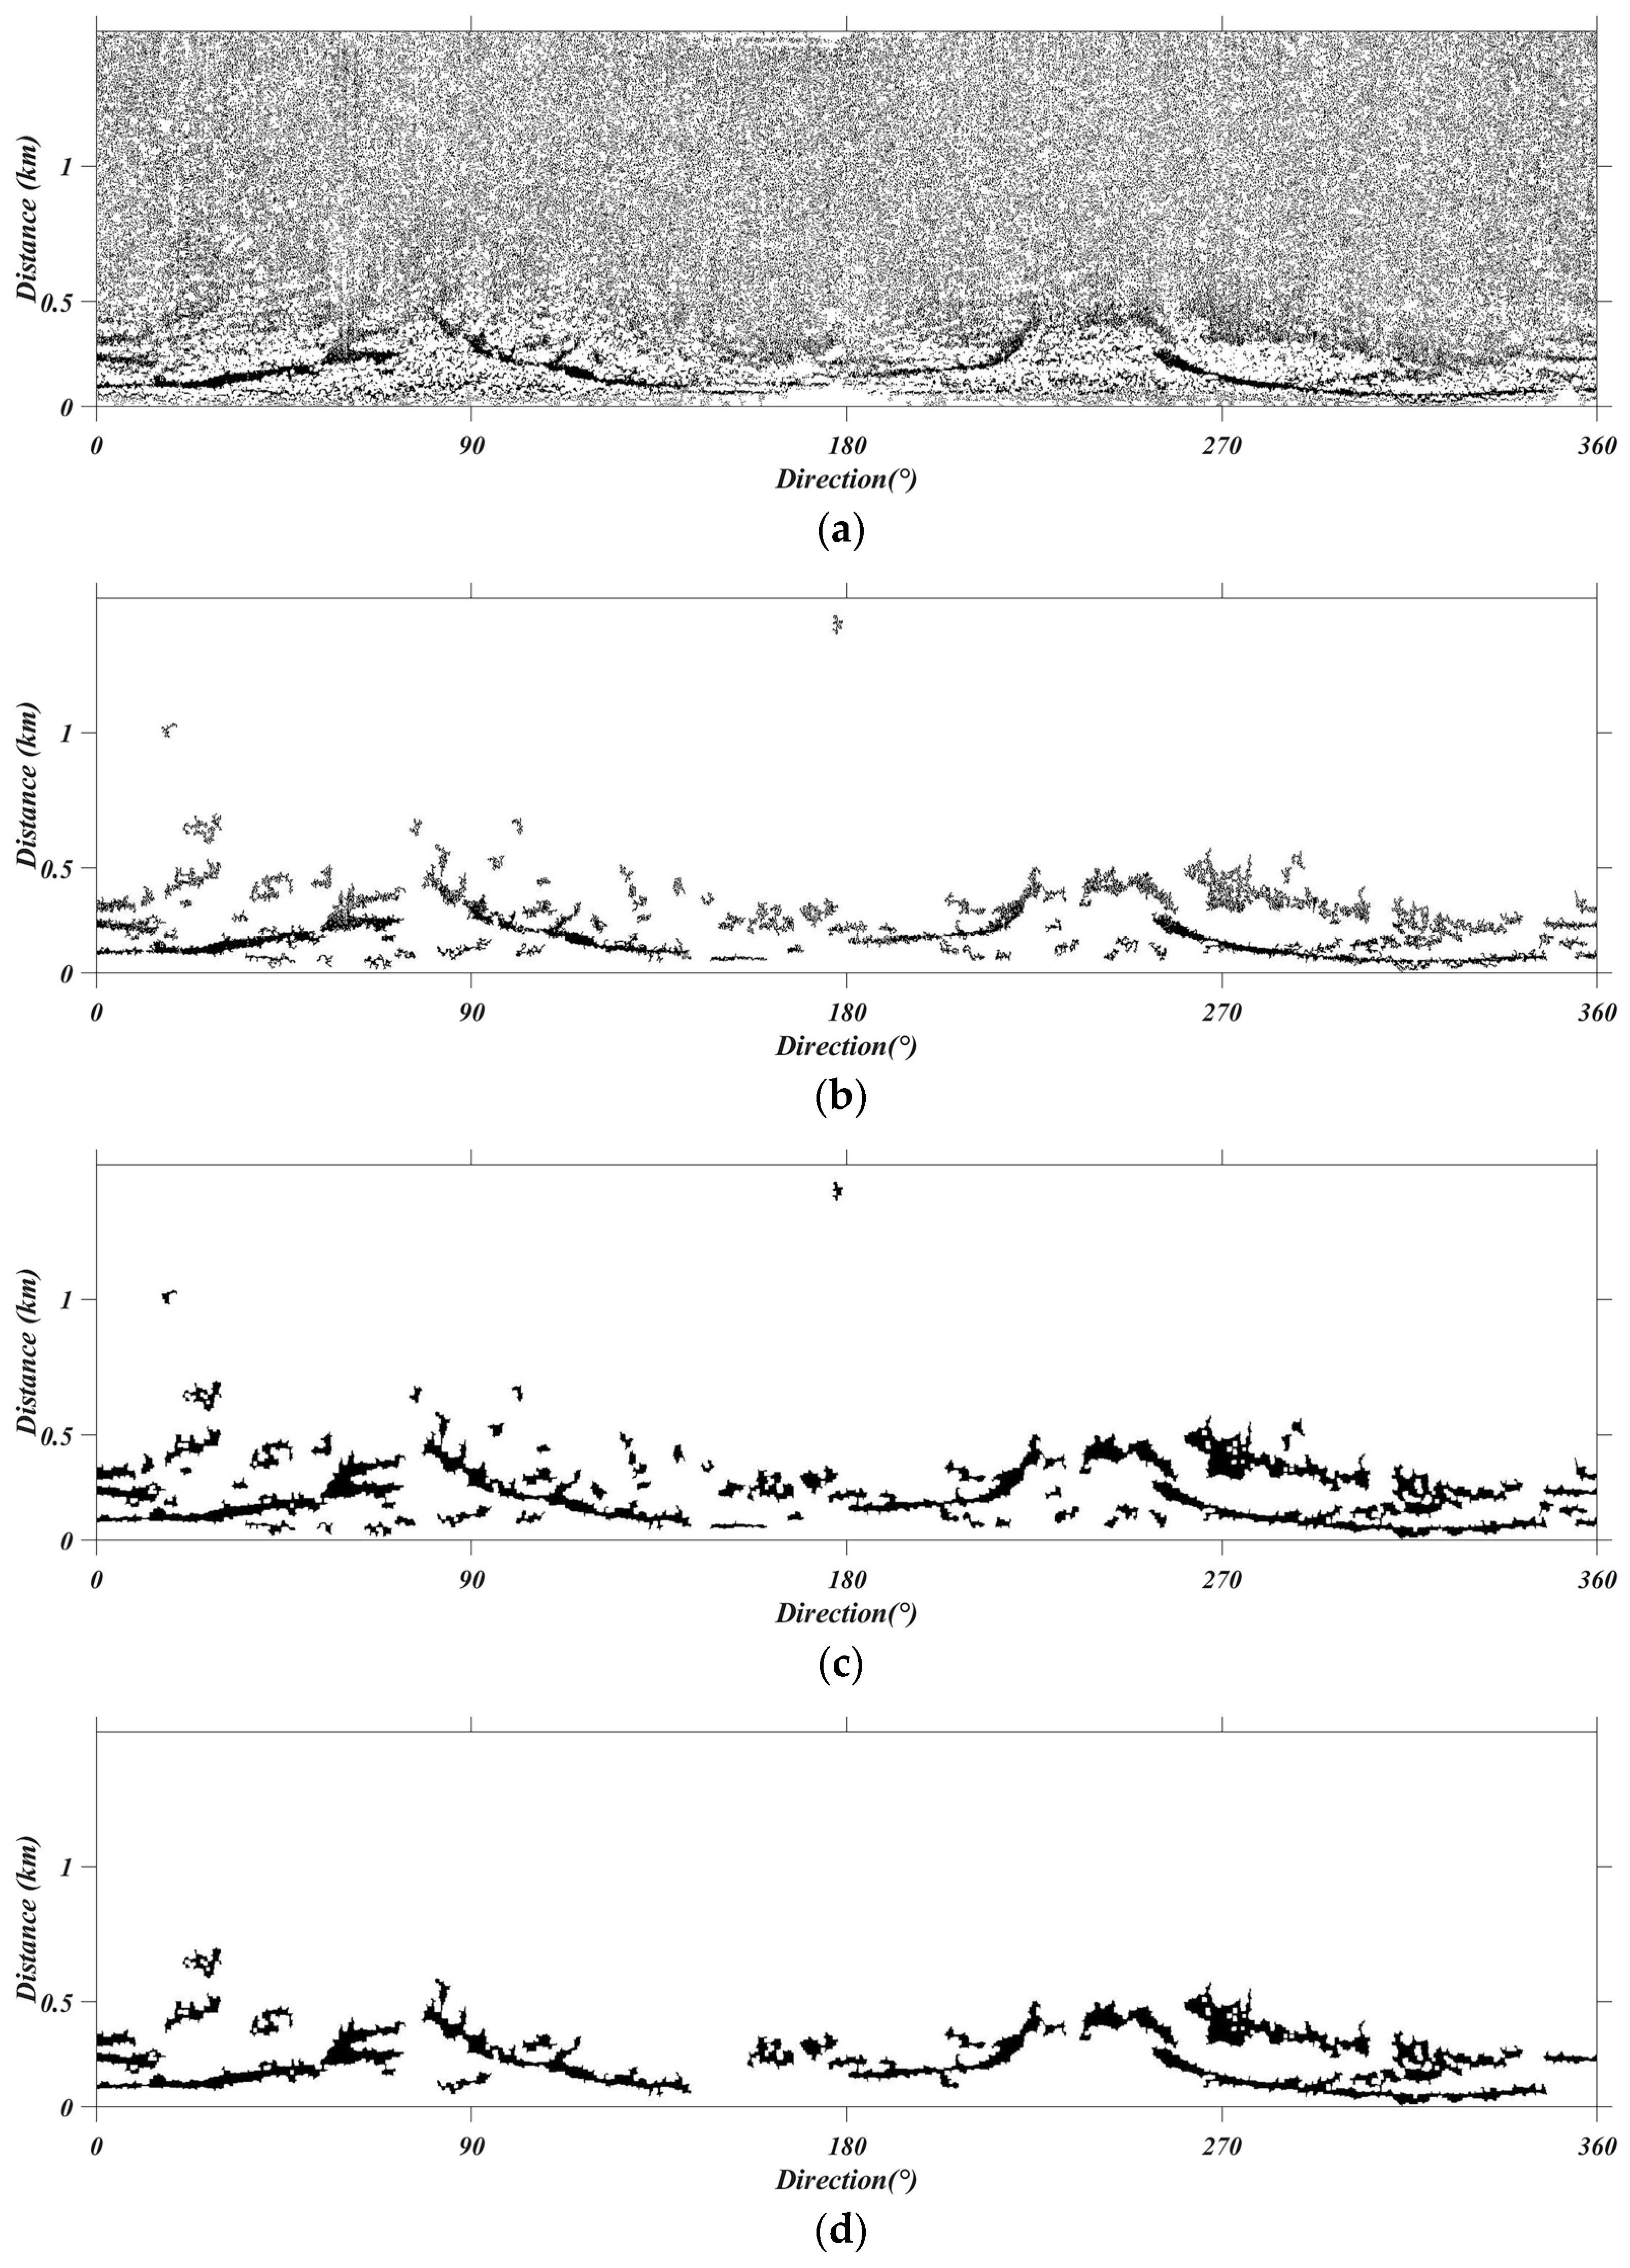
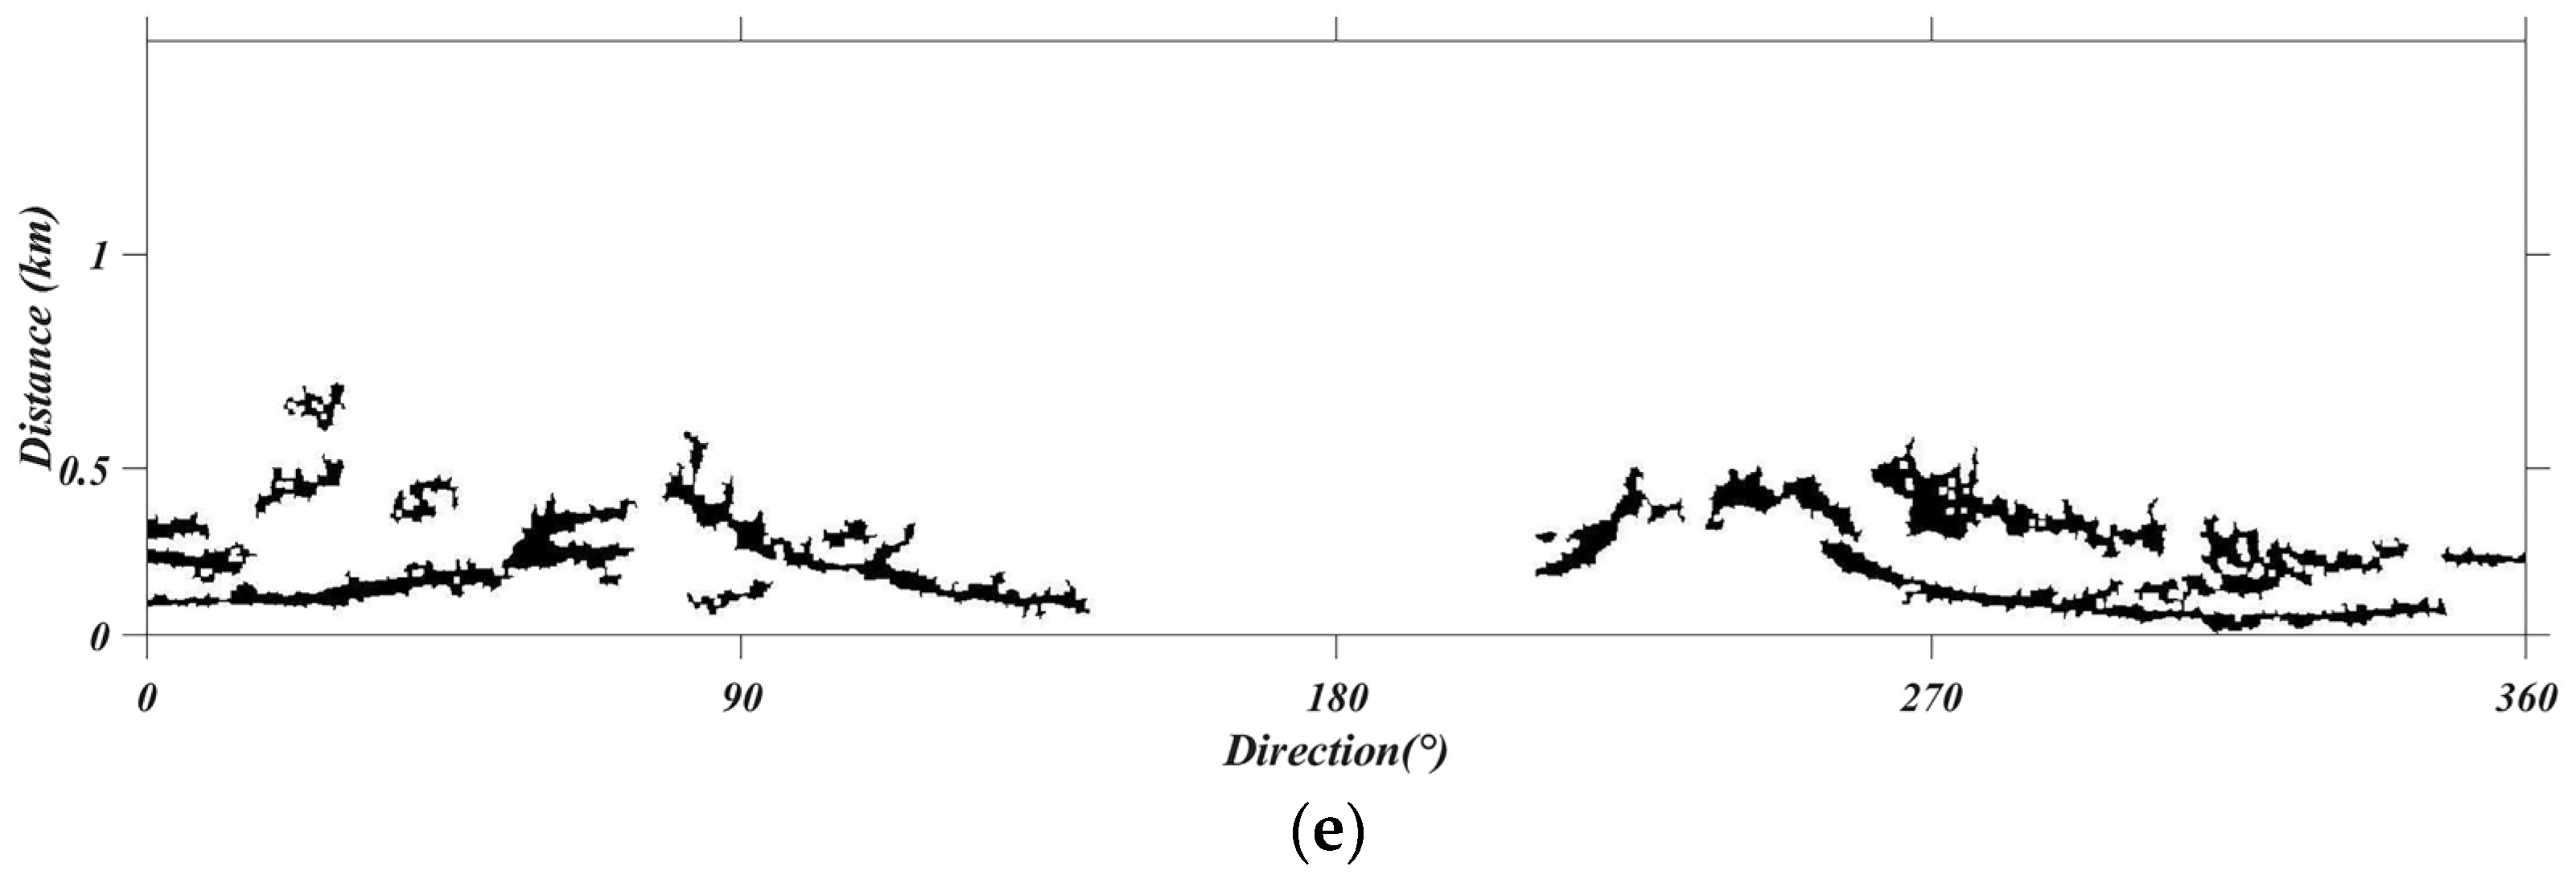
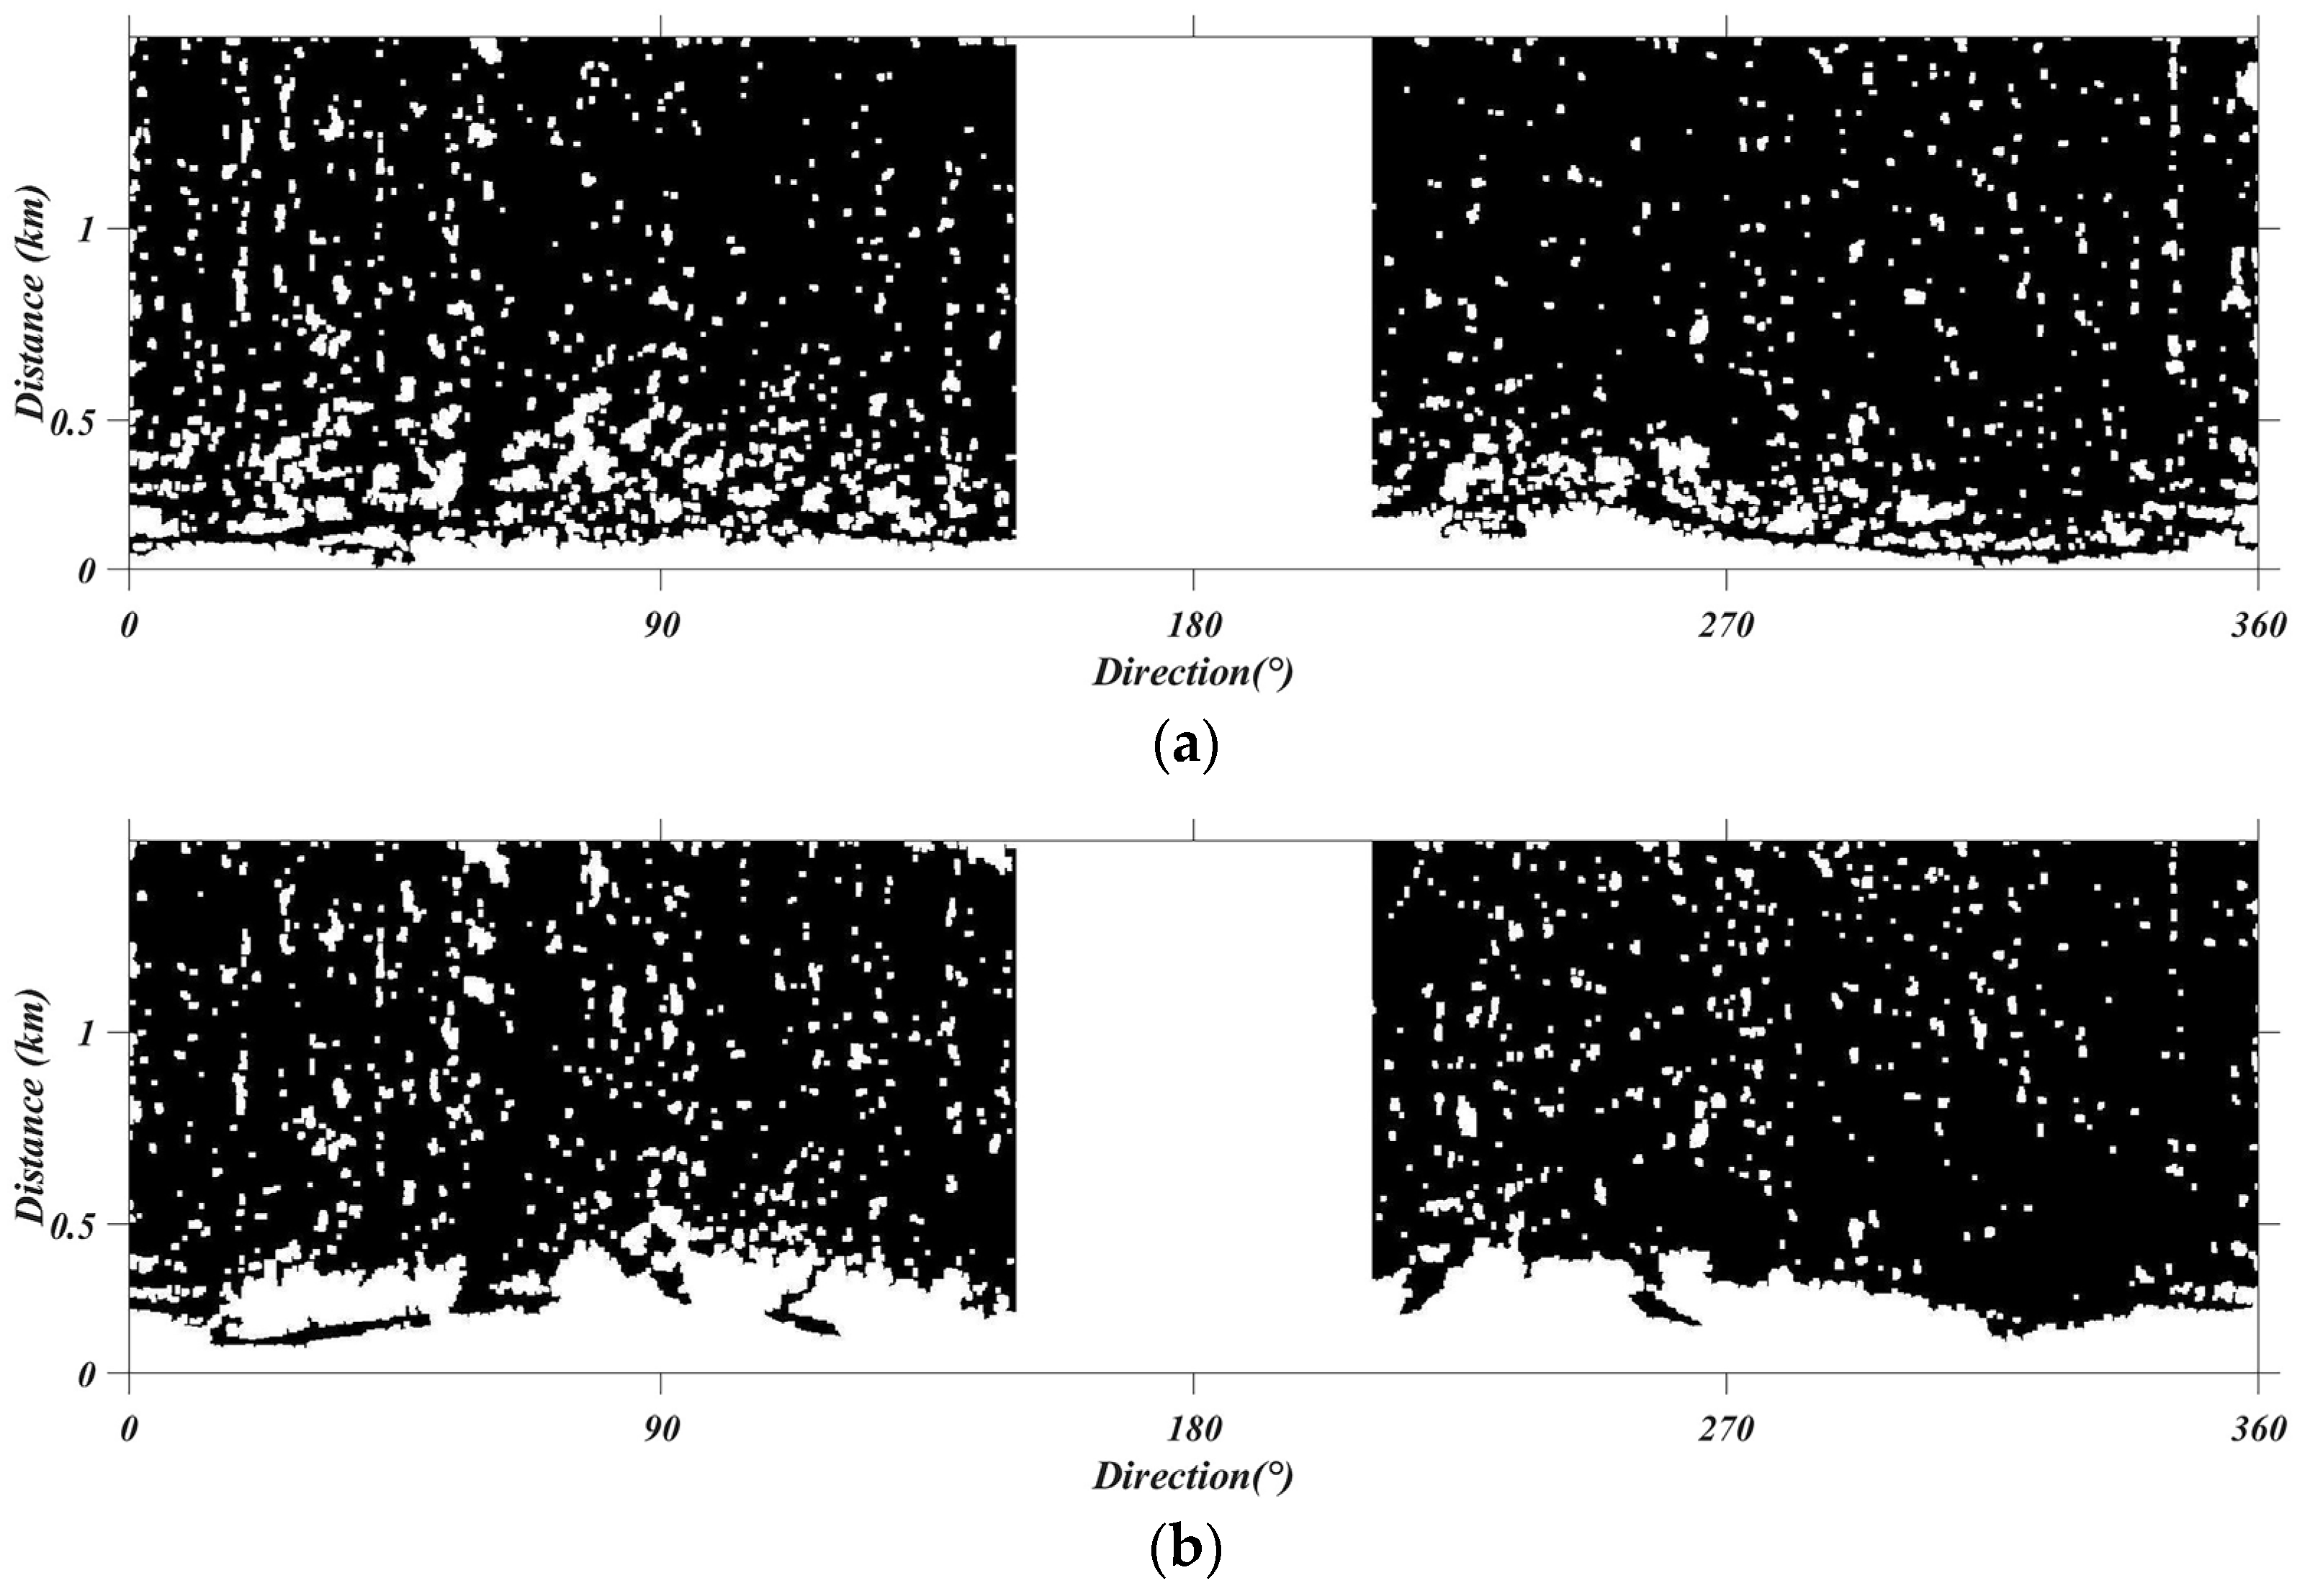
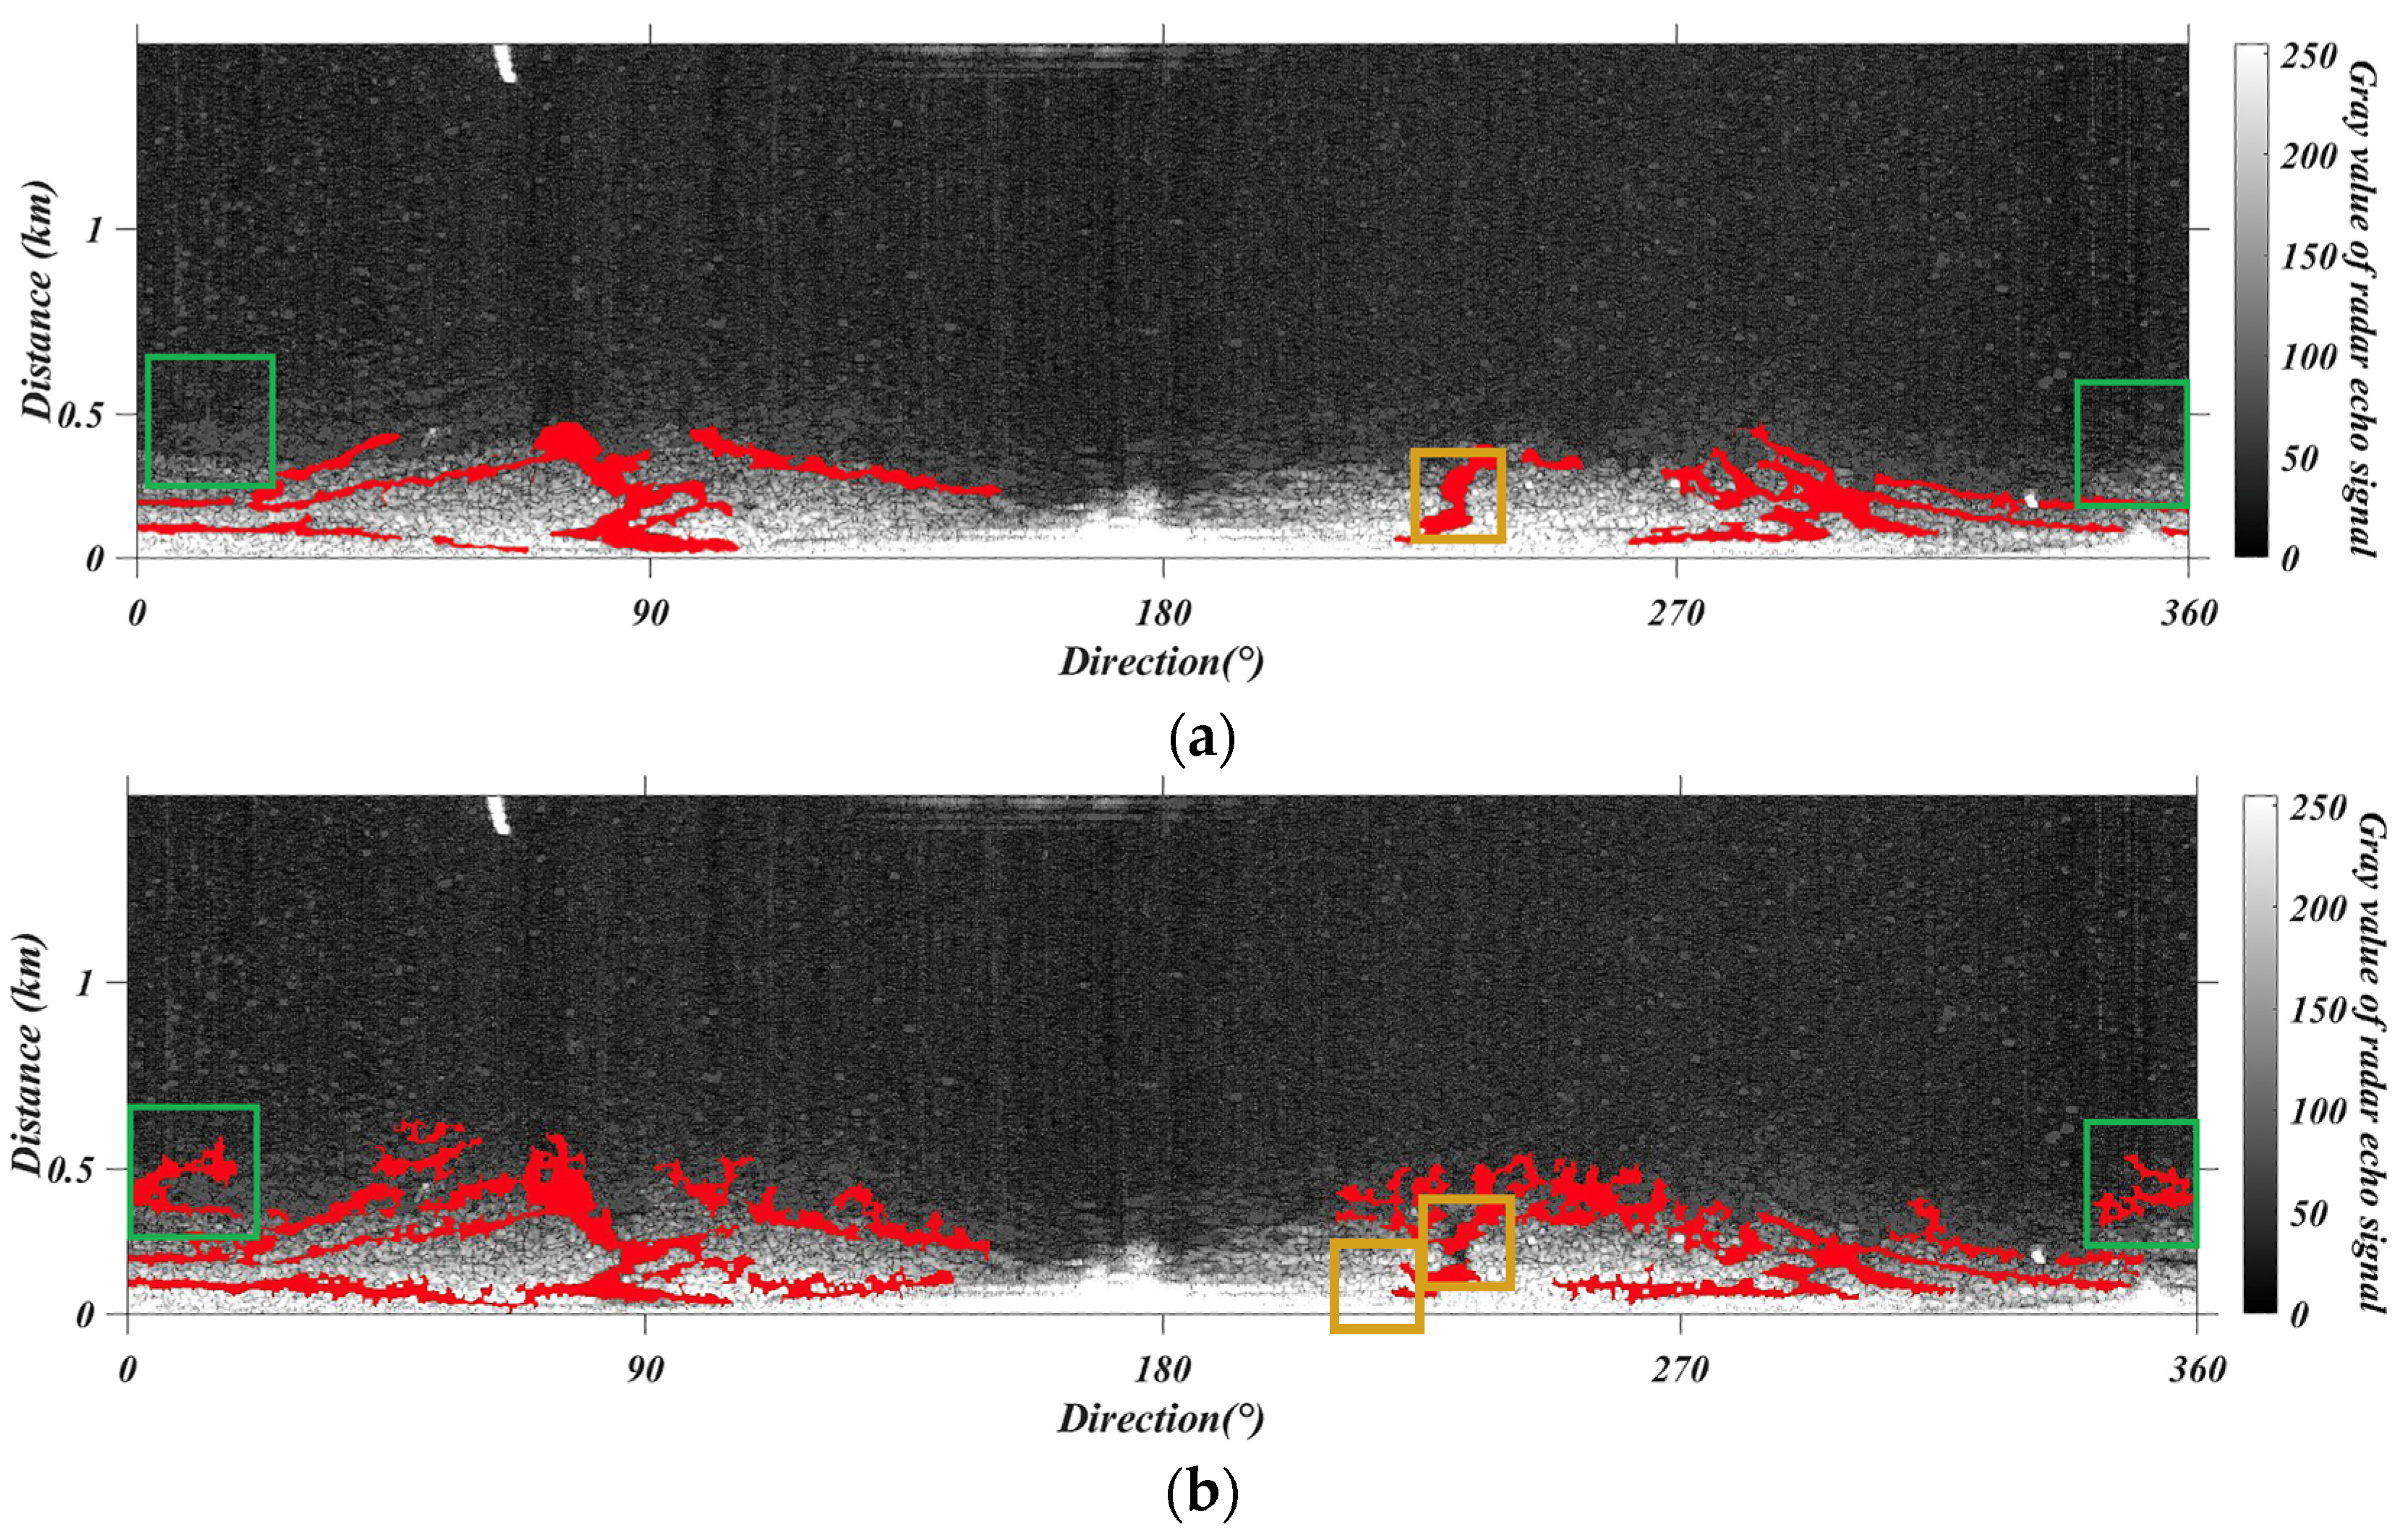
4.3. Image Segmentation

Oil spills were extracted on the enhanced imagery using the multi-stage enhancement workflow. Firstly, the Otsu method was used to segment oil spills preliminary, which is shown in Figure 6a. Then the connected-component analysis with the size of 80 was carried out for small-area filtration, as shown in Figure 6b. Thirdly, morphological operations of dilate and erode with the disk size of 3 were applied to fill the internal white space in the identified oil spill area, and the processed radar image is shown in Figure 6c. Fourthly, a connected-component analysis with the size of 500 was used to remove the detected small areas, because the distribution of oil spills usually appears as continuous tape areas, and the processed results are shown in Figure 6d. Finally, oil spill regions within the 150°–210° azimuth range were excluded due to vessel motion effects, and the final identification result is presented in Figure 6e.
Based on the segmentation method in Section 3.3, the oil spill detection results using the enhancement methods of CLAHE and POSHE are shown in Figure 7. CLAHE and POSHE misidentify the water surface far from the marine radar as oil spill areas. A comparison between Figure 6e and Figure 7 demonstrates that background removal effectively mitigates false recognition in distant dark regions of radar images. Consequently, the proposed multi-stage enhancement workflow reduces false recognition rates in distant areas.
Enhanced imagery underwent segmentation for oil spill detection, with comparative analysis against visual interpretation results conducted to validate enhancement efficacy. The visual interpretation of the marine radar image sampled at 21 July 2010, 23:20:00 is shown in Figure 8a, and the visual interpretation result marked on the original radar image is shown in Figure 8d. The oil spills of the marine radar imagery at 23:20:00 detected by the proposed multi-stage enhancement workflow are shown in Figure 8b, and the results marked on the original radar image are shown in Figure 8e. Compared with Figure 8a, Figure 8b provides more oil spill information, as exemplified by the green rectangular regions in Figure 8a,b, and the boundaries of the detected oil spills are clearer. Manifested in the original radar image, Figure 8e exists oil spills in the blue circle, but not in Figure 8d. In order to evaluate the correctness of the identified oil spills, the visual interpretation results of the marine radar imagery sampled at 23:20:12 are used for verification. The visual interpretation of the oil spill in the blue circle of Figure 8f is similar to the area of Figure 8e, which certifies that the proposed method could provide more accurate oil spill detection results.
To quantitatively evaluate the precision of the proposed method on Figure 8a,b, the Intersection over Union ( I o U ), P r e c i s i o n , R e c a l l , A c c u r a c y , and F 1 s c o r e of the recognition results were calculated using visual interpretation results, with their computational formulas defined as follows:
I o U = T P T P + F P + F N ,
P r e c i s i o n = T P T P + F P ,
R e c a l l = T P T P + F N ,
A c c u r a c y = T P + T N T P + F P + T N + F N ,
F 1 s c o r e = 2 P r e c i s i o n × R e c a l l P r e c i s i o n + R e c a l l ,
where T P denotes true positives, F P denotes false positives, F N denotes false negatives, and T N denotes true negatives. The computational results of these metrics are presented in Table 5.
Analysis of Table 5 reveals notably low values for I o U , P r e c i s i o n , and F 1 s c o r e . The diminished I o U and P r e c i s i o n stem from the proposed method extracting more extensive oil spill areas than visual interpretation, resulting in elevated F P . The F 1 s c o r e is attributable to low P r e c i s i o n . Conversely, both R e c a l l and A c c u r a c y exhibit high values, as the identified oil spill areas almost fully encompass those delineated by visual interpretation.
However, it is noteworthy that within the brown-rectangle-marked regions of Figure 8a,b, certain visually discernible oil spills were not successfully identified by the proposed methodology. This phenomenon is hypothesized to stem from insufficient precision in the background fitting model during the processing stage. Implementation of higher-precision background fitting models could potentially mitigate such occurrences.

5. Conclusions

To address the limited usable areas in oil spill detection using marine radar imagery, this study proposes an image enhancement method based on the characteristic of the marine radar images. The proposed multi-stage enhancement workflow consisted of background clutter fitting subtraction, contrast enhancement via MSR, and grayscale distribution optimization using Gamma correction. The proposed method obviously increases the contrast between oil spills and the water surface compared with CLAHE and POSHE, and the Contrast and E M E value quantitatively certifies the effectiveness. Based on the visual interpretation, the proposed method expands detectable areas and enhances radar image utilization. The proposed multi-stage enhancement method exhibits notable effectiveness in processing gradually dimming areas in the marine radar imagery, with performance stability independent of variations in radar detection range. However, this study implemented oil spill extraction under prior-known spill conditions supplemented by infrared detection systems. Under scenarios lacking pre-existing spill intelligence, integration of other information sources becomes imperative for validating dark anomalies as genuine oil spill manifestations. Meanwhile, the proposed method does not extend oil spill detection coverage to the full spatial domain of the radar imagery. Future research should be carried out to expand detectable coverage while enhancing the method’s accuracy and operational validity. Meanwhile, given the scarcity of relevant data, this study mainly focuses on the actual oil spill incident detailed in the Study Area and Data Sets section. Future work will continue prioritizing this issue.

Author Contributions

Conceptualization, P.L. and X.Z. (Xingquan Zhao); methodology, P.L., X.Z. (Xingquan Zhao), P.S. and X.W.; software, X.Z. (Xingquan Zhao), P.S., X.W. and P.L.; validation, P.C., X.Z. (Xueyuan Zhu) and J.X.; formal analysis, Y.L. and B.L.; investigation, Y.L., B.L., P.C., X.Z. (Xueyuan Zhu) and J.X.; resources, Y.L.; data curation, P.L.; writing—original draft preparation, X.Z. (Xingquan Zhao); writing—review and editing, B.L.; visualization, X.Z. (Xingquan Zhao); supervision, P.L. and B.L.; project administration, P.L.; funding acquisition, P.L. All authors have read and agreed to the published version of the manuscript.

Funding

This research was funded by National Natural Science Foundation of China, grant number 52271359; Fundamental Research Funds for the Central Universities, grant number 3132025141.

Institutional Review Board Statement

Not applicable.

Informed Consent Statement

Not applicable.

Data Availability Statement

Data available on request from the authors.

Conflicts of Interest

The authors declare no conflicts of interest.

References

  1. Alves, T.M.; Kokinou, E.; Zodiatis, G.; Radhakrishnan, H.; Panagiotakis, C.; Lardner, R. Multidisciplinary Oil Spill Modeling to Protect Coastal Communities and the Environment of the Eastern Mediterranean Sea. Sci. Rep. 2016, 6, 36882. [Google Scholar] [CrossRef] [PubMed]
  2. Lardner, R.; Zodiatis, G. Modelling Oil Plumes from Subsurface Spills. Mar. Pollut. Bull. 2017, 124, 94–101. [Google Scholar] [CrossRef] [PubMed]
  3. Jiang, H.; Lan, P.; Zhao, K.; Yu, L.; Zhou, L.; Wang, Y.; Deng, C. Biomimetic Modification of Sponges with Alkyl-Silica Hybrid Nanowires for Efficient Oil-Water Separation Applications. Surf. Interfaces 2025, 69, 106766. [Google Scholar] [CrossRef]
  4. Patil, S.; Desai, P.; Lavate, S.; Patil, S.; Patil, S. Innovative Oil Skimmer Machine for Liquid Contaminant Removal: An Environmental Friendly Approach. Reg. Stud. Mar. Sci. 2025, 86, 104184. [Google Scholar] [CrossRef]
  5. Si, J.; Miao, Z.; Wang, B.; Zheng, Z.; Yuan, Z.; Wang, Q.; Qiu, S.; Zeng, S.; Liu, X.; Cui, Z. Super-Elastic Compressible Chitosan/Chlorella Pyrenoidosa-Graphene Biomass Aerogel with Accordion-like Structure for All-Weather and High-Efficiency Cleanup of Crude Oil Spills. Sep. Purif. Technol. 2025, 367, 132887. [Google Scholar] [CrossRef]
  6. Zhu, J.; Zhu, M.; Li, J.; Liu, X.; Wang, Y.; Chen, X.; Liu, L.; Song, P. Superhydrophobic Fire-Extinguishing Polyurethane Foam for Solar-Assisted High-Efficiency Recovery of Viscous Crude Oil Spill. Sep. Purif. Technol. 2025, 364, 132531. [Google Scholar] [CrossRef]
  7. Ji, H.; Zhang, X.; Wang, T.; Yang, K.; Jiang, J.; Xing, Z. Oil Spill Area Prediction Model of Submarine Pipeline Based on BP Neural Network and Convolutional Neural Network. Process Saf. Environ. Protect. 2025, 199, 107264. [Google Scholar] [CrossRef]
  8. Almeida, R. The Effects of Oil Spills on Marine Life and Coastal Communities. Int. J. Geogr. Geol. Environ. 2023, 5, 263–265. [Google Scholar] [CrossRef]
  9. Li, P.; Cai, Q.; Lin, W.; Chen, B.; Zhang, B. Offshore Oil Spill Response Practices and Emerging Challenges. Mar. Pollut. Bull. 2016, 110, 6–27. [Google Scholar] [CrossRef]
  10. Bui, N.A.; Oh, Y.; Lee, I. Oil Spill Detection and Classification through Deep Learning and Tailored Data Augmentation. Int. J. Appl. Earth Obs. Geoinf 2024, 129, 103845. [Google Scholar] [CrossRef]
  11. Nost, E.; Egset, C. Oil Spill Detection System-Results from Field Trials. In Proceedings of the OCEANS 2006, Boston, MA, USA, 18–22 September 2006. [Google Scholar]
  12. Gangeskar, R. Automatic Oil-Spill Detection by Marine X-Band Radars-New System Based on Capturing and Processing Digitized Radar Images: Ready for Extensive Tests in October. Sea Technol. 2004, 45, 40–45. [Google Scholar]
  13. Atanassov, V.; Mladenov, L.; Rangelov, R.; Savchenko, A. Observation of Oil Slicks on the Sea Surface by Using Marine Navigation Radar. In Proceedings of the IGARSS’91 Remote Sensing: Global Monitoring for Earth Management, Espoo, Finland, 3–6 June 1991. [Google Scholar]
  14. Liu, P.; Li, Y.; Xu, J.; Zhu, X. Adaptive Enhancement of X-Band Marine Radar Imagery to Detect Oil Spill Segments. Sensors 2017, 17, 2349. [Google Scholar] [CrossRef]
  15. Xu, J.; Cheng, M.; Li, B.; Chu, L.; Dong, H.; Yang, Y.; Qian, S.; Huang, Y.; Yuan, J. Oil Slick Identification in Marine Radar Image Using HOG, Random Forest, and PSO. IEEE Geosci. Remote Sens. Lett. 2024, 21, 1504305. [Google Scholar] [CrossRef]
  16. Fan, J.; Zhang, F.; Zhao, D.; Wang, J. Oil Spill Monitoring Based on SAR Remote Sensing Imagery. Aquat. Procedia 2015, 3, 112–118. [Google Scholar] [CrossRef]
  17. Li, B.; Xu, J.; Pan, X.; Chen, R.; Ma, L.; Yin, J.; Liao, Z.; Chu, L.; Zhao, Z.; Lian, J.; et al. Preliminary Investigation on Marine Radar Oil Spill Monitoring Method Using YOLO Model. JMSE 2023, 11, 670. [Google Scholar] [CrossRef]
  18. Chen, P.; Zhou, H.; Li, Y.; Liu, B.; Liu, P. Oil Spill Identification in Radar Images Using a Soft Attention Segmentation Model. Remote Sens. 2022, 14, 2180. [Google Scholar] [CrossRef]
  19. Zuiderveld, K. Contrast Limited Adaptive Histogram Equalization. In Graphics Gems; Elsevier: Amsterdam, The Netherlands, 1994; Volume 8, pp. 474–485. [Google Scholar]
  20. Wang, Q.; Ward, R. Fast Image/Video Contrast Enhancement Based on Weighted Thresholded Histogram Equalization. IEEE Trans. Consumer Electron. 2007, 53, 757–764. [Google Scholar] [CrossRef]
  21. Bhandari, A.K.; Maurya, S.; Meena, A.K. MFO-Based Thresholded and Weighted Histogram Scheme for Brightness Preserving Image Enhancement. IET Image Process. 2019, 13, 896–909. [Google Scholar] [CrossRef]
  22. Provenzi, E.; Fierro, M.; Rizzi, A.; De Carli, L.; Gadia, D.; Marini, D. Random Spray Retinex: A New Retinex Implementation to Investigate the Local Properties of the Model. IEEE Trans. Image Process. 2007, 16, 162–171. [Google Scholar] [CrossRef]
  23. Bae, H.; Lee, S.-H. Multi-Scale Random Sprays Retinex Based on Edge-Adaptive Surround Integration. JKITS 2020, 18, 93–105. [Google Scholar] [CrossRef]
  24. Fu, X.; Zeng, D.; Huang, Y.; Zhang, X.-P.; Ding, X. A Weighted Variational Model for Simultaneous Reflectance and Illumi-nation Estimation. In Proceedings of the 2016 IEEE Conference on Computer Vision and Pattern Recognition (CVPR), Las Vegas, NV, USA, 27–30 June 2016; pp. 2782–2790. [Google Scholar]
  25. Ranganath, H.S.; Kuntimad, G.; Johnson, J.L. Pulse Coupled Neural Networks for Image Processing. In Proceedings of the IEEE Southeastcon ’95. Visualize the Future, Raleigh, NC, USA, 26–29 March 1995; pp. 37–43. [Google Scholar]
  26. Koteswara Rao, K.; Veera Swamy, K. Multimodal Medical Image Fusion Using the MBM-PCNN Model. IETE J. Res. 2025. [Google Scholar] [CrossRef]
  27. Xu, J.; Huang, Y.; Dong, H.; Chu, L.; Yang, Y.; Li, Z.; Qian, S.; Cheng, M.; Li, B.; Liu, P.; et al. Marine Radar Oil Spill Detection Method Based on YOLOv8 and SA_PSO. JMSE 2024, 12, 1005. [Google Scholar] [CrossRef]
  28. Lau, T.-K.; Huang, K.-H. A Timely and Accurate Approach to Nearshore Oil Spill Monitoring Using Deep Learning and GIS. Sci. Total Environ 2024, 912, 169500. [Google Scholar] [CrossRef]
  29. Kundu, A.; Mitra, S.; Vaidyanathan, P. Application of Two-Dimensional Generalized Mean Filtering for Removal of Impulse Noises from Images. IEEE Trans. Acoust. Speech Signal Process. 1984, 32, 600–609. [Google Scholar] [CrossRef]
  30. Liu, P.; Liu, B.; Li, Y.; Chen, P.; Xu, J. Oil Spill Detection on X-Band Marine Radar Images Based on Sea Clutter Fitting Model. Heliyon 2023, 9, e20893. [Google Scholar] [CrossRef]
  31. Roth, S.; Black, M.J. Fields of Experts. Int. J. Comput. Vis. 2009, 82, 205–229. [Google Scholar] [CrossRef]
  32. Vamos¸, C.; Cr˘aciun, M. Automatic Trend Estimation; SpringerBriefs in Physics; Springer: Dordrecht, The Netherlands, 2013; ISBN 978-94-007-4824-8. [Google Scholar]
  33. Land, E.H.; McCann, J.J. Lightness and Retinex Theory. J. Opt. Soc. Am. 1971, 61, 1–11. [Google Scholar] [CrossRef] [PubMed]
  34. Rahman, Z.; Jobson, D.J.; Woodell, G.A. Multi-Scale Retinex for Color Image Enhancement. In Proceedings of the 3rd IEEE International Conference on Image Processing, Lausanne, Switzerland, 19 September 1996; IEEE: Lausanne, Switzerland, 1996; Volume 3, pp. 1003–1006. [Google Scholar]
  35. Land, E.H. The Retinex Theory of Color Vision. Sci. Am. 1977, 237, 108–128. [Google Scholar] [CrossRef]
  36. Jobson, D.J.; Rahman, Z.; Woodell, G.A. A Multiscale Retinex for Bridging the Gap between Color Images and the Human Observation of Scenes. IEEE Trans. Image Process. 1997, 6, 965–976. [Google Scholar] [CrossRef]
  37. Jingchun, Z.; Su, G.E.; Sunar, M.S. Low-Light Image Enhancement: A Comprehensive Review on Methods, Datasets and Evaluation Metrics. J. King Saud Univ. Comput. Inf. Sci. 2024, 36, 102234. [Google Scholar] [CrossRef]
  38. Qi, Y.; Yang, Z.; Sun, W.; Lou, M.; Lian, J.; Zhao, W.; Deng, X.; Ma, Y. A Comprehensive Overview of Image Enhancement Techniques. Arch. Computat. Methods Eng. 2022, 29, 583–607. [Google Scholar] [CrossRef]
  39. Acharya, A.; Giri, A.V. Contrast Improvement Using Local Gamma Correction. In Proceedings of the 2020 6th International Conference on Advanced Computing and Communication Systems (ICACCS), Coimbatore, India, 6–7 March 2020; pp. 110–114. [Google Scholar]
  40. Otsu, N. A Threshold Selection Method from Gray-Level Histograms. IEEE Trans. Syst. Man Cybern. 1979, 9, 62–66. [Google Scholar] [CrossRef]
  41. Huang, C.; Li, X.; Wen, Y. AN OTSU Image Segmentation Based on Fruitfly Optimization Algorithm. Alex. Eng. J. 2021, 60, 183–188. [Google Scholar] [CrossRef]
  42. Haralick, R.M.; Sternberg, S.R.; Zhuang, X. Image Analysis Using Mathematical Morphology. IEEE Trans. Pattern Anal. Mach. Intell. 1987, PAMI-9, 532–550. [Google Scholar] [CrossRef]
  43. Aggarwal, G.; Agarwal, V. A Survey Paper on: Fuzzy Mathematical Morphology Techniques for Digital Image Processing. Adv. Mater. 2012, 403–408, 3469–3475. [Google Scholar] [CrossRef]
  44. Ahmad, M.; Butt, M.H.F.; Khan, A.M.; Mazzara, M.; Distefano, S.; Usama, M.; Roy, S.K.; Chanussot, J.; Hong, D. Spatial–Spectral Morphological Mamba for Hyperspectral Image Classification. IJON 2025, 636, 129995. [Google Scholar] [CrossRef]
  45. Agaian, S.S.; Lentz, K.P.; Grigoryan, A.M. A New Measure of Image Enhancement. In Proceedings of the IASTED International Conference on Signal Processing & Communication, Marbella, Spain, 19–22 September 2000. [Google Scholar]
  46. Kim, J.Y.; Kim, L.S.; Hwang, S.H. An Advanced Contrast Enhancement Using Partially Overlapped Sub-Block Histogram Equalization. T-CSVT 2000, 4, 537–540. [Google Scholar]
Figure 1. Examples of data sets sampled by marine radar and thermal infrared sensor. (a) Navigation route of ship “YUKUN” on 21 July 2010; (b) sampled marine radar image at 23:19:45; (c) thermal infrared sensor used in this study; (d) an image captured by thermal infrared sensor.
Oceans 06 00039 g001
Figure 2. Flowchart of oil spill detection using the multi-stage image enhancement.
Oceans 06 00039 g002
Figure 3. Pre-processed radar images: (a) coordinate transformed radar image; (b) denoised radar Image. The red rectangular region is used for quantitative analysis.
Oceans 06 00039 g003
Figure 4. Enhancement of marine radar image: (a) background-removed; (b) background-removed + MSR enhancement; (c) background-removed + MSR enhancement + Gamma correction. The red rectangular regions are used for quantitative analysis.
Oceans 06 00039 g004
Figure 5. Comparative enhancement results of maritime radar imagery: (a) CLAHE; (b) POSHE. The red rectangular regions are used for quantitative analysis, and the yellow rectangular regions are used for visual comparison.
Oceans 06 00039 g005
Figure 6. The processing of oil spill segmentation. (a) Segmentation using Otsu Method on Figure 4c; (b) connected-component analysis with the size of 80; (c) morphological operations of dilate and erode with the disk size of 3; (d) connected-component analysis with the size of 500; (e) ship wake interference removement.
Oceans 06 00039 g006aOceans 06 00039 g006b
Figure 7. Oil spill detection results using the enhancement methods of CLAHE and POSHE. (a) Oil spill detection using CLAHE based on Figure 5a; (b) oil spill detection using POSHE based on Figure 5b.
Oceans 06 00039 g007
Figure 8. Oil spill detection results: (a) visual interpretation of oil spills on the radar imagery sampled at 2010-07-21 23:20:00 UTC; (b) oil spills detected by the proposed multi-stage enhancement workflow on the radar imagery sampled at 2010-07-21 23:20:00 UTC; (c) visual interpretation of oil spills on the radar imagery sampled at 2010-07-21 23:20:12 UTC; (d) oil spills detected on (a) marked on the original radar imagery; (e) oil spills detected on (b) marked on the original radar imagery; (f) oil spills detected on (c) marked on the original radar imagery. The green rectangular regions, yellow rectangular regions, and blue circle regions are used for visual comparison.
Oceans 06 00039 g008aOceans 06 00039 g008b
Table 1. Main parameters of the X-band marine radar (Model: Sperry Marine Vision Master FT).
NameParameters
Working frequency9.41 GHz
Antenna length8 ft
PolarizationHorizontal
Detection range0.5–12 nautical miles
Horizontal direction360°
Angular Resolution0.1°
Vertical direction±10°
Peak power25 kW
Pulse width50 ns/250 ns/750 ns
Pulse repetition frequency3000 Hz/1800 Hz/785 Hz
Blind zone0.06 nautical mile
Table 2. Implementation parameters optimized for maritime radar imagery enhancement.
Background FittingMSRGamma Correction
M = 3 σ 1 = 64 γ = 0.5
σ 2 = 128 σ 3 = 256 L 1,2 , 3 = 1 3
Table 3. Progressive-stage contrast and E M E quantification for maritime radar imagery processed through the multi-stage enhancement workflow and evaluated in the ablation study.
MethodContrast E M E
Pre-processed radar image67.3954.54
Background-removed image25.835.55
Background-removed + MSR63.4756.14
Background-removed + Gamma correction24.853.53
Proposed multi-stage enhancement workflow84.55127.82
Table 4. Contrast and E M E of the proposed multi-stage enhancement workflow, CLAHE, and POSHE.
MethodCLAHEPOSHEProposed Multi-Stage Enhancement Workflow
Contrast66.2568.1884.55
E M E 107.84109.14127.82
Table 5. Calculated quantitative detection performance metrics.
Detection Performance MetricsValues
I o U 0.31
P r e c i s i o n 0.33
R e c a l l 0.85
A c c u r a c y 0.95
F 1 s c o r e 0.47
Disclaimer/Publisher’s Note: The statements, opinions and data contained in all publications are solely those of the individual author(s) and contributor(s) and not of MDPI and/or the editor(s). MDPI and/or the editor(s) disclaim responsibility for any injury to people or property resulting from any ideas, methods, instructions or products referred to in the content.

