Abstract
Submarine groundwater discharge (SGD) is a recognized contributor to the hydrological and biogeochemical functioning of coral reef ecosystems located along coastlines. However, the distribution, size, and thermal properties of SGD remain poorly understood at most land–reef margins. We developed, deployed, and demonstrated an operational method for airborne detection and mapping of SGD using the 200 km coastline of western Hawai‘i Island as a testing and analysis environment. Airborne high spatial resolution (1 m) thermal imaging produced relative sea surface temperature (SST) maps that aligned geospatially with boat-based transects of SGD presence–absence. Boat-based SST anomaly measurements were highly correlated with airborne SST anomaly measurements (R2 = 0.85; RMSE = 0.04 °C). Resulting maps of the relative difference in SST inside and outside of SGD plumes, called delta-SST, revealed 749 SGD plumes in 200 km of coastline, with nearly half of the SGD plumes smaller than 0.1 ha in size. Only 9% of SGD plumes were ≥1 ha in size, and just 1% were larger than 10 ha. Our findings indicate that small SGD is omnipresent in the nearshore environment. Furthermore, we found that the infrequent, large SGD plumes (>10 ha) displayed the weakest delta-SST values, suggesting that large discharge plumes are not likely to provide cooling refugia to warming coral reefs. Our operational approach can be applied frequently over time to generate SGD information relative to terrestrial substrate, topography, and pollutants. This operational approach will yield new insights into the role that land-to-reef interactions have on the composition and condition of coral reefs along coastlines.
Keywords:
coral reef; Hawai‘i; coastal hydrology; reef pollution; thermal imaging; water temperature 1. Introduction
Coral reefs are assembled via a complex mosaic of physical, biological, and hydrological interactions that challenges our ability to quantify and understand them at large spatial and ecological scales [1,2]. Unraveling processes that structure and organize coral reefs has thus long been recognized as foundational from scientific, conservation, and management perspectives [3,4,5]. From a hydrologic standpoint, much interest has focused on the role of ocean circulation, including upwelling, tides, currents, and numerous related factors that move seawater throughout coral reef ecosystems [6,7]. Additional focus has been placed on surface freshwater export from land, such as via rivers and streams, and how it affects the composition of coral reefs [8]. Submarine groundwater discharge (SGD), defined here as the flow of freshwater from below the land surface into adjacent ocean waters, has also gained increasing attention due to its potential effects on coral conditions and reef-scale processes [9,10,11]. SGD may flow into and even percolate up from below coral reefs. We estimate a potential for SGD to impact up to 530,000 km of coastal coral reefs worldwide (http://allencoralatlas.org; accessed 10 May 2024).
Corals, as foundational reef-building organisms on tropical and subtropical reefs, may be affected by SGD in a variety of important ways. Freshwater seeping from land into reefs can stress corals via anomalously low temperature and low salinity conditions [12]. On the other hand, SGD may protect some corals from periodic marine heatwaves that otherwise raise ambient water temperatures and drive coral bleaching [13]. SGD may deliver essential nutrients from land to reef [14,15]. However, land-based pollutants, including human and animal wastewater, agro-chemicals, and petrochemicals, may contaminate groundwater, subsequently discharging into reefs via SGD, causing coral stress, disease, and mortality [9].
Experienced swimmers and divers are familiar with the presence of SGD, felt as sudden, localized decreases in water temperature. However, less understood aspects of SGD include their geographic extent, persistence, and controls and, therefore, their broad role in coral reef ecosystem functioning. Mapping and monitoring of SGD is challenging, but progress has been made, largely via thermal remote sensing, which detects surface emissivity and, thus, temperature differentials between ambient seawater and cooler freshwater SGD plumes [16]. Thermal remote sensing only works in the top few millimeters of the water column, so SGD detection using this method is limited to the subset of plumes that discharge near sea level. Nonetheless, such SGD plumes are also likely indicative of the porosity and prevalence of discharge from deeper water depths in the adjacent reef system [17].
Among tropical and sub-tropical coral reefs, Hawai‘i is known for several previous SGD studies, and for good reason [10,18,19]. A stationary mid-Pacific volcanic hotspot sits under a moving Pacific plate, resulting in an archipelago of islands with basalt-derived substrates ranging in age from a few years to millions of years old [20]. Many of the younger substrates are highly porous and are comprised of fractured rock featuring preferential pathways for groundwater movement to shoreline areas. Despite this understanding, there has never been a study of SGD across the Hawaiian Archipelago, and routine monitoring of SGD is currently not possible. To date, most studies of Hawaiian SGD have relied on thermal remote sensing using moderate resolution (30 m) satellite data or localized airborne approaches [10,19,21]. Satellite-based studies are valuable for the detection of very large (i.e., >5 ha) SGD plumes that may influence synoptic-scale reef processes, similar in scale to studies of nearshore currents or zones of upwelling [22]. However, corals are often arranged in variable and highly localized patterns that render broad-brush thermal mapping insufficient for desired studies of coral–groundwater interactions. There are few exceptions to satellite-based thermal mapping of SGD, and an excellent example was provided by Johnson [23], who used airborne thermal remote sensing to map SGD plumes along a segment of the western leeward side of Hawai‘i Island. In that study, the thermal data were collected at 1.3 m spatial resolution, yielding highly detailed maps and locations of select SGD sites along a 40 km stretch of west Hawai‘i Island’s coastline. That one-time, geographically constrained study indicated highly complex and intricate patterns of SGD. However, coral dynamics—including birth, transport, and settlement—are known to occur over longer distances in west Hawai‘i [24]; thus, both high-resolution SGD mapping and large area coverage are needed for groundwater-to-coral assessments [25].
Here, we present a study of the entire 200 km west Hawai‘i coastline, the longest continuous stretch of coral reef in the State of Hawai‘i, with a mapping of SGD at 1.0 m spatial resolution. Our goal was the develop and implement an operational mapping approach that can be frequently repeated in order to capture SGD variability in space and time, yet to do so at the resolution of observed reef patterns on the seafloor that may be affected by groundwater processes [25,26]. We also sought to develop and implement an operational field-based method for verification and calibration of remotely sensed thermal patterns to those measured in surface waters into and out of mapped SGD plumes. The results presented here are part of the regional ‘Āko‘ako‘a Reef Restoration Program (http://akoakoa.org; accessed 10 May 2024), which uses multi-parameter diagnostic mapping for coral protection, restoration, and management.
2. Materials and Methods
2.1. Airborne Data Collection
We collected thermal remote sensing imagery along the coastline of West Hawai‘i Island using a wide-array broadband thermal imager (TABI-1800, Itres Research Ltd.; Calgary, AB, Canada) onboard the Global Airborne Observatory (GAO) [27]. The TABI-1800 is a push frame thermal sensor with a spectral range of 3.7–4.8 µm, 1800 cross-track detector elements aligned across a 40-degree field of view. Data collection occurred during the hours 09:00 to 11:15 local time each day. For operational efficiency, the west Hawai‘i coastline was broken into eight coastline segments 8–43 km in length, each with sufficiently linear geometry that we could cover the region with few overlapping flight lines along the same azimuth (Figure 1). The data were collected from a nominal altitude of 2000 m above sea level and at a flight speed of 130 kts, resulting in orthorectified thermal imagery with a ground pixel size of 1.0 m.
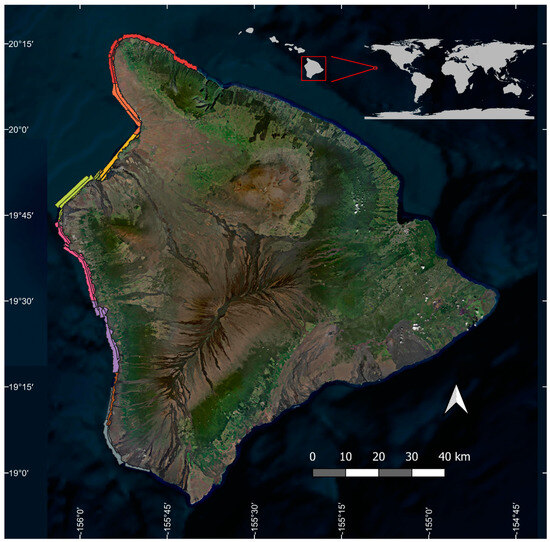
Figure 1.
Map of the west Hawai‘i Island study area. The eight flight coverage regions along the mapped coastline are shown in different colors. Inset shows the location of Hawai‘i Island west of the continental United States. Red box in upper right corner indicates locations of Hawai‘i Island globally. White arrow indicates true north.
Raw data from individual flight lines were processed to estimated °C units and orthorectified using the software tools RCX version 11.2.4.0 and GEOCOR version 5.4.2 (both provided by Itres Research Ltd., Calgary, AB, Canada). The flight lines were then grouped into their respective regions and mosaicked into eight maps, one for each coastline segment used during the flight campaign. Sea surface temperature (SST) estimates obtained from the TABI-1800 exhibit high precision, ensuring the accuracy of relative temperature variations within an image. However, to obtain accurate absolute SST measurements, a field calibration is required and was attempted with field-based SST estimates described below. Nonetheless, initially, mosaicked SST flight lines were very patchy, and the larger differences between adjacent lines masked SGD results (Figure 2a). Therefore, we devised an operational post-processing approach to shift SST estimates across flight line edges and obtain more uniform mosaics.
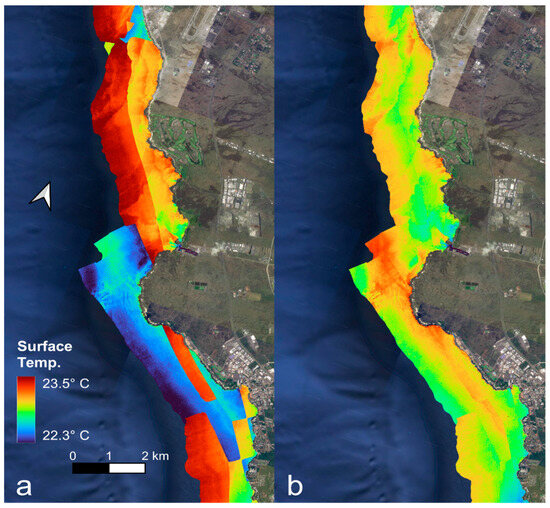
Figure 2.
Example image mosaics of sea surface temperature (a) before and (b) after flight line temperature offset computations for improved blending of flight line temperatures. Background imagery provided by Google Earth™. White arrow indicates true north.
For each thermal image mosaic, a single offset, x, was computed for each flight line to be applied to all pixels in that flight line. These offsets were optimized in such a way that values along defined flight line edges in the mosaic were as closely aligned as possible and that the overall average temperature of the mosaic changed minimally. To do this, we first identified all flight line edges within the coastline segment SST map mosaics, and we digitized each of these edges into a series of vertices defined by x and y coordinates. For each flight line edge i, a pair, j, of SST and flight line id values on opposing sides of the edge were collected at 20 m intervals along the digitized path of the edge. Locations for these paired SST values were identified by first defining a line segment 20 m long, perpendicular to and centered on the flight line edge at the given stop point, and then saving the pixels at the end points of these line segments. The SST value and flight line id of these pixels, labelled as from the left side of the edge and from the right side of the edge, were collected into a database for flight line SST offset optimization.
The optimal flight line offsets were computed by minimizing a loss function that was the sum of two components, one to penalize differences from 0 in the average SST offset computed across all N pixels in the paired dataset, , and one the sum of squared differences between adjusted SST values in all matched pairs of pixels in from each computed edge i, .
By minimizing these functions, we mitigated a large amount of inter-flight line variation to make the identification of SGD straightforward (Figure 2b).
While most of the inter-flight line SST differences were minimized via the above-stated approach, there remained noise across the mosaics. To better standardize the SGD temperature anomalies along the coastline, we computed relative SST maps by running a 250 m × 250 m mean filter across each image and subtracting the local mean temperature from the original temperature in each pixel. This produced maps in which SGD plumes became readily visible and similarly color-scaled across the full west Hawai‘i coastline (Figure 3). Using these relative SST maps, we outlined a total of 749 SGDs across all mosaics along the coastline.
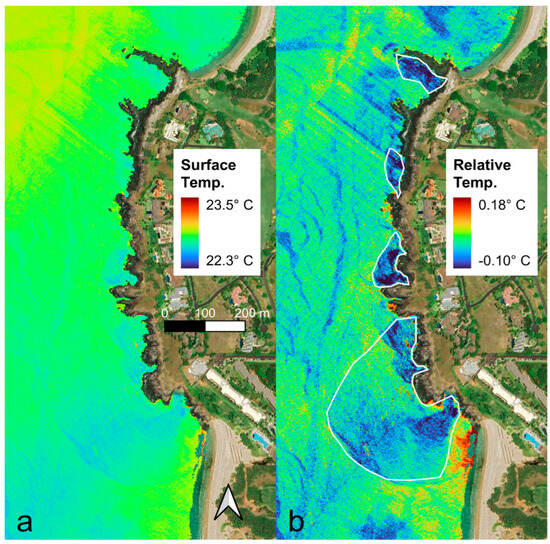
Figure 3.
Demonstration of the standardizing effect of conversion from raw surface temperature maps (a) to relative temperature maps (b). The latter were used to visually outline SGD plumes across the state. Background imagery provided by Google Earth™. White arrow indicates true north.
For each outlined SGD, we computed the average difference in SST relative to outside the plume at the time of flight, hereafter called ‘delta-SST’. The average SST values of all blended flight line mosaic pixels with centers inside the SGD plume outline were compared to the average SST of all pixels outside the plume yet within 100 m of the SGD boundary. The resulting delta-SST values were negative if the sea surface temperature inside an SGD plume was lower than the surrounding or ambient surface temperature.
2.2. Field Validation Surveys
We selected a series of detected SGD sites for field-based validation. Five clusters of SGD sites, spanning the regional mapping extent (Figure 4), were selected based on boat access for a total of 52 field transects. Using a boat with onboard navigation loaded with the SGD maps, we carried out a series of transect data collections using an instrument sonde with a temperature and depth sensor (EXO1, Yellow Springs Instruments (YSI), Yellow Springs, OH, USA). We trolled into and out of the apparent SGD plumes at a speed of <2.0 knots. The EXO1 was held at a constant depth of 20 cm off the side of the boat. The instrument has a built-in Global Positioning System (GPS) that stamps each measurement at 1 s intervals. Each of the 52 transect datasets contained was comprised of 202 to 2540 individual temperature, salinity, and GPS measurements, depending on SGD plume size and, thus, transect duration (Figure 4).
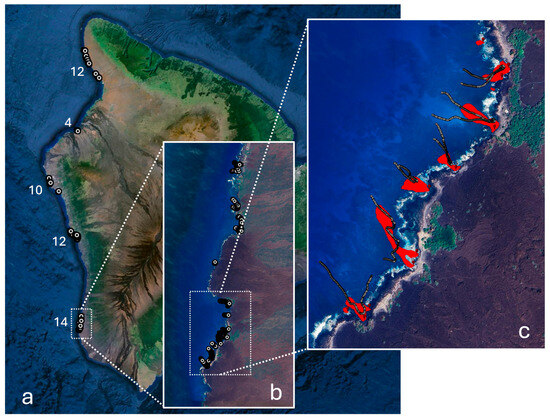
Figure 4.
Distribution of field validation sites (n = 52) at (a) region, (b) cluster, and (c) SGD plume scales. Panel (c) also shows seven of the mapped SGD plumes in red, with boat-based transects shown as sequential dots. Values in panel (a) indicate number of SGD plumes in each sub-region.
Because SGD plume size and shape are variable in time, we devised a simple temperature validation approach that takes the minimum and maximum SST difference from ambient (outside of plume) to SGD (inside of plume) positions along each boat transect. In most cases, the boat was unable to be positioned against the coastline but rather was held within the mapped SGD plume at distances of 3–10 m from shore based on available water depth. We recognize the variability in such nearshore seafloor conditions but would otherwise be unable to access the vast majority of SGD plumes from shore. The boat-based collection of delta-SST outside versus inside each SGD plume provided a metric of SGD presence. In addition, we used the delta-SST data from each plume to assess the delta-SST values generated from the aircraft thermal imaging system, which was not field-calibrated (see Section 2.1). This provided a way to convert remotely sensed delta-SST to field-based delta-SST.
3. Results
3.1. Mapped SGD Plumes
We mapped a total of 749 SGD plumes along 200 km of west Hawai‘i Island’s coastline (Figure 5). While small plumes were found throughout the entire region (Figure 5a), there were areas of greater SGD density (Figure 5b), calculated as a combination of their size and spatial clustering.
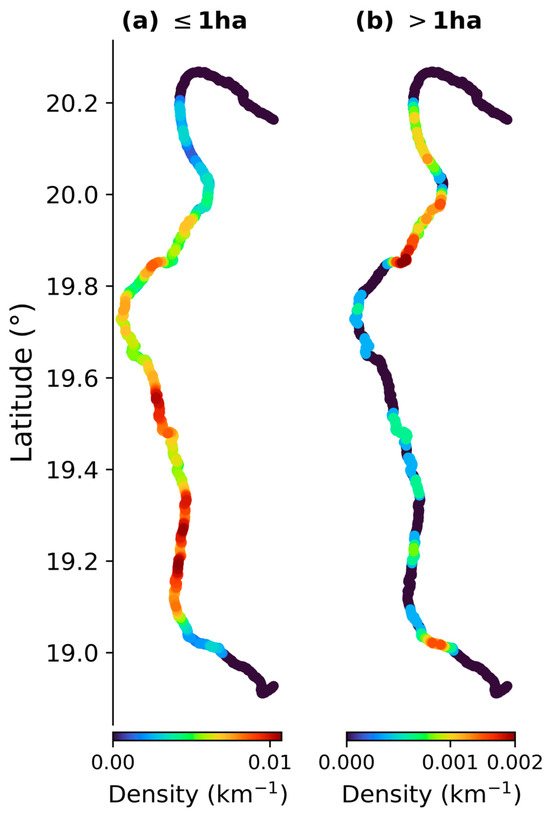
Figure 5.
Spatial density of submarine groundwater discharge (SGD) sites along the west Hawai‘i Island coastline. Refer to Figure 1 for geographic context. Due to the rare occurrence of very large SGD plumes, the density maps were calculated by the number and size of discharge sites in specific size classes of ≤1 ha and >1 ha per linear coastline distance of one km.
The size distribution of SGD plumes is highly skewed (Figure 6). More than 48% of the plumes were less than 0.1 ha in size. Only 9% of SGD plumes were ≥1 ha in size, and less than 1% were larger than 10 ha. The single largest plume was 62.6 ha in size at the time of overflight.
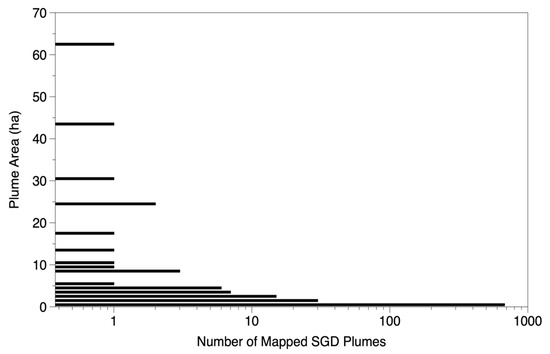
Figure 6.
Frequency distribution of submarine groundwater discharge (SGD) plumes along the west Hawai‘i coastline.
3.2. Airborne and Boat-Based SGD Temperatures
Differences in SST between SGD plumes and surrounding areas were relatively uniform in comparison to the highly skewed distribution of plume sizes described above (Figure 7). Airborne delta-SST values fell mostly in the −0.03 °C to −0.2 °C range, and this is largely due to the uncalibrated nature of the thermal imaging temperatures (see Section 2.1). A small proportion of remotely sensed delta-SST values exceeded −0.3 °C (Figure 7), indicating areas of significantly cooler freshwater discharge.
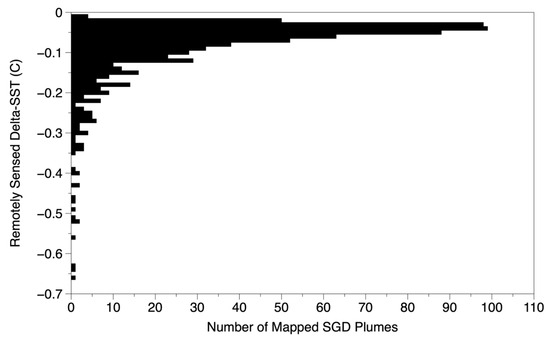
Figure 7.
Frequency distribution of remotely sensed delta-SST in each submarine groundwater discharge (SGD) plume. Delta-SST was calculated as the difference in sea surface temperature inside relative to outside of each mapped SGD plume (see Methods).
Using boat-based transects, we completed 52 passes into and out of the mapped SGD plumes. An example is shown outside of Honokōhau Harbor, located on the central coast of west Hawai‘i, and the delta-SST for that plume (Figure 8).
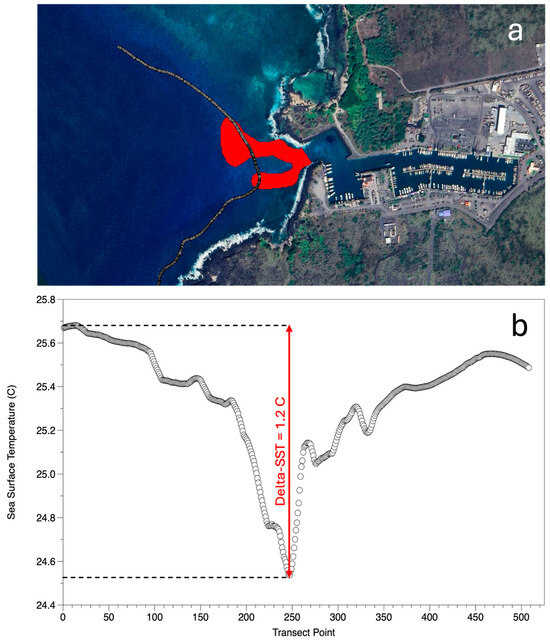
Figure 8.
(a) Example boat transect into submarine groundwater discharge (SGD) plume (in red) at Honokōhau Harbor. (b) Transect results corresponding to panel (a). Dots in both panels indicate each sea surface temperature (SST) measurement.
Of the 52 transects, 47 resulted in a boat-based delta-SST of at least −0.1 °C differential from inside relative to outside of the mapped SGD plume. The remaining five transects showed no measurable difference during boat operations, which could be due to the transient nature of SGD caused by groundwater available, tides, and local currents.
Plotting the boat-based SST results against those from the aircraft thermal imager, we derived a quadratic relationship with an R2 = 0.85 and RMSE = 0.04 °C (Figure 9). Boat-based delta-SST measurements were more sensitive than those derived from airborne thermal imaging. The resulting equation relating airborne (A) to in situ (B) delta-SST was A = −0.095 − 0.12B − 0.39B2.
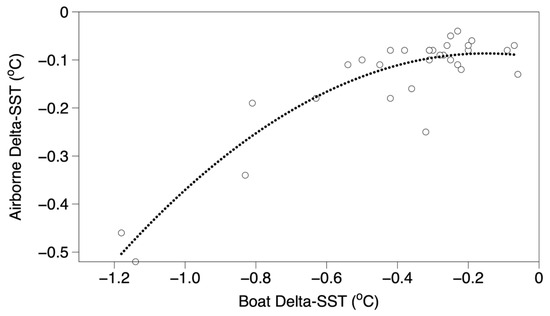
Figure 9.
Relationship between boat-based estimates of delta-SST inside and outside of each SGD plume and those derived from airborne thermal imaging (n = 47). Open circles indicate each SGD site and dashed line indicates quadratic fit line.
Finally, there was no simple relationship between remotely sensed SGD plume area and remotely sensed delta-SST (Figure 10). However, very large plumes were always associated with small delta-SST values of around −0.1 °C. In contrast, 15 very small plumes were associated with relatively large delta-SST values in the −0.4 °C to −0.7 °C range.
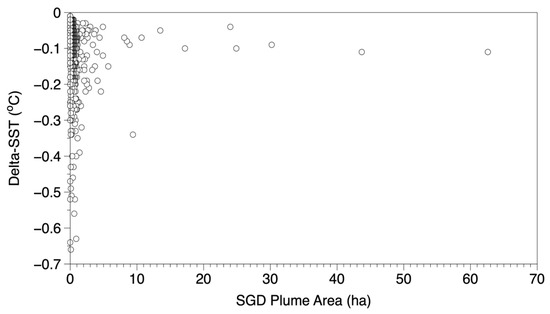
Figure 10.
Relationship between remotely sensed submarine groundwater discharge (SGD) plume area and delta-SST values. Open circles indicate each SGD site.
4. Discussion
We sought to develop, deploy, and demonstrate an operational method for airborne detection and mapping of SGD and its geospatial patterns along coastlines abutting coral reef ecosystems. While our focus was on locating SGD sites with this method, we were also able to generate a field-based calibration of airborne to in situ differential seawater temperatures associated with SGD plumes. We found that thermal remote sensing at 1.0 m spatial resolution is capable of detecting detailed patterns of SGD, which subsequently reveals a more complete size distribution of freshwater outfall. While this insight aligns with those of similar high-resolution thermal remote sensing studies [28,29], we purposefully designed our methodology to be highly operational and scalable. The approach can thus be applied frequently over time in order to generate SGD size distributions relative to land-based substrate age, topography, pollutants, and other factors.
The west Hawai’i coastline joins a complex mosaic of coral reef habitats and conditions to an array of land-based geophysical and infrastructural features. Despite the limited scope of a single SGD mapping effort as reported here, we were able to glean several new insights that bear on our understanding of the role of SGD in west Hawai’i. One major insight is that smaller (<1 ha) SGD plumes were distributed far more uniformly and ubiquitously than were the larger (>1 ha) SGD plumes along the west Hawai‘i coastline (Figure 5). Subsurface freshwater outfall is, therefore, omnipresent in the nearshore environment, so to focus only on large plumes would fail to incorporate the integrated effect of many hundreds of small plumes that have gone unmapped until now. Such numerous small SGD plumes are critically important in addressing coastal pollution, which preferentially passes through highly porous rock substrates of Hawai‘i Island [30].
Hundreds of small SGD sites present a challenge to coral reef monitoring, protection, and restoration efforts confronting the increasing amount of land-based pollution entering the reef system. SGD contaminated by onsite sewage disposal systems like cesspools and septic tanks, larger ground-infiltrating sources such as golf courses and agro-industry, as well as distributed sources from vehicles, roadways, and other infrastructure, have the potential to leak into the nearshore environment [31,32,33]. These pollutant pathways have been linked to negative impacts on corals, fish, and other inhabitants [13,34]. As a result, fine-scale SGD mapping should guide field-based sampling and monitoring of water quality. Our SGD map is now in use by organizations monitoring a variety of compounds, including those associated with human waste and nutrients, into the reefs of west Hawai‘i.
Another insight is that the very large SGD plumes are not only geographically rare (Figure 5 and Figure 6), but they are also relatively warm, as indicated by small delta-SST values (Figure 10). This finding bears on recent studies seeking to assess whether large SGD plumes might serve as cooling refugia for coral reefs as they undergo increasingly warmer surface temperature anomalies [25]. Our results suggest that the effect of the largest SGD plumes—just 0.1 °C decreases from ambient SST conditions—is insufficient to generate the cooling subsidy that might otherwise benefit reefs during times of marine heatwaves causing coral bleaching. However, we make this statement with caution until we carry out repeated airborne surveys of the large discharge sites to confirm the small delta-SST values initially reported here. In doing so, we also plan to improve our understanding of the relationship between SST and near-surface temperature as measured with boat-based temperature sondes as used in this study and others [35].
Applied over even larger areas than demonstrated here, this airborne SGD monitoring method will yield additional insights into the role that land-to-reef interactions play in the composition and condition of adjacent reef ecosystems. Our approach will facilitate future repeat mapping of SGD at diel to annual timescales, supporting a more comprehensive understanding of the role of changing land use and climate on coral and other types of reefs. Whether this approach can be applied to global satellite-based thermal data remains to be tested, but doing so would ultimately allow for the assessment of SGD on some 530,000 km of existing coastal coral reef ecosystems worldwide (http://allencoralatlas.org; accessed 10 May 2024).
5. Conclusions
Submarine groundwater discharge (SGD) is a potential major contributor to both the thermal protection and chemical pollution of coral reefs adjacent to land masses. Mapping the location, extent, and persistence of SGD is thus of increasing importance with changing ocean climate and land use. We developed, deployed, and demonstrated a thermal remote sensing approach for mapping SGD from land into coral reefs along the 200 km west coast of Hawai‘i Island. A total of 749 SGD plumes were located and verified with field-based measurements. We found that very small SGD plumes are ubiquitous in the nearshore environment. We also found that the large SGD plumes (>10 ha) are very infrequent and may not supply sufficient cooling to protect the coral reefs of west Hawai‘i from increasing ocean temperature. Our operational approach can be applied repeatedly over time to monitor the location of potential land-based pollutants leaking into coral reef environments.
Author Contributions
Conceptualization, G.P.A.; methodology, G.P.A. and N.R.V.; validation, G.P.A.; formal analysis, G.P.A. and N.R.V.; investigation, G.P.A., N.R.V. and J.H.; data curation, G.P.A., N.R.V. and J.H.; writing—original draft preparation, G.P.A.; writing—review and editing, G.P.A. and N.R.V.; funding acquisition, G.P.A. All authors have read and agreed to the published version of the manuscript.
Funding
This research was funded by the Lenfest Ocean Program, grant number 34039 to G.P. Asner.
Institutional Review Board Statement
Not applicable.
Data Availability Statement
The submarine groundwater discharge data are available on the ‘Āko‘ako‘a Reef Restoration Geoportal ((1) https://www.akoakoa.org/resources/geospatial-platform; accessed 10 May 2024) and (2) https://doi.org/10.5281/zenodo.11176377.
Acknowledgments
We thank D. Harrison and R.E. Martin for assistance in the field. We thank D. Woodward, S. Decosse, and B. Edlund for Global Airborne Observatory support.
Conflicts of Interest
The authors declare no conflicts of interest.
References
- Connell, J.H. Diversity in tropical rainforests and coral reefs. Science 1978, 199, 1302–1310. [Google Scholar] [CrossRef] [PubMed]
- Bellwood, D.R.; Pratchett, M.S.; Morrison, T.H.; Gurney, G.G.; Hughes, T.P.; Álvarez-Romero, J.G.; Day, J.C.; Grantham, R.; Grech, A.; Hoey, A.S.; et al. Coral reef conservation in the Anthropocene: Confronting spatial mismatches and prioritizing functions. Biol. Conserv. 2019, 236, 604–615. [Google Scholar] [CrossRef]
- Grigg, R.W. Community structure, succession and development of coral reefs in Hawaii. Mar. Ecol. Prog. Ser. 1983, 11, 1–14. [Google Scholar] [CrossRef]
- Murray, J. 1. On the Structure and Origin of Coral Reefs and Islands. Proc. R. Soc. Edinb. 1880, 10, 505–518. [Google Scholar] [CrossRef]
- Cabioch, G.; Davies, P.; Done, T.; Gischler, E.; Macintyre, I.; Wood, R.; Woodroffe, C. Encyclopedia of Modern Coral Reefs: Structure, Form and Process; Springer Science & Business Media: Berlin/Heidelberg, Germany, 2010. [Google Scholar]
- Lowe, R.J.; Falter, J.L. Oceanic forcing of coral reefs. Annu. Rev. Mar. Sci. 2015, 7, 43–66. [Google Scholar] [CrossRef] [PubMed]
- Munday, P.; Leis, J.; Lough, J.; Paris, C.; Kingsford, M.; Berumen, M.L.; Lambrechts, J. Climate change and coral reef connectivity. Coral Reefs 2009, 28, 379–395. [Google Scholar] [CrossRef]
- McLaughlin, C.; Smith, C.; Buddemeier, R.; Bartley, J.; Maxwell, B. Rivers, runoff, and reefs. Glob. Planet. Chang. 2003, 39, 191–199. [Google Scholar] [CrossRef]
- Paytan, A.; Shellenbarger, G.G.; Street, J.H.; Gonneea, M.E.; Davis, K.; Young, M.B.; Moore, W.S. Submarine groundwater discharge: An important source of new inorganic nitrogen to coral reef ecosystems. Limnol. Oceanogr. 2006, 51, 343–348. [Google Scholar] [CrossRef]
- Street, J.H.; Knee, K.L.; Grossman, E.E.; Paytan, A. Submarine groundwater discharge and nutrient addition to the coastal zone and coral reefs of leeward Hawaiʻi. Mar. Chem. 2008, 109, 355–376. [Google Scholar] [CrossRef]
- Silbiger, N.J.; Donahue, M.J.; Lubarsky, K. Submarine groundwater discharge alters coral reef ecosystem metabolism. Proc. R. Soc. B 2020, 287, 20202743. [Google Scholar] [CrossRef]
- Moosdorf, N.; Stieglitz, T.; Waska, H.; Dürr, H.H.; Hartmann, J. Submarine groundwater discharge from tropical islands: A review. Grundwasser 2015, 20, 53–67. [Google Scholar] [CrossRef]
- Gove, J.M.; Williams, G.J.; Lecky, J.; Brown, E.; Conklin, E.; Counsell, C.; Davis, G.; Donovan, M.K.; Falinski, K.; Kramer, L. Coral reefs benefit from reduced land–sea impacts under ocean warming. Nature 2023, 621, 536–542. [Google Scholar] [CrossRef] [PubMed]
- Oehler, T.; Bakti, H.; Lubis, R.F.; Purwoarminta, A.; Delinom, R.; Moosdorf, N. Nutrient dynamics in submarine groundwater discharge through a coral reef (western Lombok, Indonesia). Limnol. Oceanogr. 2019, 64, 2646–2661. [Google Scholar] [CrossRef]
- Tait, D.R.; Santos, I.R.; Lamontagne, S.; Sippo, J.Z.; McMahon, A.; Jeffrey, L.C.; Maher, D.T. Submarine groundwater discharge exceeds river inputs as a source of nutrients to the Great Barrier Reef. Environ. Sci. Technol. 2023, 57, 15627–15634. [Google Scholar] [CrossRef] [PubMed]
- Mukherjee, S. Review of the role of remote sensing for submarine groundwater discharge. New Water Policy Pract. 2015, 2, 30–50. [Google Scholar] [CrossRef]
- Moore, W.S. The effect of submarine groundwater discharge on the ocean. Annu. Rev. Mar. Sci. 2010, 2, 59–88. [Google Scholar] [CrossRef] [PubMed]
- McGowan, M.P. Submarine Groundwater Discharge: Freshwater and Nutrient Input into Hawaii’s Coastal Zone. Master’s Thesis, University of Hawaii at Mānoa, Honolulu, HI, USA, 2004. [Google Scholar]
- Caineta, J.; Thomas, B.F.; Bain, D.J. Submarine groundwater discharge detection through remote sensing: An application of Landsat 7 and 8 in Hawaiʻi and Ireland. Remote Sens. Environ. 2022, 279, 113109. [Google Scholar] [CrossRef]
- MacDonald, G.A.; Abbot, A.T.; Peterson, F.L. Volcanoes in the Sea: The Geology of Hawaii; University of Hawaii Press: Honolulu, HI, USA, 1983; p. 517. [Google Scholar]
- Oberle, F.K.; Prouty, N.G.; Swarzenski, P.W.; Storlazzi, C.D. High-resolution observations of submarine groundwater discharge reveal the fine spatial and temporal scales of nutrient exposure on a coral reef: Faga’alu, AS. Coral Reefs 2022, 41, 849–854. [Google Scholar] [CrossRef]
- Gove, J.M.; Whitney, J.L.; McManus, M.A.; Lecky, J.; Carvalho, F.C.; Lynch, J.M.; Li, J.; Neubauer, P.; Smith, K.A.; Phipps, J.E. Prey-size plastics are invading larval fish nurseries. Proc. Natl. Acad. Sci. USA 2019, 116, 24143–24149. [Google Scholar] [CrossRef]
- Johnson, A.G. Groundwater discharge from the leeward half of the Big Island, Hawaii. Master’s Thesis, University of Hawaii, Honolulu, HI, USA, 2008. [Google Scholar]
- Carlson, R.R.; Crowder, L.B.; Martin, R.E.; Asner, G.P. The effect of reef morphology on coral recruitment at multiple spatial scales. Proc. Natl. Acad. Sci. USA 2024, 121, e2311661121. [Google Scholar] [CrossRef]
- Asner, G.P.; Vaughn, N.R.; Martin, R.E.; Foo, S.A.; Heckler, J.; Neilson, B.J.; Gove, J.M. Mapped coral mortality and refugia in an archipelago-scale marine heat wave. Proc. Natl. Acad. Sci. USA 2022, 119, e2123331119. [Google Scholar] [CrossRef]
- Asner, G.P.; Vaughn, N.R.; Heckler, J.; Knapp, D.E.; Balzotti, C.; Shafron, E.; Martin, R.E.; Neilson, B.J.; Gove, J.M. Large-scale mapping of live corals to guide reef conservation. Proc. Natl. Acad. Sci. USA 2020, 117, 33711–33718. [Google Scholar] [CrossRef]
- Asner, G.P.; Knapp, D.E.; Boardman, J.; Green, R.O.; Kennedy-Bowdoin, T.; Eastwood, M.; Martin, R.E.; Anderson, C.; Field, C.B. Carnegie Airborne Observatory-2: Increasing science data dimensionality via high-fidelity multi-sensor fusion. Remote Sens. Environ. 2012, 124, 454–465. [Google Scholar] [CrossRef]
- Tamborski, J.J.; Rogers, A.D.; Bokuniewicz, H.J.; Cochran, J.K.; Young, C.R. Identification and quantification of diffuse fresh submarine groundwater discharge via airborne thermal infrared remote sensing. Remote Sens. Environ. 2015, 171, 202–217. [Google Scholar] [CrossRef]
- Williams, E.L. Multi-Scale Thermal Mapping of Submarine Groundwater Discharge in Coastal Ecosystems of Volcanic Islands. Master’s Thesis, The University of Texas at Austin, Austin, TX, USA, 2023. [Google Scholar]
- Knee, K.L.; Street, J.H.; Grossman>, E.E.; Boehm, A.B.; Paytan, A. Nutrient inputs to the coastal ocean from submarine groundwater discharge in a groundwater-dominated system: Relation to land use (Kona coast, Hawaii, USA). Limnol. Oceanogr. 2010, 55, 1105–1122. [Google Scholar] [CrossRef]
- Bishop, J.M.; Glenn, C.R.; Amato, D.W.; Dulai, H. Effect of land use and groundwater flow path on submarine groundwater discharge nutrient flux. J. Hydrol. Reg. Stud. 2017, 11, 194–218. [Google Scholar] [CrossRef]
- Mezzacapo, M.; Donohue, M.J.; Smith, C.; El-Kadi, A.; Falinski, K.; Lerner, D.T. Hawaiʻi’s Cesspool Problem: Review and Recommendations for Water Resources and Human Health. J. Contemp. Water Res. Educ. 2020, 170, 35–75. [Google Scholar] [CrossRef]
- Abaya, L.M.; Wiegner, T.N.; Beets, J.P.; Colbert, S.L.; Kaile’a, M.C.; Kramer, K.L. Spatial distribution of sewage pollution on a Hawaiian coral reef. Mar. Pollut. Bull. 2018, 130, 335–347. [Google Scholar] [CrossRef] [PubMed]
- Foo, S.A.; Walsh, W.J.; Lecky, J.; Marcoux, S.; Asner, G.P. Impacts of pollution, fishing pressure, and reef rugosity on resource fish biomass in West Hawaii. Ecol. Appl. 2021, 31, e2213. [Google Scholar] [CrossRef]
- Schluessel, P.; Emery, W.J.; Grassl, H.; Mammen, T. On the bulk-skin temperature difference and its impact on satellite remote sensing of sea surface temperature. J. Geophys. Res. Ocean. 1990, 95, 13341–13356. [Google Scholar] [CrossRef]
Disclaimer/Publisher’s Note: The statements, opinions and data contained in all publications are solely those of the individual author(s) and contributor(s) and not of MDPI and/or the editor(s). MDPI and/or the editor(s) disclaim responsibility for any injury to people or property resulting from any ideas, methods, instructions or products referred to in the content. |
© 2024 by the authors. Licensee MDPI, Basel, Switzerland. This article is an open access article distributed under the terms and conditions of the Creative Commons Attribution (CC BY) license (https://creativecommons.org/licenses/by/4.0/).