Abstract
In the oceans, Chaetognatha can contribute significantly to the total zooplankton biomass (up to 10–30%). The genus Eukrohnia, the dominant Chaetognath genus in the western subarctic Pacific, includes E. hamata and E. bathypelagica. Although it has been pointed out that there is no genetic difference between the two species, no study has been made that treats them as the same species group. In this study, we investigated vertical distribution based on the eight vertical stratification samplings down to 1000 m depths conducted day/night at four seasons covering one year, community structure, and population structure of the three dominant Chaetognath species: Parasagitta elegans, E. hamata, and E. bathypelagica in the western subarctic Pacific. The population densities of each species at 0–1000 m water column were 0.04–0.36 ind. m−3 for P. elegans, 0.14–1.60 ind. m−3 for E. hamata, 0.24–1.54 ind. m−3 for E. bathypelagica, and 1.37–2.62 ind. m−3 for Eukrohnia juveniles. The vertical distributions were consistent both day and night, and no diel changes were observed for all species throughout the seasons. The vertical distribution of Chaetognaths evaluated by the distribution center was 61–169 m for P. elegans, 143–206 m for Eukrohnia juveniles, 134–279 m for E. hamata, and 253–612 m for E. bathypelagica. The body length of P. elegans ranged from 4 to 34 mm, and one to three cohorts were identified at each sampling occasion. While the presence of the eight stages has been reported for Eukrohnia, only one to five stages occurred, and specimens belonging to six to eight stages were not observed in the samples throughout the year. The body length of the whole Eukrohnia species ranged from 2 to 14 mm. The body length histograms of the Eukrohnia species group, including E. hamata and E. bathypelagica, and their juveniles showed the presence of two to four cohorts at each sampling date. Within the Eukrohnia species group, vertical changes in body length were present, which were characterized by the smaller specimens occurring at shallower depths, followed by an increase in body length with increasing depths. From the vertical distribution and population structure of the Eukrohnia species group (Eukrohnia juvenile + E. hamata + E. bathypelagica) in this study, there was no difficulty in treating them as one species. It may suggest that E. hamata and E. bathypelagica in the western subarctic Pacific could be treated as one species group. To clarify this point, a detailed genetic analysis of the Eukrohnia species group will be needed for future studies.
1. Introduction
Chaetognatha is a marine phylum that has a wide distribution from the sea surface to the bottom of the worldwide oceans. In the oceans, Chaetognatha can contribute significantly to the total zooplankton biomass (up to 10–30%) [1]. Chaetognatha is carnivorous and preys on mainly small-sized copepods [2,3,4]. On the other hand, Chaetognatha is eaten by various fish: salmon [5], walleye pollock [6], and mesopelagic myctophids [7]. Thus, Chaetognatha plays an important role in transporting copepod secondary production to higher trophic-level organisms [8].
The life history of the pelagic Chaetognatha has been reported from various areas, including the North Atlantic [9,10,11], the Arctic Ocean [12,13], and the North Pacific [14,15,16]. On the other hand, the mtDNA COI analysis of the genus Eukrohnia, which has a worldwide distribution, shows that there is no genetic difference between E. hamata and E. bathypelagica of the same region, and E. bathypelagica is suggested to be a post-spawning individual of E. hamata [17]. From this point of view, it has been pointed out that it is necessary to re-analyze the life history of Chaetognatha, including the existence of cryptic species [18].
In the western subarctic Pacific, St. K2 has been set up as a long-term time-series observation station, and various biogeochemical studies, including plankton, have been conducted [19]. At St. K2, Chaetognatha has been reported to dominate in the 50–200 m depth range, accounting for 14–36% of total zooplankton biomass [20]. The dominance of Chaetognatha in zooplankton biomass at the mesopelagic layer of St. K2 has also been reported [21]. Regarding the vertical distribution of Chaetognatha at St. K2, they showed bimodal vertical distribution showing peaks at 0–50 m and 150–300 m, and few individuals distributed for 50–150 m depth both day and night [22]. Based on the sediment trap moored at 150 m of St. K2 collected at two-day intervals from June to July, P. elegans was collected as a zooplankton swimmer, and the body length of P. elegans showed a uni-modal cohort with peaks at 29.2–31.9 mm, showing the significant growth rate at 0.21 mm day−1 [23]. Although these findings are important, population structure has been observed only at certain depths and for a limited season. Thus, knowledge of the life cycle of Chaetognatha at St. K2 is scarce.
An oblique tow of a Bongo net from 0 to 200 m was conducted in the Oyashio region at 2–5 day intervals from March to April [24]. Data acquired revealed that E. hamata and P. elegans composed 95% of the Chaetognath abundance and showed three peaks in body length [24]. The growth rates of E. hamata and P. elegans were 0.039–0.050 mm day−1 and 0.042–0.101 mm day−1, respectively [24]. For vertical distribution based on the vertical stratification samplings down to 5000 m, the distribution centers of P. elegans, E. hamata, and E. bathypelagica were at 26–187 m, 169–308 m, and 583–728 m, respectively; thus, distribution depth varied for the species [25]. For the life cycle of Chaetognatha, it has been reported that the generation time of P. elegans is one or two years based on the time-series samples collected from 150 m off Kushiro for four years [16]. In addition, based on the time series sampling by Bongo net from 0 to 1000 m depth in the Oyashio region at 2 to 3 month intervals, the recruitment of E. hamata juveniles occurs in spring and summer, and their growth rates show seasonality: fast in summer and autumn, slow in winter and spring, and having two-year generation lengths [18]. While these findings are important, as mentioned above, there is a possibility that E. hamata and E. bathypelagica are the same species within the Eukrohnia species [17,26]. These facts suggest that an analysis that treats both species as the same species group is needed, but such a study has not been conducted yet.
This study conducted day/night vertical distribution, seasonal changes in body length, and population structure studies of three dominant Chaetognath species (P. elegans, E. hamata, and E. bathypelagica) at St. K2 in the western subarctic Pacific based on day/night vertical stratification samples down to 1000 m at four seasons covering one year. For two Eukrohnia species considered to be the same species [17,26], the hypothetical species group “Eukrohnia species group”, including Eukrohnia juvenile, E. hamata, and E. bathypelagica, was set. Then the body length, developmental stage composition, and vertical distribution of the Eukrohnia species group were analyzed. Through such analyses, the consistency of the treatment of both species as the same species was considered from an ecological perspective.
2. Materials and Methods
2.1. Field Sampling
Day/night vertical stratified oblique tow of Intelligent Operative Net Sampling System (IONESS, SEA, Co. Ltd., Chiba, Japan) equipped 335 μm with 1.5 m2 mouth area was made from eight layers (0–50, 50–100, 100–150, 150–200, 200–300, 300–500, 500–750, and 750–1000 m) at St. K2 (47° N, 160° E, Figure 1, Table 1) during four occasions: 29 October 2010, 26 February, 22–23 April, and 3–4 July 2011. The filtering volume of each sample was monitored by a flowmeter. Samples were preserved by 4% (v/v) borax-buffered formalin. Temperature, salinity, dissolved oxygen (DO), and fluorescence were measured by CTD (SBE 911plus; Sea-Bird Scientific) at each sampling occasion. For the zooplankton samples used in this study, data on the abundance and biomass of zooplankton taxa have already been published [20]. In this study, data on the abundance of copepods, the primary prey of Chaetognatha, were quoted from [20].
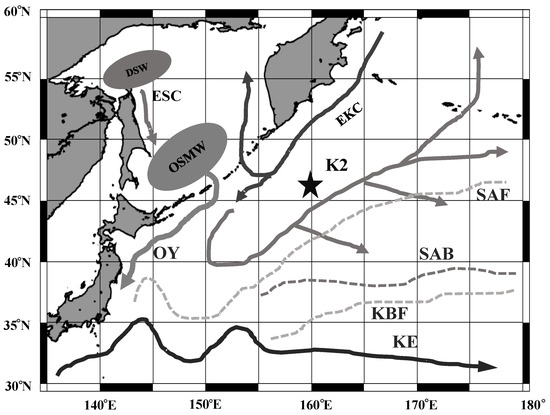
Figure 1.
Location of the sampling station (K2) in the western subarctic Pacific gyre. Arrows represent the approximate positions and directions of the currents. EKC: East Kamchatka Current, OY: Oyashio, KE: Kuroshio Extension, TC: Tsushima Warm Current, SAF: Subarctic Front, SAB: Subarctic Boundary, KBF: Kuroshio Bifurcation Front, OSMW: Okhotsk Sea Mode Water, DSW: Dense Shelf Water, and OSMW: Okhotsk Sea Mode Water.

Table 1.
Sampling data of the samples used in the present study collected at St. K2 in the western subarctic Pacific gyre from October 2010 to July 2021. All the samples were collected from eight discrete depths between 0 and 1000 m by oblique tow of IONESS.
2.2. Abundance, Body Size, and Biomass
In the land laboratory, sorting of Chaetognatha was made on the sub-samples at a division rate of 1/2–1/64, which varied with the number of samples. Under a stereomicroscope, species identification and enumeration were made. Body length was measured with a precision of 0.1 mm using vernier calipers. For each individual, the developmental condition of the gonads was observed. Based on gonad development, P. elegans is classified into three developmental stages: stages 1, 2, and 3 [23]. Stage 1 is an individual without ovaries; stage 2 is an individual with a developing egg but no mature egg; and stage 3 is an individual with a mature egg [23]. Eukrohnia were classified into stages I to VIII using the criteria of [27]. The Chaetognatha were sorted by species and placed on a pre-weighed 100 μm mesh, removed water, and measured wet weight (WW) with a precision of 0.01 mg using an electronic balance (Mettler Toledo AT261). Calculation of the abundance and biomass data from per cubic meter (m−3) to per square meter (m−2) was made by multiplying the towed depth (m) with the value per cubic meter.
2.3. Vertical Distribution
The vertical distribution of the three dominant species (P. elegans, E. hamata, and E. bathypelagica) and Eukrohnia juvenile was analyzed with day/night for the four seasons. The vertical distribution core (D50%), where 50% of the population was distributed, was calculated based on abundances (ind. m−2) in each sampling layer [28]:
where d1 is the depth (m) of the upper depth of the 50% individual occurrence layer, d2 is the maximum depth (m) of the 50% individual occurrence layer, p1 is the cumulative individual percentage (%) that occurred at depths shallower than the 50% individual occurrence layer, and p2 is the individual percentage (%) at the 50% individual occurrence layer.
2.4. Population Structure (Cohort Analyses)
Population structure analyses were made for the three dominant species: P. elegans, E. hamata, and E. bathypelagica, and one combined species group: the Eukrohnia species group (E. hamata + E. bathypelagica). Thus, we treated four taxonomic categories in this study. Based on the total number of the water column (ind. m−2) at 0–1000 m, histograms on body length were made, and cohort analyses were performed using the aid of the MSExcel solver function [29]. In addition, depth distribution composition was also calculated for each body length at a 1 mm interval. The number of Eukrohnia juveniles was estimated by multiplying the composition of E. hamata and E. bathypelagica species that occurred in the same sample. In addition, since E. hamata and E. bathypelagica are genetically identical [17,26], one species group, the Eukrohnia species group (Eukrohnia juveniles + E. hamata + E. bathypelagica), was also set, and their body length histogram and distribution depth composition were analyzed.
3. Results
3.1. Hydrography
Vertical changes in temperature, salinity, dissolved oxygen, and copepod abundance during day and night in four seasons are shown in Figure 2. Temperatures ranged from 1.2 to 8.5 °C in October, 1.8 to 3.6 °C in February, 1.4 to 3.7 °C in April, and 1.5 to 6.5 °C in July. The near-surface layer was warmer in October and July and cooler in February and April. For all seasons, the temperature decreased to 100 m, had a minimum, then increased to 200 m with the subsurface small maximum, and decreased below 200 m. Salinity ranged from 32.6–34.4 in October, 32.9–34.4 in February, 33.0–34.4 in April, and 32.8–34.4 in June. Salinity was low near the surface, especially in October, then gradually increased with increasing depth for all seasons. Dissolved oxygen was at 0.3–7.4 mL L−1 in October, 0.3–7.4 mL L−1 in February, 0.3–7.5 mL L−1 in April, and 0.3–7.5 mL L−1 in July. For all seasons, dissolved oxygen showed high values near the surface layer and decreased rapidly with increasing depth to 200 m, then stabilized around <1.4 mL L−1 below 200 m depths. The abundance of copepods was 14–732 ind. m−3 in October, 10–145 ind. m−3 in February, 8–174 ind. m−3 in April, and 5–190 ind. m−3 in June. The copepod abundance was high near the surface layer, especially in October. Common for all seasons, copepod abundance had a minimum at 150–200 m, formed a small maximum below, then decreased with increasing depth. There were few changes in copepod abundance and vertical distribution between day and night.
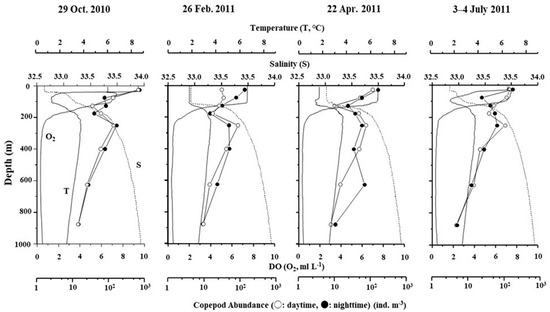
Figure 2.
Vertical distribution of temperature, salinity, dissolved oxygen (DO), and copepod abundance (day and night) at St.K2 in the western subarctic Pacific gyre from October 2010 to July 2011. Note that scales of copepod abundance are in log scales.
3.2. Abundance and Biomass of Chaetognaths
In this study, Chaetognatha belonging to two genera and three species were identified (Table 2). Abundances of Chaetognaths at the water column (0–1000 m) were 0.04–0.36 ind. m−3 for P. elegans, 0.14–1.60 ind. m−3 for E. hamata, 0.24–1.54 ind. m−3 in E. bathypelagica, and Eukrohnia juveniles were 1.37–2.62 ind. m−3. Eukrohnia juveniles accounted for nearly half of the total Chaetognath abundance. The next dominant species were E. hamata and E. bathypelagica. Both species accounted for about 20% of the total Chaetognath abundance. The abundance of P. elegans was around 5% of the population.

Table 2.
Annual mean abundance and biomass at 0–1000 m water column at St. K2 in the western subarctic Pacific gyre during October 2010 to July 2021.
Biomasses at 0 to 1000 m water column were 4.89–26.16 mg WW m−3 for P. elegans, 1.00–10.55 mg WW m−3 for E. hamata, juveniles 3.45–25.32 mg WW m−3 for E. bathypelagica, and 0.37–3.63 mg WW m−3 for Eukrohnia juveniles (Table 2). Regarding species composition, Eukrohnia juvenile, which had a high composition in abundance, had a low composition of 5.5% in biomass due to the smaller body size. On the other hand, the numerical minor P. elegans had the highest composition of biomass, accounting for 40% of total Chaetognath biomass due to its large body size.
3.3. Vertical Distribution of the Three Dominant Chaetognath Species
The day/night vertical distribution of Chaetognath species (P. elegans, E. hamata, E. bathypelagica, and Eukrohnia juvenile) at each season is shown in Figure 3. The vertical distribution of Chaetognaths was consistent with day and night for all species, and no day and night differences were detected for any species or season ( > 0.05, Kolmogorov–Smirnov test) (Table 3).
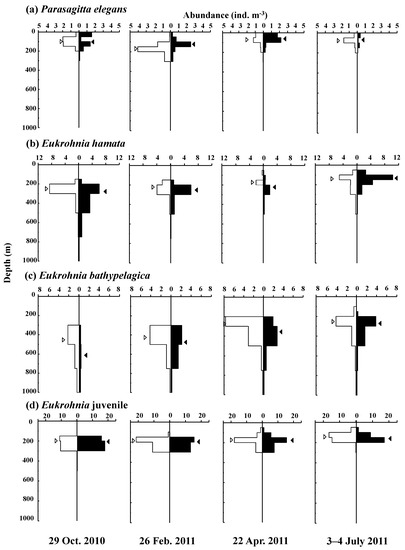
Figure 3.
Day (open) and night (solid) vertical distribution of the four dominant Chaetognaths: Parasagitta elegans (a), Eukrohnia hamata (b), Eukrohnia bathypelagica (c), and Eukrohnia juvenile (d) at St. K2 in the western subarctic Pacific gyre during October 2010 to July 2011. Distribution cores (D50%) were calculated for each sample series and shown with triangles (open: day, solid: night).

Table 3.
Summary of the vertical distribution cores (D50%, m) of each dominant chaetognath species in the western subarctic Pacific gyre during October 2010 to July 2011. (D): day, (N): night.
The vertical distribution of P. elegans was the shallowest among the species and was concentrated at 200 m depth. The vertical distribution of P. elegans was slightly deep in October and February (D50%: 100–169 m) and shallow in April and July (D50%: 62–77 m). The vertical distribution of E. hamata was deeper than that of P. elegans, which frequently occurred at 100–500 m. The vertical distribution of E. hamata was shallower in July (D50%: 134–140 m) than in October and February (D50%: 223–279 m). Eukrohnia juvenile was distributed at the same depth as E. hamata and abundant at 100–400 m. Like E. hamata, Eukrohnia juveniles mainly distributed shallower depths in July (D50%: 143–161 m) than in the other seasons (D50%: 175–206 m). The deepest-distributed species was E. bathypelagica, which occurred at 200–1000 m. Similar to the other species, the vertical distribution of E. bathypelagica was relatively deep in October and February (D50%: 253–356 m) and shallow in April and July (D50%: 253–356 m).
3.4. Population Structure
Body length histograms and depth distributions of the three dominant Chaetognath species (P. elegans, E. hamata, and E. bathypelagica) and Eukrohnia species group (E. hamata + E. bathypelagica) are shown in Figure 4, Figure 5, Figure 6 and Figure 7. The body length of P. elegans ranged from 4 to 34 mm (Figure 4). There were one to three cohorts for the body length of P. elegans at each sampling date. For example, in July, the large body length, having a mean of 25–26 mm, was observed as one cohort both day and night. For the vertical distribution at each body length, the smaller individuals tended to be distributed at shallower depths, and the larger individuals were distributed at deeper layers, which was prominent, especially in October.
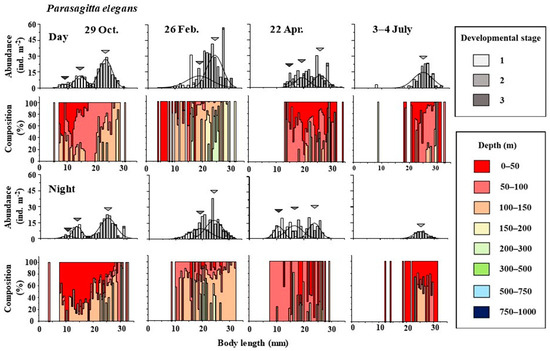
Figure 4.
Seasonal changes in body length histograms and their distribution depths of Parasagitta elagans at St. K2 in the western subarctic Pacific gyre during the daytime (upper) and nighttime (lower) of the four sampling occasions (October 2010, February, April, and July 2011). Triangles denote the mean body lengths of each cohort.
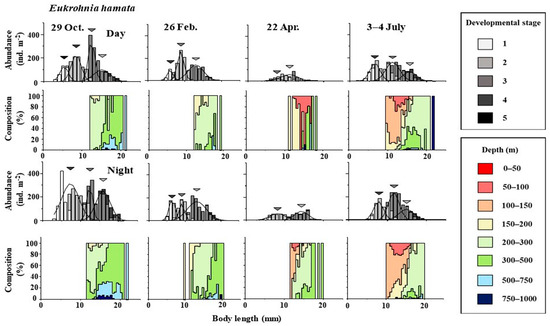
Figure 5.
Seasonal changes in body length histograms and their distribution depths of Eukrohnia hamata at St. K2 in the western subarctic Pacific gyre during the daytime (upper) and nighttime (lower) of the four sampling occasions (October 2010, February, April, and July 2011). Triangles denote the mean body lengths of each cohort. Note that depth distribution data were not shown for the juveniles and were thus presented only for E. hamata at larger body sizes.
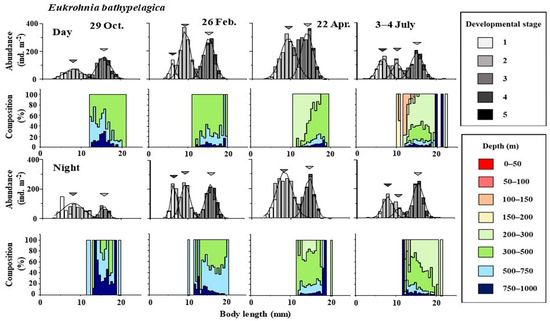
Figure 6.
Seasonal changes in body length histograms and their distribution depths of Eukrohnia bathypelagica at St. K2 in the western subarctic Pacific gyre during the daytime (upper) and nighttime (lower) of the four sampling occasions (October 2010, February, April, and July 2011). Triangles denote the mean body lengths of each cohort. Note that the data for Eukrohnia juveniles were not included in the depth composition panels.
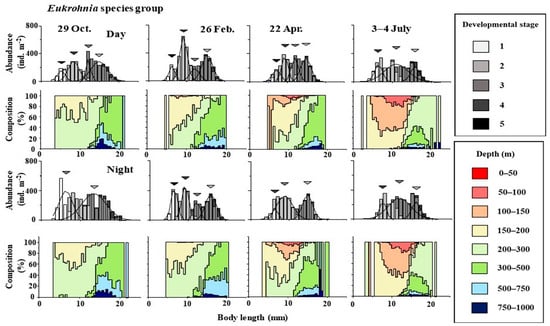
Figure 7.
Seasonal changes in body length histograms and their distribution depths of the Eukrohnia species group (juveniles + E. hamata + E. bathypelagica) at St. K2 in the western subarctic Pacific gyre during the daytime (upper) and nighttime (lower) of the four sampling occasions (October 2010, February, April, and July 2011). Triangles denote the mean body lengths of each cohort.
The body length of E. hamata ranged from 10 to 22 mm (Figure 5). There were two to four cohorts in body length of E. hamata at each sampling date. Within the eight developmental stages based on the criteria of [27], only stage 1–5 individuals have occurred for E. hamata, and stage 6–8 individuals were not present throughout the samples in this study. Commonly, for all seasons, the smaller individuals occurred at the shallower depths, and the larger individuals were distributed at the deeper layer.
The body length of E. bathypelagica ranged from 10 to 22 mm (Figure 6). There were two to three cohorts in body length of E. bathypelagica at each sampling date. However, it should be noted that the small body length cohorts of this species were derived from the combination of Eukrohnia juveniles, as mentioned before. Also, for E. bathypelagica, within the eight developmental stages of maturation based on the E. hamata criteria [27], only stage 1–5 individuals have occurred, and stage 6–8 individuals did not occur throughout the samples. The vertical distribution of E. bathypelagica was shallower in April and July than in October and February, but ontogenetic changes in vertical distribution were not clear for this species.
The body length of Eukrohnia juveniles ranged from 2 to 14 mm (Figure 7). For the Eukrohnia species group (Eukrohnia juvenile + E. hamata + E. bathypelagica), the entire body length ranged from 2 to 22 mm. Within the eight developmental stages based on the E. hamata criteria [27], only stage 1–5 individuals occurred, and stage 6–8 individuals were not present throughout the samples. The Eukrohnia species group showed clear ontogenetic changes in vertical distribution depth. Seasonally, in April and July, the new adults at 8–12 mm body length were distributed at shallower depths than juveniles at 50–200 m. Within adults, vertical distribution became deeper with growth. The largest individuals were found below 200 m. Seasonal changes in vertical distribution were evidenced by the shallowest distribution in July.
The mean body length of each cohort and developmental stage composition of P. elegans, E. hamata, E. bathypelagica, and Eukrohnia species group (Eukrohnia juvenile + E. hamata + E. bathypelagica) are shown in Figure 8. The body lengths were classified into two to four cohorts at each sampling date. However, it should be noted that the number of cohorts varied between day and night, even at the same sampling date for the E. hamata and Eukrohnia species groups in October. Thus, some discrepancies were present. For P. elegans developmental stage composition, stage II dominated throughout the year, while in Eukrohnia, stages II and III dominated.
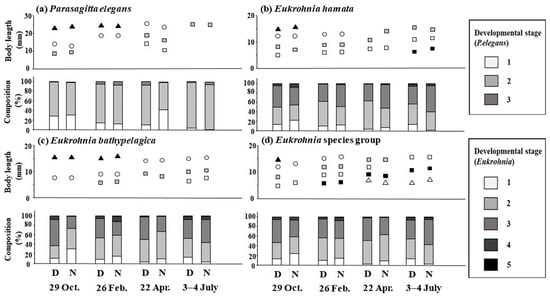
Figure 8.
Seasonal changes in mean body lengths evaluated by cohort analyses for Prasagitta elegans (a), Eukrohnia hamata (b), Eukrohnia bathypelagica (c), and Eukrohnia species group (d) at St. K2 in the western subarctic Pacific gyre during the day (D) and night (N) of the four sampling occasions (October 2010, February, April, and July 2011). Symbols in the body length panels represent the mean body length values of each cohort. For details on each species, see Figure 4, Figure 5, Figure 6 and Figure 7.
4. Discussion
4.1. Abundance and Biomass of Chaetognatha
The dominant Chaetognath species in the western Subarctic Pacific gyre were two species belonging to the genus Eukrohnia (E. hamata and E. bathypelagica) in abundance and P. elegans in terms of biomass (Table 2). These results well correspond with those in the Gulf of Alaska in the eastern subarctic Pacific [15]. To add to these species, Pseudosagitta scrippsae is also listed as the dominant species in the Oyashio region of the western subarctic Pacific [24]. This might be because the research area of [24] was at a lower latitude than this study and had a shallower sampling depth (200 m). In fact, the dominant species in the studies conducted at higher latitudes (basin of the Bering Sea) down to the depth of 3000 m corresponded with this study [25].
Within the three dominant species of this study, P. elegans is known to distribute mainly in the epipelagic zones of the high latitude areas of the Northern Hemisphere, such as the North Pacific, the North Atlantic, and the Arctic Ocean [1,8,30]. On the other hand, the two species of Eukrohnia are thought to have a worldwide distribution, distributed in the epipelagic zones of both the Arctic and Southern Oceans and the deep sea of the lower latitudes [3,4,31,32]. However, such a global distribution of Eukrohnia species has been doubted, and no genetic differences in E. bathypelagica and E. hamata within the same region, geographically four classifications, and the possibility that E. bathypelagica would be a post-spawning individual of E. hamata have been proposed by the mtDNA COI region analyses [17,26]. Furthermore, a genetic study on E. hamata has also been made for the geographic distribution, and the results of [17] have been confirmed to be correct by [33]. Unfortunately, since the genetic analysis of E. bathypelagica has not been made in [33], the genetic correspondence between E. hamata and E. bathypelagica reported in [17,26] has not been tested yet. Thus, this study is the first attempt to treat E. hamata and E. bathypelagica as a single “species group” based on field sampling.
A comparison of the abundance and biomass of the three dominant Chaetognath species in this study with those of the other regions is shown in Table 4. Abundances of P. elegans and E. hamata in this study were similar to or slightly higher than those in the adjacent Oyashio region. The highest abundance of P. elegans (2483–3922 ind. m−2) has been reported in the Celtic Sea and central Long Island Sound in the North Atlantic, where the water depths are shallow (0–37 or 0–90 m) [34,35]. These facts suggest that the abundance of the epipelagic species P. elegans is high in the neritic areas, which are characterized by high primary productivity.

Table 4.
Regional comparison in abundance of the three dominant chaetognath species (Eukrohnia bathypelagica, E. hamata and Parasagitta elegans) from worldwide oceans.
On the other hand, the vertical distribution of E. hamata has been reported to be deeper than that of P. elegans in various oceans, including the Arctic Ocean [36,37], the subarctic Pacific [15,25], and the North Atlantic [38,39]. Since the distribution of E. hamata extended deeper than that of P. elegans, the abundance in the water column (ind. m−2) would be higher for the former than the latter [13,18,24,36,37]. The vertical distribution of E. bathypelagica has been reported to be deeper than that of E. hamata [15,25]. Such restriction of the occurrence depths of E. bathypelagica implies that the abundance of this species remains similar to or slightly lower than that of E. hamata [18,31]. The Eukrohnia is carnivorous, and their primary diet has been reported to be small copepods [2,4,25,36,37,40]. The abundance of the small copepods was high in the shallower depths and low in the deep sea (Figure 2). These facts suggest that the competition for the prey animal (small copepods) would be high in the deep sea, and increasing sizes of head width and hook length of deep-sea Eukrohnia have been reported and interpreted to capture prey animals in the resource-limited deeper layers [25]. Considering these facts, E. bathypelagica, distributed in food-scarce environments, is thought to have a limited abundance due to a limited food supply, although its vertical distribution is wide.
4.2. Vertical Distribution
The vertical distribution of the same three dominant Chaetognath species in this study has been reported in the Gulf of Alaska in the eastern subarctic Pacific, and the distribution depths of P. elegans, E. hamata, and E. bathypelagica are reported to be 0–100 m, 100–500 m, and 250–1000 m, respectively [15]. The same vertical occurrence order of these three species, P. elegans < E. hamata < E. bathypelagica, has also been reported for the western subarctic Pacific and its marginal seas [25]. These facts suggest that this pattern is solid and is commonly observed throughout its occurrence areas.
For the whole zooplankton biomass, bimodal vertical distribution has been reported at St. K2, with peaks at the surface layer and 200–300 m [20,22]. This bimodal vertical distribution has also been observed even for Chaetognaths [22], and P. elegans formed the surface maximum, while a deeper maximum was composed by Eukrohnia species (Figure 3).
This study did not detect diel vertical migration (DVM) for any species (Figure 3). On the other hand, the presence of DVM, in which small specimens occur near the surface layer day and night while large individuals perform nocturnal ascent, has been reported for P. elegans in the Gulf of Alaska and Dabab Bay in Washington [14,41,42,43]. The magnitude of this DVM has been reported to be around 50 m [14]. These facts suggest that the sampling design of this study (minimum depth internal at 25 m) was too large to evaluate such a small DVM.
For the prominent characteristics of the vertical distribution of the Eukrohnia species group, juveniles occurred at the narrower, shallower depths of 150–300 m. E. hamata extended to a deeper layer than juveniles, and then E. bathypelagica extended further deeper than that of E. hamata (Figure 3c). Thus, within Eukrohnia species, their vertical distribution was seen in the order of Eukrohnia juveniles < E. hamata < E. bathypelagica. Such a phenomenon as Eukrohnia (developmental descent) has been reported in the North Pacific [42,44], Arctic Ocean [13,38], and South Ocean [31,40,45]. Thus, such ontogenetic vertical distribution is considered to be a feature of this genus.
Ontogenetic vertical distribution changes in Chaetognaths: deeper occurrences of large-sized specimens have been reported for P. elegans and E. hamata in the Gulf of Alaska [42]. In this study, both P. elegans and E. hamata showed this developmental descent ontogenetic vertical distribution clearly (Figure 4 and Figure 5). Since Chaetognatha are large in body size, they are important as food for various fish [46,47,48]. Therefore, to avoid predation by visual predators such as fish, large-sized specimens may perform a deeper distribution, which would induce ontogenetic vertical distribution.
4.3. Population Structure of Chaetognaths
This study observed two to four cohorts for the body length histograms of P. elegans, E. hamata, and E. bathypelagica (Figure 8). Based on the time-series trace of the body length cohort, life histories of Chaetognaths in the subarctic Pacific were conducted for P. elegans [16,24,49] and E. hamata [18,49] by tracing their cohorts over time. The daily growth rates in body length have been reported as 14–290 μm day−1 in P. elegans and 6–100 µm day−1 in E. hamata (see Table 3 of [31]). Considering these values, maturation of the specimens is possible within three months. However, since the sampling interval of this study is three months (four times in one year), it is difficult to analyze their life cycles by tracing the body length of each cohort.
The most prominent finding of this study is that both Eukrohnia species (E. hamata and E. bathypelagica) had no large mature specimens reported for E. hamata in the Arctic Ocean (Figure 5, Figure 6 and Figure 7). Thus, in the Arctic Ocean, the maturation stages of E. hamata have been classified into eight stages [27]. While only stages belonging to 1 to 5 occurred and no individuals belonging to 6 to 8 stages were observed throughout this study, it is also mentioned that there is a scarce occurrence of mature individuals of E. hamata and E. bathypelagica in the Southern Ocean [3,31]. As the causes of such a low abundance of mature specimens, it is suggested that the deeper occurrence of mature individuals and the long time interval (low time resolution) in sampling design may prevent the appropriate collection of the mature specimens [31].
These two factors (deeper occurrence of mature specimens and failure to collect mature specimens due to insufficient time resolution) are also inevitable in this study; however, considering their vertical distributions (Figure 3), it is hard to assume that only mature E. hamata and E. bathypelagica occur below 1000 m depth. Genetic analyses suggest that E. hamata and E. bathypelagica belong to the same species group and are geographically divided into four species groups [17,26]. The four species groups are reported to occur in different geographical regions: the northern North Pacific, the Southern Ocean, the tropical Pacific, and the Atlantic–Arctic Ocean [17,26]. From these geographical distributions of genetic groups of Eukrohnia species, it is suggested that the population in the northern North Pacific (this study) and that in the Arctic Ocean [27] belong to different cryptic species. If this hypothesis is correct, the cryptic species group of Eukrohnia in the arctic ocean (Ham-B in [17]) has eight stages of maturity. In contrast, the species of E. hamata in the northern North Pacific (Ham-D in [17]) has only five maturation stages.
In terms of the body length of Eukrohnia spp., there are substantial differences between the Arctic Ocean and the northern North Pacific. Thus, the body length of E. hamata (Ham-B) in the Arctic Ocean has been reported to be as large as 41 mm [13,27]. On the other hand, E. hamata (Ham-D) in the northern North Pacific has a maximum body length of 28 mm [15,24] (Figure 5, Figure 6 and Figure 7). Such a large geographical variation in body length may reflect the genetic differences seen in the Eukrohnia species group.
As another point to consider, there are no genetic differences between E. hamata and E. bathypelagica, and they should be treated as one species, as pointed out by [17]. The vertical distribution and population structure of the Eukrohnia species group, which combines Eukrohnia juvenile, E. hamata, and E. bathypelagica, have no difficulty considering or treating one species group (Figure 7). This may suggest that E. hamata and E. bathypelagica are the same species in the western subarctic Pacific. To clarify this point, detailed genetic analysis of the Eukrohnia species group, including Eukrohnia juveniles, small to large individuals of E. hamata, and E. bathypelagica, will be required in future studies.
In conclusion, regional genetic segregation would be present considering the great regional differences in body size and mature stage of Eukrohnia species. Within the same region (especially in the western subarctic Pacific), Eukrohnia species, including E. hamata and E. bathypelagica, could be treated as one species group. Further molecular analysis will be required for the Eukrohnia species group to evaluate these issues.
Author Contributions
Conceptualization, Y.N. and A.Y.; methodology, Y.N. and A.Y.; software, Y.N.; validation, Y.N. and A.Y.; formal analysis, Y.N.; investigation, Y.N.; resources, A.Y.; data curation, A.Y.; writing—original draft preparation, H.Z.; writing—review and editing, A.Y.; visualization, H.Z.; supervision, A.Y.; project administration, A.Y.; funding acquisition, A.Y. All authors have read and agreed to the published version of the manuscript.
Funding
Part of this study was supported by Grant-in-Aid for Challenging Research (Pioneering) 20K20573, Scientific Research 22H00374 (A), 20H03054 (B), 19H03037 (B), and 17H01483 (A) from the Japan Society for the Promotion of Science (JSPS). This study was partially supported by the Arctic Challenge for Sustainability II (ArCS II; JPMXD1420318865) and the Environmental Research and Technology Development Fund (JPMEERF20214002) of the Environmental Restoration and Conservation Agency of Japan.
Institutional Review Board Statement
Not applicable.
Informed Consent Statement
Not applicable.
Data Availability Statement
Data will be available upon request to the corresponding author.
Acknowledgments
We thank the captains, officers, crews, and researchers onboard the R/V Mirai, JAMSTEC, for their great efforts during the field sampling. We thank Minoru Kitamura for allowing us to use the samples for this study.
Conflicts of Interest
The authors declare no conflict of interest.
References
- Kotori, M. The biology of Chaetognatha in the Bering Sea and the northern North Pacific Ocean, with emphasis on Sagitta elegans. Mem. Fac. Fish. Hokkaido Univ. 1976, 23, 95–183. [Google Scholar]
- Øresland, V. Feeding of the chaetognaths Sagitta elegans and S. setosa at different seasons in Gullmarsfjorden, Sweden. Mar. Ecol. Prog. Ser. 1987, 39, 69–79. [Google Scholar] [CrossRef]
- Kruse, S.; Hagen, W.; Bathmann, U. Feeding ecology and energetics of the Antarctic chaetognaths Eukrohnia hamata, E. bathypelagica and E. bathyantarctica. Mar. Biol. 2010, 157, 2289–2302. [Google Scholar] [CrossRef]
- Giesecke, R.; Gonzales, H.E. Distribution and feeding of chaetognaths in the epipelagic zone of the Lazarev Sea (Antarctica) during austral summer. Polar Biol. 2012, 35, 689–703. [Google Scholar] [CrossRef]
- Zavolokin, A.V. Comparative characteristics of food supply of Pacific salmon (Oncorhynchus spp.) in the Bering Sea from 2002 to 2006. J. Ichthyol. 2011, 51, 227–239. [Google Scholar] [CrossRef]
- Yamamura, O.; Funamoto, T.; Chimura, M.; Honda, S.; Oshima, T. Interannual variation in diets of walleye pollock in the Doto area, in relation to climate variation. Mar. Ecol. Prog. Ser. 2013, 491, 221–234. [Google Scholar] [CrossRef][Green Version]
- Beamish, R.J.; Leask, K.D.; Ivanov, O.A.; Balanov, A.A.; Orlov, A.M.; Sinclair, B. The ecology, distribution, and abundance of midwater fishes of the Subarctic Pacific gyres. Prog. Oceanogr. 1999, 43, 399–442. [Google Scholar] [CrossRef]
- Terazaki, M. Life history, distribution, seasonal variability and feeding of the pelagic chaetognath Sagitta elegans in the subarctic Pacific: A review. Plankton Biol. Ecol. 1998, 45, 1–17. [Google Scholar]
- McLaren, I.A. Population and production ecology of zooplankton in Ogac Lake, a landlocked fiord on Baffin Island. J. Fish. Res. Board Can. 1969, 26, 1485–1559. [Google Scholar] [CrossRef]
- Sameoto, D.D. Annual life cycle and production of the chaetognath Sagitta elegans in Berlford Basin, Nova Scotia. J. Fish. Res. Board Can. 1973, 30, 333–344. [Google Scholar] [CrossRef]
- Choe, N.; Deibel, D. Seasonal vertical distribution and population dynamics of the chaetognath Parasagitta elegans in the water column and hyperbenthic zone of Conception Bay, Newfoundland. Mar. Biol. 1986, 137, 847–856. [Google Scholar] [CrossRef]
- Grigor, J.J.; Soreide, J.E.; Varpe, O. Seasonal ecology and life-history strategy of the high-latitude predatory zooplankter Parasagitta elegans. Mar. Ecol. Prog. Ser. 2014, 499, 77–88. [Google Scholar] [CrossRef]
- Kosobokova, K.N.; Hopcroft, R.R. Population structure, vertical distribution and fecundity of Eukrohnia hamata (Chaetognatha) in the Arctic Ocean during summer. Deep-Sea Res. I 2021, 169, 103454. [Google Scholar] [CrossRef]
- King, K.R. The life history and vertical distribution of the chaetognath, Sagitta elegans, in Dabob Bay, Washington. J. Plankton Res. 1979, 1, 153–167. [Google Scholar] [CrossRef]
- Terazaki, M.; Miller, C.B. Life history and vertical distribution of pelagic chaetognaths at Ocean Station P in the subarctic Pacific. Deep-Sea Res. 1986, 33A, 323–337. [Google Scholar] [CrossRef]
- Kotori, M. Life cycle and growth rate of the chaetognath Parasagitta elegans in the northern North Pacific Ocean. Plankton Biol. Ecol. 1999, 46, 153–158. [Google Scholar]
- Miyamoto, H.; Machida, R.J.; Nishida, S. Global phylogeography of the deep-sea pelagic chaetognath Eukrohnia hamata. Prog. Oceanogr. 2012, 104, 99–109. [Google Scholar] [CrossRef]
- Matsumoto, Y.T.; Yamaguchi, A. Seasonal changes in the community structure of chaetognaths and the life cycle of the dominant chaetognath Eukrohnia hamata in the Oyashio region, western subarctic Pacific. Plankton Benthos Res. 2020, 15, 146–155. [Google Scholar] [CrossRef]
- Honda, M.C.; Wakita, M.; Matsumoto, K.; Fujiki, T.; Siswanto, E.; Sasaoka, K.; Kawakami, H.; Mino, Y.; Sukigara, C.; Kitamura, M.; et al. Comparison of carbon cycle between the western Pacifc subarctic and subtropical time-series stations: Highlights of the K2S1 project. J. Oceanogr. 2017, 73, 647–667. [Google Scholar] [CrossRef]
- Kitamura, M.; Kobari, T.; Honda, M.C.; Matsumoto, K.; Sasaoka, K.; Nakamura, R.; Tanabe, K. Seasonal changes in the mesozooplankton biomass and community structure in subarctic and subtropical time-series stations in the western North Pacific. J. Oceanogr. 2016, 72, 387–402. [Google Scholar] [CrossRef]
- Kobari, T.; Nakamura, R.; Unno, K.; Kitamura, M.; Tanabe, K.; Nagafuku, H.; Niibo, A.; Kawakami, H.; Matsumoto, K.; Honda, M.C. Seasonal variability in carbon demand and flux by mesozooplankton communities at subarctic and subtropical sites in the western North Pacific Ocean. J. Oceanogr. 2016, 72, 403–418. [Google Scholar] [CrossRef]
- Steinberg, D.K.; Cope, J.S.; Wilson, S.E.; Kobari, T. A comparison of mesopelagic mesozooplankton community structure in the subtropical and subarctic North Pacific Ocean. Deep-Sea Res. II 2008, 55, 1615–1635. [Google Scholar] [CrossRef]
- Ohashi, R.; Ishii, K.-I.; Fujiki, T.; Kitamura, M.; Matsumoto, K.; Honda, M.C.; Yamaguchi, A. Short-term changes in planktonic community of the western subarctic Pacific during early summer: Analysis of sediment trap samples. Bull. Plankton Soc. Jpn. 2011, 58, 123–135. [Google Scholar]
- Abe, Y.; Miyamoto, H.; Saito, R.; Matsuno, K.; Yamaguchi, A.; Imai, I. Comparative ecology of three dominant pelagic chaetognaths (Eukrohnia hamata, Parasagitta elegans, Pseudosagitta scrippsae) in the Oyashio region during the spring phytoplankton bloom. Reg. Stud. Mar. Sci. 2016, 8, 122–132. [Google Scholar] [CrossRef]
- Ozawa, M.; Yamaguchi, A.; Ikeda, T.; Watanabe, Y.; Ishizaka, J. Abundance and community structure of chaetognaths from the epipelagic through abyssopelagic zones in the western North Pacific and its adjacent seas. Plankton Benthos Res. 2007, 2, 184–197. [Google Scholar] [CrossRef]
- Miyamoto, H.; Machida, R.J.; Nishida, S. Molecular phylogeny of pelagic chaetognaths. Bull. Plankton Soc. Jpn. 2015, 62, 29–32. [Google Scholar]
- Kosobokova, K.N.; Isachenko, A.I. The gonad maturation and size structure of the population of abundant planktonic predator Eukrohnia hamata (Möbius, 1875) (Chaetognatha) in the Eurasian Basin of the Arctic Ocean in summer. Russ. J. Mar. Biol. 2017, 72, 403–418. [Google Scholar] [CrossRef]
- Pennak, R.W. An effective method of diagramming diurnal movements of zooplankton organisms. Ecology 1943, 24, 405–407. [Google Scholar] [CrossRef]
- Aizawa, Y.; Takiguchi, N. Consideration of the methods for estimating age-composition from the length frequency data with MS-Excel. Bull. Jpn. Soc. Fish. Oceanogr. 1999, 63, 205–214. [Google Scholar]
- Pearre, S. Feeding by Chaetognatha: Energy balance and importance of various components of the diet of Sagitta elegans. Mar. Ecol. Prog. Ser. 1981, 5, 45–54. [Google Scholar] [CrossRef]
- Kruse, S.; Bathmann, U.; Brey, T. Meso- and bathypelagic distribution and abundance of chaetognaths in the Atlantic sector of the Southern Ocean. Polar Biol. 2009, 32, 1359–1376. [Google Scholar] [CrossRef][Green Version]
- Bieri, R. The distribution of the planktonic Chaetognatha in the Pacific and their relationship to the water masses. Limnol. Oceanogr. 1959, 4, 1–28. [Google Scholar] [CrossRef]
- Kulagin, D.N.; Stupnikova, A.N.; Neretina, T.V.; Mugue, N.S. Spatial genetic heterogeneity of the cosmopolitan chaetognath Eukrohnia hamata revealed by mitochondrial DNA. Hydrobiologia 2014, 721, 197–207. [Google Scholar] [CrossRef]
- Conway, D.V.P.; Williams, R. Seasonal population structure, vertical distribution and migration of the chaetognath Sagitta elegans in the Celtic Sea. Mar. Biol. 1986, 93, 377–387. [Google Scholar] [CrossRef]
- Tiselius, P.T.; Peterson, W.T. Life history and population dynamics of the chaetognath Sagitta elegans in central Long Island Sound. J. Plankton Res. 1986, 8, 183–195. [Google Scholar] [CrossRef]
- Grigor, J.J.; Schmid, M.S.; Fortier, L. Growth and reproduction of the chaetognaths Eukrohnia hamata and Parasagitta elegans in the Canadian Arctic Ocean: Capital breeding versus income breeding. J. Plankton Res. 2017, 39, 910–929. [Google Scholar] [CrossRef]
- Grigor, J.J.; Schmid, M.S.; Caouette, M.; St.-Onge, V.; Brown, T.A.; Barthelemy, R.-M. Non-carnivorous feeding in Arctic chaetognaths. Prog. Oceanogr. 2020, 186, 102388. [Google Scholar] [CrossRef]
- Sameoto, D.D. Vertical distribution and ecological significance of chaetognaths in the Arctic environment of Baffin Bay. Polar Biol. 1987, 7, 317–328. [Google Scholar] [CrossRef]
- Pierrot-Bults, A.C. A short note on the biogeographic patterns of the Chaetognatha fauna in the North Atlantic. Deep–Sea Res. II 2008, 55, 137–141. [Google Scholar] [CrossRef]
- Øresland, V. Feeding and predation impact of the chaetognath Eukrohnia hamata in Gerlache Strait, Antarctic Peninsula. Mar. Ecol. Prog. Ser. 1990, 63, 201–209. [Google Scholar] [CrossRef]
- Brodeur, R.D.; Terazaki, M. Springtime abundance of chaetognaths in the shelf region of the northern Gulf of Alaska, with observations on the vertical distribution and feeding of Sagitta elegans. Fish. Oceeanogr. 1999, 8, 93–103. [Google Scholar] [CrossRef]
- Sullivan, B.K. In situ feeding behavior of Sagittcl elegans and Eukrohnia hamata (Chaetognatha) in relation to the vertical distribution and abundance of prey at Ocean Station “P”. Limnol. Oceanogr. 1980, 25, 317–326. [Google Scholar] [CrossRef]
- Matsuda, S.; Taniguchi, A. Diel changes in vertical distribution and feeding conditions of the chaetognath Parasagitta elegans (Verill) in the subarctic Pacific in summer. J. Oceanogr. 2001, 57, 353–360. [Google Scholar] [CrossRef]
- Johnson, T.B.; Terazaki, M. Species composition and depth distribution of chaetognaths in a Kuroshio warm-core ring and Oyashio water. J. Plankton Res. 2003, 25, 1279–1289. [Google Scholar] [CrossRef]
- Øresland, V. Winter population structure and feeding of the chaetognath Eukrohnia hamata and the copepod Euchaeta antarctica in Gerlache Strait, Antarctic Peninsula. Mar. Ecol. Prog. Ser. 1995, 119, 77–86. [Google Scholar] [CrossRef]
- Nishiuchi, K. Study on the Life History and Annual Variability of the Carnivorous Planktonic Chaetognaths in the Northern North Pacific Ocean. Ph.D. Thesis, Hokkaido University, Sapporo, Japan, 1999. [Google Scholar]
- Moku, M.; Kawaguchi, K.; Watanabe, H.; Ohno, A. Feeding habits of three dominant myctophid fishes, Diaphus theta, Stenobrachius leucopsarus and S. nannochir, in the subarctic and transitional waters of the western North Pacific. Mar. Ecol. Prog. Ser. 2000, 207, 129–140. [Google Scholar] [CrossRef]
- Yamamura, O.; Honda, S.; Shida, O.; Hamatsu, T. Diets of walleye pollock Theragra chalcogramma in the Doto area, northern Japan: Ontogenetic and seasonal variations. Mar. Ecol. Prog. Ser. 2002, 238, 187–198. [Google Scholar] [CrossRef]
- Terazaki, M.; Miller, C.B. Reproduction of meso- and bathypelagic chaetognaths in the genus Eukrohnia. Mar. Biol. 1982, 71, 193–196. [Google Scholar] [CrossRef]
Disclaimer/Publisher’s Note: The statements, opinions and data contained in all publications are solely those of the individual author(s) and contributor(s) and not of MDPI and/or the editor(s). MDPI and/or the editor(s) disclaim responsibility for any injury to people or property resulting from any ideas, methods, instructions or products referred to in the content. |
© 2023 by the authors. Licensee MDPI, Basel, Switzerland. This article is an open access article distributed under the terms and conditions of the Creative Commons Attribution (CC BY) license (https://creativecommons.org/licenses/by/4.0/).