Article

Comparison of Two Methods for Measuring Sea Surface Temperature When Surfing

1
College of Life and Environmental Sciences, University of Exeter, Penryn Campus, Cornwall TR10 9FE, UK
2
Plymouth Marine Laboratory, Plymouth, Devon PL1 3DH, UK
3
Department of Marine and Environmental Sciences, Halmos College of Natural Sciences and Oceanography, Nova Southeastern University, Dania Beach, FL 33004, USA
4
Scripps Institution of Oceanography, University of California, San Diego, CA 92037, USA
5
Lost Bird Project, New York, NY 10024, USA
6
Department of Geography and Planning, University of Liverpool, Liverpool L69 3BX, UK
7
School of Biological & Marine Sciences, University of Plymouth, Plymouth, Devon PL4 8AA, UK
8
The Marine Biological Association, The Laboratory, Citadel Hill, Plymouth, Devon PL1 2PB, UK
9
National Centre for Earth Observation, Plymouth Marine Laboratory, Plymouth, Devon PL1 3DH, UK
*
Author to whom correspondence should be addressed.
Oceans 2020, 1(1), 6-26; https://doi.org/10.3390/oceans1010002
Submission received: 22 November 2019 / Revised: 18 December 2019 / Accepted: 3 January 2020 / Published: 8 January 2020

Abstract

:
Nearshore coastal waters are among the most dynamic regions on the planet and difficult to sample from conventional oceanographic platforms. It has been suggested that environmental sampling of the nearshore could be improved by mobilising vast numbers of citizens who partake in marine recreational sports, like surfing. In this paper, we compared two approaches for measuring sea surface temperature (SST), an Essential Climate Variable, when surfing. One technique involved attaching a commercially-available miniature temperature logger (Onset UTBI-001 TidbiT v2) to the leash of the surfboard (tether connecting surfer and surfboard) and the second, attaching a surfboard fin (Smartfin) that contained an environmental sensor package. Between July 2017 and July 2018, 148 surfing sessions took place, 90 in the southwest UK and 58 in San Diego, California, USA. During these sessions, both Smartfin and leash sensors were deployed simultaneously. On the leash, two TidbiT v2 sensors were attached, one with (denoted LP) and one without (denoted LU) a protective boot, designed to shield the sensor from sunlight. The median temperature from each technique, during each surfing session, was extracted and compared along with independent water temperature data from a nearby pier and benthic logger, and matched with photosynthetically available radiation (PAR) data from satellite observations (used as a proxy for solar radiation during each surf). Results indicate a mean difference ( δ ) of 0.13 °C and mean absolute difference ( ϵ ) of 0.14 °C between Smartfin and LU, and a δ of 0.04 °C and an ϵ of 0.06 °C between Smartfin and LP. For UK measurements, we observed better agreement between methods ( δ = 0.07 °C and ϵ = 0.08 °C between Smartfin and LU, and δ = 0.00 °C and ϵ = 0.03 °C between Smartfin and LP) when compared with measurements in San Diego ( δ = 0.22 °C and ϵ = 0.23 °C between Smartfin and LU, and δ = 0.08 °C and ϵ = 0.11 °C between Smartfin and LP). Surfing SST data were found to agree well, in general, with independent temperature data from a nearby pier and benthic logger. Differences in SST between leash and Smartfin were found to correlate with PAR, both for the unprotected (LU) and protected (LP) TidbiT v2 sensors, explaining the regional differences in the comparison (PAR generally higher during US surfing sessions than UK sessions). Considering that the Smartfin is sheltered from ambient light by the surfboard, unlike the leash, results indicate the leash TidbiT v2 sensors warm with exposure to sunlight biasing the SST data positively, a result consistent with published tests on similar sensors in shallow waters. We matched all LU data collected prior to this study with satellite PAR products and corrected for solar heating. Results highlight the need to design temperature sensor packages that minimise exposure from solar heating when towed in the surface ocean.

Graphical Abstract

1. Introduction

The nearshore coastal ocean (including the intertidal and subtidal regions) supports a wide range of ecosystem goods and services, for example: habitat provision for important algal and fish species [1,2], biodiversity maintenance [3], recreation [4], and carbon cycling and sequestration [5]. With over half the world’s human population living near the coast [6], the nearshore communities are exposed to multiple anthropogenic stressors and vulnerable to the effects of climate change [7,8,9,10,11,12]. Environmental monitoring of the nearshore is key to managing these threats. However, monitoring the nearshore by conventional means (e.g., using research vessels, autonomous platforms and buoys) is challenging, as it is among the most variable environments on the planet (both spatially and temporally).
Innovative solutions to monitoring the nearshore are being developed, for example: the tagging of marine vertebrates with sensors [13], coastal gliders [14], autonomous beach buoy systems [15,16], benthic data loggers [17], and new and improved satellite sensors and satellite data processing techniques [18]. One solution gaining momentum is the integration of miniaturised environmental sensors into watersports equipment. New evidence has suggested that environmental monitoring in the nearshore could be drastically improved by harnessing vast numbers of citizens who partake in marine recreational sports [19]. To date, there have been studies looking at the use of divers [20,21,22], fishermen [23], stand-up paddle boarders [24], kayakers [25], sailors [26], and surfers [27,28]. Measurements of water temperature (both at the surface and subsurface) have been a target of many of these studies, for two reasons: (1) temperature sensors are relatively cheap, small, and accurate, and consequently fairly easy to integrate into watersports equipment; and (2) water temperature is considered by the Global Climate Observing System as an Essential Climate Variable (ECV) [29,30] and by the Intergovernmental Panel on Climate Change (IPCC) as a key driver of climate change impacting coastal systems [31].
Surfers are a natural target group for citizen science studies, with many intrinsically connected with the functioning and state of the environment, surfing all year round, and advocating environmental protection [32,33]. To date, two approaches have been proposed for integrating sensors into surfing equipment for monitoring sea surface temperature (SST) in nearshore waters. Brewin et al. [27] equipped a recreational surfer with a miniature, commercially-available temperature sensor (Onset UTBI-001 TidbiT v2, Onset Computer Corporation, Bourne, MA, USA), attached to the leash of a surfboard (tether connecting surfer and surfboard, see Figure 1) that the surfer used when surfing for a period of one year (85 sessions), together with a GPS device worn under the wetsuit. This proof-of-concept study demonstrated that accurate SST data can be collected by surfers (evaluated though comparison with independent data), and are useful for assessing the performance of satellite observations of SST in the nearshore [34,35]. A second technique, proposed by Bresnahan et al. [28], is the integration of an environmental sensor package into a surfboard fin (Smartfin, see [36] and Figure 1). The Smartfin is a similar size and weight to a normal surfboard fin, but capable of recording temperature, motion, and geo-location, with plans to integrate biogeochemical sensors in future iterations. The Smartfin is well-suited for citizen science, making use of wireless data transfer and charging capabilities, mobile data upload, and cloud-based data storage and processing.
To motivate the scientific community to use data collected in citizen science programmes requires addressing and maximising data quality [37,38]. This can be done through training and protocols, cross-checking with existing datasets, validation, sensor calibrations, monitoring of sensor drift and stability, database management, and data filtering [19]. Emerging techniques need to be carefully evaluated and uncertainties in measurements need to be quantified. For example, it has been shown that some miniature, commercially-available temperature sensors (similar to that used in the Brewin et al. [27] study) can be vulnerable to solar heating when exposed to high irradiance, biasing the data positively [39].
In this paper, we compare two approaches for measuring SST when surfing, with a view towards quantifying accuracy and uncertainties in the techniques, and determining differences in approach. Over the period of one year (148 surfing sessions), the two techniques were run simultaneously by surfers. In addition, SST data collected by the surfers using the two techniques were compared with independent water temperature data from a nearby pier and benthic logger. SST observations were matched with photosynthetically available radiation (PAR) data acquired from satellite observations, to investigate influence of solar irradiance on data collection.

2. Methodology

2.1. Equipment

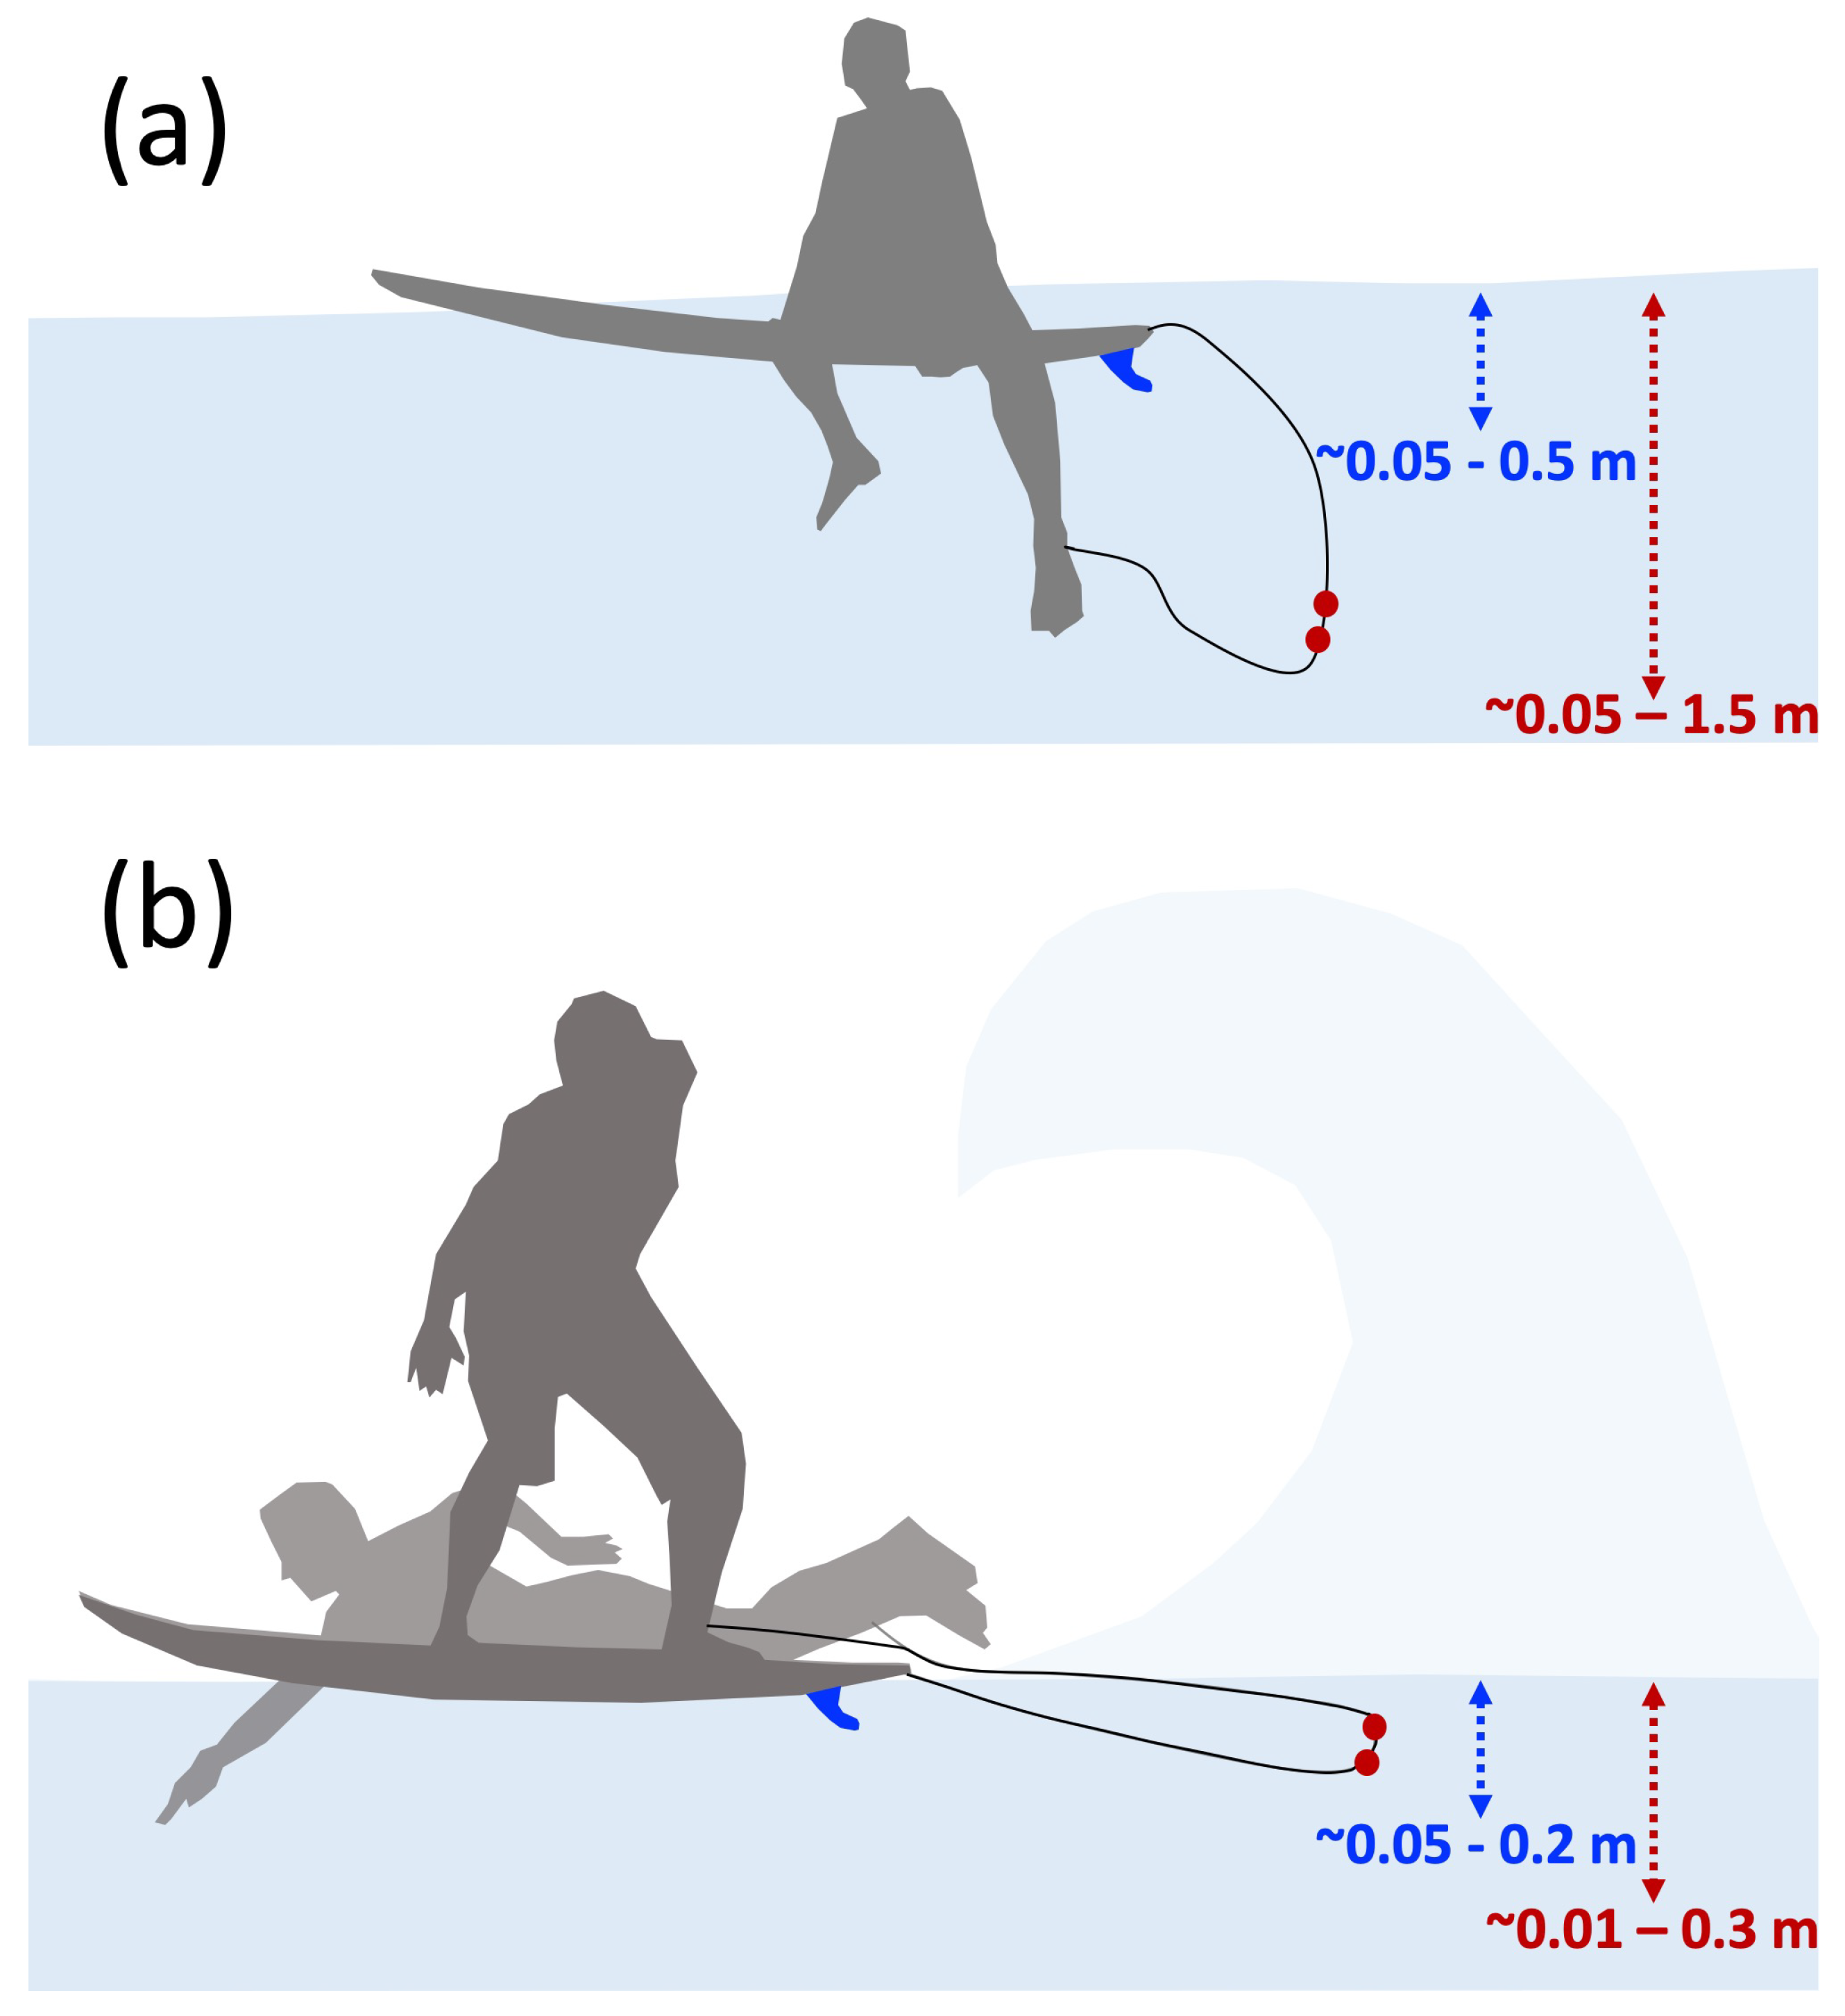
Figure 1 shows the experimental set-up used in the study. Temperature sensors were integrated into the surfing equipment of three participants (two in the UK and one in the US). Each participant was provided with a Smartfin, which was attached to the underside of a surfboard with a Futures Fins box, and two TidbiT v2 sensors, which were attached using cable ties to the mid-point of the surfboard leash (tether connecting surfer and surfboard). One of the two TidbiT v2 sensors was covered with a white protective boot (Onset TidbiT v2 Protective Boot), designed to protect the sensor from sunlight, and secured with a cable tie.
The Smartfin was charged in advance of each surfing session. Before entering the water, the surfer launched the Smartfin, either through magnet (swiped) or motion (tapping). During each surfing session, the Smartfin recorded temperature continuously at 1/6 Hz using two different temperature sensors, one placed within the body (motherboard) of the Smartfin (internal), the other placed the tip of the fin (external). The external temperature sensor being a MAX31725 temperature circuit (see [28] for technical details) sitting at a depth of 0.1 m from the base of the surfboard. The Smartfin samples between approximately 0.05 m and 0.5 m depth when the surfer is stationary, and 0.05 and 0.2 m when the surfer is moving (paddling or surfing, see Figure 2). Both sensors on each Smartfin were calibrated in a recirculating insulated cooler that had temperature controlled seawater pumped through a heat exchanger by a Thermo Scientific NESLAB RTE7 circulating bath/chiller (Newington, NH, USA). Temperature was varied from 10 to 30 °C (or 15 to 30 °C, depending on the batch of fins) at 5 °C intervals. The analog to digital counts (or voltages) from the Smartfin sensors were calibrated to a Seabird MicroCAT (Bellevue, WA, USA), with an accuracy of 0.002 °C in the range −5 to 35 °C, using linear regression. In addition to measuring temperature, the Smartfin continuously measured motion in four different directions (inbuilt accelerometer, gyroscope and magnetometer: MPU9250) at 5 Hz, and location (inbuilt GPS receiver) at ∼1/4 Hz. After each surf session, the participant uploaded data from the Smartfin to a mobile phone app using Bluetooth. Once on the mobile phone, data were then uploaded onto the Smartfin data server where it can be accessed freely. For each surf, two separate time-stamped files containing the temperature and motion/GPS data were downloaded from the Smartfin server. A total of seven different Smartfins were used throughout the duration of the study by the three participants.
The TidbiT v2 data loggers used by the surfers were recalibrated in the laboratory for the study. In the UK, the loggers were calibrated to a VWR 1620-200 traceable digital thermometer (NIST/ISO calibrated, with an accuracy of 0.05 °C at the range of 0 to 100 °C and a resolution of 0.001 °C) at four intervals between 5 to 25 °C using a PolyScience temperature bath (PolyScience, Niles, IL, USA). Systematic offsets between TidbiT v2 sensors and the VWR1620-200 data were removed from the TidbiT v2 measurements, to improve their accuracy.
We compared external Smartfins sensors (calibrated to the MicroCAT in the US) with TidbiT v2 sensors (calibrated using the VWR1620-200 in the UK) in the PolyScience temperature bath over the same temperature range, and found average differences to be <0.05 °C (i.e., within the accuracy of the VWR1620-200 thermometer). In the US, the TidbiT v2 data loggers were calibrated in the same manner as the Smartfins (using the Seabird MicroCAT), with systematic offsets between TidbiT v2 and the MicroCAT data removed from the TidbiT v2 measurements. HOBOware software (Onset Computer Corporation, Bourne, MA, USA) and HOBO USB Optic Base Station (BASE-U-4) were used by the surfer to launch the TidbiT v2 temperature logger prior to each surfing session, and then to upload data post session (see [34]). Temperature data were collected at 1/10 Hz during each deployment using the TidbiT v2 loggers. The loggers sample between approximately 0.05 m and 1.5 m depth when the surfer is stationary, and 0.01 and 0.3 m when the surfer is moving (paddling or surfing, see Figure 2). A total of eight TidbiT v2 loggers were used throughout the duration of the study by the three participants. The time stamp of the TidbiT v2 loggers and Smartfin data were regularly monitored, and in cases where differences were seen (in 6 of the 148 surfing sessions), TidbiT v2 time stamps were synced to Smartfin during the post processing of the data by aligning the times the instruments were switched on.

2.2. Processing of Smartfin and Tidbit v2 Temperature Data

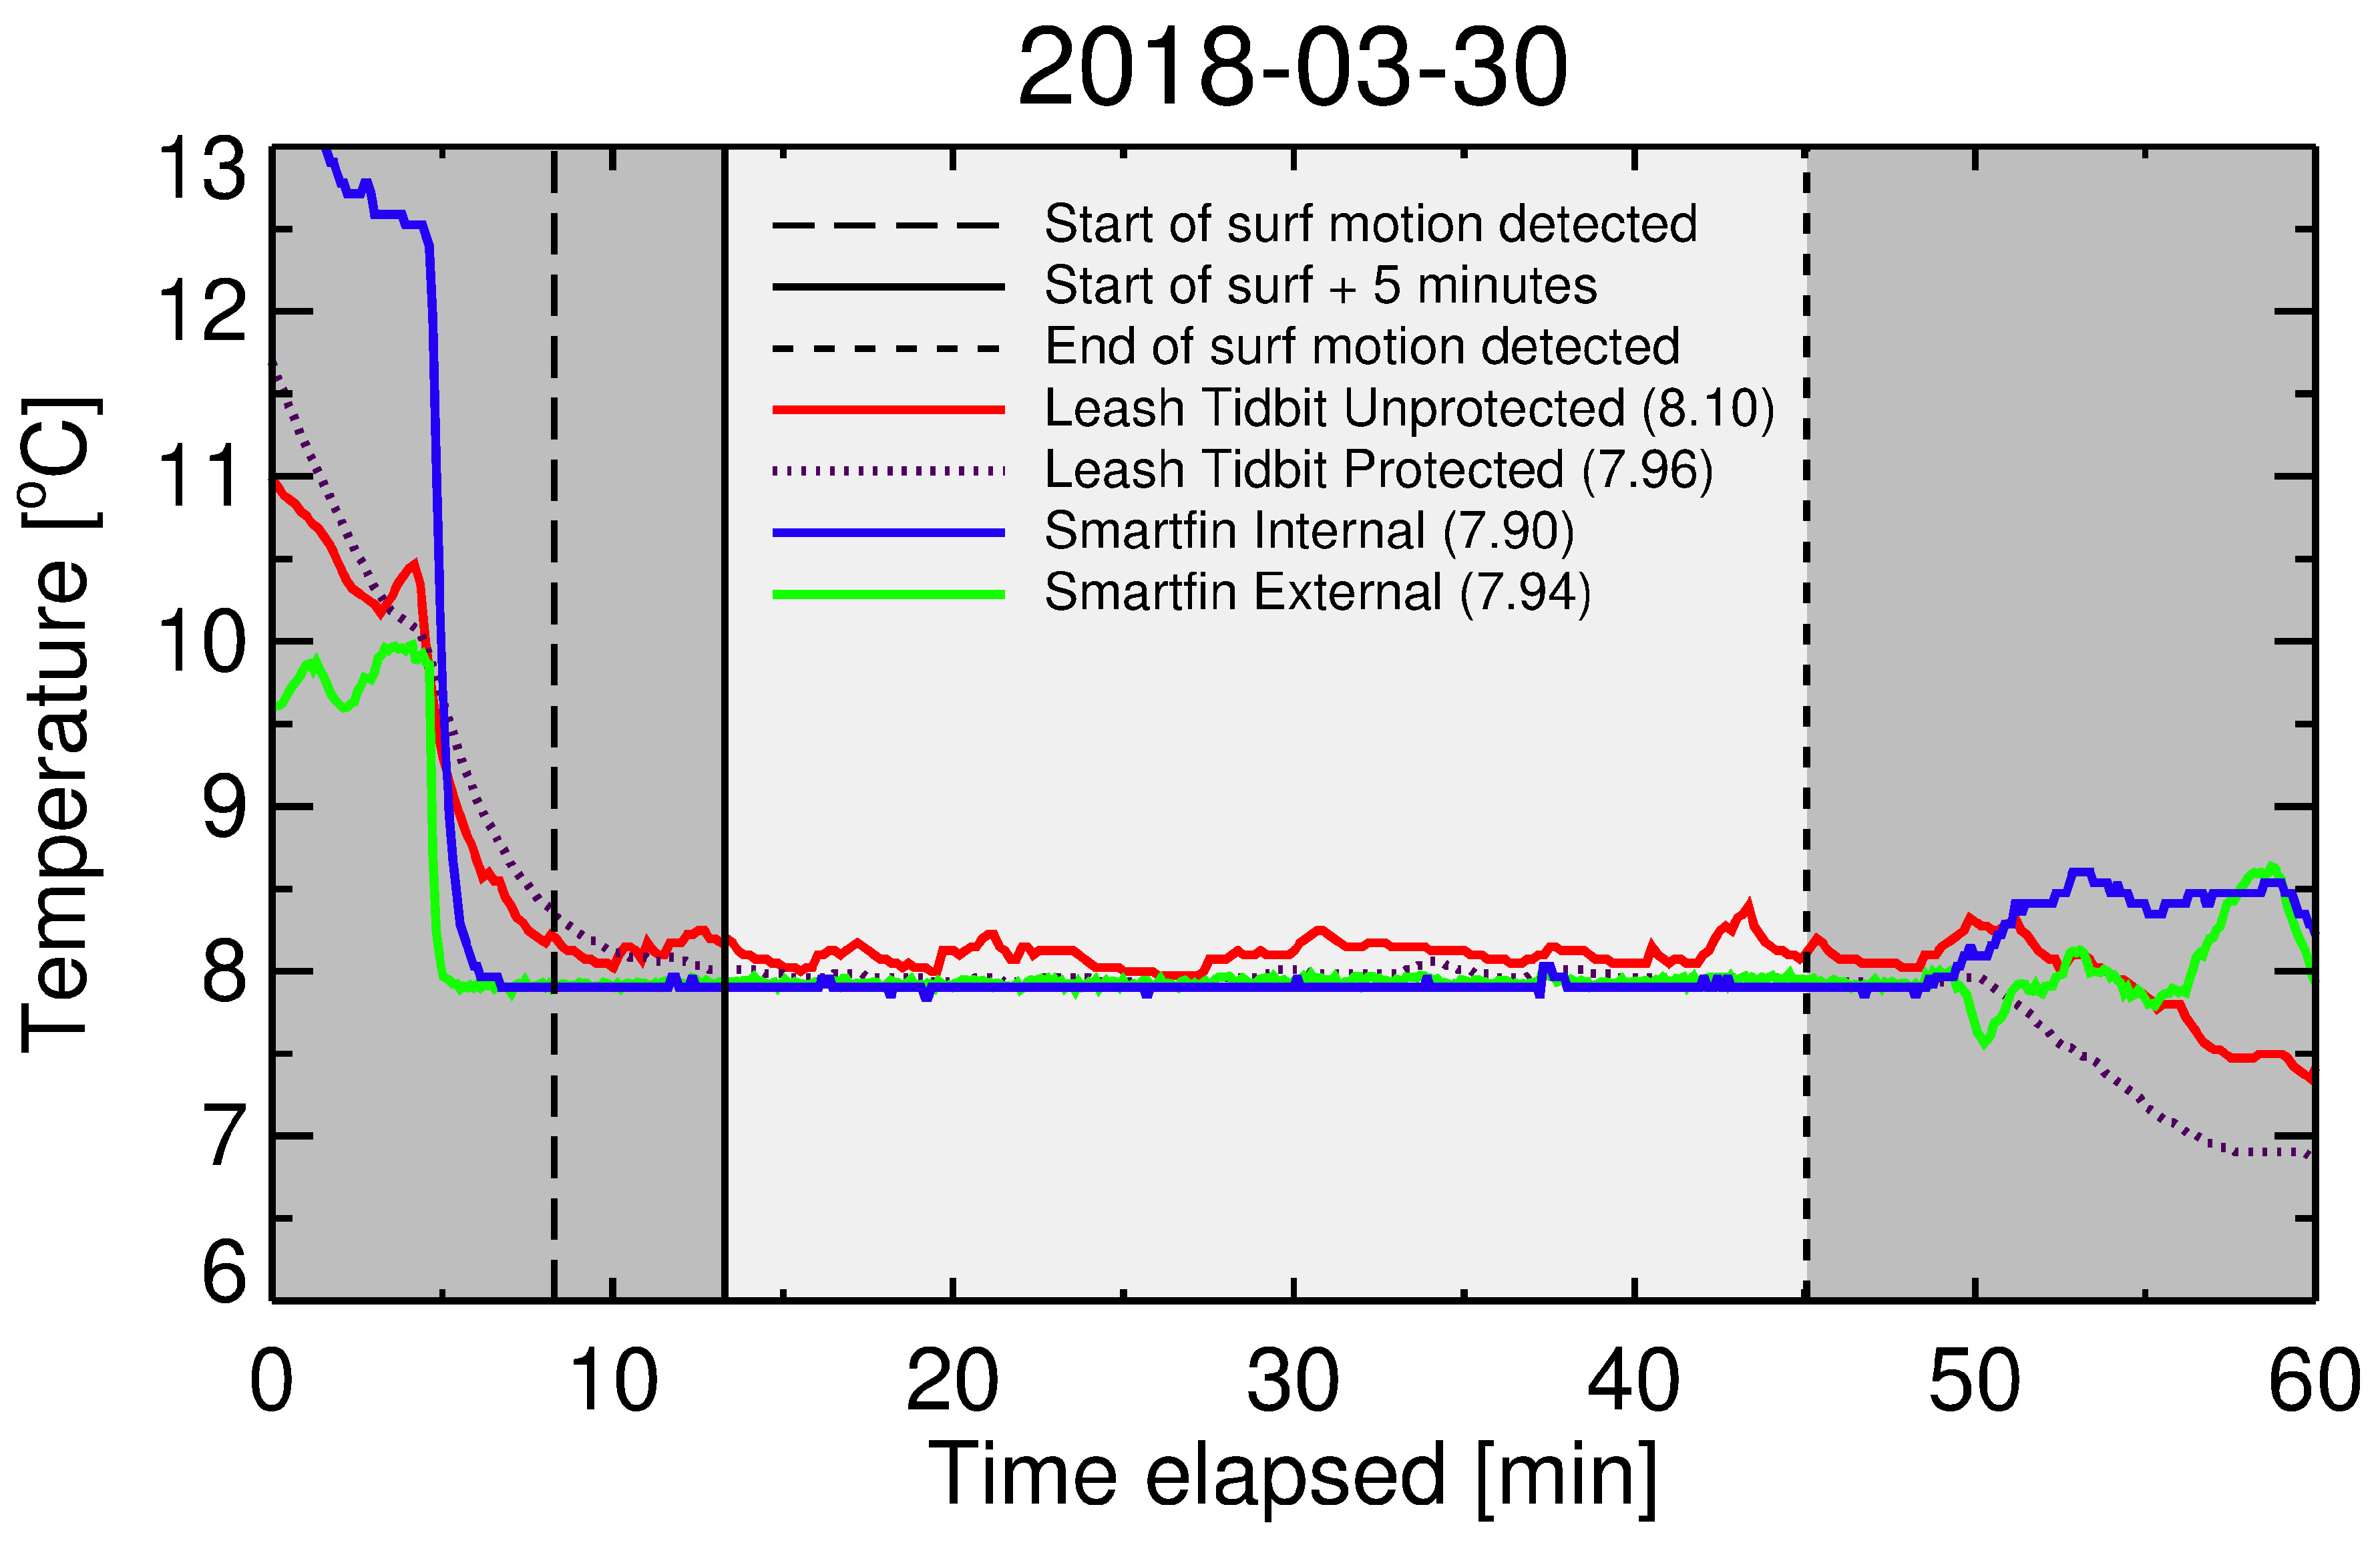
To extract SST from each surfing session required determining the start (time the surfer entered the water) and finish (time surfer exited the water) of the session. As there was no water detection sensor on the versions of the Smartfin used in this study, we adopted a method developed and tested by the Smartfin team (Cyronak et al. In Prep). This involved making use of the Smartfin motion data. Firstly, each axis (x, y and z) of the high frequency (5 Hz) acceleration data ( a x , a y , and a z ) were smoothed using a 5 min running mean. The moving variance (same window) of all acceleration axes data combined (denoted here as a v ) was also computed, which is useful for determining if the board is completely at rest (e.g., sitting on the beach). Bounds of a v , a x , a y and a z were then used to determine when the Smartfin was being surfed. These bounds were empirically determined through visual analysis of large volumes of Smartfin data (Cyronak et al. In Prep). This technique was found to work remarkably well when compared with other methods based solely on temperature [34]. Having determined the times the surfer was surfing, the start and end times were extracted from the Smartfin motion files (Figure 3). On three occasions, there were issues with the motion data (e.g., battery ran out towards the end of the session), so the start and end times were extracted manually, based on a visual inspection of the temperature data for those sessions.
As the response times of all sensors varied, with the Smartfin external sensor responding the quickest, and TidbiT v2 with Protective Boot the slowest, we added 5 min to the start time (i.e., removed the first 5 min of in-water data) to ensure that all sensors had responded to the water temperature (Figure 3). For each sensor, all temperature data collected from the point the sensors had responded to the water temperature (start time + 5 min) to the time the surfer exited the water (finish time) were extracted, and the median temperature for each sensor assigned as the SST for that session. We used the median (rather than mean) as it is fairly resistant to outliers and thus to any errors in the derived start and finish points. An example of the data processing from a session on the 30 March 2018 in the southwest UK is provided in Figure 3. In addition, we extracted the median latitude and longitude from either the Smartfin, or by a Garmin GPS (eTrex 10, Lenexa, KS, USA) worn under the wetsuit, during the times the surfer collected this data, for georeferencing the SST measurements. For one surf, no GPS data were available, so the beach coordinates were logged after the session.

2.3. Study Sites

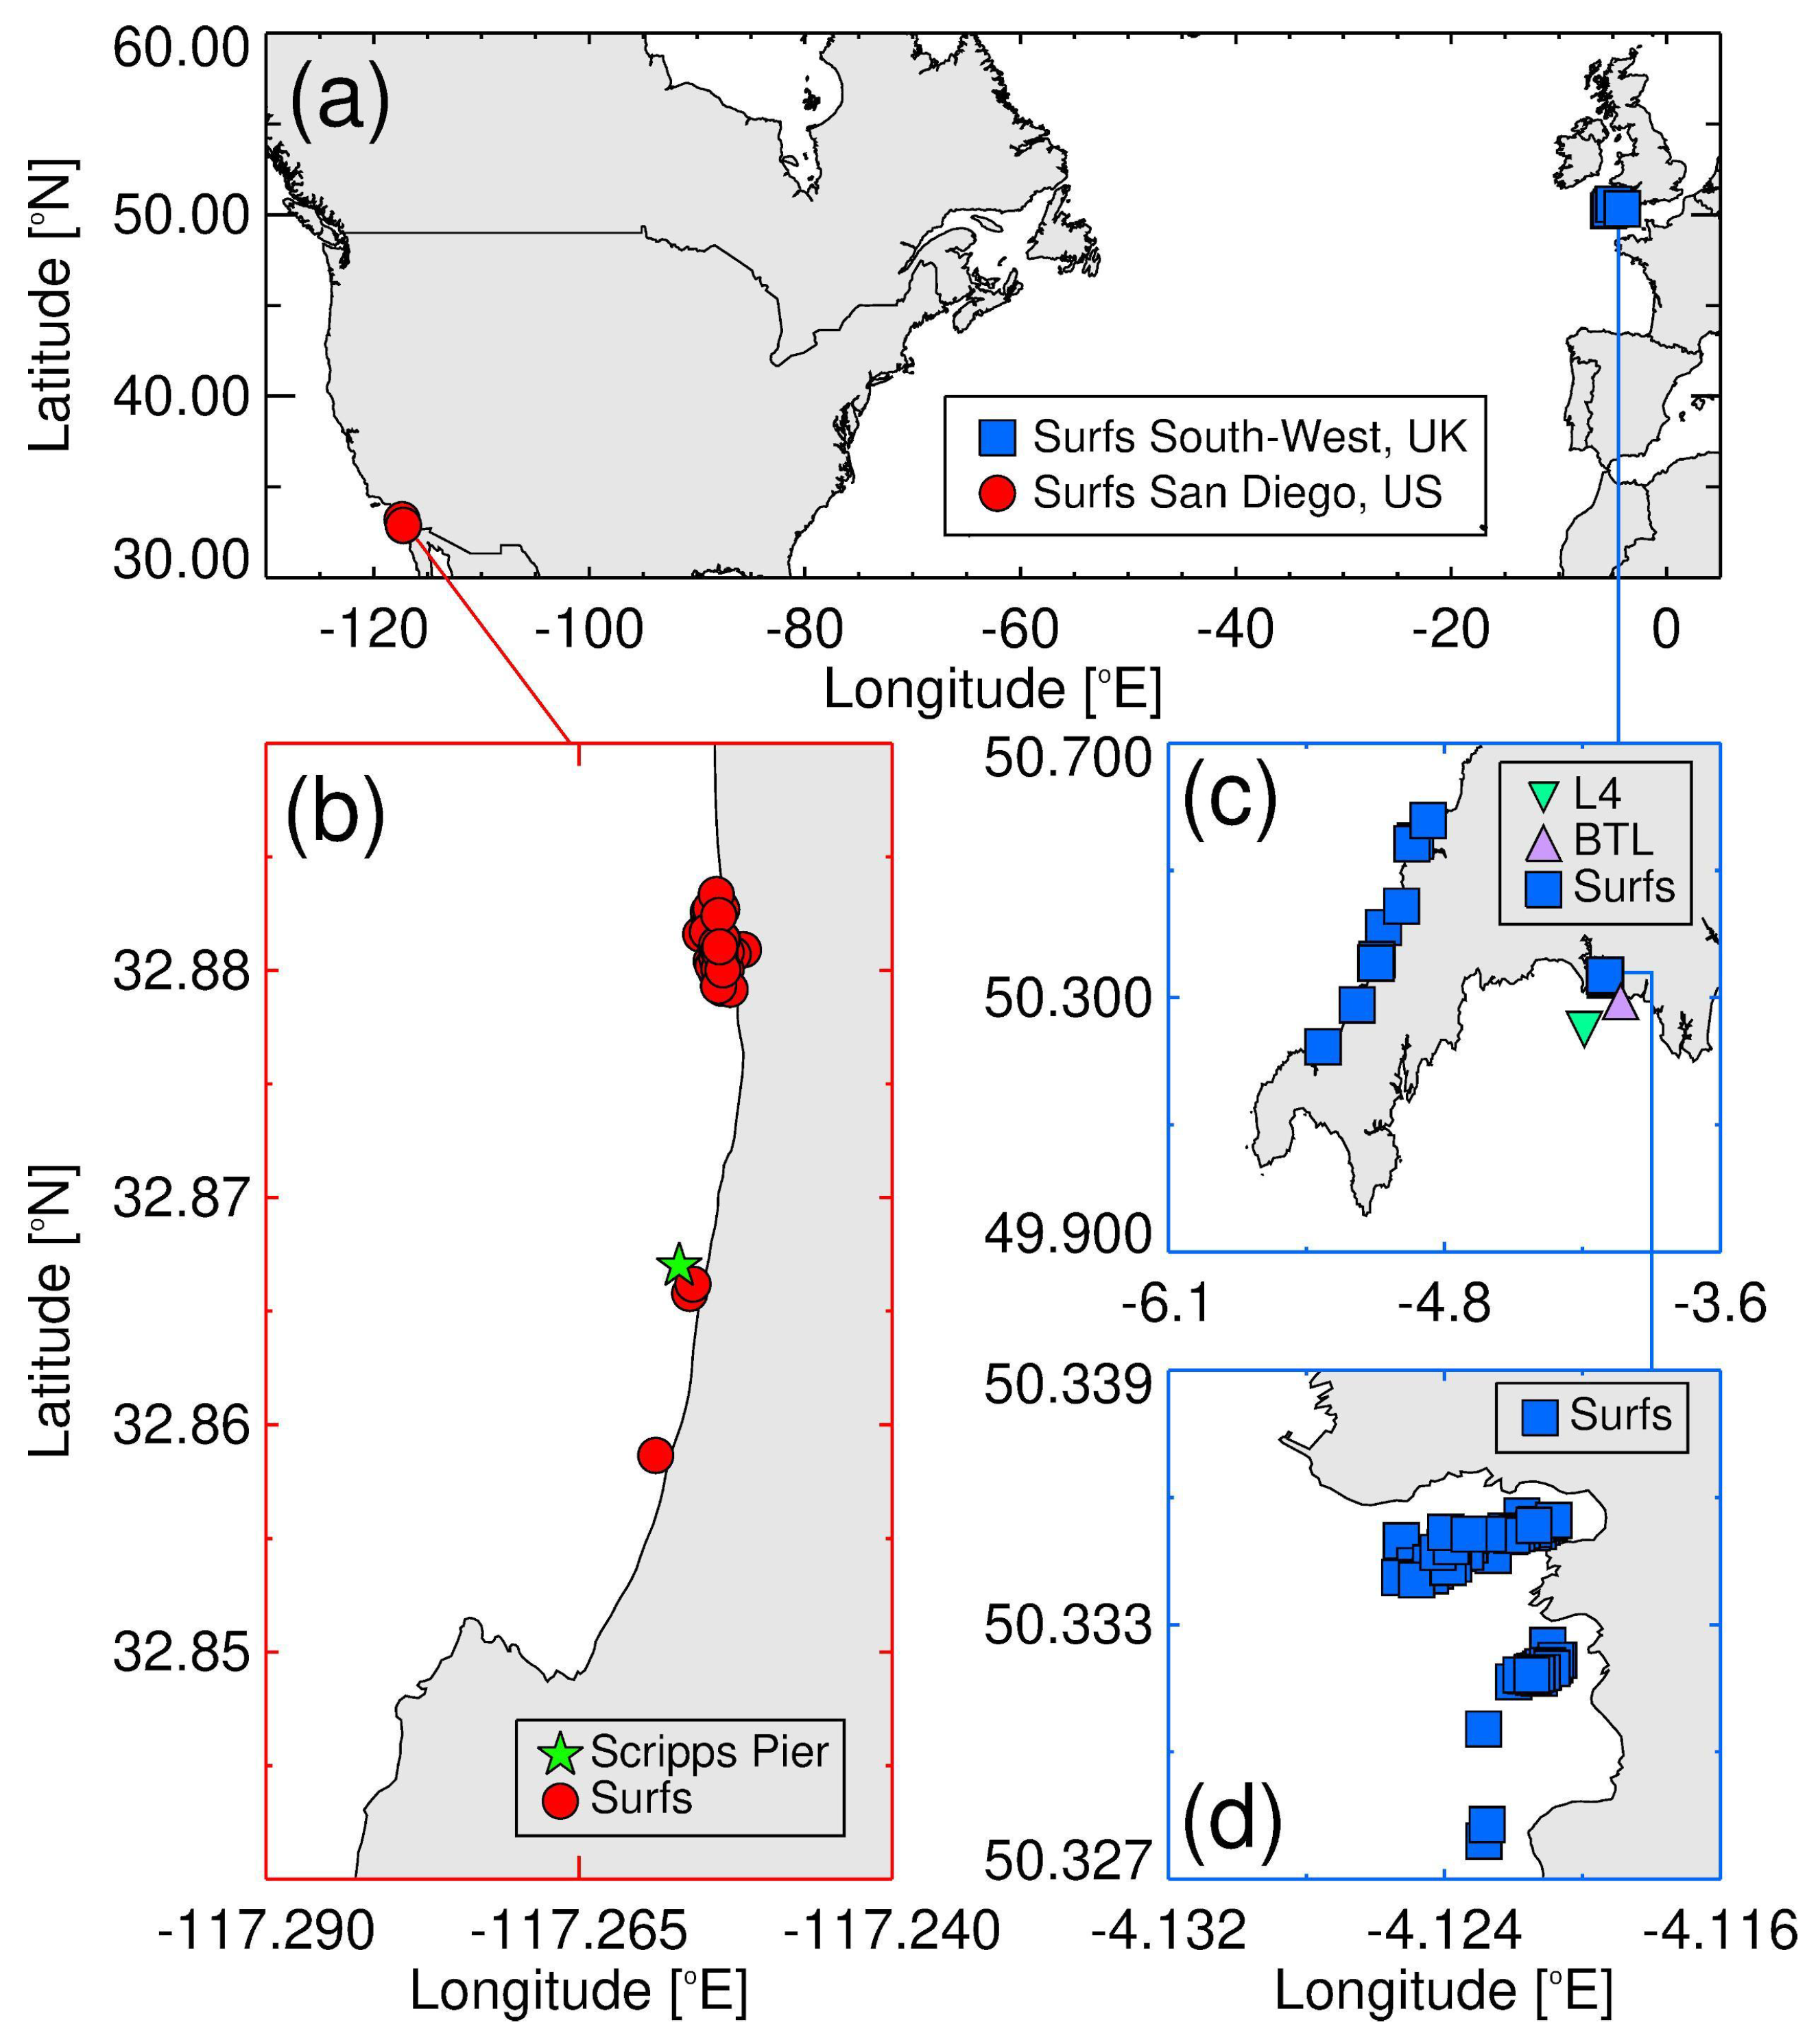
A total of 148 surfing sessions took place during the study, 90 in the southwest UK and 58 in San Diego, CA, USA (Figure 4a). Data collected in San Diego were predominately (57 sessions) from a stretch of coastline between La Jolla Shores and Black’s Beach, north and south of Scripps Pier (Figure 4b). These data were collected between February and June 2018. In the UK, data were collected between July 2017 and July 2018 around the coastline of Devon and Cornwall (Figure 4c), with the most of data (81 sessions) collected at Bovisand Beach in Plymouth (Figure 4d).
Of the 148 surf sessions, all three sensors (Smartfin, TidbiT v2 unprotected and TidbiT v2 protected) were deployed simultaneously in 134 sessions. For the remaining 14 sessions, either TidbiT v2 unprotected or TidbiT v2 protected were used with the Smartfin. In total, there were were 141 simultaneous sessions with Smartfin and TidbiT v2 unprotected and 141 Smartfin and TidbiT v2 protected. The majority of data were collected during conditions preferable for surfing, though some measurements were collected in calm seas during surfer paddle training.

2.4. Auxiliary Datasets

2.4.1. Independent Temperature Measurements from Piers, Buoys, and Benthic Loggers

Time-series data of water temperature, independent to that collected by the surfers, were acquired close to the location of the majority of surfing sessions. In the US, we extracted a time-series of water temperature data (collected every 4–5 min) from the automated shore station instrument package at Scripps pier (located at ∼3 m depth), in the first half of 2018 (Figure 4b). The instrument package includes a Seabird SBE 16plus SeaCAT Conductivity, Temperature, and Pressure recorder (with an accuracy of 0.005 °C at the range of −1 to 32 °C). The data reside on the SCCOOS ERDDAP and THREDDS catalogs: http://sccoos.org/thredds/catalog/autoss/catalog.html?dataset=autoss/scripps_pier-2018.nc.
In the UK, we used an annual time-series of shallow-water benthic temperature data (20–30 min resolution) collected on a kelp-covered reef at a depth of 3 m below chart datum, 6 km from Bovisand beach (Latitude = 50.2937° N, Longitude = −4.0529° N), where the majority of UK data were collected. A TidbiT v2 data logger was deployed and maintained on the kelp covered reef. Every six months, the data logger was retrieved by scuba divers and data were uploaded using HOBOware software and HOBO USB Optic Base Station (BASE-U-4) onto a laptop, then the logger was relaunched and reattached by scuba divers at the same location. This provided a continuous time-series of water temperature measurements at the kelp site over the period of the study, July 2017 to July 2018. Unlike the TidbiT v2 sensor on the surfboard leash, these sensors were not recalibrated in the laboratory. Manufacturers report an accuracy of 0.2 °C over a range of 0 to 50 °C, and a stability of ∼0.1 °C per year for the TidbiT v2 sensors.
SST data were also acquired from Station L4 in the Western Channel Observatory (WCO) (latitude = 50.250° N, longitude = −4.217° E), located ∼7 km from the coastline (Figure 4b), from January 2014 to July 2017. At station L4, an autonomous buoy is operated, equipped with a WET Labs Water Quality Monitor (Philomath, OR, USA) (WQM), which incorporates a Sea-Bird CTD sensor, which records water temperature. The WQM is mounted on a marine-grade stainless steel cage and situated in a moon pool (an opening in the floatation) at a fixed depth of 1 m. The WQM records SST at hourly intervals, with an accuracy of 0.002 °C at a range of −5 to 35 °C, and a resolution of 0.001 °C (see [40]). Quality controlled datasets on SST were downloaded from the Western Channel Observatory website (http://www.westernchannelobservatory.org.uk/data/buoy/) between January 2014 and July 2018, with some gaps in the datasets from buoy maintenance and downtime.
All auxiliary datasets were matched (with a time difference of ≤1 h) to nearby co-incident SST measurements collected by the surfers. The Scripps pier data and the benthic temperature logger data were matched to surfing sessions with simultaneous deployment of sensors, as described in Section 2.3, and the L4 data matched with a historic SST dataset collected using the leash method [34], as described in Section 2.4.2.

2.4.2. Historic SST Data Collected By Surfers

In addition to using SST data collected by surfers during our study using multiple methods, we used a historic SST dataset collected using the leash method of Brewin et al. [27] as described in Brewin et al. [34]. Data were collected using a (unprotected) TidbiT v2 sensor attached to the leash of a surfboard and a Garmin GPS device (as in Section 2.1). Data were processed to extract geo-referenced SST for the session following the methods described in Brewin et al. [34]. This involved determining the start (point at which the TidbiT v2 sensor had responded to the water temperature) and end point (surfer leaves the water) of the surfing session from the time-series of temperature measurements recorded during the session. The geo-referenced SST for the session was then taken as the median temperature, latitude, and longitude during start and end periods. In cases where the GPS device was not used or ran out of battery, the central location (latitude and longitude) of the surf session was extracted using GIS software (https://getlatlong.net) post session. The database of Brewin et al. [34] (from 2014–2017, [41]) was extended to July 2017 (prior to the start of this study) for this analysis, and we used data collected at two beaches (Bovisand and Wembury beach near Plymouth, UK), close to Station L4 in the Western Channel Observatory.

2.4.3. Photosynthetically Available Radiation Data from Satellites

Photosynthetically Available Radiation (PAR) represents solar radiation from 400 to 700 nanometers of the electromagnetic spectrum. Daily, Level 3 mapped 9 km PAR products were downloaded from the NASA Ocean Color website (https://oceancolor.gsfc.nasa.gov) from January 2014 to July 2018, covering both the period of this study (July 2017 to July 2018) and the period of historic SST surf data collection (see Section 2.4.2). The daily products were taken from three ocean-colour sensors operating during this period, MODIS-Aqua, MODIS-Terra, and VIIRS. We extracted data (pixels or grid points) from each global daily image surrounding the regions of study (47 to 60° N and −12 to 3° E for the UK, and 30 to 35° N and −121 to −115° E for the US).
To maximise PAR coverage, and to ensure consistency in PAR data, we produced a daily 9 km merged PAR product from these data in each region. Considering all products were mapped to the same grid, for each grid point (g), and taking MODIS-Aqua as the reference sensor, we regressed PAR from MODIS-Terra with MODIS-Aqua, and PAR from VIIRS with MODIS-Aqua, using a linear model, such that
PAR ( A , g ) = H ( i , g ) PAR ( i , g ) ,
where PAR ( A , g ) represents PAR for MODIS-Aqua at grid point g, the index i denotes either MODIS-Terra (T) or VIIRS (V), and H ( i , g ) is the coefficient for transferring PAR ( i , g ) to PAR ( A , g ) . Equation (1) was used to produce new MODIS-Terra and VIIRS PAR time-series data corrected to MODIS-Aqua, at each grid point (g) of the image. Finally, merged daily PAR images were produced by averaging PAR in each grid point from the three PAR datasets: MODIS-Aqua, MODIS-Terra (corrected to MODIS-Aqua), and VIIRS (corrected to MODIS-Aqua).
Using the merged PAR product, daily PAR data were extracted for all surfing sessions by matching the day of year of each surf with the equivalent PAR daily image and extracting PAR for the grid point (g) closest in latitude and longitude to the location of the surf (for one surf, where there was no PAR data at the closest pixel, we took the median PAR of a 3 × 3 grid box centred on the location of the surf). The NASA PAR products are provided as daily integrals (mol photons m 2 d 1 ), representing integrated irradiance over the day length (D). From these daily integrals, we estimated the instantaneous irradiance ( I ( t ) in μ mol photons m 2 s 1 ) at the mid-point of each surfing session. After conversion of PAR from mol photons m 2 d 1 to μ mol photons m 2 d 1 , we estimated the surface maximum irradiance just above the water surface at mid-day ( I m ) according to
I m = PAR / 2 D π ,
where day length in seconds (D) was computed as a function of latitude and day of year (DOY) of each surf, following the Schoolfield model, as defined in Equations (1)–(3) of Forsythe et al. [42]. Having derived I m , the values of irradiance I ( t ) at the mid-point of each surf (t, in seconds, computed from deriving the time in GMT of sunrise as a function of position and time of year, and scaling to the time (mid-point) of the surf in GMT accordingly) was estimated according to
I ( t ) = I m sin ( π t D ) .
Any values of I ( t ) below 0.1 μ mol photons m 2 s 1 (e.g., from pre-dawn surfing) were set to 0.1.

2.5. Statistical Tests

To compare estimates of water temperature from two sources, three univariate statistical tests were used. The coefficient of determination ( r 2 ), the mean absolute deviation ( ϵ ), and the mean difference (bias) between variables ( δ ). The mean absolute deviation was computed as
ϵ = 1 N i = 1 N X i M 1 X i M 2 ,
where X is the variable (e.g., SST) and N is the number of samples. The superscript M 1 denotes one measured variable (e.g., SST from the TidbiT v2 on the leash) and M 2 another measured variable (e.g., the Smartfin). Similarly, the bias (or mean deviation) was computed according to
δ = 1 N i = 1 N X i M 1 X i M 2 .

3. Results and Discussion

3.1. Comparison of SST Derived from Different Methods When Surfing

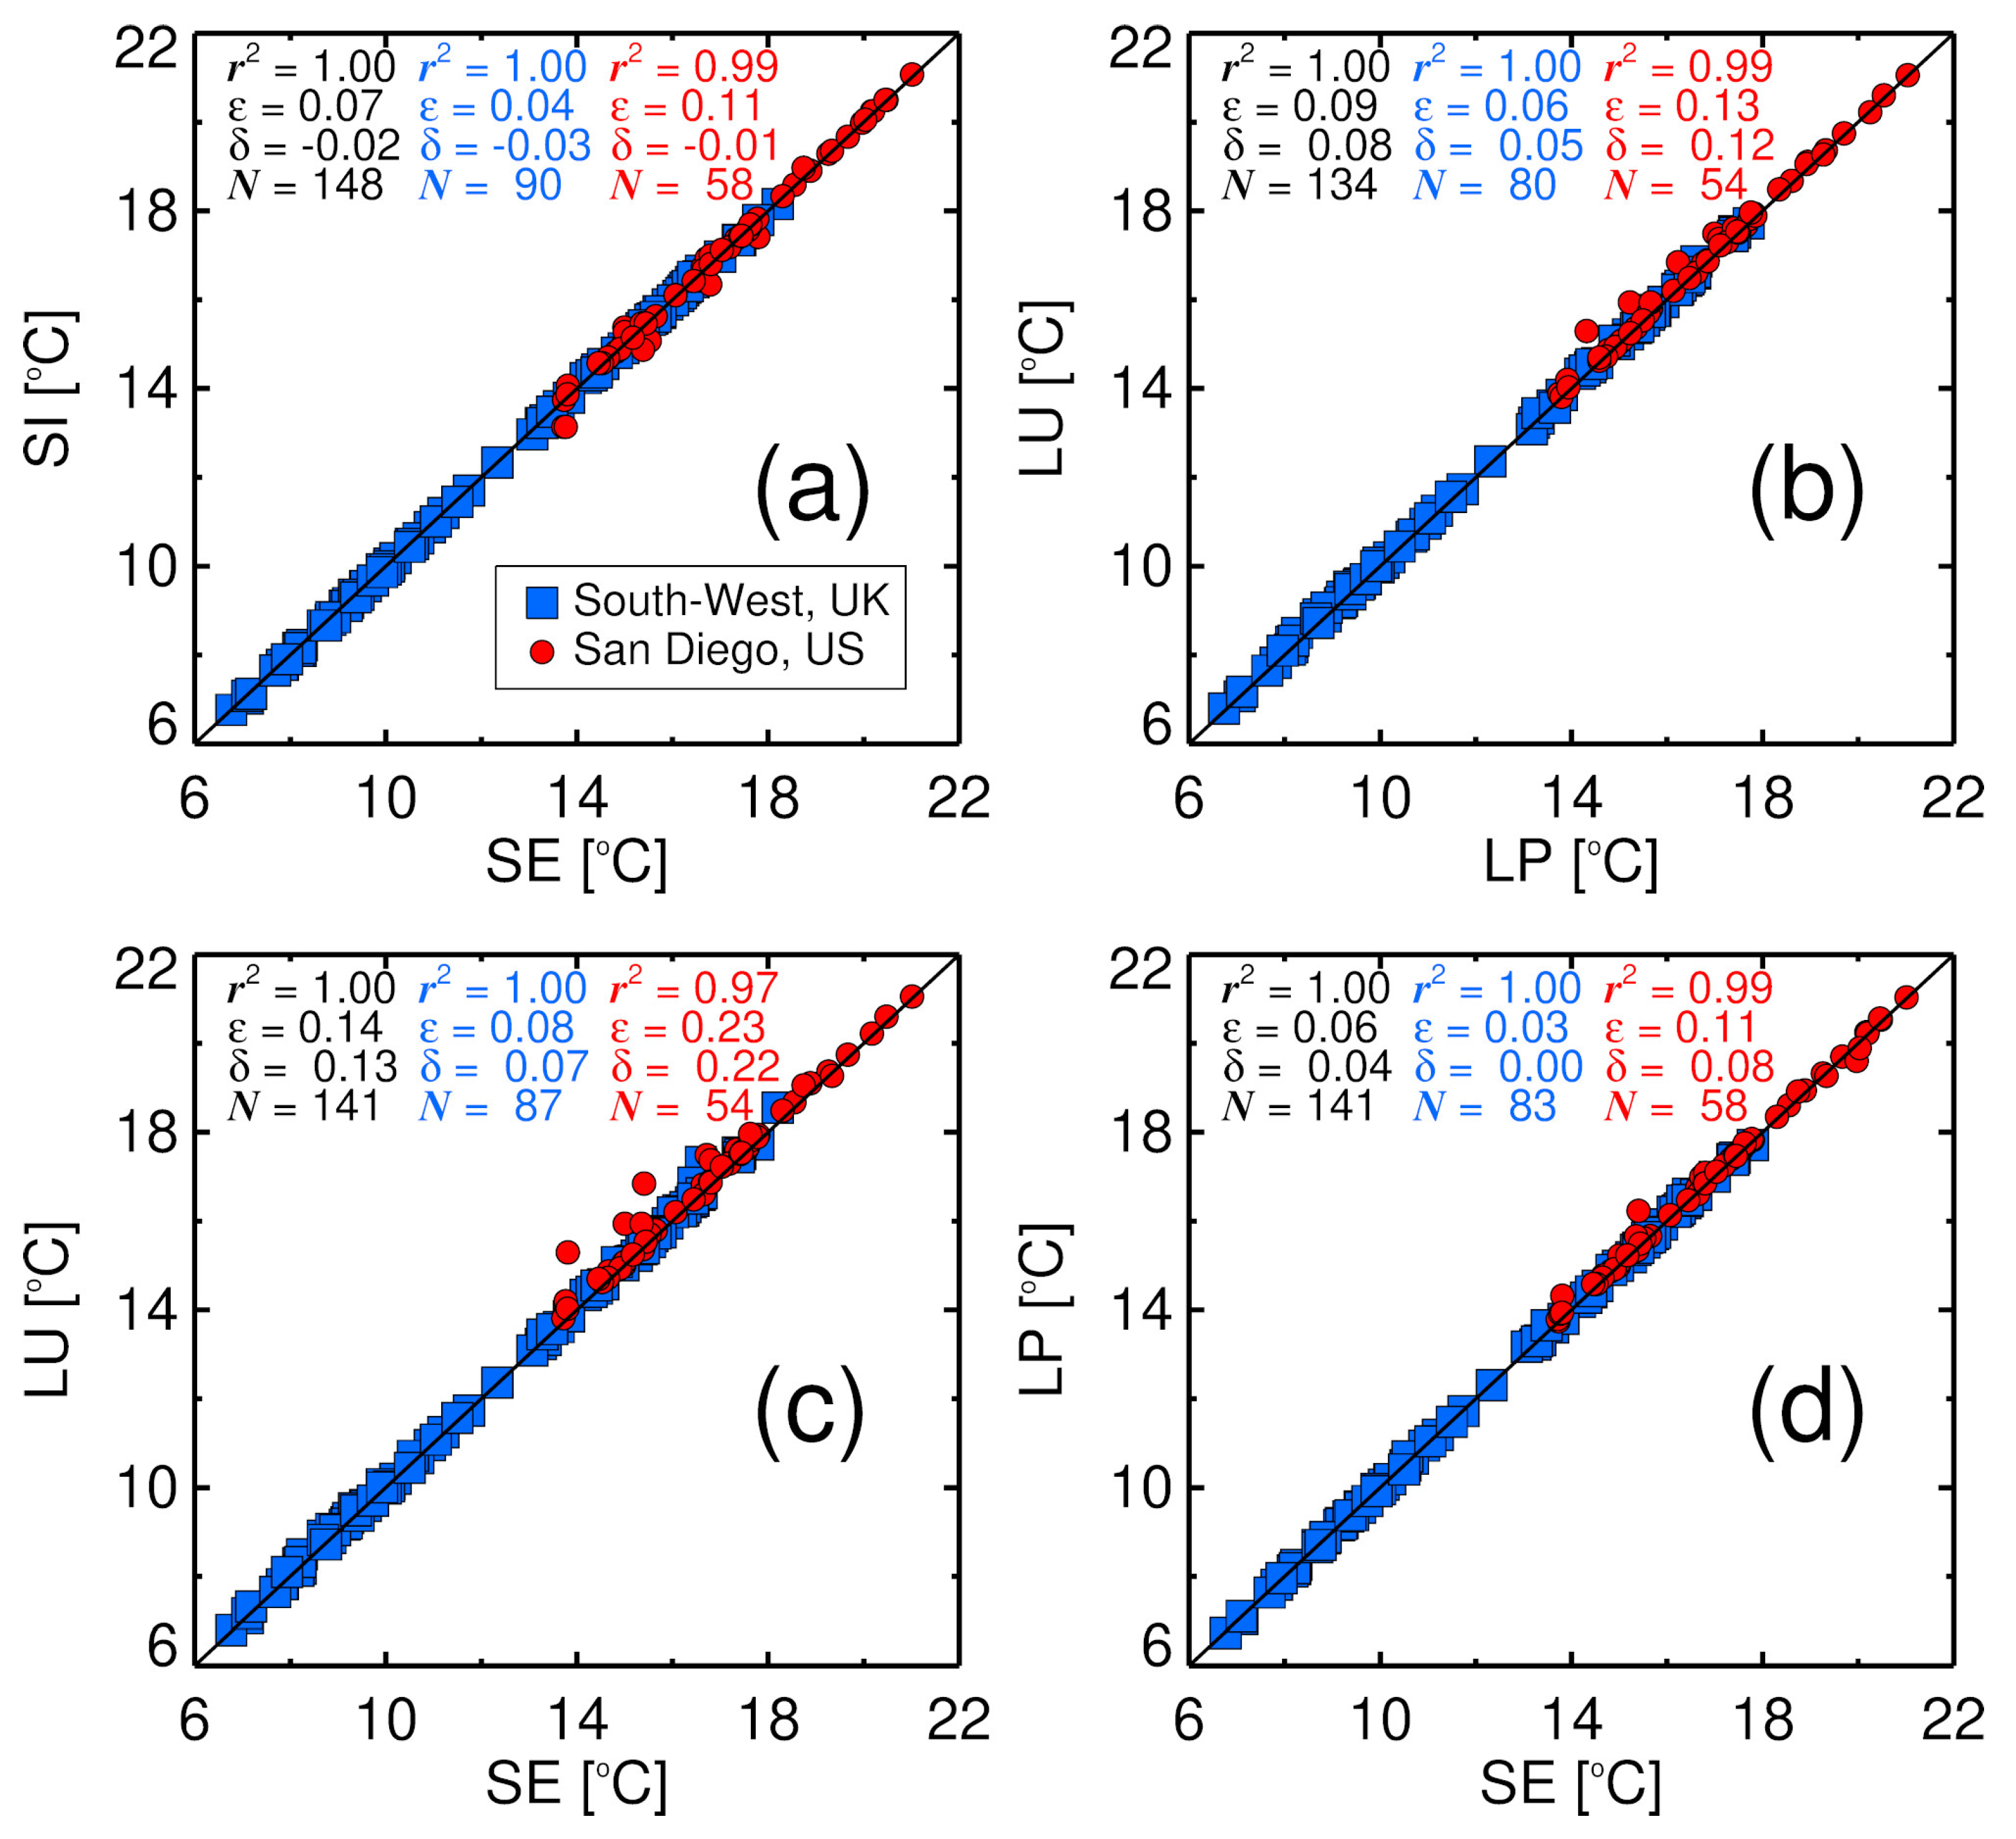
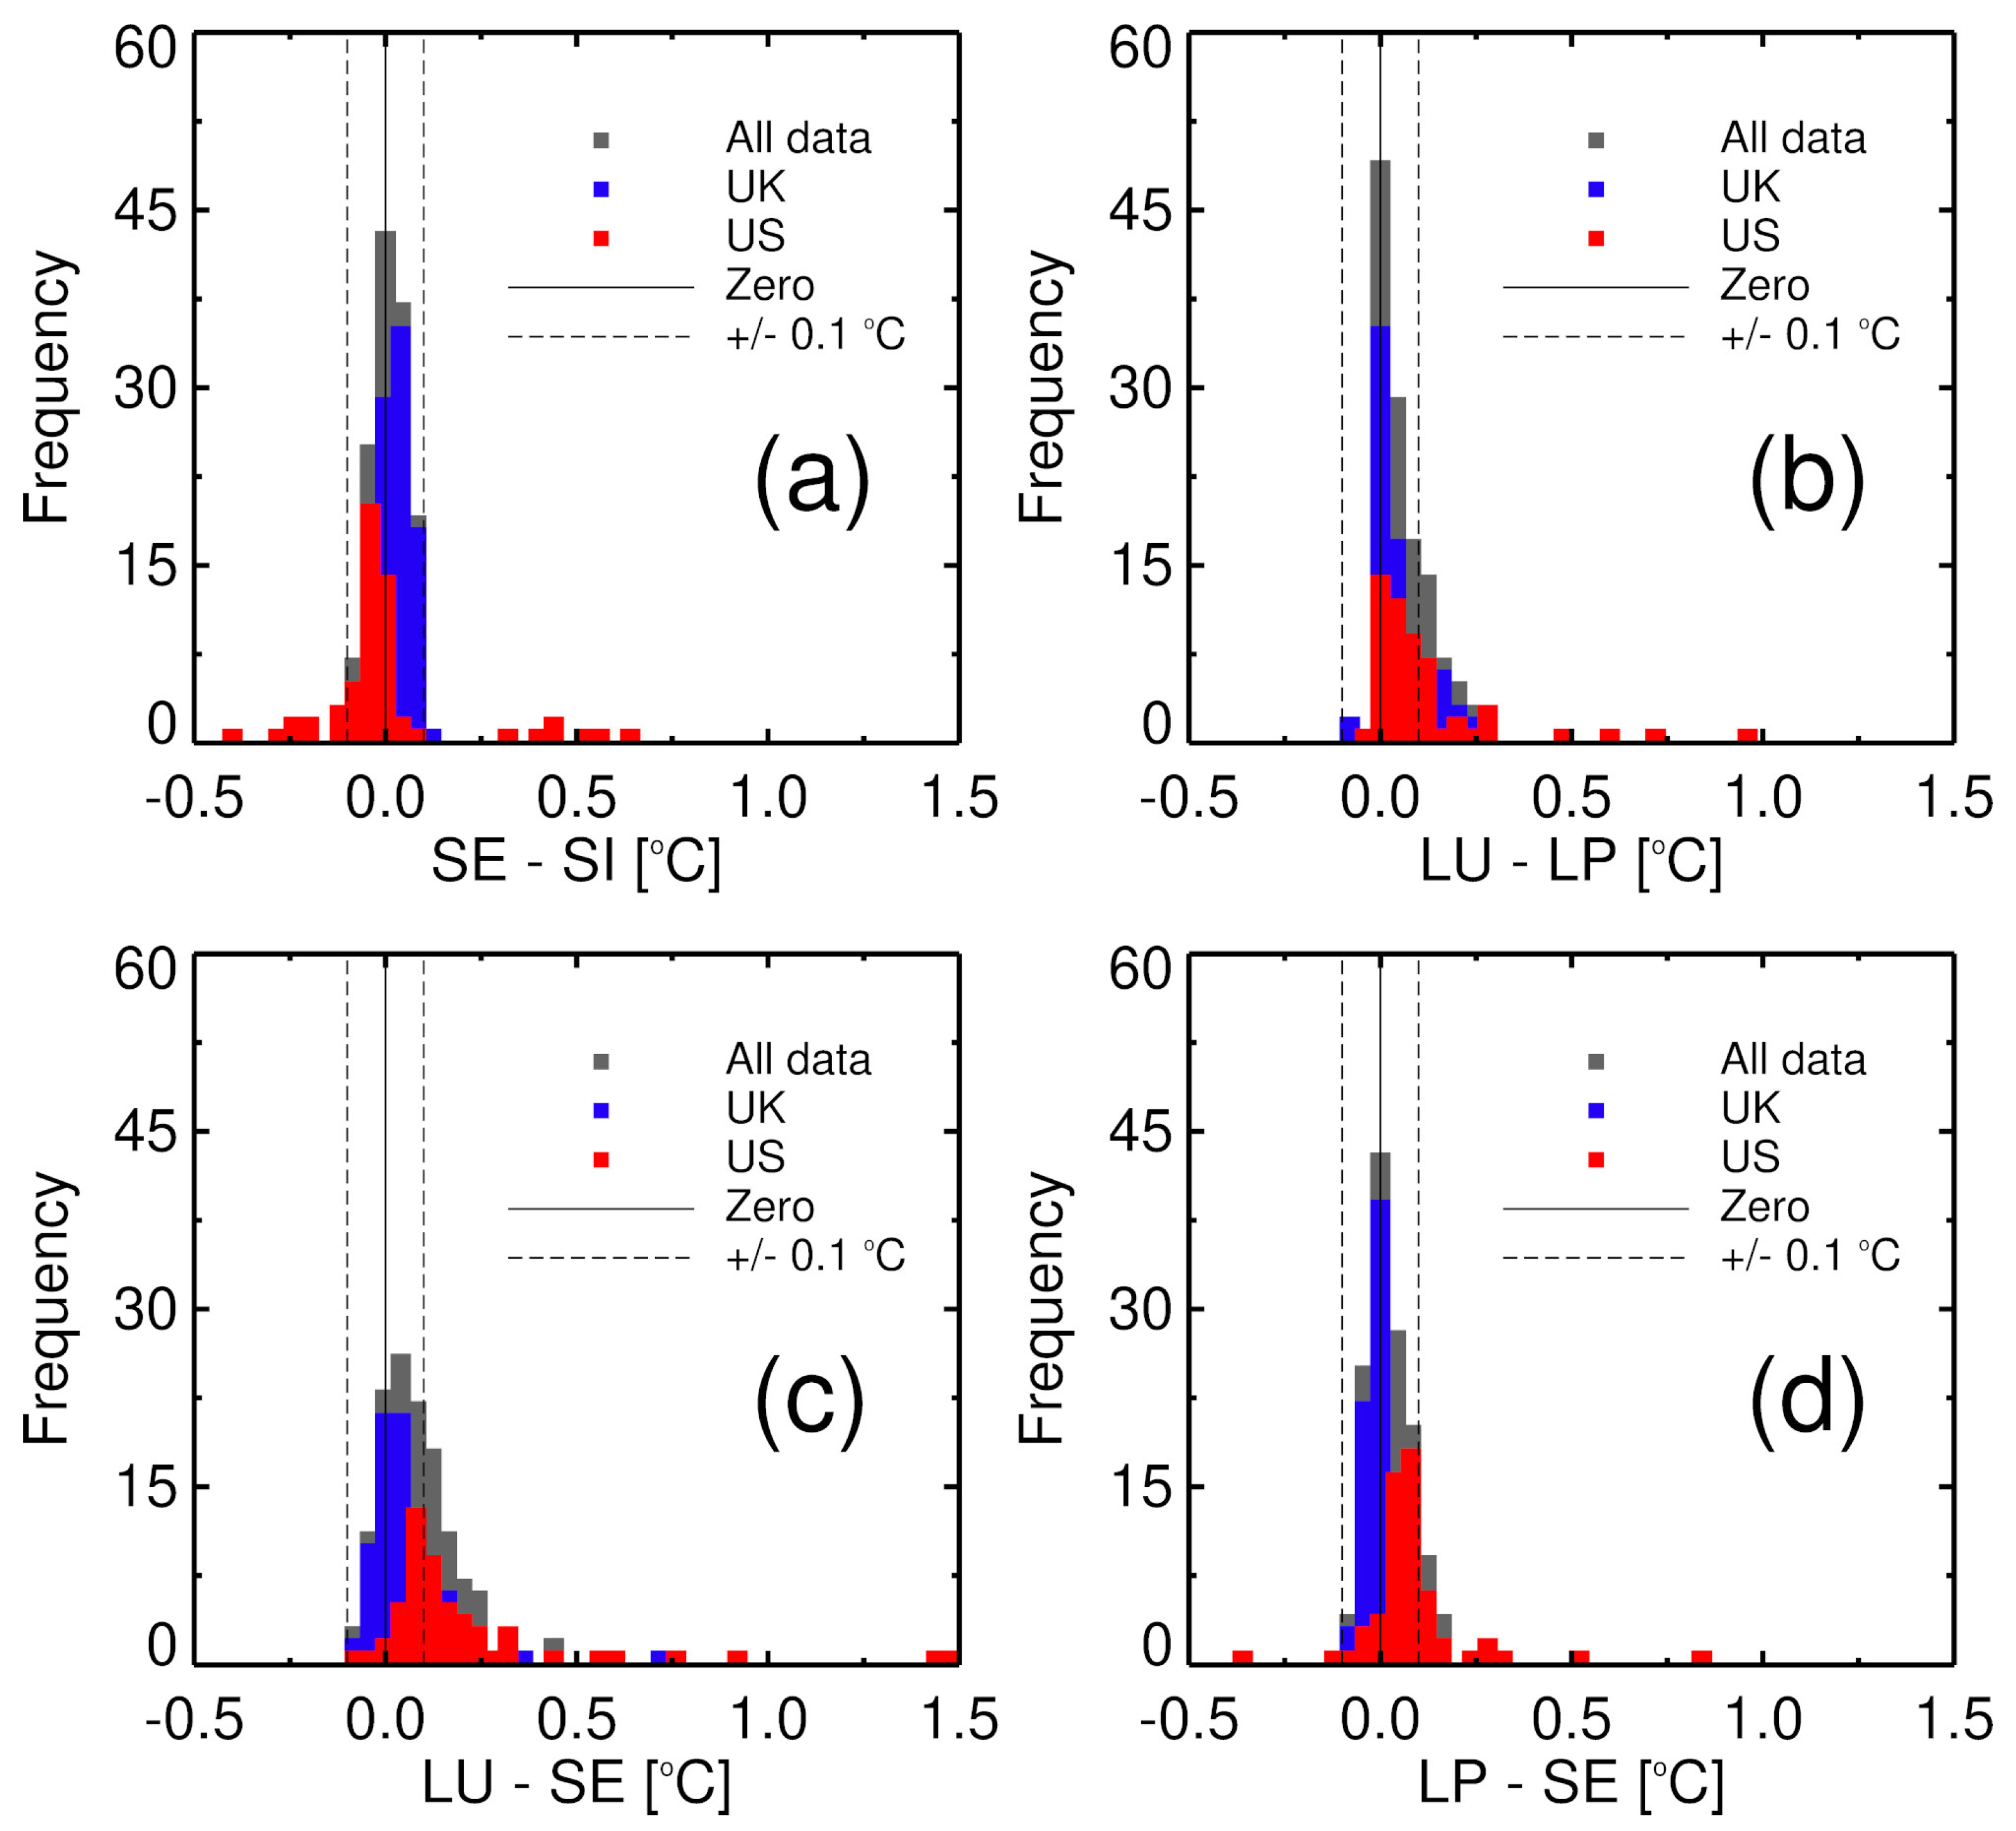
Figure 5 shows scatter plots of SST measurements collected by the various surfing techniques, and Figure 6 shows histograms of the residuals between methods. In general, all approaches are in good agreement ( r 2 > 0.97 , ϵ 0.23 , δ 0.03 and 0.22 , see Figure 5) with the majority of data within 0.1 °C (Figure 6). However, some methods are in better agreement than others. SST derived from the Smartfin Internal sensor (abbreviated from now on as SI) is in very good agreement ( r 2 = 1.00 , ϵ = 0.07 , δ = 0.02 ) with SST derived from the Smartfin External sensor (abbreviated from now on as SE, Figure 5a) with residuals evenly spread around zero (Figure 6a), and systematic differences similar for UK ( δ = 0.03 ) and US ( δ = 0.01 ) measurements, although with a marginally higher ϵ for US measurements (0.11 for US compared with 0.04 for UK). Considering consistency in data between Smartfin sensors, and that the SE sensor has a higher resolution and a quicker response time (e.g., see Figure 3) than the SI sensor, from the remaining analysis in the study using the Smartfin, we used data from the SE sensor.
SST derived from the leash with unprotected TidbiT v2 (abbreviated from now on as LU) is in reasonable agreement ( r 2 = 1.00 , ϵ = 0.09 ) with SST derived from the leash with protected TidbiT v2 (abbreviated from now on as LP, Figure 5b), though with a small systematic bias ( δ = 0.08 ) that is higher for US measurements ( δ = 0.12 ) than for UK measurements ( δ = 0.05 ). Analysis of residuals reveals a distribution skewed positive (Figure 6b), with SST generally higher for LU than for LP. Similarly, when comparing SST derived from LU with the Smartfin (SE), systematic biases are seen ( δ = 0.13 ) that are higher (Figure 5c) for US measurements ( δ = 0.22 ) than for UK measurements ( δ = 0.07 ). Analysis of residuals again reveals a distribution skewed positive (Figure 6c), particularly for US measurements, with differences as high as 1.5 °C in a few cases. Comparison of SST derived from LP with SE (Figure 5d and Figure 6d) shows better agreement ( r 2 = 1.00 , ϵ = 0.06 ) and more evenly distributed residuals, though again systematic differences are higher for US measurements ( δ = 0.08 ) than for UK measurements ( δ = 0.00 ).

3.2. Comparison of Surfing SST Data with Independent Datasets

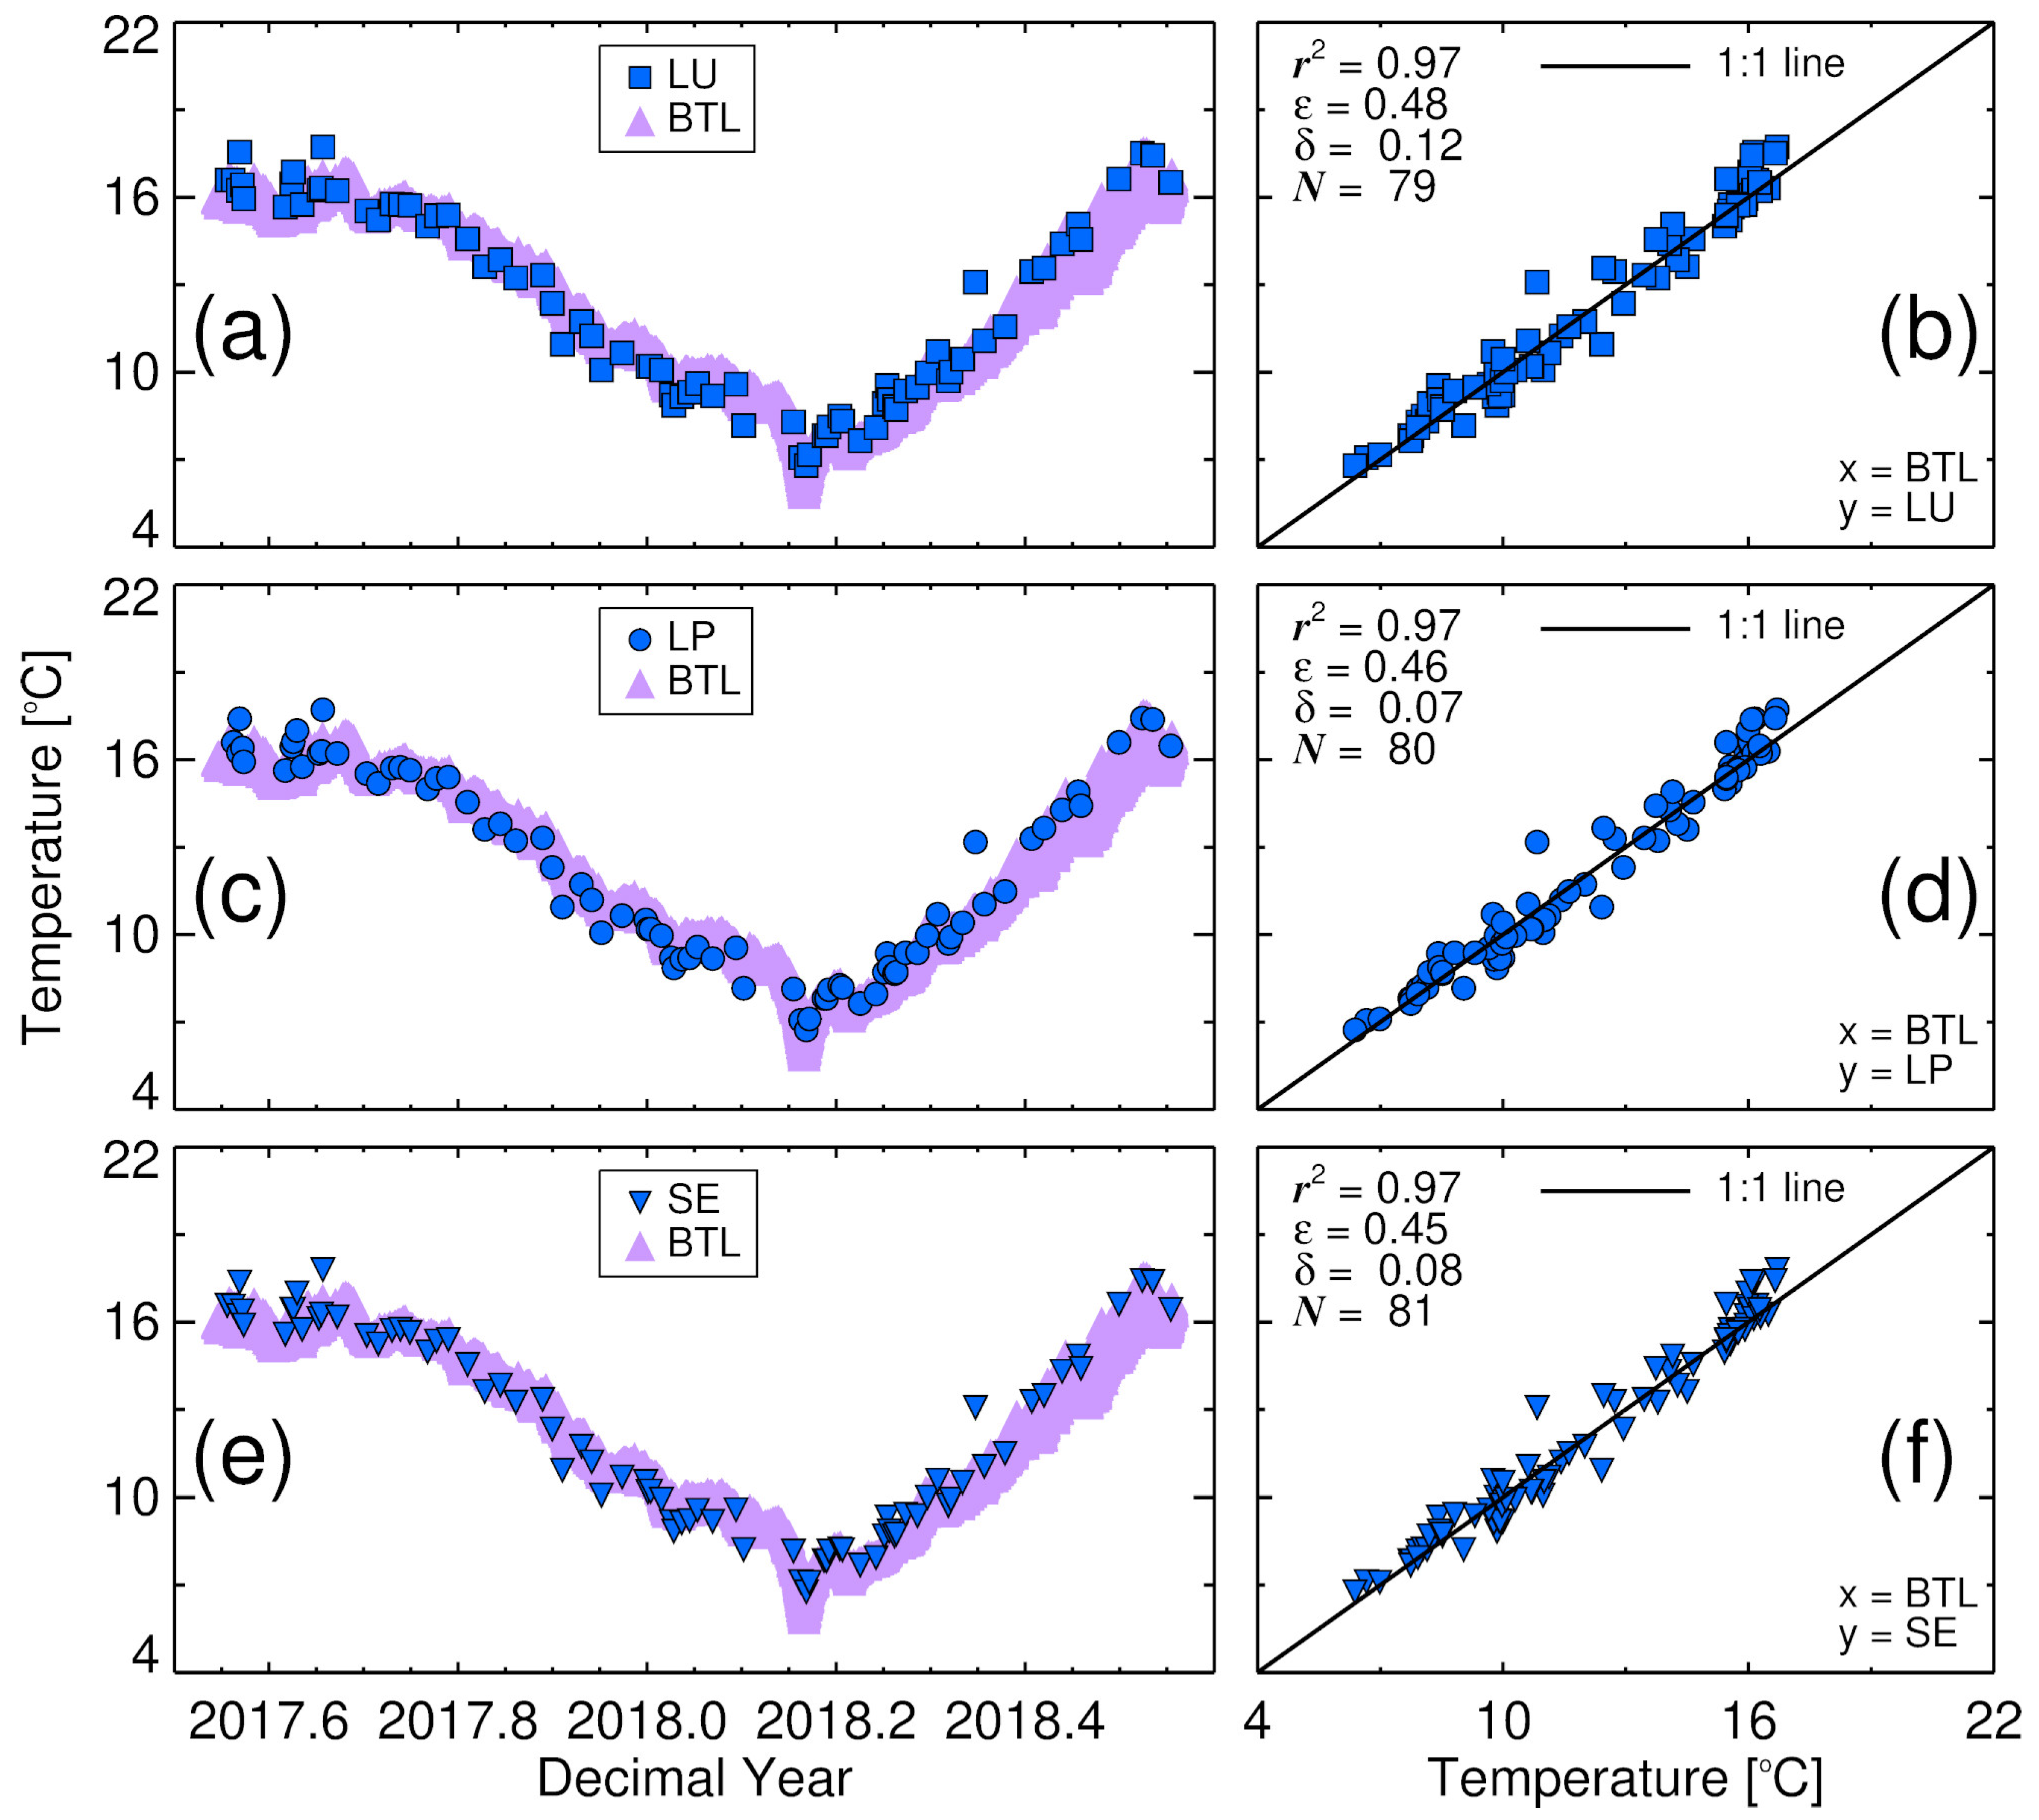
In the UK, and for measurements collected at Bovisand beach (Figure 4d), data collected by the surfers using the Smartfin (SE) and leash (LU and LP) are in good agreement with water temperature data from a benthic temperature logger (BTL) at a nearby kelp site (Figure 7). The BTL data from the kelp site tracks the observations from the surfers nicely, with minima in late February 2018 and maxima around August 2017 and June 2018 (Figure 7a,c,e). Scatter plots of data (Figure 7b,d,f) show that the surfing data (all methods) explain around 97% of the variance in the BTL data, with the SE and LP data having marginally lower differences ( ϵ 0.46 ) than the LU data ( ϵ = 0.48 ), and lower systematic differences ( δ 0.08 for LP and SE, δ = 0.12 for LU). Differences among surfing methods in UK (Figure 5) are considerably lower ( ϵ 0.08 ) than differences in surfer and BTL data ( ϵ 0.45 ), suggesting temperature differences likely represent differences in temperature between sites (BTL is in a slightly different region of the coast (∼6 km from Bovisand) and sampled at a different depth in the water). The surfer data track the BTL best in autumn and winter, with slightly higher values during spring and summer, possibly a result of near-surface heating during the spring and summer, considering the surfers are sampling at the ocean’s surface and the BTL is sampling at ∼3 m below chart datum. Results from the comparison between LU and BTL temperature data (Figure 7a,b) are consistent with a previous comparison in the same region between 2014 and 2017 (see Figure 1b,c of [35]).
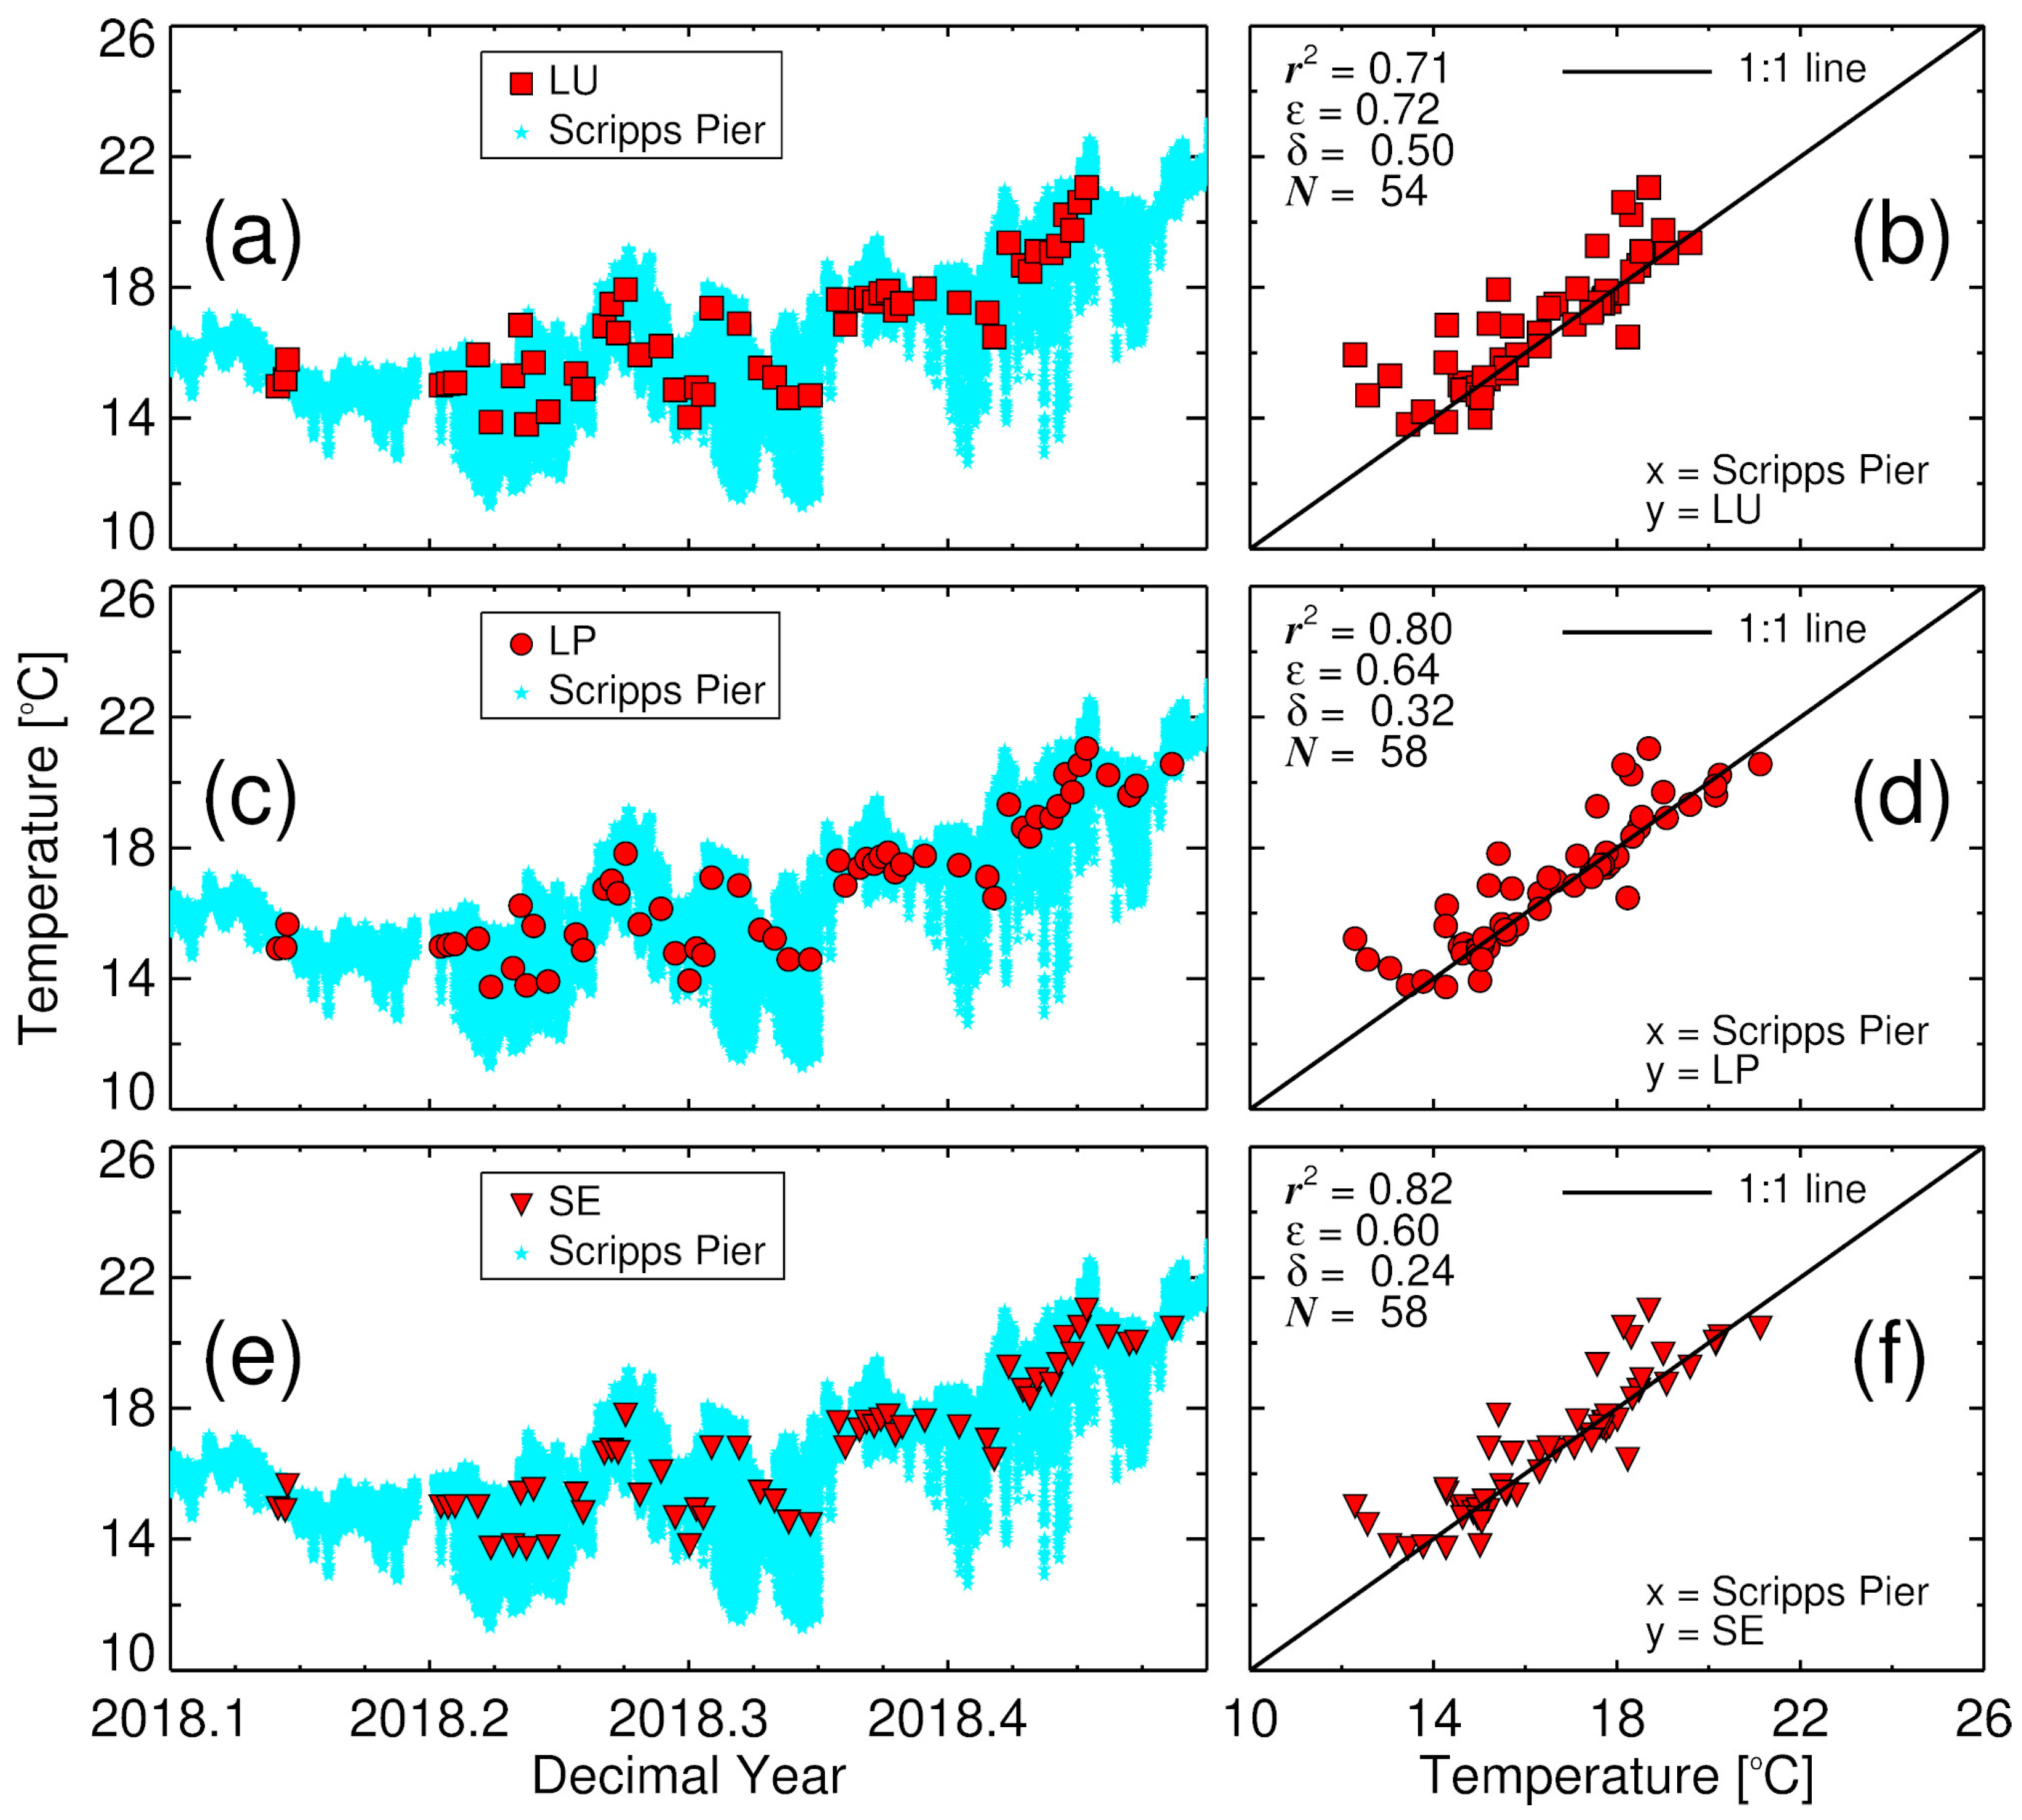
In the US, data collected by the surfers using the Smartfin (SE) and leash (LU and LP) near to Scripps Pier (Figure 4a,b) are compared with water temperature data collected from Scripps Pier in Figure 8, between February and June 2018. In comparison to the BTL data collected in the UK (Figure 7), water temperature at Scripps Pier has considerably more short-term variability, with diurnal changes in temperature sometimes exceeding 5 °C. These changes have been linked to upwelling, solar heating (sensible heat and shortwave radiation), tidal, internal wave, and rip current dynamics in the region [43,44,45]. The surfer data track the general changes in Scripps Pier data over the period (increasing from February to June), with the surfer data explaining ≥ 71% of the variance in the Scripps Pier data (highest for the Smartfin (SE) and protected (LP) leash (80 to 82% of the variance) and lowest for the unprotected (LU) leash (71% of the variance)). The LU data showed higher differences ( ϵ = 0.72 ) than the LP and SE data ( ϵ 0.64 ), and higher systematic differences ( δ = 0.50 for LU, δ = 0.32 and 0.24 for LP and SE, respectively), when compared with the Scripps Pier data (Figure 8b,d,f). Similar to the analysis in the UK, differences among surfing methods in US (Figure 5) are lower ( ϵ 0.23 ) than differences among surfer data and Scripps Pier data ( ϵ 0.60 ), suggesting the temperature differences observed in Figure 8 likely represent real spatial temperature dynamics along the La Jolla coastline. For example, the majority of surfing data was collected near Black’s beach, which may have different temperature dynamics when compared with Scripps Pier, owing to the complex bathymetry and physical processes of the region [45,46].

3.3. Influence of Irradiance on Tidbit v2 Leash Measurements

Bahr et al. [39] recently demonstrated that some miniature, commercially-available temperature sensors (Onset HOBO® Pendant®, Onset Computer Corporation, Bourne, MA, USA), similar to the Onset TidbiT v2 sensors, are vulnerable to solar heating when exposed to high solar irradiance. Differences exceeding 2.2 °C were observed between shaded an unshaded sensors. Considering that: (i) the unprotected TidbiT v2 sensor on the leash (LU) is exposed to irradiance during operation (unshaded); (ii) that systematic differences between LU and the Smartfin (which is shaded by the surfboard when being surfed) were observed in the study (Figure 5 and Figure 6), with LU higher than the Smartfin, particularly for US measurements where a higher amount of irradiance was observed on average (583 μ mol qunata m 2 s 1 ) than for UK measurements (275 μ mol qunata m 2 s 1 ); it seemed pertinent to investigate the effect of solar heating on LU measurements.
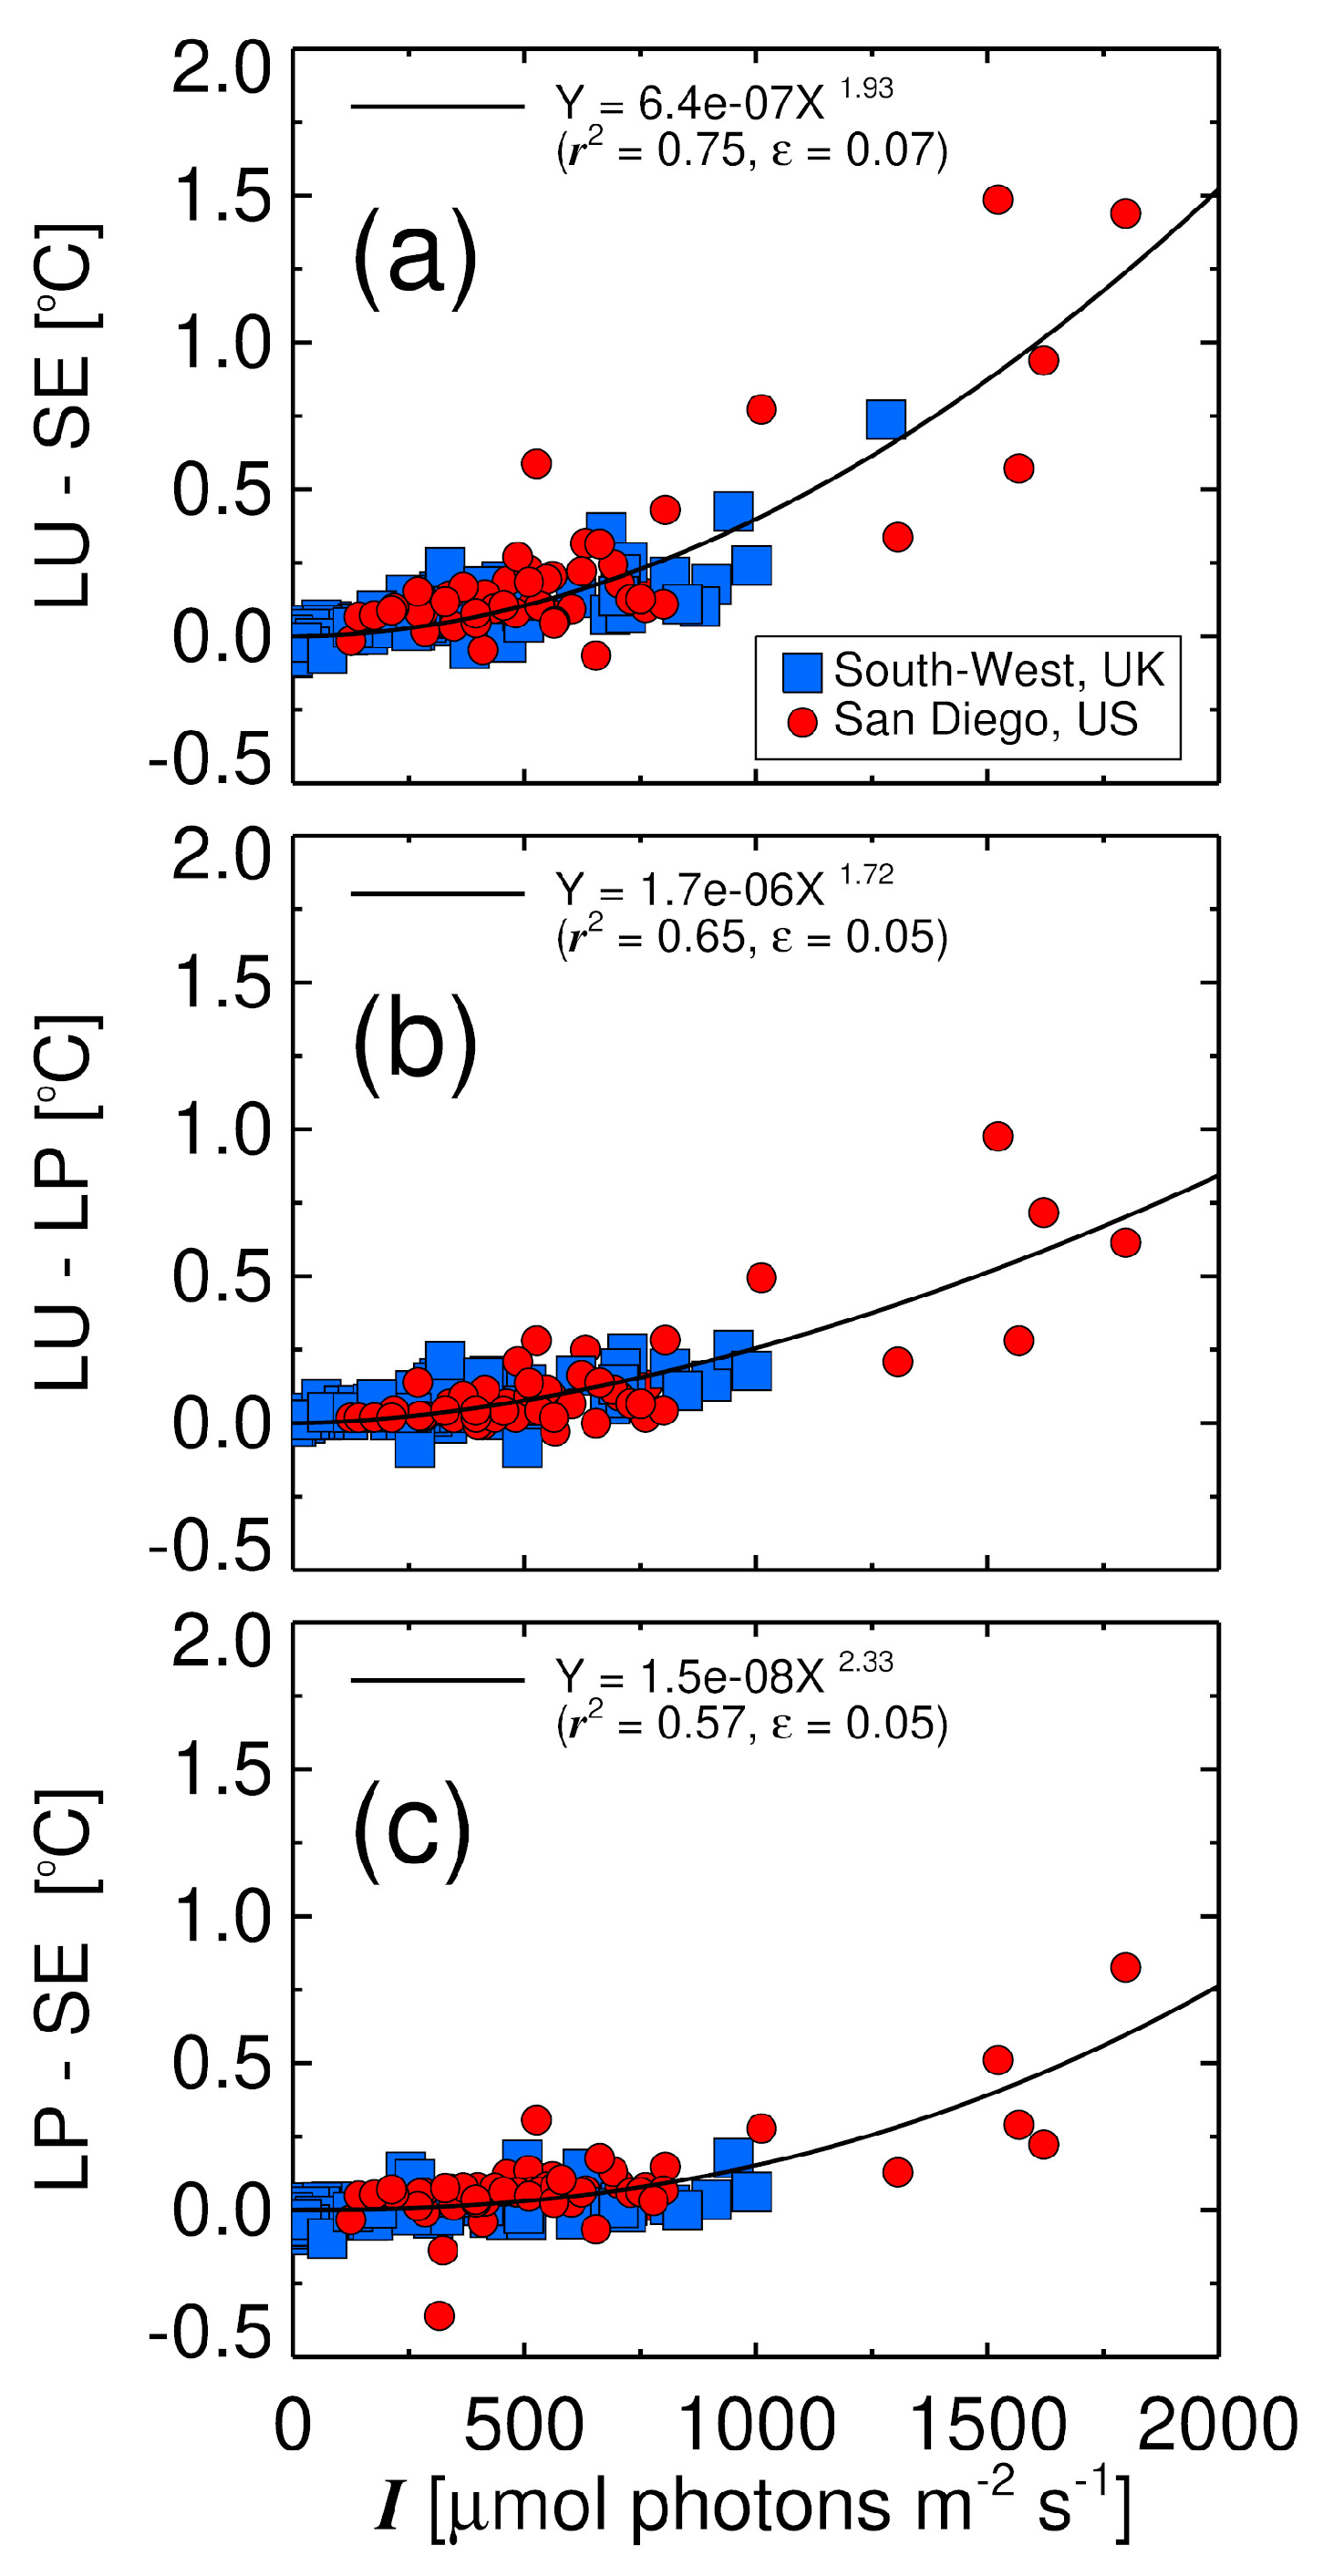
We found residuals in SST between LU and the Smartfin (SE) to be significantly correlated with irradiance (I) (Figure 9a), with I explaining 75% of the variance in the residuals (Y) between LU and SE using a power function of the form Y = A I B (Figure 9a). Model coefficients (A and B) were derived using nonlinear least-square regression (Levenberg-Marquardt [47,48], IDL Routine MPFITFUN). We used the method of bootstrapping [49,50] to compute a parameter distribution (10,000 bootstraps), and from the resulting parameter distribution median values and robust standard deviations in the parameters were obtained, such that A = 6.4 × 10 7 ( ± 5.0 × 10 7 ) and B = 1.93 ( ± 0.15 ) . When applying the model, the mean absolute difference ( ϵ ) between LU and SE halves from 0.14 °C to 0.07 °C (Figure 5a and Figure 9a).
Similarly, when plotting residuals in SST between the unprotected and protected TidbiTs on the leash (LU−LP, Figure 9b), we observed the same model (with A = 1.7 × 10 6 ( ± 1.4 × 10 6 ) and B = 1.72 ( ± 0.16 ) ) could explain 65% of the variance in the residuals (Y), with ϵ between LU and LP dropping by nearly half when applying the equation (from 0.09 to 0.05, see Figure 5b and Figure 9b). This is clear evidence of the susceptibility of the unprotected TidbiT v2 sensors to the effect of solar heating from high irradiance. Interestingly, we even found residuals in SST between LP and the Smartfin (SE) to correlate with I (Figure 9c, with A = 1.5 × 10 8 ( ± 1.4 × 10 8 ) and B = 2.33 ( ± 0.39 ) ), suggesting that covering the TidbiT v2 sensors with a protective boot does not completely eliminate the effect of solar heating from high irradiance. This was consistent with the findings in Bahr et al. [39], who found, even when protecting the HOBO® Pendant® with a reflective cover, the effect of solar heating from high irradiance was still apparent, though smaller.
In light of these findings, and that such a large amount of the variance (57 to 75%, Figure 9a,c) between the TidbiT v2 sensors on the leash and the Smartfin could be explained by satellite estimates of I, we used the power function and satellite I data to back-calibrate all SST measurements collected since 2014 using the unprotected leash method (LU). Our measurement equation for these revised estimates was
SST c = T t δ l a b A i I B i ,
where SST c is the corrected SST measurements from the leash method, T t is the median temperature from the TidbiT v2 sensor during the start and end of the surf, δ l a b is the systematic difference derived in the laboratory calibrations, and the term A i I B i is the power function to correct for solar heating, with I as irradiance (at mid-point of the surf) and A i and B i the coefficients of this correction, with the subscript i indicating the selection of coefficients from the LU sensor (see Figure 9a). When computing SST c using Equation (6), we also estimated the uncertainty in SST c by computing the derivatives of Equation (6) and propagating the uncertainty in each term using the standard law of error propagation, accounting for any correlations in the uncertainties. The uncertainties for each term in Equation (6) were defined as follows: uncertainty in T t was defined as the median absolute deviation in T t during the surf; uncertainty in δ l a b set to 0.05 °C (accuracy of the VWR1620-200 traceable digital thermometer used in the calibrations); uncertainty in the terms A i and B i were taken from the model fits (provided in paragraph above); and uncertainty in I was set to 11% based on a recent, and conservative, estimate from a satellite validation of PAR [51].
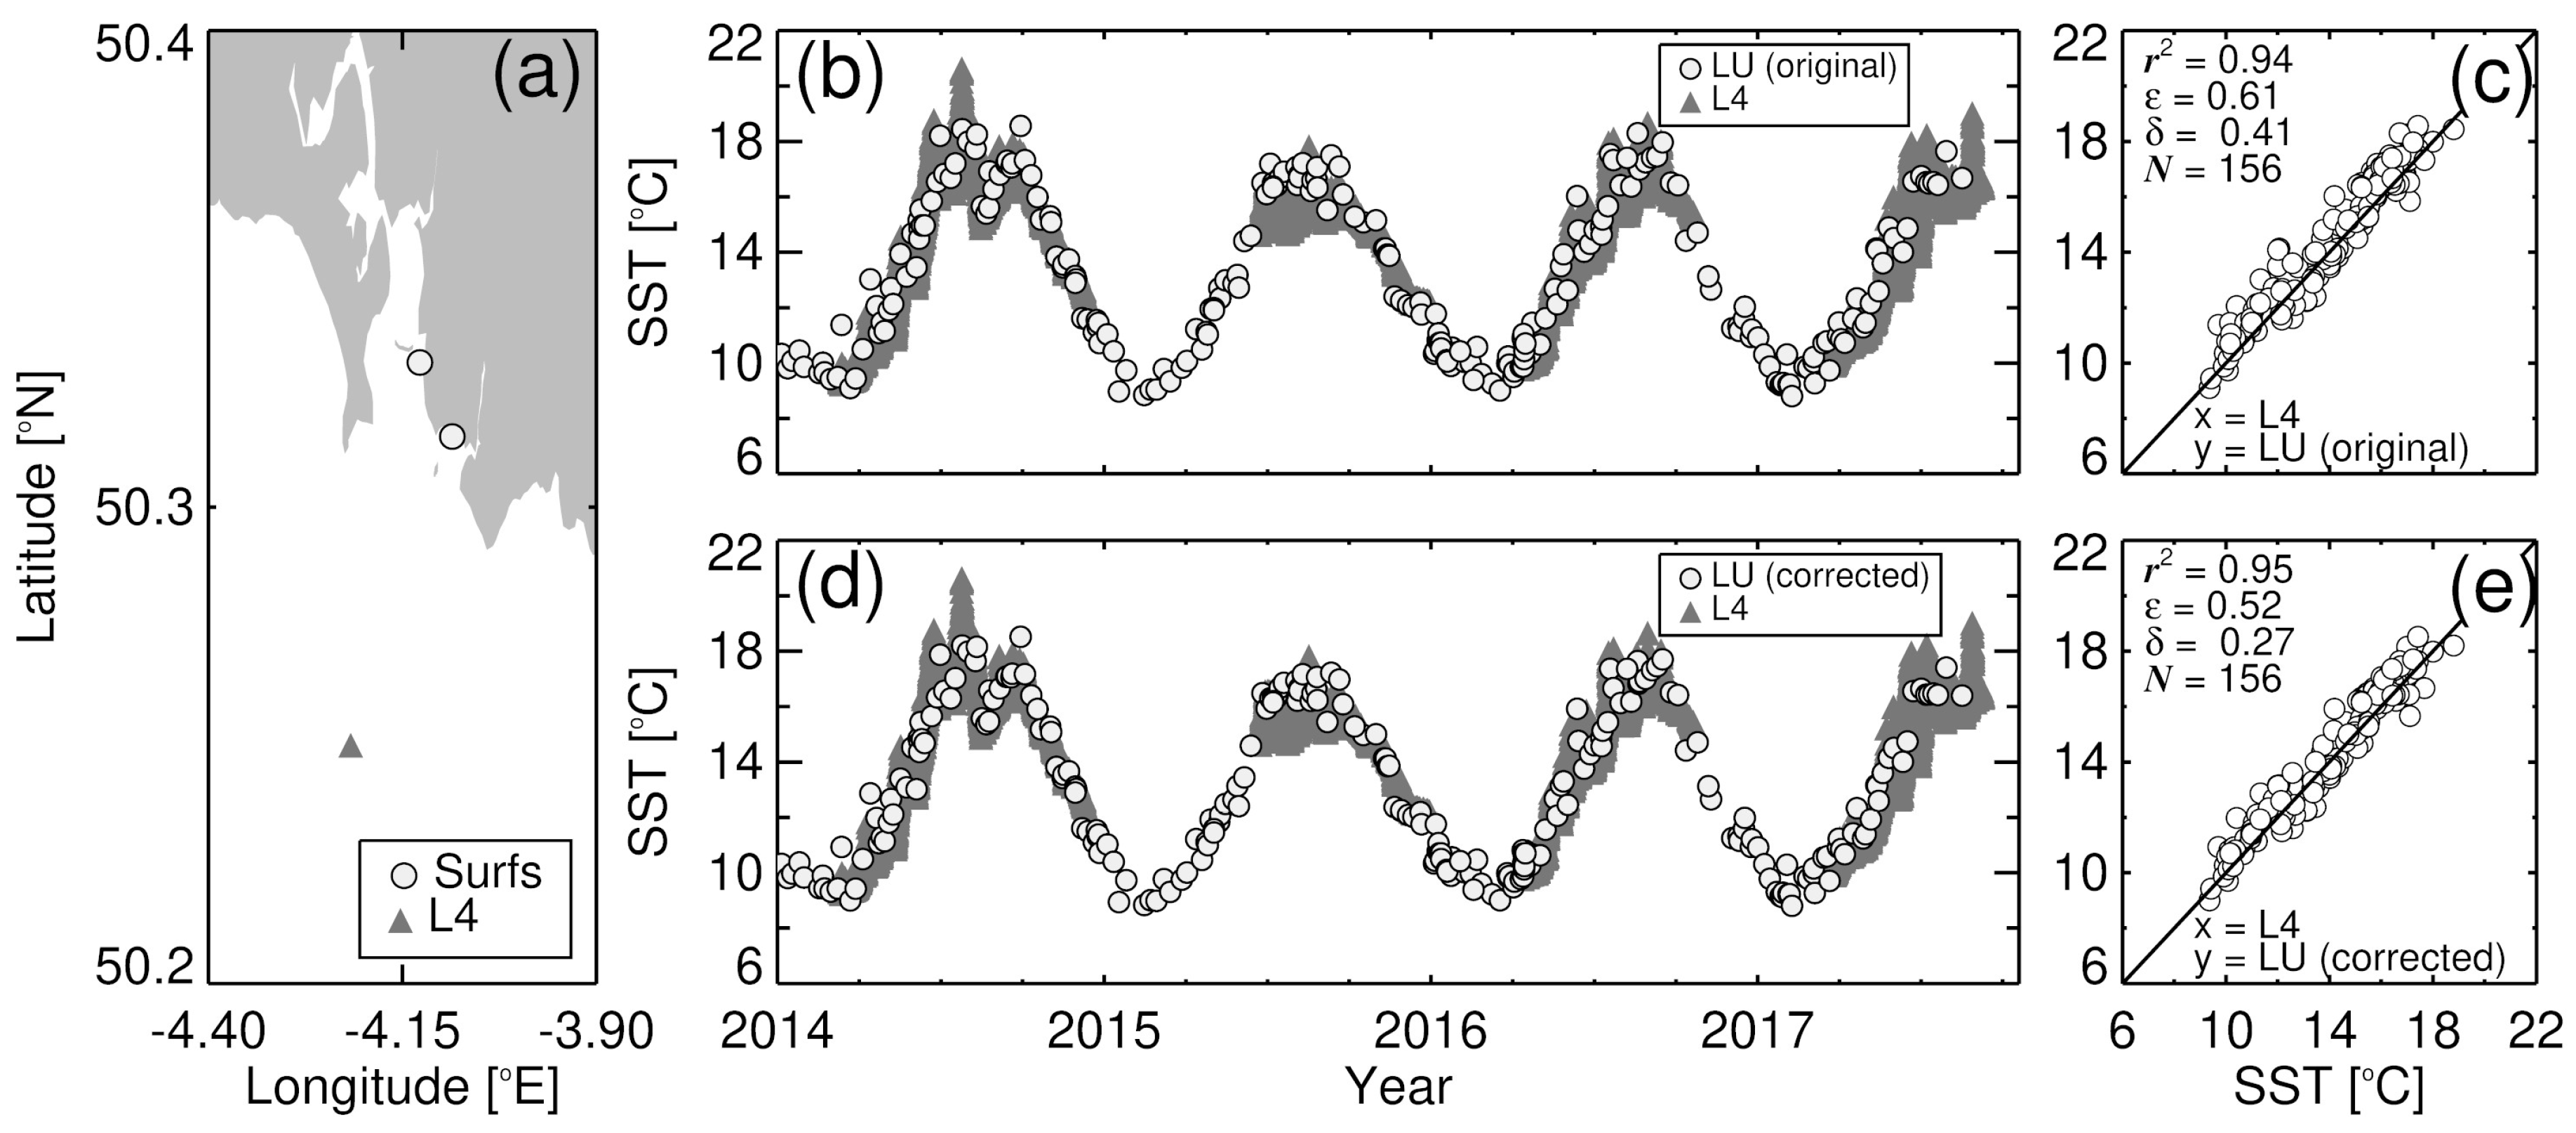
Figure 10 shows a comparison of SST data from Station L4 with both historic (prior to this study) LU SST data [34], and corrected LU SST c data following Equation (6), at Bovisand and Wembury beach near Plymouth, UK. Statistical results from the comparison between historic LU and L4 SST data (Figure 10a,b) are consistent with previous comparisons at these sites [27,34]. The corrected data were on average 0.14 °C (median 0.08 °C) lower than the historic data, and shown to agree more closely with data from Station L4, with a higher r 2 (0.95 compared with 0.94), lower median absolute deviation ( ϵ = 0.52 compared with 0.61) and a bias closer to zero ( δ = 0.27 compared with 0.41). The average uncertainty, computed from Equation (6), in these corrected data was 0.17 °C (median of 0.09 °C), with the uncertainty increasing with increasing I. Following this reprocessing, the corrected LU SST c data were found to be more accurate (based on independent analysis in Figure 10), can be more confidently integrated with Smartfin data (e.g., for time-series analysis), and can be provided with uncertainty estimates, for use in scientific applications. All SST c data collected using the LU and LP methods are now provided, together with estimates of uncertainty using Equation (6), in Brewin et al. [52].

3.4. Future Recommendations

The agreement between Smartfin data and the leash data (Figure 5) indicates both methods are capable of providing consistent SST data. This is encouraging, particularly in the case of the UK, where better agreement was shown, and where the leash method has been used historically, in applications like the validation of satellite SST data [34]. Average differences between methods in the UK ( ϵ = 0.08 °C) are considerably lower than the errors observed in satellite products at the coastline in these analyses [34,35]. Nonetheless, our results clearly indicate temperature biases in the TidbiT v2 loggers on the leash can occur in the presence of high irradiance. In such conditions, the Smartfin was found to produce more accurate data, as the sensors are shaded from sunlight and less vulnerable to solar heating. Should future work look to tow similar sensors to the TidbiT v2 in the water, careful consideration needs to be placed on minimising exposure to sunlight heating. This could be achieved by designing better shading methods or increasing the response time of the sensors. This is particularly important in regions exposed to high irradiance, as seen in our comparison between UK and US measurements, and have implications when designing environmental sensor packages for any surface ocean platform. When correcting for solar heating, the leash data were in very good agreement with the Smartfin ( δ = 0.01 , ϵ = 0.07 °C), suggesting differences between techniques were not influenced significantly by differences in the depth of sampling (Figure 2). This could be related to the presence of the surfer mixing the surface layer of the ocean as they move through it, or from turbulent mixing of surface waters caused by wave breaking.
The external sensor on the Smartfin has other advantages over the TidbiT v2 logger. It has a much quicker response time in the water (e.g., see Figure 3), meaning it is better suited for exploring spatial and temporal variability in SST during the surfing sessions, something the leash method was not designed for. Acknowledging that the leash method was developed as a ’proof of concept’, as a general citizen science tool, the Smartfin is more attractive. The TidbiT v2 sensors require launching and data upload via computer (although newer versions are now available with bluetooth) meaning the surfer has to invest a large amount of time using the kit. In contrast, the Smartfin makes use of wireless data transfer capabilities (Bluetooth) and charging, mobile data upload, and cloud-based data storage and processing, meaning the citizen does not need to invest much time using it. The Smartfin is also bespoke, designed to minimise impact on the activity of surfing. These are all qualities desirable for successful citizen science projects of this nature [19].
It has been estimated that there are in the region of 1 million surfers in the UK, 3.3 million in the US, and possibly as many as 35 million worldwide [19,53]. Huge stretches of the world’s tropical and subtropical coastline are populated with surfing beaches [19], and although there are seasonal changes in the frequency of participation, surfing occurs all year around even in cold and dark winter months at high latitudes. There is a huge potential to use surfers to help increase the coverage of nearshore ocean observations like temperature, using the types of approaches tested here, which can be easily expanded to other aquatic recreational activities (e.g., diving, kayaking) and to other environmental indicators of aquatic health, such as ocean acidity and water quality [20,21,22,23,24,25,26].
Despite the potential of using surfers to monitor the nearshore, and the progress made with tools like the Smartfin, to achieve systematic coverage there are still challenges that still need to be overcome. The sensor packages need to be made easily accessible to the surfing communities and versatile enough to be integrated into standard surfing equipment. Surfers need to be motivated to use the technology, and while advocacy is proven to be the biggest motivator in marine citizen science [38], the influence of gaming and competition can also play a role [54]. For instance, it has been suggested that GPS positioning data used to compute performance statistics may motivate user uptake [27].
Whereas our study has directly addressed questions around data quality and uncertainty, more could still be done—for example, quantifying the stability in these sensors over time. Another challenge is that the analysis and interpretation of the data collected should carefully consider and identify temporal and spatial data biases [19]. Naturally, data collected by surfers will be biased toward conditions preferable for surfing. Integrating the data collected from the surfers with other data streams (in situ and satellite), and with measurements collected using other recreational activities that occur in the nearshore in conditions not preferable to surfing (e.g., diving and kayaking), will improve systematic coverage.

4. Conclusions

In this paper, we compared two approaches for measuring sea surface temperature (SST) when surfing. The first is based on attaching a commercially-available miniature temperature sensor (Onset UTBI-001 TidbiT v2) to a surfboard leash (tether connecting surfer and surfboard) and the second a surfboard fin (Smartfin), with an integrated environmental sensor package. Over the period of one year (148 surfing sessions), the two techniques were deployed simultaneously, 90 times in the southwest of the UK and 58 times in San Diego, CA, USA. Two TidbiT v2 sensors were attached to the leash of the surfboard, one with (denoted LP) and one without (denoted LU) a protective boot, designed to minimise solar heating. The median temperature from each technique, for each surfing session, were extracted and considered as the SST. The values were compared with independent water temperature data from a nearby pier and benthic logger, and matched with satellite observations of photosynthetically available radiation (PAR).
We observed a mean difference ( δ ) of 0.13 °C and mean absolute difference ( ϵ ) of 0.14 °C between Smartfin and LU, and δ = 0.06 °C and ϵ = 0.04 °C between Smartfin and LP. This was lower for UK measurements (e.g., δ = 0.08 °C and ϵ = 0.07 °C between Smartfin and LU) than for US measurements (e.g., δ = 0.23 °C and ϵ = 0.22 °C between Smartfin and LU). Differences among surfing methods were lower than differences between surfer data and nearby independent water temperature data (pier and benthic logger), suggesting differences represent real spatial gradients between sites. We observed a significant relationship between satellite estimates of PAR during the surfing sessions and differences in SST between leash sensors and Smartfin, explaining the regional differences in the comparison (PAR generally higher during US sessions than during UK sessions). As the sensors on the leash are exposed to ambient light, they were found to warm in high irradiance, biasing the SST data positively. By modelling these differences, we recalibrated historic SST data collected with the leash sensors, to be consistent with the Smartfin data, and provided uncertainty estimates with these data. The corrected historic observations at two beaches were found to be in better agreement with independent SST data from a nearby buoy. Our findings demonstrate the need to design temperature sensor packages that minimise exposure from sunlight heating when towed in the surface ocean, with implications for integrating environmental sensor packages into other marine sports equipment.

Author Contributions

Conceptualization, R.J.W.B., T.C., and P.J.B.; Methodology, R.J.W.B., T.C., P.J.B., and J.R.; Software, R.J.W.B. and G.D.; Validation, R.J.W.B.; Formal Analysis, R.J.W.B.; Investigation, R.J.W.B., T.C., and P.J.B.; Resources, R.J.W.B., T.C., P.J.B., and A.J.A.; Data Curation, R.J.W.B., J.R., K.H., O.B., L.d.M., T.J., and D.S.; Writing—Original Draft Preparation, R.J.W.B.; Writing—Review and Editing, R.J.W.B., T.C., P.J.B., A.J.A., J.R., K.H., O.B., L.d.M., T.J., D.S., and G.D. All authors have read and agreed to the published version of the manuscript.

Funding

A.J.A., P.J.B., J.R., K.H., and T.C. received financial support from the non-profit Lost Bird project. D.S. is supported by a UKRI Future Leaders Fellowship (MR/S032827/1).

Acknowledgments

We acknowledge all surfers involved in collection of the SST data and all divers involved in the deployments of the benthic loggers. We also acknowledge all those involved with maintaining and operating the L4 buoys, benthic loggers, and instruments at Scripps Pier. We thank Jamie Shutler for his support during the work.

Conflicts of Interest

A.J.A., P.J.B., J.R., K.H., and T.C. received financial support from the non-profit Lost Bird project. All other authors declare the absence of any commercial or financial relationships that could be construed as a potential conflict of interest.

References

  1. Azeiteiro, U.M.; Bacelar-Nicolau, L.; Resende, P.; Gonçalves, F.; Pereira, M.J. Larval fish distribution in shallow coastal waters off North Western Iberia (NE Atlantic). Estuar. Coast. Shelf Sci. 2006, 69, 554–566. [Google Scholar] [CrossRef] [Green Version]
  2. Bertocci, I.; Araújo, R.; Oliveira, P.; Sousa-Pinto, I. Potential effects of kelp species on local fisheries. J. Appl. Ecol. 2015, 52, 1216–1226. [Google Scholar] [CrossRef] [Green Version]
  3. Tittensor, D.P.; Mora, C.; Jetz, W.; Lotze, H.K.; Ricard, D.; Berghe, E.V.; Worm, B. Global patterns and predictors of marine biodiversity across taxa. Nature 2010, 466, 1098–1101. [Google Scholar] [CrossRef] [PubMed]
  4. Ghermandi, A.; Nunes, P. A global map of coastal recreation values: Results from a spatially explicit meta-analysis. Ecol. Econ. 2013, 86, 1–15. [Google Scholar] [CrossRef]
  5. Duarte, C. Reviews and syntheses: Hidden forests, the role of vegetated coastal habitats in the ocean carbon budget. Biogeosciences 2017, 14, 301–310. [Google Scholar] [CrossRef] [Green Version]
  6. Newton, A.; Harff, J.; You, Z.J.; Zhang, H.; Wolanski, E. Sustainability of future coasts and estuaries: A synthesis. Estuar. Coast. Shelf Sci. 2016, 183, 271–274. [Google Scholar] [CrossRef]
  7. Jickells, T.D. Nutrient biogeochemistry of the coastal zone. Science 1998, 281, 217–222. [Google Scholar] [CrossRef]
  8. Harley, C.D.G.; Randall Hughes, A.; Hultgren, K.M.; Miner, B.G.; Sorte, C.J.B.; Thornber, C.S.; Rodriguez, L.F.; Tomanek, L.; Williams, S.L. The impacts of climate change in coastal marine systems. Ecol. Lett. 2006, 9, 228–241. [Google Scholar] [CrossRef] [Green Version]
  9. Rabalais, N.N.; Turner, R.E.; Díaz, R.J.; Justić, D. Global change and eutrophication of coastal waters. ICES J. Mar. Sci. 2009, 66, 1528–1537. [Google Scholar] [CrossRef]
  10. Bulleri, F.; Chapman, M.G. The introduction of coastal infrastructure as a driver of change in marine environments. J. Appl. Ecol. 2010, 47, 26–35. [Google Scholar] [CrossRef]
  11. Wernberg, T.; Russell, B.D.; Moore, P.J.; Ling, S.D.; Smale, D.A.; Coleman, M.; Steinberg, P.D.; Kendrick, G.A.; Connell, S.D. Impacts of climate change in a global hotspot for temperate marine biodiversity and ocean warming. J. Exp. Mar. Biol. Ecol. 2011, 400, 7–16. [Google Scholar] [CrossRef] [Green Version]
  12. Barbier, E.B. A global strategy for protecting vulnerable coastal populations. Science 2014, 345, 1250–1251. [Google Scholar] [CrossRef] [PubMed]
  13. Fedak, M. Marine animals as platforms for oceanographic sampling: A “win/win” situation for biology and operational oceanography. Mem. Natl. Inst. Polar Res. Spec. Issue 2004, 58, 133–147. [Google Scholar]
  14. Rudnick, D.; Davis, R.E.; Eriksen, C.C.; Fratantoni, D.M.; Perry, M.J. Underwater gliders for ocean research. Mar. Technol. Soc. J. 2004, 38, 73–84. [Google Scholar] [CrossRef]
  15. Shively, D.A.; Nevers, M.B.; Breitenbach, C.; Phanikumar, M.S.; Przybyla-Kelly, K.; Spoljaric, A.M.; Whitman, R.L. Prototypic automated continuous recreational water quality monitoring of nine Chicago beaches. J. Environ. Manag. 2016, 166, 285–293. [Google Scholar] [CrossRef]
  16. Schmidt, W.; Raymond, D.; Parish, D.; Ashton, I.G.; Miller, P.I.; Campos, C.J.; Shutler, J.D. Design and operation of a low-cost and compact autonomous buoy system for use in coastal aquaculture and water quality monitoring. Aquac. Eng. 2018, 80, 28–36. [Google Scholar] [CrossRef]
  17. Smale, D.A.; Moore, P.J. Variability in kelp forest structure along a latitudinal gradient in ocean temperature. J. Exp. Mar. Biol. Ecol. 2017, 486, 255–264. [Google Scholar] [CrossRef]
  18. Holman, R.; Haller, M. Remote sensing of the nearshore. Annu. Rev. Mar. Sci. 2013, 5, 95–113. [Google Scholar] [CrossRef] [Green Version]
  19. Brewin, R.J.W.; Hyder, K.; Andersson, A.J.; Billson, O.; Bresnahan, P.J.; Brewin, T.G.; Cyronak, T.; Dall’Olmo, G.; de Mora, L.; Graham, G.; et al. Expanding aquatic observations through recreation. Front. Mar. Sci. 2017, 4, 351. [Google Scholar] [CrossRef] [Green Version]
  20. Boss, E.; Zaneveld, J.R.V. The effect of bottom substrate on inherent optical properties: Evidence of biogeochemical processes. Limnol. Oceanogr. 2003, 48, 346–354. [Google Scholar] [CrossRef] [Green Version]
  21. Wright, S.; Hull, T.; Sivyer, D.B.; Pearce, D.; Pinnegar, J.K.; Sayer, M.D.J.; Mogg, A.O.M.; Azzopardi, E.; Gontarek, S.; Hyder, K. SCUBA divers as oceanographic samplers: The potential of dive computers to augment aquatic temperature monitoring. Sci. Rep. 2016, 6, 30164. [Google Scholar] [CrossRef] [PubMed] [Green Version]
  22. Egi, S.; Cousteau, P.Y.; Pieri, M.; Cerrano, C.; Özyigit, T.; Marroni, A. Designing a Diving Protocol for Thermocline Identification Using Dive Computers in Marine Citizen Science. Appl. Sci. 2018, 8, 2315. [Google Scholar] [CrossRef] [Green Version]
  23. Hut, R.; Tyler, S.; van Emmerik, T. Proof of concept: Temperature-sensing waders for environmental sciences. Geosci. Instrum. Methods Data Syst. 2016, 5, 45–51. [Google Scholar] [CrossRef]
  24. Bresnahan, P.J.; Wirth, T.; Martz, T.R.; Andersson, A.J.; Cyronak, T.; D’Angelo, S.; Pennise, J.; Melville, W.K.; Lenain, L.; Statom, N. A sensor package for mapping pH and oxygen from mobile platforms. Methods Oceanogr. 2016, 17, 1–13. [Google Scholar] [CrossRef] [Green Version]
  25. Griffiths, A.; Kemp, K.; Matthews, K.; Garrett, J.; Griffiths, D. Sonic Kayaks: Environmental monitoring and experimental music by citizens. PLoS Biol. 2017, 15, e2004044. [Google Scholar] [CrossRef] [PubMed] [Green Version]
  26. Lauro, F.M.; Senstius, S.J.; Cullen, J.; Neches, R.; Jensen, R.M.; Brown, M.V.; Darling, A.E.; Givskov, M.; McDougald, D.; Hoeke, R.; et al. The Common Oceanographer: Crowdsourcing the Collection of Oceanographic Data. PLoS Biol. 2014, 12, e1001947. [Google Scholar] [CrossRef] [Green Version]
  27. Brewin, R.J.W.; de Mora, L.; Jackson, T.; Brewin, T.G.; Shutler, J. On the potential of surfers to monitor environmental indicators in the coastal zone. PLoS ONE 2015, 10, e0127706. [Google Scholar] [CrossRef]
  28. Bresnahan, P.J.; Cyronak, T.; Martz, T.; Andersson, A.; Waters, S.; Stern, A.; Richard, J.; Hammond, K.; Griffin, J.; Thompson, B. Engineering a Smartfin for surf-zone oceanography. In Proceedings of the OCEANS 2017, Anchorage, AK, USA, 18–21 September 2017; pp. 1–4. [Google Scholar]
  29. GCOS. Systematic Observation Requirements from Satellite-Based Data Products for Climate; Technical Report; World Meteorological Organisation (WMO): Geneva, Switzerland, 2011. [Google Scholar]
  30. Bojinski, S.; Verstraete, M.; Peterson, T.; Richter, C.; Simmons, A.; Zemp, M. The concept of essential climate variables in support of climate research, applications, and policy. Bull. Am. Meteorol. Soc. 2014, 95, 1431–1443. [Google Scholar] [CrossRef]
  31. Wong, P.P.; Losada, I.J.; Gattuso, J.P.; Hinkel, J.; Khattabi, A.; McInnes, K.L.; Saito, Y.; Sallenger, A. Climate Change 2014: Impacts, Adaptation, and Vulnerability. Part A: Global and Sectoral Aspects. Contribution of Working Group II to the Fifth Assessment Report of the Intergovernmental Panel of Climate Change; Cambridge University Press: Cambridge, UK; New York, NY, USA, 2014; Chapter Coastal Systems and Low-Lying Areas; pp. 361–409. [Google Scholar]
  32. Butt, T.; Russell, P.E.; Grigg, R. Surf Science: An Introduction to Waves for Surfing.; University of Hawaii Press: Honolulu, HI, USA; Alison Hodge Publishers: Cornwall, UK, 2004; p. 144. ISBN1 0 8248 2891 7 (USA). ISBN2 0 906720 36 2 (UK). [Google Scholar]
  33. Reineman, D.R. The utility of surfers’ wave knowledge for coastal management. Mar. Policy 2016, 67, 139–147. [Google Scholar] [CrossRef]
  34. Brewin, R.J.W.; de Mora, L.; Billson, O.; Jackson, T.; Russell, P.; Brewin, T.G.; Shutler, J.; Miller, P.I.; Taylor, B.H.; Smyth, T.; et al. Evaluating operational AVHRR sea surface temperature data at the coastline using surfers. Estuar. Coast. Shelf Sci. 2017, 196, 276–289. [Google Scholar] [CrossRef]
  35. Brewin, R.J.W.; Smale, D.A.; Moore, P.J.; Dall’Olmo, G.; Miller, P.I.; Taylor, B.; Smyth, T.J.; Fishwick, J.R.; Yang, M. Evaluating Operational AVHRR Sea Surface Temperature Data at the Coastline Using Benthic Temperature Loggers. Remote Sens. 2018, 10, 925. [Google Scholar] [CrossRef] [Green Version]
  36. Smartfin website. Available online: http://smartfin.org/ (accessed on 22 November 2019).
  37. Bonney, R.; Shirk, J.; Phillips, T.; Wiggins, A.; Ballard, H.; Miller-Rushing, A.; Parrish, J. Next, steps for citizen science. Science 2014, 343, 1436–1437. [Google Scholar] [CrossRef] [PubMed]
  38. Garcia-Soto, C.; van der Meeren, G.I.; Busch, J.A.; Delany, J.; Domegan, C.; Dubsky, K.; Fauville, G.; Gorsky, G.; von Juterzenka, K.; Malfatti, F.; et al. Advancing Citizen Science for Coastal and Ocean Research; Position Paper 23; French, V., Kellett, P., Delany, J., McDonough, N., Eds.; European Marine Board: Ostend, Belgium, 2017; 112p, ISBN 978-94-92043-30-6. [Google Scholar]
  39. Bahr, K.D.; Jokiel, P.L.; Rodgers, K.S. Influence of solar irradiance on underwater temperature recorded by temperature loggers on coral reefs. Limnol. Oceanogr. Methods 2016, 14, 338–342. [Google Scholar] [CrossRef]
  40. Smyth, T.J.; Fishwick, J.R.; Gallienne, C.P.; Stephens, J.A.; Bale, A.J. Technology, Design, and Operation of an Autonomous Buoy System in the Western English Channel. J. Atmos. Ocean. Technol. 2010, 27, 2056–2064. [Google Scholar] [CrossRef]
  41. Brewin, R.J.W.; de Mora, L.; Jackson, T.; Brewin, T.G.; Shutler, J.; Billson, O. Sea Surface Temperature (SST) Measurements Collected by Surfers around the Southern UK and Western Ireland Coastline between 2014 and 2017; British Oceanographic Data Centre—Natural Environment Research Council: Swindon, UK, 2017. [Google Scholar] [CrossRef]
  42. Forsythe, W.C.; Rykiel, E.J., Jr.; Stahl, R.S.; Wu, H.; Schoolfield, R.M. A model comparison for day length as a function of latitude and day of year. Ecol. Model. 1995, 80, 87–95. [Google Scholar]
  43. Pineda, J. Predictable upwelling and the shoreward transport of planktonic larvae by internal tidal bores. Science 1991, 253, 548–549. [Google Scholar] [CrossRef]
  44. Checkley, D., Jr.; Lindegren, M. Sea surface temperature variability at the Scripps Institution of Oceanography Pier. J. Phys. Oceanogr. 2014, 44, 2877–2892. [Google Scholar] [CrossRef] [Green Version]
  45. Sinnett, G.; Feddersen, F.; Lucas, A.; Pawlak, G.; Terrill, E. Observations of nonlinear internal wave run-up to the surfzone. J. Phys. Oceanogr. 2018, 48, 531–554. [Google Scholar] [CrossRef]
  46. Sinnett, G.; Feddersen, F. The Nearshore Heat Budget: Effects of Stratification and Surfzone Dynamics. J. Geophys. Res. Oceans 2019, 124. [Google Scholar] [CrossRef]
  47. Moré, J. The Levenberg-Marquardt Algorithm: Implementation and Theory. In Numerical Analysis; Springer: Berlin, Germany, 1978; Chapter The Levenberg-Marquardt Algorithm: Implementation and Theory; p. 105. [Google Scholar]
  48. Markwardt, C.B. Nonlinear least squares fitting in IDL with MPFIT. In Proceedings of the Astronomical Data Analysis Software and Systems XVIII, ASP Conference Series, Quebec, Canada; Bohlender, D., Dowler, P., Duran, D., Eds.; Astronomical Society of the Pacific: San Francisco, CA, USA, 2008; Volume 411. [Google Scholar]
  49. Efron, B. Bootstrap methods: Another look at the jackknife. Ann. Stat. 1979, 7, 1–26. [Google Scholar] [CrossRef]
  50. Brewin, R.J.W.; Sathyendranath, S.; Jackson, T.; Barlow, R.; Brotas, V.; Airs, R.; Lamont, T. Influence of light in the mixed layer on the parameters of a three-component model of phytoplankton size structure. Remote Sens. Environ. 2015, 168, 437–450. [Google Scholar] [CrossRef]
  51. Gould, R., Jr.; Ko, D.; Ladner, S.; Lawson, T.; MacDonald, C. Comparison of Satellite, Model, and In Situ Values of Photosynthetically Available Radiation (PAR). J. Atmos. Ocean. Technol. 2019, 36, 535–555. [Google Scholar] [CrossRef]
  52. Brewin, R.J.W.; Cyronak, C.; Bresnahan, P.J.; Andersson, A.J.; Richard, J.; Hammond, K.; Billson, O.; de Mora, L.; Jackson, T.; Smale, D.; et al. Sea Surface Temperature (SST) Measurements Collected by Surfers around the Coastlines of the Southern UK, Western Ireland, and San Diego, US, between 2014 and 2018; British Oceanographic Data Centre—Natural Environment Research Council: Swindon, UK, 2020. [Google Scholar] [CrossRef]
  53. O’Brien, D.; Ponting, J. STOKE Certified: Initiating sustainability certification in surf tourism. In Handbook on Sport, Sustainability, and the Environment; McCullough, B., Kellison, T., Eds.; Milton: Routledge, UK, 2018; pp. 301–316. [Google Scholar]
  54. Cooper, S.; Khatib, F.; Treuille, A.; Barbero, J.; Lee, J.; Beenen, M.; Leaver-Fay, A.; Baker, D.; Popović, Z.; players, F. Predicting protein structures with a multiplayer online game. Nature 2010, 466, 756–760. [Google Scholar] [CrossRef] [PubMed] [Green Version]
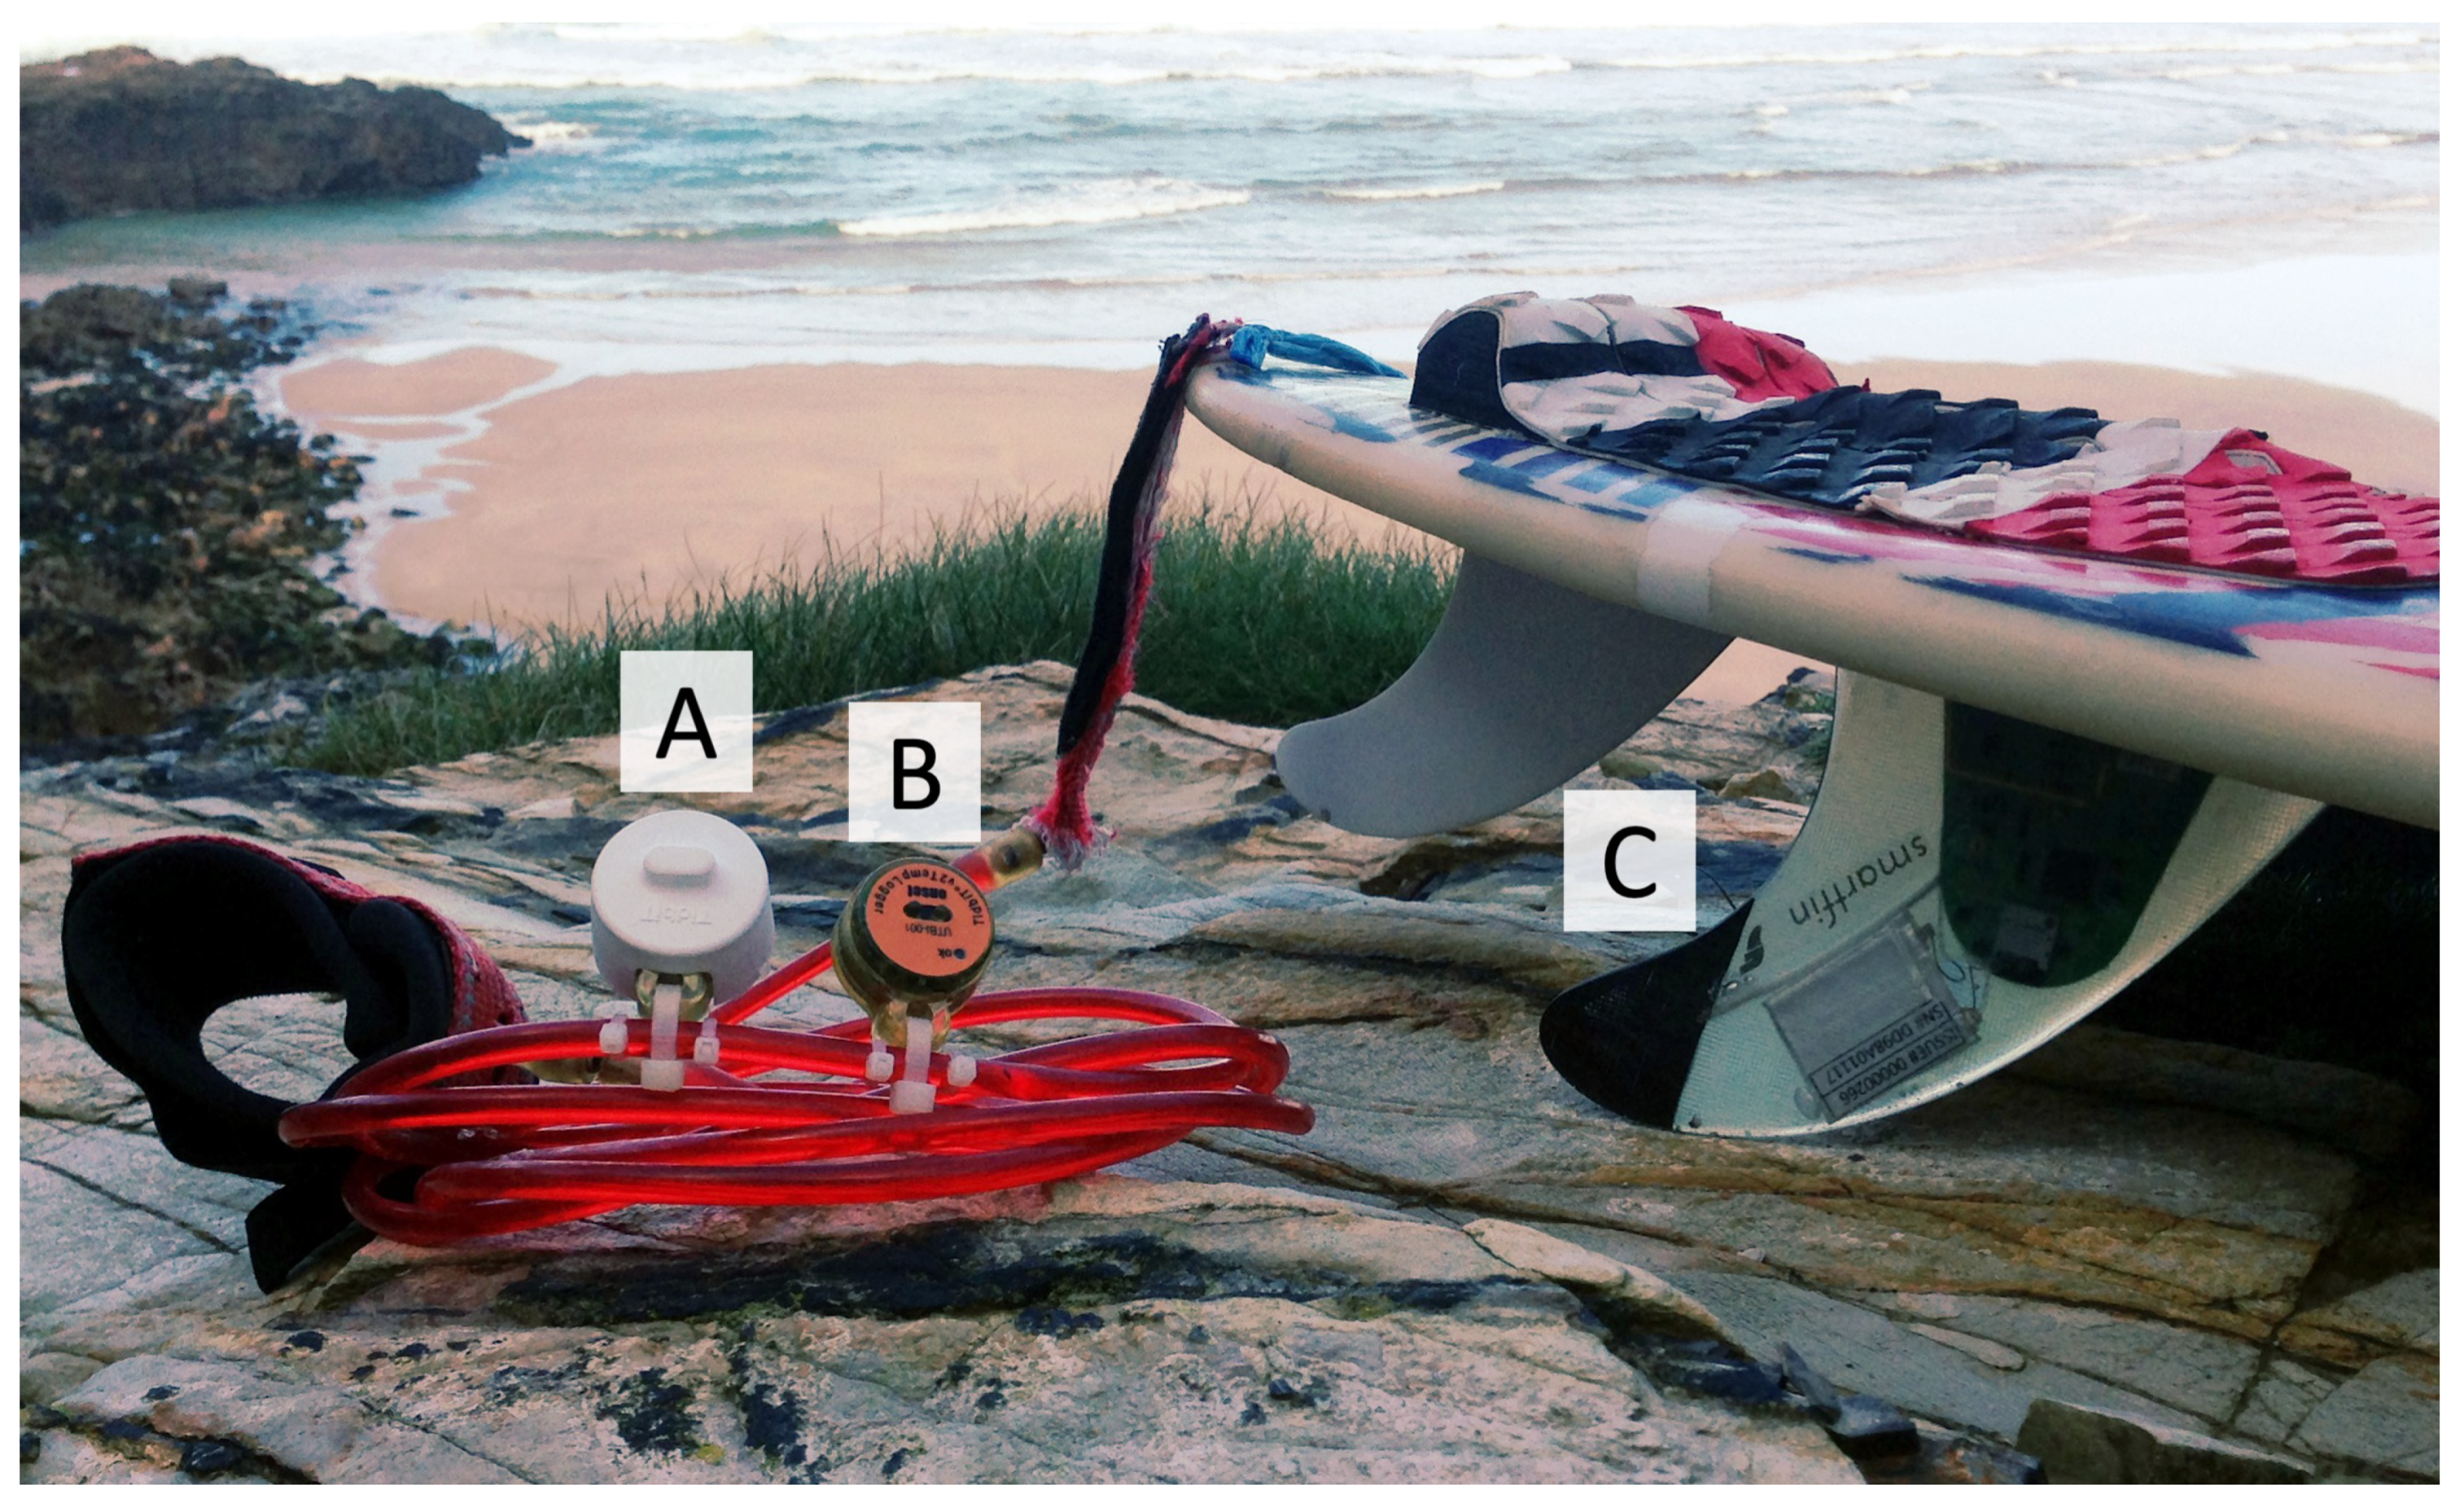
Figure 1. Experimental set-up. Surfing equipment with integrated temperature sensors. Two TidbiT v2 sensors attached to surfboard leash (tether connecting surfer and surfboard), one with (A) and one without (B) a white protective boot, designed to protect the sensor from solar heating. Smartfin (C) attached to underside of the surfboard.
Oceans 01 00002 g001
Figure 2. Approximate depth of sensors (TidbiT v2 in red and Smartfin in blue) when surfer is (a) stationary (∼60% of the time, see Table 1 of [27]) and (b) paddling or surfing (∼40% of the time, see Table 1 of [27]).
Oceans 01 00002 g002
Figure 3. Example of the temperature data processing from a session on 30 March 2018 in the southwest UK, to extract the sea surface temperature (SST) from each sensor (shown in brackets).
Oceans 01 00002 g003
Figure 4. Study sites. (a) a total of 148 surfing session took place during the study, 90 in the southwest UK, and 58 in San Diego, US; (b) data collected near La Jolla; (c) data collected in the southwest UK; (d) data collected at Bovisand Beach in Plymouth.
Oceans 01 00002 g004
Figure 5. Scatter plots of SST measurements from the various surfing techniques. (a) SST derived from the Smartfin Internal sensor (SI) plotted as a function of SST from the Smartfin External sensor (SE); (b) SST derived from the Leash with unprotected TidbiT v2 (LU) plotted as a function of SST from the Leash with protected TidbiT v2 (LP); (c) SST derived from the Leash with unprotected TidbiT v2 (LU) plotted as a function of SST from the Smartfin External sensor (SE); (d) SST derived from the Leash with protected TidbiT v2 (LP) plotted as a function of SST from the Smartfin External sensor (SE); r 2 is the coefficient of determination, ϵ the mean absolute deviation, δ the mean bias, and N the number of samples. Statistics coloured black indicate all data, blue UK data, and red US data.
Oceans 01 00002 g005
Figure 6. Histograms of the residuals between SST measurements from the various surfing techniques. (a) SST derived from the Smartfin External sensor (SE) minus SST from the Smartfin Internal sensor (SI); (b) SST derived from the Leash with unprotected TidbiT v2 (LU) minus SST from the Leash with protected TidbiT v2 (LP); (c) SST derived from the Leash with unprotected TidbiT v2 (LU) minus SST from the Smartfin External sensor (SE); (d) SST derived from the Leash with protected TidbiT v2 (LP) minus SST from the Smartfin External sensor (SE).
Oceans 01 00002 g006
Figure 7. Comparison of SST data collected at Bovisand beach in the UK by surfers using a leash with unprotected TidbiT v2 (LU), protected TidbiT v2 (LP) and Smartfin External sensor (SE), with water temperature data from a benthic temperature logger (BTL) at a nearby kelp site (∼6 km from Bovisand). (a,b) show a comparison of LU data with the BTL, (c,d) LP data with the BTL, and (e,f) SE data with the BTL. r 2 is the coefficient of determination, ϵ the mean absolute deviation, δ the mean bias, and N the number of samples.
Oceans 01 00002 g007
Figure 8. Comparison of SST data collected near to Scripps Pier in the US by surfers using a leash with unprotected TidbiT v2 (LU), protected TidbiT v2 (LP) and Smartfin External sensor (SE), with water temperature data from a Scripps pier. (a,b) show a comparison of LU data with the Scripps pier; (c,d) LP data with the Scripps pier, and (e,f) SE data with the Scripps pier. r 2 is the coefficient of determination, ϵ the mean absolute deviation, δ the mean bias, and N the number of samples.
Oceans 01 00002 g008
Figure 9. Residuals between SST measurements from the various surfing techniques plotted as a function of irradiance (I) at the mid-point of the surf. (a) SST derived from the Leash with unprotected TidbiT v2 (LU) minus SST from the Smartfin External sensor (SE) plotted as a function of I; (b) SST derived from the Leash with unprotected TidbiT v2 (LU) minus SST from the Leash with protected TidbiT v2 (LP) plotted as a function of I; (c) SST derived from the Leash with protected TidbiT v2 (LP) minus SST from the Smartfin External sensor (SE) plotted as a function of I. r 2 is the coefficient of determination and ϵ the mean absolute deviation from the model fits.
Oceans 01 00002 g009
Figure 10. Comparison of historic and corrected (following Equation (6)) SST measurements derived from the Leash with unprotected TidbiT v2 (LU) at Bovisand and Wembury beach near Plymouth, UK, and SST data from Station L4 buoy in the Western Channel Observatory. (a) locations of SST data collected at the two beaches (Wembury and Bovisand) and Station L4; (b) time-series of SST acquired by the surfer at the two beaches using the LU method overlain onto the SST data from Station L4; (c) scatter plots of hourly match-ups between SST acquired by the surfer at the beaches using the LU method and SST data from Station L4; (d) time-series of SST acquired by the surfer at the two beaches using the LU method, corrected using Equation (6), overlain onto the SST data from Station L4; (e) scatter plots of hourly match-ups between SST acquired by the surfer at the beaches using the LU method, corrected using Equation (6), and SST data from Station L4. r 2 is the coefficient of determination, ϵ the mean absolute difference, δ the bias, and N the number of samples.
Oceans 01 00002 g010