Abstract
Computer vision is one of the key technologies of advanced driver assistance systems (ADAS), but the incorporation of a vision-based driver assistance system (still) poses a great challenge due to the special characteristics of the algorithms, the neural network architecture, the constraints, and the strict hardware/software requirements that need to be met. The aim of this study is to show the influence of image resolution in traffic lane detection using a virtual dataset from virtual simulation environment (CARLA) combined with a real dataset (TuSimple), considering four performance parameters: Mean Intersection over Union (mIoU), F1 precision score, Inference time, and processed frames per second (FPS). By using a convolutional neural network (U-Net) specifically designed for image segmentation tasks, the impact of different input image resolutions (512 × 256, 640 × 320, and 1024 × 512) on the efficiency of traffic line detection and on computational efficiency was analyzed and presented. Results indicate that a resolution of 512 × 256 yields the best trade-off, offering high mIoU and F1 scores while maintaining real-time processing speeds on a standard CPU. A key contribution of this work is the demonstration that combining synthetic and real datasets enhances model performance, especially when real data is limited. The novelty of this study lies in its dual analysis of simulation-based data and image resolution as key factors in training effective lane detection systems. These findings support the use of synthetic environments in training neural networks for autonomous driving applications.
1. Introduction
According to the World Health Organization, nearly one-third of the global population will reside in cities by 2030, resulting in many new challenges in urban areas, especially in transportation. Recognizing this challenge, the European Commission released the Transport White Paper in 2011 [1], highlighting the need for innovative mobility solutions to ensure sustainability and safety in transportation. In terms of safety, the paper set a goal to reduce the number of fatalities caused by road accidents in the EU by half between 2010 and 2020. Despite this, over 25,700 people lost their lives on EU roads in 2014 alone, with many of these accidents attributed to improper driver behavior. Furthermore, the National Highway Traffic Safety Administration (NHTSA), reported [2] that human factors contribute to 94% of road accidents. These factors include inappropriate speed, driver distraction, and age-related issues such as impaired vision, slower reflexes, and reduced joint mobility.
Considering the above facts, new technologies such as autonomous driving (AD) and advanced driver assistance systems (ADAS) have been at the center of research and development in recent decades. Advanced driver assistance systems (ADAS) are essential through direct contributions related to improving safety by significantly reducing human error, improving the driving experience through systems that relieve the driver of monitoring the journey, and reducing road accidents by automating responses to dangerous traffic situations. Through the primary results obtained and with the development of hardware and software components and systems, AD technology has made significant progress in its applicability in the automotive and transportation industries, being considered one of the emerging technologies of the fourth industrial revolution. The initial challenging and unresolved issues regarding safety and implementation in vehicle construction and operation were resolved once modern Artificial Intelligence (AI) methods emerged through Deep Learning (DL) processes, supported by:
- Advances in computer vision;
- Data and knowledge accumulated in vehicle dynamics;
- Development and availability of new sensors;
- Datasets for different operating situations;
- Hyper-realistic simulators.
Thus, more and more advanced driver assistance systems are being implemented, which either alert the driver to dangerous situations that may arise in traffic or take measures or assist the driver in difficult situations. However, it should be remembered that, currently, the successful development and implementation of a reliable and fully functional autonomous driving system represents one of the most difficult challenges and tasks in automotive engineering.
The main challenge in the development of ADAS systems is the perception problem [3] or, in other words, how vehicles based on sensors interpret the world around them (other vehicles, pedestrians, obstacles, roads, lanes, etc.—all components of traffic environments). Semi- and fully autonomous vehicles are expected to share the road with human drivers, so the main perceptual cues for an AD or ADAS system remain the same as for humans. The main cues that human drivers use to indicate the route they intend to follow are, for example, road markings and road boundaries; autonomous driving systems must fulfill this task while ensuring traffic safety. Therefore, the most promising path for autonomous driving systems remains the perception of the road, lane, and markings using traditional cues [4].
Determining road boundaries and the number and location of traffic lanes in diverse contexts, including urban, rural, and highway contexts, are essential components of road and lane perception. Despite significant advances in recent years, current perceptual systems still struggle with this type of understanding, and several types of sensors have been tested and researched for road and lane understanding: monocular vision (a single video camera), stereo vision, LIDAR, vehicle dynamics information obtained from the vehicle computer or an inertial measurement unit (IMU), and global positioning information obtained using the global positioning system (GPS) [5,6]. Since markings are designed for human vision, the most advanced area of research in lane detection is the ability to accurately obtain road and lane data through the visual process. Other complementary systems, such as GPS and LIDAR, provide additional information (which can validate the data obtained through vision).
These road and lane detection processes provide a lot of data necessary for interpretation and thus lend themselves to the use of DL methods. Vision-based deep learning DL systems for various functions in AD and ADAS have made and continue to make significant progress in recent years [7,8]. State-of-the-art neural networks now achieve remarkable results on public, real-world benchmarks, but for training neural networks, it must be remembered that they require large, large-scale, labeled datasets (structured data). Obtaining these datasets is a difficult, time-consuming, and relatively expensive process. In this regard, current research is focused on the possibility of acquiring labeled training data using simulation environments (e.g., CARLA [9]). While numerous works have demonstrated the effectiveness of deep learning-based lane detection using either real or synthetic datasets, relatively few have explored the integration of synthetic and real-world data to enhance model robustness. Additionally, limited research exists on understanding how image resolution affects the trade-off between lane detection accuracy and computational efficiency. This study addresses both gaps by evaluating a U-Net segmentation model trained on real, synthetic, and mixed datasets across multiple image resolutions to identify an optimal configuration for effective and efficient lane detection.
2. Related Work
Lane detection is a fundamental capability that enables fully functional autonomous driving systems. Over the past decade, numerous approaches have been proposed for lane detection, which can generally be categorized along two key dimensions: Model-based vs. Learning-based methods and Real-world vs. Synthetic datasets.
2.1. Model-Based vs. Learning-Based Methods
Model-based techniques rely on geometric models and traditional image processing algorithms—such as edge detection and Hough transforms—to identify lane features. These methods are usually lightweight but often struggle under complex environmental conditions. For example, Shashidhar et al. [10] used a model-based approach combining Gaussian filtering, Canny edge detection, and the Hough transformation to achieve a 92% accuracy in band detection. Learning-based methods, on the other hand, employ deep learning techniques and convolutional neural networks (CNNs) to learn features directly from image data. These approaches have demonstrated superior accuracy and adaptability to changing environments, such as poor lighting or adverse weather conditions. Swain and Tripathy [11] developed a YOLOV5-based lane detection model using extensive preprocessing and achieved 89% accuracy at 48 FPS. Song et al. [12] proposed IAED, a CNN with attention modules, improving robustness in complex environments. Liu et al. [13] introduced a top-down lane detection architecture with conditional convolution and a recurrent instance module, while Baek et al. [14] and Chng et al. [15] focused on real-time performance improvements with CNN-based models.
2.2. Real-World vs. Synthetic Datasets
Many traditional and learning-based methods have relied solely on real-world datasets like TuSimple and CULane. On the other hand, synthetic datasets generated using simulation platforms have gained popularity, and the open-source virtual simulation environment CARLA offers several benefits related to the number of sensors that can be synthesized, ground annotations, and the diversity of adverse weather conditions (compared to other virtual simulation environments) [16,17,18]. They allow for scenario customization and large-scale data generation, and furthermore, the datasets offer the possibility of investigating valuable real-world traffic scenarios involving rare or boundary conditions. Examples of the use of this advantage in research are those published by Swain and Tripathy [10], Song et al. [12], and Liu et al. [13] who conducted experiments using the TuSimple and CULane databases to validate their learning-based methods. Furthermore, to benefit from the advantages offered by virtual simulation environments, Jeon et al. [19] used CARLA to evaluate the performance of sensors in heavy rain and found that the detection accuracy, especially for curved lanes, decreased with increasing precipitation (something difficult to achieve in real traffic conditions).
2.3. Our Contribution
Unlike most prior studies, this work investigates the trade-off between image resolution and performance, and it combines both real and synthetic data for training. The use of CARLA as a simulation environment allows for efficient generation of high-quality labeled data and the modeling of rare scenarios. By comparing three different input resolutions (512 × 256, 640 × 320, and 1024 × 512), this study identifies an optimal setting that balances accuracy (mIoU and F1 score) and real-time performance (inference time and FPS). Training was conducted using three dataset configurations: images solely from CARLA (3890 labeled), solely from TuSimple (3626 labeled), and a balanced mix (1750 from each). The model’s performance was evaluated using four key metrics: Mean Intersection over Union (mIoU), F1 precision score, inference time, and processed frames per second (FPS).
3. Materials and Methods
3.1. CARLA (CAR Learning to Act) Simulation Environment
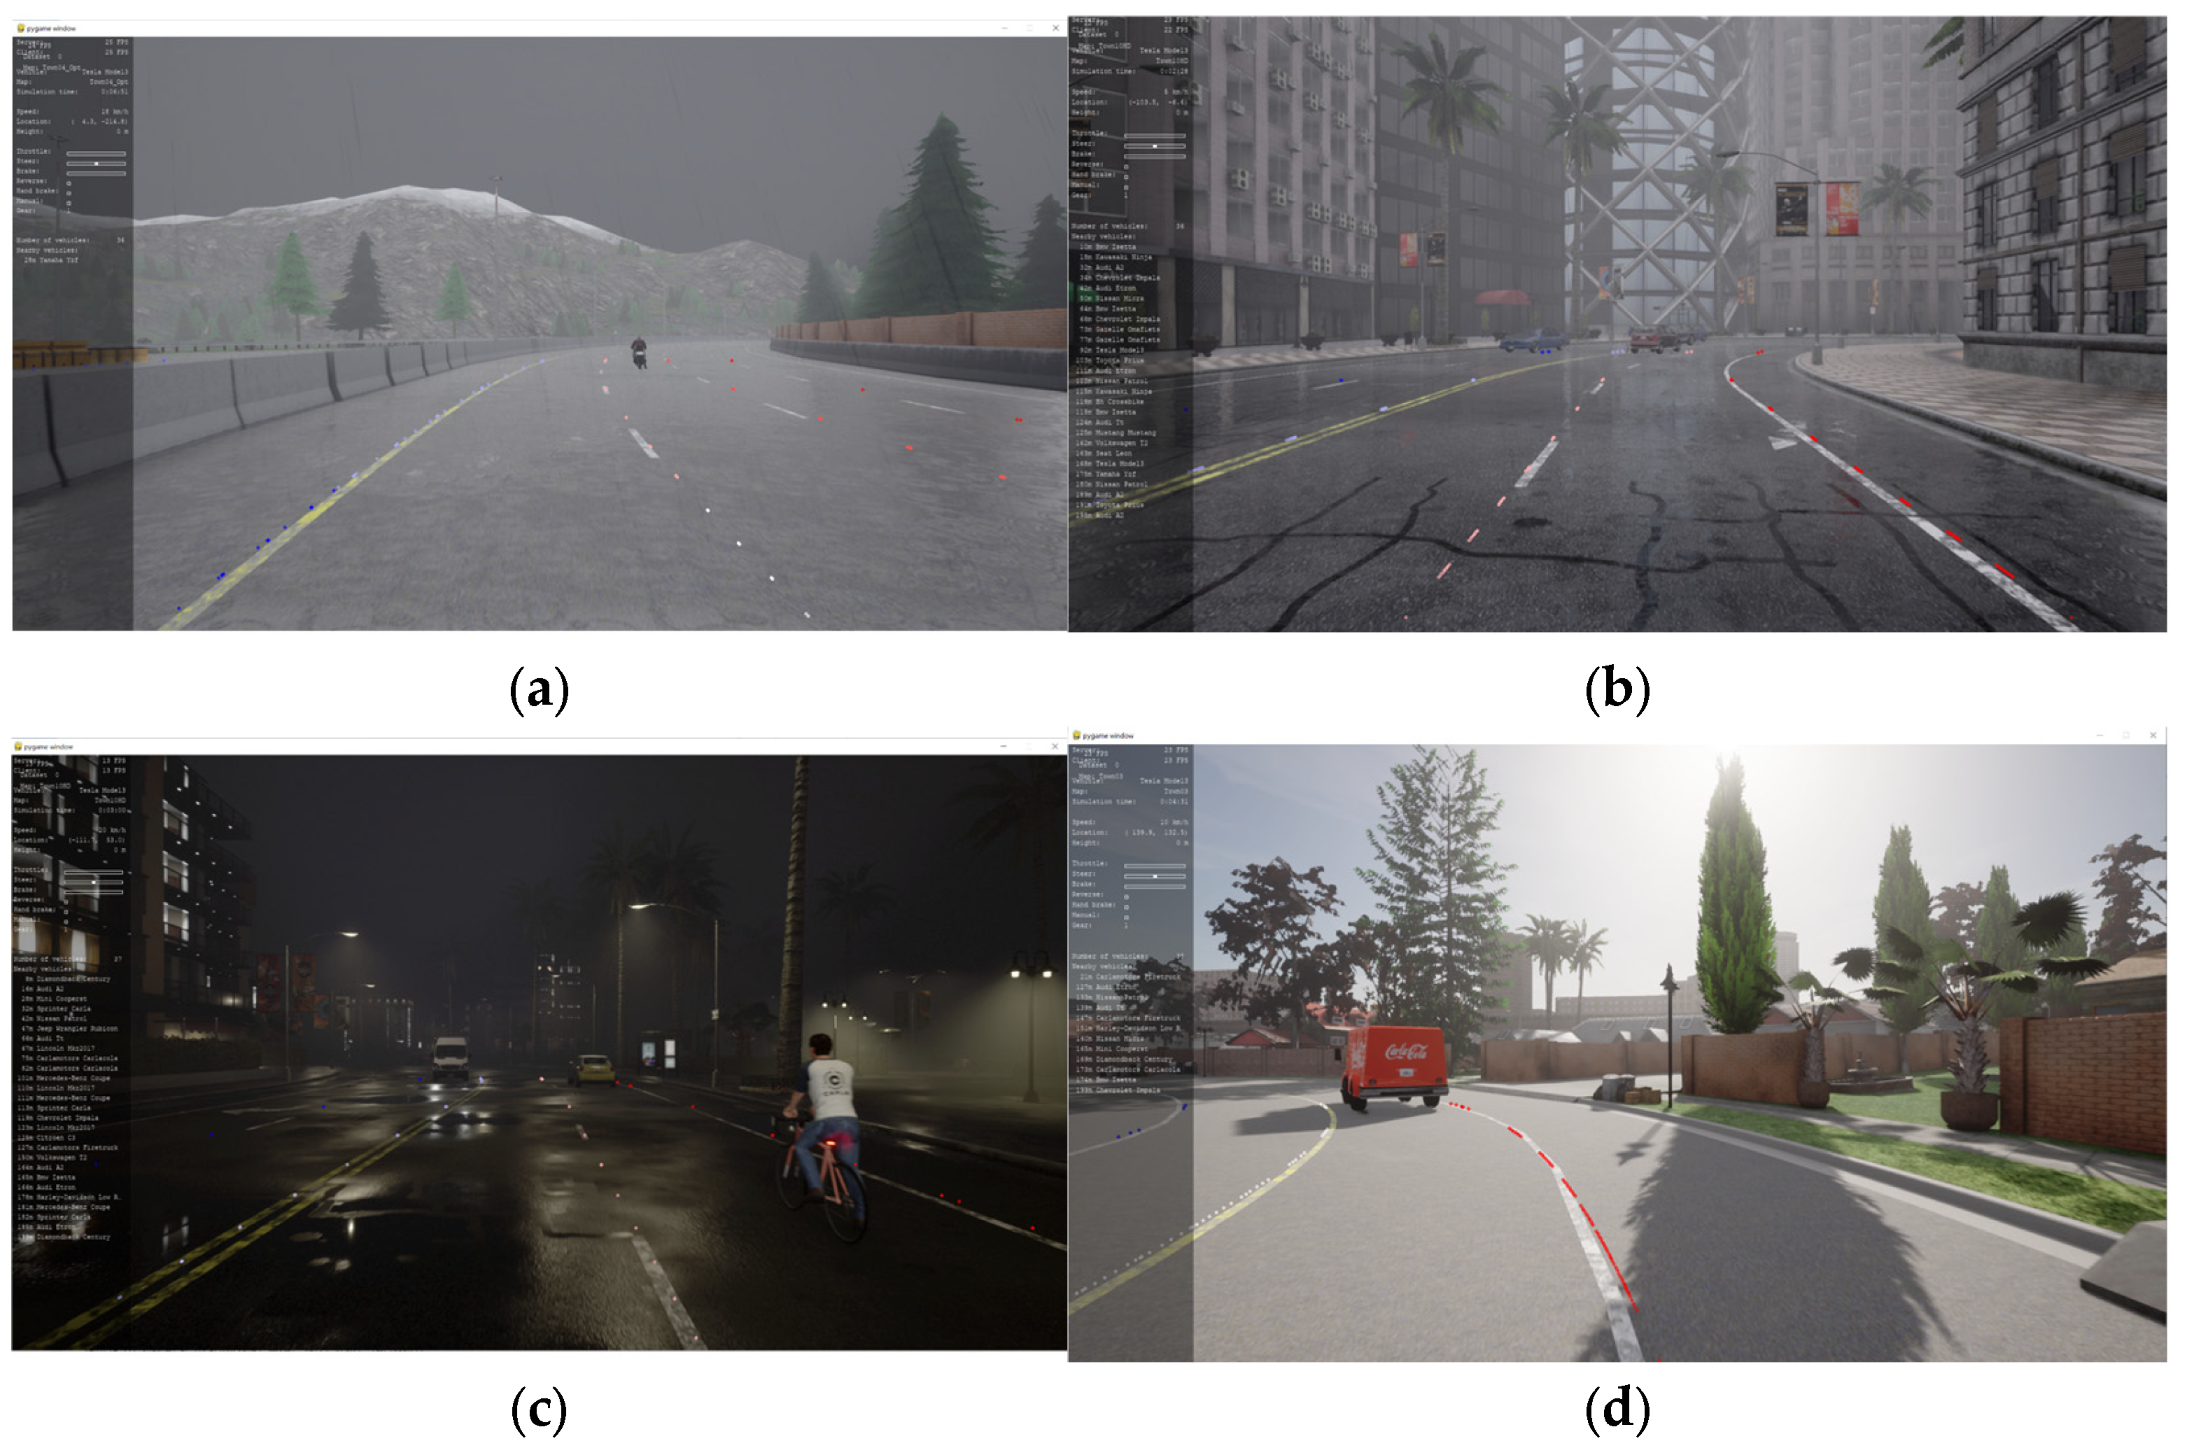
The CARLA (Car Learning to Act) simulation environment is an open-source simulator for urban environment simulation, focusing on creating a publicly available virtual environment applicable to specific requirements in the automotive industry. Many individual contributors are constantly working to improve it, and as a result, the current version of the CARLA simulation environment (version 0.9.12) is a powerful and suitable tool for simulating real-world scenarios. CARLA was developed from the ground up to support training, prototyping, and validation of autonomous driving models, both on the perception and control side. CARLA was developed from scratch based on the Unreal Engine to use the Open DRIVE standard for defining roads and possible urban environments in which traffic flows. Uniquely, the urban environment content provided with CARLA is also free of charge and the game engine offers state-of-the-art rendering quality (realistic physics, basic logic for NPCs or Non-Player Characters, etc.). Various urban planning scenarios include a multitude of vehicle models, buildings, pedestrians, road signs, etc. The simulation supports flexible sensor configuration and provides signals that can be used to train autonomous driving software, such as GPS coordinates, speed, acceleration, detected objects, and detailed data on collisions with objects or other road users. A wide range of environmental conditions can be specified, including weather and time of day, and several such environmental conditions are illustrated in Figure 1.
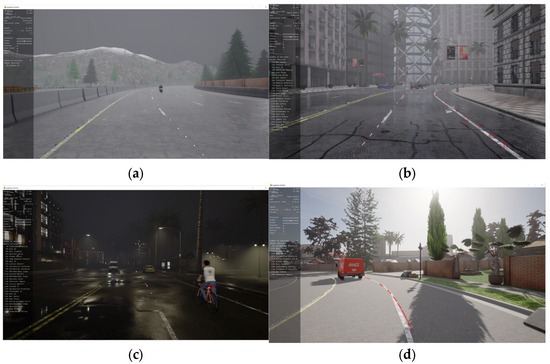
Figure 1.
Examples of environmental scenarios in CARLA: (a) Daytime and cloudy, highway; (b) rain, urban; (c) night, urban; (d) daytime, clear sky, suburbia.
CARLA offers the possibility to obtain images in every simulation step from the sensors via python.api, and CARLA maps are based on open drive maps. Open DRIVE files contain detailed information about the road layout, including lane markings, road geometry, and junctions. The simulated vehicle is called “ego vehicle”, a vehicle to which the camera sensor is attached. Both the autopilot (initially implemented) and manual control are used for data collection. The autopilot only allows navigation through urban areas (cities) via reference points, which leads to limitations related to no multiple lane changes, no approaches to the vehicle in front, no exit from a parking space without giving priority, no speed limits are exceeded, and so on. So, to cover these ideal situations and simulate the real situation as faithfully as possible, manual control is used.
3.2. Testing the Virtual Dataset Quality
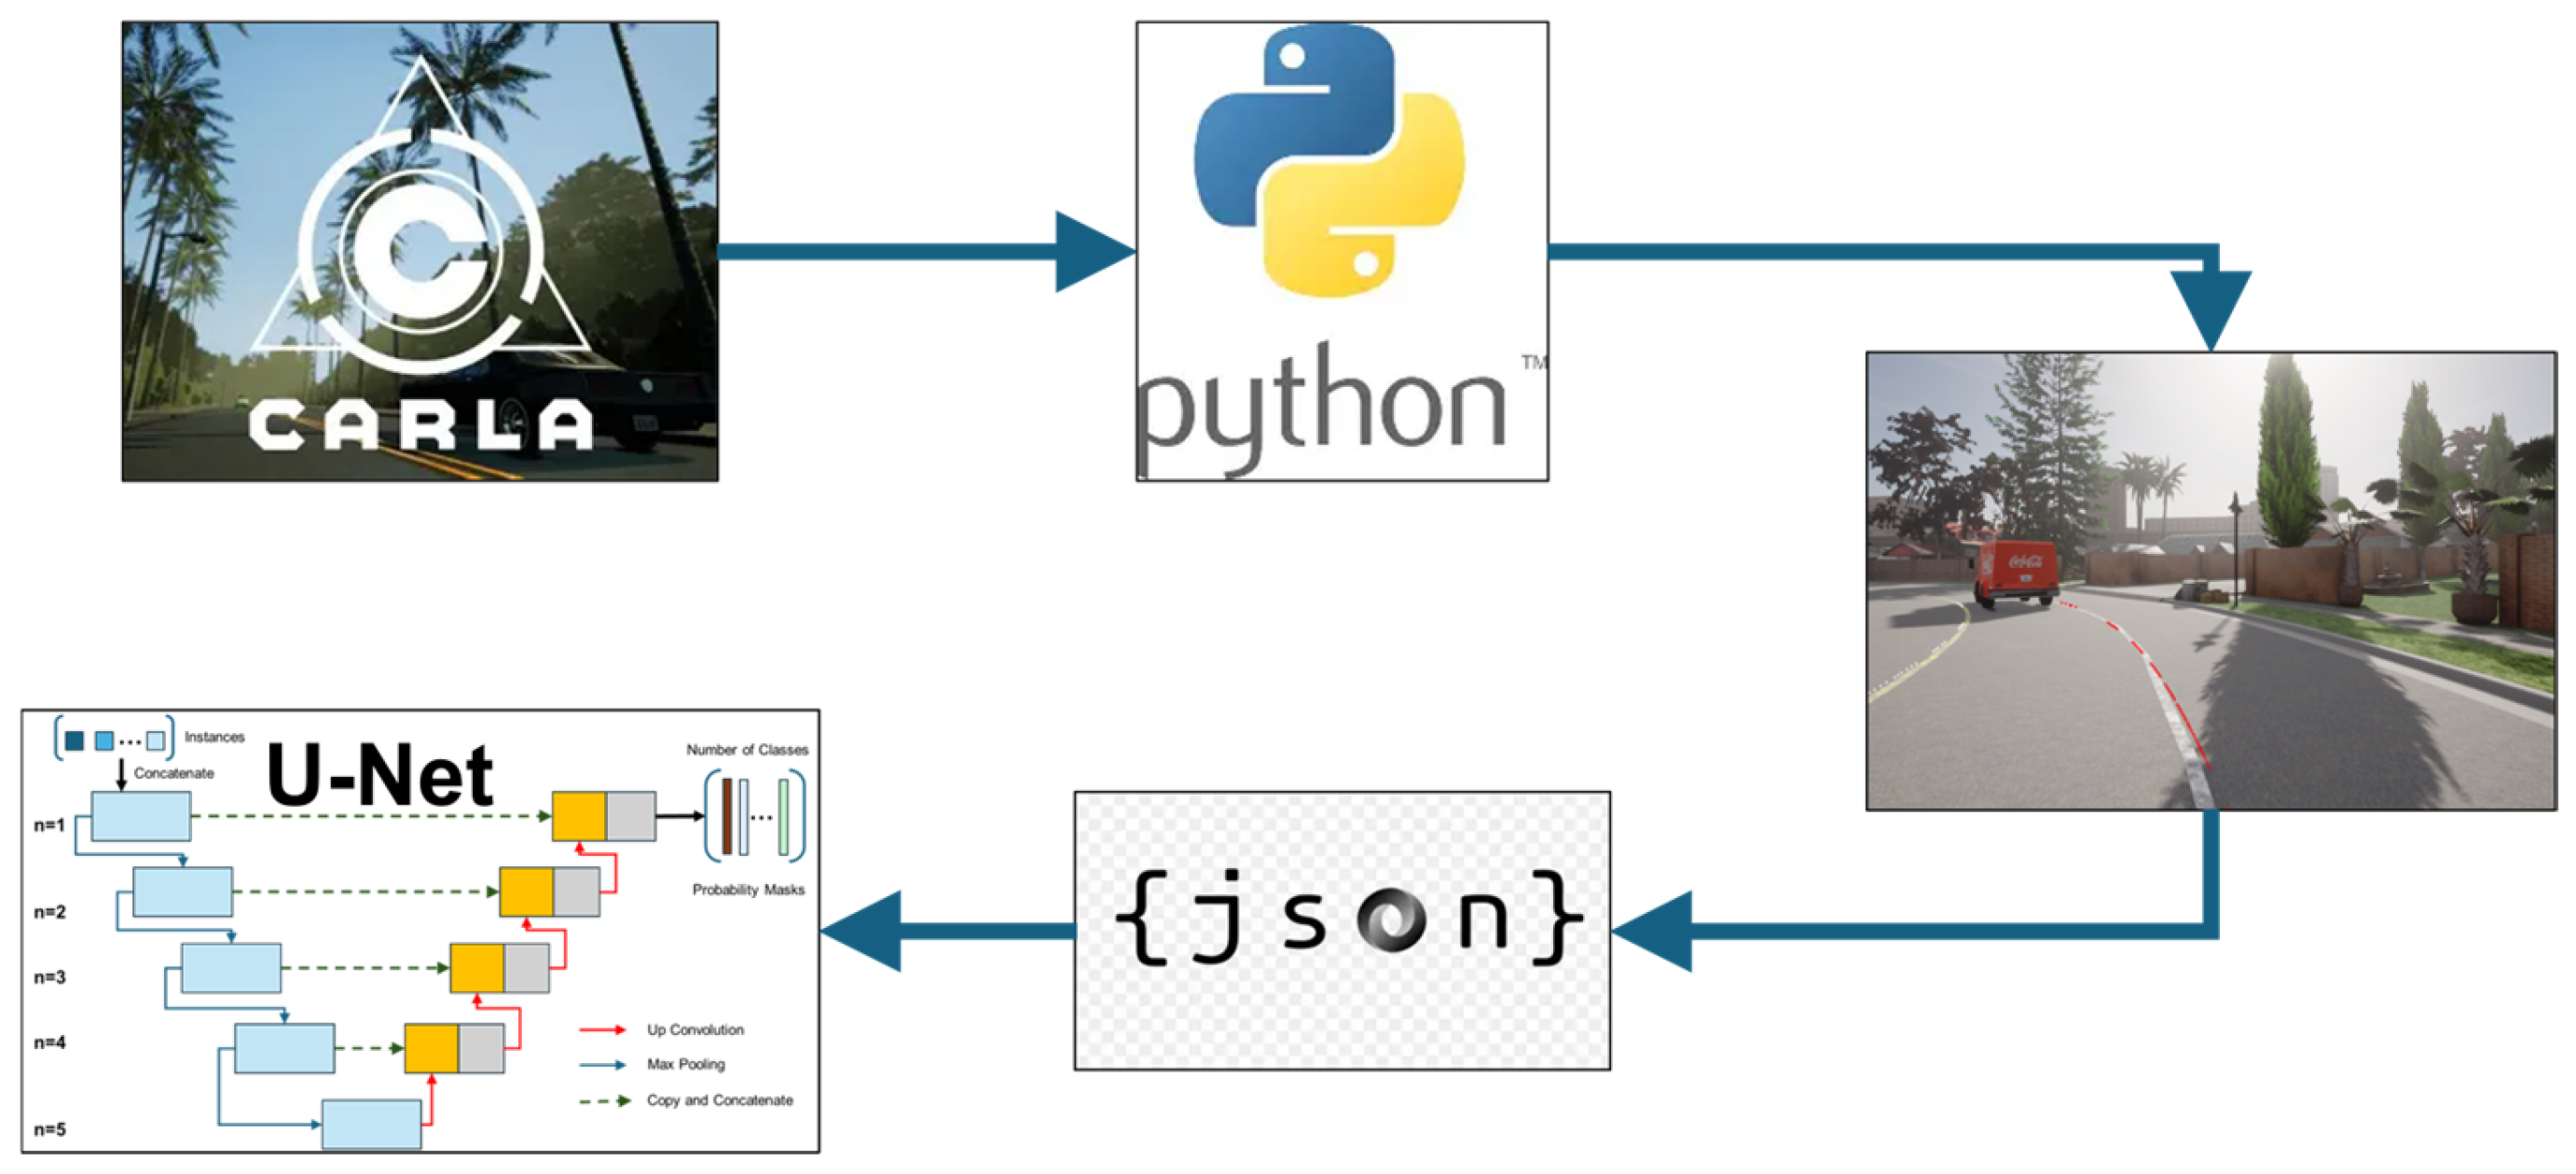
The ego vehicle operates within the speed limits defined by traffic signs. To enhance the diversity of collected images, weather conditions are changed after every 100 saved frames, and other vehicles and pedestrians appear randomly in the urban simulation environment (Figure 1). Lane information is saved in JSON format, storing the coordinates of the lane markings. These coordinates are then transformed from the map reference system to the optical camera coordinate system. Using this data, binary lane masks are created by drawing the lanes on the image based on the transformed coordinates (Figure 2).

Figure 2.
Virtual dataset generation process using CARLA.
To evaluate the quality of the virtual dataset, the following method was used: a neural network was trained on the newly generated CARLA dataset, and the same network was trained separately on the TuSimple dataset [20]. The U-Net architecture was selected for this purpose due to its proven effectiveness in segmentation tasks and its ability to yield high accuracy even when trained on relatively small datasets. Unlike specialized lane detection models such as SCNN, ENet, or PolyLaneNet++, U-Net offers a flexible encoder-decoder structure with skip connections that preserve spatial details. This structure is particularly suitable for the lane detection task, where precise localization is important.
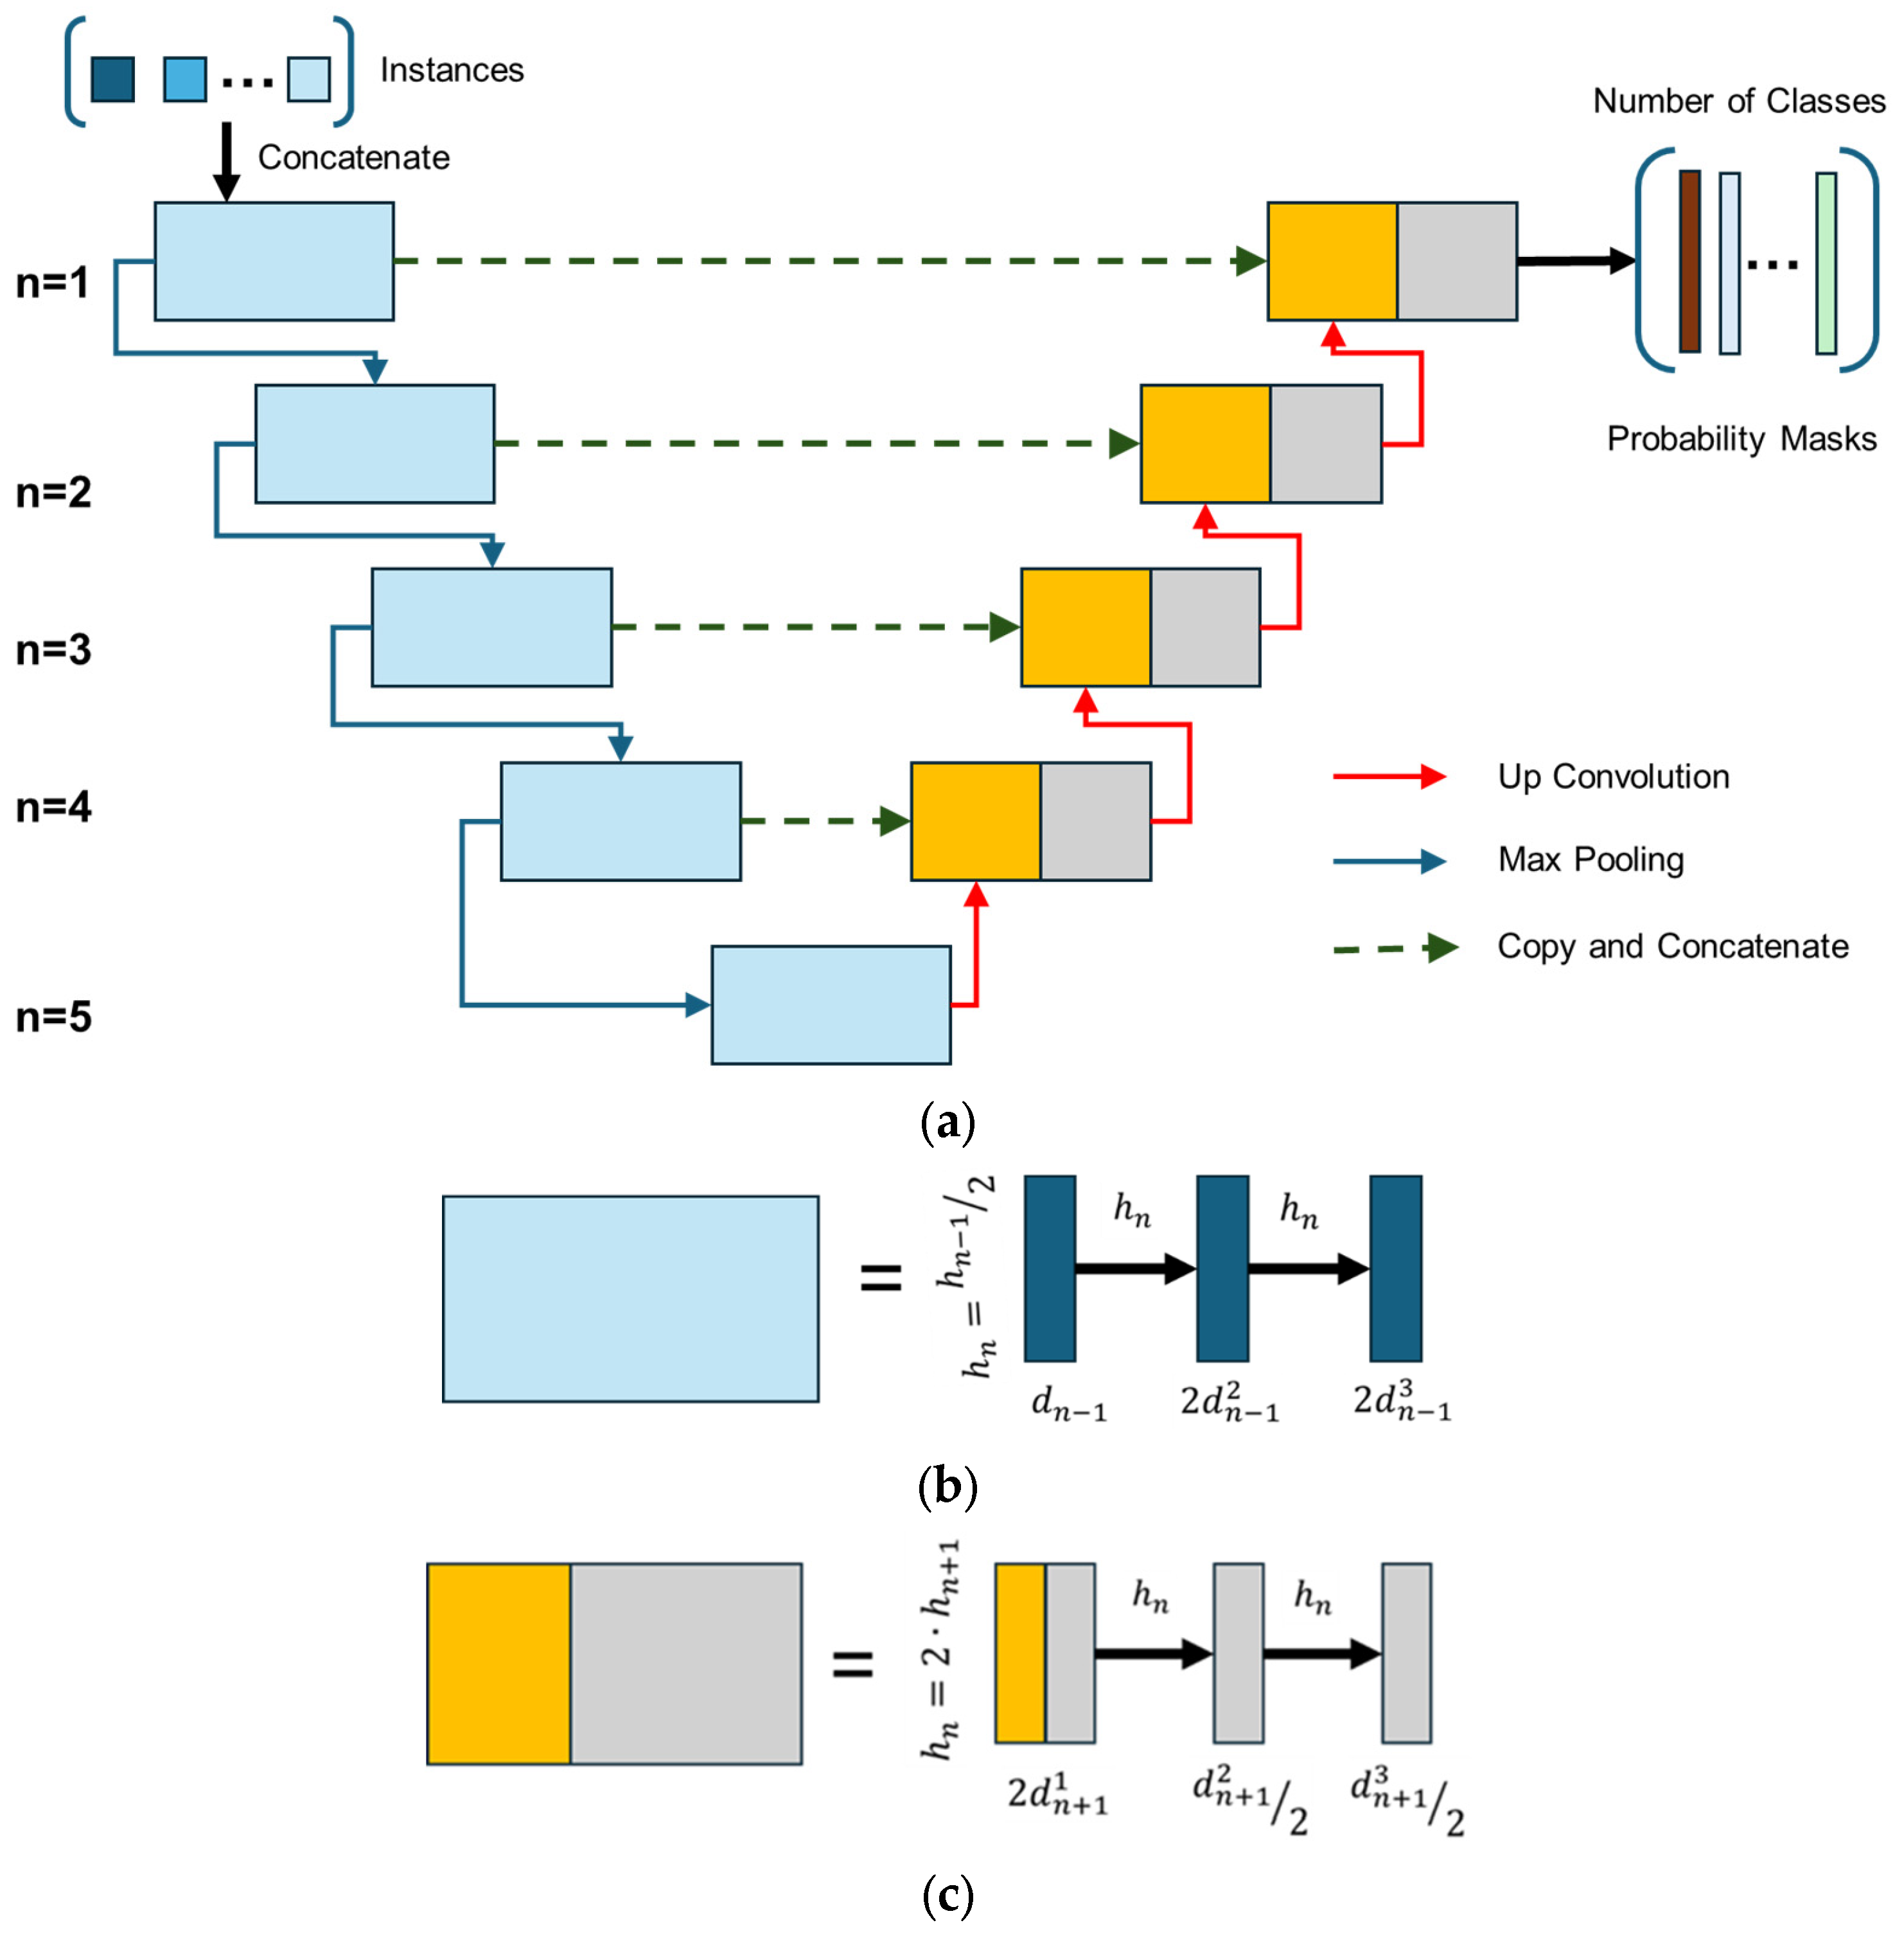
The general structure of the U-Net used is illustrated in Figure 3. The notation hn refers to the height of the convolutional layers at block level n, and dni denotes the number of channels in the ith convolutional layer at level n. The width of each convolutional layer follows a consistent pattern, and the depth of the convolutional layers at level n is twice that of the corresponding layer at the previous level (n − 1).
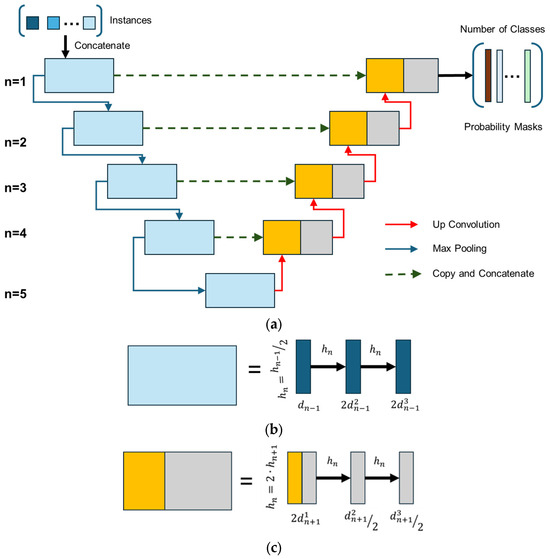
Figure 3.
U-net architecture: (a) general architecture and information transfer paths; (b) structure of pooling blocks; (c) structure of convolution blocks (adapted from source [18]).
U-Net is a type of convolutional neural network (CNN) designed specifically for image segmentation tasks. It was originally developed for biomedical image segmentation [21,22,23]. The architecture features a symmetric encoder–decoder structure, with skip connections between corresponding down-sampling and up-sampling blocks. This design helps preserve fine-grained spatial information that might otherwise be lost due to max pooling.
In this implementation, each down-sampling block consists of two convolutional layers with 3 × 3 filters and a padding of size 1, followed by a 2 × 2 max pooling operation with a stride of 2. Batch normalization is applied after each convolutional layer to improve training stability and convergence speed. The up-sampling part mirrors the down-sampling blocks, and concatenation is used to merge high-resolution features from the encoder with the corresponding decoder layers. The number of filters begins at 16 and doubles at each block level, reaching 256 at the bottleneck. Dropout layers are also incorporated to reduce overfitting.
The model was trained using a batch size of 16 and optimized with the Adam optimizer using a learning rate of 1 × 10⁻⁴ and a linear decay schedule over 80 epochs. These hyperparameters were chosen based on commonly effective defaults for segmentation tasks and were not further tuned, as the primary goal of the study was to analyze resolution and dataset effects.
The model takes an RGB image as an input and returns a binary segmentation map indicating the presence of lane lines (Figure 4). The TuSimple dataset, which was used for evaluation, contains labeled road scenes tailored for autonomous driving applications.
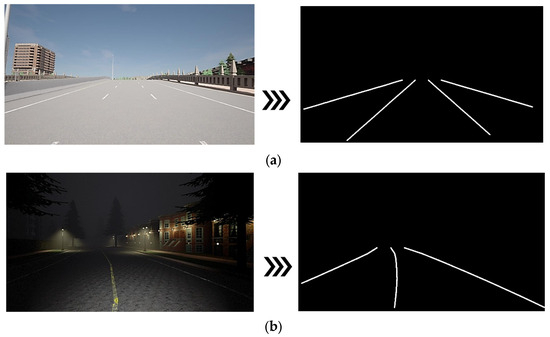
Figure 4.
Identification of traffic lanes in different situations and environments: (a) Multilane Road, extra urban, sunny environment; (b) Single Lane Road, urban, dark environment.
After training on both datasets, the neural network was evaluated using a test image set from the TuSimple dataset. The evaluation focused on two primary aspects: segmentation accuracy, represented by the Mean Intersection over Union (mIoU) and F1 Score, and runtime efficiency, measured by inference time and frames per second (FPS). The mIoU metric quantifies the overlap between the predicted segmentation and the ground truth. It is calculated as the ratio of the area of intersection (correctly predicted lane pixels) to the area of union (all pixels predicted as lanes or labeled as lanes in the ground truth). This provides a single metric that summarizes the overall segmentation performance of the model (Equation (1)).
Another important parameter is the F1 score, parameter that combines two factors “precision” and “recall” (Equation (2)). The factor “precision” is defined as the fraction of detected lane pixels that are correct, and the factor “recall” represents the fraction of ground truth lane pixels that are detected.
Inference time (speed) is a critical performance parameter for real-time applications because the implementation and architecture of a neural network on mobile devices has many strict requirements regarding latency and computing resources [24]. The parameter considered in the FPS study measures how many frames can be processed per second and is an important factor in the development of ADAS systems. This is because another major challenge of incorporating an ADAS vision algorithm is to run it in real time on the target embedded hardware platform, and the frame rate of the general driver assistance system is limited by the camera frame rate and the processing time of the application [25].
4. Results
The results obtained from the simulation and training processes are summarized in Table 1. This table illustrates the impact of varying input image resolutions (512 × 256, 640 × 320, and 1024 × 512) on both lane detection performance and computational efficiency. The neural network was trained using three different datasets:
- TuSimple dataset with 3626 labeled images;
- CARLA dataset with 3890 labeled images;
- Mixed dataset with 3500 images mixed evenly as 1750 from the TuSimple and 1750 CARLA dataset.

Table 1.
Results from U-Net trained on considered datasets (different image resolution).
Table 1.
Results from U-Net trained on considered datasets (different image resolution).
| Performance Parameters | Dataset 512 × 256 | Dataset 640 × 320 | Dataset 1024 × 512 | ||||||
|---|---|---|---|---|---|---|---|---|---|
| TuSimple | CARLA | TuSimple + CARLA | TuSimple | CARLA | TuSimple + CARLA | TuSimple | CARLA | TuSimple + CARLA | |
| mIoU | 0.52 | 0.36 | 0.56 | 0.47 | 0.32 | 0.49 | 0.48 | 0.33 | 0.49 |
| F1 Score | 0.67 | 0.52 | 0.69 | 0.63 | 0.48 | 0.67 | 0.64 | 0.46 | 0.67 |
| Inference Time [s] | 0.016 | 0.017 | 0.016 | 0.027 | 0.027 | 0.027 | 0.065 | 0.07 | 0.065 |
| FPS | 60 | 59 | 60 | 36.88 | 37.08 | 37.03 | 15.4 | 15.3 | 15.37 |
Each dataset was split into training and testing sets, with 80% of the data used for training and the remaining 20% used for testing. Training was conducted over 50 epochs using the Adam optimizer (Adaptive Moment Estimation) with a learning rate of 1 × 10⁻⁴ [26]. To isolate the influence of dataset composition and image resolution, data augmentation was intentionally excluded from this study. The original size of the images used for training was 1280 × 720 pixels.
The variation in performance across the evaluated parameters and the relative differences between results are illustrated in Figure 5, Figure 6, Figure 7 and Figure 8.

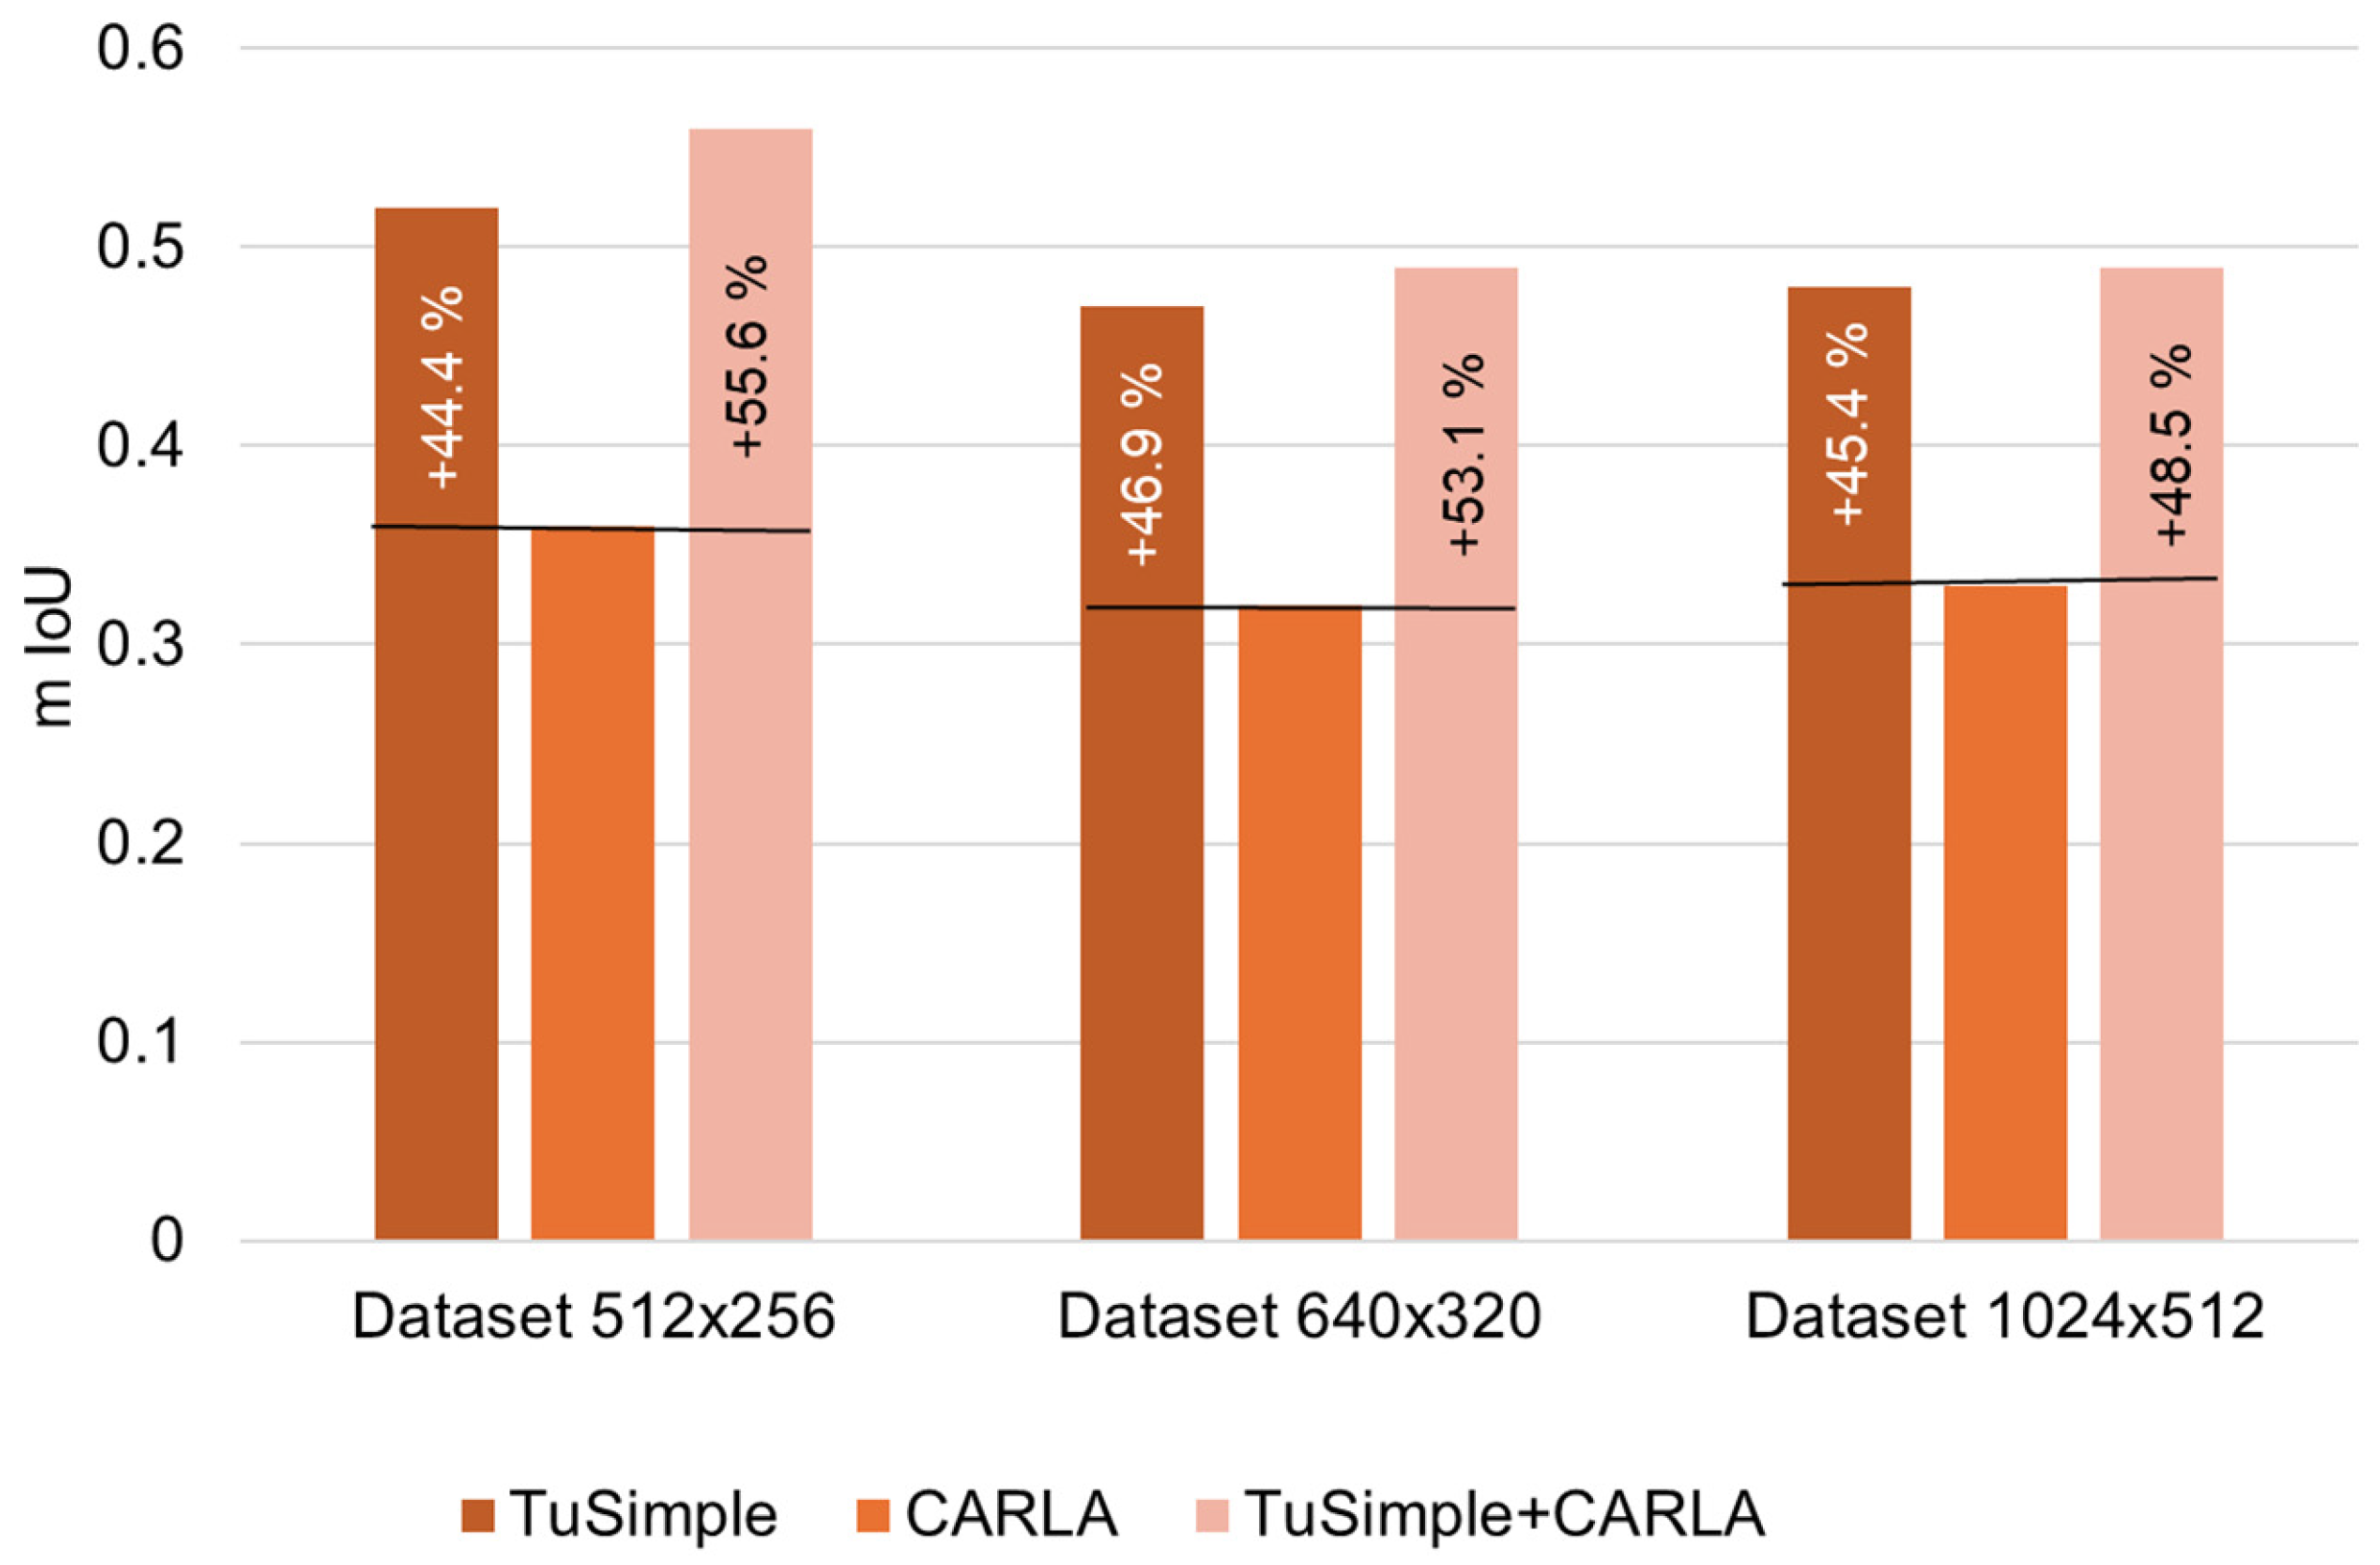
Figure 5.
Comparative analysis of mIoU performance.
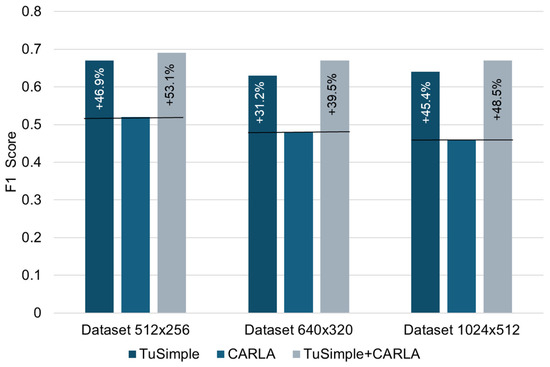
Figure 6.
Comparative analysis of F1 score performance.
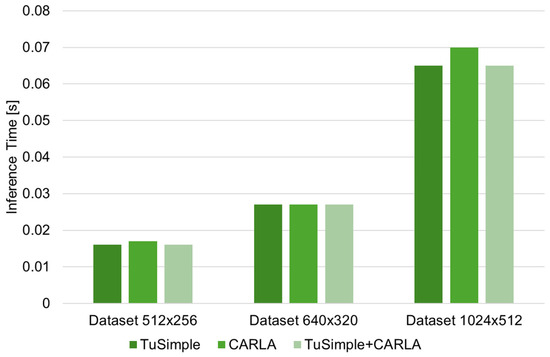
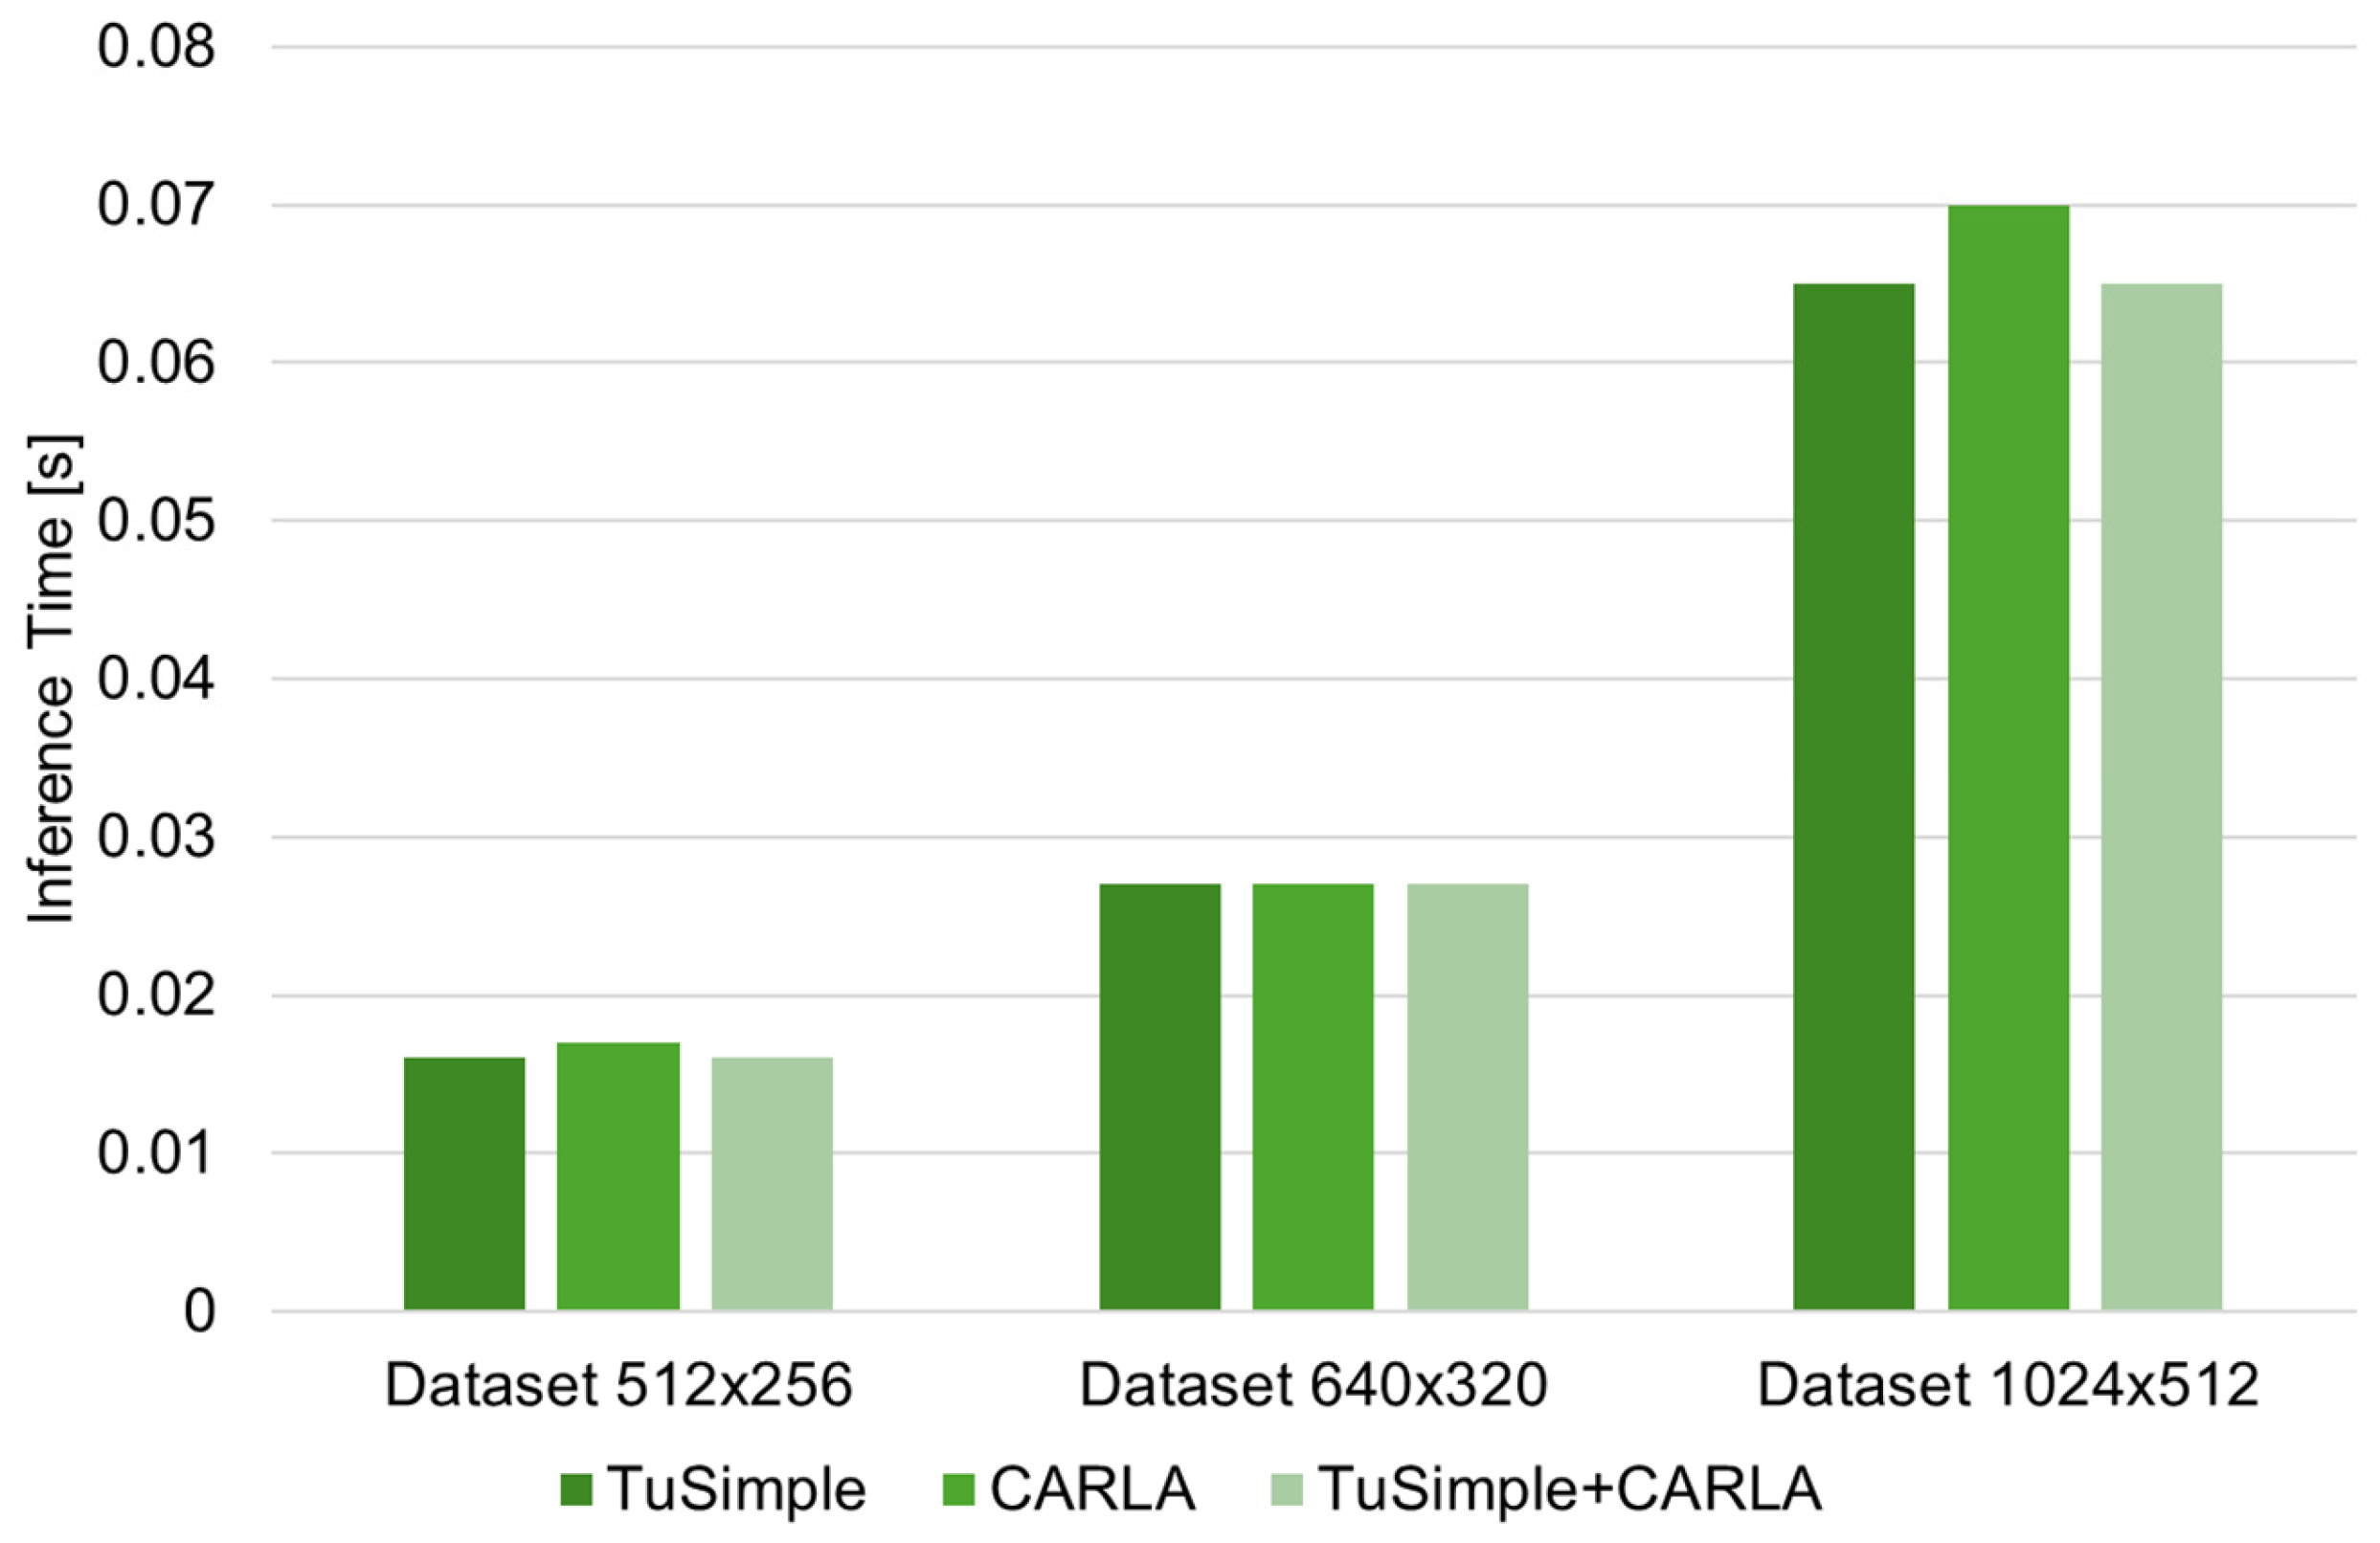
Figure 7.
Comparative analysis of inference time performance.

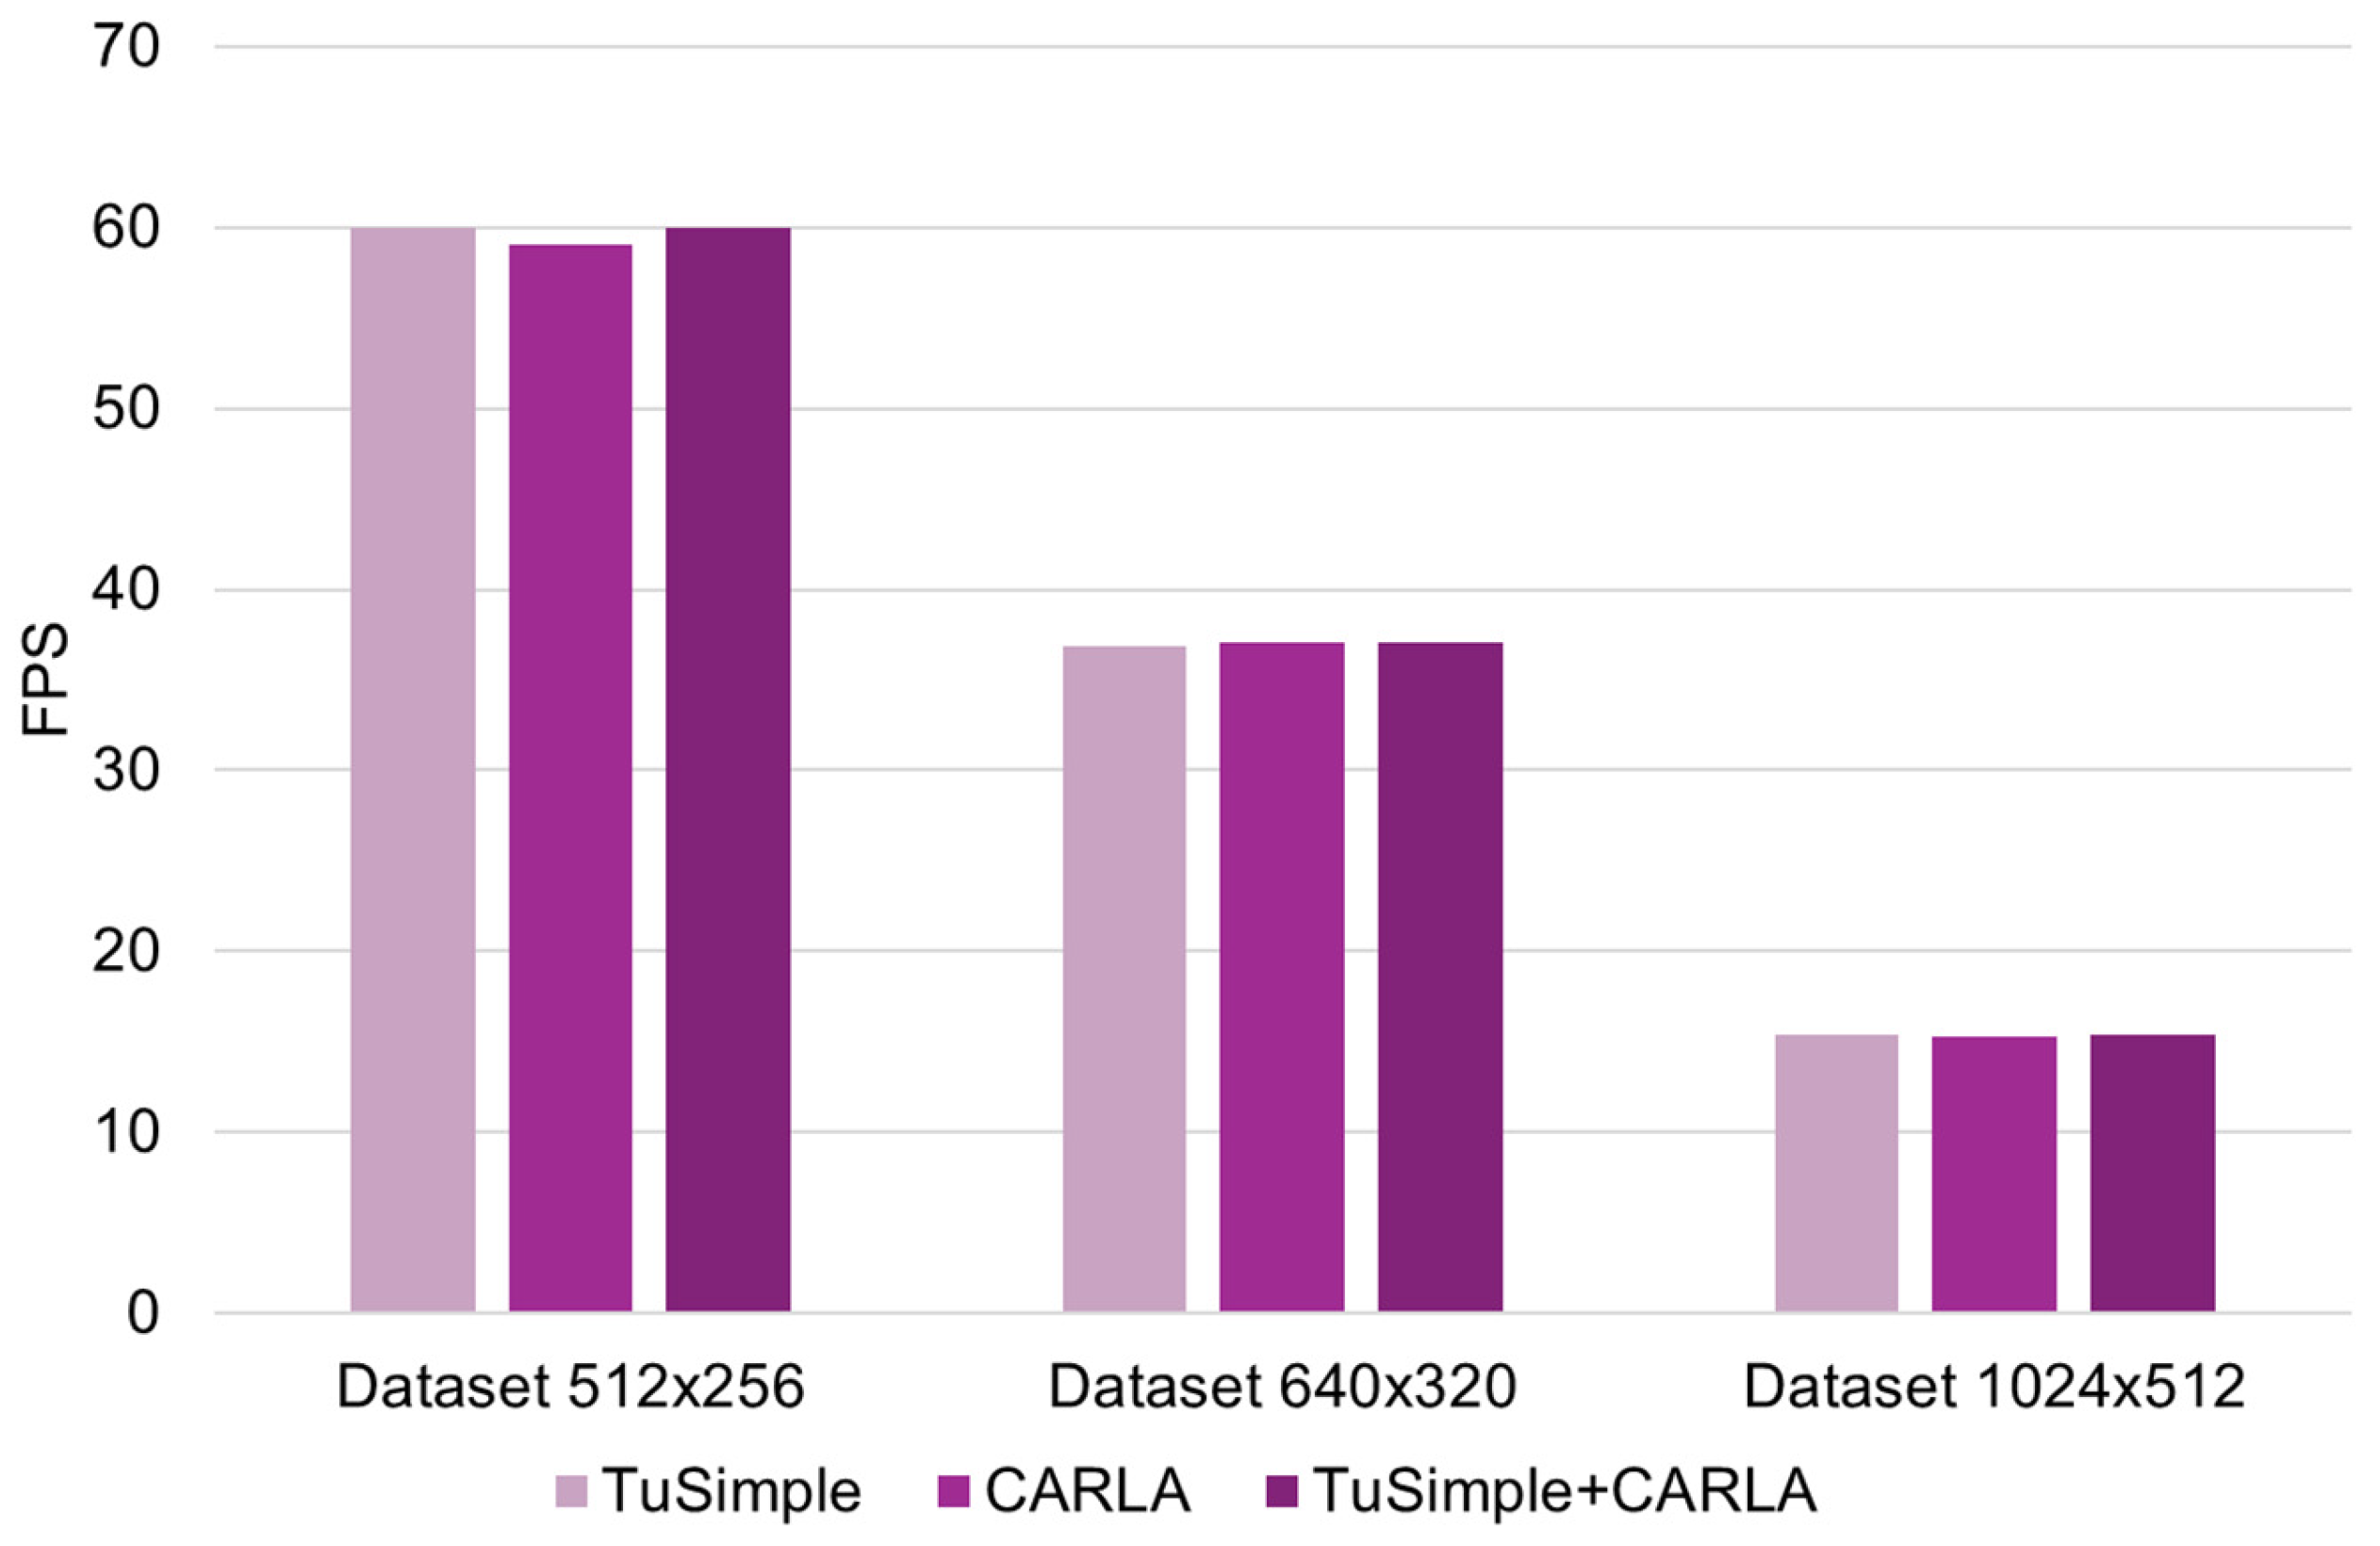
Figure 8.
Comparative analysis of FPS parameter performance.
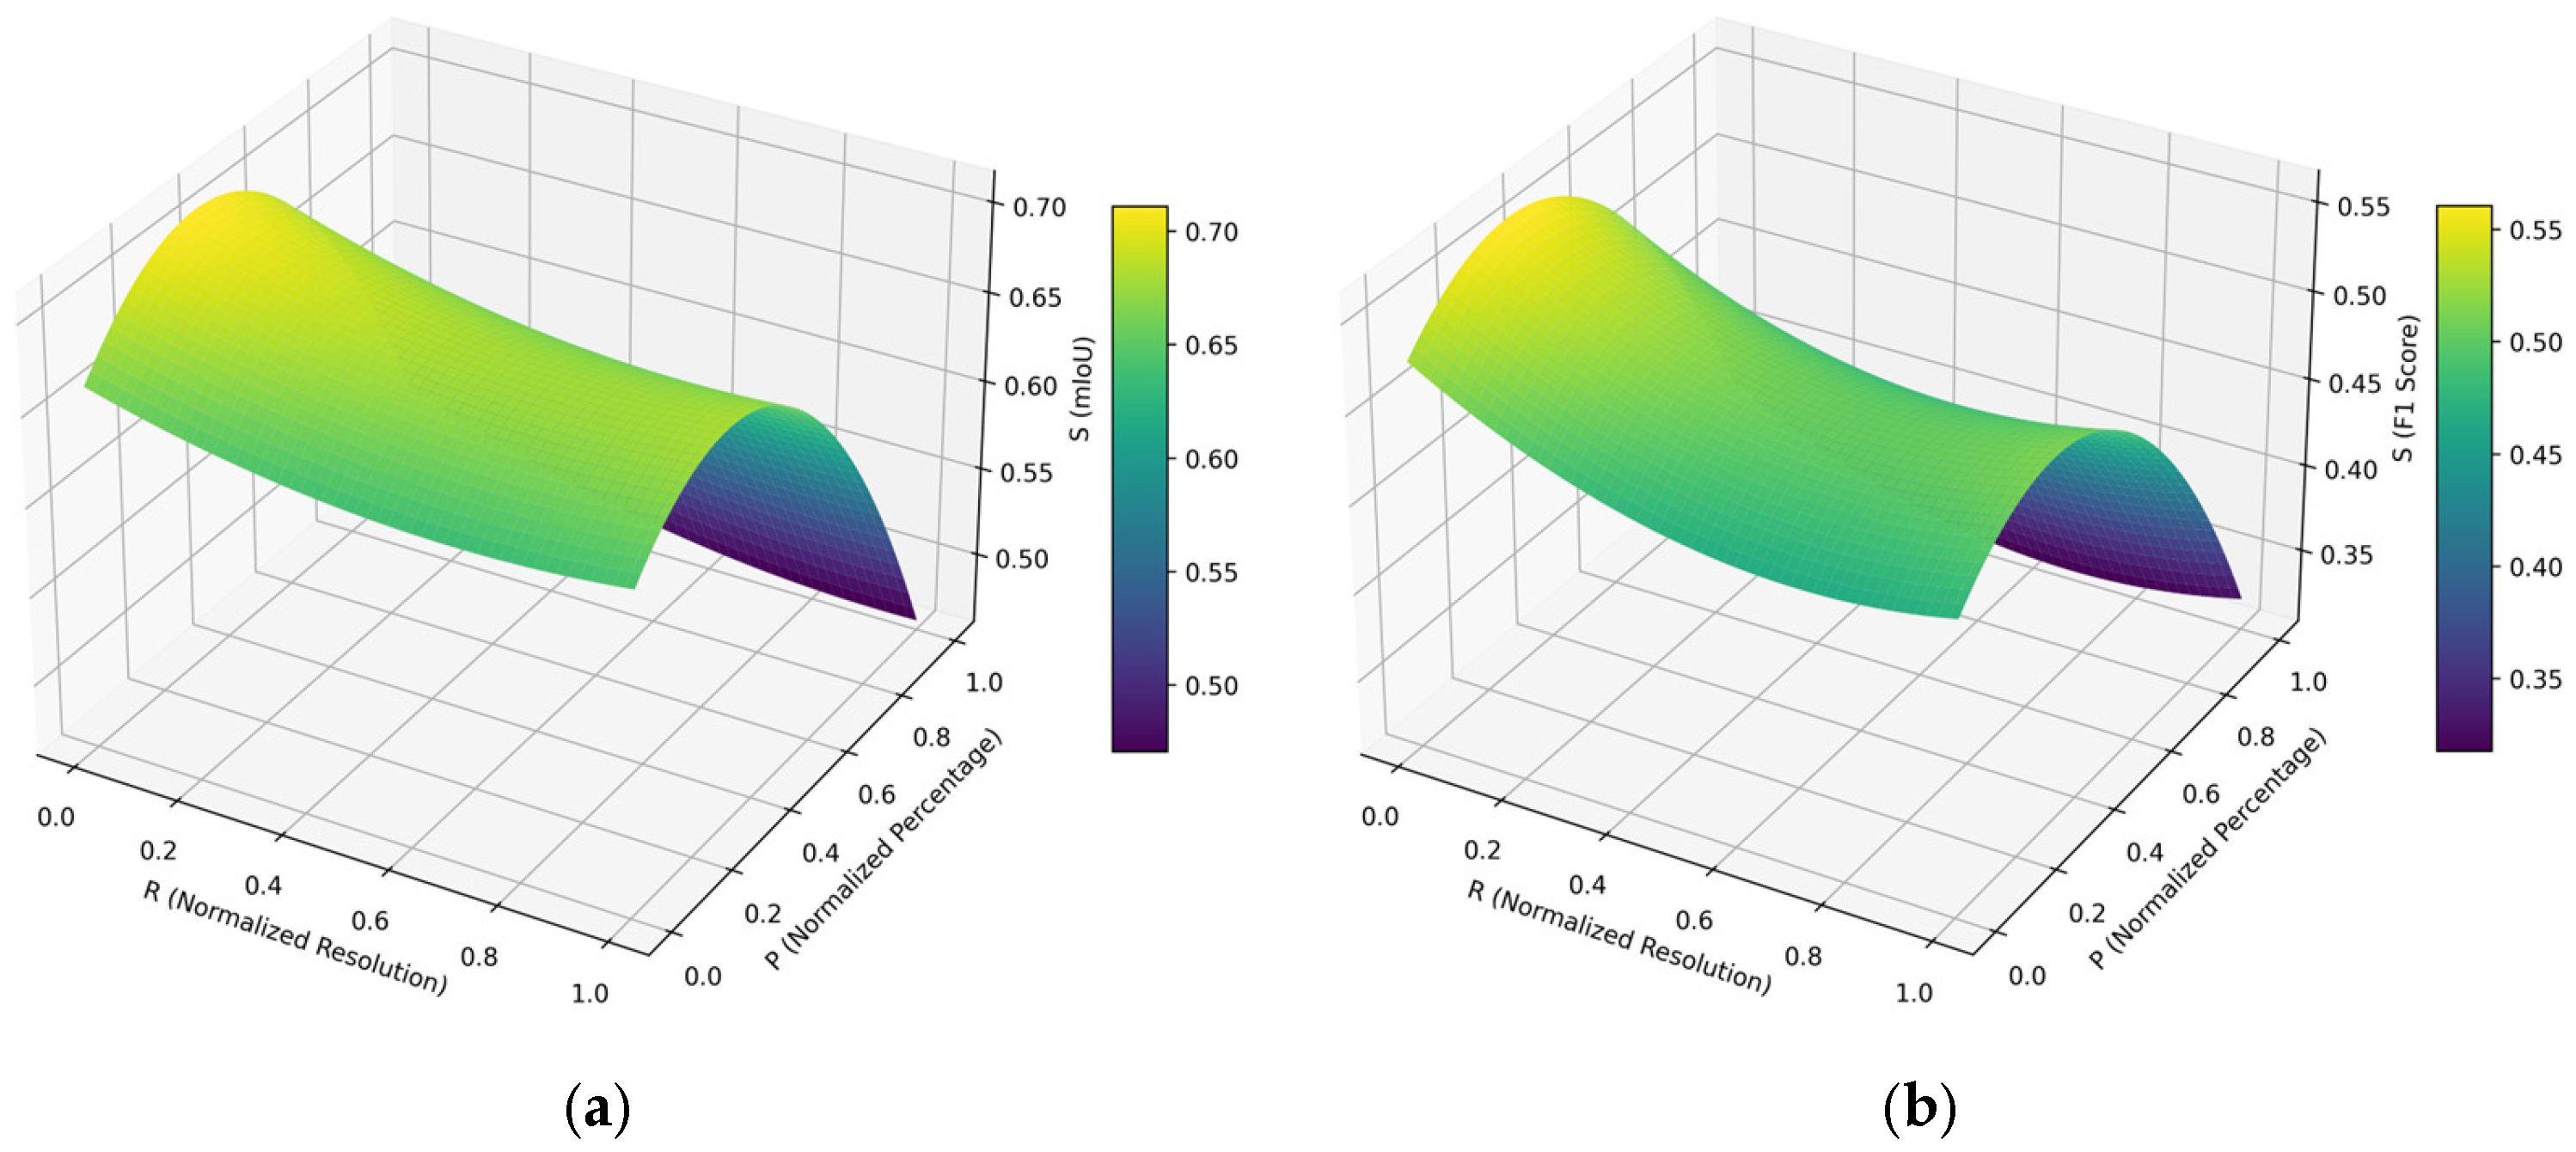
Based on the analysis of the results obtained, it is observed that their variation can be captured through a parametric equation (which defines the variation surface—Figure 9). Thus, for the calculation of the mIoU parameter, the relationship is presented in Equation 3 (R2 = 0.9953), and for the F1 Score parameter, it is in Equation 4 (R2 = 0.9927), with the specification that R represents the image normalized resolution in pixels and p is the normalized percentage of images taken from the TuSimple database vs. virtual images from CARLA (p = 0 for 100% TuSimple dataset and 0% CARLA dataset and p = 1 for 0% TuSimple dataset and 100% CARLA dataset).

Figure 9.
Variations of mIoU (a) and FPS (b) parameter performance.
In the case of the variation of the mIoU parameter, the minimum value was 0.313 (for R = 0.67 and p = 1.0), and the maximum was 0.562 (for R = 0.00 and p = 0.31). In the case of the variation of the FPS parameter, the minimum value was 0.466 (for R = 0.94 and p = 1.0), and the maximum was 0.712 (for R = 0.00 and p = 0.33). It should be noted that these results and variation curves were obtained for the particular case treated in the article, and future research will be carried out using other real and virtual databases to validate these hypotheses.
5. Discussion
While the CARLA dataset alone yields competitive results (Table 1), the best performance in both the mIoU and F1 scores was achieved by the combined TuSimple + CARLA dataset, highlighting the benefits of combining real and synthetic data. The minimum value obtained for the mIoU parameter was 0.32 (CARLA, data set 640 × 320), and the maximum was 0.56 (TuSimple + CARLA, data set 512 × 256), with an average difference of 75%. The F1 score parameter also shows better results when using the CARLA dataset for all cases of image resolution considered. The highest score obtained was 0.69 (TuSimple + CARLA, data set 512 × 256), and the lowest was 0.46 (CARLA, data set 1024 × 512).
It can also be stated from the results obtained that the Inference time (average variation of approx. 5.8%) and FPS score (average variation of approx. 1.6%) values for each case of image resolution considered have a minimal sensitivity relative to the dataset used (specific to each resolution considered). This suggests that the U-Net architecture maintains constant band detection performance in all tested datasets. Such stability can be attributed to the prominent and structured nature of the band markings, which remain solid even at lower resolutions. In the case of band line detection, the fine details that can be captured by the increased size of the input images (image resolution) are not significant in their tracing/identification.
By analyzing the functional (applicative) efficiency of the proposed method, it is observed that there is a significant inverse relationship between the resolution of the input image and the computational efficiency. Specifically, in terms of frame rate (FPS), when using the TuSimple database, increasing the resolution from 512 × 256 to 640 × 320 results in a 38.53% reduction, and when increasing the 640 × 320 resolution to 1024 × 512, a 58.24% reduction. When using the CARLA Simulation Environment, increasing the resolution from 512 × 256 to 640 × 320 results in a 37.15% reduction, and when increasing the 640 × 320 resolution to 1024 × 512, a 58.73% reduction. However, it is observed that using 1024 × 512 resolution reduces FPS by over 50% compared to 512 × 256, with a negligible gain in mIoU. The values and trends of these indicators indicate a substantial increase in the computational load required with increasing image resolution, once again emphasizing the need to find a compromise, in applications specific to solving such problems, between image resolution and processing speed.
All experiments in this study were conducted using a 12th generation i7 2.3 GHz CPU, without GPU acceleration. Despite this, the U-Net model achieved reasonable inference times and frame rates, indicating its potential viability for real-time applications on modest hardware.
However, several limitations must be acknowledged:
- Only the U-Net architecture was tested. Other models such as SCNN, ENet, or PolyLaneNet++ may exhibit different performance trends, particularly regarding resolution sensitivity and generalization.
- Real-world generalization to unseen roads was not assessed. Testing the trained models on independent datasets or previously unseen road segments would provide a more comprehensive evaluation of robustness.
Given the performance and computational trade-offs, we recommend using a 512 × 256 input resolution combined with a mixed dataset (real + synthetic data) for lightweight ADAS systems.
For actual deployment in embedded systems, further optimization would be necessary. Future work will explore hardware-specific improvements, such as quantization, model pruning, or transitioning to more lightweight architectures (e.g., ENet or MobileNet-based U-Nets) for improved performance on embedded systems.
6. Conclusions
A key advantage of using simulation environments for training lane detection neural networks is the ability to generate rare or uncommon traffic scenarios—such as sharp street corners or unusual lane configurations—that are often missing or underrepresented in real-world datasets. Incorporating such edge cases into the training process is essential for ensuring the safety and robustness of autonomous driving systems.
Additionally, simulation environments like CARLA enable the rapid generation of large volumes of accurately labeled data. This significantly reduces the time and cost typically associated with manual annotation, while also offering flexibility to model diverse environmental conditions.
Future enhancements in simulation-based training may focus on increasing the photorealism of generated images using game engine technologies. While this may demand more powerful hardware resources, improved visual fidelity can lead to better generalization of trained models in real-world scenarios, as also noted in related research.
Author Contributions
Conceptualization, A.C., G.C. and F.M.; methodology, A.C. and F.M.; software, A.C.; validation, A.C.; investigation, A.C., G.C. and F.M.; writing—original draft preparation, F.M.; writing—review and editing, A.C., G.C. and F.M.; supervision, F.M. All authors have read and agreed to the published version of the manuscript.
Funding
The APC was funded by Technical University of Cluj Napoca.
Data Availability Statement
Data is unavailable due to privacy.
Conflicts of Interest
The authors declare no conflicts of interest.
Abbreviations
The following abbreviations are used in this manuscript:
| AD | Autonomous driving |
| ADAS | Advanced driver assistance systems |
| AI | Artificial Intelligence |
| CARLA | CAR Learning to Act |
| CNN | Convolutional neural network |
| DL | Deep learning |
| F1 | Precision factor |
| FPS | Frames per second |
| GPS | Global positioning system |
| LIDAR | Light detection and ranging |
| IMU | Inertial measurement unit |
| mIoU | Mean Intersection over Union |
| NPC | Non-player character |
| RIM | Recurrent instance module |
References
- European Commission. Roadmap to a Single European Transport Area: Towards a Competitive and Resource Efficient Transport System. 2011. ISBN 978-92-79-18270-9. Available online: https://op.europa.eu/en/publication-detail/-/publication/bfaa7afd-7d56-4a8d-b44d-2d1630448855/language-en#:~:text=The%20European%20Commission%20adopted%20a%20roadmap%20of%2040,in%20key%20areas%20and%20fuel%20growth%20and%20employment (accessed on 12 March 2025). [CrossRef]
- National Highways Traffic Safety Administration, Critical Reasons for Crashes Investigated in the National Motor Vehicle Crash Causation Survey, 2015, DOT HS 812 115. Available online: https://crashstats.nhtsa.dot.gov/Api/Public/ViewPublication/812115 (accessed on 12 March 2025).
- Gruyer, D.; Magnier, V.; Hamdi, K.; Claussmann, L.; Orfila, O.; Racotonirainy, A. Perception, information processing and modeling: Critical stages for autonomous driving applications. Annu. Rev. Control 2017, 44, 323–341. [Google Scholar] [CrossRef]
- Cai, J.; Jiang, H.; Wang, J.; Li, A. Multi-head attention-based intelligent vehicle lane change decision and trajectory prediction model in highways. J. Intell. Transp. Syst. 2024, 1–18. [Google Scholar] [CrossRef]
- Xia, X.; Meng, Z.; Han, X.; Li, H.; Tsukiji, T.; Xu, R.; Zheng, Z.; Ma, J. An automated driving systems data acquisition and analytics platform. Transp. Res. Part C Emerg. Technol. 2023, 151, 104120. [Google Scholar] [CrossRef]
- Chen, G.; Zhao, X.; Gao, Z.; Hua, M. Dynamic drifting control for general path tracking of autonomous vehicles. IEEE Trans. Intell. Veh. 2023, 8, 2527–2537. [Google Scholar] [CrossRef]
- Masmoudi, M.; Friji, H.; Ghazzai, H.; Massoud, Y. A reinforcement learning framework for video frame-based autonomous car-following. IEEE Open J. Intell. Transp. Syst. 2021, 2, 111–127. [Google Scholar] [CrossRef]
- Malligere Shivanna, V.; Guo, J.-I. Object Detection, Recognition, and Tracking Algorithms for ADASs—A Study on Recent Trends. Sensors 2024, 24, 249. [Google Scholar] [CrossRef]
- Malik, S.; Khan, M.A.; El-Sayed, H. CARLA: Car Learning to Act—An Inside Out. Procedia Comput. Sci. 2022, 198, 742–749. [Google Scholar] [CrossRef]
- Shashidhar, R.; Arunakumari, B.N.; Manjunath, A.S.; Ahuja, N.J.; Hoang, V.T.; Tran-Trung, K.; Belay, A. Computer Vision and the IoT-Based Intelligent Road Lane Detection System. Math. Probl. Eng. 2022, 4755113. [Google Scholar] [CrossRef]
- Swain, S.; Tripathy, A.K. Real-time Lane detection for autonomous vehicles using YOLOV5 Segmentation Model. Int. J. Sustain. Eng. 2024, 17, 718–728. [Google Scholar] [CrossRef]
- Song, Y.; Wang, L.Y.; Wang, H.D.; Li, M.L. Lane detection based on IBN deep neural network and attention. Connect. Sci. 2022, 34, 2671–2688. [Google Scholar] [CrossRef]
- Silva, I.; Silva, H.; Botelho, F.; Pendão, C. Realistic 3D Simulators for Automotive: A Review of Main Applications and Features. Sensors 2024, 24, 5880. [Google Scholar] [CrossRef]
- Li, Y.; Yuan, W.; Zhang, S.; Yan, W.; Shen, Q.; Wang, C.; Yang, M. Choose your simulator wisely: A review on open-source simulators for autonomous driving. IEEE Trans. Intell. Veh. 2024, 9, 4861–4876. [Google Scholar] [CrossRef]
- Koroglu, Y.; Wotawa, F. Towards a Review on Simulated ADAS/AD Testing. In Proceedings of the 2023 IEEE/ACM International Conference on Automation of Software Test (AST), Melbourne, Australia, 15–16 May 2023; pp. 112–122. [Google Scholar] [CrossRef]
- Liu, L.; Chen, X.; Zhu, S.; Tan, P. Condlanenet: A top-to-Down Lane Detection Framework Based on Conditional Convolution. In Proceedings of the 18th IEEE/CVF International Conference on Computer Vision, ICCV 2021, Montreal, QC, Canada, 10–17 October 2021; pp. 3753–3762. [Google Scholar]
- Baek, S.W.; Kim, M.J.; Suddamalla, U.; Wong, A.; Lee, B.H.; Kim, J.H. Real-time Lane detection based on deep learning. J. Electr. Eng. Technol. 2022, 17, 655–664. [Google Scholar] [CrossRef]
- Chng, Z.M.; Lew, J.M.H.; Lee, J.A. RONELD: Robust Neural Network Output Enhancement for Active Lane Detection. In Proceedings of the 25th International Conference on Pattern Recognition (ICPR), Milan, Italy, 10–15 January 2021; pp. 6842–6849. [Google Scholar] [CrossRef]
- Jeon, H.; Kim, Y.; Choi, M.; Park, D.; Son, S.; Lee, J.; Choi, G.; Lim, Y. CARLA Simulator-Based Evaluation Framework Development of Lane Detection Accuracy Performance Under Sensor Blockage Caused by Heavy Rain for Autonomous Vehicle. IEEE Robot. Autom. Lett. 2022, 7, 9977–9984. [Google Scholar] [CrossRef]
- Yang, C.; Tian, Z.; You, X.; Jia, K.; Liu, T.; Pan, Z.; John, V. Polylanenet++: Enhancing the polynomial regression lane detection based on spatio-temporal fusion. Signal Image Video Process. 2024, 18, 3021–3030. [Google Scholar] [CrossRef]
- Modiboyina, C.; Chakrabarti, I.; Ghosh, S.K. Lightweight Low-Power U-Net Architecture for Semantic Segmentation. Circuits Syst. Signal Process. 2024, 44, 2527–2561. [Google Scholar] [CrossRef]
- Kugelman, J.; Allman, J.; Read, S.A.; Vincent, S.J.; Tong, J.; Kalloniatis, M.; Chen, F.K.; Collins, M.J.; Alonso-Caneiro, D. A comparison of deep learning U-Net architectures for posterior segment OCT retinal layer segmentation. Sci. Rep. 2022, 12, 14888. [Google Scholar] [CrossRef] [PubMed]
- Falk, T.; Mai, D.; Bensch, R.; Çiçek, Ö.; Abdulkadir, A.; Marrakchi, Y.; Böhm, A.; Deubner, J.; Jäckel, Z.; Seiwald, K.; et al. U-Net: Deep learning for cell counting, detection, and morphometry. Nat. Methods 2019, 16, 67–70. [Google Scholar] [CrossRef] [PubMed]
- Tran, L.-A.; Do, T.-D.; Park, D.-C.; Le, M.-H. Enhancement of Robustness in Object Detection Module for Advanced Driver Assistance Systems. In Proceedings of the International Conference on System Science and Engineering (ICSSE), Ho Chi Minh City, Vietnam, 26–28 August 2021; pp. 158–163. [Google Scholar] [CrossRef]
- Velez, G.; Otaegui, O. Embedding vision-based advanced driver assistance systems: A survey. IET Intell. Transp. Syst. 2017, 11, 103–112. [Google Scholar] [CrossRef]
- Kingma, D.P.; Ba, L.J. A Method for Stochastic Optimization. In Proceedings of the International Conference on Learning Representations, San Diego, CA, USA, 7–9 May 2015; Available online: https://arxiv.org/abs/1412.6980 (accessed on 19 February 2025).


Disclaimer/Publisher’s Note: The statements, opinions and data contained in all publications are solely those of the individual author(s) and contributor(s) and not of MDPI and/or the editor(s). MDPI and/or the editor(s) disclaim responsibility for any injury to people or property resulting from any ideas, methods, instructions or products referred to in the content. |
© 2025 by the authors. Licensee MDPI, Basel, Switzerland. This article is an open access article distributed under the terms and conditions of the Creative Commons Attribution (CC BY) license (https://creativecommons.org/licenses/by/4.0/).