Article

Application of Continuous Stability Control to a Lightweight Solar-Electric Vehicle Using SMC and MPC

1
Faculty of Engineering and Information Technology, University of Technology Sydney, Sydney, NSW 2007, Australia
2
Warwick Manufacturing Group, University of Warwick, Coventry CV4 7AL, UK
3
Transport for NSW, Sydney, NSW 2161, Australia
*
Author to whom correspondence should be addressed.
Vehicles 2024, 6(2), 874-894; https://doi.org/10.3390/vehicles6020042
Submission received: 23 October 2023 / Revised: 23 April 2024 / Accepted: 8 May 2024 / Published: 28 May 2024
(This article belongs to the Topic Vehicle Dynamics and Control)

Abstract

:
This paper investigates the application of contusion stability yaw control of a lightweight solar-electric vehicle. The vehicle’s customized design envelope makes it more sensitive to variations in load due to its low weight and relatively large size. To address this issue, control strategies were developed using differential motor torques to generate direct yaw moments using the vehicle’s rear in-wheel motors. This paper introduces the working conditions of solar vehicles and demonstrates the necessity of stability control. Vehicle parameters such as mass and center of gravity position are obtained to apply control to the real vehicle. The paper then describes two stability control strategies, using (i) sliding-mode control (SMC) and (ii) model predictive control (MPC). To account for the road bank angle of the test area and the impact of additional weight from a driver and passenger, a Kinematic-Based Observer is designed to estimate the vehicle’s side-slip based on measured values. To collect real-time data, a dSPACE MicroAutobox was installed on the solar vehicle. The results show the effect of the observer and controllers under different vehicle speeds and load conditions. Finally, closed-loop simulation results are presented to support the findings from the open-loop testing.

1. Introduction

The integration of solar power in electric vehicles is a compelling feature, as it uses renewable energy in complement to energy sourced from the grid. Many of the recent developments in this type of technology trace back to the Bridgestone World Solar Challenge (BWSC). The BWSC is a 3000 km international competition where solar-electric vehicles drive from Darwin to Adelaide, Australia [1]. This paper investigates the Australian Technology Network (ATN) of Universities solar car, Priscilla, which competed in the 2019 race. The ATN solar car competed in the cruiser class in this competition, which is for vehicles designed for efficiency and practicality to be more acceptable for a consumer market. Because these vehicles are designed for efficiency, they optimize the size to maximize the area for solar panels [2,3]. In addition, they are also optimized to be lightweight to reduce energy consumption during driving [4]. The focus on both efficiency and practicality presents unique challenges in vehicle stability, safety, and handling due to the vehicle’s streamlined design and low weight. Two rear-wheel in-wheel motors are adopted to reduce the energy loss caused by standard drivelines. The use of multiple motors provides the opportunity to use torque vectoring for enhanced vehicle-stability control [5].
In traditional passenger vehicles, dynamic control problems have been thoroughly investigated in the past and are often standard in most modern road vehicles. However, the dynamic control challenges in solar vehicles, like those competing in the BWSC, require custom solutions due to their unique design and operational constraints. Braking-based technologies such as electronic stability control (ESC) [6,7] have been widely used for vehicle dynamics control to improve safety and stability. In [8], a control strategy for rollover prevention is designed, which considers the impact of delay in the ESC braking system. In [9], a model predictive controller is designed to improve vehicle stability, which adopts the LuGre tire model to describe the tire–road contacting force. The use of braking force in combination with active steering and active suspension is investigated in [10] to achieve a multi-objective control including stability, handling, and driving comfort. In [11], stability control under the extreme condition of a tire blow-out is researched via the use of differential braking and active steering to maintain the vehicle path following performance. At the same time, it is worth noting that braking-based controls have the drawback of degrading the vehicle’s dynamic performance and reducing speed, which is linked to increased energy consumption if acceleration is required after, e.g., a curve. Brake heat fade also affects the reliability and sustainability of braking-based control methods [12,13].
Independent wheel-driven vehicles propose the option of controlling the vehicle through torque vectoring control, which generates a desired yaw moment by manipulating the driving torque on the left and right-hand-side wheels [5,14,15]. The advantage of torque vectoring is that while the yaw moment adjusts the vehicle yaw rate to control vehicle maneuver, the vehicle driving force and dynamic performance can be maintained. Numerous research investigations have been conducted to exploit torque vectoring control to improve vehicle stability, safety, and trajectory following performance. For example, in [16], a robust gain-scheduled output feedback controller is designed for an in-wheel-driven electric vehicle that uses torque vectoring of four wheels to maintain the vehicle stability. The work presented by [17] further exploits the advantage of four-wheel independent driving to control the vehicle slip, stability, and handling and prevent rollover. The multi-objective problem is solved by model predictive control, which is based on torque vectoring. Ref. [18] combines the active front steering and torque vectoring control to improve the vehicle’s yaw stability. The control strategy is verified in both high and low-friction-coefficient road surfaces; thus, it is also promising for icy and snowy roads. In [19], the control strategy integrates steer-by-wire and torque vectoring technology to improve the vehicle stability, more specifically under the condition that the steer-by-wire system fails. Thus, vehicle safety is also guaranteed. In [20], a changing control gain was used to adjust for variations in the side-slip angles of the front and rear tires. The proposed approach performs better than the traditional method with erroneous tire side-slip angle feedback, according to comparative simulation findings.
In [21], relatively light incremental loads caused the load-to-curb weight ratio to over-proportionally rise as a vehicle’s curb weight decreased. This resulted in changes in the vehicle’s inertial measurements, such as the center of gravity and properties related to the vehicle’s dynamics. The unique and highly customized ultra-lightweight vehicle in this paper is more susceptible to such variation in comparison to current commercial passenger vehicles, which is discussed in detail in [22]. The paper discusses how additional load displays drift in comparison to an empty vehicle in relation to the reference model. While most of the torque vectoring-based vehicle-stability control strategies focus on traditional passenger vehicles, the stability control of lightweight solar-electric vehicles is still insufficient. Although research has been made into lightweight vehicles, it normally focuses on small-sized vehicles, whereas in this study, the vehicle has a track and length similar to a common passenger vehicle.
Due to its low weight, the solar vehicle in this study is sensitive to additional loads or changes in load conditions. For example, minor movements, such as the driver shifting in their seat during real-life testing, cause reactions in the sensor systems. This sort of sensitivity supports the critical nature of investigating the engineering application to the actual vehicle shown in this paper. The investigation of the design envelope of the solar vehicle in this paper can contribute to the development of emerging lightweight vehicle technologies. In addition, the study provides an understanding of these vehicles’ dynamic responses to load conditions, which can provide foundational insight to improve safety within solar vehicle racing while also supporting new teams to keep innovating with their vehicle designs.
Previous literature is mainly focused on simulation studies, whereas the contribution in this paper provides real-life data that supports findings for previously simulated data in [22].
This paper systematically presents the ATN solar cars’ dynamic characteristics, open-loop torque vectoring control in real-life testing, and closed-loop control in simulation. Due to logistical limitations caused by the COVID-19 lockdowns, the test area was compromised, and as such, the tire characteristics had to be estimated from published work. Additional effort was made to design an observer to accommodate for road bank angles.

2. Vehicle Specification: ATN Solar Car

The ATN solar car, as shown in Figure 1, can reach a speed of 130 km/h and has a driving range of 1200 km without external charge. The car competed in the cruiser class, which requires the vehicle to have enough room for a driver and at least one passenger. The primary concept of the cruiser class is to recognize sustainable transportation alternatives and encourage a design that is both practical and acceptable to consumers.
As such, the ATN solar car is a lightweight two-seated solar-electric vehicle driven via two electric in-wheel motors located in the vehicle’s two rear wheels. The car has been designed for practicality and efficiency, which has produced a unique test bed for research into dynamic handling. In previous research [22], the influence of load variation was studied due to the car’s unique features.

2.1. Vehicle Parameter Identification

Due to the unique design process of the solar car, its parameters are not easily correlated with the intended design. With corner scales, it was possible to measure the individual tire weights and estimate the vehicle’s center of gravity. Attempts were made to estimate the height of the center of gravity; however, due to the solar car’s custom design and with the in-wheel motors occupying the rear wheels, no hook point is available without potentially damaging the vehicle. In real-life testing, these values are not necessarily crucial, as the control considers only the lateral and longitudinal plane; however, for an accurate model in simulation, the accuracy of the vertical component must be considered to create a digital twin of the real vehicle.

Cornering Stiffness

Steady-state cornering is studied by driving the vehicle following a circular path with a constant radius on a flat surface. By changing the longitudinal velocity, the change in lateral acceleration, yaw rate, and the side-slip angle can be studied. In a steady-state maneuver, the yaw velocity is constant for a given longitudinal velocity, and as such, the cornering stiffness can be estimated from the slope of the lateral force versus the side-slip. However, the lack of space and resources made this impractical. As such, the cornering stiffness has been estimated by tuning its values during the post-processing of the experimental data and comparing them to figures found in the literature.
The solar car is equipped with radial tubeless Bridgestone Ecopia Ologic tires, which are custom-made for solar racing. With a diameter of 55.7 mm and width of 98 mm, these tires are closer in resemblance to motorcycle tires in terms of sizing. In [23], the experimental results for a motorcycle tire with a vertical load of 1400 N have a cornering stiffness of 410 N/deg. From the measurements recorded during the weighing of the car, it is possible to approximate the cornering stiffness.
In addition, when the vehicle drives in a steady state, the data collected from driving should correlate closely with the bicycle model. This would mean that the collected yaw rate data should be close to the desired yaw rate during lower velocities since the vehicle is within its linear region.
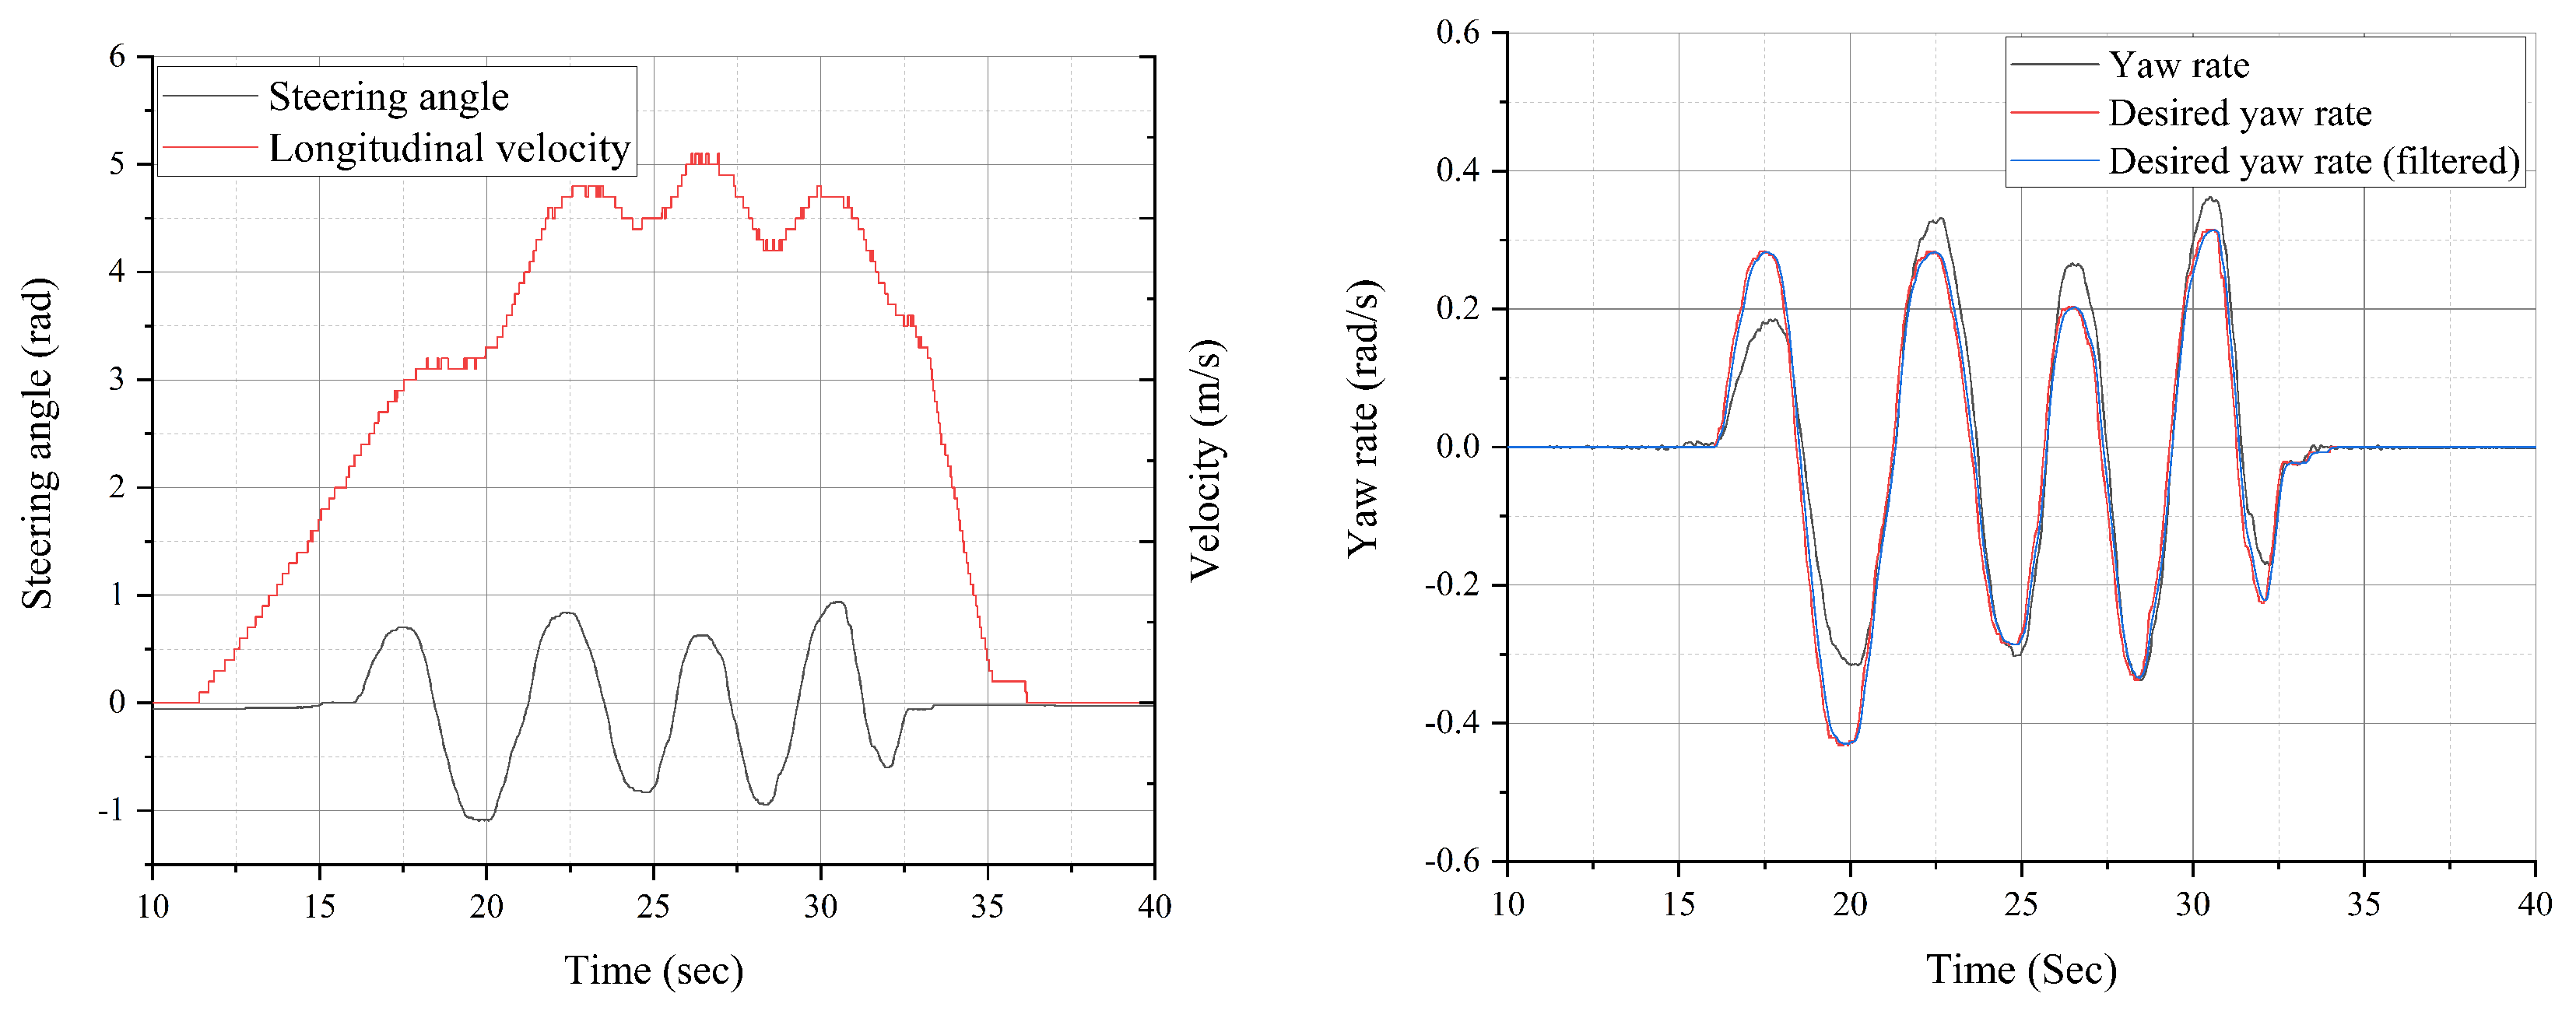
By adjusting the cornering stiffness in increments, it was found that C f = 380 N/deg and C r = 390 N/deg correlates with research data presented in [23] and in approximation to the vertical load in Table 1, as well as monitoring the behavior of the desired yaw rate in Figure 2. The inability to maintain constant velocity during the maneuvering and the road bank angle makes an exact match difficult to achieve. For future work, it is recommended to estimate the tire cornering stiffness using the more conventional method of steady-state circular trajectory.

3. Control Design

3.1. Reference Model

In this paper, the bicycle model is adopted. This type of model is commonly adopted as a reference model in the literature from control design [24,25,26,27,28,29,30]. As per Figure 3, this is a linearized 2-DOF model of a vehicle that works under the following assumptions: (i) neglects the lift, rolling, and pitching motions; (ii) it is a rigid body moving along a flat surface; (iii) the tires forces operating within the linear region; (iv) mass is concentrated at the center of gravity; and (v) the vehicle’s wheels have been lumped into a single track along the center-line of the vehicle [24,31,32].
Under the assumption of small tire-slip angles, the linear model can be expressed as:
m ( v ˙ y + v x r ) = ( l f C f l r C r ) r v x ( C f + C r ) β + C f δ
I z r ˙ = ( l f 2 C f l r 2 C r ) r v x ( l f C f + l r C r ) β + l f C f δ .
where C f is the front tire cornering stiffness, C r is the rear tire cornering stiffness, β refers to the vehicle side-slip angle, and δ f is the front wheel steering angle, β is the vehicle side-slip angle, r is the vehicle yaw angle, l f is the length between the center of gravity and the front wheel, l r is the length between the center of gravity and the rear wheel, m is the vehicle mass and I z is the vehicle yaw inertia.
To maintain the lateral stability of the vehicle, the vehicle’s steering behavior is leveraged to determine the desired side-slip angle β d and desired yaw rate r d . Steady-state handling, also known as steady-state cornering, is defined as a circular trajectory with a constant radius maintained during constant velocity and steering angle [33]. From the steady-state handling of the reference model (1) and (2), and with limitation of the tire friction ( μ ), the desired yaw rate can be expressed as in [26] as:
r d = r t , | r d | < 0.85 μ g v x 0.85 μ g v x s i g n ( r t ) , | r d | 0.85 μ g v x
where r t is expressed using the under-steering gradient K s as:
r t = v x δ l ( 1 + K s v x 2 )
and the under-steering gradient is expressed as:
K s = m ( l r C r l f C f ) 2 l 2 C f C r
In theory, a vehicle can experience a lateral acceleration of gravity times maximum friction at the tires. If the friction coefficient is equal to one, the lateral acceleration could be 9.81 m/s2 with a side-slip angle of zero. The reference value for side-slip can be considered similar to the yaw rate to be limited by the availability of friction as presented in [26]. However, because the solar car is designed for straight running conditions and tests are performed at relatively low speeds, it was chosen to consider the desired side-slip as:
β d = 0

3.2. System Model

To design the system model for the yaw controller, the reference model is used by implementing the corrective yaw moment M z and considering four wheels, then (2) can be expressed as:
I z r ˙ = 2 r ( l f 2 C f l r 2 C r ) v x 2 β ( l f C f + l r C r ) + 2 l f C f δ + M z .
Based on this, in order to derive a continuous-time dynamic state–space system model for the reference model, we can define the system state and control input as:
x ( t ) = β ( t ) r ( t ) , u ( t ) = M z ( t ) ,
which leads to the following expression:
x ˙ ( t ) = A c x ( t ) + B c u ( t ) + d ( t ) ,
where
A c = 2 ( C f + C r ) m v x 2 ( l f C f l r C r ) m v x 2 1 2 ( l f C f l r C r ) l z 2 ( l f 2 C f l r 2 C r ) l z v x , B c = 0 1
It is important to emphasize that, from a control viewpoint, d ( t ) is a known input disturbance vector for (9), which is represented by:
d ( t ) = E c δ f ( t )
where
E c = 2 C f m v x 2 l f C f l z .
Now, considering a forward Euler approximation, the following discrete-time dynamic model can be derived:
x ( k + 1 ) = A x ( k ) + B u ( k ) + d ( k )
where
A = I + t s A c , B = t s F B c ,
in which t s is the sampling time.

3.3. Sliding-Mode Control Strategy Design

In a sliding-mode control formulation, a sliding surface ( s ) is first defined. In this case, it is chosen as follows:
s = e 1 + λ e 2
where e 1 is the yaw rate tracking error and e 2 is the side-slip angle tracking error. Moreover, λ is a positive real constant, i.e., λ > 0 .
From the desired yaw rate and side-slip angle, the tracking error of the yaw rate is expressed as:
e 1 = r r d
Since β d = 0 , the tracking error for the side-slip angle is simply:
e 2 = β
This leads to the following sliding surface for the yaw rate control:
s = r r d + λ β
Now, a suitable candidate Lyapunov function for this problem can be the following standard quadratic function:
V = 1 2 s 2
It is important to emphasize that whenever the tracking errors, e 1 and e 2 , are not zero, V in (19) will take a value larger than zero, i.e., V > 0 for all e 1 , e 2 0 . Moreover, V = 0 only if e 1 = e 2 = 0 . Consequently, leading the tracking errors to zero is equivalent to leading the Lyapunov function to zero, i.e., if V 0 , then e 1 0 and e 2 0 . This can be achieved by forcing the derivative of the Lyapunov function to be negative whenever the tracking errors are not zero, i.e., V ˙ < 0 for all e 1 , e 2 0 .
Based on the above discussion, it is convenient to introduce the Lyapunov function derivative, which is expressed as follows:
V ˙ = s s ˙
Now, it is proposed to choose the surface derivative as follows:
s ˙ = e ˙ 1 λ e ˙ 2 = r ˙ r ˙ d + λ β ˙ = K ^ sign ( s )
where K ^ > 0 is the controller gain. This leads to:
V ˙ = s s ˙ = s · ( K ^ sign ( s ) ) = K ^ · s · sign ( s )
Then, since s · sign ( s ) = | s | , it follows that:
V ˙ = s s ˙ = K ^ | s |
which clearly ensures the convergence of the Lyapunov function to zero. This is formally known as the Lyapunov stability criteria for a sliding-mode controller.
Finally, to satisfy the Lyapunov stability criteria, the control input needs to be selected to satisfy (21). To ensure this, even in the presence of uncertainties, it is possible to express
β ˙ = f 1 + Δ f 1
and
r ˙ = f 2 + Δ f 2 + M Z u ( t )
in which Δ f 1 and Δ f 2 represent uncertainty. While f 1 and f 2 are the corresponding rows from the state–space Equations (9) and (10), which is:
f 1 = C f + C r m v x β l f C f l r C R m v x 2 1 C f m v x δ f
f 2 = l f C f l r 2 C r I z v x β l f 2 C f + l r 2 C r I z v x r l f C f I z δ f
Substituting f 1 and f 2 into the sliding surface derivative as follows:
f 2 + Δ f 2 + U ( t ) r ˙ d + λ ( f 1 + Δ f 1 ) = K ^ s i g n ( s )
Rearranging (28), the control input can be expressed as:
U ( t ) = + r ˙ d f 2 Δ f 2 λ ( f 1 + Δ f 1 ) K ^ s i g n ( s )
In [22], the uncertainties Δ f 1 0 and Δ f 2 0 were considered to be the maximum change in mass and inertia. A zero-uncertainty scenario was also considered to investigate the difference in robustness. In this case, the control input can be simplified to:
U ( t ) = + r ˙ d f 2 λ f 1 K ^ s i g n ( s )
Afterward, the Lyapunov stability criteria are verified to consider these maximum uncertainties. From (22), it follows that:
V ˙ = s ( r ˙ r ˙ d + λ β ˙ ) = s ( Δ f 2 + λ Δ f 1 K ^ sign ( s ) )
If s < 0 , it implies that sign ( s ) = 1 . This leads to V ˙ = s ( Δ f 2 + λ Δ f 1 + K ^ ) . Since Δ f 1 , Δ f 2 , K ^ 0 , it implies that V ˙ < 0 . Conversely, for the case when s > 0 , it implies that sign ( s ) = 1 . This leads to V ˙ = s ( Δ f 2 + λ Δ f 1 K ^ ) . Clearly, this imposes a lower positive limit for K ^ given by K ^ > Δ f 2 + λ Δ f 1 to ensure that V ˙ < 0 . Moreover, the bandwidth of the controller is directly related to the gain K ^ , which can be increased to achieve a faster closed-loop dynamic. However, this cannot be increased indefinitely since it will translate into a large control action, i.e., a large torque of the motors in this case. Therefore, the gain K ^ can be practically tuned to satisfy the torque limitations of the motors while satisfying the Lyapunov stability criteria.

3.4. Model Predictive Control Strategy Design

The control target is to track the system state references, x = β r T . To achieve this, the MPC strategy is formulated considering the following quadratic cost function that evaluates the tracking error over a finite prediction horizon N, i.e,
V N = = k k + N 1 x e T ( + 1 ) Q x e ( + 1 ) + σ Δ u 2 ( )
where x e ( k ) = x ( k ) x is the system state tracking error and Δ u ( k ) = u ( k ) u ( k 1 ) is the so-called control effort given by the rate change in the yaw moment. Moreover,
Q = diag ( q 1 , q 2 )
is the diagonal state weighting matrix, in which q 1 , q 2 0 are the individual weighting factor associated with each system state. This allows one to give more or less importance to the control of the yaw rate versus β . Finally, the scalar σ > 0 is the control weighting factor that allows one to trade system state tracking errors versus a control input effort. In this way, the MPC objective is to obtain an input control sequence
U ( k ) = u ( k ) u ( k + 1 ) u ( k + N 1 ) T
that minimizes the cost function (32) over a prediction horizon N. Importantly, to forecast the future system behavior, the discrete-time system model (13) must be used, which considers the known input disturbance d ¯ = d ( k ) as persistent over the whole prediction horizon. This will lead to the following future system state predictions:
X [ 1 : N ] = x T ( k + 1 ) x T ( k + N ) T
Moreover, since the value that the yaw moment can adopt is physically limited by the torque of the motors, it is necessary to constrain all system input along the whole prediction horizon. Consequently, in a formal manner, the MPC strategy can be formulated as the following optimal control problem:
U opt ( k ) = arg min V N ( x ( k ) , U ( k ) )
subject to : x ( + 1 ) = A x ( ) + B u ( ) + d ¯
u min u ( ) u max , { k , k + N 1 }
The solution of the optimal control problem in (36) leads to the following optimal input vector:
U opt ( k ) = u opt ( k ) u opt ( k + 1 ) u o p t ( k + N 1 ) T .
Finally, following the receding horizon policy, only the first element of the optimal input vector, u opt ( k ) , is applied to the system, discarding the remaining future optimal inputs. This yields the following predictive closed-loop equation:
x ( k + 1 ) = A x ( k ) + B u opt ( k ) + d ¯
Then, this procedure is repeated at each sampling instant using fresh measurements of the system states, vehicle speed, and steering angle.
By iterating (13), the future predictive values for the state vector X [ 1 : N ] = x T ( 1 ) x T ( N ) T , can be obtained by:
X [ 1 : N ] = Λ x ( 0 ) + Φ U ( k ) + Γ d ¯
where
Λ = A A 2 A N , Φ = B 0 n × m 0 n × m 0 n × m A B B 0 n × m 0 n × m A N 1 B A N 2 B A B B , Γ = I A + I A N 1 + A N 2 A + I
Compact form:
V N = X e , [ 1 : N ] T Q N X e , [ 1 : N ] + σ ( S U ( k ) G u ( k 1 ) ) T ( S U ( k ) G u ( k 1 ) )
where
Q N = diag { Q , , Q }
S = 1 0 0 0 0 1 1 0 0 0 0 1 1 0 0 0 0 0 1 1 , G = 1 0 0 0
X e , [ 1 : N ] T Q N X e , [ 1 : N ] = Λ x ( 0 ) + Γ d ¯ X [ 1 : N ] + Φ U ( k ) T Q N Λ x ( 0 ) + Γ d ¯ X [ 1 : N ] + Φ U ( k ) = Λ x ( 0 ) + Γ d ¯ X [ 1 : N ] T Q N Λ x ( 0 ) + Γ d ¯ X [ 1 : N ] + 2 Λ x ( 0 ) + Γ d ¯ X [ 1 : N ] T Q N Φ U ( k ) + U T ( k ) Φ T Q N Φ U ( k )
and
σ ( S U ( k ) G u ( k 1 ) ) T ( S U ( k ) G u ( k 1 ) ) = σ u 2 ( k 1 ) 2 σ u ( k 1 ) G T U ( k ) + σ U T ( k ) S T S U ( k )
Then, it follows that:
V N ( x ( k ) , U ( k ) ) = ν + U ( k ) T H U ( k ) + 2 f T ( k ) U ( k )
where
H = Φ T Q N Φ + σ S T S
and
f ( k ) = Φ T Q N Λ x ( k ) + Γ d ¯ X [ 1 : N ] σ G u ( k 1 )
Note that the term
ν = Λ x ( k ) + Γ d ¯ X [ 1 : N ] T Q N Λ x ( k ) + Γ d ¯ X [ 1 : N ] + σ u 2 ( k 1 )
does not depend on the input vector U ( k ) . Therefore, it does not participate in the optimization.
Finally, the original optimal control problem in (36) can be transformed into the following equivalent optimal problem:
U opt ( k ) = arg min U ( k ) U T ( k ) H U ( k ) + 2 f T ( k ) U ( k )
subject to : u min I N U ( k ) u max I N
where I N stands for an N × N identity matrix.
This optimization is a convex optimal problem due to the quadratic cost function and linear constraints. Therefore, standard Quadratic Programming (QP) algorithms can be used to obtain U opt ( k ) .

3.5. Torque Allocation

The control input applies the assistive yaw moment, denoted as M z c , to the system. This is carried out by adjusting the torque of the individual motors. The relationship between the yaw moment and torque can be expressed in relation to the tire forces as:
M z c = ( F x 3 F x 4 ) t r 2 = Δ F t r 2 = Δ T t r 2 r w = 2 T t r 2 r w = T t r r w
Rearranging (52), then the total torque input from the controls can be described as:
T = M z c r w t r .
When distributed to the rear wheels:
T 3 = T d r i v e r 2 + T
T 4 = T d r i v e r 2 T .

4. Vehicle Side-Slip Estimation

In simulation environments, finding the vehicle side-slip is simple; however, it can be difficult to measure in real life. There are two primary methods for side-slip estimation known as Model-Based Observers and Kinematic Observers [34]. The Model-Based Observer commonly relies on the liner bicycle model and, as such, the tire cornering stiffness, which is known to influence the accuracy. The Kinematic-Based Observers are independent from tire–road parameters, as they rely on the correlation of the vehicles measured yaw rate, lateral and longitudinal velocity, and the longitudinal and lateral acceleration [34,35,36]. Due to the knowledge that the custom solar car tires in this research have limited tire data, the Kinematic-Based Observer would be more suitable.
In [22,25,37], dynamic curvature was introduced as a control variable, which has the potential to remove the use of complicated estimators during real-life testing. From the steady-state of the reference model, the curvature of a vehicle’s driving path for neutral steer can be described as:
1 R = δ L + m v x 2 ( l r C r l f C f 2 C f C r L )
where R is the radius of the vehicle’s cornering path.
The drawbacks, as described by [25], are the potential error due to the curvature being derived from the steady-state model as well as the cornering stiffness of the tires having been linearized and approximated. As per [37], the dynamic curvature variable denoted as k can be expressed as:
k = β ˙ + r v x
The use of k ( t ) allows for the use of the instantaneous curvature at any time during maneuvering. The lateral acceleration ( a y ) can be obtained from the inertia measurement unit (IMU) and is mathematically expressed as:
a y = ( β ˙ + r ) v x
By expressing (57) in relation to (58), a relationship between obtainable data and side-slip can be made as:
k = β ˙ + r v x = a y v x 2
Rearrange
β ˙ = a y v x r
then side-slip can then be expressed as:
β = a y v x r d t

Lateral Acceleration Compensation

Lateral and longitudinal acceleration experience bias when road bank and chassis angles are present [38]. The measured acceleration, a y m , requires gravity compensation for a correct estimation of the side-slip as mentioned in [39,40], which can be achieved as follows:
a y = a y m g sin ( ϕ + χ )
whereas χ is the road bank angle. Thus, ( ϕ + χ ) represents the vehicle roll angle in relation to the global coordinate field. Correspondingly, the measured roll angle, which can be measured via an IMU, can be described as ϕ m = ( ϕ ± χ ) , which accommodates for positive and negative bank angle depending on which direction the vehicle is facing in relation to the IMU coordinate field. As per [39], (61) can now be written as:
a y = a y m g sin ( ϕ m )
As such, the side-slip with gravity compensation can, in its full expansion, be expressed as:
β = a y m g sin ( ϕ m ) v x r d t
The integral is sensitive to sensor offsets and noise, which can result in large cumulative errors. To remove noise between the maneuvers and to overcome the issue of division by small numbers, which causes exponential peaks, the control has a velocity initiation at 2 m/s. This control initiation velocity is low enough for the vehicle to be considered within its stability region and, as such, does not impose any safety concerns.

5. Data Acquisition and Control Unit Integration

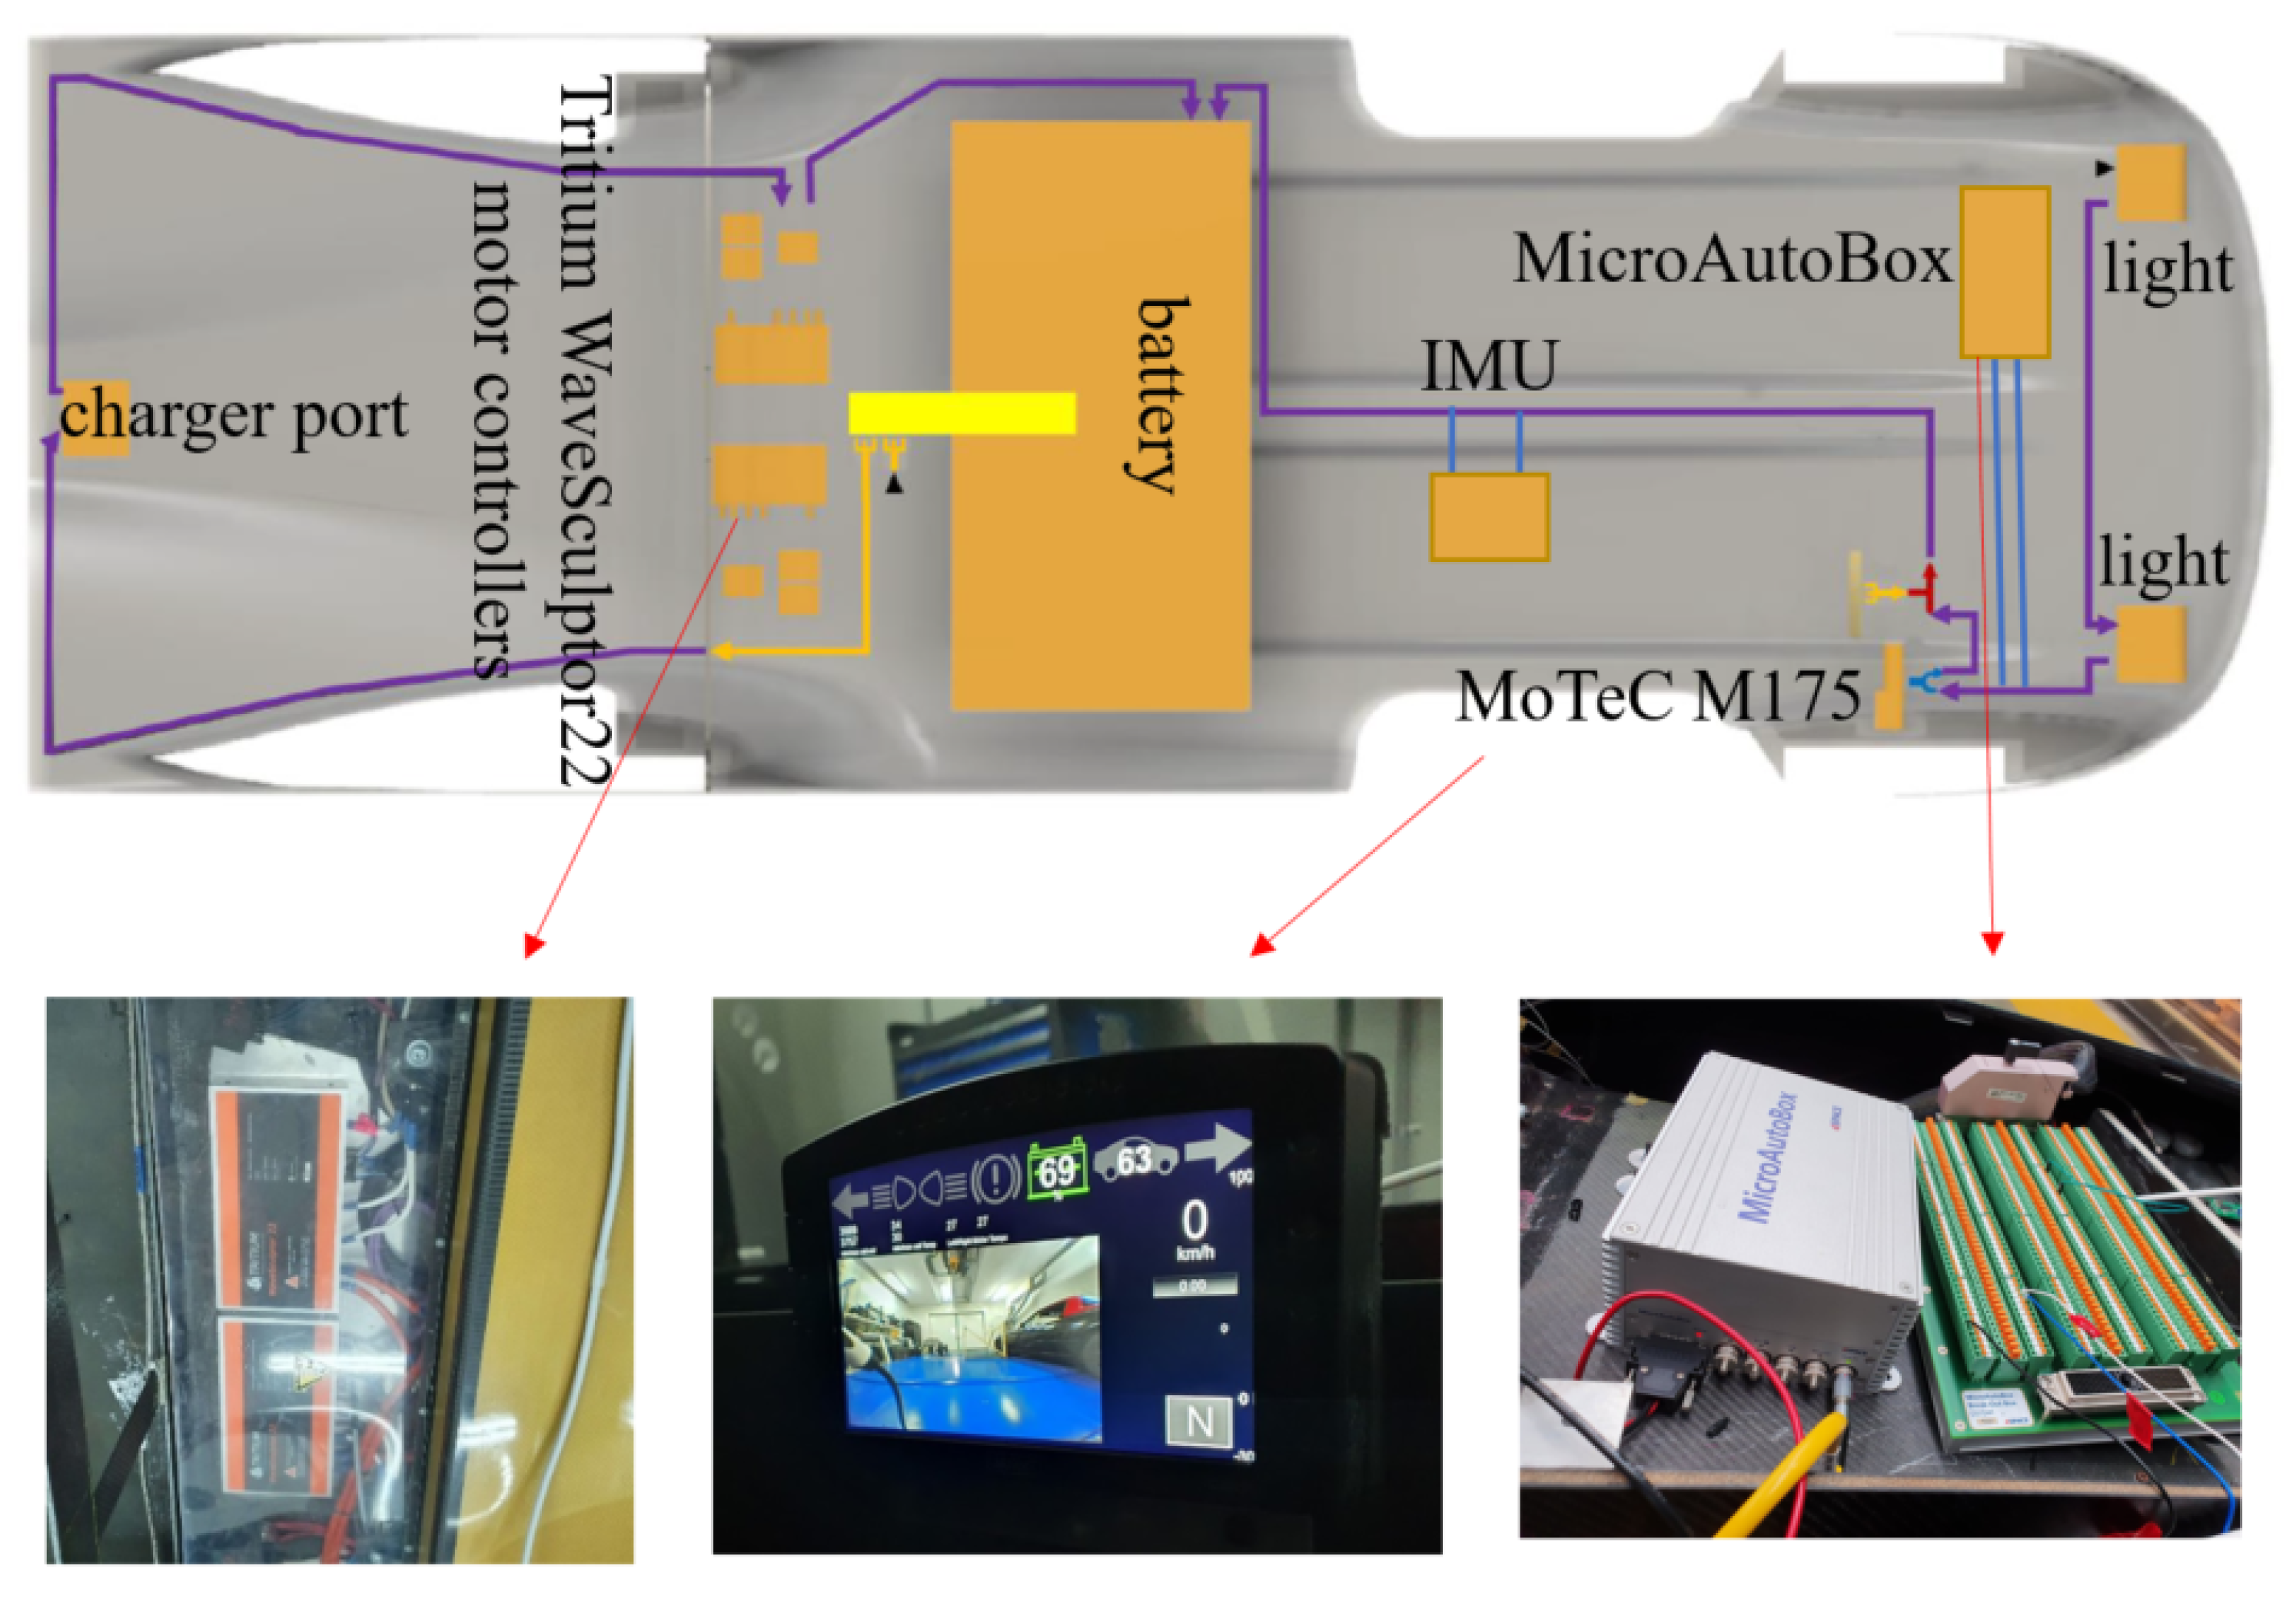
The existing vehicle control originally consisted of a MoTeC C187 dash and two Tritium WaveSculptor 22 Motor Inverters. These can process simple driver commands; however, the setup is not capable of any advanced control mathematics. As such, the control strategy is implemented by connecting a dSPACE MicroAutoBox II to the existing CAN (Figure 4).
To verify control and ensure the safety of the vehicle and its occupants, the Simulink® control model is implemented to the vehicle via the dSPACE MicroAutoBox. This step allows for the evaluation of the control and parameter estimation and tuning.
The dSPACE MicroAutoBox II (Version 1401/1511, Germany) allows for data collection, enabling, disabling, and control selection in real time via the associated dSPACE control desk software.The software has real-time monitoring ability, which permits quick evaluation of data during testing that assists in tuning sensors and parameter estimations.
As this test was performed during the COVID-19 lockdown, the experiment was faced with unprecedented circumstances which limited the availability of resources and the test area. To eliminate bias during testing, precautions were taken to avoid errors, such as the inclusion of lateral acceleration compensation and the initiation velocity as 2 m/s of the control, as mentioned in the previous section. Due to the vehicle’s heavy steering, the mounting bracket experienced a low level of flex, which was not discovered until the data were processed. As such, a manual offset value was introduced to the steering angle reading to reduce error in the control, which is due to the dynamic input to the desired model.

6. Results

This paper considers a low-speed (longitudinal velocity < 5 m/s) slalom maneuver as the baseline. By examining at a lower velocity, the vehicle is within its stability region, which allows for the estimation of the tire cornering stiffness, as detailed in the previous section. The baseline test is then compared to the results of the vehicle driven with a higher velocity and then compared to the results of the vehicle with a passenger introduced. Furthermore, the baseline is ultimately compared to a simulation.

6.1. Baseline Slalom Maneuver with Low Velocity < 5 m/s

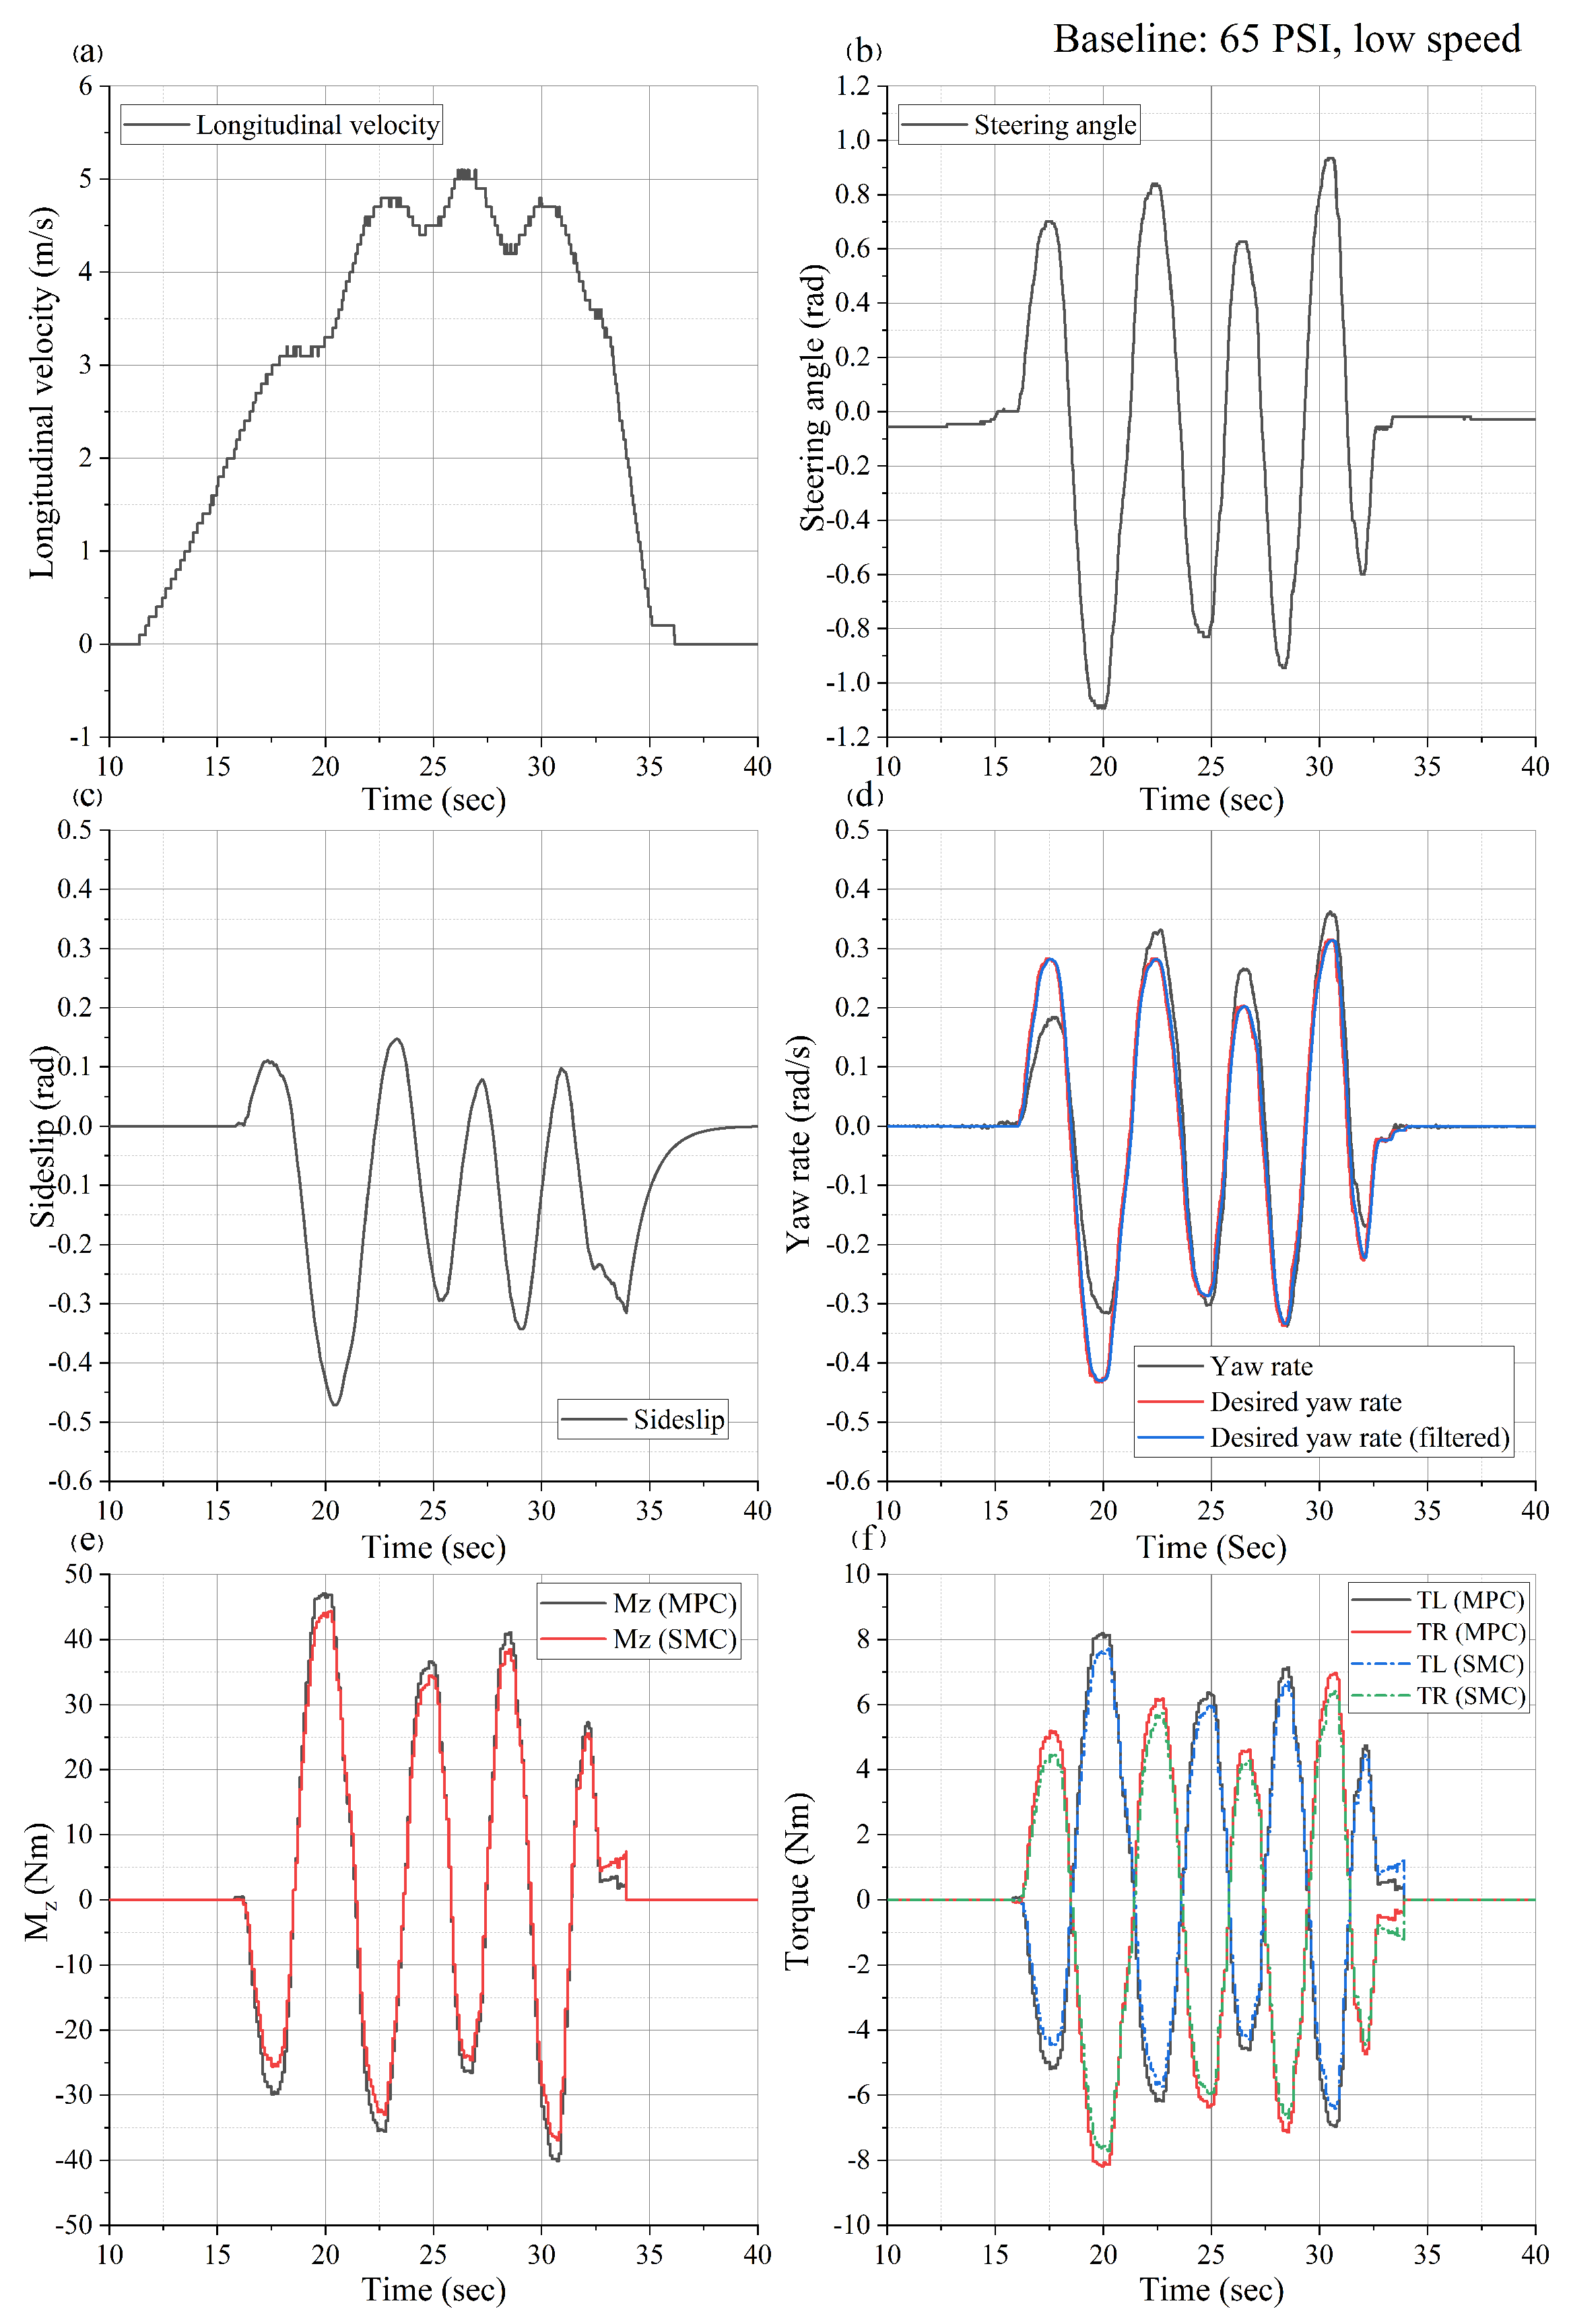
The longitudinal velocity in Figure 5a indicates that the control is enabled at approximately 15.5 s, whereas the steering angle in Figure 5b indicates that the maneuver commences at 16 s. The steering angle offset was compensated for at the beginning of the maneuver. However, there is still a small offset present upon termination of the maneuver. These offsets are due to the bracket plasticity of the steering angle sensor, as mentioned in an earlier section.
The estimated side-slip in Figure 5c indicates the largest peak occurs just after 20 s, which correlates with the steering action in Figure 5b. The side-slip angle is significantly larger than expected and does not flutter around zero. This indicates that both error and drift have been introduced to the estimation due to an accumulative effect of such error. Examining Figure 5c, it can be found that the side-slip as the control action is disabled at the time instance 33 s, is about −0.3 radians, which is a relatively large offset as the true value should be going towards zero at lower velocities.
Since the side-slip is estimated based on the lateral acceleration, the longitudinal velocity, and the yaw rate, there are three sources of error. The yaw rate is of little concern as the yaw rate is not heavily impacted by the road bank angle, as well as the raw data in Figure 5d correlating well with the steering action at a reasonable magnitude. The two main concerns of error are due to (i) non-constant velocity as per Figure 5a and (ii) offset error in the lateral acceleration due to the road bank angle.
Figure 5d shows the raw yaw rate data recording in comparison to the desired yaw rate, filtered and unfiltered. In this baseline vehicle, it is expected that the desired yaw rate should be a close match to the vehicle’s yaw rate. Since the desired model is derived from the linear bicycle model, which considers a constant velocity on a flat surface, a certain degree of error is to be expected due to the test area. This is also expected during the time range of 16–22.5 s, as the vehicle is undergoing relatively large acceleration compared to the remainder of the maneuver. The undesired offset in the steering angle sensor is expected to introduce a slight error, particularly in the beginning and towards the end of the maneuver. This produces a small step error at the end of the maneuver as the desired yaw returns to zero while the vehicle velocity is below 2 m/s. In terms of the desired yaw rate, the magnitude is small enough to be neglected since the raw yaw rate is a close match as per Figure 5d.
The controller peaks correlate with the peaks of steering angle in Figure 5b and the desired yaw rate in Figure 5d, during the time range 18–22 s and 28–32 s. In Figure 5e, the assistive yaw moment is displayed, which indicates that the MPC produces a slightly larger moment than the SMC. This is directly reflected in the torque in Figure 5f, where the MPC produces a slightly larger torque. In general, the MPC is requesting a larger effort to reach the reference yaw rate compared to the SMC. The more apparent deviation between the MPC and SMC is at the end of the maneuver. The MPC produces a relatively smooth transition, which is desired, while the SMC abruptly cuts off at approximately 1 Nm. The steering offset has previously been found to produce these types of cut-offs in the desired yaw rate. However, since the steering angle is also an input to the system matrix, this would reflect the controller’s behavior. Overall, there is a fine difference between the two control methods; however, the MPC’s ability to handle the sensor errors and offsets is an advantage.
These results do not necessarily reflect the correct action of either of the controllers under study because it is performed in an open loop since the control action is not applied to the system. Nonetheless, the comparison of the controllers’ effort when unchanged real-time data are processed, and estimation error is present makes it possible to evaluate if the control action is appropriate and safe to be enabled in future works. The evaluation of this baseline vehicle setup indicates that since the torque is relatively low and evenly distributed, it should be considered safe enough for closed-loop testing even if estimation error for side-slip and sensor error is present. It is, however, desired that the side-slip estimation and sensor errors are rectified and evaluated prior to closed-loop testing for more accurate representation.

6.2. Slalom Maneuver with Velocity > 5 m/s

The baseline test in Section 6.1 considered a longitudinal velocity < 5 m/s while performing a slalom maneuver, with all four tires of an equal tire pressure of 65 PSI. In this section, the test is repeated with a higher velocity to examine if there are deviations between the raw yaw rate and the desired yaw rate.
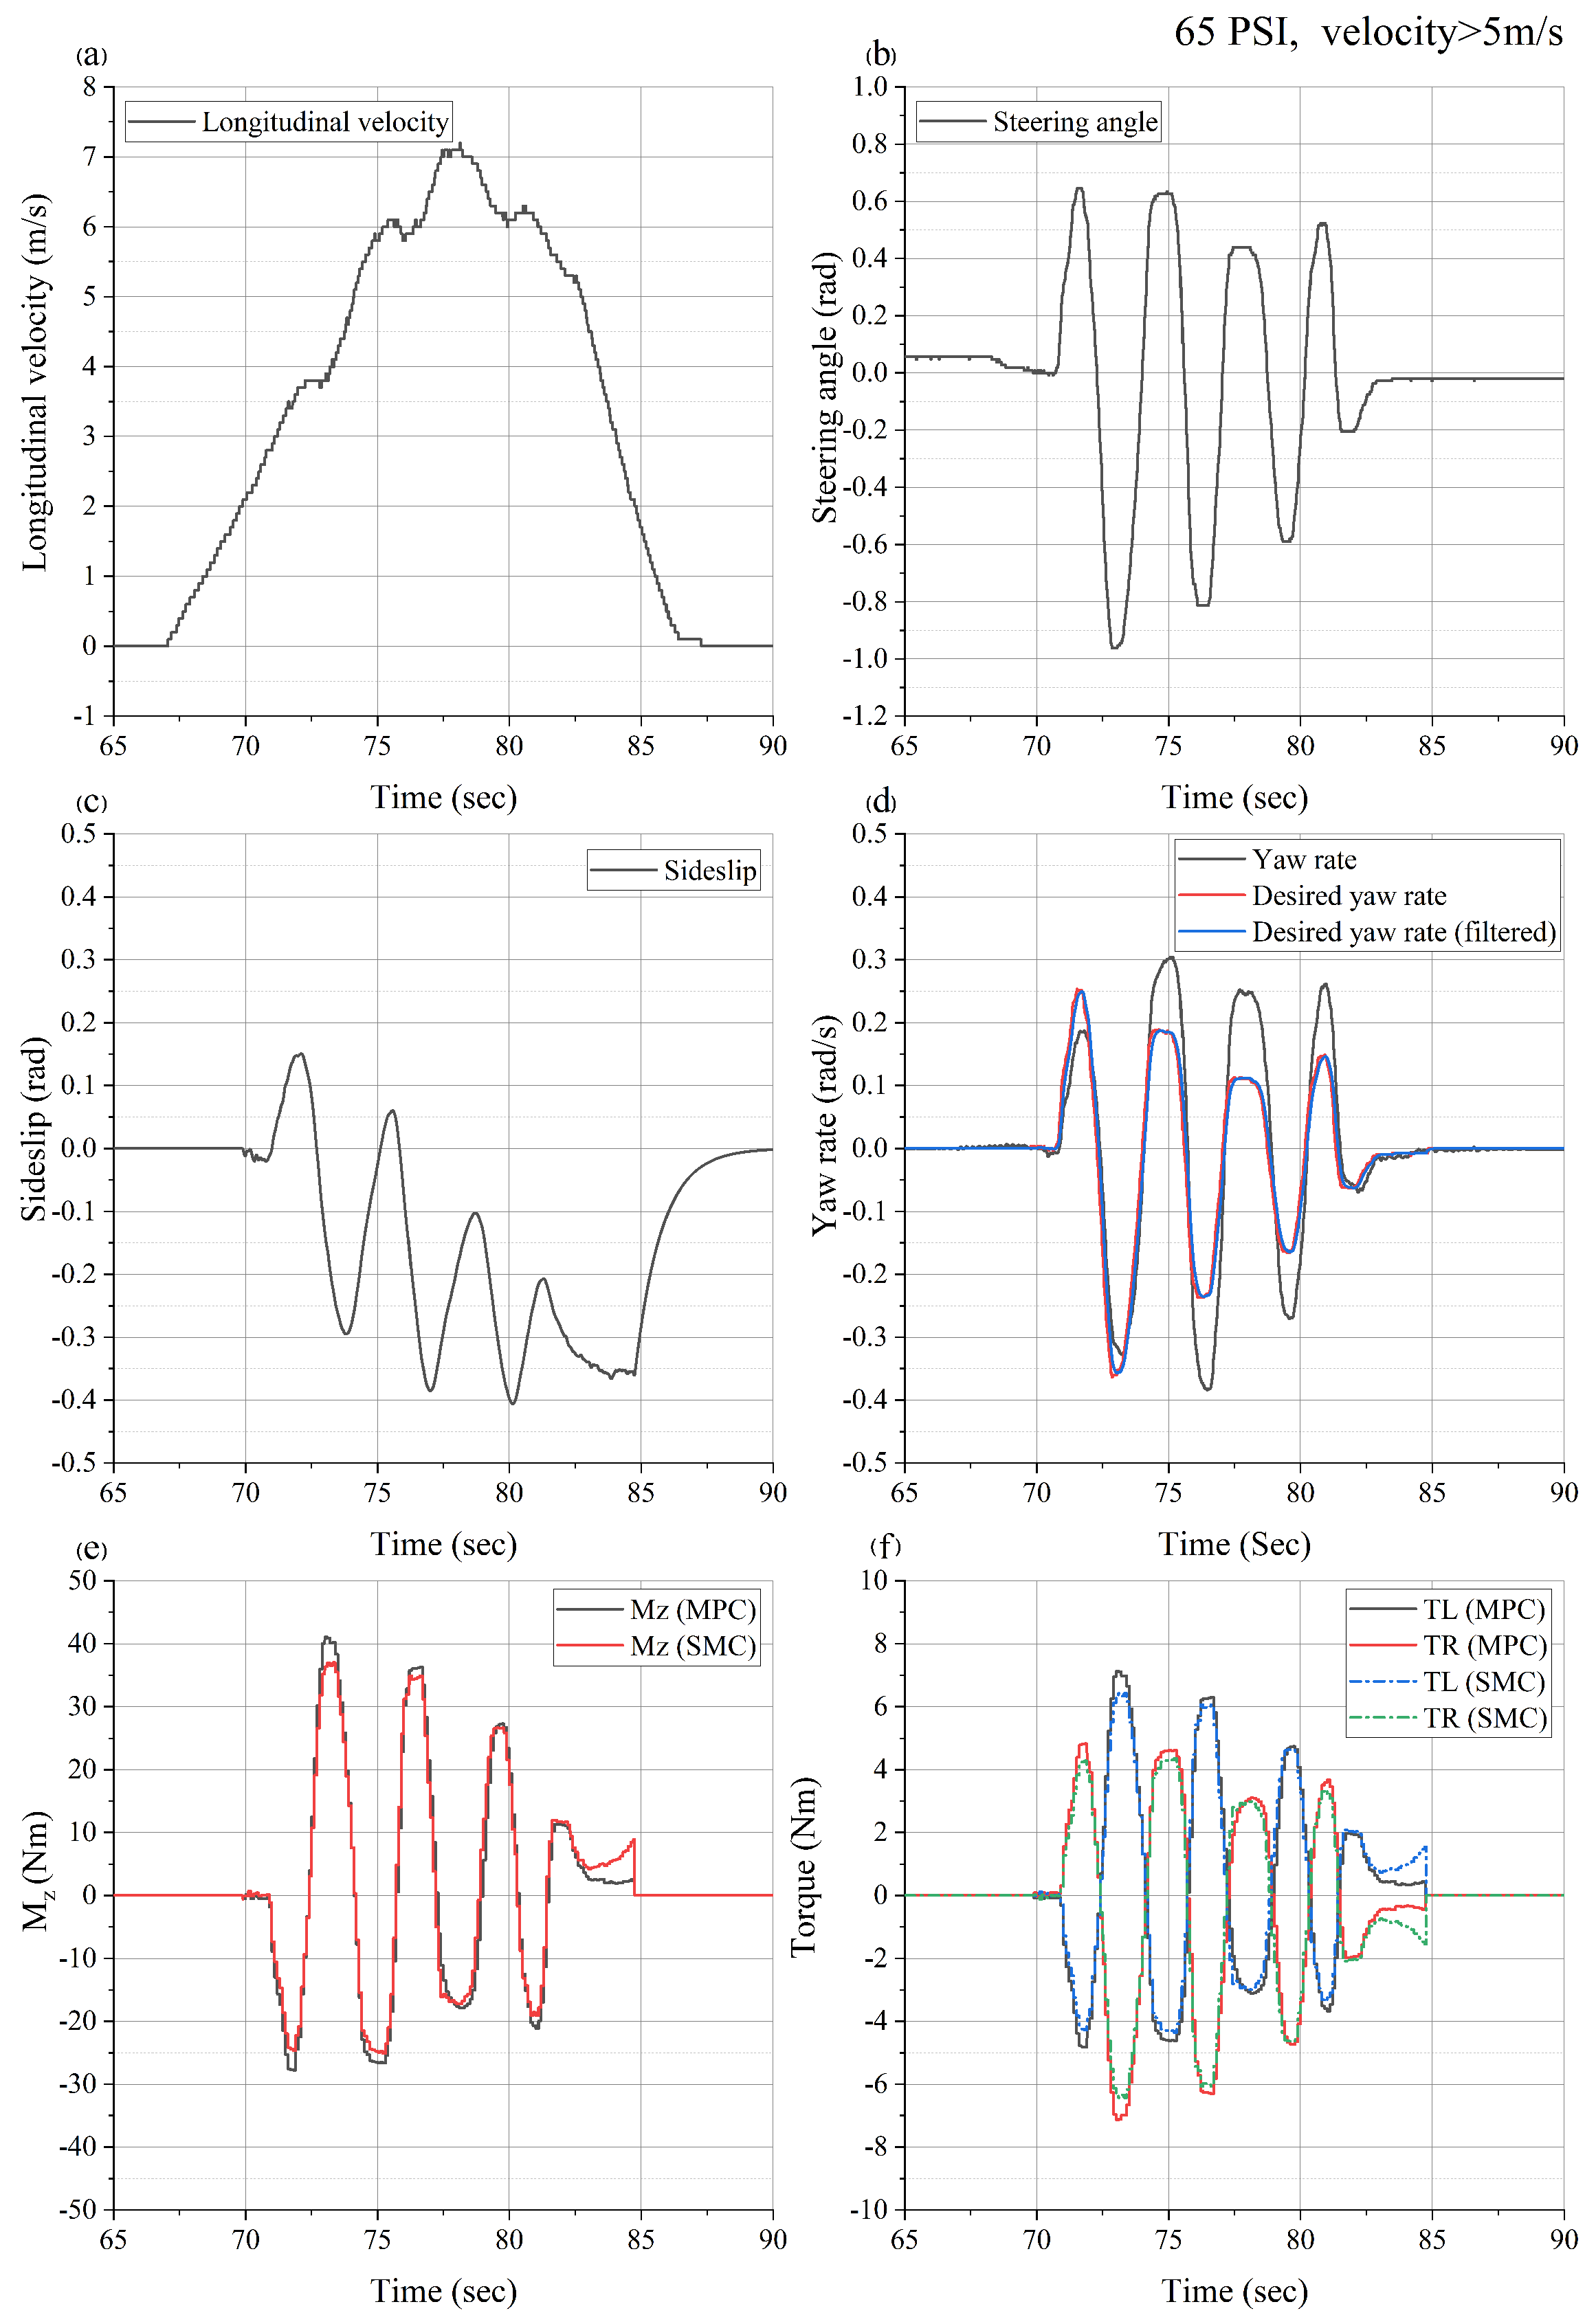
The longitudinal velocity in Figure 6a indicates that the control strategy is enabled approximately at the instant 70 s, and the steering angle in Figure 6b indicates that the maneuver commences closely thereafter. The first steering action is performed at a velocity of 4 m/s and steering angle of 0.65 rad, which is within the range of velocity and steering angle for the baseline vehicle in Figure 5. The steering angle offset has been accommodated for at the beginning of the maneuver. However, there appears to be a small offset present upon termination, which is of similar magnitude to the baseline test.
Although the velocity is not constant for the baseline vehicle in Figure 5a, there is a close-to-constant velocity during the maneuvers starting from the instant 22.5 s. The increased velocity in Figure 6a experiences less even continuity during the maneuvers, which may be a reason the side-slip drift in Figure 6c is more conspicuous. Although the velocity is one culprit, it cannot be excluded that the increased drift is not due to lateral acceleration offsets or change in location center of gravity due to the vehicle’s low weight. This can be caused by the driver shifting in the seat.
Evidently, there is a larger deviation between the desired yaw rate and measured yaw rate when the velocity is increased as per Figure 6d when compared to the baseline vehicle in Figure 5d. This implies that due to the increased velocity, the vehicle is deviating from steady-state handling for the current velocity, which is likely due to the tires reaching their linear limit. In Figure 6a, at the time instance 70–75 s, the vehicle is undergoing relatively large acceleration, from 2 m/s to 6 m/s. At the same time, the driver is performing the large steering actions per Figure 6b. As a result, the desired yaw rate in Figure 6d at this time is relatively large in comparison to the remainder of the maneuver. However, there is a closer match between the desired yaw rate and the measured one, indicating that the vehicle is within its linear region. Comparing the desired yaw rate in Figure 6d with the baseline in Figure 5d, it is evident that the desired yaw rate is lower even though the velocity is higher. This is due to the smaller steering action in Figure 6b in comparison to Figure 5b, which indicates that the steering angle affects the desired yaw rate more than the velocity. In terms of the raw yaw rate, the higher velocity produces a higher yaw rate even though the steering action is less evasive. The offset in the steering angle in Figure 6d produces a stable offset towards the end of the maneuver until the vehicle reaches the control cut-off at 2 m/s.
In terms of the assistive yaw moment and torque in Figure 6e,f, the peaks correlate well with the steering angle and, consequently, desired yaw rate peaks. Due to the smaller steering angles, the torque output does not reach the same magnitude as the baseline vehicle in Figure 5e,f, even if a more significant drift of side-slip is present for this test. This indicates that the side-slip drift does not vastly impact the controller performance. Similar to the baseline vehicle, however, the side-slip offset, in combination with the steering angle offset, is the cause of the controller peaking at the end. Once again, there is just a fine difference between the two control methods. However, the MPC’s ability to handle side-slip errors is favorable.

6.3. Slalom Maneuver with Passenger

The baseline vehicle in Section 6.1 included only the driver while performing a slalom maneuver. In this section, the test is repeated with a driver and passenger.
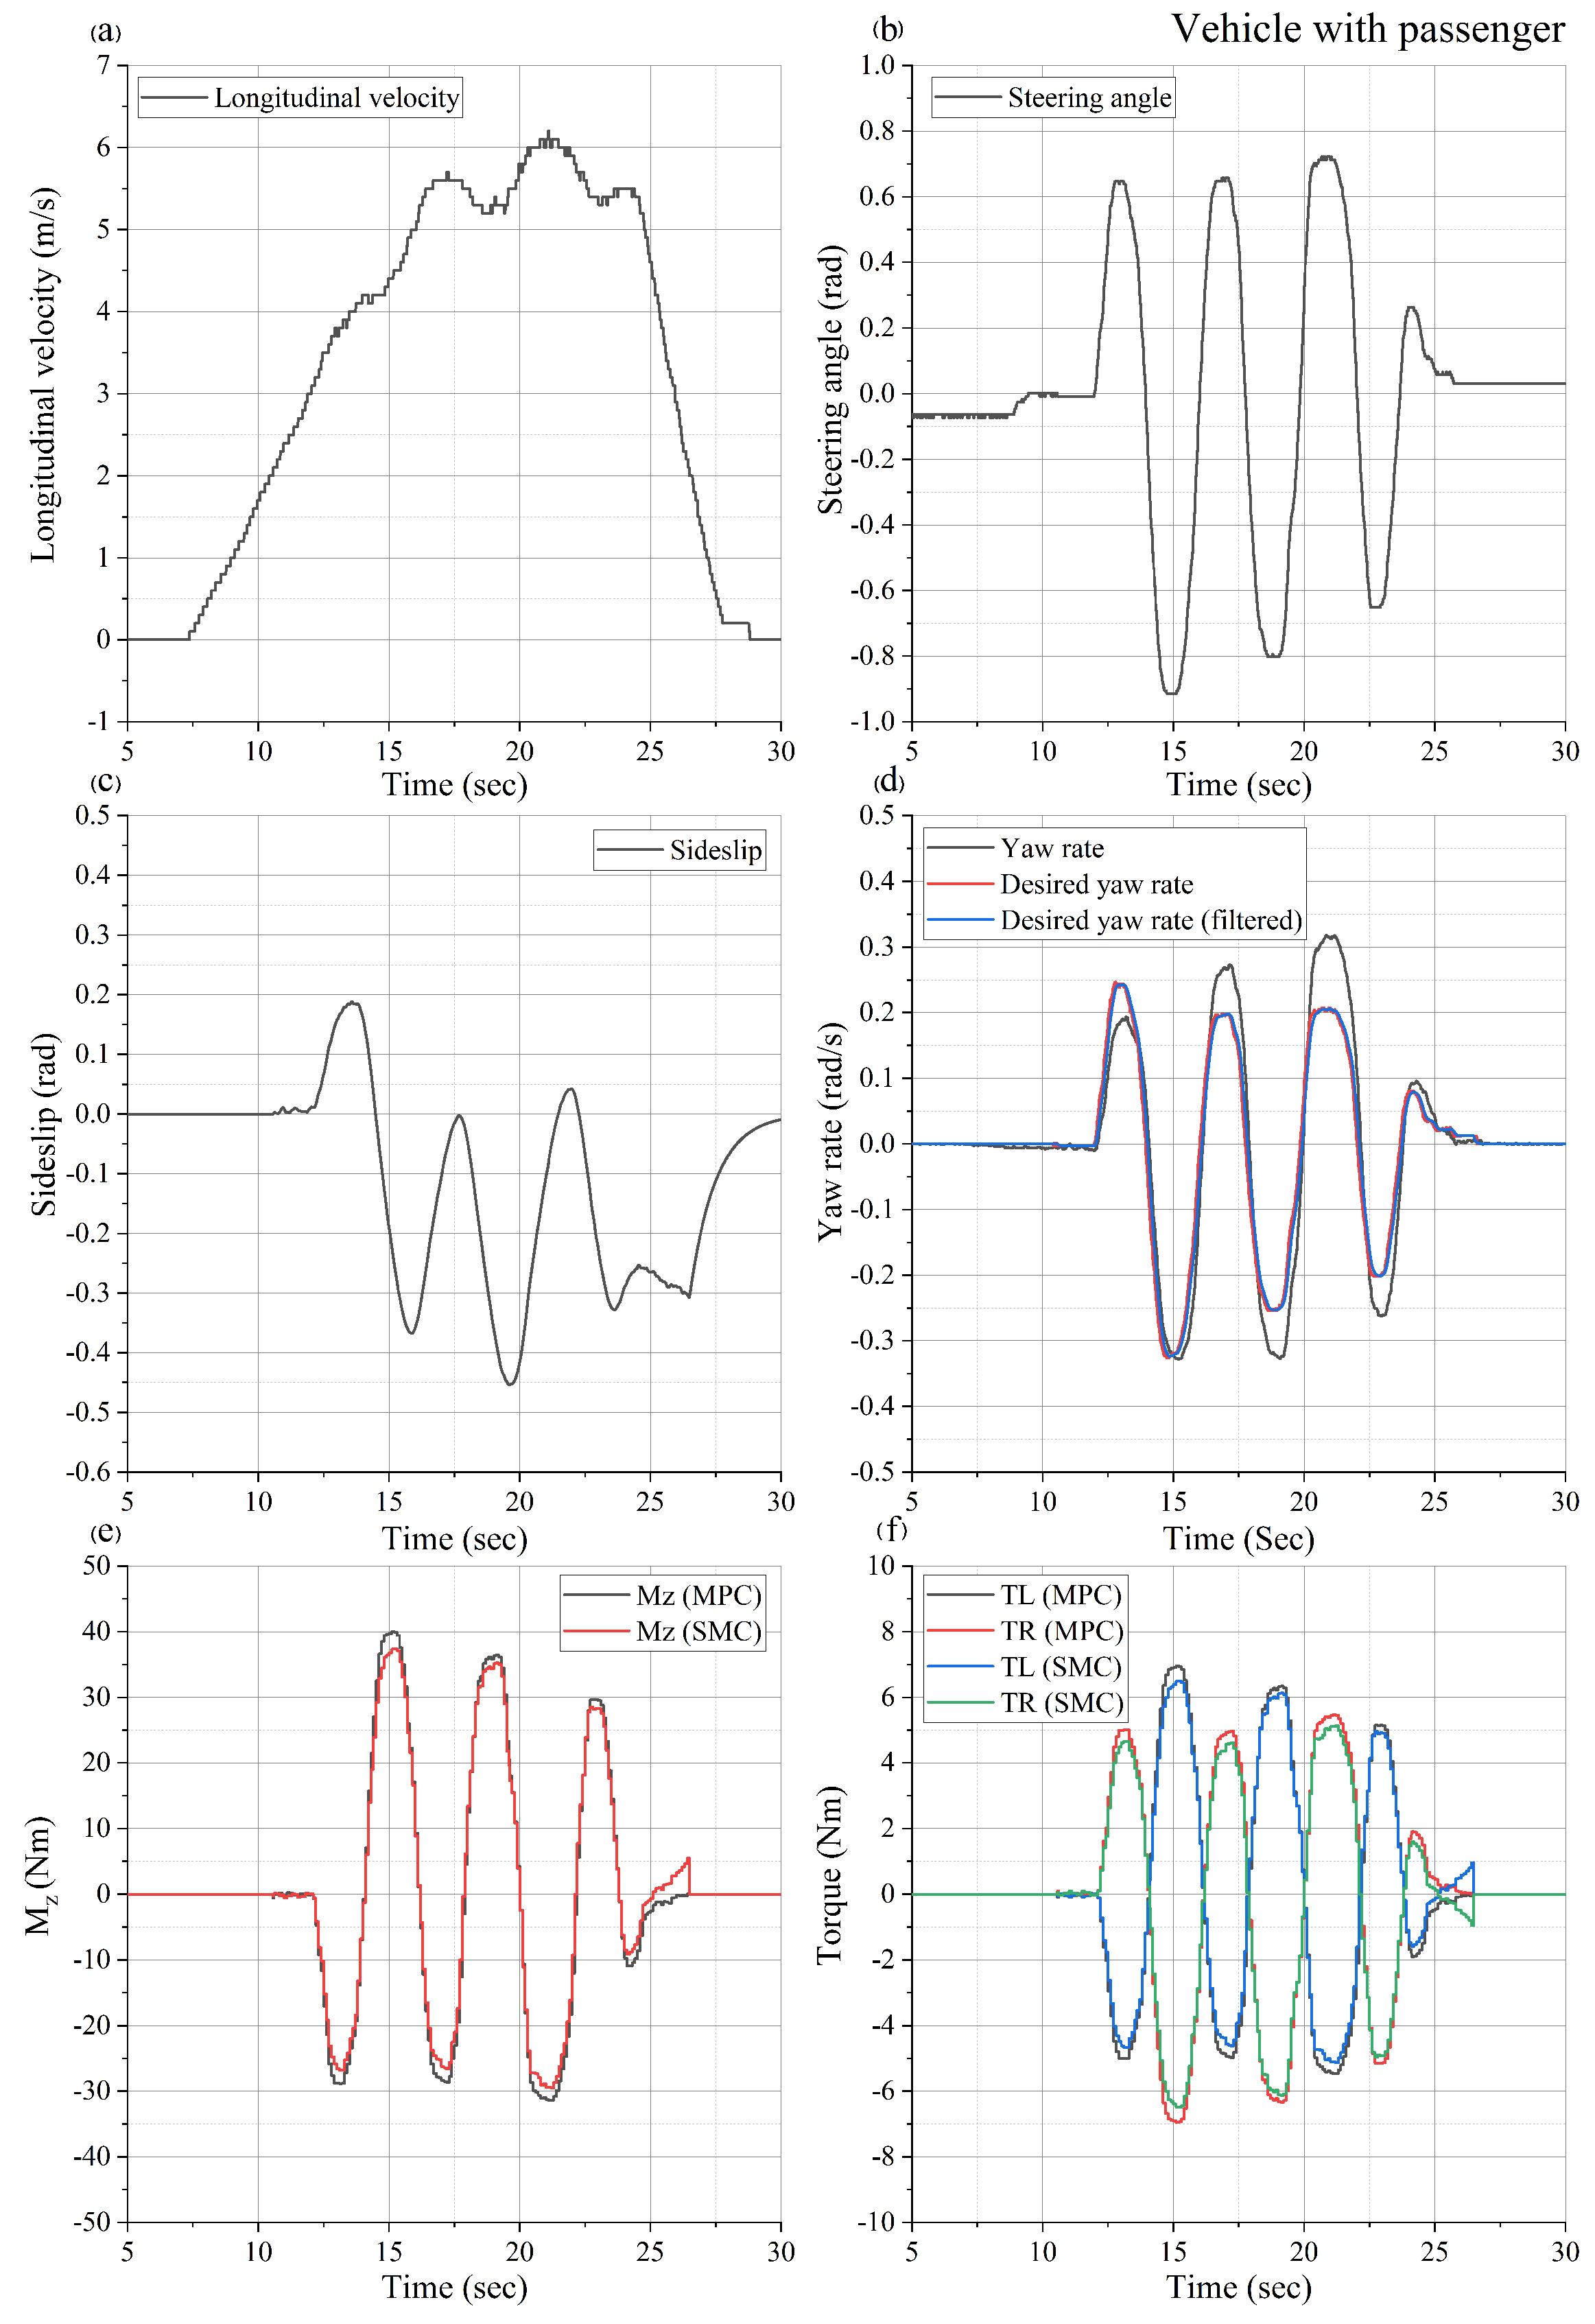
The longitudinal velocity in Figure 7a indicates that the control strategy is enabled approximately at 11 s. The steering angle in Figure 7b indicates that the maneuver commences closely thereafter. The first steering action is performed shortly thereafter at a range that correlates better with the +5 m/s velocity test in Figure 6b closer than the steering actions for the baseline vehicle test in Figure 5b.
The velocity during the initial steer is above 4 m/s, which is larger than both the previous tests and would be the cause of a larger initial peak in side-slip as per Figure 7c. Similar to Figure 6c, there is a significant drift in side-slip compared to the baseline vehicle in Figure 5c. Although the longitudinal velocity is changing at a similar rate in Figure 7a, as in Figure 5a, and unlike Figure 6a, the likely drift error is due to the change in center of gravity caused by the additional passenger.
It is clear that Figure 7d shows a deviation between the desired and measured yaw rate, which is similar to when the velocity increased in Figure 6d. In this case, however, this is partially due to the mismatch in the model since additional mass has been introduced while the model uses its original parameters. This means that the desired model produces the desired yaw rate for a vehicle with the same setup as the baseline vehicle. The increased mass not only impacts the overall weight but also causes a location change in the center of gravity and the tire properties. In previous work by the authors, a simulation study of vehicle parameter sensitivity showed that the change in vehicle parameters causes a phase shift in the yaw rate [22]. Looking closely at Figure 7d, there is a clear phase shift in raw yaw rate, as the vehicle’s parameters have changed in comparison to the desired yaw rate, which considers the original parameters.
In terms of the assistive yaw moment and torque in Figure 7e,f, the peaks correlate well with the steering angle and, consequently, the desired yaw rate peaks. Due to the smaller steering angles, the torque output does not reach the same magnitude as the baseline vehicle in Figure 5e,f, which is similar to Figure 6e even if a more significant drift of side-slip is present. The more notable difference between the two previous tests is the reduced error offset towards the end of the maneuver for the yaw moment in Figure 7e and consequently the torque in Figure 7f. As previously noted, the MPC can handle the offset errors better than the SMC. Although the SMC provides a smaller peaking assistive yaw moment in Figure 7e compared to the baseline vehicle in Figure 5e, the MPC produces a far better response.

6.4. Simulation Model Comparison

The simulation model used in this section is presented in [22]. The simulated responses in Figure 8 are compared with the baseline vehicle data, which is also presented in Section 6.1. The simulation uses obtained steering angle data as per Figure 8b while maintaining a constant velocity as per Figure 8a.
As previously mentioned, the side-slip angle for the real testing is significantly larger than expected, which is supported by results in the simulation. When the vehicle is within a controllable limit, the magnitude of the side-slip angle is, in general, remarkably less than the yaw rate magnitude. Both simulated and real-time test side-slips were estimated using the same method. Siemens Simcenter AmesimTM uses a super-component that allows for ideal measurement of the side-slip. The simulated result was performed with both the measured and estimated side-slip. Since both data were identical, the measured one was excluded from the results in Figure 8b. This is an excellent example of how the observer is affected by uncertainty caused by real-world testing and further highlights the need for additional considerations in terms of testing and/or observer design.
The resulting simulated yaw rate is a very close match to the measured yaw rate, unlike the larger mismatch during real testing. This highlights how real-time testing is affected by non-ideal testing conditions and non-constant velocity, requesting a larger desired yaw rate despite lower velocity.

7. Conclusions

This paper proposed two methods of direct yaw moment control—(i) Sliding-Mode Control and (ii) Model Predictive Control—to improve the vehicle stability of a lightweight solar car. The paper includes a detailed description of the vehicle specification and determination of its parameters. Using these and making reasonable assumptions, a detailed development of a linearized, 2D model for the vehicle is described.
A baseline case—a low-speed slalom maneuver—was compared to the vehicle being driven at higher velocity and with the introduction of a passenger. The vehicle was driven on a test track with a road bank angle, and the control was investigated in an open-loop setting with two test scenarios: (i) a slalom maneuver with velocity > 5 m/s, (ii) a slalom maneuver with a passenger in addition to the driver. These tests demonstrated the effectiveness of the control strategies during different operational settings.
The vehicle side-slip was estimated using the Kinematic-Based Observer, which was adapted to account for the variation in lateral acceleration due to the bank angle. Although the estimation showed discrepancies, the robustness of the control methods ensured that there were no major disruptions in vehicle output, as verified through closed-loop simulations. This indicates the potential to adopt these control methods for real-world application; however, it is necessary to explore a more accurate observer and further validate the process in a fully operational setting.
The novelty of this paper is the specific adoption and application of SMC and MPC to the specific design envelope of the solar-electric vehicle to contribute to advancements in solar racing vehicles.

Author Contributions

Conceptualization, A.L.L. and P.D.W.; methodology, A.L.L., P.D.W., R.P.A. and S.Z.; software, A.L.L., S.Z. and P.D.W.; validation, A.L.L., P.D.W., R.P.A., B.H. and S.Z.; formal analysis, A.L.L., P.D.W., R.P.A. and S.Z.; investigation, A.L.L., P.D.W., R.P.A., B.H. and S.Z.; resources, A.L.L., P.D.W. and B.H.; data curation, A.L.L. and S.Z; writing—original draft preparation, A.L.L., P.D.W., R.P.A. and S.Z.; writing—review and editing, A.L.L., R.P.A., B.H. and S.Z.; visualization, A.L.L., P.D.W., R.P.A., B.H. and S.Z.; supervision, P.D.W.; project administration, A.L.L., P.D.W., R.P.A., B.H. and S.Z.; funding acquisition, P.D.W. and B.H. All authors have read and agreed to the published version of the manuscript.

Funding

This project was supported by the Australian Research Council Discovery Early Career Research Award (DE170100134), and by the Australian Technology Network solar car project; the ATN solar car team.

Data Availability Statement

The data supporting the reported results are available from the corresponding author upon reasonable request.

Conflicts of Interest

The authors declare no conflict of interest.

Abbreviations

The following abbreviations are used in this manuscript:
ATNAustralian Technology Network
DOFDegree of freedom
SMCSlide mode control
MPCModel predictive control
IMUinertia measurement unit

References

  1. Bridgestone World Solar Challenge. 2022. Available online: https://www.worldsolarchallenge.org/ (accessed on 27 May 2022).
  2. Minak, G.; Brugo, T.M.; Fragassa, C.; Pavlovic, A.; de Camargo, F.V.; Zavatta, N. Structural design and manufacturing of a cruiser class solar vehicle. J. Vis. Exp. 2019, 143, e58525. [Google Scholar]
  3. Pavlovic, A.; Sintoni, D.; Fragassa, C.; Minak, G. Multi-objective design optimization of the reinforced composite roof in a solar vehicle. Appl. Sci. 2020, 10, 2665. [Google Scholar] [CrossRef]
  4. Paterson, S.; Vijayaratnam, P.; Perera, C.; Doig, G. Design and development of the Sunswift eVe solar vehicle: A record-breaking electric car. Proc. Inst. Mech. Eng. Part D J. Automob. Eng. 2016, 230, 1972–1986. [Google Scholar] [CrossRef]
  5. Lenzo, B.; Zanchetta, M.; Sorniotti, A.; Gruber, P.; De Nijs, W. Yaw rate and sideslip angle control through single input single output direct yaw moment control. IEEE Trans. Control Syst. Technol. 2021, 29, 124–139. [Google Scholar] [CrossRef]
  6. Choi, M.; Choi, S.B. Model predictive control for vehicle yaw stability with practical concerns. IEEE Trans. Veh. Technol. 2014, 63, 3539–3548. [Google Scholar] [CrossRef]
  7. Lutz, A.; Schick, B.; Holzmann, H.; Kochem, M.; Meyer-Tuve, H.; Lange, O.; Mao, Y.; Tosolin, G. Simulation methods supporting homologation of Electronic Stability Control in vehicle variants. Veh. Syst. Dyn. 2017, 55, 1432–1497. [Google Scholar] [CrossRef]
  8. Li, L.; Lu, Y.; Wang, R.; Chen, J. A three-dimensional dynamics control framework of vehicle lateral stability and rollover prevention via active braking with MPC. IEEE Trans. Ind. Electron. 2016, 64, 3389–3401. [Google Scholar] [CrossRef]
  9. Jalali, M.; Hashemi, E.; Khajepour, A.; Chen, S.k.; Litkouhi, B. A combined-slip predictive control of vehicle stability with experimental verification. Veh. Syst. Dyn. 2018, 56, 319–340. [Google Scholar] [CrossRef]
  10. Termous, H.; Shraïm, H.; Talj, R.; Francis, C.; Charara, A. Coordinated control strategies for active steering, differential braking and active suspension for vehicle stability, handling and safety improvement. Veh. Syst. Dyn. 2019, 57, 1494–1529. [Google Scholar] [CrossRef]
  11. Wang, F.; Chen, H.; Guo, K.; Cao, D. A novel integrated approach for path following and directional stability control of road vehicles after a tire blow-out. Mech. Syst. Signal Process. 2017, 93, 431–444. [Google Scholar] [CrossRef]
  12. Kumbhar, B.K.; Patil, S.R.; Sawant, S.M. A Comparative study on automotive brake testing standards. J. Inst. Eng. Ser. C 2017, 98, 527–531. [Google Scholar] [CrossRef]
  13. Thiyagarajan, V.; Kalaichelvan, K.; Vijay, R.; Lenin Singaravelu, D. Influence of thermal conductivity and thermal stability on the fade and recovery characteristics of non-asbestos semi-metallic disc brake pad. J. Braz. Soc. Mech. Sci. Eng. 2016, 38, 1207–1219. [Google Scholar] [CrossRef]
  14. Zhang, L.; Chen, H.; Huang, Y.; Wang, P.; Guo, K. Human-centered torque vectoring control for distributed drive electric vehicle considering driving characteristics. IEEE Trans. Veh. Technol. 2021, 70, 7386–7399. [Google Scholar] [CrossRef]
  15. Li, X.; Xu, N.; Guo, K.; Huang, Y. An adaptive SMC controller for EVs with four IWMs handling and stability enhancement based on a stability index. Veh. Syst. Dyn. 2021, 59, 1509–1532. [Google Scholar] [CrossRef]
  16. Jin, X.; Yin, G.; Zeng, X.; Chen, J. Robust gain-scheduled output feedback yaw stability control for in-wheel-motor-driven electric vehicles with external yaw-moment. J. Frankl. Inst. 2018, 355, 9271–9297. [Google Scholar] [CrossRef]
  17. Ataei, M.; Khajepour, A.; Jeon, S. Model predictive control for integrated lateral stability, traction/braking control, and rollover prevention of electric vehicles. Veh. Syst. Dyn. 2020, 58, 49–73. [Google Scholar] [CrossRef]
  18. Ren, B.; Chen, H.; Zhao, H.; Yuan, L. MPC-based yaw stability control in in-wheel-motored EV via active front steering and motor torque distribution. Mechatronics 2016, 38, 103–114. [Google Scholar] [CrossRef]
  19. Kırlı, A.; Chen, Y.; Okwudire, C.E.; Ulsoy, A.G. Torque-vectoring-based backup steering strategy for steer-by-wire autonomous vehicles with vehicle stability control. IEEE Trans. Veh. Technol. 2019, 68, 7319–7328. [Google Scholar] [CrossRef]
  20. Fu, C.; Hoseinnezhad, R.; Li, K.; Hu, M. A novel adaptive sliding mode control approach for electric vehicle direct yaw-moment control. Adv. Mech. Eng. 2018, 10, 1687814018803179. [Google Scholar] [CrossRef]
  21. Kohlhuber, F.; Lienkamp, M.; Pfeffer, P.E. Load problem of lightweight electric vehicles and solution by online model adaptation. In Proceedings of the 5th International Munich Chassis Symposium, Munich, Germany, 29 July 2014; pp. 281–302. [Google Scholar] [CrossRef]
  22. Lidfors Lindqvist, A.; Zhou, S.; Walker, P.D. Direct yaw moment control of an ultra-lightweight solar-electric passenger vehicle with variation in loading conditions. Veh. Syst. Dyn. 2020, 60, 1393–1415. [Google Scholar] [CrossRef]
  23. Uli, R. Non-Lagging Effect of Motorcycle Tyres: An Experimental Study with the Flat Plank Tyre Tester; Technische Universiteit Eindhoven: Eindhoven, The Netherlands, 2006. [Google Scholar]
  24. Regolin, E.; Savitski, D.; Ivanov, V.; Augsburg, K.; Ferrara, A. Lateral vehicle dynamics control via sliding modes generation. Sliding Mode Control Veh. Dyn. 2017, 121–158. [Google Scholar] [CrossRef]
  25. Jang, Y.; Lee, M.; Suh, I.S.; Nam, K. Lateral handling improvement with dynamic curvature control for an independent rear wheel drive EV. Int. J. Automot. Technol. 2017, 18, 505–510. [Google Scholar] [CrossRef]
  26. Ding, S.; Liu, L.; Zheng, W. Sliding mode direct yaw-moment control design for in-Wheel electric vehicles. IEEE Trans. Ind. Electron. 2017, 64, 6752–6762. [Google Scholar] [CrossRef]
  27. Ji, X.; He, X.; Lv, C.; Liu, Y.; Wu, J. A vehicle stability control strategy with adaptive neural network sliding mode theory based on system uncertainty approximation. Veh. Syst. Dyn. 2018, 56, 923–946. [Google Scholar] [CrossRef]
  28. Truong, D.V.T.; Meywerk, M.; Tomaske, W. Torque vectoring for rear axle using Adaptive Sliding Mode Control. In Proceedings of the 2013 International Conference on Control, Automation and Information Sciences (ICCAIS), Nha Trang, Vietnam, 25–28 November 2013; pp. 328–333. [Google Scholar] [CrossRef]
  29. Cao, Y.; Zhai, L.; Sun, T.; Gu, H. Straight running stability control based on optimal torque distribution for a four in-wheel motor drive electric vehicle. Energy Procedia 2017, 105, 2825–2830. [Google Scholar] [CrossRef]
  30. Ding, S.; Sun, J. Direct yaw-moment control for 4WID electric vehicle via finite-time control technique. Nonlinear Dyn. 2017, 88, 239–254. [Google Scholar] [CrossRef]
  31. Ahmed, A.A. Simulation of Stability Control for In-Whee-Motored Vehicle Using Fuzzy PID Controller. In Proceedings of the Automotive and Vehicle Technologies Conference Proceedings, Istanbul, Turkey, 23–24 November 2015. [Google Scholar]
  32. Schramm, D.; Hiller, M.; Bardini, R. Single Track Models. In Vehicle Dynamics: Modeling and Simulation; Springer: Berlin/Heidelberg, Germany, 2018; pp. 225–257. [Google Scholar] [CrossRef]
  33. Abe, M. Vehicle Handling Dynamics: Theory and Application; Elsevier Science & Technology: Oxford, UK, 2015. [Google Scholar]
  34. Singh, K.B. Vehicle sideslip angle estimation based on tire model adaptation. Electronics 2019, 8, 199. [Google Scholar] [CrossRef]
  35. Selmanaj, D.; Corno, M.; Panzani, G.; Savaresi, S.M. Vehicle sideslip estimation: A kinematic based approach. Control Eng. Pract. 2017, 67, 1–12. [Google Scholar] [CrossRef]
  36. Piyabongkarn, D.; Rajamani, R.; Grogg, J.A.; Lew, J.Y. Development and experimental evaluation of a slip angle estimator for vehicle stability control. IEEE Trans. Control Syst. Technol. 2009, 17, 78–88. [Google Scholar] [CrossRef]
  37. Okajima, H.; Yonaha, S.; Matsunaga, N.; Kawaji, S. Direct Yaw-moment Control method for electric vehicles to follow the desired path by driver. In Proceedings of the SICE Annual Conference 2010, Taipei, Taiwan, 18–21 August 2010; pp. 642–647. [Google Scholar]
  38. Taheri, S.; Singh, K.B. Integrated state and parameter estimation for vehicle dynamics control. Int. J. Veh. Perform. 2019, 5, 329–376. [Google Scholar] [CrossRef]
  39. Cho, K.; Son, H.; Choi, S.B.; Kang, S. Lateral acceleration compensation of a vehicle based on roll angle estimation. In Proceedings of the 2010 IEEE International Conference on Control Applications, Yokohama, Japan, 8–10 September 2010; IEEE: Piscataway, NJ, USA, 2010. [Google Scholar] [CrossRef]
  40. Ding, E.; Massel, T. Estimation of vehicle roll angle. IFAC Proc. Vol. 2005, 38, 122–127. [Google Scholar] [CrossRef]
Figure 1. Measurement setup to determine the center of gravity.
Vehicles 06 00042 g001
Figure 2. Steering angle and velocity, comparison of desired yaw rate and measured yaw rate for cornering stiffness estimation.
Vehicles 06 00042 g002
Figure 3. Free-body diagram of the bicycle reference model.
Vehicles 06 00042 g003
Figure 4. CAN communication layout of the solar car.
Vehicles 06 00042 g004
Figure 5. Baseline vehicle displaying (a) longitudinal velocity, (b) steering angle, (c) side-slip, (d) measured yaw rate versus desired yaw rate, (e) corrective yaw moment M z , (f) assistive torque.
Vehicles 06 00042 g005
Figure 6. Velocity >5m/s displaying (a) longitudinal velocity, (b) steering angle, (c) side-slip, (d) measured yaw rate versus desired yaw rate, (e) corrective yaw moment M z , (f) assistive torque.
Vehicles 06 00042 g006
Figure 7. Vehicle with passenger displaying (a) longitudinal velocity, (b) steering angle, (c) side-slip, (d) measured yaw rate versus desired yaw rate, (e) corrective yaw moment M z , (f) assistive torque.
Vehicles 06 00042 g007
Figure 8. Comparison between baseline vehicle and simulation. Displaying (a) Longitudinal velocity, (b) steering angle, (c) Side-slip angle, and (d) yaw rate.
Vehicles 06 00042 g008
Table 1. ATN Solar car axial load at the wheels.
LocationFrontRear
RightLeftRightLeft
Weight (N)109810011177961
Disclaimer/Publisher’s Note: The statements, opinions and data contained in all publications are solely those of the individual author(s) and contributor(s) and not of MDPI and/or the editor(s). MDPI and/or the editor(s) disclaim responsibility for any injury to people or property resulting from any ideas, methods, instructions or products referred to in the content.