Abstract
Cow’s milk is an important part of the human diet, primarily due to its high nutritional content, particularly proteins and fats. The processing of milk enhances its safety while modifying its composition and structure, influencing bioactive peptide release, which impacts protein quality, digestion, and allergenicity. Recently, filtered milk, which undergoes pasteurisation and microfiltration, has become available in UK supermarkets, offering a longer shelf life than pasteurised milk. This study aimed to evaluate the effects of microfiltration on the protein structure of cow’s milk, compared with pasteurisation, including analysis of the peptide profile released after in vitro gastrointestinal digestion of commercially available semi-skimmed filtered and pasteurised cow’s milk. Dynamic light scattering analysis revealed that the Z-average particle size of filtered milk was significantly (p < 0.05) larger than that of pasteurised milk across all brands. Additionally, filtered milk exhibited a significantly (p < 0.05) lower free thiol concentration compared with pasteurised milk, indicating structural modifications in proteins. Confocal laser scanning microscopy (CLSM) further highlighted heterogeneities in the distribution of fat and protein, with filtered milk samples showing increased interaction between fat globules and proteins. After gastrointestinal digestion, the numbers of peptides released from filtered milk exceeded those of peptides released from pasteurised milk by an average of 5%. These results provide new insights into the potential impact of microfiltration on the microstructure of milk. Further investigations using advanced analytical techniques are needed to assess the implications of these changes on protein bioavailability and human health.
1. Introduction
Milk proteins are an important component of the human diet, for both nutritional and functional purposes. The structure of milk proteins can be modified by processing conditions, leading to altered interactions between proteins and other nutrients in the milk; consequently, this affects the properties and functionality of the milk proteins [1,2,3,4]. The composition of processed milk, particularly as a milk matrix, and the impact of its properties on physiological and physicochemical functions are major areas of research [5,6,7,8]. Furthermore, milk processing can influence the release of peptides during milk digestion, thus impacting their bioavailability and physiological effects. The changes in the physicochemical properties of the protein alter the digestibility of milk and may consequently alter the formation of bioactive peptides [4,9]. Milk microfiltration is an emerging process that offers similar or better nutritional value, microbial removal, and shelf stability compared with thermal-only processes [10]. Commercial microfiltered milk usually undergoes two different treatments, i.e., pasteurisation and microfiltration, to ensure it is safe to be consumed [10,11,12]. The combination of pasteurisation and microfiltration extends the shelf-life of pasteurised milk by removing somatic cells and microorganisms and stopping the activity of native proteinase enzymes [13,14]. The process begins by separating raw milk into skimmed milk and cream. The skimmed milk then passes through a microfiltration membrane, while the cream undergoes ultra-high temperature (UHT) treatment. After microfiltration, the filtered skimmed milk is homogenised with the cream and subsequently pasteurised to ensure that it is ready for consumption [10].
Previous research indicates that shear force during microfiltration can destabilise the native structure of proteins [15]; thus, it is necessary to examine the impact of this force on the milk matrix during commercial processing. The thiol and disulphide groups are important active groups that undergo several reactions and interactions during milk processing, impacting the biochemical and biological properties of the milk [16]. The highest quantity of thiol groups is present in whey proteins; however, during milk processing, the disulphide groups present in the casein fraction are involved in thiol–disulfide exchange reactions with the milk fat globule membrane proteins [6,16,17]. One of the key activities of thiol groups is their role in modifying allergenicity [18,19,20]. Allergic reactions occur when an allergen, typically a protein or peptide, is recognised by the immune system as harmful, leading to its binding with immunoglobulin E (IgE) antibodies. This interaction often involves thiol groups, which can participate in disulphide bond formation or thiol–disulphide exchange reactions, potentially altering the conformation and stability of proteins. Changes in protein structure, such as unfolding or aggregation, can either expose or mask (or bury) these thiol groups, directly influencing the allergenic potential of the protein [18,19,20,21,22,23]. In addition to protein interactions, the activity of fat globules during milk processing is crucial for influencing the structure, stability, and digestibility of milk [6,24]. Pasteurisation causes the denaturation of both milk proteins and milk fat globule membrane (MFGM) proteins [1,25]. In contrast, microfiltration can lead to the migration or retention of small fat globules within skimmed milk, thereby altering its overall composition [26,27]. The details of these processes reveal how processing methods significantly influence protein and fat interactions within the milk matrix, contributing to changes in the structure, bioavailability, and functionality of milk.
Most studies on filtered milk have focused on its shelf-life and microbiological load, indicating that filtered milk has a longer shelf-life and low microbiological load in comparison with pasteurised milk [28,29,30]. The current study is novel as it focuses on the role of microfiltration on the chemical composition of milk, particularly the potential structural changes in proteins and the peptide profile released after in vitro digestion. We hypothesised that microfiltration of milk may impact its protein structure and alter protein digestibility and the released peptide profile. Therefore, this study aimed to evaluate the effect of microfiltration on protein structure, as understanding these structural changes is crucial for assessing the properties of proteins, such as bioavailability and functionality.
2. Materials and Methods
2.1. Materials
All chemicals were of analytical grade. Nile Red, 9-diethylamino-5H-benzo[α]phenoxazine-5-one, was purchased from MedChemExpress (Milwaukee, WI, USA) and used to stain fat globules (1 mg/mL in acetone). Fast Green was purchased from Sigma-Aldrich, (Gillingham, UK) and used to stain protein (0.1 mg/mL in water). Ellman’s reagent DTNB (5,5-dithio-bis-2-nitrobenzoic acid) and 98% L-cysteine were purchased from Thermo Scientific, (Loughborough, UK). HPLC water, LC-MS grade water, formic acid, and acetonitrile ≥ 99.9% were sourced from Fisher Scientific, (Loughborough, UK). Pepsin from porcine gastric mucosa (no. P7000; 800 to 2500 U/mg of protein), porcine bile extract (no. B8631); and porcine pancreatin (no. P1750; 4 × USP) were purchased from Sigma-Aldrich (Gillingham, UK).
2.2. Samples
Seven semi-skimmed filtered cow milk samples from different brands (Asda, Co-op, Dairy Manor, Cow Belle, Tesco, Sainsbury’s, and Waitrose) (n = 14) were bought from local supermarkets in Reading (UK). Seven pasteurised semi-skimmed cow milk samples, with two replicates per brand (n = 14), were also purchased as controls. All milk samples were homogenised.
Table 1 shows the samples’ information according to their labelling. Two different batches of each milk sample were used to conduct the analyses. All milk samples were delivered to the laboratory under cool conditions (~4 °C) within 60 min of purchase.

Table 1.
Commercially available filtered (F) and pasteurised (P) milk used in this study, including macronutrient content as indicated on the label.
2.3. Proximate Analysis by Lactoscope
Semi-skimmed milk samples were analysed for total protein, fat, solids contents, and lactose, using a lactoscope (Delta Instruments Type C4-2.3, Sofia, Bulgaria). The device was calibrated for semi-skimmed milk analysis, and samples (200 mL) were heated in a water bath until they reached a temperature of 40 °C before being analysed using the lactoscope. Measurements were performed in triplicate.
Due to the well-established fact that homogenisation reduces the size of the fat globules and causes milk proteins to become associated with milk fat [8,31,32], this step aimed to determine whether there was any adsorption between the fat globule membrane protein and the milk proteins in these commercially processed milk samples. Therefore, all the milk samples were skimmed via centrifugation at 2500× g for 30 min at 4 °C (SIGMA, Laborzentrifugen, 3K10, Newtown Shropshire, UK). This step was performed to identify any specific differences in the adsorption or intermolecular interactions between fat and proteins in filtered and pasteurised milk samples.
2.4. Particle Size Measurement by Dynamic Light Scattering
Particle size analysis was measured using a Malvern Instrument (Zetasizer software Version 7.13 Orsay, France), as described by Mootse, et al. [33]. Milk samples were diluted with distilled water (1:200 (s/w)),filtered using a 0.45 µm pore size disposable polyvinylidene fluoride (PVDF) syringe filter (Millex MCE, Merrek, Germany), and kept overnight at 4 °C before analysis. Water was considered the solvent with a refractive index of 1.330 at 25 °C. For each sample, triplicate measurements were performed and 10 readings from individual samples were collected.
2.5. Free Thiol Group Content by Ellman’s Reagent
The reactive thiol groups in the diluted samples (1:100, milk: distilled water) were determined using Ellman’s reagent [34,35]. A solution of thiol content was expressed as cysteine; for this purpose, a standard curve was constructed with a standard cysteine solution at pH 8.2 (0.25 to 1.5 mM, r = 0.99). For the analysis, 50 µL of Ellman’s Reagent solution (4 mg DTNB/1 mL sodium phosphate, 0.1 M, pH 8.0), 2.5 mL of sodium phosphate (0.1 M), and 250 µL of each standard or sample were mixed in a test tube and incubated at room temperature for 15 min. Absorbance measurements at 412 nm were performed on a Perkin Elmer device (Lambada XLS and XLS+, 8382 V3.0.1, Norwalk, CA, USA). Sodium phosphate buffer was used as a reagent blank. Each determination was made in triplicate.
2.6. Milk Microstructure Evaluation by Confocal Laser Microscopy
The microstructural composition of the semi-skimmed filtered and pasteurised milk samples was studied using CLSM analysis (Nikon A1R, Melville, NY, USA) with a 60× oil immersion objective lens, as previously described by Gallier et al. [36,37]. Samples of semi-skimmed milk were diluted with distilled water (1:50); then; 200 µL of the diluted milk was stained with Fast Green (5 µL) and Nile Red (10 µL). Fat globules stained with Nile Red were excited at 488 nm, and milk proteins stained with Fast Green were excited at 633 nm. Stained samples (20 µL) were transferred to cavity slides (75 × 26 mm) (Eisco Microscope, BI0086B, obtained from Rapid Electronics, Colchester, Essex, UK), covered with a glass coverslip (0.17 mm thick), and secured with nail polish (Rimmel London, UK). All images were acquired at room temperature. Three brands were randomly selected—Asda (A), Co-op (Co), and Tesco (T)—to study the protein structures of filtered and pasteurised milk. The images were processed using Nikon NIS-Elements Imaging Software version 5.42.02 (Czech Republic). Three images per sample were analysed.
2.7. In Vitro Digestion of Milk
The in vitro gastric and intestinal digestion model used in this study was previously described by Gallier, et al. [37]. A 20 mL milk sample was mixed with 10 mL of simulated gastric fluid (SGF) containing 2 g of NaCl/L and 7 mL of HCl/L at pH 1.2. The mixture was acidified with 6 M HCl to pH 1.5 and was incubated in a shaking water bath (Grant OLS 200, Grant Instruments, Cambridge, UK) at 37 °C for 10 min. Pepsin (3.2 mg/mL of SGF) was then added, and the temperature of 37 °C and shaking at 95 rpm were maintained for 2 h.
For the intestinal stage, intestinal fluid (SIF) was prepared with 6.8 g of K2HPO4/L and 190 mL 0.2 M NaOH/L and maintained at pH 7.5. The milk–SGF mixture was mixed with SIF (1:1) to a total volume of 30 mL, the pH was adjusted to 7, and bile extract (5 mg/mL) and pancreatin (1.6 mg/mL) were added. The mixture was incubated at 37 °C in a shaking water bath (Grant OLS 200, Grant Instruments, Cambridge, UK) (95 rpm) for 3 h. To inactivate the enzymes, samples were immediately placed in a water bath (Grant JB 300W, Cambridge, UK) at 95 °C for 5 min [38]. All digestions were performed in triplicate and enzyme-reagent control, matched to digestion conditions, was conducted with each set of digested samples.
For quantification of the percentage of protein in the samples before and after in vitro digestion, a Lowry assay was conducted [39]. Dilutions of known concentrations of bovine serum albumin (BSA) were prepared in series and assayed alongside the unknowns to determine the concentration within the working range (0.10–2 mg). To determine the protein content after in vitro digestion, a trichloroacetic acid (TCA) precipitation step was performed to remove undigested proteins and large aggregates. TCA (50%) was added to the digested sample solution in a 1:1 ratio, followed by incubation at room temperature for 20 min. The mixture was then centrifuged at 5000× g for 20 min at room temperature, and the protein content in the clear supernatant was quantified via Lowry assay. In vitro digestibility was expressed as the percentage of protein digestion, calculated as the proportion of solubilised protein relative to the total protein content before digestion, as described previously [40,41]. A blank was included in the analysis, and its absorbance was subtracted from the absorbance values of the samples. The percentage of protein digestion before and after in vitro digestion was calculated via the following Equation (1):
where protein b is the protein concentration before in vitro digestion, and protein a is the protein concentration after in vitro digestion.
2.8. Peptide Profile Analysis
The LC-MS peptide analysis was performed on a Q-TOF device (Agilent, MassHunter workstation, 1290 Infinity Advance Bio, 6545XT, Wokingham, Berkshire, UK). The digested milk solutions were diluted (1:100) with HPLC water and then filtered using a 0.45 µm (PVDF) syringe filter, and 5 µL was injected into the system. A reverse-phase analytical column (C18—300, 150 mm × 2.1 mm internal diameter) (ACE 221-1502 HPLC Columns, Aberdeen, Scotland, UK) with 120 Angstrom pore size and 2.7 µm particle size was used for peptide separation, and the flow rate was kept at 0.200 mL/min. The LC gradient started with 90% mobile phase A (water/0.1% Formic acid), 10% B (Acetonitrile/0.1% Formic acid) at 0 and 2 min, increased to 30% B for 5 min, with a 51 min linear gradient to 40% B, followed by 50% B for 5 min. Mobile phase B was increased from 10% to 90% over 25 min, followed by a column wash at 90% B for 15 min. Full-scan mass spectra were acquired at a rate of 3 spectra/sec in sensitivity mode from 100 to 3000 m/z. MS/MS scan spectra were acquired at a rate of 2 spectra/sec over the same mass range, using data-dependent acquisition (DDA acquisition). The raw data from Q-TOF measurements were processed using MassHunter software (BioConfirm 2.7). The following parameters were selected to create the project: nonspecific (enzyme), reduced disulphides, and variable modifications (oxidation of M, Phosphorylation of S, T, Y). A database containing the following sequences was used: α-S1-casein (P02662), α-S2-casein (P02663), β-casein (P02666), ϰ-casein (P02668), β-lactoglobulin (P02754), and α-lactalbumin (P00711). Data were searched with MS and MS/MS mass tolerances set at 10 and 50 ppm, respectively.
2.9. Identification of Bioactive Peptides
Peptide sequences obtained from the Q-TOF LC/MS analysis of in vitro digested milk samples were screened for bioactive peptide identification. The peptide sequences were searched using the Milk Bioactive Peptide Database MBPDB [42]. This database contains all potentially bioactive peptide sequences; recently, it has been used by many researchers. The search outcomes were further refined by comparing them with the literature.
2.10. Statistical Analysis
Results were expressed as the mean of triplicate determinations ± standard deviation. XLSTAT (version 2022.2.1) was used for all statistical analyses. The significance of the differences between filtered and pasteurised milk samples for each brand was assessed using an independent samples t-test, with a p-value of less than 0.05 considered statistically significant. One-way ANOVA was employed to evaluate the overall effect of milk processing methods (filtered vs. pasteurised) across all brands.
3. Results and Discussion
3.1. Proximate Analysis
Within each brand, no significant (p > 0.05) differences were found between the protein quantity of the filtered milk and that of the counterpart pasteurised samples (Table 2). However, the overall analysis of the filtered milk samples revealed a significantly (p < 0.05) lower protein content (3.42 ± 0.11 g/100 mL) than in the pasteurised samples (3.61 ± 0.15 g/100 mL). This decrease in protein content due to microfiltration was attributed to the removal of some of the aggregated protein through membrane fouling in the retentate phase [10,15,30,43].
Table 2.
Proximate analysis (protein, lactose, and solids) and pH of filtered and pasteurised milk. Means of three replicates ± standard deviation.
The lactose and total solids contents are reported in Table 2. Lactose is the major carbohydrate in milk, ranging between 4–5%; it is a disaccharide sugar consisting of glucose and galactose [44]. The lactose content of the filtered and pasteurised milk samples ranged from 4.84 to 4.98%, with no significant differences (p > 0.05) between groups. The total solids content for all filtered milk samples was 10.52 ± 0.07 g/100 mL, which was significantly (p < 0.05) lower than in the pasteurised milk samples (10.73 ± 0.05 g/100 mL). This reduction was due to the fouling of protein during the microfiltration [15], as reflected in the protein content values listed in Table 2.
Overall, there were no significant differences (p > 0.05) in fat content between filtered and pasteurised milk. This was observed for each of the milk brands (Table 3). Since some food processing methods such as pasteurisation, ultra-high temperature treatment, and homogenisation alter protein structures and enhance protein–fat interaction, they consequently impact the physicochemical and biological properties of proteins [8,9,45,46]. We hypothesise that shear force during microfiltration [15] could affect protein structure and protein–fat interaction. To infer the interaction between the fat globule membrane and the proteins in the commercially processed milk samples, as a first step, all these milk samples underwent centrifugation to remove fat (cream). This allowed us to evaluate differences in the fat retention rate and assess potential protein–fat interactions by examining the amount of fat retained and the texture of the separated cream before conducting further experiments.
Table 3.
Total fat content in filtered (F) and pasteurised (P) (semi-skimmed) milk samples before and after centrifugation, and percentage of fat retained.
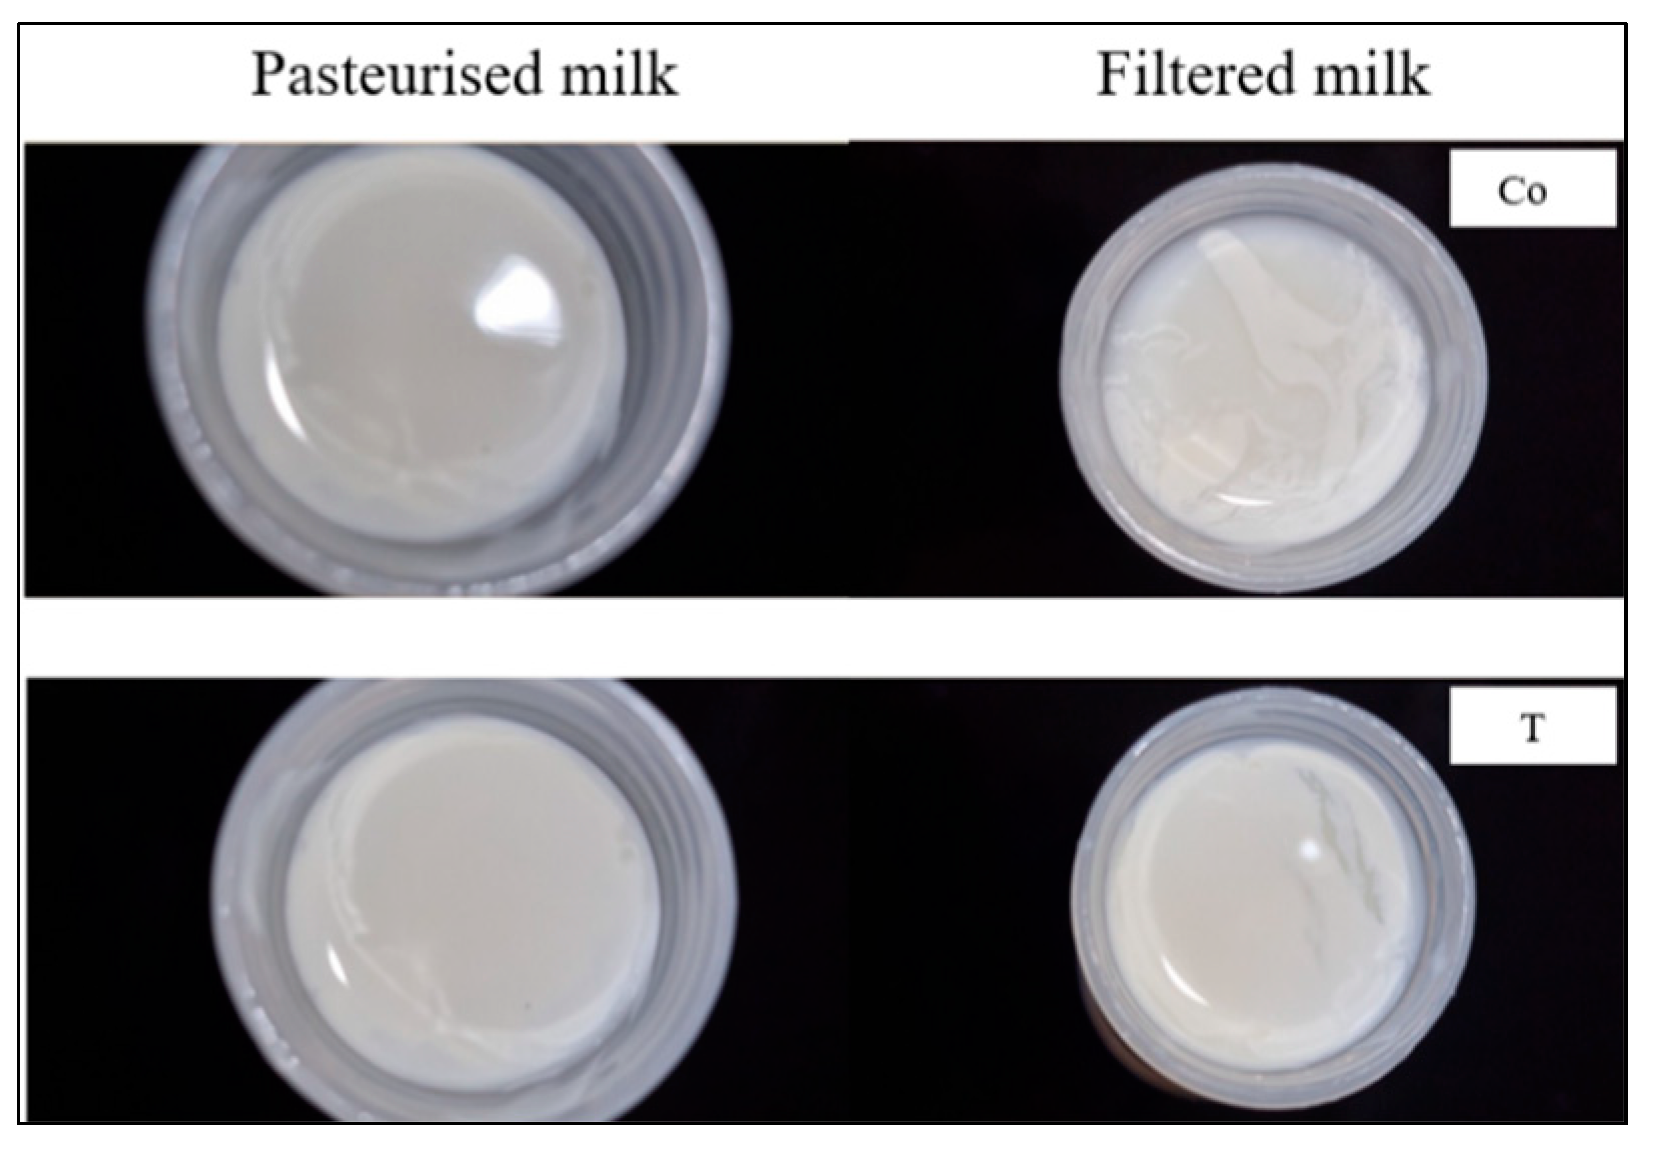
Homogenisation and pasteurisation significantly alter the structure and composition of milk proteins and fat globules [45,47]. During homogenisation, the size of fat droplets is reduced, and the interfacial membrane surrounding the fat globules is modified [48]. Furthermore, pasteurisation further alters the milk proteins, impacting their conformation and interactions with fat, thereby enhancing protein–fat interactions. The combination of these processes affects the structural composition of milk, making it difficult to remove all the fat after these processes. Additionally, these changes can influence the digestion of milk fat, as droplets coated with proteins (as a result of homogenisation and pasteurisation) exhibit different digestive characteristics compared with those surrounded by native fat globule membranes [9,49]. Although complete skimming of these commercially homogenised milk samples was not expected, all filtered milk samples showed different results compared with the pasteurised milk samples (Table 3). The calculations to determine the level of fat retention were clarified to accurately represent the proportion of fat remaining after centrifugation. Interestingly, the combined analysis revealed that the filtered milk retained a higher fat content post-centrifugation compared with the pasteurised milk (p < 0.05), while the proportion of fat removed from the pasteurised milk was higher (p < 0.05). Additionally, the fat (cream) separated from the filtered milk samples exhibited a softer and more fragile texture than the fat from the pasteurised milk (Figure 1). This led to the assumption that microfiltration could have had an additional effect on the protein–fat interactions, and thus, that this interaction may have affected the fat’s texture and impacted the protein properties. While these observations suggest a potential impact on protein–fat interactions, we did not directly measure the protein content of the skimmed cream. Future studies measuring the protein composition of the separated fat phase would be valuable to confirm the extent of the protein–fat interactions.
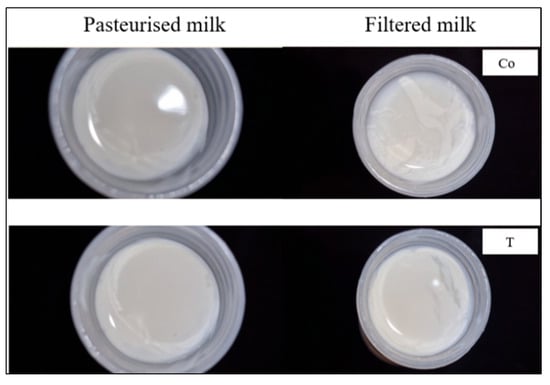
Figure 1.
Cream separated from filtered and pasteurised milk. The tested samples are Co = Co-op and T = Tesco.
3.2. Particle Size Analysis
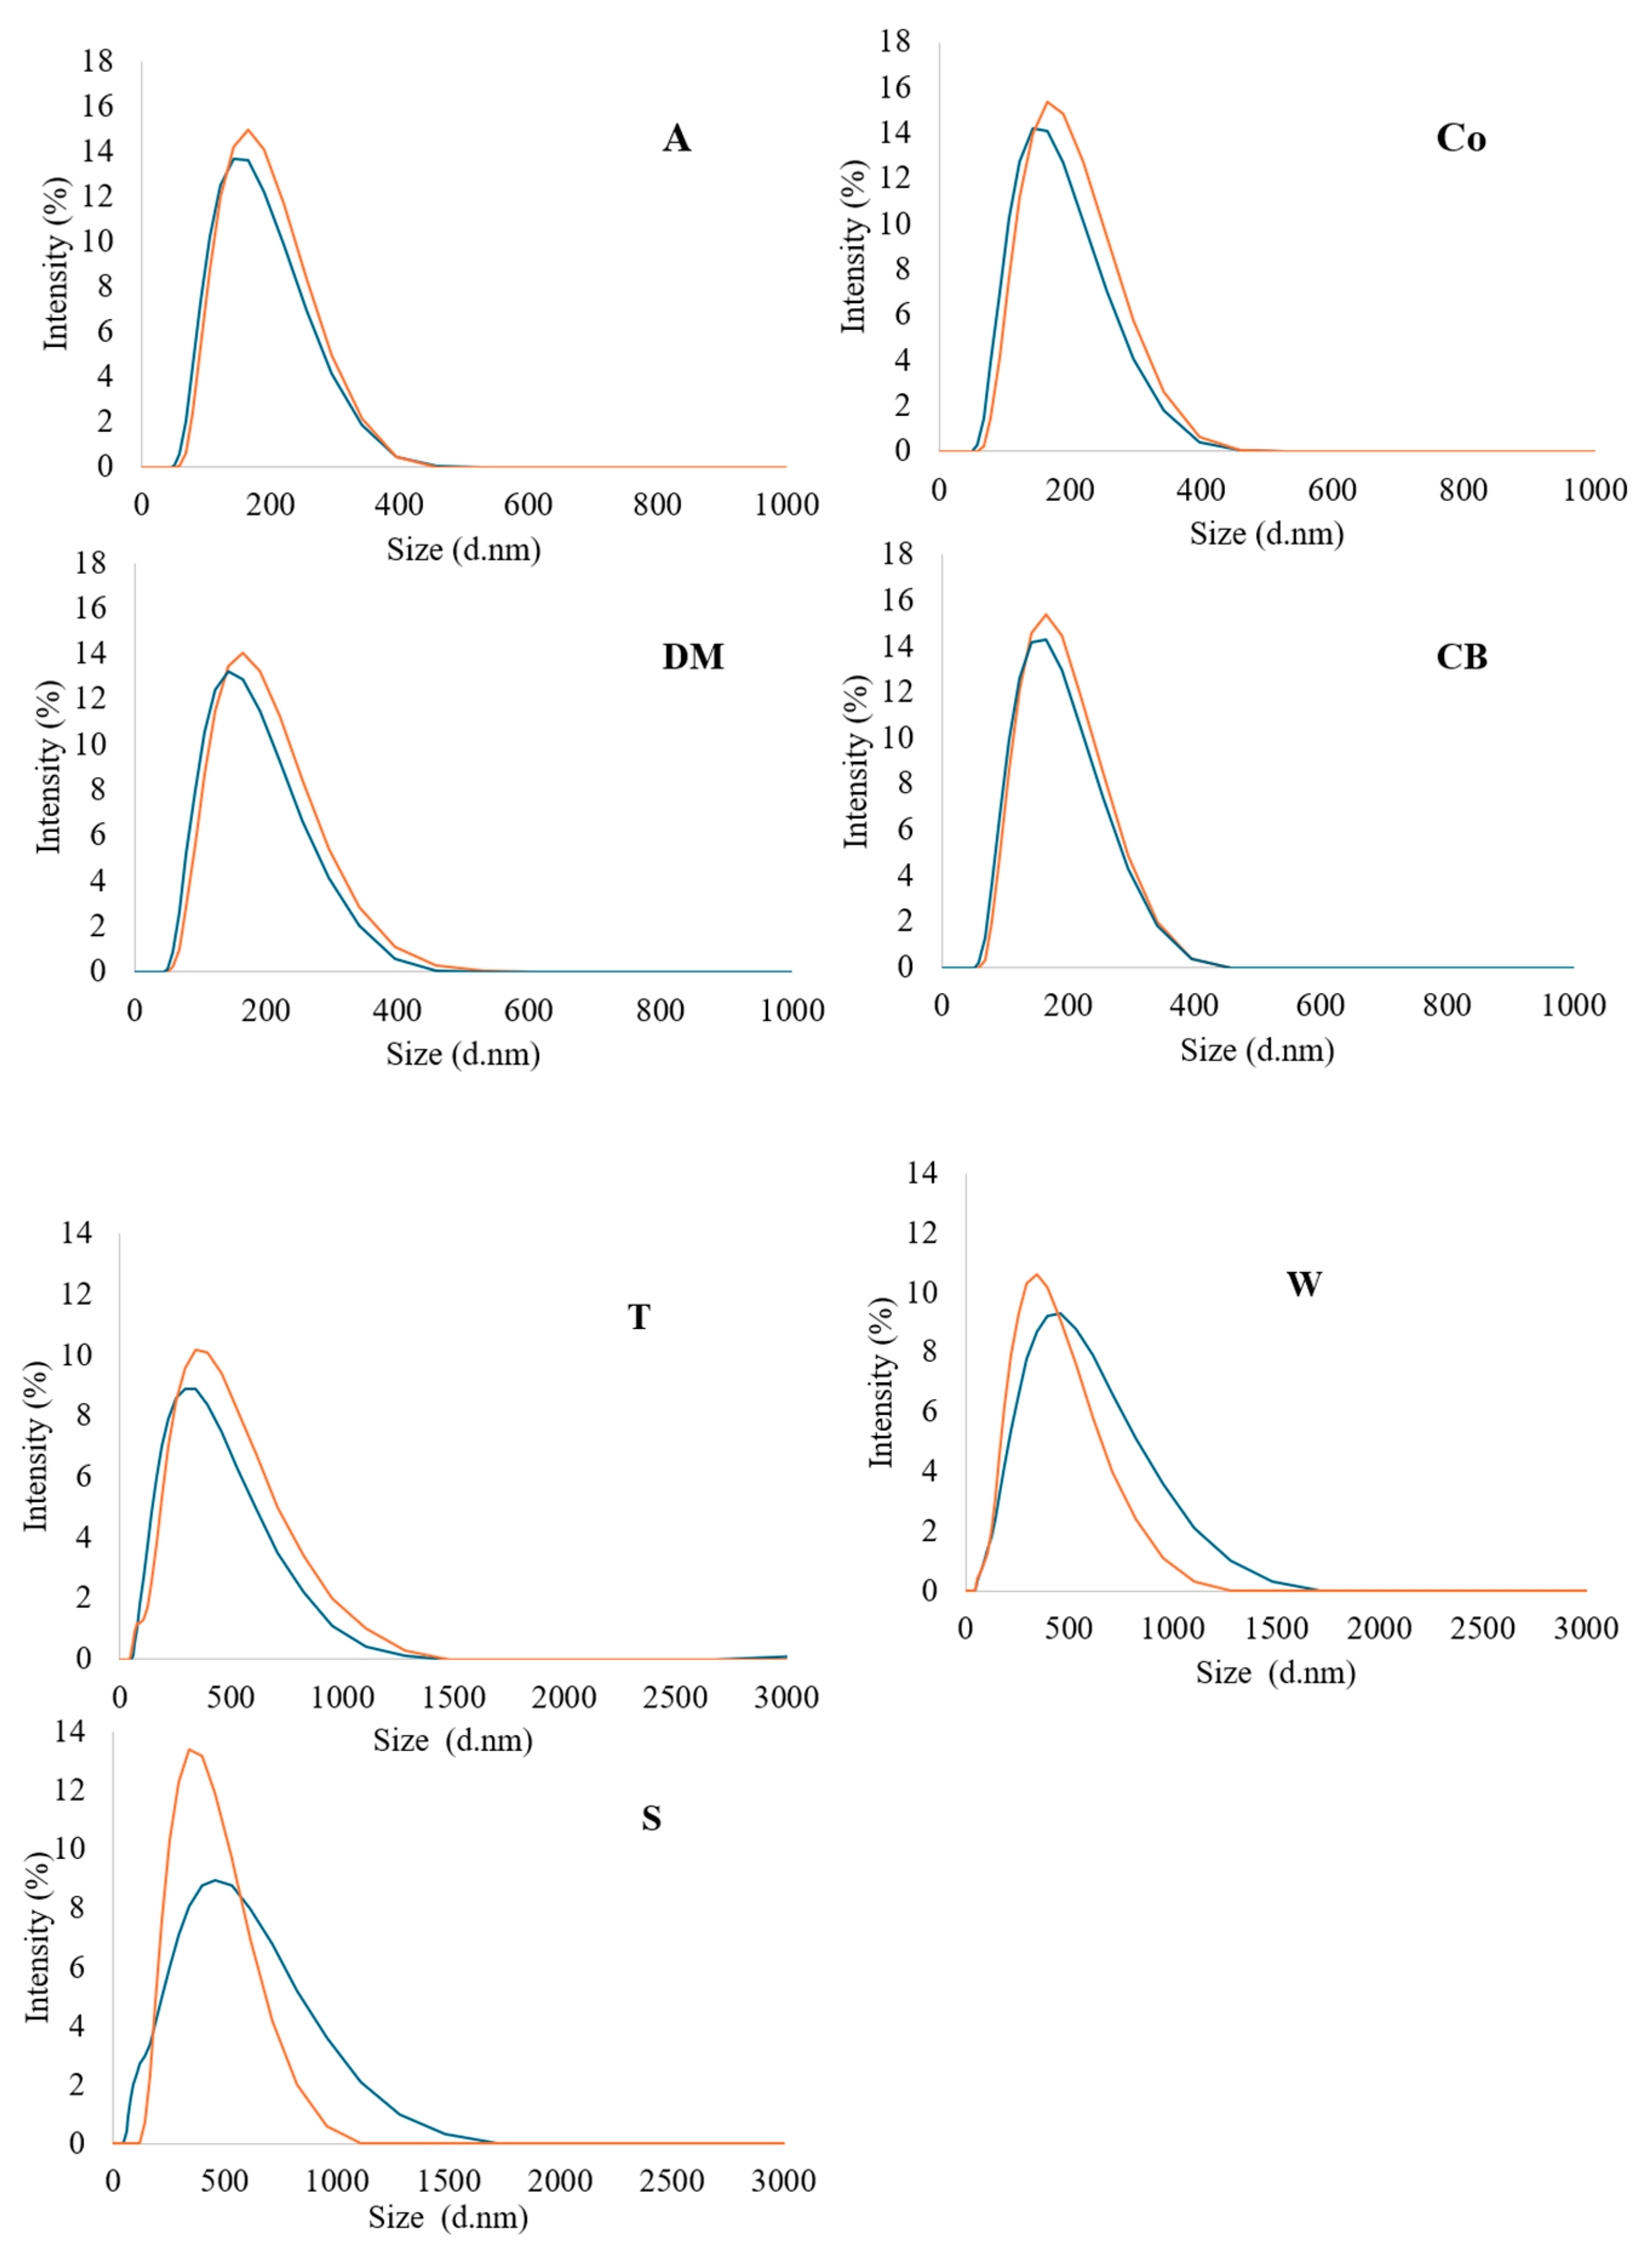
The particle size of milk influences its microstructure and defines many properties of dairy products, such as colloidal stability, texture, etc. [50]. The average diameters (Z-average) and particle size distribution of casein micelles and fat in semi-skimmed homogenised filtered and pasteurised milk were investigated via dynamic light scattering, focusing on particles with sizes smaller than 0.45 μm. The Z-average of particles in filtered and pasteurised milk samples ranged between 186 to 198 and 159 to 185 nm, respectively (Table 4). Overall, the filtered milk samples showed significantly (p < 0.05) larger particle size diameters compared with the pasteurised samples. A single peak in size distribution was observed in all samples. The differences in particle size distribution between the filtered and pasteurised milk samples were examined, as shown in Figure 2. All samples exhibited a single peak, with the majority of particle sizes distributed between 100 to 400 nm. Overall, the size distribution in all the samples was similar, although the size intensity and the particle concentration of the filtered milk were slightly greater than in the pasteurised milk. This may indicate a slight increase in the numbers of the most common particle sizes, due to the shear force during microfiltration, which enhanced the intermolecular interactions in the milk matrix and contributed to the subsequent differences in aggregation and adsorption rates between the milk components [15,43]. Identification of particle types was not attempted in this study. However, casein micelles typically have diameters ranging between 30 and 300 nm [51,52], leading to the assumption that the larger particles were likely to have been small fat globules or aggregated particles. Thus, larger particles were slightly more abundant in all the filtered milk samples compared with the pasteurised milk, regardless of the source.
Table 4.
Mean values of Z-average, primary particle size (size) and free thiol content in filtered (F) and pasteurised (P) milk.
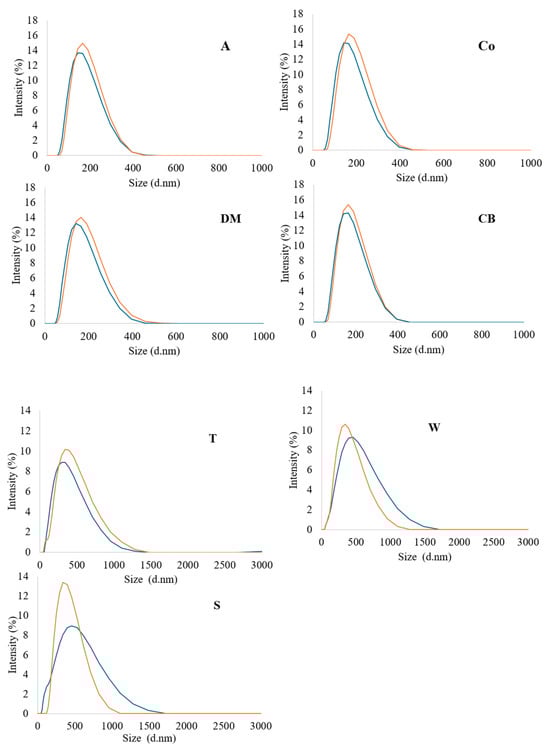
Figure 2.
Distribution of particle sizes in DLS micrographs of all milk samples; filtered milk = orange line, pasteurised = blue line. Milk samples: A = Asda, Co = Co-op, DM = Dairy Manor, CB = Cow Belle, T = Tesco, S = Sainsbury’s, and W = Waitrose.
3.3. Free Thiol Groups
Exposed free thiol groups are chemical groups that can play a role in protein structure and stability [53,54,55]; their concentration in the milk samples is shown in Table 4. There were significant differences (p < 0.05) in the content of the free thiol group between pasteurised and filtered cow’s milk (Table 4). Filtered milk consistently exhibited a lower concentration of free thiols compared with the pasteurised milk, across all brands. The lower content of free thiol groups in the filtered samples was attributed to protein–fat interaction during the milk filtering process. Microfiltration, which separates the milk from the cream, can unfold the protein structures in skimmed milk, due to the action of shear force [15,56]. This unfolding can expose more thiol groups on the proteins [18,57]. When cream is heated, the protein on the surface of the fat globules is denatured and the structure unfolds, which exposes the thiol group. These unfolded proteins (on fat globule surfaces and proteins) with exposed thiols can potentially interact, leading to formation of disulphide bonds and resulting in a decrease in the availability of free thiol groups [18,57]. Additionally, other factors during microfiltration, such as protein adsorption onto the filtration membrane, may also have contributed to the lower content of free thiols in the filtered milk. In support of this idea, Ye, et al. [17] established that milk proteins can interact with milk fat membrane proteins even at temperatures lower than the protein denaturation temperature. This suggests that protein–fat interactions could occur during processing steps such as microfiltration during the production of filtered milk. This aligns with the findings described in Figure 1, where the remaining fat in the filtered milk after centrifugation was higher than in the pasteurised milk samples. These results indicate the probability of intermolecular interaction (thiol–disulphide exchange reactions and intra- and interprotein thiol–disulphide interchange reactions) between proteins and fat; thus, the decrease in free thiol groups in filtered milk correlates with the increase in the Z-average and the decrease in fat separation. Previous studies have shown that homogenisation and pasteurisation enhance the interaction of casein, whey, and fat [6,17,32]; so, we can assume that filtration can also enhance this interaction. Correlation analysis between the particle size and the free thiol group content revealed significant insight into the impact of microfiltration on milk particle characteristics, compared with pasteurisation. Strong and moderate negative correlations were observed between the Z-average (r = −0.76, p < 0.05) and the free thiol group content and between the particle size distribution (r = −0.63, p < 0.05) and the free thiol group content, respectively. These correlations reflect the interplay between microfiltration and particle properties. While microfiltration increases the particle size, it decreases the content of free thiol groups, potentially due to the shear force enhancing the intermolecular interactions. Previous research has shown that milk processing, such as heat treatment and homogenisation, can induce interactions between milk proteins (whey, casein, and fat globule membrane proteins), mediated by thiol–disulphide exchange reactions. In this study, all samples (commercially filtered and pasteurised milk) had undergone pasteurisation and homogenisation; however, the filtered milk samples had additionally been subjected to microfiltration to extend their shelf-life. The results showed that the filtered milk had a lower content of free thiols and a larger particle diameter than the pasteurised milk. The lower content of free thiols in filtered milk suggests that these groups might be involved in protein–fat linkages via thiol–disulphide exchange reactions. Additionally, the larger particle size in the filtered milk may have been another consequence of this interaction. Furthermore, as Figure 1 demonstrates, the percentage of fat separated from the filtered milk after centrifugation was less than the fat separated from the pasteurised samples. Mechanical processes cause migration of the membrane fat globule proteins from the surface of the membrane to the aqueous face, resulting in interaction between these proteins, as mentioned by Anderson and Brooker [26]. This observation supports the hypothesis that, during microfiltration, more proteins interact with fat globule membrane proteins via thiol–disulphide bonds and cause an increase in the particle diameter size. This interaction links the fat with protein in the aqueous phase and prevents their subsequent separation. Protein–fat interaction occurs in some milk-processing techniques [58], and this effect may also occur during microfiltration. Further research is needed to fully elucidate the specific mechanisms behind the protein–fat interactions observed during microfiltration.
3.4. Milk Microstructure
CLSM is widely used to visualise changes in protein and fat as a result of food processing or digestion [36,37]. The distribution of protein aggregates and fat globules in the filtered and pasteurised milk samples was observed via CLSM. Fast Green fluorescent dye was used to label the protein, and a Nile Red fluorescent probe was used to label the fat. The distribution of protein aggregates and fat globules in the milk samples is shown in Figure 3. The images visualise the interaction between the proteins and fat globules in the filtered and pasteurised semi-skimmed milk samples. These samples underwent heating and homogenisation, leading to protein denaturation and aggregation [8]. Filtered milk samples (Figure 3), which underwent heating, homogenisation, and microfiltration, showed more interaction between protein (stained green) and fat (stained red), resulting in more yellow-orange colouration compared with the pasteurised milk samples, according to the interaction areas stained with Fast Green and Nile Red. The CLSM images revealed that more protein aggregates and more interactions between protein and fat were present in the filtered milk compared with the pasteurised samples. This observation agrees with the size measurements and free thiol results, where filtered milk samples showed larger particle size and fewer free thiol groups compared with the pasteurised milk samples, leading to the conclusion that protein and fat interacted via exchange reactions and intra- and interprotein thiol–disulphide interchange reactions. Microfiltration may be a promising process leading to structural changes in proteins and resulting in properties that cannot be achieved through pasteurisation. Such structural changes or thiol-related reactions can influence protein structure, potentially affecting nutrient bioavailability, digestibility, and allergenicity [18,23,59,60], while also impacting functional properties [1,50].
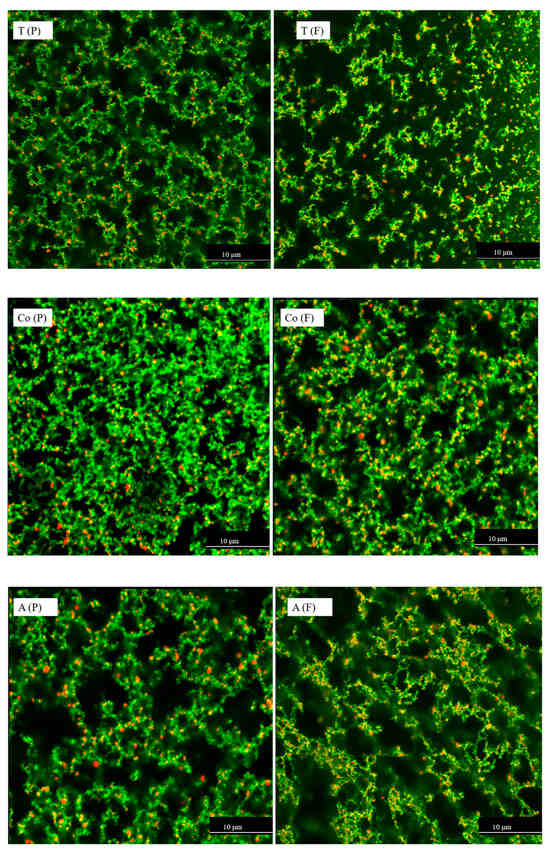
Figure 3.
CLSM micrographs of pasteurised (P) and filtered (F) milk from three different brands (T, Co, and A), with Nile Red-stained fat globules appearing red and Fast Green-stained proteins appearing green. The dark areas correspond to the serum. Images were captured with a 60 × oil objective lens. The first image has a 2× magnified area to highlight detail. Samples were diluted 50 times with distilled water. The scale bars are 10 µm in length.
3.5. Percentage of Protein Digestion
Determining digestion of protein and its derived products is essential for understanding its biological effects and nutritional and health implications [9,61,62]. Investigating the relation between the protein–peptide profiles as a result of the digestion process could provide valuable insights into protein structure functionality, allergenicity, and bioactivity [63,64,65]. The percentage of protein in the filtered and the pasteurised milk digested (% Dig) at the gastric stage was relatively low, with values ranging between 15 to 39% and 21 to 43.9% for filtered and pasteurised milk, respectively (Table 5). These results align with the findings of Huang, et al. [65], who reported that some intact proteins remained undigested after the gastric digestion of fresh milk. Overall, the % Dig value after in vitro gastric digestion of the filtered and pasteurised samples was 29 ± 7.4%. However, brand-to-brand variability in % Dig suggested that factors beyond the basic composition of the milk, such as differences in protein structure or the food matrix [6,7], as well as differences in processing conditions [3], might influence digestion. Moreover, the % Dig values of the proteins in both the filtered and pasteurised samples after 2 h of gastric digestion and 3 h of intestinal digestion (Table 5) were within the range reported by Van Hekken, et al. [66] (80–95%). No significant differences (p > 0.05) were observed between filtered and pasteurised samples within the same brands. After the intestinal stage, a higher degree of protein hydrolysis (% Dig) was observed within the tested samples compared with the gastric phase.
Table 5.
Percentage of protein digested in filtered (F) and pasteurised (P) milk samples after the in vitro gastric and intestinal stages.
3.6. Peptides After the In Vitro Intestinal Stage
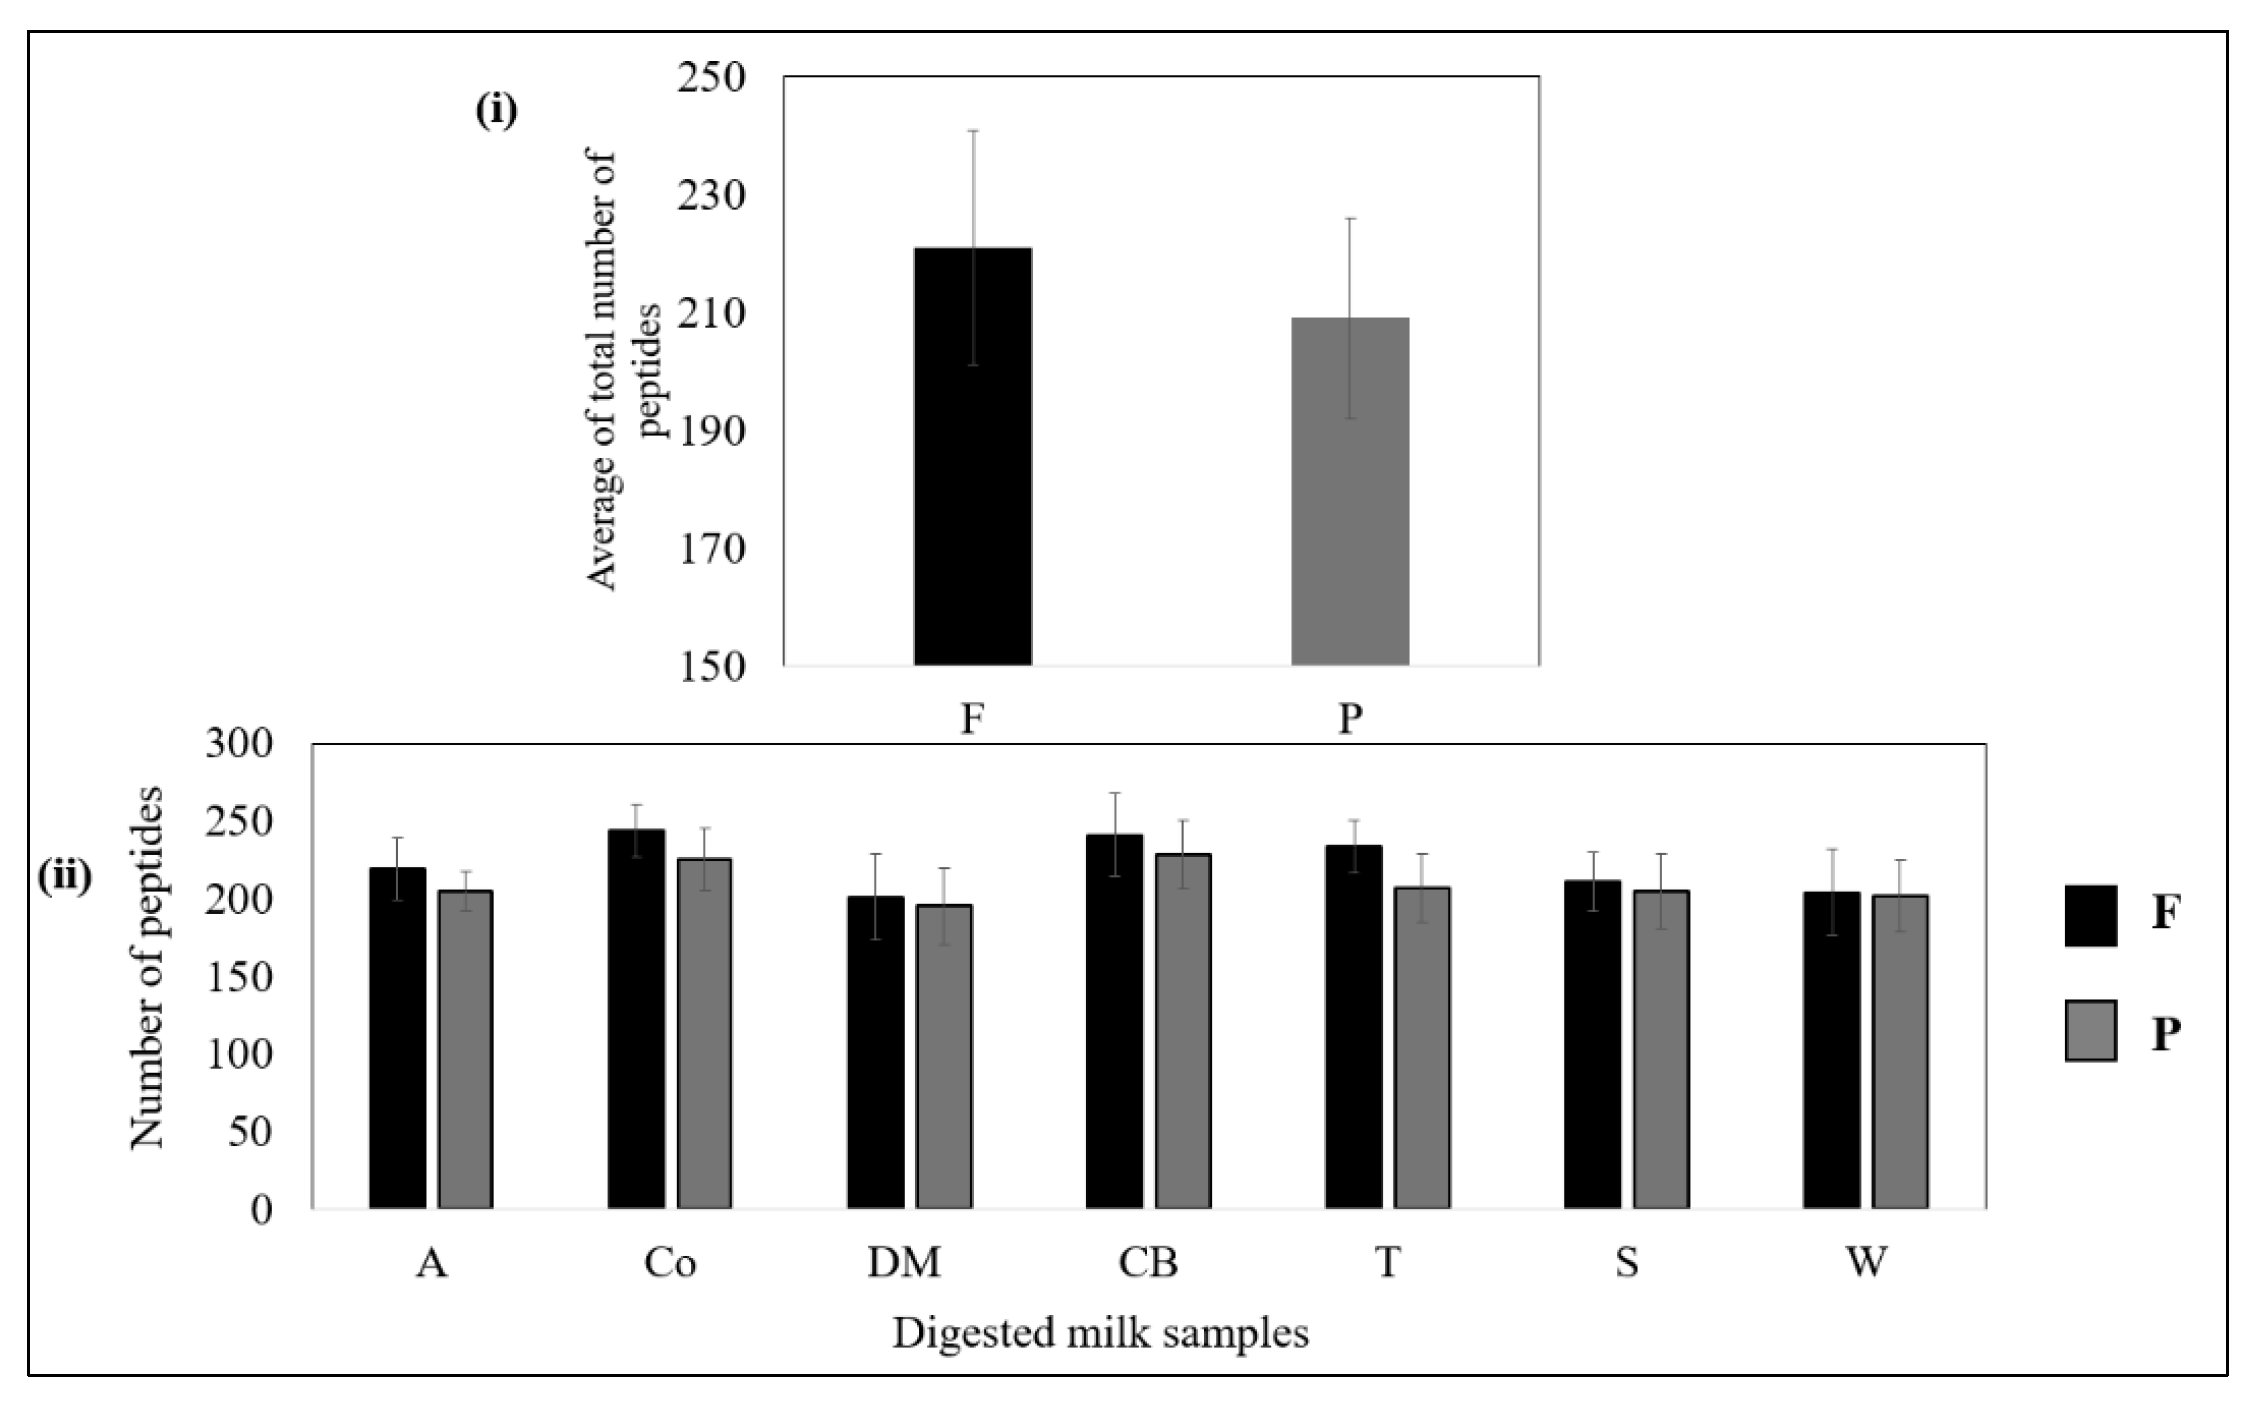
Figure 4i shows that, overall, the filtered samples released slightly more peptides than the pasteurised samples. As shown in Figure 4ii, no significant (p > 0.05) differences were observed between the numbers of peptides released from the filtered and pasteurised samples of each brand, although the filtered samples generally tended to release more peptides than the pasteurised samples (p > 0.05).

Figure 4.
(i) Average numbers of peptides released from all filtered and pasteurised milk samples after the intestinal stage. (ii) Total numbers of peptides released from filtered and pasteurised milk of each brand. No significant difference (p > 0.05) between F and P samples of the same brand.
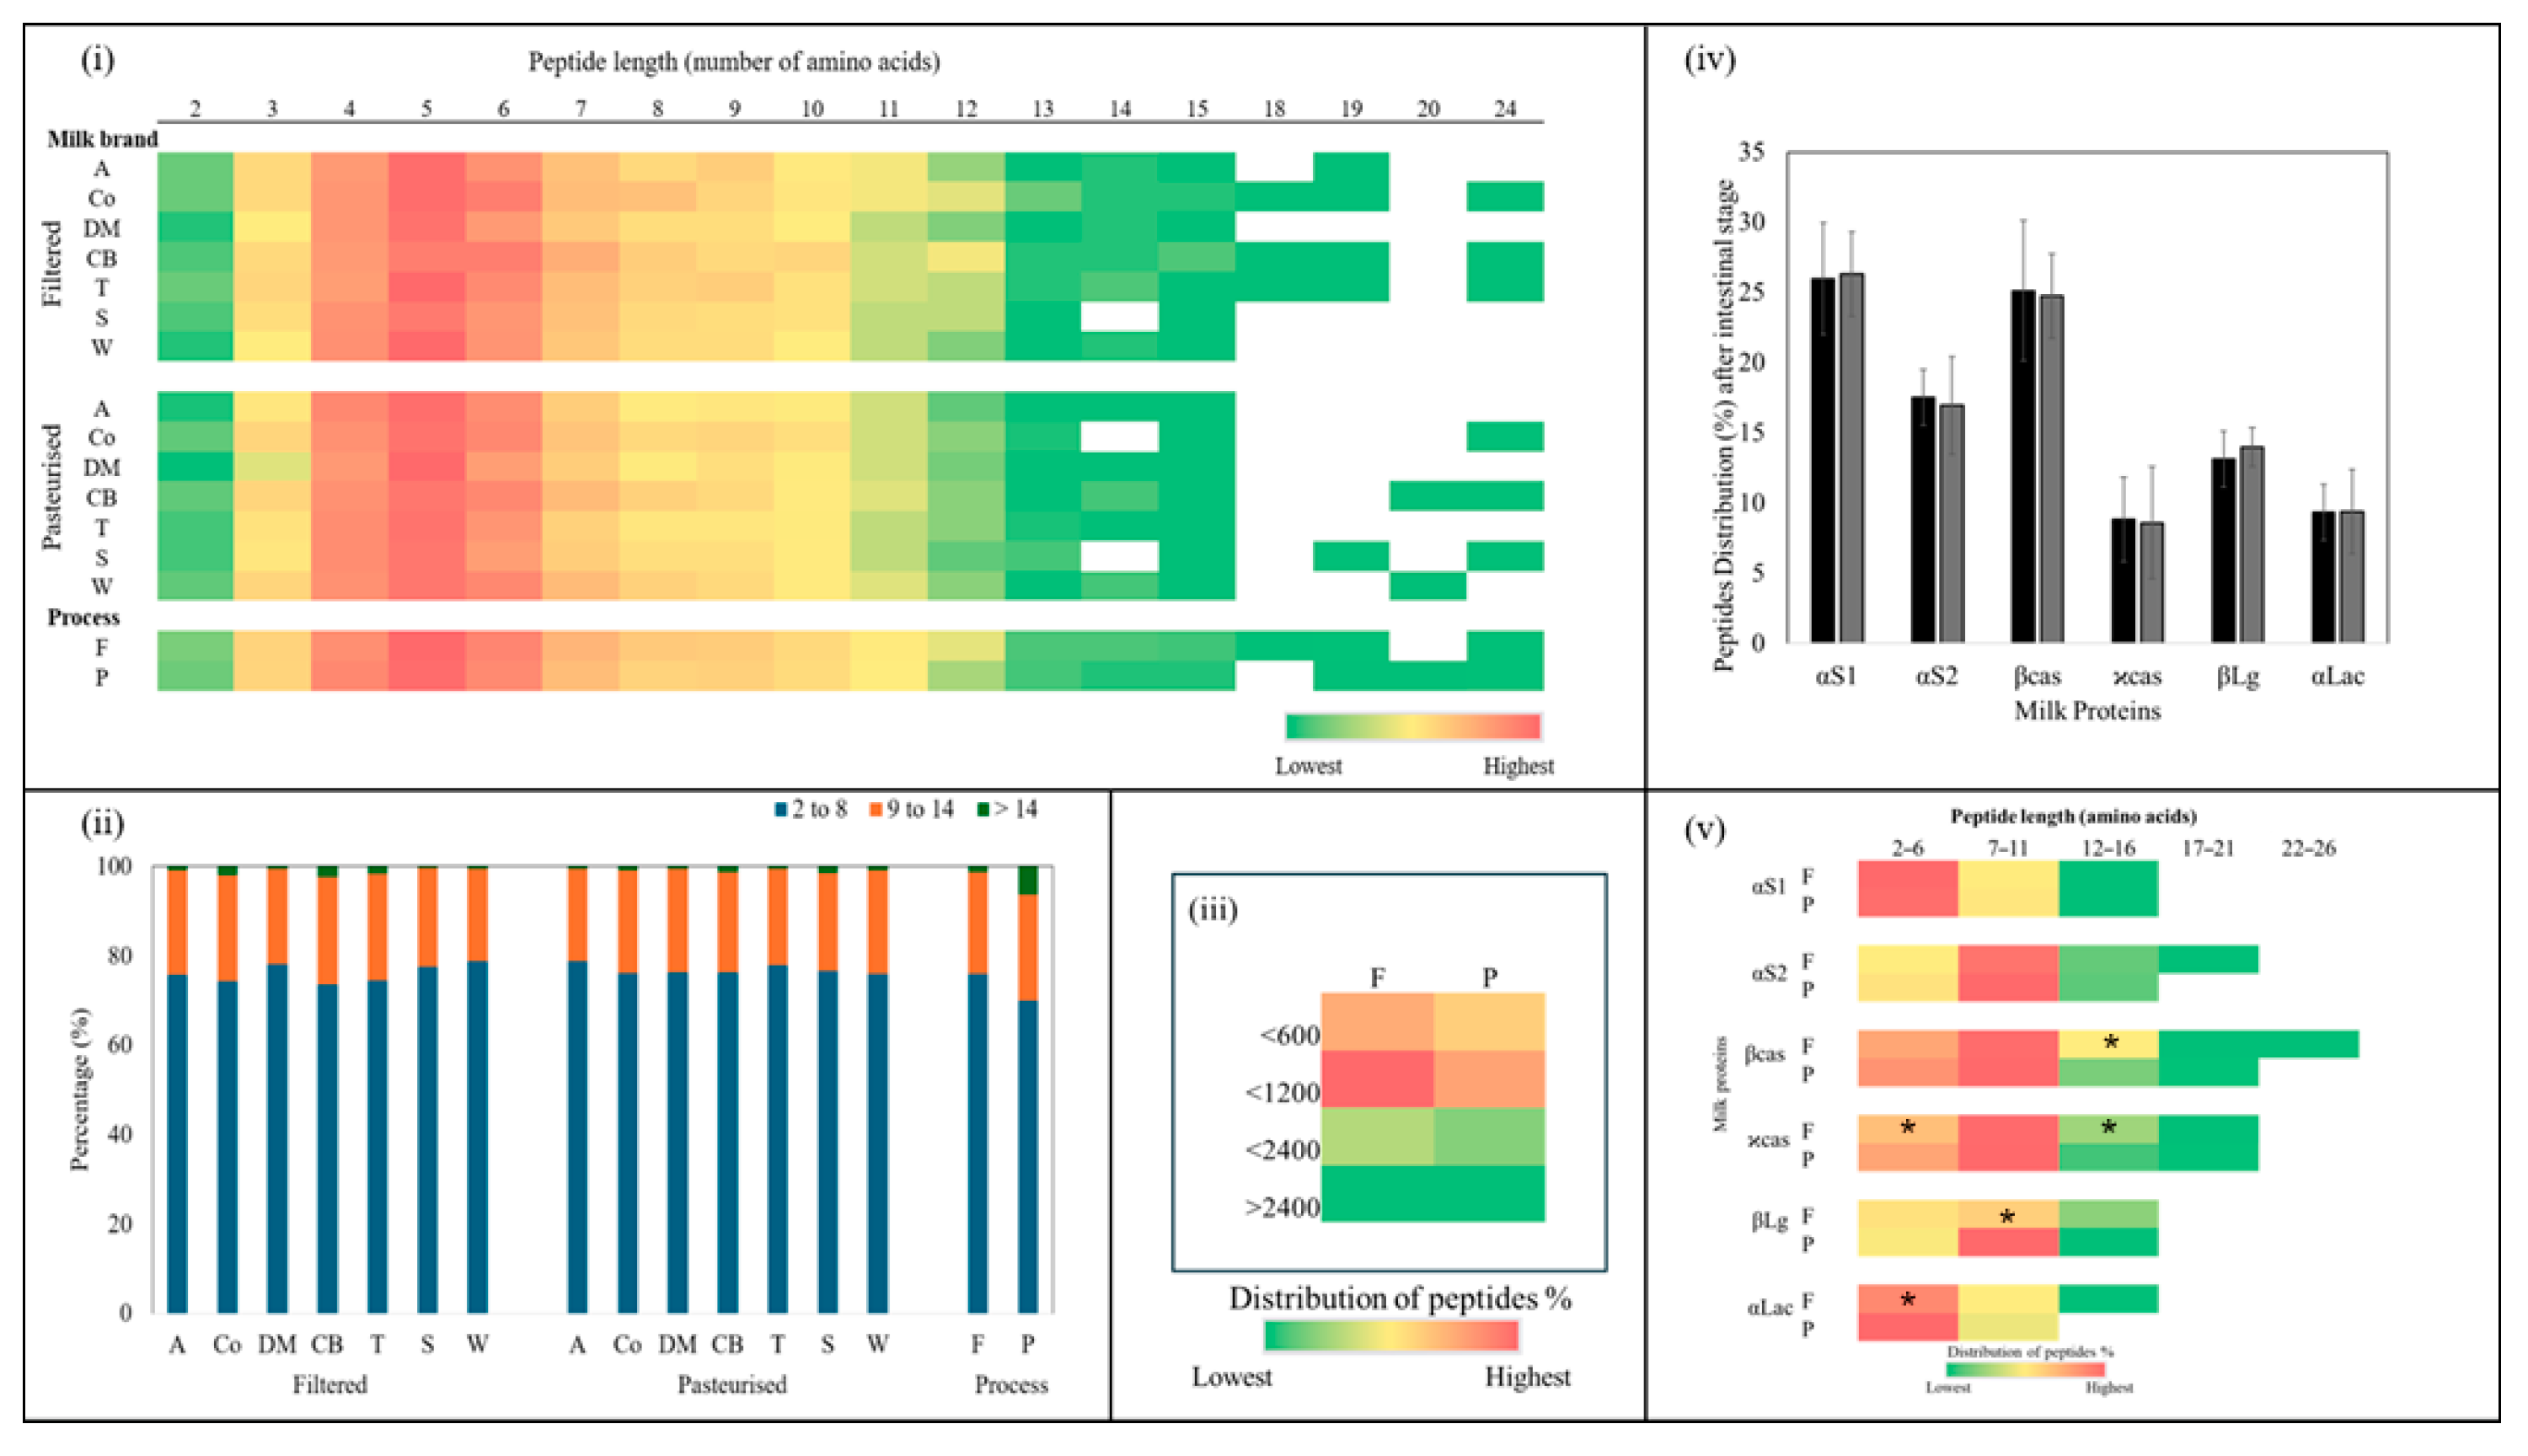
The length distribution of peptides that were released after in vitro intestinal digestion is reported in Figure 5. The lengths of the peptides identified ranged from 2 to 24 amino acids. The most abundant peptides contained 4 to 7 amino acids (Figure 5i). Digested filtered milk released larger peptides, containing 14, 18, or 19 amino acids, compared with digested pasteurised milk (p > 0.05). On average, peptides with lengths of 2–8 amino acids made up the majority, accounting for approximately 75 ± 6.1% of total peptides in the filtered milk and 76 ± 3.6% of total peptides in the pasteurized milk (p > 0.05) (Figure 5ii). Slightly more variability was observed in the filtered samples, with percentages ranging from 73 to 78% of total peptides, compared with a narrower range of 75 to 78% of total peptides in the pasteurised samples (Figure 5ii).
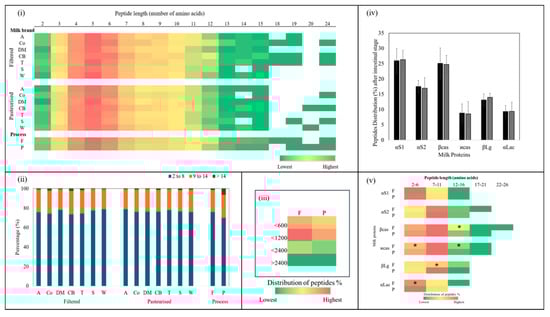
Figure 5.
(i) Heatmaps of peptide length distribution in each of the in vitro intestinal digested filtered (F) and pasteurised (P) milk brands (A, Co, DM, CB, T, S, and W). Colours ranging from green to red indicate low and high recurrence of specific peptides, respectively. Unidentified peptide sequences are shown as white stretches. (ii) Percentages of length distribution of peptides identified from the in vitro intestinal digestion of filtered and pasteurised milk and the overall process. (iii) Heatmap of peptide size distribution in all filtered and pasteurised samples. (iv) Distribution of peptides from the parent proteins αS1, αS2, β- and ϰ-casein, βLg, and αLac from each of the in vitro intestinal digested filtered and pasteurised milk samples. (v) Heatmap of peptide length distribution from the parent proteins αS1, αS2, β- and ϰ-casein, βLg, and αLac from each of the in vitro intestinal digested filtered (F) and pasteurised (P) milk samples. (*) indicates significant difference (p < 0.05) between F and P samples from the same brand.
Regarding peptides longer than 14 amino acids, for the filtered milk, the distribution range was 0.4 to 2% of the total peptides, while those in the pasteurised milk ranged from 0.4 to 1.4% of the total peptides (p > 0.05), representing only a small fraction of the peptide profile in both milk types (Figure 5ii). Meanwhile, the distribution of peptide length from 9 to 14 amino acids represented the second largest group, comprising about 22 ± 2.4% of the total peptides in both milk types (Figure 5ii). The variability in the filtered milk suggested some differences in proteolysis between brands during digestion, which may have been due to variations in microfiltration conditions that impacted structural changes.
A heatmap illustrating the sizes of the peptides released after in vitro intestinal digestion can be seen in Figure 5iii. Overall, in all the digested filtered and pasteurised milk samples, the peptides present in the highest proportion were those with a mass less than 1200 Da. (between 600 Da.–1200 Da.), followed by smaller peptides (less than 600 Da.). Noticeably higher values were obtained for the filtered milk (p > 0.05).
Overall, the peptides released after in vitro intestinal digestion of the filtered and pasteurised milk were most frequently derived from αS1, followed by βcas, αS2, and βLg, accounting for about 26 ± 5.3%, 25 ± 3.9%, 17 ± 3.5%, and 13 ± 2.8% of the total peptides, respectively (Figure 5iv). No significant differences were found between the peptides released after in vitro intestinal digestion of filtered and pasteurised milk from the same brand.
Figure 5v presents a heatmap showing the distribution of peptide lengths (as a percentage of total peptides) derived from different milk proteins after in vitro intestinal digestion of filtered and pasteurised milk. From the heatmap, it is evident that certain peptide lengths were more frequently generated from specific proteins. Small peptides (<7 amino acids) were abundantly released from αS1 and αLac, followed by β-casein and κ-casein, while shorter peptides (2–6 amino acids) associated with βLg were less common. Both αLac and κ-casein in the filtered samples released fewer small peptides compared with the pasteurised samples (p > 0.05). Medium peptides (7–11 amino acids) were released at a higher percentage from αS2, β-casein, and κ-casein in both the filtered and pasteurised samples. In addition, medium peptides were released from βLg in the pasteurised samples at a higher percentage than in the filtered samples (p > 0.05). In contrast, αS1 and αLac in both the filtered and pasteurised samples had the lowest percentages of medium peptides. The heatmap visualisation provides insights into how different proteins release peptides of varying lengths and highlights some differences between the filtered and pasteurised samples.
The pooled analysis of the peptides released from all the filtered and pasteurised milk samples identified about 579 and 510 peptides, respectively. The main parent proteins of the identified bioactive peptides were βcas, αS1, βLg, αLac, and αS2, in that order. Distribution of peptides among the filtered and pasteurised samples varied and some differences in peptide profiles were noticed. The peptide sequences released after in vitro intestinal digestion of the filtered and pasteurised milk samples were compared with reported epitopes reviewed by Xu, et al. [67] and Fan, et al. [68]. Approximately 7.3% and 6.0% of the total peptides released from the filtered and pasteurised milk were potential bioactive peptides, representing 12 different categories of possible bioactivity.
Many of these bioactive peptides have the capacity to bind IgE, acting as linear epitopes that correspond to established allergenic sequences (Table 6). While numerous peptides are known to trigger allergic symptoms, only a few of these peptides were detected in our study. This can be attributed to the analysis method used; most studies on allergenic peptides rely on trypsin [67,68,69], while, in contrast, our study employed pepsin and pancreatin. The peptide distribution results suggest that filtered milk may have a distinct peptide profile. Additional studies are necessary to understand how microfiltration influences the release of bioactive and allergenic peptides, particularly regarding their IgE-binding properties.
Table 6.
The most abundant bioactive peptides from all in vitro intestinal digested filtered (F) and pasteurised (P) milk samples. (√) = present; blank = not present 1.
4. Conclusions
In summary, this study demonstrated that the free thiol content in filtered milk was lower than in pasteurised milk, while the particle size in the filtered milk was larger. CLSM analysis showed differences in the distribution of protein and fat between the filtered and the pasteurised milk, suggesting the presence of additional protein–fat interactions in the filtered milk. These observations indicate that microfiltration may influence protein–fat interaction, potentially through thiol–disulphide interchange reactions. Given these structural differences, further research is needed to determine the impact of microfiltration on the bioavailability and functionality of protein in milk.
Author Contributions
Conceptualization, M.-J.O.-C. and M.E.C.; methodology, R.B., N.M., M.-J.O.-C. and M.E.C.; software, MassHunter, Nikon NIS-Elements Imaging Software version 5.42.02 (Czech Republic), and XLSTAT version 2022.1.2 (Addinsoft, New York, NY, USA); formal analysis, R.B.; investigation, R.B.; resources, M.-J.O.-C., M.E.C. and R.B.; data curation, R.B.; writing—original draft preparation, R.B.; writing—review and editing, M.-J.O.-C., M.E.C. and N.M.; supervision, M.-J.O.-C. and M.E.C. All authors have read and agreed to the published version of the manuscript.
Funding
This research was sponsored by the Ministry of Higher Education and Scientific Re-search—Libya under JACS Code: 100527 at the University of Reading, as part of a PhD sponsorship from the University of Tripoli. This research did not receive any specific grant from funding agencies in the public, commercial, or not-for-profit sectors. Declarations of interest: none.
Institutional Review Board Statement
Not applicable.
Informed Consent Statement
Not applicable.
Data Availability Statement
The datasets supporting the results of this study are not currently available for public access. However, the raw data supporting the conclusions of this article will be made available by the authors on request from the corresponding author.
Conflicts of Interest
The authors declare no conflicts of interest.
References
- Nunes, L.; Tavares, G.M. Thermal treatments and emerging technologies: Impacts on the structure and techno-functional properties of milk proteins. Trends Food Sci. Technol. 2019, 90, 88–99. [Google Scholar] [CrossRef]
- Krishna, T.C.; Najda, A.; Bains, A.; Tosif, M.M.; Papliński, R.; Kapłan, M.; Chawla, P. Influence of ultra-heat treatment on properties of milk proteins. Polymers 2021, 13, 3164. [Google Scholar] [CrossRef] [PubMed]
- Bhat, Z.F.; Morton, J.D.; Bekhit, A.E.-D.A.; Kumar, S.; Bhat, H.F. Processing technologies for improved digestibility of milk proteins. Trends Food Sci. Technol. 2021, 118, 1–16. [Google Scholar] [CrossRef]
- van Lieshout, G.A.; Lambers, T.T.; Bragt, M.C.; Hettinga, K.A. How processing may affect milk protein digestion and overall physiological outcomes: A systematic review. Crit. Rev. Food Sci. Nutr. 2020, 60, 2422–2445. [Google Scholar] [CrossRef]
- Lopez, C.; Briard-Bion, V.; Ménard, O.; Beaucher, E.; Rousseau, F.; Fauquant, J.; Leconte, N.; Robert, B. Fat globules selected from whole milk according to their size: Different compositions and structure of the biomembrane, revealing sphingomyelin-rich domains. Food Chem. 2011, 125, 355–368. [Google Scholar] [CrossRef]
- Ding, M.; Huang, Z.; Jin, Z.; Zhou, C.; Wu, J.; Zhao, D.; Shan, K.; Ke, W.; Zhang, M.; Nian, Y. The effect of fat content in food matrix on the structure, rheological properties and digestive properties of protein. Food Hydrocoll. 2022, 126, 107464. [Google Scholar] [CrossRef]
- Iqbal, S.; Zhang, P.; Wu, P.; Ge, A.; Kirk, T.V.; Chen, X.D. Impact of fat content on the modulation of viscosity, microstructure and enzymatic hydrolysis of UHT milk during simulated gastrointestinal digestion. Int. J. Dairy Technol. 2024, 77, 59–70. [Google Scholar] [CrossRef]
- Ye, A.; Cui, J.; Dalgleish, D.; Singh, H. Effect of homogenization and heat treatment on the behavior of protein and fat globules during gastric digestion of milk. J. Dairy Sci. 2017, 100, 36–47. [Google Scholar] [CrossRef]
- Kopf-Bolanz, K.A.; Schwander, F.; Gijs, M.; Vergères, G.; Portmann, R.; Egger, L. Impact of milk processing on the generation of peptides during digestion. Int. Dairy J. 2014, 35, 130–138. [Google Scholar] [CrossRef]
- Elwell, M.W.; Barbano, D.M. Use of microfiltration to improve fluid milk quality. J. Dairy Sci. 2006, 89, 20–30. [Google Scholar] [CrossRef]
- Cheryan, M. Membranes in food processing. In Effective Industrial Membrane Processes: Benefits and Opportunities; Springer: Berlin/Heidelberg, Germany, 1991; pp. 157–180. [Google Scholar]
- Maubois, J. Membrane microfiltration: A tool for a new approach in dairy technology. Aust. J. Dairy Technol. 2002, 57, 92. [Google Scholar]
- Dinkçi, N.; Sirbu, A. Quality assessment of extended shelf life (ESL) milk in comparison with other kinds of pasteurised milk commercially available on the market. Sci. Study Res.-Chem. Chem. Eng. Biotechnol. Food Ind. 2024, 25, 35–48. [Google Scholar]
- Wang, D.; Fritsch, J.; Moraru, C.I. Shelf life and quality of skim milk processed by cold microfiltration with a 1.4-μm pore size membrane, with or without heat treatment. J. Dairy Sci. 2019, 102, 8798–8806. [Google Scholar]
- Kelly, S.T.; Zydney, A.L. Protein fouling during microfiltration: Comparative behavior of different model proteins. Biotechnol. Bioeng. 1997, 55, 91–100. [Google Scholar] [PubMed]
- Owusu-Apenten, R. Colorimetric analysis of protein sulfhydyl groups in milk: Applications and processing effects. Crit. Rev. Food Sci. Nutr. 2005, 45, 1–23. [Google Scholar] [CrossRef] [PubMed]
- Ye, A.; Singh, H.; Taylor, M.W.; Anema, S. Interactions of whey proteins with milk fat globule membrane proteins during heat treatment of whole milk. Le Lait 2004, 84, 269–283. [Google Scholar]
- Bu, G.; Luo, Y.; Chen, F.; Liu, K.; Zhu, T. Milk processing as a tool to reduce cow’s milk allergenicity: A mini-review. Dairy Sci. Technol. 2013, 93, 211–223. [Google Scholar]
- Miciński, J.; Kowalski, I.M.; Zwierzchowski, G.; Szarek, J.; Pierożyński, B.; Zabłocka, E. Characteristics of cow’s milk proteins including allergenic properties and methods for its reduction. Pol. Ann. Med. 2013, 20, 69–76. [Google Scholar]
- Rahaman, T.; Vasiljevic, T.; Ramchandran, L. Conformational changes of β-lactoglobulin induced by shear, heat, and pH—Effects on antigenicity. J. Dairy Sci. 2015, 98, 4255–4265. [Google Scholar]
- Wilson, S.; Martinez-Villaluenga, C.; De Mejia, E. Purification, thermal stability, and antigenicity of the immunodominant soybean allergen P34 in soy cultivars, ingredients, and products. J. Food Sci. 2008, 73, T106–T114. [Google Scholar]
- Wu, X.; Lu, Y.; Xu, H.; Lin, D.; He, Z.; Wu, H.; Liu, L.; Wang, Z. Reducing the allergenic capacity of β-lactoglobulin by covalent conjugation with dietary polyphenols. Food Chem. 2018, 256, 427–434. [Google Scholar] [CrossRef] [PubMed]
- Zhou, E.; Li, Q.; Zhu, D.; Chen, G.; Wu, L. Characterization of physicochemical and immunogenic properties of allergenic proteins altered by food processing: A review. Food Sci. Hum. Wellness 2024, 13, 1135–1151. [Google Scholar]
- Aguilera, J.M. The food matrix: Implications in processing, nutrition and health. Crit. Rev. Food Sci. Nutr. 2019, 59, 3612–3629. [Google Scholar] [PubMed]
- Argov, N.; Lemay, D.G.; German, J.B. Milk fat globule structure and function: Nanoscience comes to milk production. Trends Food Sci. Technol. 2008, 19, 617–623. [Google Scholar]
- Anderson, M.; Brooker, B. Loss of material during the isolation of milk fat globule membrane. J. Dairy Sci. 1975, 58, 1442–1448. [Google Scholar]
- Jhanwar, A.; Ward, R. Particle size distribution and lipid composition of skim milk lipid material. Int. Dairy J. 2014, 36, 110–117. [Google Scholar]
- Bellassi, P.; Cappa, F.; Fontana, A.; Morelli, L. Phenotypic and genotypic investigation of two representative strains of Microbacterium species isolated from micro-filtered milk: Growth capacity and spoilage-potential assessment. Front. Microbiol. 2020, 11, 554178. [Google Scholar]
- García, L.F.; Rodríguez, F.R. Combination of microfiltration and heat treatment for ESL milk production: Impact on shelf life. J. Food Eng. 2014, 128, 1–9. [Google Scholar]
- Hoffmann, W.; Kiesner, C.; Clawin-Rädecker, I.; Martin, D.; Einhoff, K.; Lorenzen, P.C.; Teufel, P. Processing of extended shelf life milk using microfiltration. Int. J. Dairy Technol. 2006, 59, 229–235. [Google Scholar]
- Michalski, M.-C.; Cariou, R.; Michel, F.; Garnier, C. Native vs. damaged milk fat globules: Membrane properties affect the viscoelasticity of milk gels. J. Dairy Sci. 2002, 85, 2451–2461. [Google Scholar] [CrossRef]
- Berton, A.; Rouvellac, S.; Robert, B.; Rousseau, F.; Lopez, C.; Crenon, I. Effect of the size and interface composition of milk fat globules on their in vitro digestion by the human pancreatic lipase: Native versus homogenized milk fat globules. Food Hydrocoll. 2012, 29, 123–134. [Google Scholar]
- Mootse, H.; Pisponen, A.; Pajumägi, S.; Polikarpus, A.; Tatar, V.; Sats, A.; Poikalainen, V. Investigation of casein micelle particle size distribution in raw milk of Estonian Holstein dairy cows. Agron. Res. 2014, 12, 753–758. [Google Scholar]
- Guingamp, M.-F.; Humbert, G.; Linden, G. Determination of sulfhydryl groups in milk using Ellman’s procedure and clarifying reagent®. J. Dairy Sci. 1993, 76, 2152–2155. [Google Scholar]
- ThermoScientific. Ellman’s Reagen; ThermoScientific: Waltham, MA, USA, 2011. [Google Scholar]
- Gallier, S.; Gragson, D.; Jiménez-Flores, R.; David, E. Using confocal laser scanning microscopy to probe the milk fat globule membrane and associated proteins. J. Agric. Food Chem. 2010, 58, 4250–4257. [Google Scholar]
- Gallier, S.; Ye, A.; Singh, H. Structural changes of bovine milk fat globules during in vitro digestion. J. Dairy Sci. 2012, 95, 3579–3592. [Google Scholar] [CrossRef]
- Wen, S.; Zhou, G.; Song, S.; Xu, X.; Voglmeir, J.; Liu, L.; Zhao, F.; Li, M.; Li, L.; Yu, X. Discrimination of in vitro and in vivo digestion products of meat proteins from pork, beef, chicken, and fish. Proteomics 2015, 15, 3688–3698. [Google Scholar] [CrossRef]
- Waterborg, J.H. The Lowry method for protein quantitation. In The Protein Protocols Handbook; Springer: Berlin/Heidelberg, Germany, 2009; pp. 7–10. [Google Scholar]
- Martínez-Maqueda, D.; Hernández-Ledesma, B.; Amigo, L.; Miralles, B.; Gómez-Ruiz, J.Á. Extraction/fractionation techniques for proteins and peptides and protein digestion. In Proteomics in Foods: Principles and Applications; Springer: Berlin/Heidelberg, Germany, 2012; pp. 21–50. [Google Scholar]
- Sinha, R.; Radha, C.; Prakash, J.; Kaul, P. Whey protein hydrolysate: Functional properties, nutritional quality and utilization in beverage formulation. Food Chem. 2007, 101, 1484–1491. [Google Scholar]
- Nielsen, S.D.-H.; Liang, N.; Rathish, H.; Kim, B.J.; Lueangsakulthai, J.; Koh, J.; Qu, Y.; Schulz, H.-J.; Dallas, D.C. Bioactive milk peptides: An updated comprehensive overview and database. Crit. Rev. Food Sci. Nutr. 2024, 64, 11510–11529. [Google Scholar] [CrossRef]
- Lay, H.T.; Yeow, R.J.E.; Ma, Y.; Zydney, A.L.; Wang, R.; Chew, J.W. Internal membrane fouling by proteins during microfiltration. J. Membr. Sci. 2021, 637, 119589. [Google Scholar]
- Fox. The Major Constituents of Milk; Woodhead Publishing Limited: Sawston, UK, 2003. [Google Scholar]
- Han, T.; Wang, M.; Wang, Y.; Tang, L. Effects of high-pressure homogenization and ultrasonic treatment on the structure and characteristics of casein. LWT 2020, 130, 109560. [Google Scholar] [CrossRef]
- Loveday, S.M. Protein digestion and absorption: The influence of food processing. Nutr. Res. Rev. 2023, 36, 544–559. [Google Scholar] [CrossRef]
- Qi, P.X.; Ren, D.; Xiao, Y.; Tomasula, P.M. Effect of homogenization and pasteurization on the structure and stability of whey protein in milk. J. Dairy Sci. 2015, 98, 2884–2897. [Google Scholar] [PubMed]
- Zamora, A.; Ferragut, V.; Guamis, B.; Trujillo, A. Changes in the surface protein of the fat globules during ultra-high pressure homogenisation and conventional treatments of milk. Food Hydrocoll. 2012, 29, 135–143. [Google Scholar]
- Fox, F.; Uniacke-Lowe, T.; McSweeney, L.; O’Mahony, J. Heat-Induced Changes in Milk. In Dairy Chemistry and Biochemistry; Springer: Berlin/Heidelberg, Germany, 2015; pp. 345–375. [Google Scholar]
- Augustin, M.A.; Udabage, P. Influence of processing on functionality of milk and dairy proteins. Adv. Food Nutr. Res. 2007, 53, 1–38. [Google Scholar] [PubMed]
- Olson, D.; White, C.; Richter, R. Effect of pressure and fat content on particle sizes in microfluidized milk. J. Dairy Sci. 2004, 87, 3217–3223. [Google Scholar] [PubMed]
- Anema, S.G.; Lowe, E.K.; Stockmann, R. Particle size changes and casein solubilisation in high-pressure-treated skim milk. Food Hydrocoll. 2005, 19, 257–267. [Google Scholar] [CrossRef]
- Cosio, M.; Mannino, S.; Buratti, S. Electrochemical sensor detecting free sulfhydryl groups: Evaluation of milk heat treatment. J. Dairy Sci. 2000, 83, 1933–1938. [Google Scholar]
- Pofahl, T.; Vakaleris, D. Effects of heat on sulfhydryl and disulfide groups of milk proteins as measured by the spectrofluorometric method. J. Dairy Sci. 1968, 51, 1345–1348. [Google Scholar]
- Wijesinha-Bettoni, R.; Gao, C.; Jenkins, J.A.; Mackie, A.R.; Wilde, P.J.; Mills, E.C.; Smith, L.J. Heat treatment of bovine α-lactalbumin results in partially folded, disulfide bond shuffled states with enhanced surface activity. Biochemistry 2007, 46, 9774–9784. [Google Scholar]
- Verruck, S.; Sartor, S.; Marenda, F.B.; da Silva Barros, E.L.; Camelo-Silva, C.; Canella, M.M.; Prudencio, E.S. Influence of heat treatment and microfiltration on the milk proteins properties. Adv. Food Technol. Nutr. Sci. 2019, 5, 54–66. [Google Scholar]
- Hansen, S.F.; Nielsen, S.D.; Rasmusen, J.T.; Larsen, L.B.; Wiking, L. Disulfide bond formation is not crucial for the heat-induced interaction between β-lactoglobulin and milk fat globule membrane proteins. J. Dairy Sci. 2020, 103, 5874–5881. [Google Scholar] [PubMed]
- Alzagtat, A.A.; Alli, I. Protein-lipid interactions in food systems: A review. Int. J. Food Sci. Nutr. 2002, 53, 249–260. [Google Scholar] [CrossRef] [PubMed]
- Liu, Q.; Lin, S.; Sun, N. How does food matrix components affect food allergies, food allergens and the detection of food allergens? A systematic review. Trends Food Sci. Technol. 2022, 127, 280–290. [Google Scholar]
- Monaci, L.; Tregoat, V.; van Hengel, A.J.; Anklam, E. Milk allergens, their characteristics and their detection in food: A review. Eur. Food Res. Technol. 2006, 223, 149–179. [Google Scholar]
- Capuano, E.; Janssen, A.E. Food matrix and macronutrient digestion. Annu. Rev. Food Sci. Technol. 2021, 12, 193–212. [Google Scholar] [PubMed]
- Egger, L.; Ménard, O. Update on bioactive peptides after milk and cheese digestion. Curr. Opin. Food Sci. 2017, 14, 116–121. [Google Scholar]
- Cui, Q.; Zhang, Z.; Li, M.; Zhou, M.; Sun, X. Peptide profiles and allergy-reactivity of extensive hydrolysates of milk protein. Food Chem. 2023, 411, 135544. [Google Scholar]
- Graversen, K.B.; Larsen, J.M.; Pedersen, S.S.; Sørensen, L.V.; Christoffersen, H.F.; Jacobsen, L.N.; Halken, S.; Licht, T.R.; Bahl, M.I.; Bøgh, K.L. Partially hydrolysed whey has superior allergy preventive capacity compared to intact whey regardless of amoxicillin administration in brown Norway rats. Front. Immunol. 2021, 12, 705543. [Google Scholar] [CrossRef]
- Huang, M.; Tan, H.; Xiong, Z.; Hu, W.; Wu, Y.; Meng, X.; Chen, H.; Li, X. Allergenicity evaluation of peptides from milk and yogurt after gastrointestinal digestion based on epitopes. Food Funct. 2022, 13, 10769–10789. [Google Scholar]
- Van Hekken, D.; Tunick, M.; Ren, D.; Tomasula, P. Comparing the effect of homogenization and heat processing on the properties and in vitro digestion of milk from organic and conventional dairy herds. J. Dairy Sci. 2017, 100, 6042–6052. [Google Scholar]
- Xu, Y.; Zhang, F.; Mu, G.; Zhu, X. Effect of lactic acid bacteria fermentation on cow milk allergenicity and antigenicity: A review. Compr. Rev. Food Sci. Food Saf. 2024, 23, e13257. [Google Scholar] [PubMed]
- Fan, S.; Ma, J.; Liu, Z.; Ning, Y.; Cao, M.; Li, Q.; Zhang, Y. Determination of egg and milk allergen in food products by liquid chromatography-tandem mass spectrometry based on signature peptides and isotope-labeled internal standard. Food Sci. Hum. Wellness 2023, 12, 728–736. [Google Scholar]
- Villa, C.; Costa, J.; Oliveira, M.B.P.; Mafra, I. Bovine milk allergens: A comprehensive review. Compr. Rev. Food Sci. Food Saf. 2018, 17, 137–164. [Google Scholar] [PubMed]

Disclaimer/Publisher’s Note: The statements, opinions and data contained in all publications are solely those of the individual author(s) and contributor(s) and not of MDPI and/or the editor(s). MDPI and/or the editor(s) disclaim responsibility for any injury to people or property resulting from any ideas, methods, instructions or products referred to in the content. |
© 2025 by the authors. Licensee MDPI, Basel, Switzerland. This article is an open access article distributed under the terms and conditions of the Creative Commons Attribution (CC BY) license (https://creativecommons.org/licenses/by/4.0/).