Review

Honey Discrimination Using Fourier Transform-Infrared Spectroscopy

by
Andrei A. Bunaciu
1,* and
Hassan Y. Aboul-Enein
2
1
S.C. AAB_IR Research S.R.L., 077025 Bragadiru, Romania
2
Pharmaceutical and Medicinal Chemistry Department, Pharmaceutical and Drug Industries Research Division, National Research Center, Cairo 12622, Egypt
*
Author to whom correspondence should be addressed.
Chemistry 2022, 4(3), 848-854; https://doi.org/10.3390/chemistry4030060
Submission received: 17 July 2022 / Revised: 15 August 2022 / Accepted: 23 August 2022 / Published: 25 August 2022
(This article belongs to the Special Issue Chemistry Research in Romania)

Abstract

:
Infrared spectroscopy is a widely used method of analysis to monitor various characteristics in the honey products analysis, to highlight these changes and to detect fraudulent modifications. In this way honey products could not be avoided. This article reviews some of the most important applications of these spectroscopic procedures in order to discriminate different types of honey and other products published between 2015–2022.

1. Introduction

In this period of globalization, the markets have given consumers access to a large variety of foods, so everyone can taste food flavors and aromas of different nations.
Honey is defined as “the natural sweet substance, produced by honey bees from the nectar of plants or from secretions of living parts of plants or excretions of plant-sucking insects on the living parts of plants, which the bees collect, transform by combining with specific substances of their own, deposit, dehydrate, store and leave in honeycombs to ripen and mature ” [1,2].
It is estimated that the world honey market will reach 2.4 million tonnes by 2022, most of them being monofloral or having a specific geographical origin [3].
Honey is recognized for its high nutritional value (330 kcal/100 g), and its main feature is the rapid absorption of carbohydrates on consumption. It presents anti-bacterial and anti-inflammatory properties, being used in the treatment of different diseases, such as skin wounds and gastrointestinal problems [4,5,6]. Moreover, the consumption of honey is beneficial to the immune system and for cancer and metastasis prevention [6,7,8]. It has been demonstrated that the composition and properties are closely correlated with the botanical origin of nectars or secretions [9,10,11,12].
It was established that honey is a supersaturated sugar solution, with more than 95% saccharides, but there are also disaccharides and trisaccharides, as well as proteins, free aminoacids, vitamins and minerals, all of which influence its organoleptic and nutritional properties [9,13,14].
There is a great variety of monofloral and polyfloral honeys on the market, and each of them can be characterized by specific physical and chemical properties. When talking about the floral origin, the specialists refer to the physico-chemical and microscopic characteristics of the source, which must represent more than 45% of a single plant and can reach 90%, while a polyfloral honey presents a variable percentage of different plants [4,15,16,17]. It is necessary to mention that absolutely unifloral honeys do not exist because the bees never visit only one plant species.
Honey authenticity has two major aspects: (i) origin of the honey, which includes geographical and botanical origin, and (ii) the mode of honey production, which is related to the harvesting of honey hives and processing. For botanical origin determination, it is better to perform a melissopalynogical analysis [18], which is for the moment, the single recognized method of analysis, as well as sensory and some physico-chemical analysis, and finally, all the results must be used for a proper determination.
One of the simplest methods that can give us a lot of data correlated with the chemical composition of any sample is infrared spectroscopy. As it is known, any infrared spectrum offers a unique fingerprint, and so it is possible to discriminate a specific compound from all others.
The authenticity of honey has two different aspects, one related with its composition and the other with its geographical and botanical origin [19]. Some researchers utilize the characteristic peaks of volatile and semivolatile chemicals in order to determine its variation with floral origins and honey processes [11,20].
The aim of this review is to present some of the most important papers, published in the period 2017–2022, related to the use of the Fourier Transform Infrared Spectroscopy technique for honey product discrimination and botanical origin determination. There are several other reviews that provide information for the research community in order to develop a highly sensitive and accurate point-of-care honey analysis [21,22,23]. Taking into account that this issue is dedicated to Chemistry Research in Romania, the first part of this review will be related to papers published by Romanian researchers while the second will be related to other international researchers.

2. Applications of Fourier Transform Infrared Spectroscopy

The first study, which we must mention in this review, is the result of Romanian and French researchers’ collaboration [24]. In this research, two models were obtained in order to discriminate between different samples of honey using infrared spectra. The monofloral origins of acacia, colza, linden and sunflower were first confirmed by the melissopalyonogical method [18,19].
Figure 1 shows the averaged infrared spectra after excluding the ranges 1610–1700 cm−1 and 3000–4000 cm−1 (marked in gray) that correspond to the O-H vibrations [25].
In the present work, the best discrimination potential proved to have, in this order, the spectral ranges: 1580–1600; 1075–1195 and 1450–1458 cm−1, corresponding to C=O vibration, mainly of carbohydrates [26], C–O stretching vibration of phenolic compounds [27] as well as to C–C and C–O stretching vibrations of lipids from pollen [28]. It was concluded that the floral discrimination can be performed based on carbohydrate content, lipids from pollen, phenolic compounds and aminoacid composition.
The different samples of acacia, colza and linden were correctly classified, while for sunflower, 1 sample out of 3 was misclassified as colza honey.
The attempt to determine the country of origin gave completely correct results, and the parameters studied are very useful for discrimination.
In another research, different samples of raspberry, mint, rape, sunflower, thyme, acacia and tilia honey were used for the determination of monofloral discrimination (Figure 2) [29].
All the spectra present characteristic peaks at 3297 cm−1 and at 2932 cm−1 due to the presence of water and, respectively, to C–H stretching in carboxylic acids and NH3 stretching in free aminoacids [30,31]. The differentiation was performed in the region of 1800–750 cm−1, which is preferred for the spectral analysis of honey. Plus, the Romanian honey samples used in this study presented an absorption band around 1640 cm−1, due to both water and a small amount of protein molecules [31] due to the difference in water content, water-carbohydrate interactions and protein content. The peaks from 1175 to 940 cm−1 corresponded to C–O stretching in carbohydrates, as follows: 1148 cm−1 was specific to sucrose, 1087 and 1043 cm−1 to the presence of glucose and fructose, and 983 cm−1 and 965 cm−1 to fructose [32].
Apart from the studies carried out by Romanian researchers, there are other numerous studies performed by other international research groups.
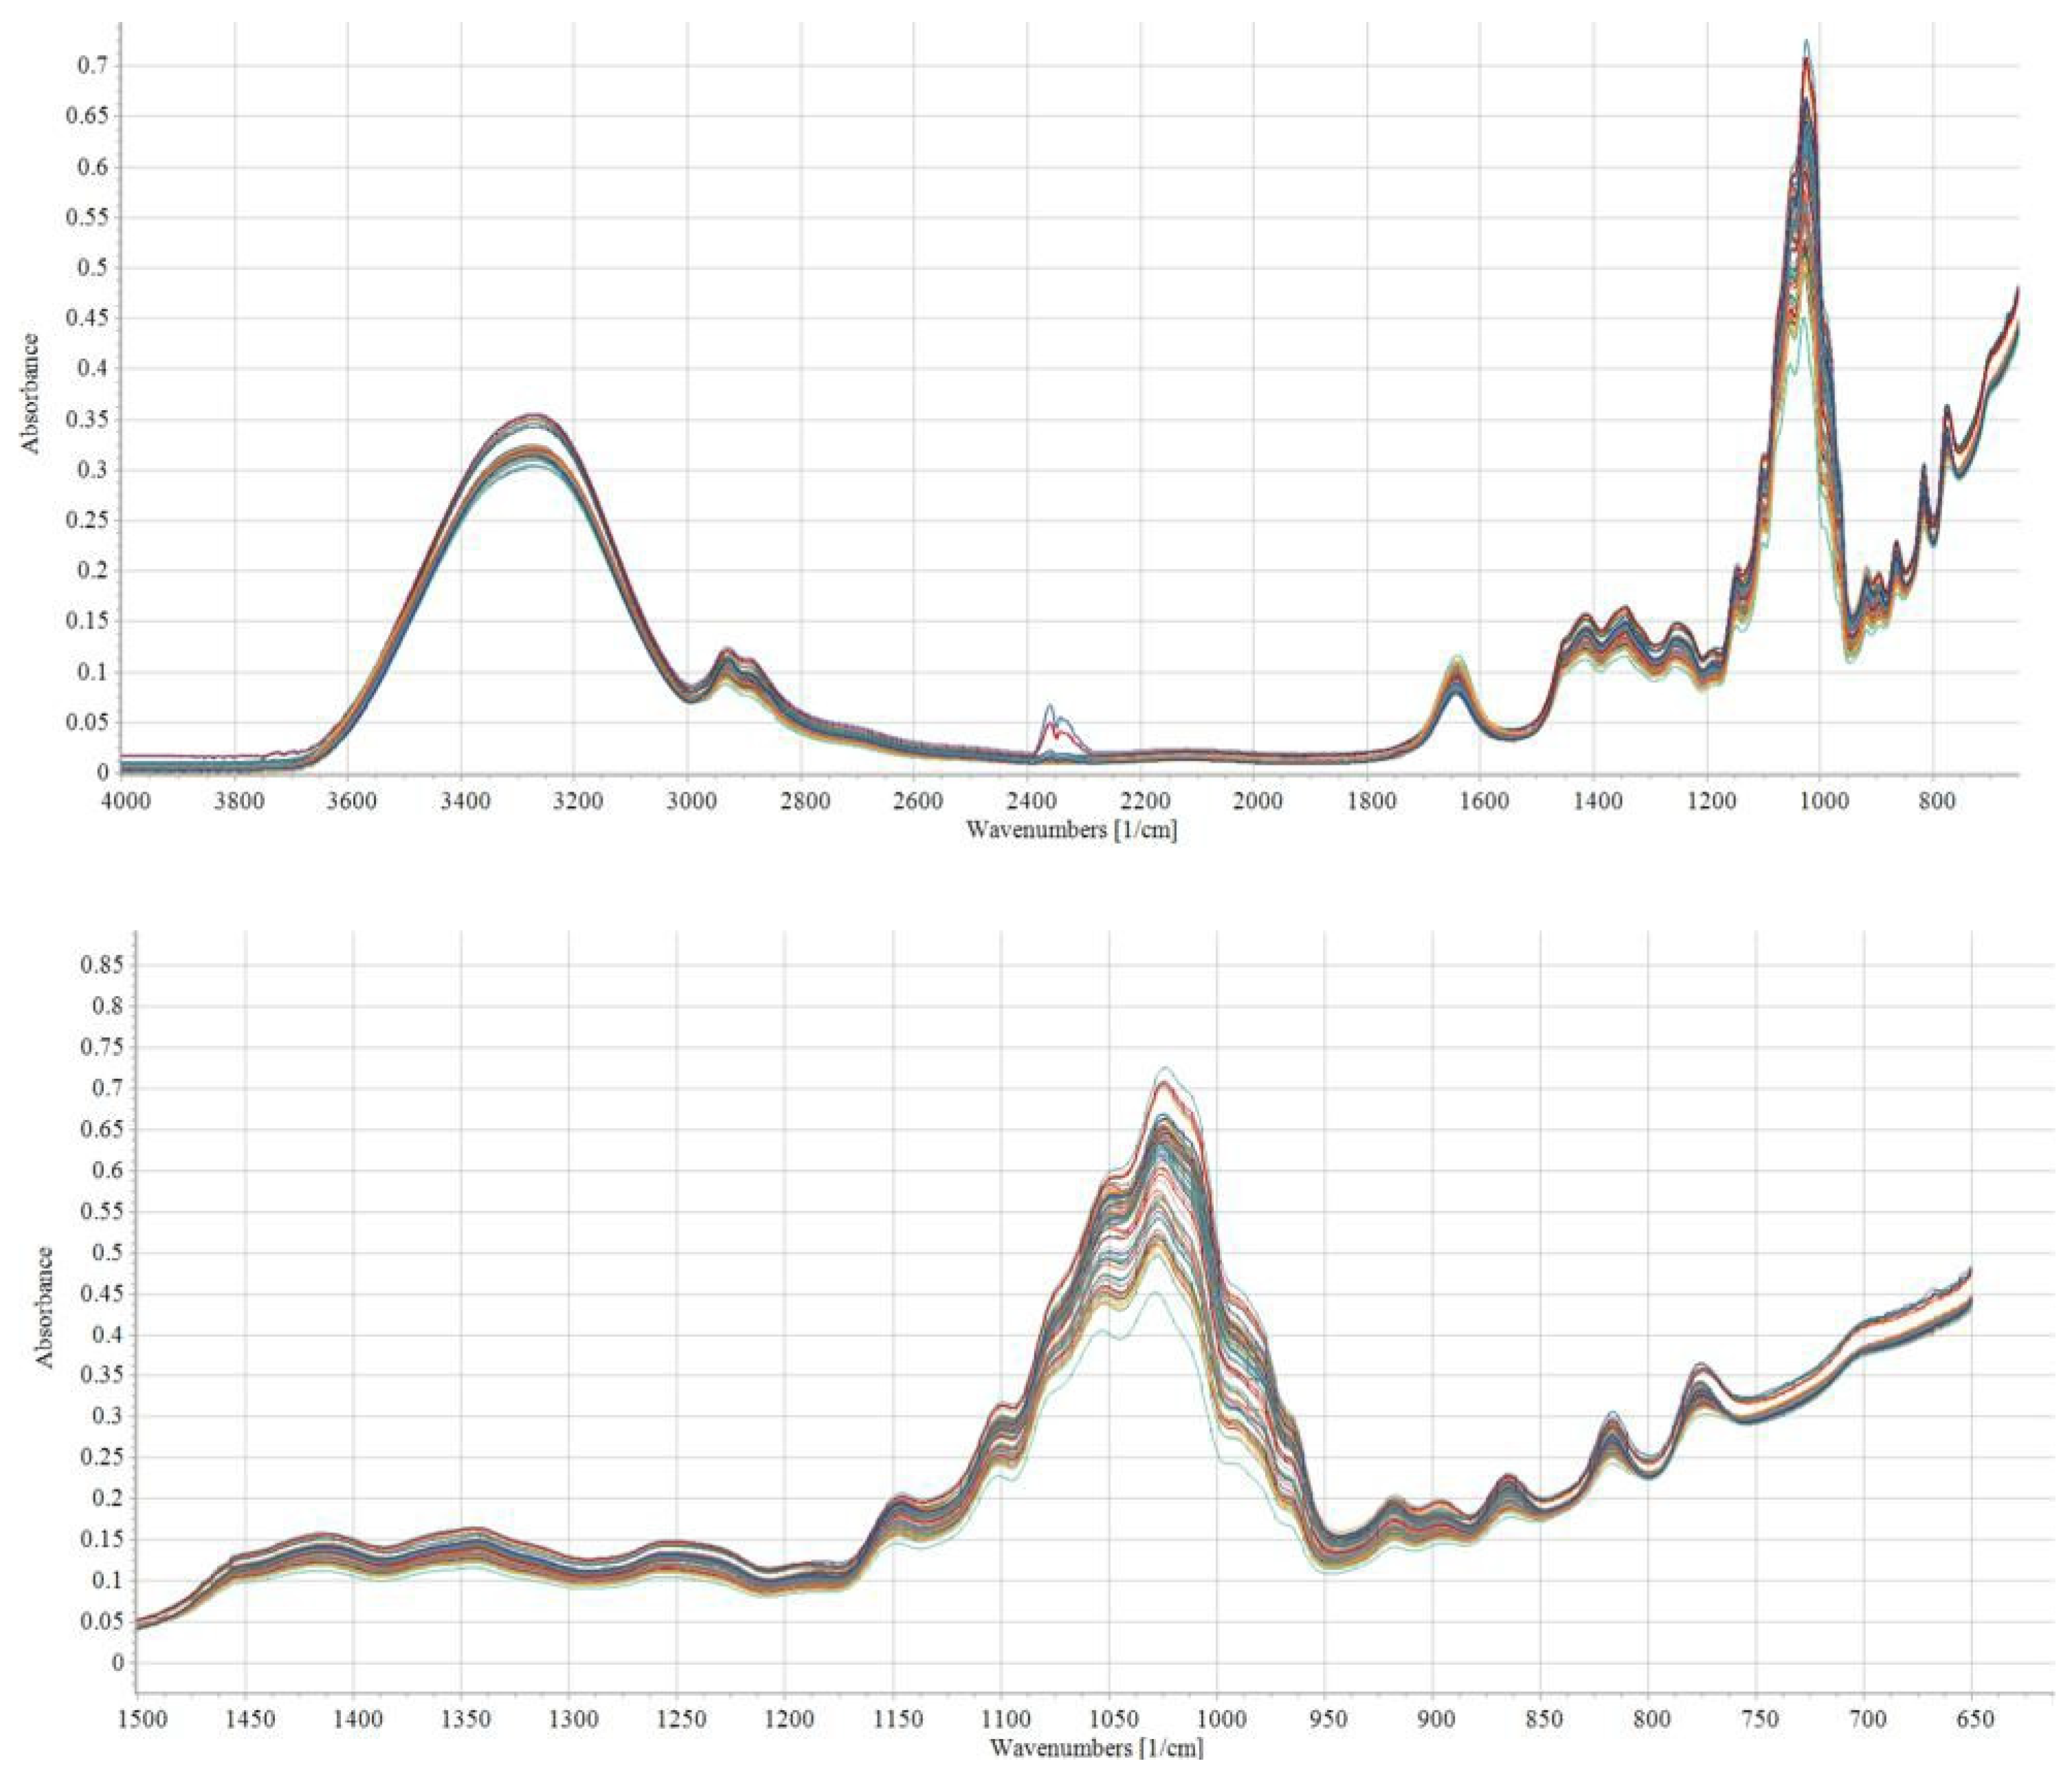
In another research, a study was performed in order to determine the botanical origin of honey samples specific to the Anatolia region using different multivariate analysis techniques (hierarchical clustering and Principal Component Analysis, PCA) to the Attenuated Total Reflectance (ATR)-FTIR spectroscopic data [30]. This study discriminates the characteristics of Anatolian honey samples from different botanical origins based on the differences in their molecular content, rather than giving numerical information about the constituents of samples. Moreover, the study tries to differentiate in authentic honey samples from the natural ones precisely, with discrimination in the same spectral region, 1800–750 cm−1, and using hierarchical clustering analysis.
Figure 3 shows the comparative infrared spectra of honey samples in the 4000–650 cm−1 region.
It was concluded that there are many considerable variations in the spectral parameters of honey samples that come from different botanical origins. New research was performed in order to correlate near-infrared (NIR) vibration bands to physico chemical parameters using different honey samples from Brazil (Roraima State, northern Brazil, and Paraná State, southern Brazil) [34].
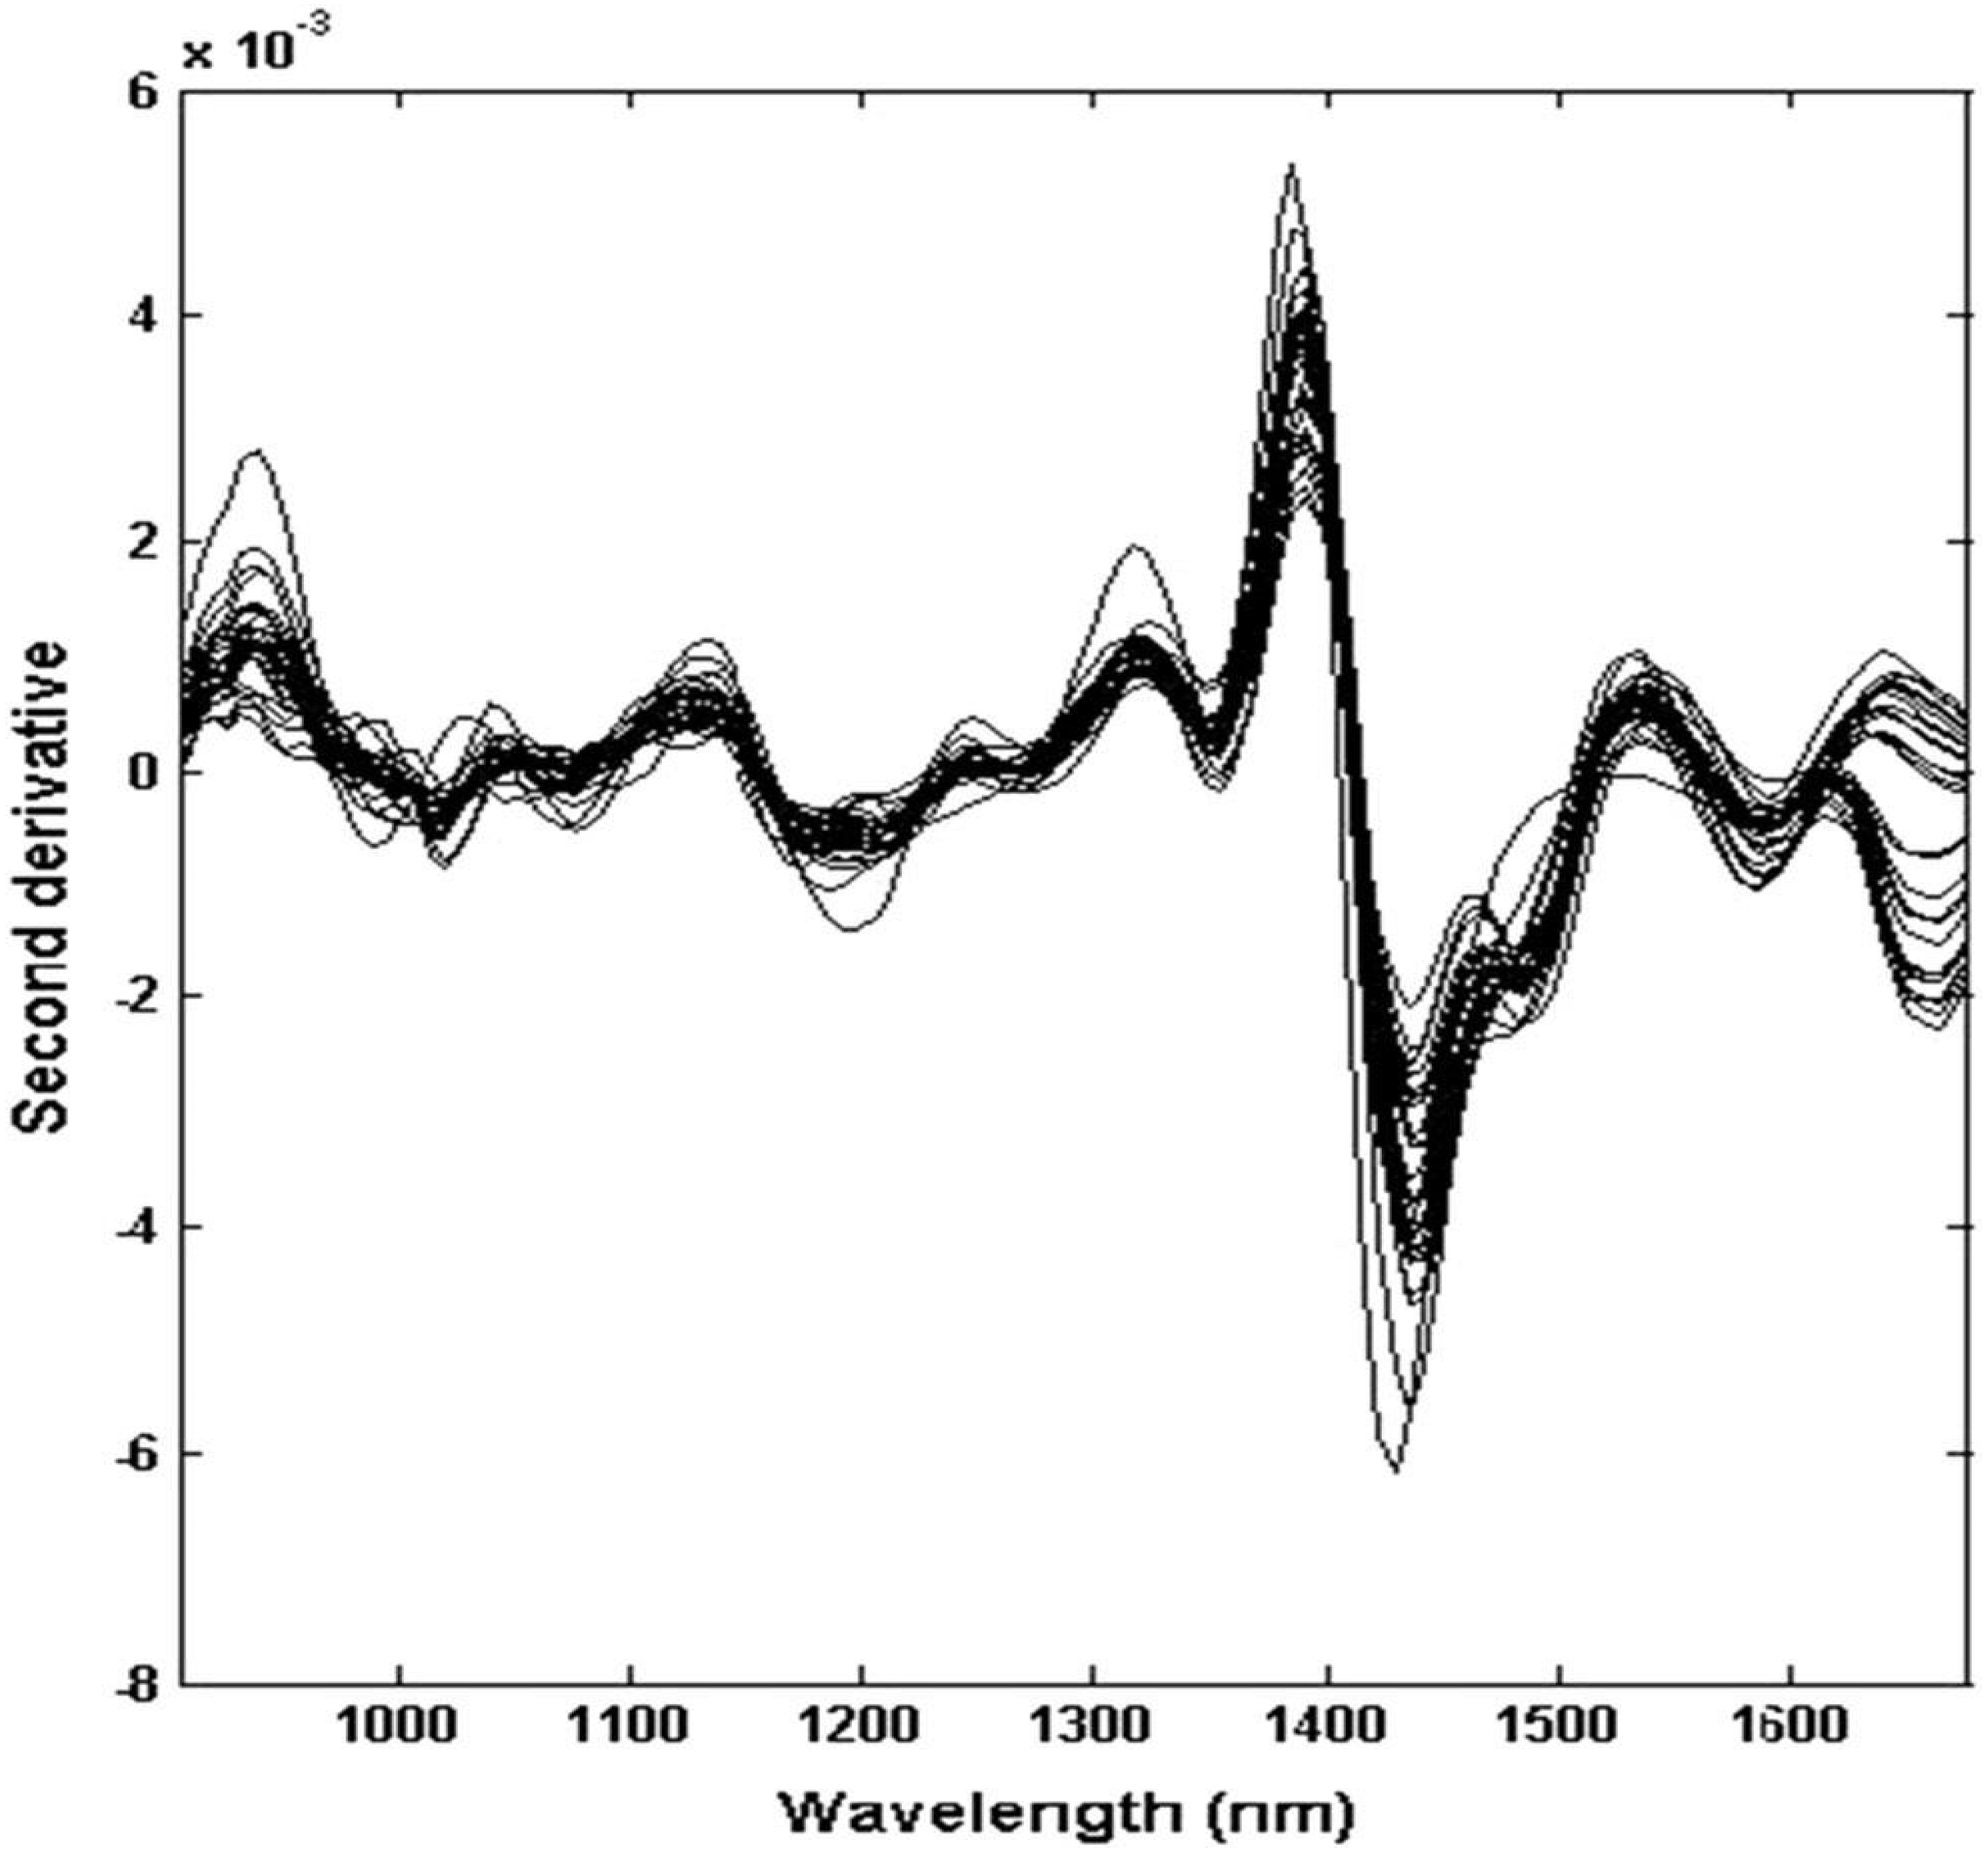
Figure 4 shows the NIR spectra of the honey samples after base line correction and smoothing through the Savgol algorithm [35].
The results obtained using PCA from NIR spectroscopy were identical to those from the ComDim multiblock analysis (“Common Dimensions”), so it is easier to replace the physico chemical parameters determination by NIR spectroscopy in the honey sample discrimination [37,38].
In another study, four unique varieties of honey (saffron, apple, cherry, and Plectranthus rugosus) from the Kashmir valley of India were studied, taking into account the principal physico-chemical parameters and carbohydrate profile [39], obtained in the region 1400 to 750 cm−1, which corresponds to the most sensitive absorption region of the sugars by using FTIR–ATR.
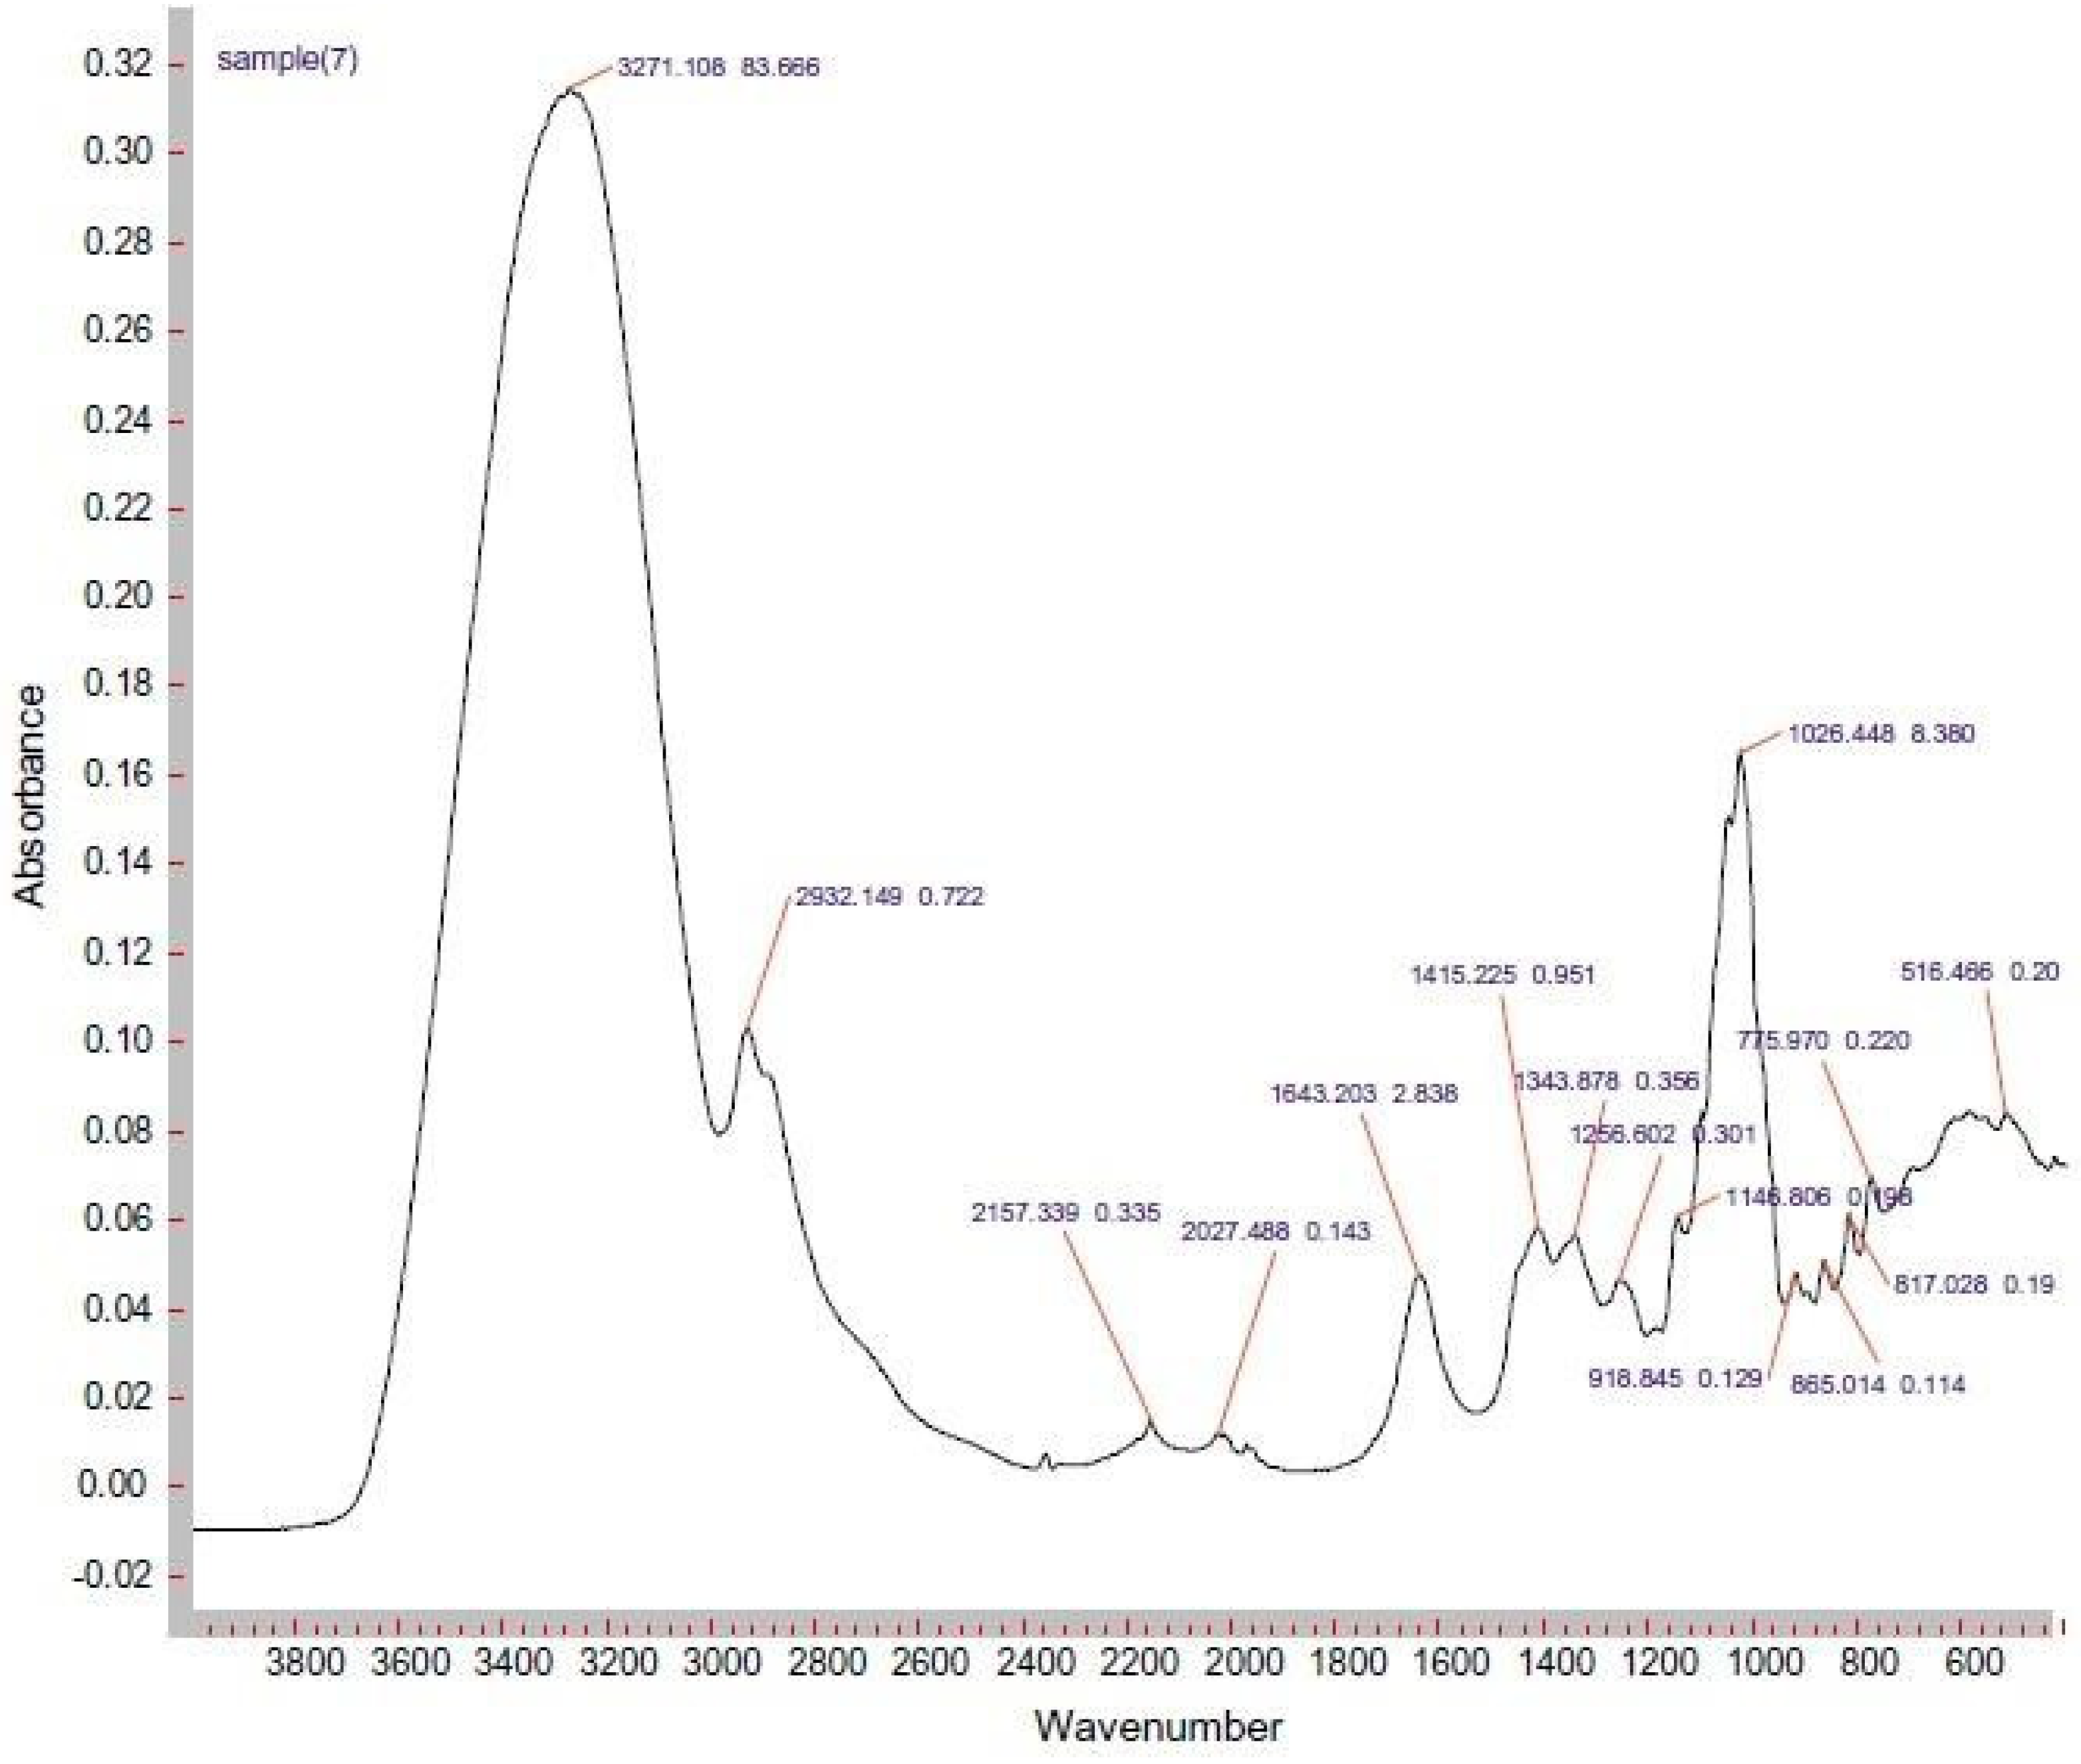
A representative ATR-FTIR spectrum of saffron honey is presented in Figure 5.

3. Conclusions

Honey discrimination can ensure honey quality and safety and can facilitate the advancements of the apicultural industry. The identification and characterization of the botanical and geographical origins of honey are complicated. Because the component soft he different honey types are generally similar, spectroscopic techniques such as IR can be a useful method for honey authentication, being preferred in the analysis of honey due to its major advantages, such as being non-destructive and short time-consuming. The advantages of this method are that it is fast, reliable and easy to use. Plus, it requires minimal or no sample preparation and only a very small amount of the sample.
ATR-FTIR spectroscopy in combination with multivariate analysis enables the extraction of useful quantitative information via single rapid measurement for the classification of the botanical origin of honey samples.
The carbohydrate profile of studied honey revealed that all the unique honey varieties possessed reducing sugars, mainly fructose and glucose in the largest portion, and also small quantities of disaccharides and trisaccharides. Vibrational spectra recorded by using FTIR–ATR were shown to be a good methodology in the evaluation of sugars in honey.

Author Contributions

A.A.B. contributed to conceptualization, methodology and writing of the original draft. H.Y.A.-E. contributed to data curation, supervision and writing—reviewing and editing. All authors have read and agreed to the published version of the manuscript.

Funding

This research received no external funding.

Institutional Review Board Statement

Not applicable.

Informed Consent Statement

Not applicable.

Data Availability Statement

Not applicable.

Conflicts of Interest

The authors declare no conflict of interest.

References

  1. Codex Alimentarius Commission Standards. Draft Revised Standard for Honey; 33rd Session; Food Standards Agency: Geneva, Switzerland, 2010; pp. 19–26. [Google Scholar]
  2. Council of the European Union. Council Directive, 2001/110/EC of 20 December 2001 relating to honey. Off. J. Eur. Commun. 2002, L10, 47–52. [Google Scholar]
  3. Global Industry Analysts Inc. Honey: A Global Strategic Business Report; Global Industry Analysts Inc.: San Jose, CA, USA, 2016; Available online: http://www.strategyr.com/MarketResearch/Honey_Market_Trends.asp (accessed on 1 July 2022).
  4. Conti, M.E.; Stripeikis, J.; Campanella, L.; Cucina, D.; Tudino, M.B. Characterization of Italian honeys (Marche Region) on the basis of their mineral content and some typical quality parameters. Chem. Cen. J. 2007, 1, 14. [Google Scholar] [CrossRef] [PubMed]
  5. Pohl, P. Determination of metal content in honey by atomic absorption and emission spectrometries. TrAC Trends Anal. Chem. 2009, 28, 117–128. [Google Scholar] [CrossRef]
  6. Alvarez-Suarez, J.M.; Tulipani, S.; Romandini, S.; Bertoli, E.; Battino, M. Contribution of honey innutrition and human health: A review. Medit. J. Nutr. Met. 2010, 3, 15–23. [Google Scholar] [CrossRef]
  7. Bogdanov, S.; Jurendic, T.; Sieber, R.; Gallmann, P. Honey for nutrition and health: A review. J. Am. Coll. Nutr. 2008, 27, 677–689. [Google Scholar] [CrossRef]
  8. Conti, M.E.; Finoia, M.G.; Fontana, L.; Mele, G.; Botrè, F.; Iavicoli, I. Characterization of Argentine honeys on the basis of their mineral content and some typical quality parameters. Chem. Cent. J. 2014, 8, 44. [Google Scholar] [CrossRef]
  9. Wang, J.; Li, Q.X. Chemical composition, characterization, and differentiation of honey botanical and geographical origins. In Advances in Food and Nutrition Research; Elsevier Inc.: Amsterdam, The Netherlands, 2011; Volume 62, pp. 89–137. [Google Scholar] [CrossRef]
  10. Cozzolino, D.; Corbella, E.; Smyth, H.E. Quality control of honey using infrared spectroscopy: A review. Appl. Spectrosc. Rev. 2011, 46, 523–538. [Google Scholar] [CrossRef]
  11. Odeh, I.; Abu-Lafi, S.; Dewik, H.; Al-Najjar, I.; Imam, A.; Dembitsky, V.M.; Hanuš, L.O. A variety of volatile compounds as markers in Palestinian honey from Thymus capitatus, Thymelaea hirsuta, and Tolpis virgata. Food Chem. 2007, 101, 1393–1397. [Google Scholar] [CrossRef]
  12. Svečnjak, L.; Biliškov, N.; Bubalo, D.; Barišić, D. Application of infrared spectroscopy in honey analysis. Agric. Conspec. Sci. 2011, 76, 191–195. [Google Scholar]
  13. Bogdanov, S.; Ruoff, K.; Persano Oddo, L. Physico-chemical methods for the characterization of unifloral honeys: A review. Apidologie 2004, 35, S4–S17. [Google Scholar] [CrossRef]
  14. Consonni, R.; Cagliani, L.R. Recent developments in honey characterization. RSC Adv. 2015, 5, 59696–59714. [Google Scholar] [CrossRef]
  15. Perez-Arquillue, C.; Conchello, P.; Arino, A.; Juan, T.; Herrera, A. Physicochemical attributes and pollen spectrum of some unifloral Spanish honeys. Food Chem. 1995, 54, 167–172. [Google Scholar] [CrossRef]
  16. Wang, J.; Kliks, M.; Qu, W.Y.; Jun, S.J.; Shi, G.Y.; Li, Q.X. Rapid determination of the geographical origin of honey based on protein fingerprinting and barcoding using MALDI TOF MS. J. Agric. Food Chem. 2009, 57, 10081–10088. [Google Scholar] [CrossRef] [PubMed]
  17. Cotte, J.F.; Casabianca, H.; Chardon, S.; Lheritier, J.; Grenier-Loustalot, M.F. Application of carbohydrate analysis to verify honey authentication. J. Chromatogr. A 2003, 1021, 145–155. [Google Scholar] [CrossRef]
  18. Ohe, W.; Von der Persano Oddo, L.; Piana, M.L.; Morlot, M.; Martin, P. Harmonized methods of melissopalynology. Apidologie 2004, 35 (Suppl. S1), S18–S25. [Google Scholar] [CrossRef]
  19. Louveaux, J.; Maurizio, A.; Vorwohl, G. Methods of melissopalynology. Bee World 1978, 59, 139–157. [Google Scholar] [CrossRef]
  20. Tsagkaris, A.S.; Koulis, G.A.; Danezis, G.P.; Martakos, I.; Dasenaki, M.; Georgiouc, C.A.; Thomaidis, N.S. Honey authenticity: Analytical techniques, state of the art and challenges. RSC Adv. 2021, 11, 11273. [Google Scholar] [CrossRef]
  21. Anklam, E. A review of the analytical methods to determine the geographical and botanical origin of honey. Food Chem. 1998, 63, 549–562. [Google Scholar] [CrossRef]
  22. Adamchuk, L.; Sukhenko, V.; Akulonok, O.; Bilotserkivets, T.; Vyshniak, V.; Lisohurska, D.; Lisohurska, O.; Slobodyanyuk, N.; Shanina, O.; Galyasnyj, I. Methods for determining the botanical origin of honey. Potravin. Slovak J. Food Sci. 2020, 14, 483–493. [Google Scholar] [CrossRef]
  23. Su, W.H.; Sun, D.W. Mid-infrared (MIR) spectroscopy for quality analysis of liquid foods. Food Eng. Rev. 2019, 11, 142–158. [Google Scholar] [CrossRef]
  24. Guyon, F.; Enora Logodin, E.; Magdas, D.A.; Gaillard, L. Potential of FTIR-ATR diamond in discriminating geographical and botanical origins of honeys from France and Romania. Talanta Open 2021, 3, 100022. [Google Scholar] [CrossRef]
  25. Stuart, B.H. Biological Applications of Infrared Spectroscopy; Ando, D.J., Ed.; ACOL Series; Wiley: Chichester, UK, 1997; 212p, ISBN 978-0-471-97414-7. [Google Scholar]
  26. Gallardo-Velazquez, T.; Osorio-Revilla, G.; Loa, M.Z.; Rivera-Espinoza, Y. Application of FTIR-HATR spectroscopy and multivariate analysis to the quantification of adulterants in Mexican honeys. Food Res. Int. 2009, 42, 313–3318. [Google Scholar] [CrossRef]
  27. Masek, A.; Chrzescijanska, E.; Kosmalska, A.; Zaborski, M. Characteristics of compounds in hops using cyclic voltammetry, UV–VIS, FTIR and GC–MS analysis. Food Chem. 2014, 156, 353–361. [Google Scholar] [CrossRef] [PubMed]
  28. Kraspryzk, I.; Depciuch, J.; Grabek-Lejko, D.; Parlinska-Wojtan, M. FTIR-ATR spectroscopy of pollen and honey as a tool for unifloral honey authentication. The case study of rape honey. Food Control 2018, 84, 33–40. [Google Scholar] [CrossRef]
  29. Pauliuc, D.; Ciursă, P.; Ropciuc, S.; Dranca, F.; Oroian, M. Physicochemical parameters prediction and authentication of different monofloral honeys based on FTIR spectra. J. Food Compos. Anal. 2021, 102, 104021. [Google Scholar] [CrossRef]
  30. Gok, S.; Severcan, M.; Goormaghtigh, E.; Kandemir, I.; Severcan, F. Differentiation of Anatolian honey samples from different botanical origins by ATR-FTIR spectroscopy using multivariate analysis. Food Chem. 2015, 170, 232–240. [Google Scholar] [CrossRef]
  31. Tewari, J.; Irudayaraj, J. Quantification of saccharides in multiplefloral honeys using Fourier transform infrared micro attenuated total reflectance spectroscopy. J. Agric. Food Chem. 2004, 52, 3237–3243. [Google Scholar] [CrossRef]
  32. Anjos, O.; Campos, M.G.; Ruiz, P.C.; Antunes, P. Application of FTIR-ATR spectroscopy to the quantification of sugar in honey. Food Chem. 2015, 169, 218–223. [Google Scholar] [CrossRef]
  33. Horvatinec, J.; Svečnjak, L. Infrared (FTIR) spectral features of honey bee (Apis mellifera L.) hemolymph. J. Cent. Eur. Agric. 2020, 21, 37–41. [Google Scholar] [CrossRef]
  34. Freire, K.R.L.; Lins, A.C.S.; Dórea, M.C.; Santos, F.A.R.; Camara, C.A.; Silva, T.M.S. Palynological origin, phenolic content, and antioxidant properties of honey bee-collected pollen from Bahia, Brazil. Molecules 2012, 17, 1652–1664. [Google Scholar] [CrossRef]
  35. Savitzky, A.; Golay, M.J.E. Smoothing and differentiation of data by simplified least squares procedures. Anal. Chem. 1964, 36, 1627–1639. [Google Scholar] [CrossRef]
  36. Leme, L.M.; Montenegro, H.R.; da Rochados Santos, L.; Sereia, M.J.; Valderrama, P.; Março, P.H. Relation between near-infrared spectroscopy and physicochemical parameters for discrimination of honey samples from Jatai weyrauchi and Jatai angustula bees. Food Anal. Methods 2018, 11, 1944–1950. [Google Scholar] [CrossRef]
  37. Cariou, V.; Qannari, E.M.; Rutledge, D.N.; Vigneau, E. ComDim: From multiblock data analysis to path modeling. Food Qual. Prefer. 2016, 67, 27–34. [Google Scholar] [CrossRef]
  38. Jouan-Rimbaud Bouveresse, D.; Pinto, R.C.; Schmidtke, L.M.; Locquet, N.; Rutledge, D.N. Identification of significant factors by an extension of ANOVA-PCA based on multi-block analysis. Chemom. Intell. Lab. Syst. 2011, 106, 173–182. [Google Scholar] [CrossRef]
  39. Nayik, G.A.; Dar, B.N.; Nanda, V. Physico-chemical, rheological and sugar profile of different unifloral honeys from Kashmir. valley of India. Arab. J. Chem. 2019, 12, 3151–3162. [Google Scholar] [CrossRef] [Green Version]
Figure 1. The FTIR spectra of honey samples from Romania and France regions, where the areas excluded are presented in gray. (Reprinted with permission from ref. [24]).
Chemistry 04 00060 g001
Figure 2. The FTIR spectra of honey samples of different botanical origin: raspberry, mint, rape, sunflower, thyme, acacia and tilia honey. (Reprinted with permission from ref. [29]).
Chemistry 04 00060 g002
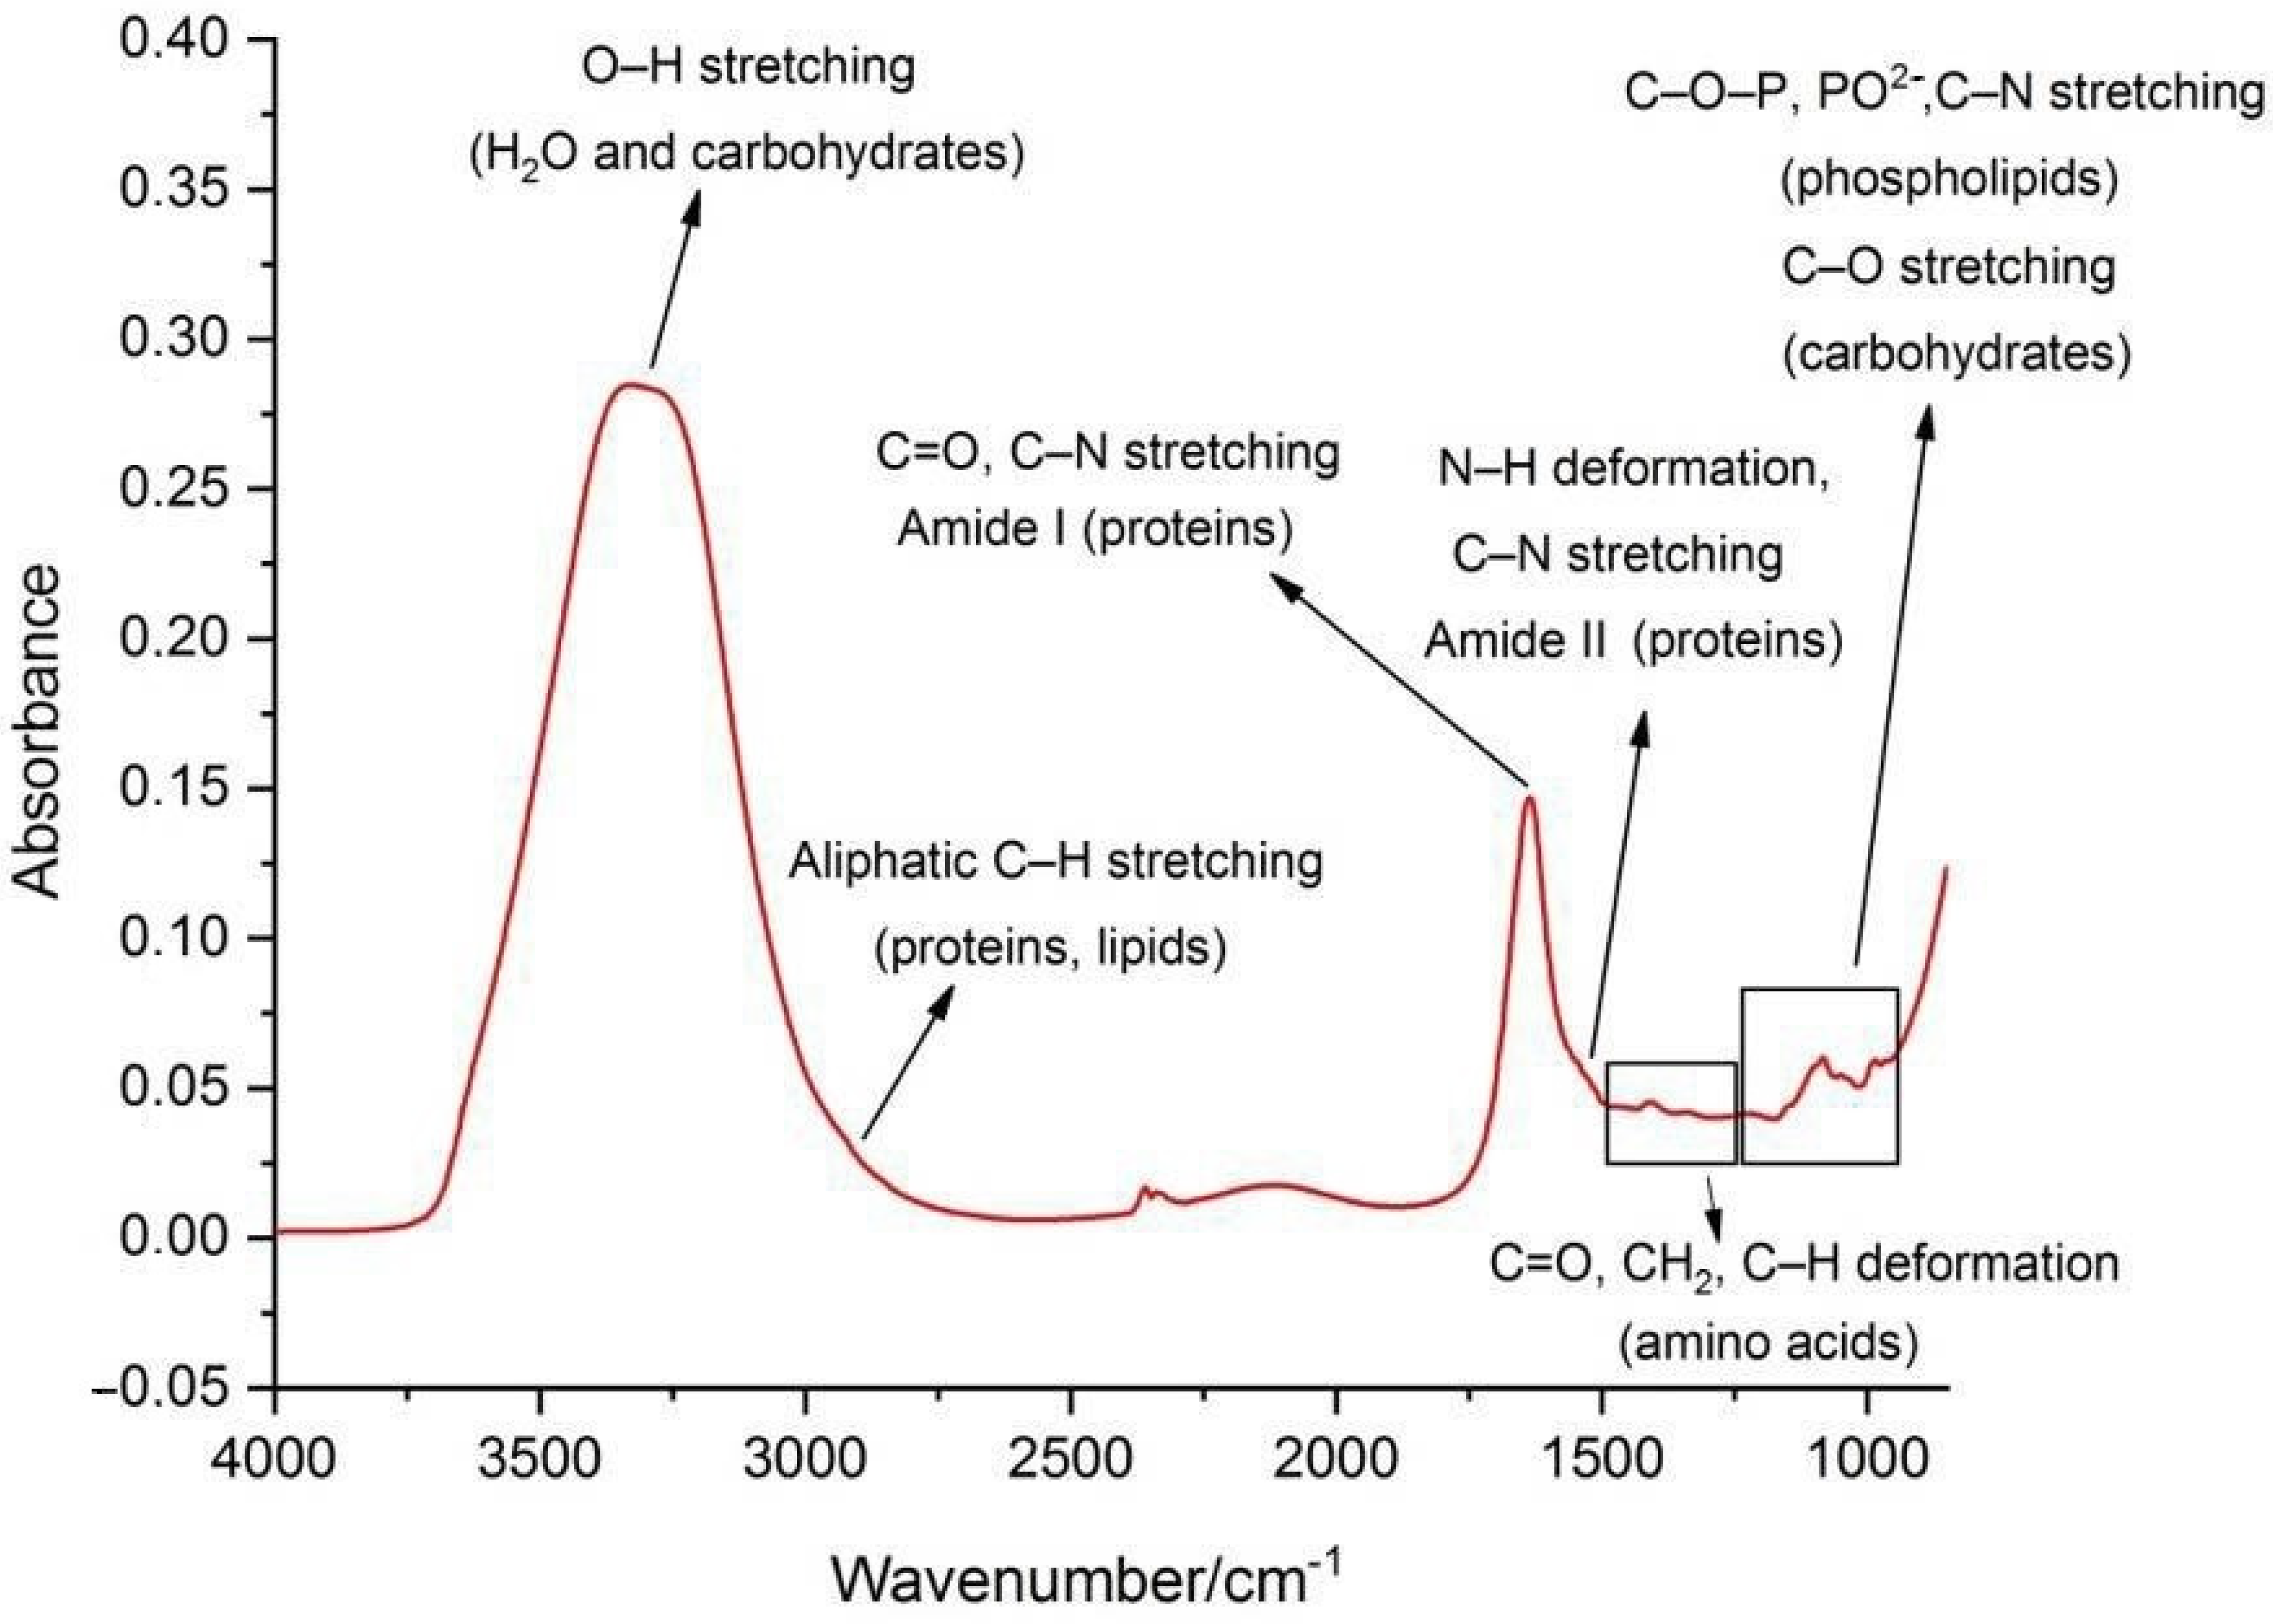
Figure 3. Characteristic FTIR-ATR spectrum of the honey bee hemolymph (spectral range: 4000–600 cm−1) with assignation of major underlying molecular vibrations. (Reprinted with permission from ref. [33]).
Chemistry 04 00060 g003
Figure 4. NIR spectra of all honey samples. (Reprinted with permission from ref. [36]).
Chemistry 04 00060 g004
Figure 5. Representative FTIR–ATR spectrum of saffron honey in the 4000–400 cm−1 spectral region. (Reprinter with permission from ref. [39]).
Chemistry 04 00060 g005
Publisher’s Note: MDPI stays neutral with regard to jurisdictional claims in published maps and institutional affiliations.