Article

A Machine Learning Approach to Detect Denial of Sleep Attacks in Internet of Things (IoT)

by
Ishara Dissanayake
1,
Anuradhi Welhenge
2 and
Hesiri Dhammika Weerasinghe
3,*
1
Department of Computer Engineering, Faculty of Engineering, University of Sri Jayewardenepura, Nugegoda 10250, Sri Lanka
2
School of Electrical Engineering, Computing and Mathematical Sciences, Curtin University, Bentley, WA 6102, Australia
3
Department of Computer Systems Engineering, Faculty of Computing and Technology, University of Kelaniya, Kelaniya 11600, Sri Lanka
*
Author to whom correspondence should be addressed.
IoT 2025, 6(4), 71; https://doi.org/10.3390/iot6040071 (registering DOI)
Submission received: 3 September 2025 / Revised: 9 November 2025 / Accepted: 15 November 2025 / Published: 20 November 2025

Abstract

The Internet of Things (IoT) has rapidly evolved into a central component of today’s technological landscape, enabling seamless connectivity and communication among a vast array of devices. It underpins automation, real-time monitoring, and smart infrastructure, serving as a foundation for Industry 4.0 and paving the way toward Industry 5.0. Despite the potential of IoT systems to transform industries, these systems face a number of challenges, most notably the lack of processing power, storage space, and battery life. Whereas cloud and fog computing help to relieve computational and storage constraints, energy limitations remain a severe impediment to long-term autonomous operation. Among the threats that exploit this weakness, the Denial-of-Sleep (DoSl) attack is particularly problematic because it prevents nodes from entering low-power states, leading to battery depletion and degraded network performance. This research investigates machine-learning (ML) and deep-learning (DL) methods for identifying such energy-wasting behaviors to protect IoT energy resources. A dataset was generated in a simulated IoT environment under multiple DoSl attack conditions to validate the proposed approach. Several ML and DL models were trained and tested on this data to discover distinctive power-consumption patterns related to the attacks. The experimental results confirm that the proposed models can effectively detect anomalous behaviors associated with DoSl activity, demonstrating their potential for energy-aware threat detection in IoT networks. Specifically, the Random Forest and Decision Tree classifiers achieved accuracies of 98.57% and 97.86%, respectively, on the held-out 25% test set, while the Long Short-Term Memory (LSTM) model reached 97.92% accuracy under a chronological split, confirming effective temporal generalization. All evaluations were conducted in a simulated environment, and the paper also outlines potential pathways for future physical testbed deployment.

1. Introduction

The Internet of Things (IoT) stands out as one of the most impactful innovations in modern computing, connecting billions of smart devices to enable new levels of automation and data-driven decision-making. From smart homes and cities to critical healthcare and industrial automation, IoT has become an integral part of many sectors, driving efficiency and innovation [1,2]. However, as IoT systems continue to expand, they also introduce new security and operational challenges, especially in environments with resource-constrained devices. Among these, energy-draining attacks such as DoSl attacks pose a serious risk to the sustainability and smooth functioning of IoT networks.
Unlike traditional Denial-of-Service (DoS) attacks that flood networks to deny service, DoSl attacks prevent IoT devices from entering their low-power sleep modes, causing their batteries to drain faster than usual [3,4]. This can drastically shorten the lifetime of individual nodes and destabilize the entire network by isolating devices, breaking communication paths, and hindering essential sensing and actuation functions. These risks are even more severe in scenarios where it is difficult or impossible to replace batteries regularly, such as remote or hard-to-access sensing and monitoring deployments.
Despite the significance of this threat, DoSl attacks have received comparatively little research attention. One major challenge is the lack of publicly available datasets that realistically simulate such attacks, which makes it difficult to develop, evaluate, and compare detection methods, especially those relying on data-driven machine-learning (ML) techniques. Furthermore, algorithmic approaches for detecting these attacks are also harder to implement due to the limited processing power and energy constraints of tiny IoT devices.
To bridge this gap, we developed a comprehensive dataset by simulating three types of battery-draining attacks: a UDP flood, a wormhole, and an externally generated legitimate-request attack similar to a barrage attack. These approaches were initially proposed in our previous work [5]. As a baseline experimental platform, this study employed the COOJA simulator, which executes actual ContikiOS firmware and therefore provides high-fidelity simulation of IoT node behavior. Although a physical testbed was not available, this simulated environment generated realistic and reproducible power-consumption data suitable for ML-based analysis, forming a strong foundation for subsequent validation on real testbeds. Using the COOJA simulator with ContikiOS and the Powertrace tool, we gathered power-consumption data for both normal and attack conditions. Simulations were conducted with varying parameters and network configurations using six to twelve nodes over a three-hour period. The resulting dataset contained 58,025 records with ten features and labels indicating whether each instance represented attack or normal activity. Based on this data, we defined the detection task as a classification problem and tested various supervised ML models, including Logistic Regression, Support Vector Machines, k-Nearest Neighbors, Decision Trees, and Random Forests. These models represent a range of linear, non-linear, and ensemble classifiers, which are particularly useful when resources are constrained on IoT devices. We also investigated deep learning (DL) using an Artificial Neural Network (ANN) and a Long Short-Term Memory (LSTM)-based Recurrent Neural Network. ANNs are robust in modeling complex non-linear relationships and have demonstrated strong performance in domains with sufficient training data [6]. According to our findings, deep learning and ensemble algorithms, including Random Forest, effectively identify the abnormal behavior of DoSl attacks, supporting the concept that ML-based detection can enhance energy-aware security in IoT systems.
The key findings of this paper include the following:
  • Dataset Creation: We constructed an elaborate dataset that models various battery-depleting DoSl attacks on a ContikiOS-based IoT setting with COOJA. This dataset has power consumption and node-level features where instances are labelled for supervised learning [5].
  • Machine Learning Evaluation: We performed an extensive test of classical ML models, both linear and non-linear, in a multi-class classification system. The models were also tested with respect to identifying real nodes and different attack situations such as attacks involving sleep deprivation, UDP-flooding, wormhole, and externally generated legitimate-request attacks.
  • Deep Learning Application: We showed that DL could be applied to the dataset by training an ANN and an LSTM-based RNN model to reveal the existence of complex attack patterns, which conventional ML methods could not reveal.
  • Analysis and Future Directions: We interpret the results of the tested models about their strengths and weaknesses, and we suggest future work, such as more considerations on the implementation in real time, as well as validation on real-life IoT architecture.
The necessity of mitigating these energy-draining attacks lies in their broad scholarly and practical significance. In healthcare, for example, monitoring systems, wearable medical sensors, and implantable devices built on the Internet of Things heavily rely on long battery life to ensure continuous gathering of essential health information. Such devices may experience delayed alerts, data loss, or compromised patient safety due to unintended wake-ups and accelerated energy depletion. Similar vulnerabilities arise in environmental monitoring and smart-city infrastructure, where large sensor networks must maintain uninterrupted functionality. Therefore, DoSl attacks are not merely a technical issue but a significant threat to the reliability and stability of critical IoT services. To address this issue, this paper explores how ML and DL models can identify DoSl attacks using energy-consumption traces. In contrast to rule-based or threshold-based intrusion detection mechanisms, data-driven methods are more adaptive to changing network conditions and dynamic attack behaviors. This study enhances energy-conscious intrusion detection in IoT networks by focusing on the underexplored DoSl threat category, offering a dedicated dataset, optimized ML/DL models, and a comparative evaluation of their performance to support the development of more energy-aware IoT systems.
The rest of this manuscript is structured as follows: Section 2 onwards examines relevant literature in the area of intrusion detection and energy-based threats in the IoT field, available datasets, and potential ML contributions towards the context. Section 3 elaborates on the implementation, including the simulation environment and dataset preparation. Section 4 provides the analysis of other ML models and empirical findings. Lastly, Section 5 provides a comprehensive evaluation of the developed models and finally concludes with statements along with an evaluation of the limitations and future research opportunities.

2. Related Works

As indicated in the introduction, energy efficiency is a major issue in IoT networks. Maintaining battery power can be approached at multiple levels in the IoT. Two of the most popular approaches used to extend the battery life of IoT devices include MAC-layer techniques and ML-based systems.
A number of protocols have been developed to minimize energy consumption at the MAC layer, employing techniques such as duty cycling, synchronization, and low-power listening. Examples include S-MAC and T-MAC, which manage sleep scheduling to conserve battery life [7,8]. Likewise, schemes such as B-MAC and X-MAC implement low-power listening to further reduce power consumption [9,10]. Another commonly used protocol designed with energy efficiency in mind is ContikiMAC [11]. Even with these energy-saving properties, these MAC protocols still face significant challenges in defending against sleep-deprivation attacks, in which malicious activity forces devices to remain awake and drain their batteries.
Various mechanisms have been proposed to mitigate such attacks. For example, a mechanism known as Short Message Authentication Check (SMACK) was developed to detect battery exhaustion in IoT and can be implemented at any communication stack layer. At the application layer, SMACK was integrated with the CoAP protocol and tested on resource-constrained CC2538 systems. The findings showed that it was cost-effective in terms of memory, computation, and power consumption [12]. However, SMACK may not withstand certain classes of attacks, such as barrage attacks, where nodes are targeted with a high rate of legitimate but bandwidth-intensive requests. In addition, performing full packet verification on each node can cause network overload in high-traffic conditions.
In contrast, ML-based approaches analyze behavioral patterns over time to detect deviations from normal activity, making them capable of detecting a wide range of battery exhaustion attacks. For instance, a Random Forest regression model was developed to predict battery life in IoT devices, achieving 97% predictive accuracy, although it focused on battery life prediction rather than attack classification [13].
The quality and relevance of datasets are crucial for training effective ML models. While datasets such as KDDCUP99, NSL-KDD [14], UNSW-NB15 [15], and CICIDS2017 [16] are widely used for anomaly-based intrusion detection in general networking, they lack specific data for IoT environments. Therefore, they are not suitable for detecting battery exhaustion attacks in IoT. Additionally, there are some other datasets that have been created focusing on IoT attacks [17,18], but they do not specifically address DoSl attacks.
However, there have been a few attempts to develop datasets suitable for detecting DoSl attacks. For example, ref. [19] simulated two datasets containing benign and malicious power-consumption and network-traffic data. However, this work only covered UDP-flooding attacks in terms of battery depletion, thus limiting the scope for anomaly-based IDS development. Inspired by [19], we proposed in our previous work [5] a dataset generation process that extends to include three types of battery-exhaustion attacks: UDP flood, wormhole, and externally generated legitimate-request attacks (similar to barrage attacks). Building on that foundation, this work utilizes the dataset alongside ML models for attack detection. Using the COOJA simulator and the Powertrace tool in ContikiOS, we collected data from six to twelve motes, with each attack running for three hours. This approach facilitated the development of ML models for detecting DoSl attacks, as presented in this paper.
Another related study [20] used the OPNET Modeler 17.5 simulator to generate a dataset with 19 features. After preprocessing, 1190 valid samples were used to train an SVM model that achieved 90.8% accuracy and a 97.49% true-positive rate. Although promising, the small dataset size raises concerns about the model’s scalability to larger datasets.
Authors in [21] presented a study that simulated an energy-efficient framework in a controlled environment with five sensors to counter DoSl attacks in a Wireless Body Area Network (WBAN) by optimizing energy use, detecting repetitive events, and controlling transmissions. The results showed significant improvements in network lifetime. For instance, the Pulsed-MAC protocol’s lifetime increased from 16 to 50 min under full attack and extended to over six days with partial node compromise. However, this study’s scope is limited by its small-scale setup with only five sensors in a controlled environment, which may not reflect the complexity and variability of larger, real-world WBAN deployments. Additionally, the framework focuses on specific repetitive request-type DoSl attacks and may not generalize well to other attack types or dynamic network conditions.
The ToN_IoT dataset presented in [22] combines telemetry, log, and network metrics from a realistic testbed featuring nine different types of attacks, such as DoS, DDoS, scanning, and ransomware. Their benchmark indicated that the CART model achieved the highest accuracy (0.77) at a low training cost, outperforming more complex deep models. Similarly, ref. [23] performed a rigorous audit of the Bot-IoT dataset, revealing data-quality challenges such as extreme class imbalance and environment-specific features that compromise reproducibility. Further efforts to enhance realism include the IDSIoT2024 dataset proposed in [24], which recorded 16.2 million network-flow records in a multi-device smart-home system with twelve attack types. In addition, studies such as [25] evaluated deep architectures including DenseNet121 and InceptionTime on ToN-IoT, Edge-IIoT, and UNSW-NB15 datasets, achieving near-perfect accuracy in traffic-based multi-class intrusion detection. Although these datasets and models represent important progress toward improving the security of constrained IoT networks, they have mainly focused on analyzing network traffic data, which limits their ability to detect energy-depletion attacks.
To further address this limitation, recent studies have begun exploring energy-conscious intrusion detection approaches. For instance, ref. [26] proposed a lightweight ML-based method for DoS detection in wireless sensor networks, achieving low latency and high accuracy, though it did not address energy exhaustion. More closely related, ref. [27] introduced a DL framework for DoSl detection in Narrowband-IoT (NB-IoT) networks using ns-3 simulations, where recurrent models (LSTM and GRU) achieved up to 98.99% accuracy and an ROC-AUC of 0.9889 in binary classification between normal and attack traffic. While these studies demonstrated the potential of DL approaches for energy-oriented intrusion detection, they primarily focused on network-traffic features or single-attack scenarios. Building on these findings, our work extends this direction by incorporating power-state telemetry features, such as CPU, transmit, listen, and idle components, to enable multi-class, energy-aware intrusion detection. This approach provides a more comprehensive understanding of sleep-state disruption and energy-drain dynamics in constrained IoT sensor networks.
More recently, Sharma et al. [28] proposed a stacking-based TinyML intrusion detection model that combines two lightweight learners, a compact Decision Tree and a small Neural Network optimized for microcontroller execution. A Logistic Regression meta-classifier was used to aggregate their predictions, improving generalization and stability across multiple attack categories. Trained on the ToN-IoT dataset (≈461 k samples across ten attack types), the model achieved 99.98% accuracy with an average inference latency of 0.12 ms and a power footprint of only 0.01 mW on an Arduino Nano 33 BLE Sense board. While this demonstrates the potential of TinyML ensembles for real-time edge deployment, the approach remains traffic-centric and lacks energy or sleep-state telemetry, limiting its capability to detect DoSl behaviors. In contrast, our work advances this direction by focusing on energy-aware intrusion detection that leverages device-level power metrics to capture sleep-state disruptions in constrained IoT sensor nodes.
Given these gaps, this work focuses on evaluating multiple ML classification models capable of identifying different types of battery exhaustion attacks in IoT, using a more comprehensive dataset. Table 1 provides a comparative summary of recent related works, outlining their approaches, targeted attack types, key outcomes, and limitations.

3. Implementation and Evaluation of the Proposed Solution

In the realm of IoT security, the detection of battery exhaustion attacks, particularly DoSl attacks, has become paramount to maintaining network reliability and longevity. Developing effective ML models for such detection depends on the availability of high-quality datasets that comprehensively represent both normal and attack conditions in IoT environments. As discussed earlier, existing publicly available datasets, while abundant for general network intrusion detection, suffer from several limitations when applied directly to battery exhaustion attack detection. These include a lack of granularity in power consumption features, diversity in attack types, and insufficient record volume from resource-constrained IoT devices.To address this gap, the present work undertakes the construction of a realistic, simulation-based dataset tailored specifically to this security challenge.

3.1. Dataset Generation Process

The dataset generation was realized through extensive simulations using the COOJA simulator, a platform specifically designed for the Contiki Operating System (ContikiOS), which is widely adopted in IoT and wireless sensor networks (WSN) research. COOJA offers the unique advantage of simulating nodes (motes) running the actual ContikiOS firmware, thus providing a high-reliability simulation of operational and power consumption behaviors in real-world IoT devices. The Powertrace application measures the time spent by each mote’s components in various operational states. These time measurements, when combined with device-specific current consumption values and supply voltage, are used to estimate power consumption in milliwatts (mW) and calculate total energy consumption in millijoules (mJ) over a given interval. The selection of COOJA was a strategic decision following a comparative analysis of three prominent simulation platforms, including COOJA, TOSSIM, and OPNET Modeler.
Initially, the TOSSIM simulator was considered due to its widespread use in TinyOS-based sensor network research. However, it lacks native support for accurate power consumption logging. Although PowerTOSSIM extends this functionality, it is limited in its ability to simulate low-level radio duty cycling mechanisms accurately, which are critical to understanding power exhaustion attacks that manipulate radio states to deplete batteries. Similarly, OPNET Modeler excels in simulating large-scale networks with rapid computation but requires costly commercial licensing, which impedes accessibility and reproducibility in academic research. Therefore, COOJA’s open-source BSD licensing, combined with its native Powertrace application for granular power consumption monitoring, makes it the most suitable platform for dataset creation in this study.
The IoT network topology in COOJA was constructed to mimic typical small-scale sensor deployments common in environmental monitoring and industrial control scenarios.
  • UDP Flood Attack Simulation: For this attack, the network consisted of twelve motes arranged in a mesh topology utilizing the RPL (Routing Protocol for Low-Power and Lossy Networks) stack over UDP. The simulation ran continuously for three hours, during which each mote’s power consumption in various operational modes was recorded using the Powertrace application. To simulate realistic network activity patterns and avoid synchronization artifacts, mote response time intervals were randomized for each hour, effectively diversifying the duty cycles and capturing a broad range of operational conditions.
  • Wormhole Attack Simulation: This simulation was conducted using the same twelve node network topology, with a key modification applied to the MAC layer of ContikiOS (the framer-nullmac.c file). This modification disabled the transmission of acknowledgement (ACK) frames from receivers to senders. As a result, victim nodes extended their listening periods, remaining active longer than usual while waiting for ACK that never arrived. This behavior led to increased radio-on time and accelerated battery depletion, a tactic commonly used in energy-draining attacks. The simulation spanned three hours, during which power consumption data was collected from ten motes to evaluate the impact of the wormhole attack on their energy profiles.
  • Externally Generated Legitimate Request Attack: This third attack type resembles barrage attacks where victim nodes are overwhelmed by a high volume of valid, seemingly benign requests. This scenario involved six motes, split evenly between victim and normal operation roles. The motes ran the Sky-websense application within ContikiOS, while an external Java program orchestrated periodic communications at randomized intervals to simulate legitimate requests that kept victim motes awake, thereby accelerating battery depletion. This setup was constrained by computational and simulation limits but was instrumental in capturing the nuanced behavior of legitimate request flooding attacks.
The prepared dataset contains four classes with the following distribution: Class 0 (non-compromised motes): 25,773 instances; Class 1 (UDP-flood attack victims): 12,981 instances; Class 2 (wormhole-attack victims): 12,959 instances; and Class 3 (externally generated legitimate-request attack victims): 6312 instances. The class imbalance is attributed to the fact that non-compromised motes were present in all three attack simulations. While the UDP-flood and wormhole attacks generated a comparable number of records, the externally generated legitimate-request attack produced fewer instances due to external-thread management constraints and the simulator’s limited capacity to handle a large number of concurrent threads, which restricted the number of nodes in that simulation.
After simulations were completed, all collected data were consolidated into a single CSV file containing 58,025 records, with each record representing a node’s operational status over a duty cycle interval. This dataset was labeled to indicate whether each record corresponded to an attacked or benign state, facilitating supervised ML training. The dataset was partitioned into training and testing subsets using a 75-25 split, ensuring that the models were evaluated on unseen data for unbiased performance assessment.

3.2. Dataset Features and Their Advantages

Once the dataset was prepared, it included ten power-related features that collectively describe the comprehensive energy-consumption profile of each mote during each duty-cycle interval. These features capture both cumulative and interval-specific power usage across multiple hardware states and activities, including CPU operation, low-power modes, transmission, and listening (both active and idle). Table 2 provides a summary of these features and their descriptions.

3.3. Machine Learning Model Development and Evaluation

Following the creation and preparation of the custom IoT attack dataset, the next phase of this research focused on the development and evaluation of various supervised ML models for intrusion detection. Given the labeled nature of the dataset, supervised classification algorithms were chosen to categorize each instance into one of four classes: normal operation, UDP-flood attack, wormhole attack, or externally generated legitimate-request (barrage) attack.
Prior to model construction, a correlation analysis was performed to determine the relationships between the features and the target variable. This step is essential in the ML process, as it provides an initial understanding of the data and identifies which features are most closely related to the target variable. In this analysis, the correlation ratio ( η 2 ) was employed to quantify the strength of each numerical feature in relation to the nominal target attribute. A value closer to 1.0 indicates a stronger predictive relationship. The results, as shown in Table 3, indicated that features such as idle_listen and all_transmit exhibited high correlation, while others, such as transmit, showed weaker correlation. Despite these variations, all models were trained on the complete feature set, and their satisfactory performance demonstrates that they successfully identified complex, non-linear patterns and feature interactions that a straightforward correlation analysis could not capture.
All experiments used only the ten numerical power-related features that represent node energy consumption behavior. These features were standardized using a StandardScaler fitted on the training split, and the same transformation was applied to the validation and test sets as well. Standardization was applied only to models sensitive to feature magnitude, namely Logistic Regression, SVM, KNN, ANN, and RNN, while tree-based models (Decision Tree and Random Forest) were trained on the raw feature values, as their split-based learning process is invariant to scaling. For the Recurrent Neural Network (RNN) model, the same ten power-related features were reshaped into fixed-length temporal sequences to capture time-dependent variations, as described in the corresponding RNN subsection.
Both linear (Logistic Regression and SVM) and non-linear (Decision Tree, Random Forest, K-Nearest Neighbors, ANN, and RNN) models were developed to identify DoSl attacks. Hyperparameter tuning for all models was performed using Bayesian optimization with the Tree-Structured Parzen Estimator (TPE) implemented in Optuna, where the macro-averaged F1-score under cross-validation served as the optimization objective. Ten-fold stratified cross-validation was used for traditional ML models, while a 3-fold scheme was adopted for the ANN and a time-aware 3-fold approach for the RNN to accommodate computational and sequential constraints. The dataset was divided into training (75%) and test (25%) partitions using stratified sampling to preserve class proportions, and all random operations were performed with a fixed seed of 42 to ensure reproducibility. Model implementations were based on the scikit-learn library for classical algorithms and TensorFlow for deep-learning models.

3.3.1. Logistic Regression

Logistic Regression was used as the baseline linear model for detecting DoSl attacks. Hyperparameters were tuned using the same Optuna-based Bayesian optimization procedure described earlier in Section 3.3. The model served as a linear reference classifier for comparing the performance of more complex non-linear algorithms.
During optimization, several parameters were explored, including the regularization type (L1 or L2), solver method (saga or lbfgs), inverse regularization strength (C), tolerance (tol), and class weighting. Optuna identified the best setup as an L2 penalty with the lbfgs solver, where C = 965.9184 , tol = 1.9 × 10 5 , class_weight = None, and max_iter = 3000. This configuration represents light regularization with a fine tolerance level, allowing the solver to reach an accurate minimum and maintain good generalization on unseen data.
The tuned model reached a test accuracy of 96.42% on the held-out validation set. This shows that even a simple linear approach like Logistic Regression can separate power-consumption patterns linked to normal and attack behaviors effectively. With proper tuning and regularization, Logistic Regression remains a strong and lightweight baseline for detecting DoSl attacks in IoT systems with limited computing resources.

3.3.2. Support Vector Machine (SVM)

After establishing Logistic Regression as the baseline, Support Vector Machine (SVM) classifiers were developed to evaluate their ability to capture both linear and non-linear relationships within the dataset. Hyperparameters were tuned using the same Optuna-based Bayesian optimization procedure described earlier in Section 3.3. To enhance computational efficiency, a Successive-Halving pruner was employed to terminate less-promising trials early.
The tuning process explored different kernel types, regularization strengths (C), and kernel coefficients ( γ ). The optimal configuration selected by Optuna used an RBF kernel with C = 194.9488 , γ = 0.6393 , class_weight = balanced, tol = 1 × 10 3 , and max_iter = 100,000. The large C enforced a stricter decision boundary that correctly classified more samples, while the moderate γ produced a smoother boundary that reduced over-fitting. The balanced class weighting further improved fairness between majority and minority classes.
When evaluated on the held-out 25% portion of the dataset, the optimized SVM achieved an accuracy of 98.32%. These results confirm that the RBF kernel, tuned through TPE-based optimization, effectively captured non-linear patterns in power-consumption features and delivered strong, stable performance. Consequently, SVMs can be considered an efficient and reliable approach for detecting DoSl attacks in resource-constrained IoT environments.

3.3.3. K-Nearest Neighbors (KNN)

The K-Nearest Neighbors (KNN) algorithm was examined for its non-parametric ability to classify unseen samples based on their similarity to nearby instances within the feature space. Hyperparameters were tuned using the same Optuna-based Bayesian optimization procedure described earlier in Section 3.3, ensuring that the model gave balanced consideration to all attack categories during learning.
Because KNN does not rely on iterative solvers, its training process is computationally lighter than that of Logistic Regression or SVM. However, the model remains sensitive to hyperparameter selection. A Median Pruner was therefore applied to stop unpromising trials early, improving efficiency by focusing on configurations that showed higher intermediate validation scores.
The search space included the number of neighbors (k), distance metric, and weighting scheme. The best configuration obtained k = 5 , weights = distance, and metric = cosine. This setup allowed closer neighbors to exert greater influence while using angular distance to capture similarities in feature trends rather than absolute magnitudes, enhancing class separation. The optimized KNN model achieved an overall accuracy of 97.33% on the held-out 25% test set, indicating that proximity-based learning effectively leveraged the natural clustering of attack categories for detecting DoSl behavior in constrained IoT environments.

3.3.4. Decision Tree (DT)

The Decision Tree (DT) classifier was explored as a non-linear model valued for its transparency and interpretability, achieved through a hierarchical, rule-based structure that maps feature conditions to class outcomes. Hyperparameters were tuned using the same Optuna-based Bayesian optimization procedure described earlier in Section 3.3 to maintain consistency with the preceding models and ensure balanced performance across all attack classes.
The search space included the splitting criterion, splitter strategy, maximum tree depth, minimum sample requirements for node splitting and leaf creation, number of features considered per split, class weighting, and the cost-complexity pruning parameter (ccp_alpha). This comprehensive search helped maintain a reasonable balance between model complexity and generalization capability.
The optimal configuration selected by Optuna was criterion = gini, splitter = random, max_depth = 40, min_samples_split = 2, min_samples_leaf = 2, max_features = None, class_weight = None, and ccp_alpha = 0.0. The random splitter introduced controlled stochasticity that reduced deterministic bias, while the moderate depth and small sample thresholds enabled the model to capture relevant feature interactions without excessive overfitting. On the held-out 25% test split, the optimized Decision Tree achieved an overall accuracy of 97.86%. These results suggest that the Decision Tree can effectively identify hierarchical relationships in power-consumption features and may serve as a practical and interpretable baseline for detecting DoSl attacks in IoT environments.

3.3.5. Random Forest (RF)

Building on the Decision Tree baseline, the Random Forest (RF) classifier was developed to strengthen predictive performance and mitigate overfitting through ensemble learning. The algorithm constructs multiple trees using bootstrap samples and random feature subsets, then aggregates their outputs to achieve better generalization across high-dimensional data. Hyperparameters were tuned using the same Optuna-based Bayesian optimization procedure described earlier in Section 3.3 to ensure consistent evaluation across models.
The search space covered criterion, n_estimators, max_depth, min_samples_split, min_samples_leaf, max_features, ccp_alpha, bootstrap, and class_weight. Optuna identified the best configuration as criterion = log_loss, n_estimators = 410, max_depth = 29, min_samples_split = 10, min_samples_leaf = 7, bootstrap = True, ccp_alpha = 0.0, max_features = 0.8431, and class_weight = balanced. The log_loss criterion improved probabilistic calibration, while the intermediate depth and ensemble size offered a trade-off between capacity and speed. Smaller sample thresholds regularized splits, and feature subsampling increased diversity and stability across trees.
On the held-out 25% test set, the optimized model achieved 98.57% accuracy. The close agreement between cross-validation and test results indicates stable generalization. These findings suggest that the Random Forest effectively leverages ensemble diversity and calibrated node splitting to provide reliable DoSl detection within constrained IoT environments.

3.3.6. Artificial Neural Networks (ANN)

A feed-forward Artificial Neural Network (ANN) was developed to explore the potential of deep learning for detecting DoSl attacks. Prior studies have demonstrated the suitability of ANNs for anomaly detection in constrained IoT environments, including applications within the Internet of Medical Things (IoMT) [32]. In this work, the ANN was designed to achieve a balance between representational capacity and computational efficiency, maintaining a lightweight yet expressive architecture capable of learning non-linear dependencies in power-consumption patterns.
For the Artificial Neural Network (ANN), hyperparameter tuning followed the same Optuna-based Bayesian optimization framework described earlier in Section 3.3, but with adjustments to suit the model’s higher computational cost. A 3-fold stratified cross-validation scheme was adopted instead of the 10-fold setup used for the traditional ML models to maintain computational feasibility. The macro-averaged F1-score remained the same as the optimization objective, ensuring balanced learning across all classes. A Hyperband pruner was used to terminate underperforming trials early, while Early Stopping halted training when validation performance plateaued for ten epochs. This configuration improved efficiency and stability, leading to consistent convergence across folds.
The search space covered both architectural and training parameters, including the number of hidden layers, neurons per layer, activation functions, the use of Batch Normalization, dropout rate, L2 weight regularization, optimizer type, learning-rate schedule, batch size, and training epochs. The best configuration identified by Optuna featured two hidden layers with 1024 and 256 neurons, ReLU activation, Batch Normalization between layers, a dropout rate of 0.078, L2 regularization = 0.0018, the Nadam optimizer, a learning rate of 0.00249, a cosine learning-rate schedule, a batch size of 512, and 130 epochs. On the held-out 25% test set, the model achieved an accuracy of 96.65% and a macro F1-score of 98.22 ± 0.39 %. These results suggest that a compact and well-regularized ANN can effectively learn complex power-consumption relationships, providing a strong foundation for future extensions toward deeper or recurrent architectures in IoT security.

3.3.7. Recurrent Neural Network (LSTM)

To capture temporal dependencies in node-level power consumption, a Recurrent Neural Network (RNN) based on Long Short-Term Memory (LSTM) units was developed. The gated-cell architecture of LSTMs enables them to model sequential variations in IoT energy traces, where attack behavior evolves over time. Auxiliary attributes such as clock_time, Mote ID, and seqno were used only for preprocessing (chronological sorting, node grouping, and tie-breaking) and not as direct model inputs. Sliding-window sequences of 32 time steps (stride = 4) were generated for each node, corresponding to a 160-s observation window at a 5-s sampling rate. The final dataset comprised 14,418 samples of shape (32, 10), divided chronologically into training (10,092), validation (2163), and test (2163) subsets. Features were standardized using statistics from the training split, and class weights were applied to mitigate class imbalance.
Hyperparameter optimization was performed in Optuna using Bayesian search with the Tree-Structured Parzen Estimator (TPE), employing a 70/15/15 chronological split per trial and optimizing the mean macro F1-score. Two early-termination strategies improved efficiency: a Hyperband pruner operating at the trial level through the TFKerasPruningCallback (monitoring validation loss) and Early Stopping within training (patience = 10, with automatic weight restoration). These mechanisms minimized redundant computation and prevented overfitting during the multi-trial search process.
The search space included both architectural and training hyperparameters: the number of units in the first LSTM layer { 32 , 64 , 96 , 128 , 192 } , optional bidirectionality and dropout [0, 0.5]; the presence or absence of a second LSTM layer with the same parameter options or a GlobalAveragePooling1D layer; dense head layer size { 0 , 32 , 64 , 128 , 256 } with dropout [0, 0.5]; optimizer types { Adam , Nadam , RMSprop } ; learning rates in [ 10 4 , 10 2 ] (log scale); batch sizes { 64 , 128 , 256 , 512 } ; and epochs ranging from 30 to 120. The best configuration selected by Optuna used: batch size = 64, epochs = 120, first LSTM layer = 128 units (dropout = 0.372, unidirectional), second LSTM layer = 96 units (dropout = 0.251, unidirectional), dense layer = 256 units (dropout = 0.021), and the Nadam optimizer (learning rate = 0.0018). This setup achieved a strong trade-off between model capacity, regularization, and computational cost. On the held-out 15% test set, the optimized LSTM achieved an overall accuracy of 97.92%, confirming that a compact time-aware recurrent model can effectively learn sequential dependencies in power-trace data and serve as a viable method for DoSl detection in constrained IoT networks.

4. Results and Evaluation of the Developed Models

In the previous section, the ML models that have been designed in this research were analyzed separately. During this process, a significant effort was put into preparing a dependable dataset before these models were built. This data was divided into four different classes, and it included the data of victim and non-victim nodes in power depletion attacks. The procedure of generating the datasets was based on a simulator to reproduce several scenarios of power exhaustion. Nonetheless, the simulator had a few difficulties, especially in simulating the externally generated legitimate request attack. It was challenging to synchronize with the predefined time intervals of the external Java program, and controlling a number of external threads was challenging as well. However, the simulation process was effective in producing an adequate amount of data that pertained to three key types of attacks. This also meant that the dataset was deemed strong enough to be used to train ML models to identify DoSl attacks in IoT settings.

4.1. Classification Accuracy and Overall Performance

Having established that the simulated dataset was sufficient and reliable for training, the next step involved evaluating its effectiveness across multiple machine-learning classifiers. In this research, seven models were trained and tested on the processed dataset: Logistic Regression, Support Vector Machine (SVM), K-Nearest Neighbors (KNN), Decision Tree, Random Forest, Artificial Neural Network (ANN), and a Recurrent Neural Network (RNN) based on Long Short-Term Memory (LSTM) units. Table 4 lists the optimal hyperparameter settings obtained through automatic tuning with Optuna for each model, together with their accuracies on the held-out 25% test set and during cross-validation. All traditional ML models used 10-fold stratified cross-validation, while the ANN and LSTM models used 3-fold validation to balance computational cost and reliability. This ensured a fair and consistent basis for comparison among all classifiers.
During k-fold validation, the set of data is split into k equal subsets, with (k − 1) of them being used in the training process, with the remaining subset being used in the validation process, and this is repeated k times. The average of the folds gives a more stable measure of the performance of the model on unexplored data. As indicated by Table 4, there is a small difference between the test and cross-validation in all models, implying that they generalize well. Based on the updated results, one can observe that the highest accuracies of all the classifiers compared were obtained with the Random Forest, SVM using the RBF kernel, and the deep-learning model (LSTM). The Random Forest achieved the most overall performance with 98.57% on the held-out test set and 98.65% on 10-fold cross-validation. This high performance is a result of its ensemble nature, as it combines various decision trees, as a result of which non-linear and linear relationships are captured among the ten features that power is related to. The averaging process in a series of randomized trees minimizes the variance and avoids over-fitting, and the model can generalize well even in more complex and imbalanced operating conditions.
The SVM with an RBF kernel also delivered competitive results, achieving 98.32% test accuracy and 98.39% under cross-validation. These scores indicate the presence of non-linear interactions in the dataset that are effectively captured by the RBF kernel’s smooth decision boundaries. The Random Forest and SVM (RBF) together show that ensemble and kernel-based methods are particularly well suited for modelling the complex relationships between power-consumption behavior and attack states in constrained IoT environments.
Among the DL models, the ANN achieved a test accuracy of 96.65% and ( 98.22 ± 0.39 ) % under 3-fold validation, while the LSTM reached 97.92%. For the ANN, the “±” term represents the standard deviation across the three validation folds. To ensure deterministic and reproducible outcomes, all random seeds were fixed to 42 across Python (version 3.1.1), NumPy (version 2.3.3), and TensorFlow (version 2.20.0). Deterministic TensorFlow operations (TF_DETERMINISTIC_OPS = 1) and single-thread execution were used to eliminate nondeterministic execution order. Minor variations between runs are expected in neural-network training due to random weight initialization, mini-batch ordering, dropout masking, and hardware-level randomness. Hence, the reported variability represents the ANN’s intrinsic robustness and reproducibility.
In contrast, the LSTM was not evaluated using random k-fold cross-validation because its sequential input windows (32 steps with a 20-s stride) must preserve temporal order. Randomly shuffling time-ordered samples across folds would introduce temporal leakage, allowing future information to influence earlier predictions. So, a chronological data split (70% training, 15% validation, 15% testing) was used to maintain temporal integrity. The LSTM training process was run three times with random seeds (42,43,44) to estimate the accuracy of the test, and the mean and standard deviation over the three runs were reported.
In general, the findings indicate that ensemble-based and deep-learning models offer a high accuracy and stable detection. The overall accuracy of the Random Forest was highest with the SVM (RBF) coming in second, with the ANN and LSTM also performing quite well with a higher ability to capture complex, non-linear, and temporal effects in node-level power consumption.

4.2. F1-Score and Class-Wise Evaluation

Having analyzed the general accuracy of both ML and DL models, the next focus was to evaluate model behavior under class imbalance. As discussed in the dataset development section, the dataset contained four traffic classes with unequal sample sizes. It was therefore important to ensure that this imbalance did not disproportionately affect model performance. Table 5 presents the F1-scores for each class across all models, providing a balanced measure of reliability and recall for every traffic category.
The F1-score was used as the main evaluation metric because it offers a fairer assessment of detection capability when certain traffic classes occur more frequently than others. Unlike overall accuracy, which may be inflated by dominant normal traffic, the F1-score combines precision and recall into a single harmonic mean, reflecting both accurate detection and coverage of minority attacks. Precision measures the proportion of correctly identified attacks among all predicted attacks, while recall indicates the proportion of actual attacks detected.
A high F1-score represents a good balance between these two metrics, whereas a low value signals either frequent false alarms or missed detections. Thus, this measure provides a more trustworthy indication of overall model reliability when class distributions are uneven.
As shown in Table 5, the lowest F1-score observed among all models and classes was 94.69% for the Wormhole-attack class in the ANN model. This result indicates that class imbalance did not significantly degrade performance. Although the dataset contained fewer samples for some attacks, each class provided enough data for successful learning and generalization. The F1-scores were consistently high across all models and classes, confirming that the classifiers could distinguish both majority and minority attack behaviors with minimal bias.

4.3. Receiver Operating Characteristic (ROC) Analysis

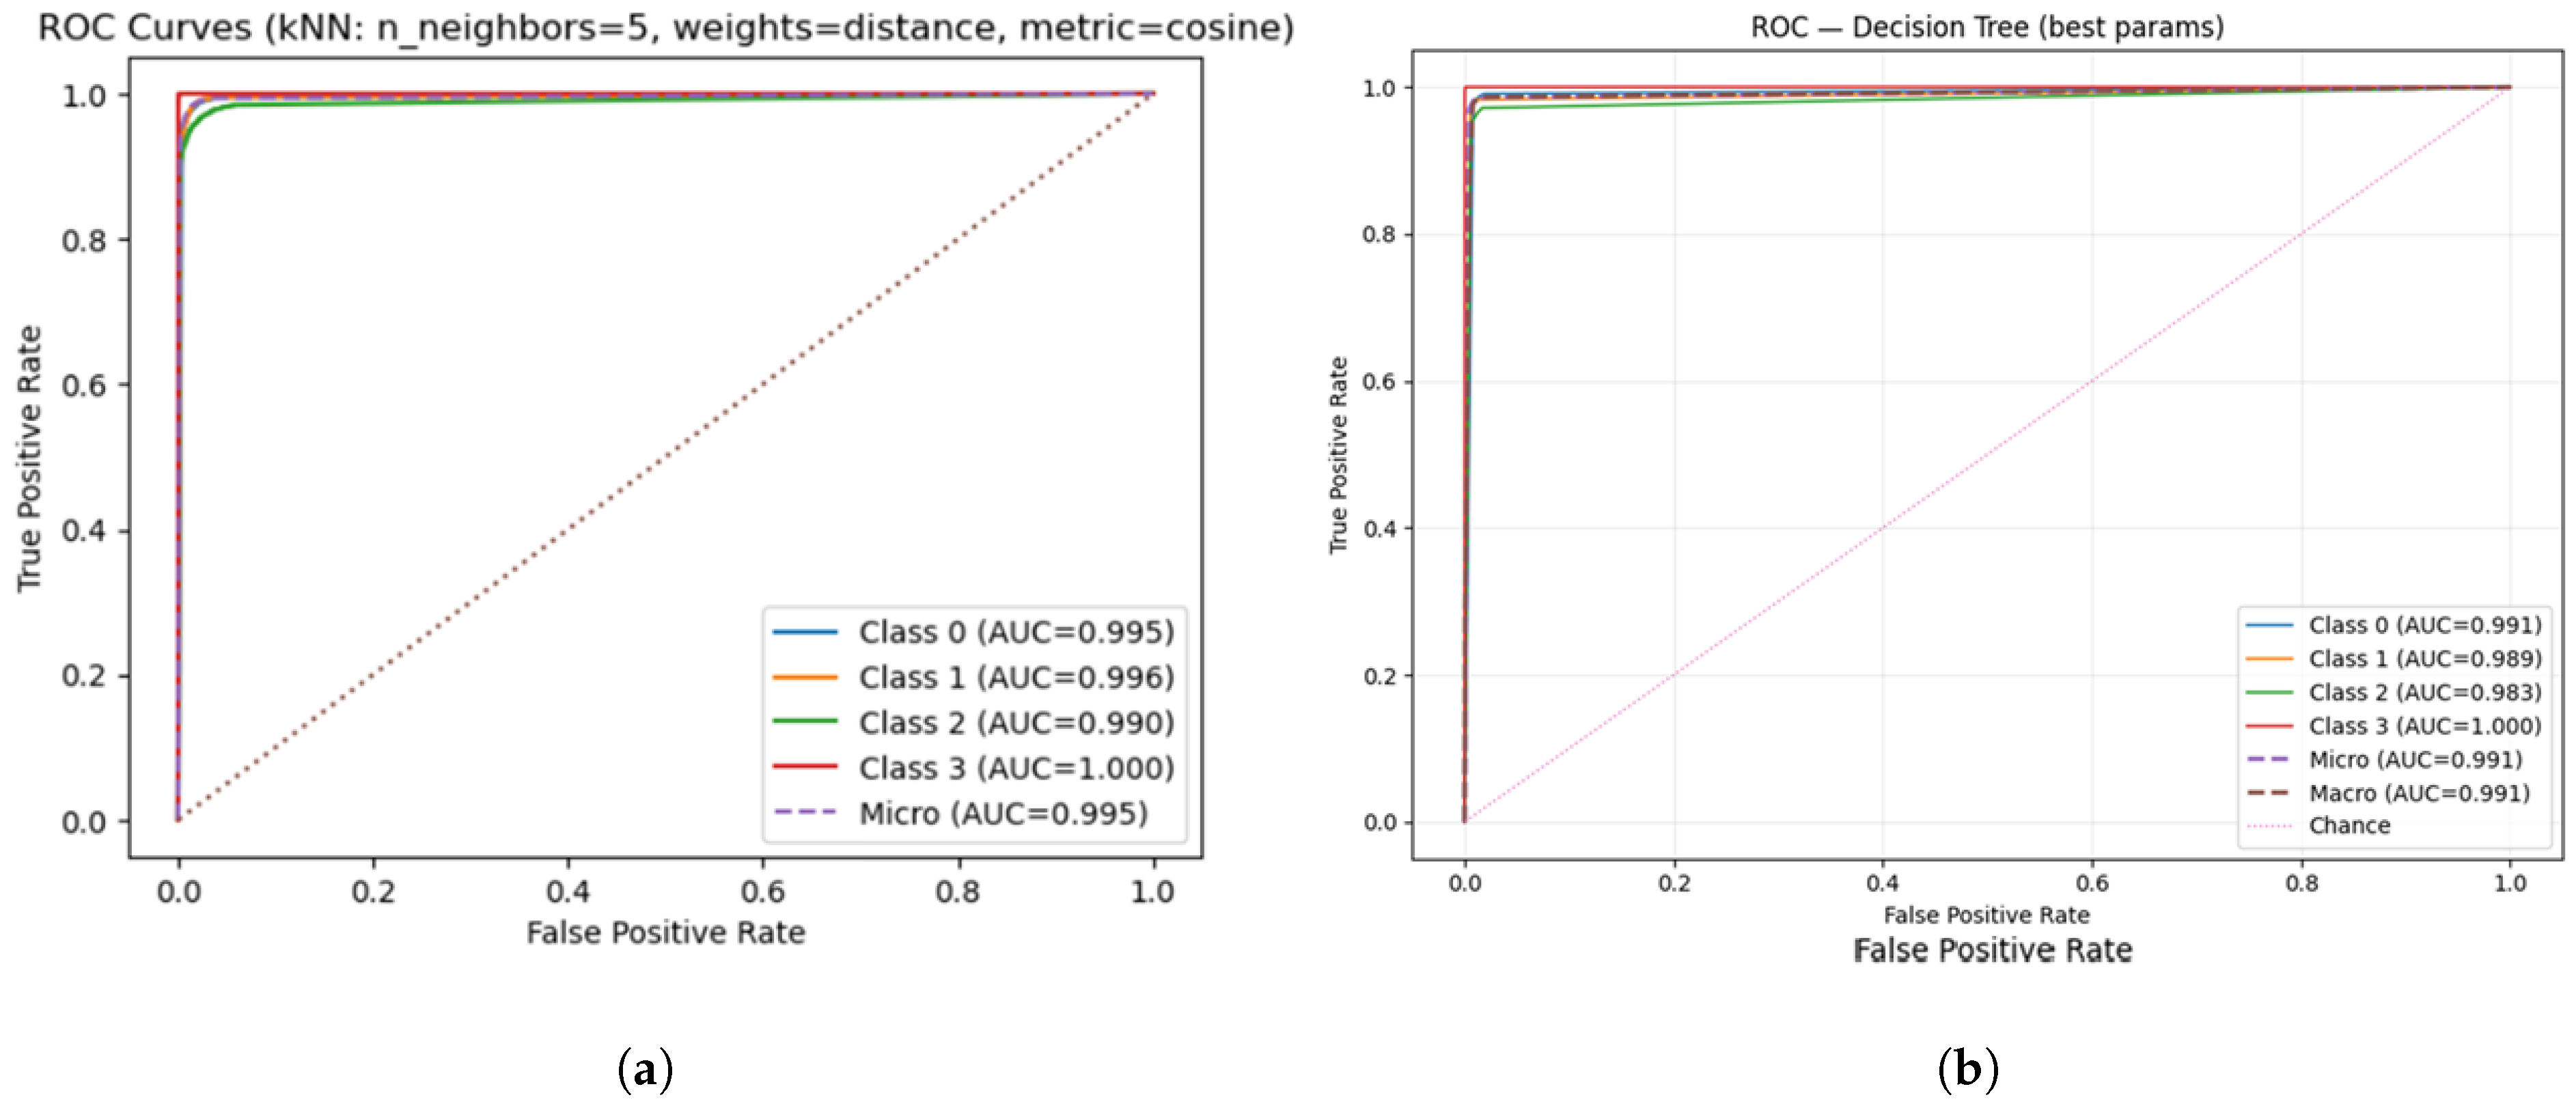
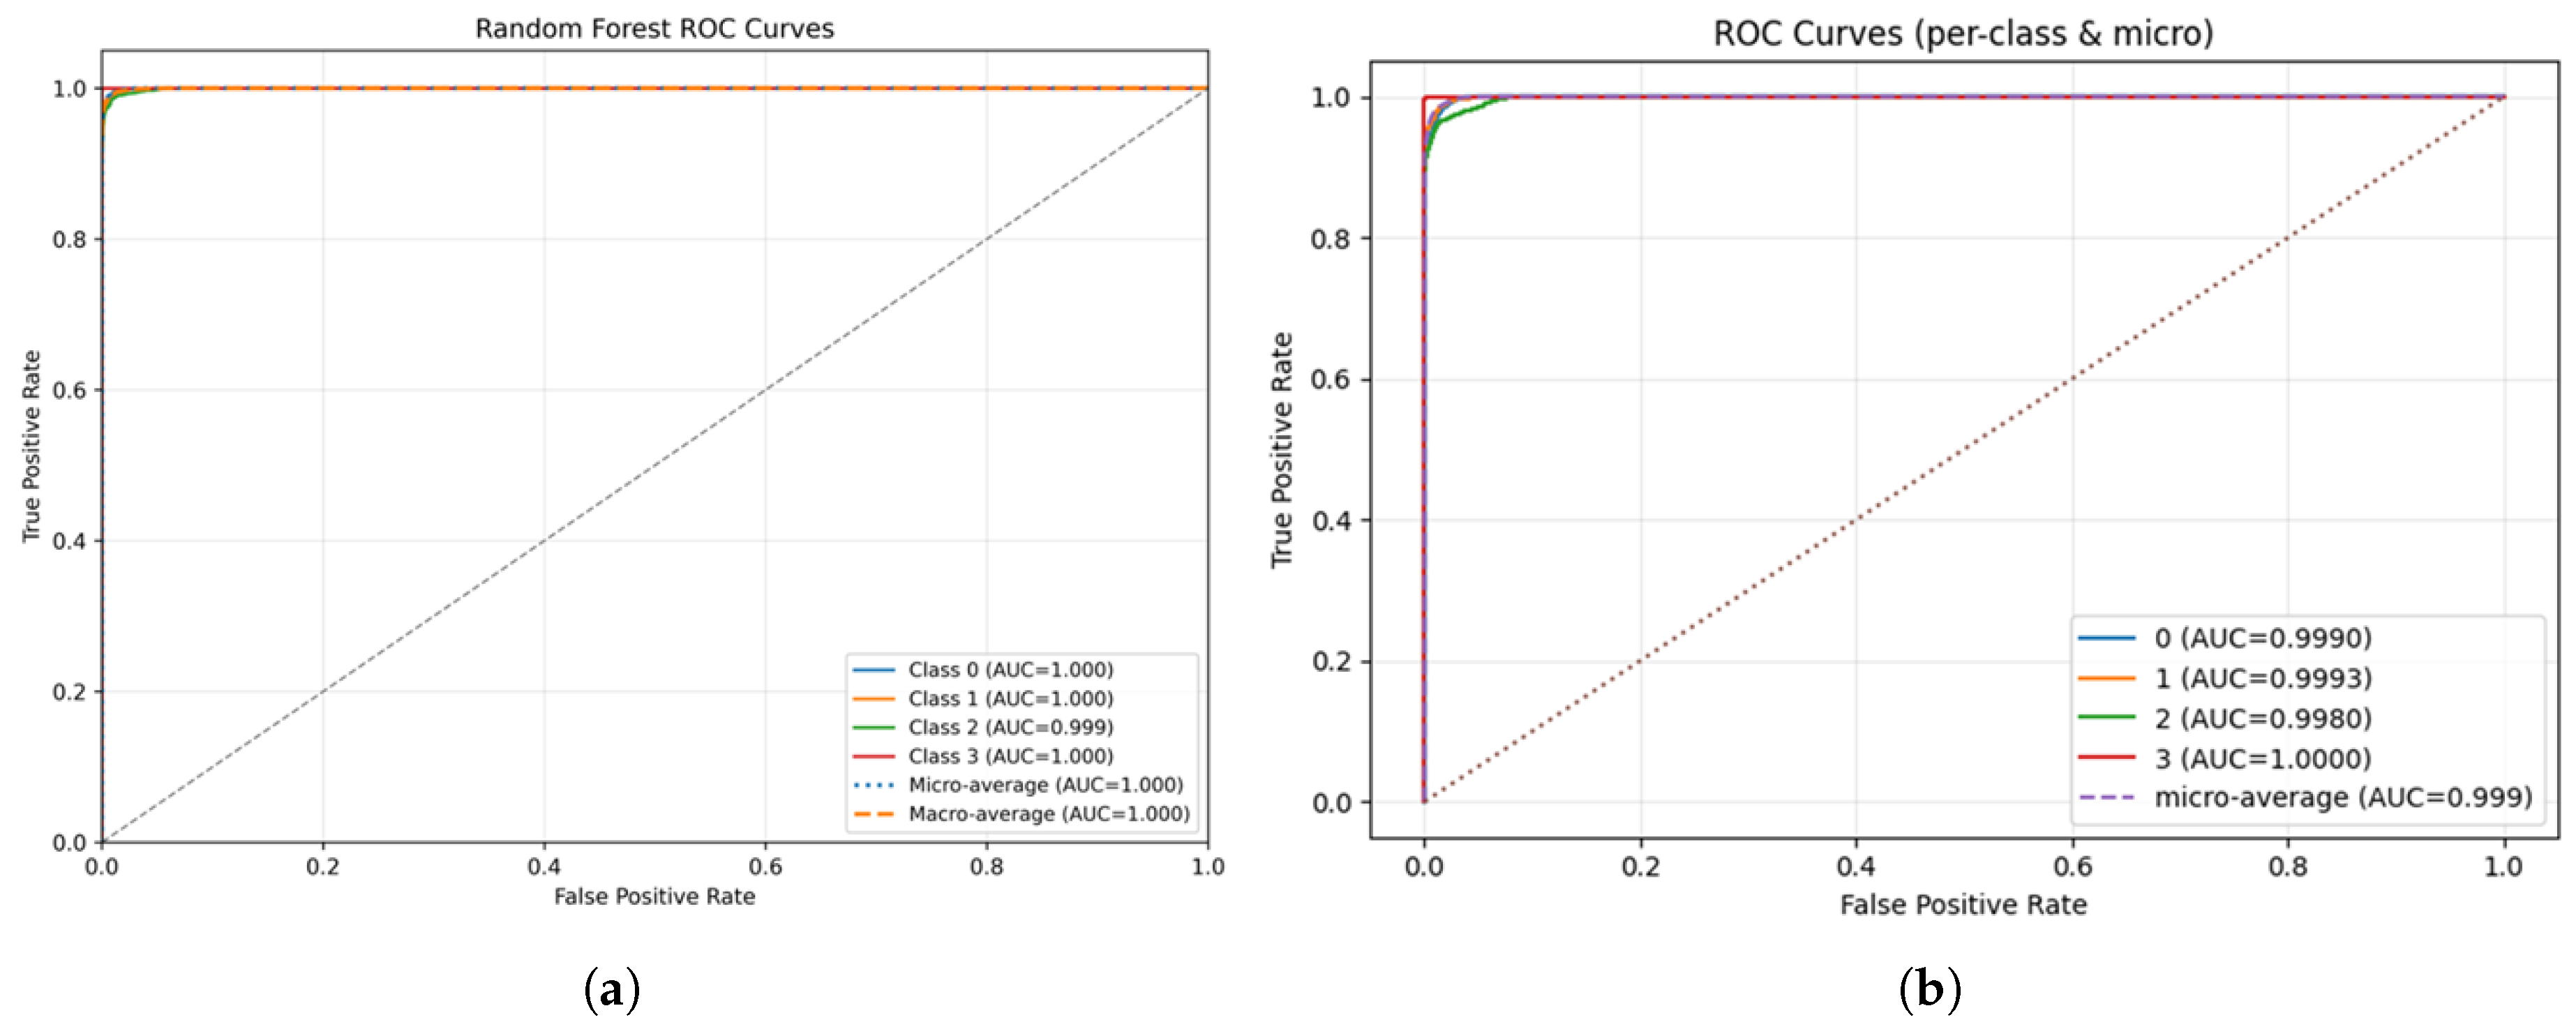
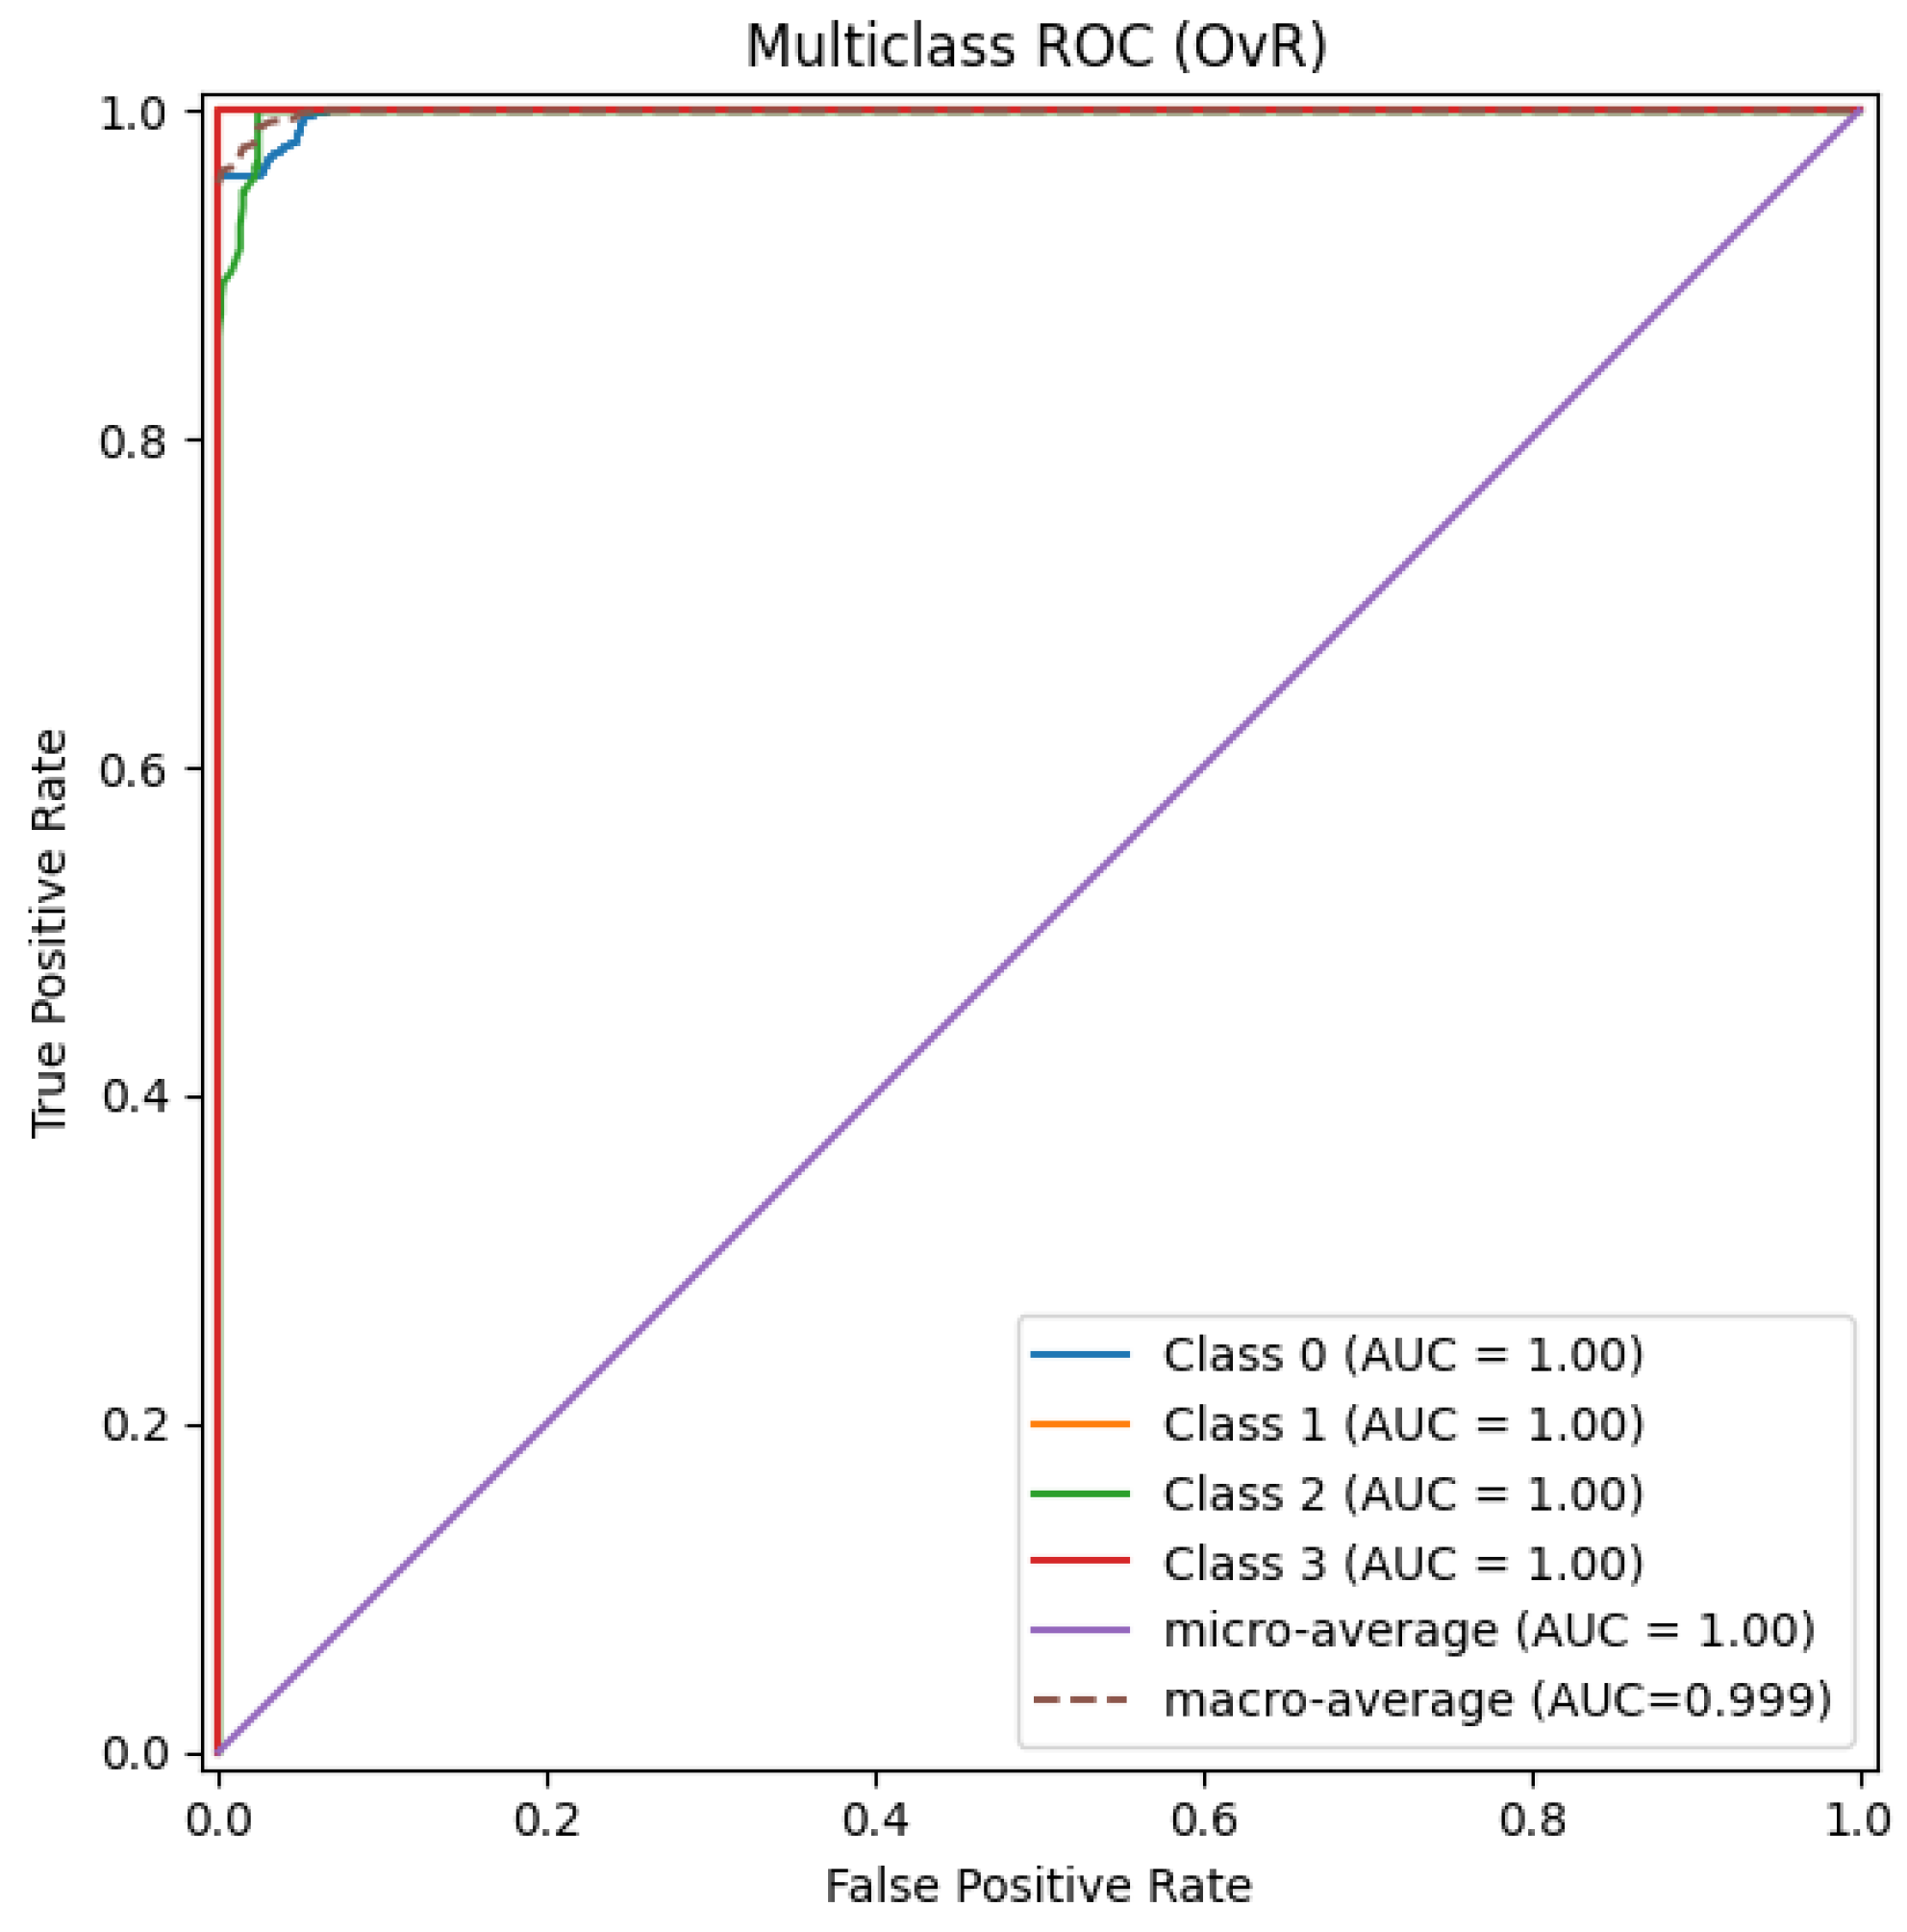
In order to test the discriminative capabilities of the developed models, Receiver Operating Characteristic (ROC) analysis was performed after benchmarking the classifiers using accuracy and F1-score metrics. Each ROC curve was constructed by comparing the True Positive Rate (TPR) and False Positive Rate (FPR) across a range of decision thresholds. This visualization helps illustrate how effectively a model separates attack traffic from normal traffic at different sensitivity levels. The overall discrimination is summarized using the Area Under the Curve (AUC), where values near 1.0 indicate excellent performance and 0.5 corresponds to random guessing.
Although ROC analysis is inherently binary, a One-vs-Rest (OvR) approach was adopted to extend it to the multi-class scenario. In this scheme, each attack type was treated as the positive class in turn, with all remaining classes considered negative. The resulting per-class and micro-average AUC values provide a comprehensive picture of each model’s discriminative performance across all traffic categories.
Figure 1 presents the ROC curves for Logistic Regression and SVM (RBF), while Figure 2 presents the ROC curves for K-Nearest Neighbors (KNN) and Decision Tree models. All four classifiers demonstrated strong discrimination, with most AUC values exceeding 0.98, confirming clear separation between normal and attack traffic. The SVM (RBF) and Logistic Regression models showed a slight drop in one class but still maintained well-above-average performance.
Figure 3 illustrates the ROC results for the Random Forest and Artificial Neural Network (ANN), while Figure 4 represents the ROC curve for the Recurrent Neural Network (RNN) models. These advanced classifiers achieved near-perfect separation, with micro-averaged AUC values approaching 1.00. Their ensemble and DL architectures enabled better generalization, lower false-positive rates, and consistently high true-positive detection across all DoSl attack types.

4.4. Temporal Split Evaluation and Model Generalization

To further validate model generalization of the developed models and minimize potential temporal correlations between training and testing data, the dataset was divided chronologically into separate training and testing files. The first two hours of each simulation were used for training and validation, while the final hour served as the test set. This temporal split ensured that models were evaluated on entirely unseen data, closely reflecting a realistic IoT deployment scenario where an intrusion detection system must detect new attack events after being trained on past behavior. The training data contained 38,852 records, and the temporally independent test set included 19,173 records.
For the RNN model, the same temporal partition was applied using time-ordered sequences. During CSV export, a small number of entries were accidentally excluded, producing 38,852 training and 19,142 test samples. This difference, less than 0.2% of the dataset, was uniformly distributed across classes and had no measurable impact on balance, evaluation, or comparability. All models were retrained and re-evaluated under this temporal configuration using the same hyperparameters optimized in the earlier random-split experiments.
To confirm that previous near-perfect results were not influenced by record overlap, all classifiers were re-assessed using this temporal partition. The updated results are summarized in Table 6. Compared with the earlier random 75/25 split, classical models showed moderate reductions in accuracy and F1-macro scores, indicating that their earlier performance was partly affected by temporal correlation among adjacent samples.
Under this configuration, Logistic Regression achieved 87.0% accuracy (F1-macro = 0.84), while Decision Tree and Random Forest achieved 84.4% and 76.0%, respectively. In contrast, the neural models maintained strong performance: the ANN reached 96.4% and the RNN achieved 96.9% accuracy, both with F1macro above 0.96. These results confirm that neural architectures exhibit better temporal generalization and stability compared to traditional classifiers.
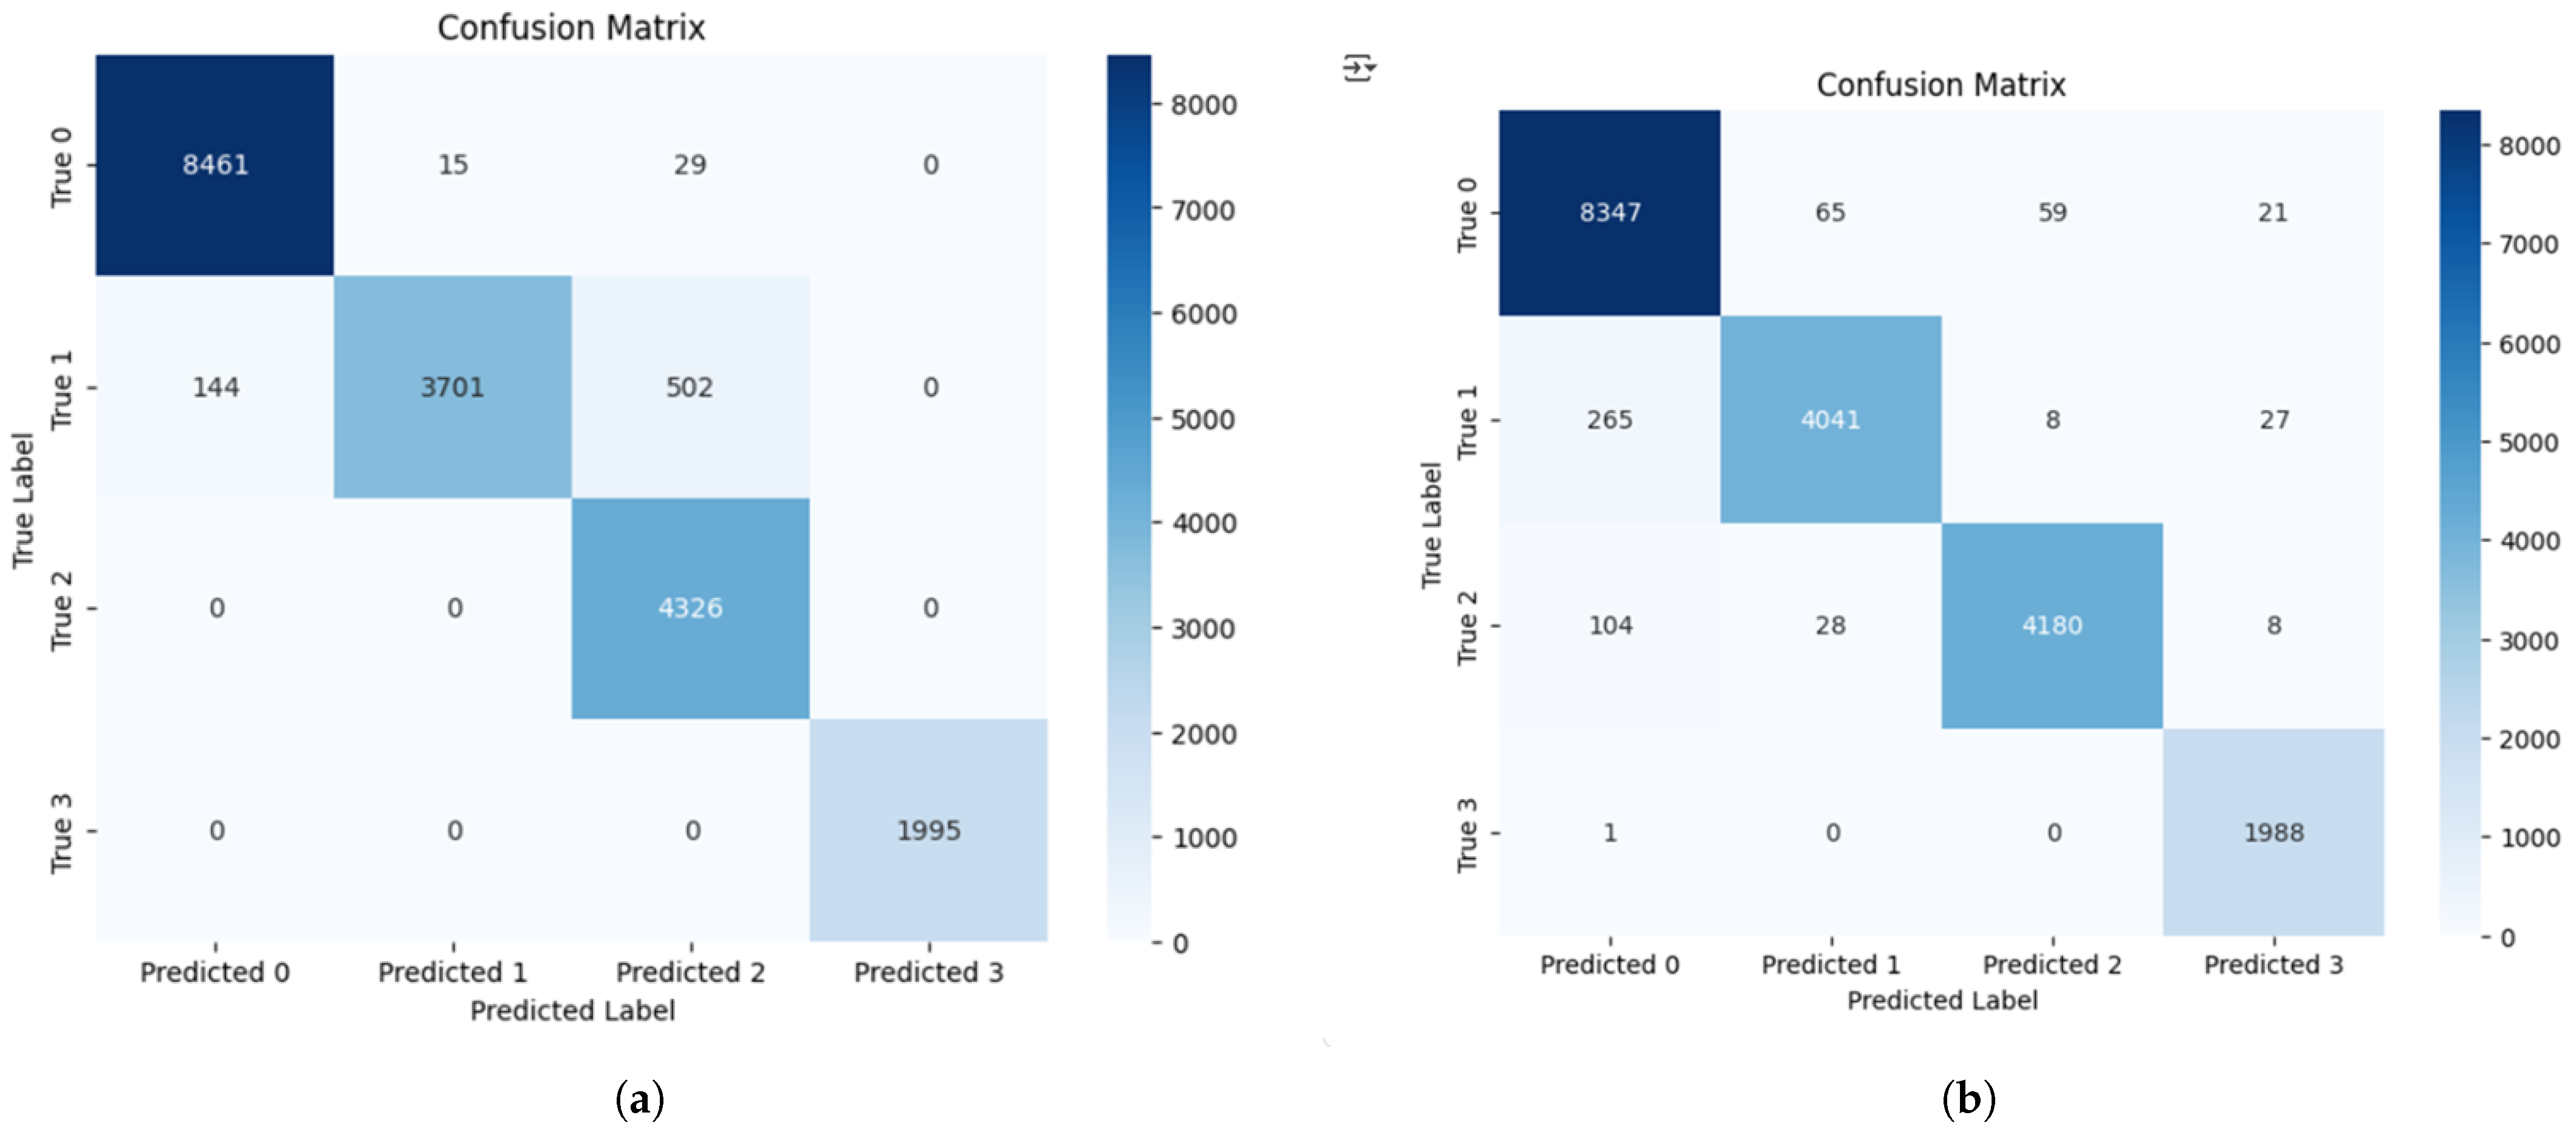
Figure 5a,b present the confusion matrices for the ANN and RNN models under this temporal split. Both networks achieved high recall across all four classes, with most misclassifications occurring between the UDP Flood (Class 1) and Wormhole (Class 2) attacks, which share partially overlapping power-consumption profiles. The Normal (Class 0) and Externally Generated Legitimate Request (Class 3) classes were almost perfectly recognized. Overall, the temporal evaluation demonstrates that the neural models effectively capture sequential dependencies in node power traces, enabling accurate detection of evolving attack behaviors over time.

4.5. Ablation on Cumulative Energy Counters

To evaluate how much of the previously reported high accuracy was influenced by cumulative Powertrace counters, an additional ablation experiment was conducted. Powertrace records both instantaneous and cumulative measures (all_cpu, all_lpm, all_transmit, all_listen, and all_idle_listen), which represent total energy consumed in each state since device boot. Although these cumulative features accurately describe overall node energy use, their monotonically increasing nature can introduce temporal correlation between consecutive samples, reducing statistical independence between training and testing data.
To remove this confounding effect and isolate genuine behavioral patterns, all cumulative attributes were excluded. Only instantaneous power-state variables describing per-interval activity were retained. The models were retrained using the same temporal configuration (first two hours for training and the final hour for testing) and with identical tuned hyperparameters. This provided a stricter assessment of each classifier’s ability to learn real energy-consumption dynamics relevant to DoSl attacks.
As summarized in Table 7, excluding the cumulative features led to a noticeable drop in accuracy for most classical and feed-forward models, confirming that those features contributed to earlier near-perfect results. However, the LSTM-based RNN maintained a strong accuracy of 91.1%, demonstrating that sequential modelling can effectively capture temporal energy-drain behavior even without cumulative information.

4.6. Feasibility and Resource Cost Considerations

To assess the practical deployability of the proposed models, their memory footprints were analysed to evaluate suitability for resource-constrained IoT environments. The serialized artefacts measured approximately 9.8 KB for Logistic Regression and Decision Tree, 7.3 MB for k-Nearest Neighbors, about 20 MB for Random Forest, and 3.22 MB for the Artificial Neural Network. These results indicate that only the Logistic Regression and Decision Tree models are lightweight enough to potentially execute on individual nodes, while the others are better deployed at an edge gateway or host device with higher processing and memory capacity.
In a practical implementation, the gateway may act as an overall monitor, doing inference on feature information at regular intervals sent by the motes. Each node would send a small feature vector of ten 32-bit values (approximately 40 B) with very little metadata (approximately 8 B) so that the application payload of a report is about 48 B. This represents about 13.5 KiB per node in a single day, easily within the communication bounds of a low-power duty-cycled network. Even though extra protocol stack overhead and retransmissions would bloat effective airtime, such volumes are small when compared to the bandwidth available.
To improve responsiveness, an adaptive reporting service could be implemented in which the gateway temporarily requests higher reporting rates upon detecting anomalies. This approach enables faster verification of potential attacks without permanently increasing communication cost. Importantly, nodes would still transmit only during scheduled wake periods or by piggybacking feature data on existing packets, avoiding unnecessary radio activity. While this mechanism was not implemented in the present work, it represents a promising direction for enhancing both responsiveness and energy efficiency in future deployments.
Overall, deploying the trained machine-learning models at the edge gateway while maintaining lightweight telemetry from motes is a feasible and energy-aware design choice. Future work will translate this conceptual architecture into a physical IoT testbed to empirically measure energy consumption, communication overhead, and detection latency using field-installed power-monitoring instrumentation alongside Contiki-NG Energest profiling.

5. Conclusions

This study has considered a set of ML and DL methods to detect DoSl attacks in IoT networks, with an emphasis on energy-efficient intrusion detection for constrained sensor devices. A key contribution of this study is the development of a new IoT-specific dataset that captures the power-consumption behavior of ContikiOS-based motes under both normal and energy-draining attack conditions. The dataset, generated using the COOJA simulator with the Powertrace tool, comprises 58,025 labeled records with ten power-related features describing CPU activity, transmission, listening, and low-power operation states. Three attack types, including UDP Flood, Wormhole, and externally generated legitimate-request (barrage-like) attacks, were simulated under diverse network conditions to enhance realism and variability.
Prior to dataset creation, several existing benchmark datasets, including NSL-KDD, UNSW-NB15, and CICIDS2017, were examined and found unsuitable for DoSl attack detection, as they lack energy-level telemetry or sleep-state indicators. More recent datasets, such as ToN-IoT, Bot-IoT, and IDSIoT2024, although comprehensive in traffic-based intrusion coverage, remain primarily packet or flow centric and omit device-level power information essential for identifying energy-depletion behaviors. Related studies have also explored energy-aware intrusion detection using lightweight ML and DL models in wireless sensor and NB-IoT environments. Meanwhile, TinyML-based frameworks have demonstrated real-time feasibility at the microcontroller level. However, these works have primarily concentrated on traffic or signal features rather than fine-grained power-state dynamics. This study advances that direction by integrating node-level power telemetry to enable multi-class, energy-focused intrusion detection that captures sleep-state disruptions in constrained IoT systems.
Using this dataset, multiple ML and DL models were trained and optimized through Bayesian hyperparameter tuning. Under the standard 75/25 split, the Random Forest and Decision Tree achieved accuracies of 98.57% and 97.86%, respectively, while the LSTM maintained 97.92% accuracy under a chronological split, confirming its ability to generalize over temporally disjoint data. These findings demonstrate that both ensemble and sequence-aware models perform strongly under simulated conditions in recognizing distinctive power-consumption signatures associated with DoSl attacks.
To further validate these results, the temporal-split evaluation protocol was applied: the first two hours of every simulation were used for training and validation, and the final hour was used for testing. This reduced temporal overlap and better represented real-world deployment conditions. Traditional classifiers such as Random Forest and Decision Tree showed lower accuracies (76.0% and 84.4%, respectively), confirming that earlier near-perfect results were influenced by data correlation. Conversely, neural-based models maintained high accuracy, and ANN and LSTM recorded 96.4% and 96.9%, signifying their ability to learn temporal variations in power-consumption curves and extrapolate to new time scales.
A feasibility study of model sizes and communication overheads found that smaller models (Logistic Regression and Decision Tree, each about 10 KB) can be implemented on constrained nodes, whereas larger models (Random Forest, ANN, and LSTM) are better suited for edge or gateway deployment. Compact feature vectors (approximately 48 B per node per report, about 13.5 KiB per day) remain within low-power network limits, and adaptive reporting could balance responsiveness and energy efficiency in future implementations.
Although the results are encouraging, they were obtained under simulated conditions. Real-world IoT deployments may introduce hardware variability, noise, and interference that could affect model stability. Future work will therefore develop a Contiki-NG testbed using low-power motes to gather empirical power-trace data, evaluate generalization, and measure inference cost. The dataset will be expanded with hybrid attack scenarios, and future models will explore TinyML-based on-device architectures.
In summary, this study contributes a realistic power-telemetry dataset and a comprehensive evaluation of energy-aware ML and DL methods for DoSl attack detection. The findings establish a strong simulation-based baseline and lay the groundwork for future testbed validation and scalable, edge-assisted intrusion detection frameworks for next-generation IoT environments.

Author Contributions

Conceptualization, I.D., H.D.W. and A.W.; methodology, I.D., H.D.W. and A.W.; software, I.D.; validation, I.D., H.D.W. and A.W.; formal analysis, I.D.; investigation, I.D.; resources, H.D.W. and A.W.; data curation, I.D.; writing—original draft preparation, I.D.; writing—review and editing, I.D., H.D.W. and A.W.; visualization, I.D.; supervision, H.D.W. and A.W.; project administration, H.D.W. and A.W.; funding acquisition, H.D.W. All authors have read and agreed to the published version of the manuscript.

Funding

This research received no external funding.

Data Availability Statement

The dataset generated and analyzed during this study is available on request from the corresponding author. The data are not publicly available now, as the research is part of an ongoing MPhil study. However, they will be made publicly available upon completion of the thesis.

Acknowledgments

During the preparation of this manuscript, the authors used Gemini (version Flash 2.5) and ChatGPT (version 5.0) for the purposes of refining language and grammar. The authors have reviewed and edited the output and take full responsibility for the content of this publication.

Conflicts of Interest

The authors declare no conflicts of interest.

Abbreviations

The following abbreviations are used in this manuscript:
IoTInternet of Things
DoSlDenial of Sleep
MLMachine Learning
DLDeep Learning
ROCReceiver Operating Characteristic
UDPUser Datagram Protocol
SMACKShort Message Authentication ChecK
WBANWireless Body Area Network
WSNWireless Sensor Networks
CoAPConstrained Application Protocol
mWmilliwatts
mJmillijoules
BSDBerkeley Software Distribution
lpmLow-Power Mode
LRLogistic Regression
SVMSupport Vector Machine
KNNK-Nearest Neighbors
DTDecision Tree
RFRandom Forest
ANNArtificial Neural Networks
LSTM    Long Short-Term Memory
RNNRecurrent Neural Network
IoMTInternet of Medical Things
TPRTrue Positive Rate
FPRFalse Positive Rate
AUCArea Under the Curve

References

  1. Haseeb, M.; Hussain, H.I.; Slusarczyk, B.; Jermsittiparsert, K. Industry 4.0: A Solution Towards Technology Challenges of Sustainable Business Performance. J. Open Innov. Technol. Mark. Complex. 2019, 5, 154. [Google Scholar] [CrossRef]
  2. Joglekar, S.; Kadam, S.; Dharmadhikari, S. Industry 5.0: Analysis, Applications and Prognosis. In Global Perspectives on the Next Generation of Service Science; IGI Global: Hershey, PA, USA, 2023; pp. 1–28. [Google Scholar]
  3. Pirretti, M.; Zhu, S.; Vijaykrishnan, N.; McDaniel, P.; Kandemir, M.; Brooks, R. The Sleep Deprivation Attack in Sensor Networks: Analysis and Methods of Defense. Int. J. Distrib. Sens. Netw. 2006, 2, 267–287. [Google Scholar] [CrossRef]
  4. Boubiche, D.E.; Bilami, A. A Defense Strategy against Energy Exhausting Attacks in Wireless Sensor Networks. J. Emerg. Technol. Web Intell. 2013, 5, 18–27. [Google Scholar] [CrossRef]
  5. Dissanayake, I.; Weerasinghe, H.D.; Welhenge, A. A generation of dataset towards an Anomaly-Based Intrusion Detection System to detect Denial of Sleep Attacks in Internet of Things (IoT). In Proceedings of the 2022 22nd International Conference on Advances in ICT for Emerging Regions (ICTer), Colombo, Sri Lanka, 30 November–1 December 2022; pp. 92–97. [Google Scholar] [CrossRef]
  6. Gupta, R.; Srivastava, D.; Sahu, M.; Tiwari, S.; Ambasta, R.K.; Kumar, P. Artificial intelligence to deep learning: Machine intelligence approach for drug discovery. In A Step towards Advanced Drug Discovery; Springer: Singapore, 2021; pp. 1–25. [Google Scholar]
  7. Ye, W.; Heidemann, J.; Estrin, D. An Energy-Efficient MAC Protocol for Wireless Sensor Networks. In Proceedings of the Twenty-First Annual Joint Conference of the IEEE Computer and Communications Societies, New York, NY, USA, 23–27 June 2002; Volume 3, pp. 1560–1569. [Google Scholar]
  8. van Dam, T.; Langendoen, K. An adaptive energy efficient MAC protocol for wireless sensor networks. In Proceedings of the 1st International Conference on Embedded Networked Sensor Systems, Los Angeles, CA, USA, 5–7 November 2003; ACM: New York, NY, USA, 2003; pp. 171–180. [Google Scholar]
  9. Polastre, J.; Hill, J.; Culler, D. Versatile Low Power Media Access for Wireless Sensor Networks. In Proceedings of the 2nd International Conference on Embedded Networked Sensor Systems, Baltimore, MD, USA, 3–5 November 2004; ACM: New York, NY, USA, 2004; pp. 95–107. [Google Scholar]
  10. Buettner, M.; Yee, G.V.; Anderson, E.; Han, R. X-MAC: A Short Preamble MAC Protocol for Duty-Cycled Wireless Sensor Networks. In Proceedings of the 4th International Conference on Embedded Networked Sensor Systems, Boulder, CO, USA, 31 October–3 November 2006; ACM: Boulder, CO, USA, 2006; pp. 307–320. [Google Scholar]
  11. Dunkels, A. The ContikiMAC Radio Duty Cycling Protocol; SICS Technical Report T2011:13; Swedish Institute of Computer Science: Stockholm, Sweden, 2011. [Google Scholar]
  12. Gehrmann, C.; Tiloca, M.; Hoglund, R. SMACK: Short Message Authentication ChecK Against Battery Exhaustion in the Internet of Things. In Proceedings of the 2015 12th Annual IEEE International Conference on Sensing, Communication, and Networking (SECON), Seattle, WA, USA, 22–25 June 2015; IEEE: Chicago, IL, USA, 2015; pp. 1–6. [Google Scholar]
  13. Maddikunta, P.K.R.; Srivastava, G.; Gadekallu, T.R.; Deepa, N.; Boopathy, P. Predictive model for battery life in IoT networks. IET Intell. Transp. Syst. 2020, 14, 1388–1395. [Google Scholar] [CrossRef]
  14. Tavallaee, M.; Bagheri, E.; Lu, W.; Ghorbani, A.A. A Detailed Analysis of the KDD CUP 99 Data Set. In Proceedings of the 2009 IEEE Symposium on Computational Intelligence for Security and Defense Applications, Ottawa, ON, Canada, 8–10 July 2009; IEEE: Chicago, IL, USA, 2009; pp. 1–9. [Google Scholar]
  15. Moustafa, N.; Slay, J. UNSW-NB15: A Comprehensive Data set for Network Intrusion Detection systems. In Proceedings of the 2015 Military Communications and Information Systems Conference (MilCIS), Canberra, Australia, 10–12 November 2015; IEEE: Chicago, IL, USA, 2015; pp. 1–6. [Google Scholar]
  16. Sharafaldin, I.; Lashkari, A.H.; Ghorbani, A.A. Toward Generating a New Intrusion Detection Dataset and Intrusion Traffic Characterization. In Proceedings of the 4th International Conference on Information Systems Security and Privacy, Funchal, Portugal, 22–24 January 2018; SCITEPRESS: Funchal, Portugal, 2018; pp. 108–116. [Google Scholar]
  17. Koroniotis, N.; Moustafa, N.; Sitnikova, E.; Turnbull, B. Towards the Development of Realistic Botnet Dataset in the Internet of Things for Network Forensic Analytics: Bot-IoT Dataset. Future Gener. Comput. Syst. 2019, 100, 779–796. [Google Scholar] [CrossRef]
  18. Hamza, A.; Gharakheili, H.H.; Benson, T.A.; Sivaraman, V. Detecting Volumetric Attacks on IoT Devices via SDN-Based Monitoring of MUD Activity. In Proceedings of the 2019 ACM Symposium on SDN Research, San Jose, CA, USA, 3–4 April 2019; pp. 1–9. [Google Scholar]
  19. Essop, I.; Ribeiro, J.C.; Papaioannou, M.; Zachos, G.; Mantas, G.; Rodriguez, J. Generating Datasets for Anomaly-Based Intrusion Detection Systems in IoT and Industrial IoT Networks. Sensors 2021, 21, 1528. [Google Scholar] [CrossRef] [PubMed]
  20. Mohd, N.; Singh, A.; Bhadauria, H.S. A Novel SVM Based IDS for Distributed Denial of Sleep Strike in Wireless Sensor Networks. Wirel. Pers. Commun. 2020, 111, 1999–2022. [Google Scholar] [CrossRef]
  21. Mukhtar, M.; Lashari, M.H.; Alhussein, M.; Karim, S.; Aurangzeb, K. Energy-Efficient Framework to Mitigate Denial of Sleep Attacks in Wireless Body Area Networks. IEEE Access 2024, 12, 66584–66598. [Google Scholar] [CrossRef]
  22. Alsaedi, A.; Mahmood, A.; Moustafa, N.; Tari, Z.; Anwar, A. TON_IoT Telemetry Dataset: A New Generation Dataset of IoT and IIoT for Data-Driven Intrusion Detection Systems. IEEE Access 2020, 8, 165130–165150. [Google Scholar] [CrossRef]
  23. Peterson, J.M.; Leevy, J.L.; Khoshgoftaar, T.M. A Review and Analysis of the Bot-IoT Dataset. In Proceedings of the 2021 IEEE International Conference on Service-Oriented System Engineering (SOSE), Oxford, UK, 23–26 August 2021; IEEE: Piscataway, NJ, USA, 2021; pp. 47–56. [Google Scholar] [CrossRef]
  24. Koppula, M.; Leo Joseph, L.M.I. A Real-World Dataset “IDSIoT2024” for Machine Learning/Deep Learning-Based Cyber Attack Detection System for IoT Architecture. In Proceedings of the 3rd International Conference on Intelligent Data Communication Technologies and Internet of Things (IDCIoT 2025), Coimbatore, India, 17–19 July 2025; IEEE: Piscataway, NJ, USA, 2025. [Google Scholar] [CrossRef]
  25. Tareq, I.; Elbagoury, B.M.; El-Regaily, S.; El-Horbaty, E.-S.M. Analysis of ToN-IoT, UNW-NB15, and Edge-IIoT Datasets Using DL in Cybersecurity for IoT. Appl. Sci. 2022, 12, 9572. [Google Scholar] [CrossRef]
  26. Elsadig, M.A. Detection of Denial-of-Service Attack in Wireless Sensor Networks: A Lightweight Machine Learning Approach. IEEE Access 2023, 11, 101246–101260. [Google Scholar] [CrossRef]
  27. Bani-Yaseen, T.; Tahat, A.; Kastell, K.; Edwan, T.A. Denial-of-Sleep Attack Detection in NB-IoT Using Deep Learning. J. Telecommun. Digit. Econ. 2022, 10, 1–17. [Google Scholar] [CrossRef]
  28. Sharma, A.; Rani, S.; Shabaz, M. An Optimized Stacking-Based TinyML Model for Attack Detection in IoT Networks. PLoS ONE 2025, 20, e0329227. [Google Scholar] [CrossRef] [PubMed]
  29. Muzakkar, B.A.; Mohamed, M.A.; Kadir, M.F.A.; Mohamad, Z.; Jamil, N. Recent advances in energy efficient-QoS aware MAC protocols for wireless sensor networks. Int. J. Adv. Comput. Res. 2018, 8, 11–26. [Google Scholar] [CrossRef]
  30. Han, K.; Luo, J.; Liu, Y.; Vasilakos, A.V. Algorithm Design for Data Communications in Duty-Cycled Wireless Sensor Networks: A Survey. IEEE Commun. Surv. Tutor. 2016, 18, 1222–1245. [Google Scholar] [CrossRef]
  31. Tang, L.; Sun, Y.; Gurewitz, O.; Johnson, D.B. PW-MAC: An Energy-Efficient Predictive-Wakeup MAC Protocol for Wireless Sensor Networks. In Proceedings of the 2011 Proceedings IEEE INFOCOM, Shanghai, China, 10–15 April 2011; IEEE: Chicago, IL, USA, 2011; pp. 261–272. [Google Scholar]
  32. Goumidi, H.; Pierre, S. Real-Time Anomaly Detection in IoMT Networks Using Stacking Model and a Healthcare Specific Dataset. IEEE Access 2025, 13, 70352–70365. [Google Scholar] [CrossRef]
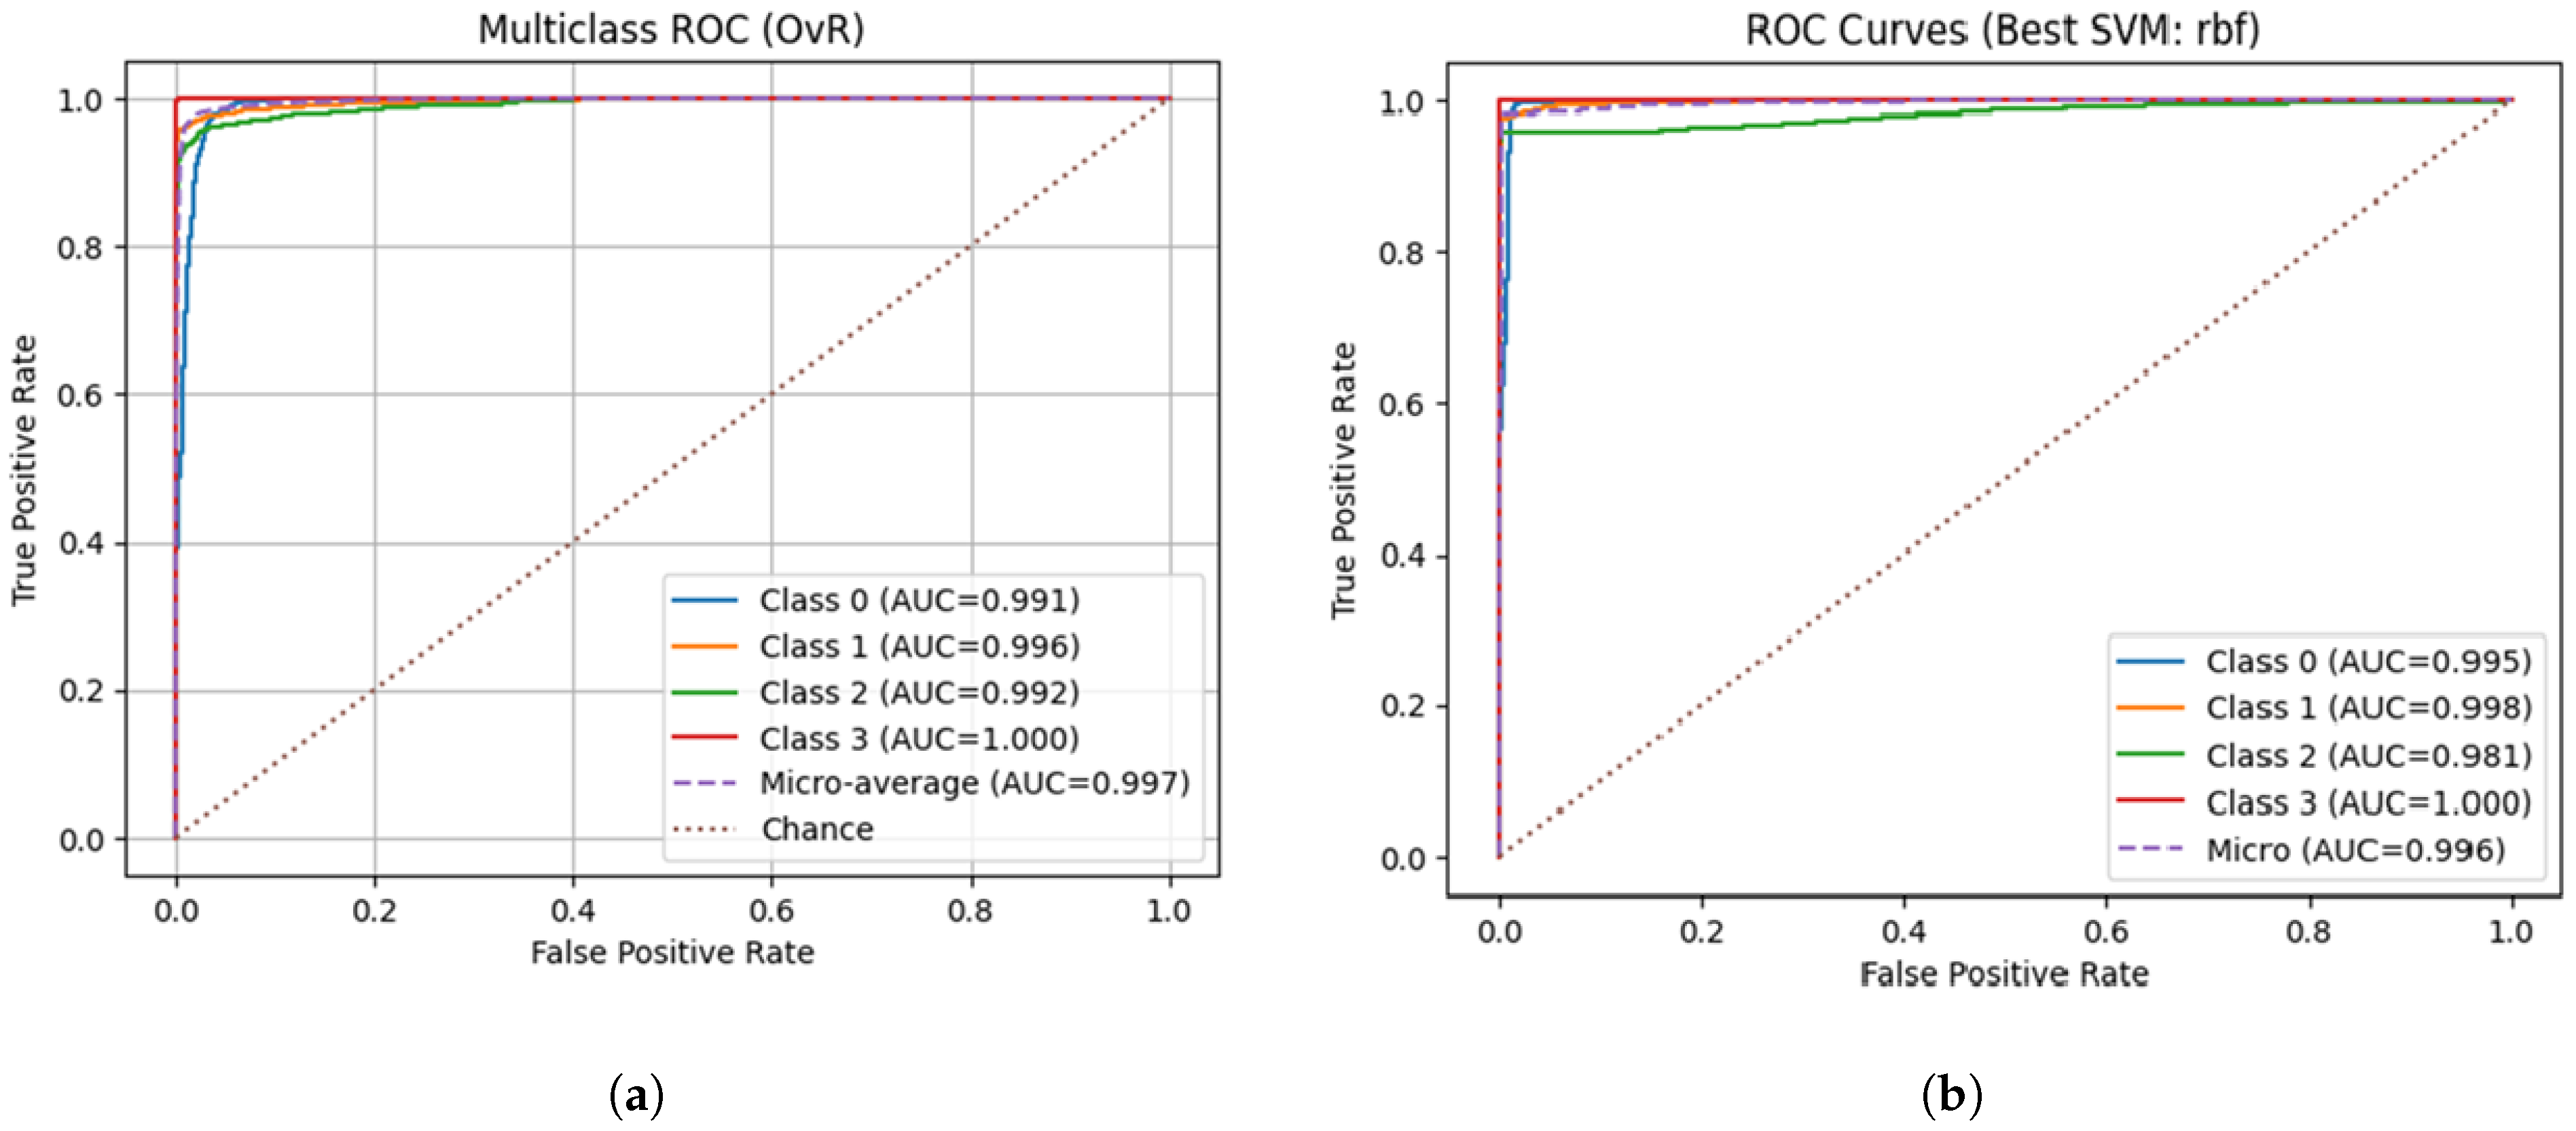
Figure 1. Receiver Operating Characteristic (ROC) curves for LR and SVM (RBF). (a) Logistic Regression; (b) SVM (RBF).
Iot 06 00071 g001
Figure 2. Receiver Operating Characteristic (ROC) curves for kNN and DT. (a) kNN; (b) Decision Tree.
Iot 06 00071 g002
Figure 3. Receiver Operating Characteristic (ROC) curves for RF and ANN. (a) Random Forest; (b) ANN.
Iot 06 00071 g003
Figure 4. Receiver Operating Characteristic (ROC) curves for RNN.
Iot 06 00071 g004
Figure 5. Confusion matrices under the temporal train–test split (first two hours for training/validation; and last hour for testing). (a) ANN confusion matrix (temporal split); (b) RNN confusion matrix (temporal split).
Iot 06 00071 g005
Table 1. Comparison of existing solutions.
ReferenceApproach or DatasetAttack TypesModelsKey OutcomesNotes
MAC Protocols [7,8,9,10,11,29,30,31]Low-power MAC protocols (duty cycling, sync)General energy-savingN/AReduces battery use, but limited vs. sleep deprivation attacksStruggle with battery exhaustion attacks
SMACK [12]Authentication mechanism at app layer (CoAP), tested on CC2538Battery exhaustion (general)N/AEnergy-efficient but limited vs. barrage attacksPacket validation overhead
[19]COOJA simulation dataset (approximately 11k benign + approximately 11k malicious)UDP flood onlyN/ADataset limited to single attack typeNot enough for broad IDS
Our previous work [5]COOJA simulationUDP flood, wormhole, barrage-likeN/ABroader attack coverageNo ML implementation was carried out by that time, and only the dataset preparation approaches were given.
[20]Opnet simulation, 1190 samplesBattery exhaustionSVM90.8% accuracy; high TPRSmaller dataset, accuracy might drop with scale
[21]Energy-efficient framework by optimizing energy utilizationBattery exhaustion with repetitive tasksN/AIncreased lifetimeSmaller simulation, with only repetitive tasks concerned
[22,23,24,25]Traffic-centric IoT/IIoTMulti-class intrusions (DoS/DDoS, etc.)CART; DenseNet121; InceptionTime; various MLGood accuracy, low training costPredominantly packet/flow features; lacks energy/sleep-state telemetry, limited for DoSl detection
[26,27]Energy-aware IDS directionsDenial of Service attacks, Hello FLood DoSLDT, KNN, RF, XGBoost; LSTM, GRU99.5% (WSN-DS); 98.99% accuracy and ROC-AUC 0.9889 for DoSl in NB-IoTTraffic-based features; limited-attack focus; no device-level power telemetry
[28]ToN-IoT dataset (≈461 k samples, 10 attack types); TinyML stacking on MCUGeneral multi-class intrusionsTinyML-Stacking (compact DT + small NN → LR meta)99.98% accuracy;  0.12 ms inference;  0.01 mW on Arduino Nano 33 BLE SenseTraffic-centric; no sleep-state/energy telemetry
Table 2. Features in the prepared dataset.
Feature TitleDescription
all_cpuPower consumption of CPU from the beginning
all_lpmPower consumption of low-power mode from the beginning
all_transmitPower consumed for data transmission from the beginning
all_listenPower consumed to listen to data from the beginning
all_idle_listenPower consumed for idle listening from the beginning
cpuPower consumption of CPU for that duty cycle
lpmPower consumption of low-power mode for that duty cycle
transmitPower consumed for data transmission for that duty cycle
listenPower consumed to listen to data for that duty cycle
idle_listenPower consumed for idle listening for that duty cycle
Table 3. Correlation Ratio ( η 2 ) between features and target.
FeatureCorrelation Ratio ( η 2 )
all_cpu0.334
all_lpm0.192
all_transmit0.400
all_listen0.321
all_idle_listen0.331
cpu0.337
lpm0.324
transmit0.057
listen0.334
idle_listen0.499
Table 4. Comparison of all the best models.
ModelParameter (s)Held-Out 25% Test SetK-Fold Cross Validation
Logistic Regressionpenalty = l2,
solver = lbfgs,
C = 965.9184849666412,
tol = 1.9148577409664156 × 10 5 ,
class_weight = None
96.42%96.43%
SVMkernel = rbf,
C = 194.94884560528726,
gamma = 0.639323158597893,
class_weight = balanced,
tol = 1 × 10 3 ,
max_iter = 100,000
98.32%98.39%
KNNn_neighbors = 5,
weights = distance,
metric = cosine
97.33%97.60%
Decision Treecriterion = gini,
splitter = random,
max_depth = 40
min_samples_split = 2,
min_samples_leaf = 2,
max_features = None,
class_weight = None,
ccp_alpha = 0.0
97.86%97.29%
Random Forestn_estimators = 410,
max_depth = 29,
min_samples_split = 10,
min_samples_leaf = 7,
bootstrap = True,
ccp_alpha = 0.0,
max_features = 0.8430774202347376,
class_weight = balanced
98.57%98.65%
ANNn_hidden_layers = 2,
activation_hidden = relu,
use_bn = True,
  dropout = 0.07816451844305984,  
l2 = 0.0018067201114756084,
optimizer = nadam,
lr = 0.0024901124769445967,
lr_schedule = cosine,
batch_size = 512,
epochs = 130,
units_0 = 1024,
units_1 = 256
96.65%98.22 ± 0.39%
LSTMbatch_size = 64,
epochs = 120,
units_1 = 128,
bidir_1 = False,
drop_1 = 0.372,
use_second = True,
units_2 = 96,
bidir_2 = False,
drop_2 = 0.251,
dense_units = 256,
dense_drop = 0.021,
optimizer = nadam,
lr = 0.0018
97.92 % (15 % chronological holdout)Chronological split (no random k-fold)
Table 5. Per-class F1 scores with overall F1-macro for each model.
ModelF1 Score (per Class)F1-Macro
Non-CompromisedUDP FloodWormholeLegitimate Request
Logistic Regression0.96430.96550.94730.99430.9679
SVM0.98500.98220.97350.99750.9845
KNN0.98060.96750.95380.99460.9741
Decision Tree0.98390.97450.96370.99560.9794
Random Forest0.98980.98060.97840.99500.9859
ANN0.97610.95310.94690.99370.9675
LSTM0.97791.00000.95021.00000.9820
Table 6. Performance of all classifiers under temporal train/test split (first 2 h training, last hour testing).
ModelAccuracyF1macro
Logistic Regression0.8700.839
SVM (RBF)0.5730.509
kNN0.8860.866
Decision Tree0.8440.856
Random Forest0.7600.780
ANN0.9640.962
RNN0.9690.971
Table 7. Performance under temporal split with and without cumulative features.
ModelAll FeaturesNo Cumulative Δ Accuracy (%)
LR0.8700.668−20.2
SVM0.5730.611+3.8
KNN0.8860.685−20.1
DT0.8440.753−9.1
RF0.7600.677−8.3
ANN0.9640.736−22.8
RNN0.9690.911−5.8
Disclaimer/Publisher’s Note: The statements, opinions and data contained in all publications are solely those of the individual author(s) and contributor(s) and not of MDPI and/or the editor(s). MDPI and/or the editor(s) disclaim responsibility for any injury to people or property resulting from any ideas, methods, instructions or products referred to in the content.