Article

Acoustic Trap Design for Biodiversity Detection

Department of Informatics, Technische Universität Clausthal, 38678 Clausthal-Zellerfeld, Germany
*
Author to whom correspondence should be addressed.
Submission received: 27 August 2025 / Revised: 14 September 2025 / Accepted: 17 September 2025 / Published: 24 September 2025

Abstract

Real-time insect monitoring is essential for sustainable agriculture and biodiversity conservation. The traditional method of attracting insects to colored glue traps and manually counting the catch is time-intensive and requires specialized taxonomic expertise. Moreover, these traps are often lethal to pests and beneficial insects alike, raising both ecological and ethical concerns. Camera-based trap designs have recently emerged to lower the amount of manual labor involved in determining insect species, yet they are still deadly to the catch. This study presents the design and evaluation of a non-lethal acoustic monitoring system capable of detecting and classifying insect species based on their sound signatures. A first prototype was developed with a focus on low self-noise and suitability for autonomous field deployment. The system was initially validated through laboratory experiments, and subsequently tested in six rapeseed fields over a 25-day period. More than 3400 h of acoustic data were successfully collected without system failures. Key findings highlight the importance of carefully selecting each component to minimize self-noise, as insect sounds are extremely low in amplitude. The results also underscore the need for efficient data and energy management strategies in long-term field deployments. This paper aims to share the development process, design decisions, technical challenges, and practical lessons learned over the course of building our IoT sensor system. By outlining what worked, what did not, and what should be improved, this work contributes to the advancement of non-invasive insect monitoring technologies.

1. Introduction

The use of animal monitoring systems across different ecosystems has been increasingly studied over the years [1,2,3]. In the recent past, a significant uptake of methods to detect species through camera traps or passive acoustic sensors was observed [1,4,5]. Since effective insect monitoring is a pressing issue in conservation science, given that insects play a crucial role in maintaining biodiversity [6], this trend is also reflected in studies focused on insect identification [7,8]. This growing interest in insect monitoring is not only relevant for biodiversity conservation, but also for improving agricultural practices. In this context, the European Scientific Foresight Study “Precision Agriculture and the Future of Farming in Europe” [9] highlights that early pest detection in agricultural areas could significantly reduce pesticide usage and support more informed decision-making, with potential reductions in pesticide application of up to 84.5%. The report also notes that technologies such as sensor systems, satellite navigation and positioning, and the Internet of Things (IoT) are increasingly assisting farmers in their daily work. Furthermore, it emphasizes that these technologies and methods can be further enhanced to increase the effectiveness of precision agriculture, which is described as a modern farming management concept that uses digital techniques to monitor and optimize agricultural production processes.
Although technology-supported approaches towards insect monitoring in agriculture predominantly rely on image processing algorithms [10], research on bioacoustics dates back more than 30 years already [11]. Since then, a number of data collection device prototypes to capture (eco-)acoustic data for processing have been presented. Along with the resultingly increased availability of recorded data, researchers have also started to investigate data processing methods for signal analysis and species identification. The recent rise of Artificial Intelligence (AI) frameworks and toolkits have made even more sophisticated data analyses possible, e.g., enabling the extraction of biodiversity indicators from ecological soundscapes [12] or the detection of specific species in audio recordings [13]. However, there is a growing imbalance between the large number of scientific works on acoustic data processing and the comparably few publications introducing IoT-enabled sensor system designs to collect acoustic data. This has motivated us to explore the design space for acoustic data collection systems in more depth.
This study aims to present the development and challenges of an acoustic recording system designed to operate as an acoustic trap for insect identification. Our work thus serves to share the main requirements, encountered difficulties, and insights gained in order to support and facilitate the implementation of similar systems in future research.
We first summarize the state of the art in acoustic data collection systems for ecoacoustics applications in Section 2, before introducing our overall system design and component selection considerations in Section 3. The system was tested as a prototype to assess its functionality in terms of ease of use, weather resistance, insect attractiveness, and recording quality. We provide more details on our testing in actual rapeseed fields in Section 4, and share insights and lessons learned in Section 5. We summarize our observations in Section 6.

2. Related Work

Several studies have presented acoustic systems that can be used for species monitoring [14,15,16]. In general, these recording systems were developed to identify louder animals, such as birds [17] and frogs [18], whose vocalizations can reach high sound pressure levels even at relatively long distances. However, most of these devices do not include embedded systems for real-time recognition and classification; instead, they are used solely for recording, with analysis carried out later. This highlights the challenge of implementing embedded systems for real-time processing, a difficulty that remains even when monitoring louder species. In contrast, some applications for smartphones have already been developed to identify bird species based on sounds recorded directly by the device [19,20].
Verma and Kumar in [16] present an IoT-based solution, called AviEar, that uses acoustic monitoring for avian species. In their study, the authors highlight issues associated with devices that store data locally and perform analysis and processing later. They point out that this delay can lead to problems such as the risk of data loss and the missed benefits of real-time monitoring. Additionally, they emphasize that most existing devices suffer from high power consumption, which limits their usability in long-term or remote field applications. To address these limitations, they developed their own system designed for low power consumption and real-time monitoring. The device includes a Micro-Electro-Mechanical System (MEMS) microphone, an ultra-low-power microcontroller unit, and a storage unit. Thus, they integrate acoustic signal recording, onboard signal processing, data storage, and cloud-based uploading to facilitate remote monitoring. The system achieves 95% accuracy in avian species detection using a rapid target species detection algorithm and an 8 kHz sampling rate.
While AviEar demonstrates effective acoustic monitoring for birds, extending similar approaches to insect monitoring introduces additional challenges. Insect sounds are typically much quieter, making them more difficult to capture. Therefore, recording systems used for this purpose must have low self-noise to reliably detect such weak signals. In this context, the analysis of Hill et al. in [14] evaluated a low-cost recording system designed for general biodiversity monitoring. The authors used the AudioMoth device (https://www.openacousticdevices.info/audio) (accessed on 5 August 2025)., which has a Signal-to-Noise Ratio (SNR) of 44.2 dB. While the device showed good performance in capturing a range of sounds, including loud events like gunshots and bat calls, its evaluation for insect sounds was limited. The study assessed only the system’s ability to distinguish the presence or absence of cicadas from background noise. Although a true positive rate of 0.98 was achieved, no classification was attempted, and no other insect species were tested. Furthermore, since cicadas produce high sound pressure levels [21], their detection may not accurately reflect the system’s performance for quieter insect species.
Even with a good SNR, it is essential that insects of interest are attracted to the vicinity of the microphone, since a shorter distance between the insect and the microphone results in higher recorded sound pressure levels. Despite these challenges, various research efforts have explored the use of these same types of equipment for insect recordings, later using the data to train models for automatic species identification [13,22,23]. Some researchers have opted for controlled environments to record insect sounds. For example, Branding et al. in their research [24] built an anechoic chamber, specifically designed to capture the sounds of selected insect species. In this case, they were able to use a low self-noise, high-quality recording system that required a stable power source. Consequently, the system was not suitable for field deployment and was not resistant to weather conditions.
Other studies, such as presented by Ribeiro et al. in [25], opted to record insect sounds directly in the field, with all signal analysis, processing, and model training performed later, offline. In their study, a handheld portable recorder, Song Meter SM2 (This model is discontinued. Updated system information can be found at: https://www.wildlifeacoustics.com/products/song-meter-sm4 (accessed on 5 August 2025).), was used by a researcher who approached the target insects in experimental tomato fields. The goal was to classify the recorded sounds according to the species of buzzing bees: Melipona bicolor or Exomalopsis analis. Although the authors discuss various factors that may have contributed to the relatively low model performance (with accuracies ranging from 49% to 74%), it is worth noting the high self-noise level of the recording device, which was 32 dB.
In contrast, Madhusudhana et al. in [22] employed a device with an even higher self-noise level of 36 dB (Swift recorder (Cornell University): https://www.birds.cornell.edu/ccb/swift/) (accessed on 5 August 2025) and also conducted field recordings by installing the recorders in tree canopies. The aim of the study was to classify insect calls from 31 different katydid species. Despite the higher self-noise, their models achieved significantly better results, with classification accuracy reaching up to 98.81% for Panacanthus cuspidatus. However, good precision was obtained for only 8 out of the 31 species. In both studies, all data processing and model training were performed offline after the recordings had been collected. It is important to note, however, that these studies focused on bees and katydids, respectively, which are insect groups that generally produce louder sounds than other insect taxa. This likely facilitated their detection despite the limitations of the recording equipment.
When we look at studies combining IoT and AI that have been conducted in the literature, the EDANSA-2019 dataset [26] created by Coban et al. provides a large-scale ecoacoustic dataset covering 9000 square miles in the Alaska North Slope during the summer of 2019, collected using 100 autonomous recording units. Over 27 h of the dataset have been annotated with 28 tags, and convolutional baseline classifiers for 9 environmental classes have been released, paving the way for large-scale automated analysis. The study aims to quantify the effects of rapid climate change on ecofauna through acoustic monitoring of geophonic events. The study conducted by Alberti et al. in [6] evaluates the effectiveness of bioacoustic sensors deployed on farms in estimating flying insect abundance by counting “buzz” events, as well as the feasibility of IoT-based field deployments. It reports that the average number of buzzes per hour is positively correlated with abundance measured by pan traps, and that long-term patterns are related to temperature. Passive acoustic sensing is found to be effective in abundance estimation, while algorithmic improvements are needed for taxon-level identification. The study in [27] by Karar et al. proposes an end-to-end architecture that establishes a wireless IoT network using TreeVibes sensors attached to date palm tree trunks, transmits sounds to the cloud, and performs early detection using InceptionResNet V2. The study reports that transfer learning in the TreeVibes database achieved 97% accuracy and that the system demonstrated applicability despite field noise. GPS-based tree positioning and cloud-side analysis components support early intervention and scalable field management.
While systems developed for bird detection often achieve satisfactory performance with low sampling rates, such as 8 kHz [16], insect acoustic monitoring presents additional challenges, as insect sounds may contain relevant components in higher frequency ranges [28,29,30]. In addition to the specific frequency bands in which insect acoustic signals occur, the overall quality of the recorded data tends to improve with higher sampling rates. The study by Yin et al. [31] demonstrates that the accuracy of mosquito detection and classification from wingbeat sounds can vary significantly depending on the sampling rate. Using a deep learning-based pipeline, they found that recordings at 96 kHz yielded much better results compared to those at 8 kHz, highlighting the presence of relevant signal information in higher frequency bands. However, lower sampling rates contribute lower data storage demands, which makes the use of resource-constrained embedded IoT devices for insect detection an even greater challenge. To highlight differences among insect species, Figure 1 presents the spectrograms of several species, based on audio recordings obtained from the InsectSound1000 [32] and InsectSet47 & InsectSet66 [33] databases.
Previous studies on acoustic sensors for insect identification face several limitations, including low insect sound pressure levels, high device self-noise, and limited sampling rates. This study presents a prototype system designed to address these limitations in an integrated manner. The goal is to improve overall system efficiency by optimizing data quality, energy consumption, and storage capacity, enabling practical deployment under field conditions.

3. System Design

In order to detail the development of our IoT-based acoustic trap, the following sections aim to justify and explain the selection of all major components, with the goal of achieving the best cost-benefit ratio and, more importantly, a balanced performance across the different parts of the system. Section 3.1 outlines the requirements and design considerations necessary for the system to operate effectively in the field and to attract insects. Section 3.2 explains the rationale behind the selection of the electronic components and microphone, which are discussed in Section 3.2.1, and Section 3.2.2, respectively. Finally, Section 3.3 describes our considerations made during the development of the code.

3.1. Mechanical Design

In agricultural pest monitoring, water-based traps are commonly used and often coloured to attract specific insects. The most frequently used colours include green, yellow, blue, and red; however, the optimal choice depends on the target species [39]. Once attracted, insects typically drown in the liquid. Periodically, a biologist or technician visits the site to replace the water and collect the trapped insects, which are then manually counted and identified [1]. Recent advancements include automated systems that also use liquid-based containers to attract insects, but incorporate an integrated camera to automate species detection and counting [7].
Building upon the principle of colour attraction used in traditional traps, the acoustic trap developed in this study is designed to draw insects towards the measurement site without physically capturing them. As the device is intended for use in rapeseed fields, yellow was selected to match the colour of rapeseed flowers and to attract the same insect species. A yellow-painted satellite dish was employed to visually attract insects while also serving an acoustic function. Due to its parabolic shape, the satellite dish helps enhance the recorded insect sounds by focusing acoustic energy toward the microphone and reducing the distance between the microphone and the sound source. This configuration improves the SNR by both concentrating incoming sounds and positioning the insects as close as possible to the microphone. The acoustic focusing effect of the parabolic reflector is particularly effective for mid- to high-frequency sounds, which correspond to the typical frequency range of many insect-produced signals [29,40,41]. At these frequencies, the dish geometry provides sufficient spatial resolution to concentrate sound waves at the focal point, thereby amplifying the target signal while minimizing ambient noise. In addition to attracting insects and ensuring good signal quality, the mechanical system was also required to meet several additional criteria, as listed below:
  • The microphone had to be protected from wind and rain;
  • The passage for the cable connecting the microphone to the hardware system had to be weatherproof.
  • The hardware system itself (as described in Section 3.2) also required protection from rain;
  • The height of the satellite dish relative to the ground had to be adjustable, so that it could be aligned with the height of the surrounding vegetation.
To meet the mechanical and protection requirements, the microphone was enclosed in a plastic pipe, and the hardware system was housed in a waterproof box. The cable connecting the waterproof box to the microphone was routed through a corrugated plastic conduit for additional protection. All connections and open areas were sealed using custom 3D-printed components, including the internal microphone mount. To ensure that the height of the satellite dish is adjustable, a fixed support column was installed on the ground, along with a horizontal arm equipped with a movable clamp to allow for height adjustment. The complete system with all components installed on site is shown in Figure 2. The setup includes the satellite dish, microphone protection structure, and waterproof housing for the hardware components, configured for autonomous operation in an agricultural environment.

3.2. Hardware Design

3.2.1. Electronic Design

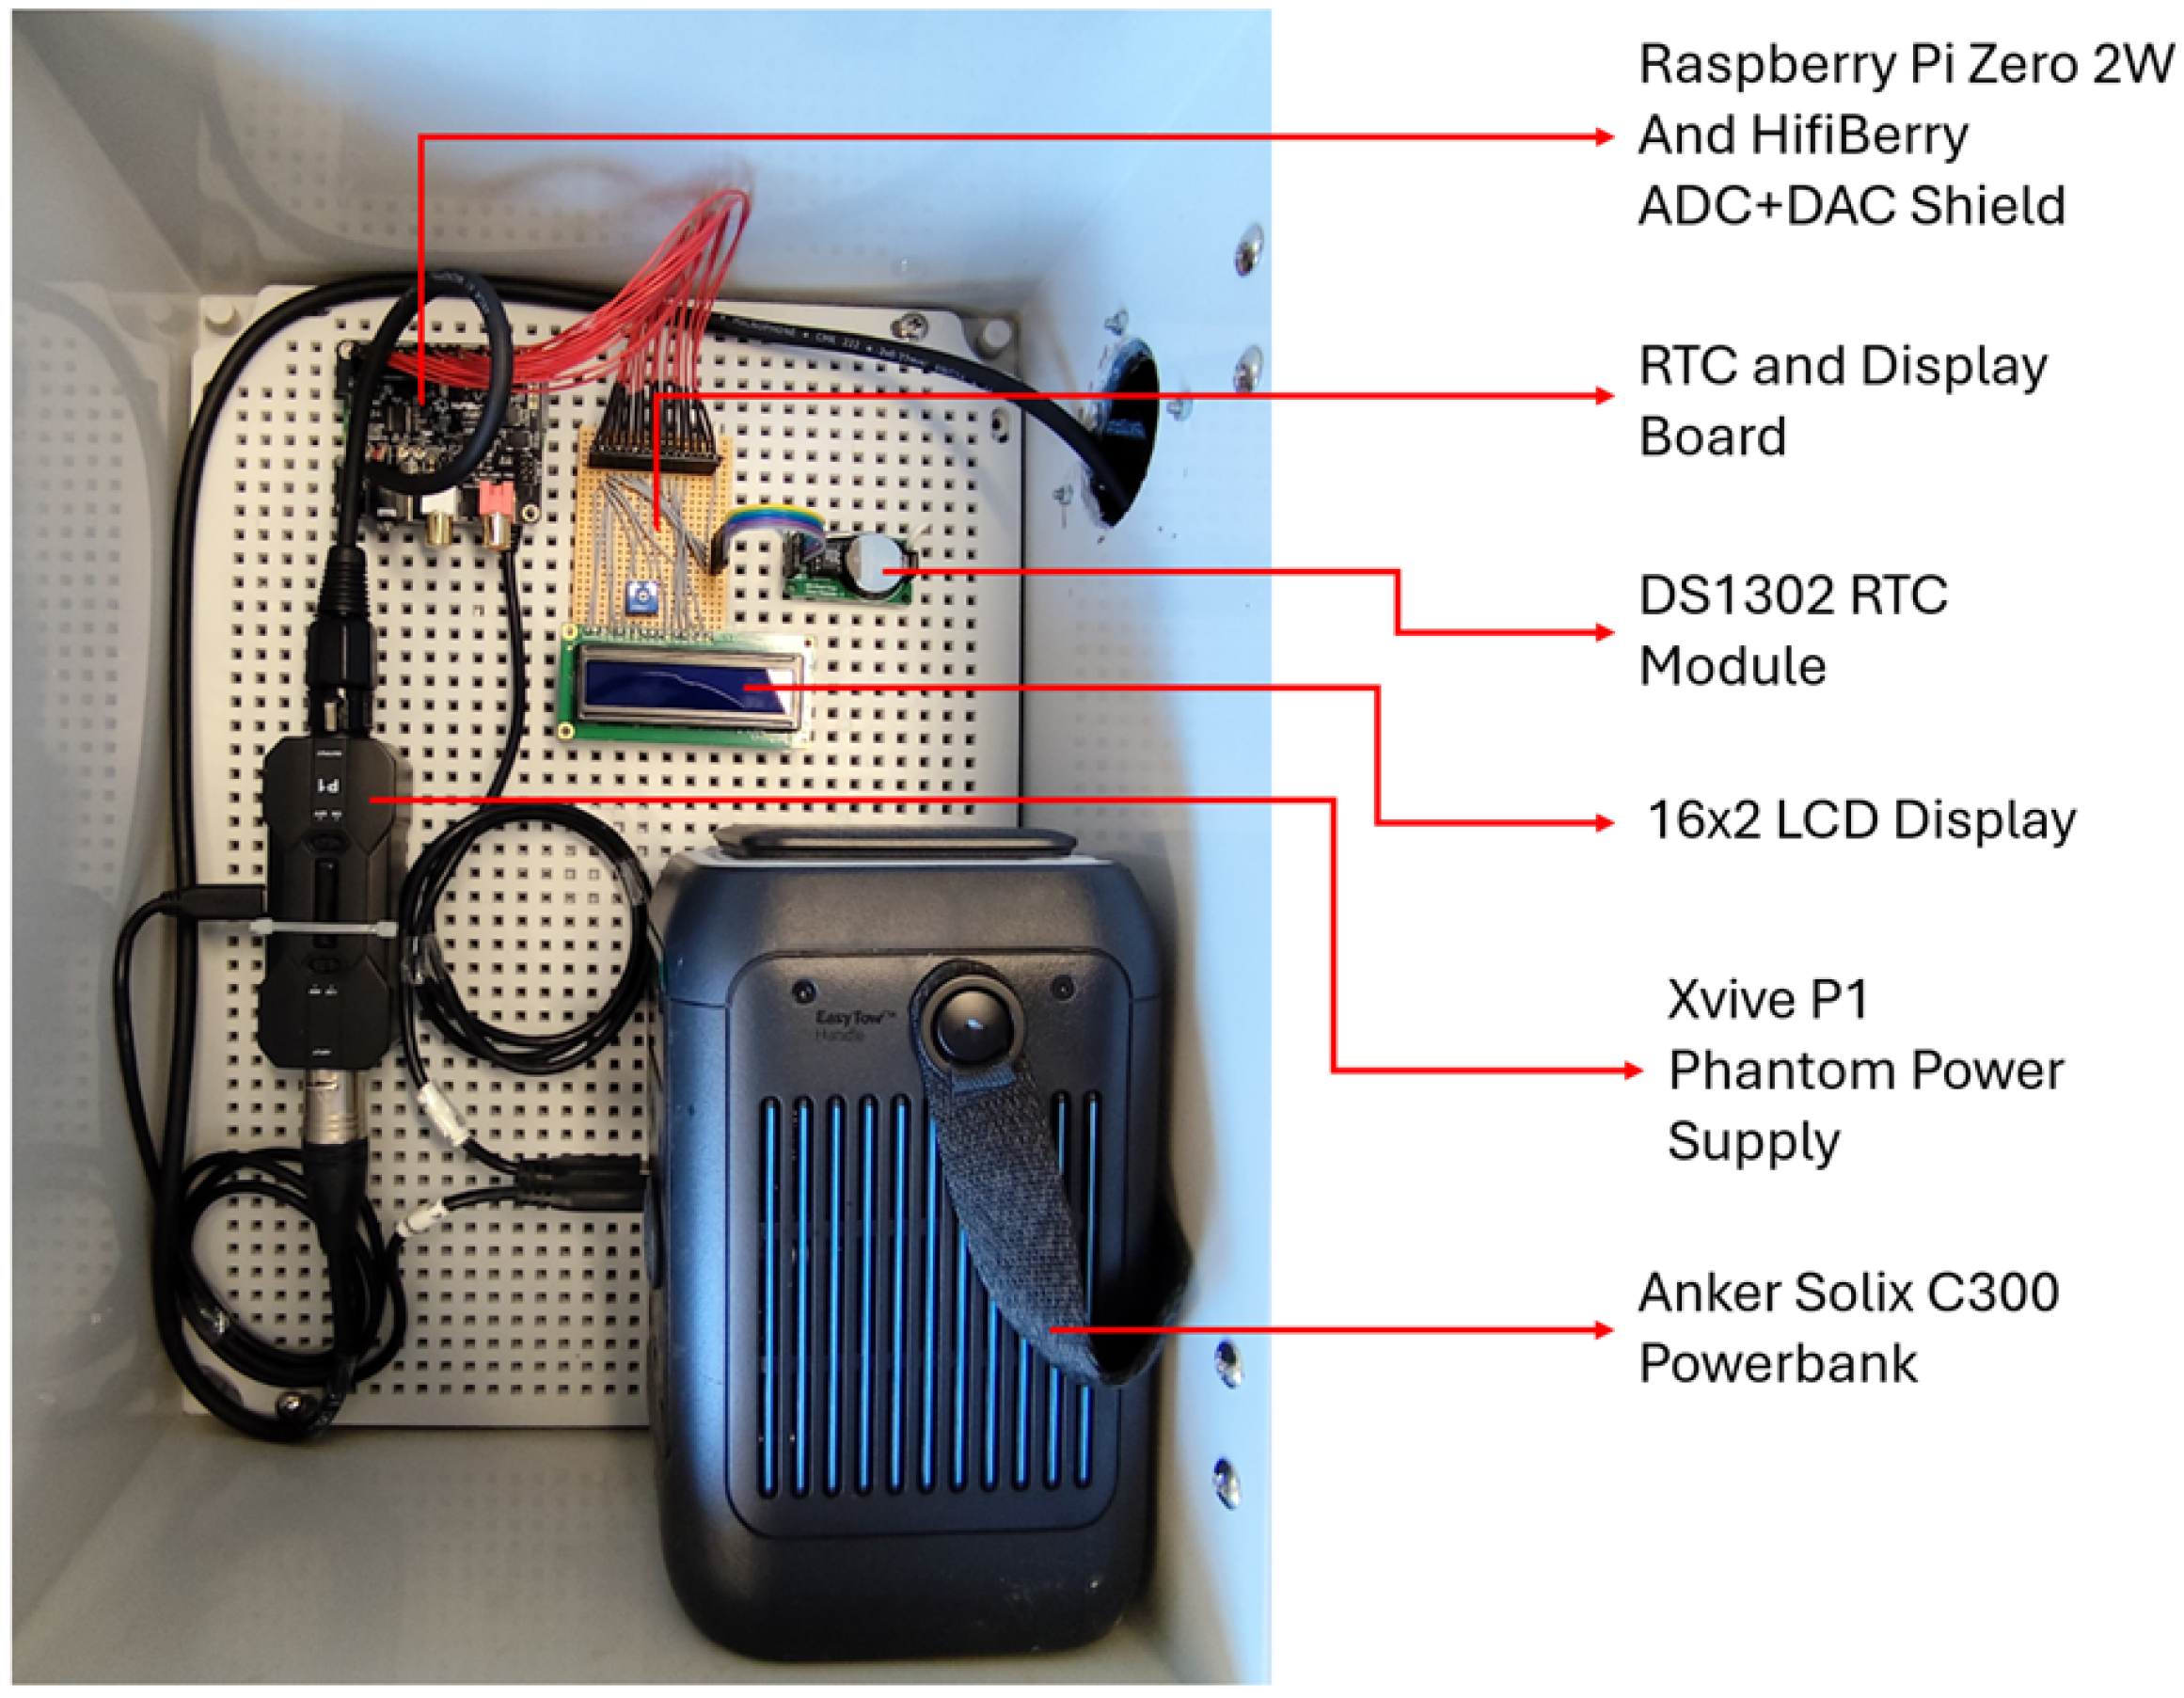
When selecting a device for audio recording, commonly used development boards were examined. Evaluations were made in terms of long-term recording capability, memory management, and high-resolution recording conditions. Arduino boards based on AVR-based Atmega series [42] processors have 10-bit resolution and a theoretical sampling rate of 9.6 kHz. The ARM-based Arduino Due can achieve 12-bit resolution and a sampling rate of 44.1 kHz [43]. With special configurations, the Teensy 3.x and 4.x series (PJRC, Sherwood, OR, USA) can record at a sampling rate of 192 kHz and 24-bit resolution [44]. Audio files are output in Pulse Code Modulation (PCM) or Waveform Audio File Format (WAV) format. However, Raspberry Pi is a more suitable choice in terms of system logging and memory management. The Raspberry Pi Zero 2 W [45] board and the compatible HiFiBerry DAC+ADC Pro [46] sound card were chosen therefore. This sound card supports recording at up to 192 kHz sampling rate and 32-bit resolution. Therefore, the Raspberry Pi Zero 2 W and HiFiBerry combination was chosen for its software flexibility and hardware capabilities. A DS1302 real-time clock (RTC) module [47] was used to keep track of time even after the battery was replaced.
Furthermore, a 16 × 2 Liquid Crystal Display (LCD) screen has been added to the system to display the current date and time after initialization. The Real-Time Clock (RTC) and LCD modules communicate with the Raspberry Pi via a custom designed Printed Circuit Board (PCB). The electrical/electronic components used in the system inside of the waterproof box are shown in Figure 3.

3.2.2. Microphone

One of the main challenges in recording insect sounds is the low signal level produced by certain species. This makes it essential to use a high-quality microphone with a low noise floor and a high SNR. Compared to the microphones used in other studies focused on insect sound recognition and/or classification (as shown in Table 1), the Behringer B-5 condenser microphone was selected, which offers a favorable trade-off between SNR, sensitivity, and cost, and includes both omnidirectional and cardioid options. This microphone offers a SNR of 78 dB, which is adequate for capturing low-level insect sounds under field conditions. The decision was also based on the microphone’s directivity because it is oriented toward the satellite dish in our system setup, where insects are expected to land or remain nearby. In this setup, the hypothesis is that using a directional (cardioid) configuration may enhance the capture of insect sounds by attenuating ambient noise from other directions.
To evaluate the hypothesis regarding the cardioid configuration outperforming the omnidirectional capsule when being pointed at the satellite dish, recordings were conducted using both capsules under identical conditions. For this purpose, we segmented an area of 70 cm × 70 cm into a 7 × 7 grid, as shown in Figure 4a. We used 2.8 cm miniature loudspeakers with plastic diaphragms (Visaton K28WP (Loudspeaker datasheet: https://www.visaton.de/de/produkte/chassis/kleinlautsprecher/k-28-wpc-8-ohm) (accessed on 5 August 2025). The loudspeakers were placed at the center of each 10 cm × 10 cm square, and configured to emit a frequency sweep from 500 Hz to 20 kHz. To minimize sound reflections, the array was placed on acoustic foam, and the measurements were conducted in a location as far as possible from reflective surfaces such as walls and ceilings. The satellite dish was placed at the center of the grid to account for its spherical surface, and speakers were magnetically attached to 16 of the 49 grid points. These 16 points, highlighted in Figure 4a, were not selected arbitrarily; rather, these positions were physically occupied by the satellite dish, which has a diameter of 40 cm. Since the satellite dish has a rim of approximately 1 cm, the microphones positioned along its edge were mounted directly onto this rim. The test setup is illustrated in Figure 4b. The resulting signals were then compared in terms of SNR and background noise suppression, allowing assessment of the directional configuration’s effectiveness in isolating insect sounds in the target area. The experiment was repeated using both microphone capsules (cardioid and omnidirectional), positioned at a distance of 20 cm from the center of the satellite dish.
All recorded data were normalized by the maximum amplitude for each frequency and a final color-scaled diagram was generated to compare the amplitude at each measurement point. The results, shown in Figure 5, indicate that the directional focus provided by the satellite dish is more effective when using the cardioid capsule. This is evidenced by higher amplitude values concentrated in the central area of the heatmap, which corresponds to the loudspeakers positioned on the satellite dish. These results suggest that the satellite dish is effectively focusing sound energy toward the cardioid microphone. In contrast, when using the omnidirectional capsule, only the speaker position at exactly the center—and therefore closest to the microphone—produced a relatively high amplitude. This confirms that the directional capsule benefits more from the guiding effect of the satellite dish.
In addition to amplifying insect sounds, the satellite dish also functions as a barrier to sounds originating behind it. These could include sounds from other animals in the field or rustling leaves. To evaluate this effect, a second experiment was conducted. In this case, all loudspeakers were placed directly on the floor at the 49 grid positions, while the microphone was fixed at a height of 1.05 m. The test was performed using the same sweep signal, with both microphone’s capsules, as illustrated in Figure 6a. The results, in Figure 6b,c, show lower amplitude values behind the satellite dish when the cardioid capsule is used, indicating improved attenuation of unwanted ground noise in that configuration. This behavior was observed across the entire tested frequency range. The superior performance of the cardioid capsule in both experiments confirmed the hypothesis, and the Behringer B5 microphone equipped with the cardioid capsule was chosen for integration into the system.
A disadvantage of using this type of condenser microphone is its requirement for phantom power, 48 V DC supplied through the microphone cable. Condenser microphones rely on an internal preamplifier and a charged capacitor diaphragm to operate, which makes an external power source necessary. While phantom power is standard in many studio and laboratory environments, it presents a limitation for field applications. In this system, which is intended for autonomous operation in agricultural environments, the need to provide phantom power adds complexity: it becomes one more component that must be powered in the field, thus increasing energy consumption.
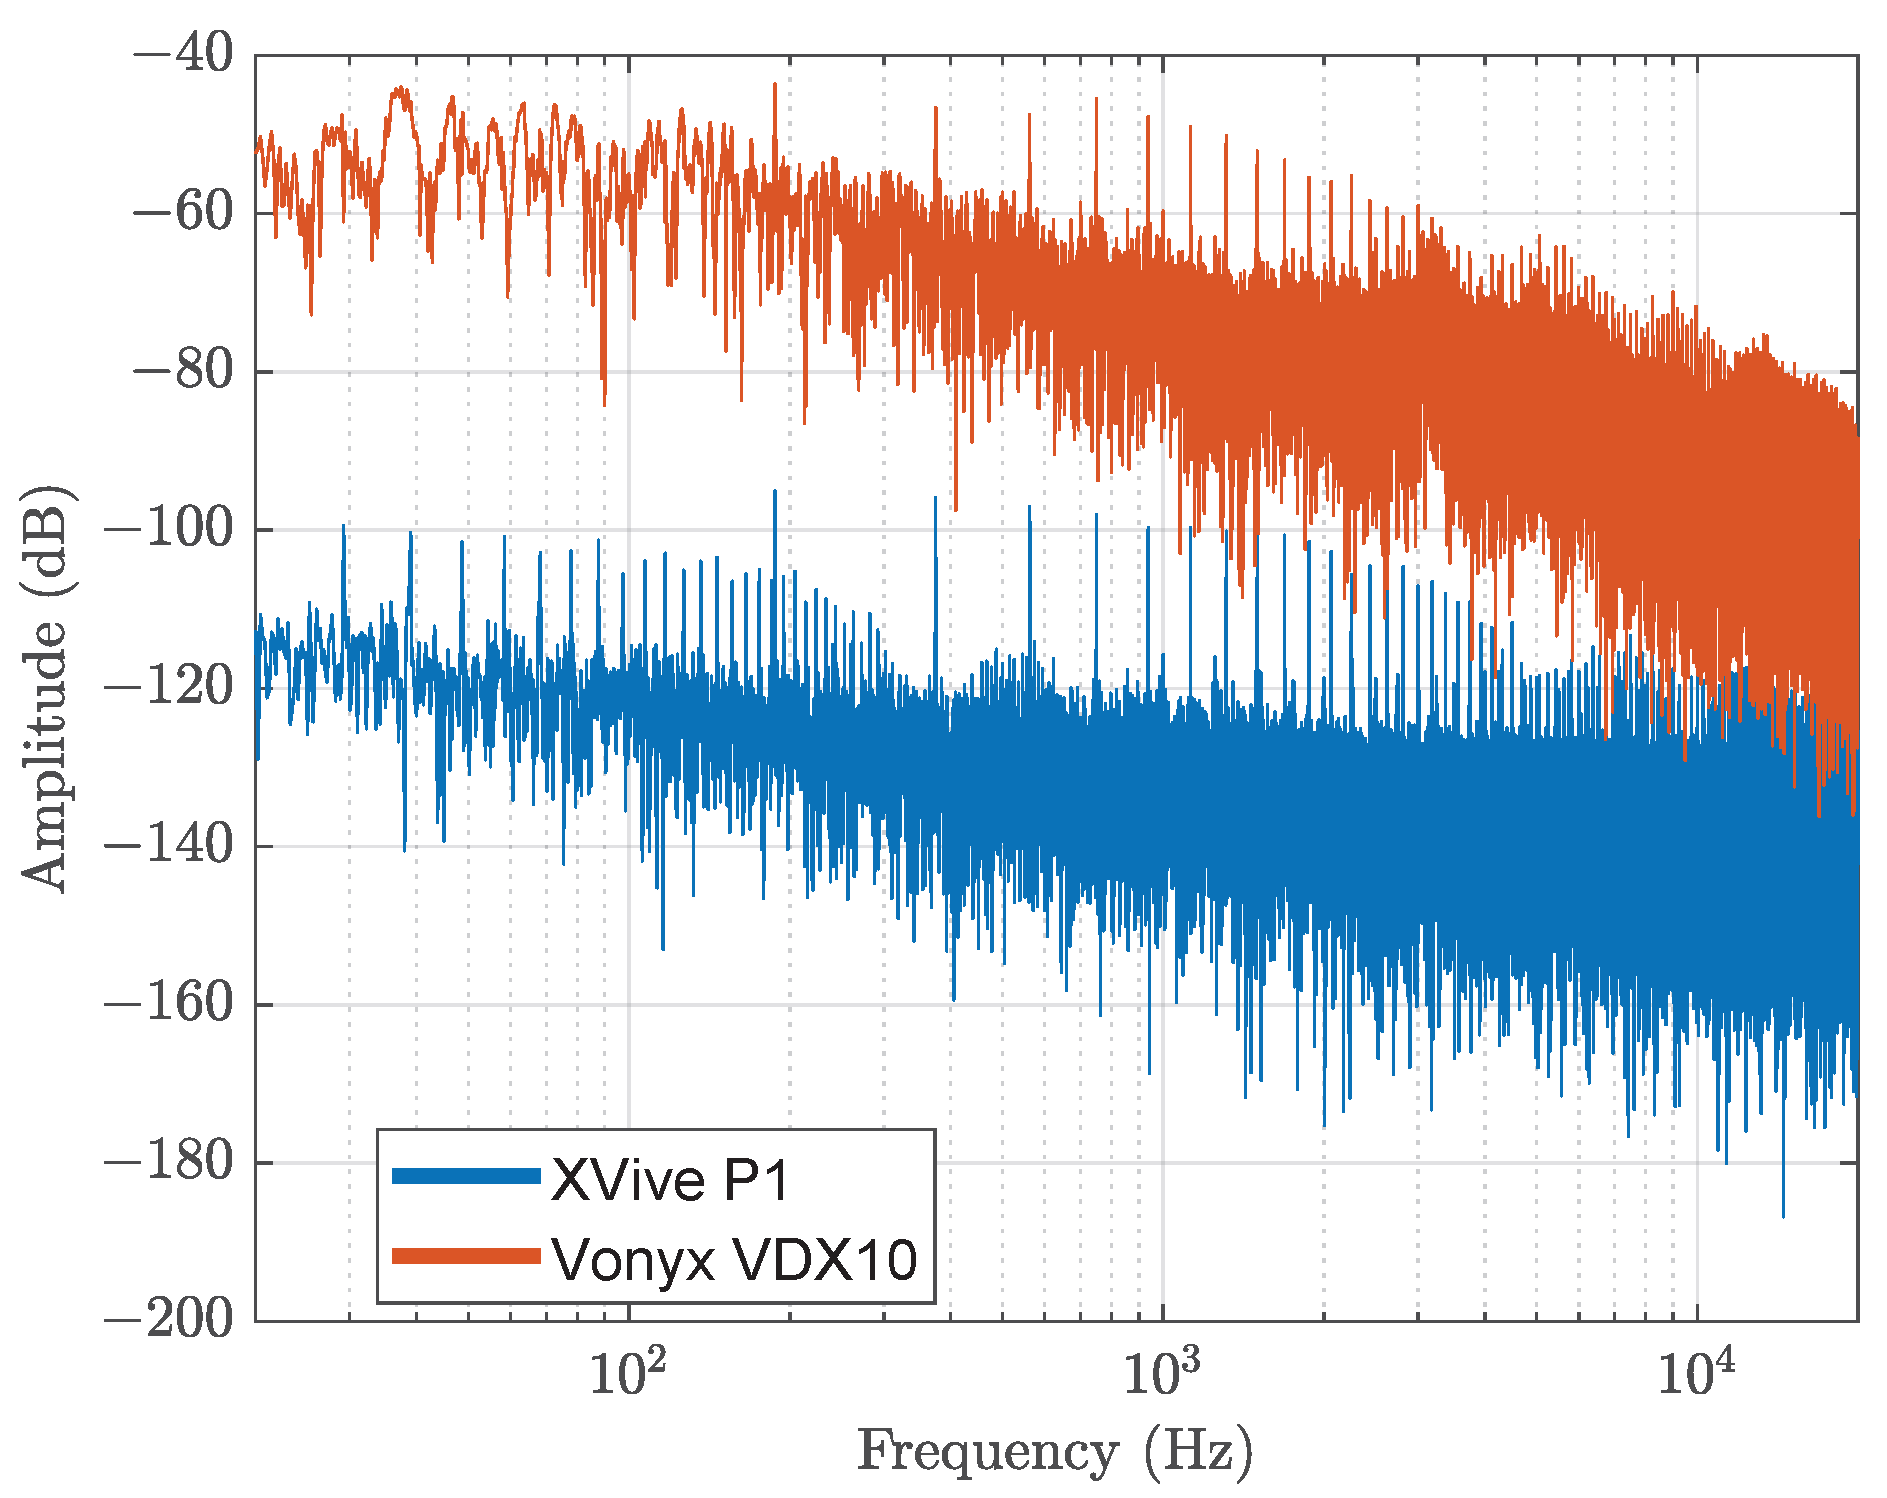
Considering field conditions, to determine the most suitable phantom power supply, two phantom power options compatible with power banks were identified: XVive P1 [52] and Vonyx VDX10 [53]. To compare these two available options, the self-noise of each device was measured without a real microphone connected, using an artificial microphone load designed to consume 0.192 W, even slightly exceeding the power specified by the microphone manufacturer (0.144 W). The artificial microphone load was implemented with two 24 kΩ resistors, one connected between HOT and GND and the other between COLD and GND. Each resistor drew approximately 0.002 A at 48 V, resulting in a total current of 0.004 A and a total power consumption of 0.192 W, thereby replicating the microphone’s power consumption. This approach allowed the measurement of the system’s intrinsic noise while preventing the capture of environmental sounds, yet still reproducing the microphone’s actual operating conditions. The comparison results are shown in Figure 7, showing that the baseline electrical noise introduced differs significantly between the devices. As noise is a critical factor in low-noise insect sound recording systems, the lower-noise XVive P1 phantom power supply was selected for use in our acoustic trap.
Another important consideration regarding microphones is their performance in capturing sounds at frequencies beyond the typical human hearing range, since the signals analyzed in this development may occur across a wide frequency spectrum [41,54]. Since human hearing is generally limited to approximately 20 kHz, most microphones are designed to operate effectively up to this frequency. Even though the data sheet of the Behringer B-5 indicates an upper frequency limit of 20 kHz, it is possible that the microphone is still capable of capturing higher frequencies. This is because condenser microphones use a diaphragm that responds to sound pressure variations, which theoretically allows them to react to ultrasonic frequencies as well. However, since the microphone was not designed or calibrated for this range, the accuracy and sensitivity above 20 kHz may be significantly reduced, and artifacts or distortions may occur.
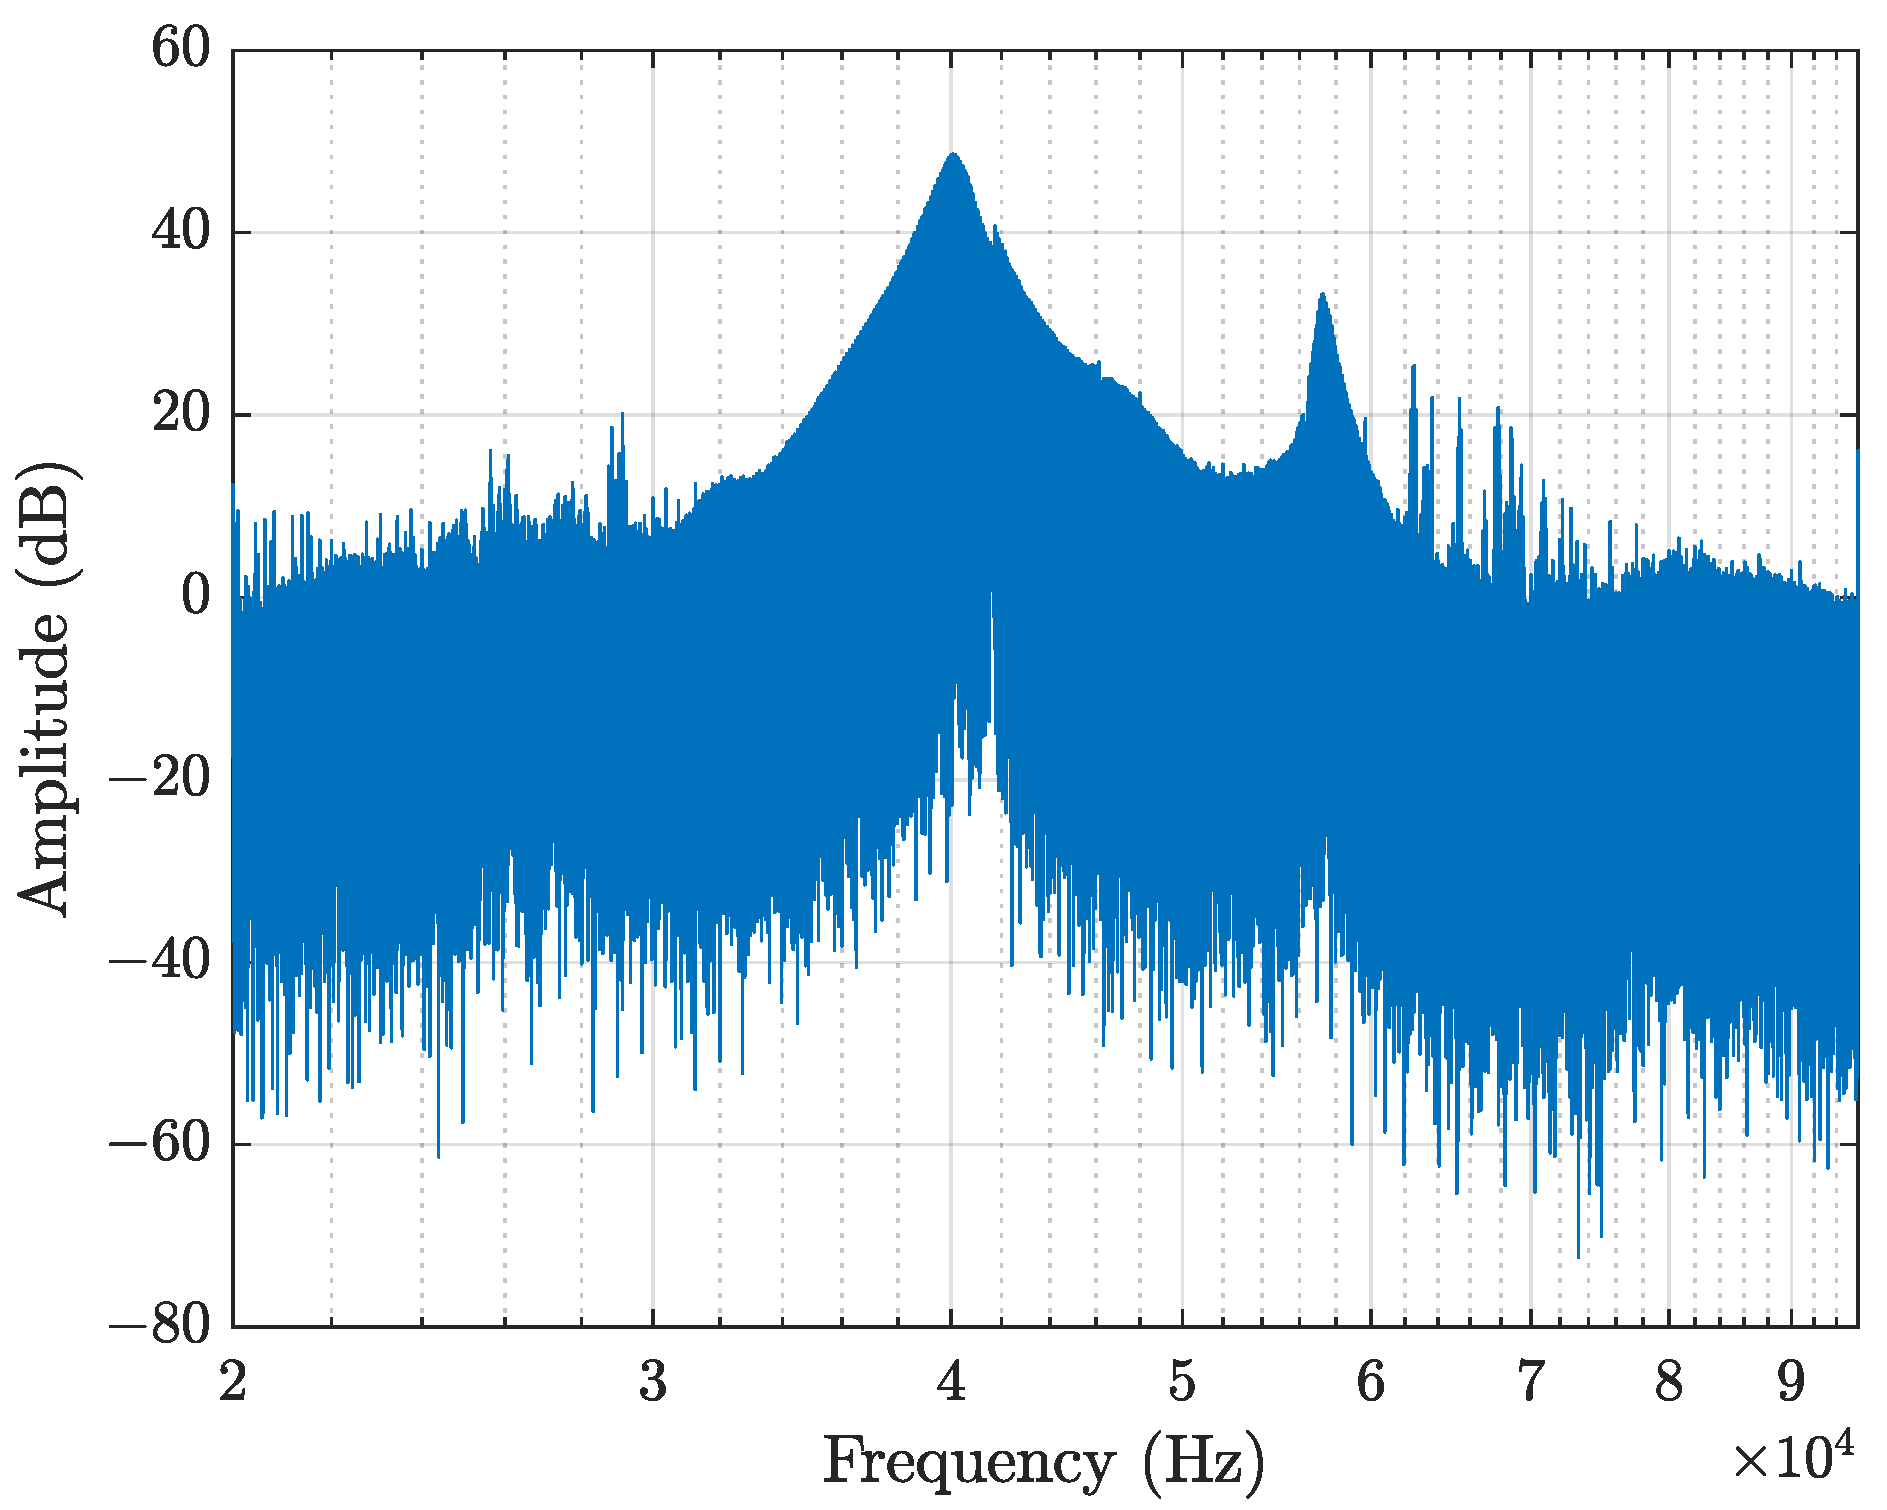
To evaluate the microphone’s ability to capture frequencies higher than those specified by the manufacturer, the Behringer B-5 was tested using an ultrasonic loudspeaker. Although the power output of the speaker is unknown, the test aimed to assess whether the microphone can detect ultrasonic signals. The results, shown in Figure 8, reveal a prominent peak around 40 kHz, which corresponds to the resonance frequency of the ultrasonic speaker used in the test. This peak confirms the expected behavior of the speaker and indicates that the microphone is capable of detecting signals in the ultrasonic range, which qualifies it well for insect monitoring.

3.3. Software Design

The acoustic trap system developed in this study is based on a software architecture that can capture high-sampling-rate audio recordings and compress the recorded data in real time. The system was developed using the Python 3.11.2 programming language, and hardware resources are used efficiently thanks to multi-threaded structures and multi-processing support.

3.3.1. Audio Recording and Compression

Audio data is recorded at a sampling rate of 190 kHz using the HiFiBerry DAC+ADC Pro card. This rate was chosen to accurately record the high-frequency sounds emitted by high-frequency biological species. The HiFiBerry device supports sampling up to a maximum of 192 kHz. However, during compression, files with a 192 kHz sampling rate had a compression ratio of approximately two as compared to original WAV files. Files with a 190 kHz sampling rate had compression ratio of more than six. For this reason, this sampling rate was chosen. Recordings are saved as WAV files, each with a fixed length of 1 min. This duration was chosen to keep the size of the data files manageable and to enhance the efficiency of the simultaneous compression process. File names are generated sequentially, and each new recording is numbered using a counter.
The Free Lossless Audio Codec (FLAC) algorithm was chosen to ensure lossless compression while reducing storage space. The study in [55] evaluated various audio compression algorithms and found that FLAC provided the best compression rates among the lossless methods for audio files sampled at 250 kHz. The Fast Forward Moving Picture Experts Group (FFmpeg) framework was used for WAV to FLAC conversion. All FFmpeg parameters used during the compression process have been left at the system’s default settings, with only the compression level of the FLAC algorithm set to 2. This level falls within the FLAC compression range, which varies from 0 (fastest, lowest compression) to 8 (slowest, highest compression), offering a balanced choice between processing time and compression ratio. Level 2 was chosen to provide sufficient compression efficiency in environments with limited processing power, such as embedded systems, while keeping the load on the processor low.
As shown in Figure 9, even when the same parameters are used, different compression ratios result at different sampling rates. Although there is no research on the reason for this, it is thought that it may be related to the amount of memory space occupied by the data. As shown in Figure 8, the microphone is capable of capturing high-frequency data up to approximately 95 kHz. Considering a suitable trade-off between a higher sampling rate, required to record signals in this frequency range, and the resulting compression ratio, a sampling rate of 190 kHz was selected. Since insects can produce sounds ranging from 152 Hz to 90 kHz, as reported in the review by Low et al. [56], this sampling rate also satisfies the Shannon–Nyquist sampling theorem for the entire frequency range of interest.

3.3.2. Raspberry Pi Integration

The software is configured as a system service on the Raspberry Pi. This ensures that the system continues to run automatically when the device is restarted or unexpectedly shut down and restarted. In addition, the system service is set to be automatically restarted by systemd in the event of a failure. This structure ensures continuous and stable operation of the system in long-term, unattended field applications. Additionally, there is a second service that runs when the device starts up. This service reads the date and time information from the RTC module and displays it on the LCD screen for a short period after initialization. This screen not only visually confirms whether the system is active but also facilitates the tracking of time-stamped events.

4. Evaluation of the System

4.1. Runtime Analysis

In order to estimate the runtime of our recording system, we analyzed the power consumption of the major components individually and their summation to the total system power consumption. Therefore, we used a Nordic Semiconductor Power Profiler Kit II [57], set up a supply voltage of 5 V and measured the current consumption of the components. The measurements were re-sampled to a sample rate of 10 Hz and performed in two steps:
1.
Raspberry Pi Zero 2 W together with the Hifi Berry DAC+ADC Pro and RTC shield.
2.
Xvive P1 Phantom Power Supply with an connected artificial microphone load (cf. Section 3.2.2).
As the phantom power supply is equipped with an internal battery, we made sure to fully charge it before running the measurements, to avoid falsifying the results by the additional charging current. The resulting power consumption for both measurements as well as the total system consumption is visualized in Figure 10 for a time frame of approximately 12 min.
As the figure shows, the power consumption of the phantom power supply is approximately constant at 330 mW. The Raspberry Pi has a variable power consumption. It takes approximately 1.5 min to completely boot up and start the software components (cf. Section 3.3). Afterwards the system reaches a stable state with characteristic, repeating power consumption patterns. As the FLAC conversion adds significant load on the system, the power consumption is increased during conversion periods. The remaining periods are govern by a lower power consumption and minor sporadic spikes as a result of activities of the underlying operating system. In order to quantify the results, we calculated the mean and standard deviation of the power consumption after the boot up time. The quantitative results are given in Table 2, including the values for the Raspberry Pi, the phantom power supply as well as the entire system.
Additionally, we also included an estimation of the system runtime based on the measured values for several common battery capacities. For a battery capacity of 288 W h, as used in our system, the estimated runtime is approximately 192 h, or eight days. Naturally, the real runtime additionally depends on manufacturing tolerances and further external parameters as the prevailing temperature. However, the calculation lines up with the runtimes we observed during the system deployment, allowing to give an estimate for real deployments and decision support on the battery selection.

4.2. Real World Experiments

The system was installed in six rapeseed fields in Lower Saxony, Germany. The location of each acoustic trap is detailed in Figure 11a. The traps were installed in early April 2025, a few weeks after the rapeseed was sown, and remained in operation until their removal at the end of the month, by which time the rapeseed flowers had already bloomed. Figure 11b,c show the system on the first day of installation and on the day of its removal, respectively. The data from the Deutscher Wetterdienst [58] indicate total precipitation in the fields ranging from 21 to 40 mm during the observation period, and wind speeds in the region reaching up to 25.2 m/s.
Considering the six installation points, more than 3400 h of recordings were obtained. The number of audio files and compressed file sizes for each acoustic trap recorded in the field is shown in Table 3. During the deployment, we observed a runtime duration with the power bank of approximately seven to ten days.
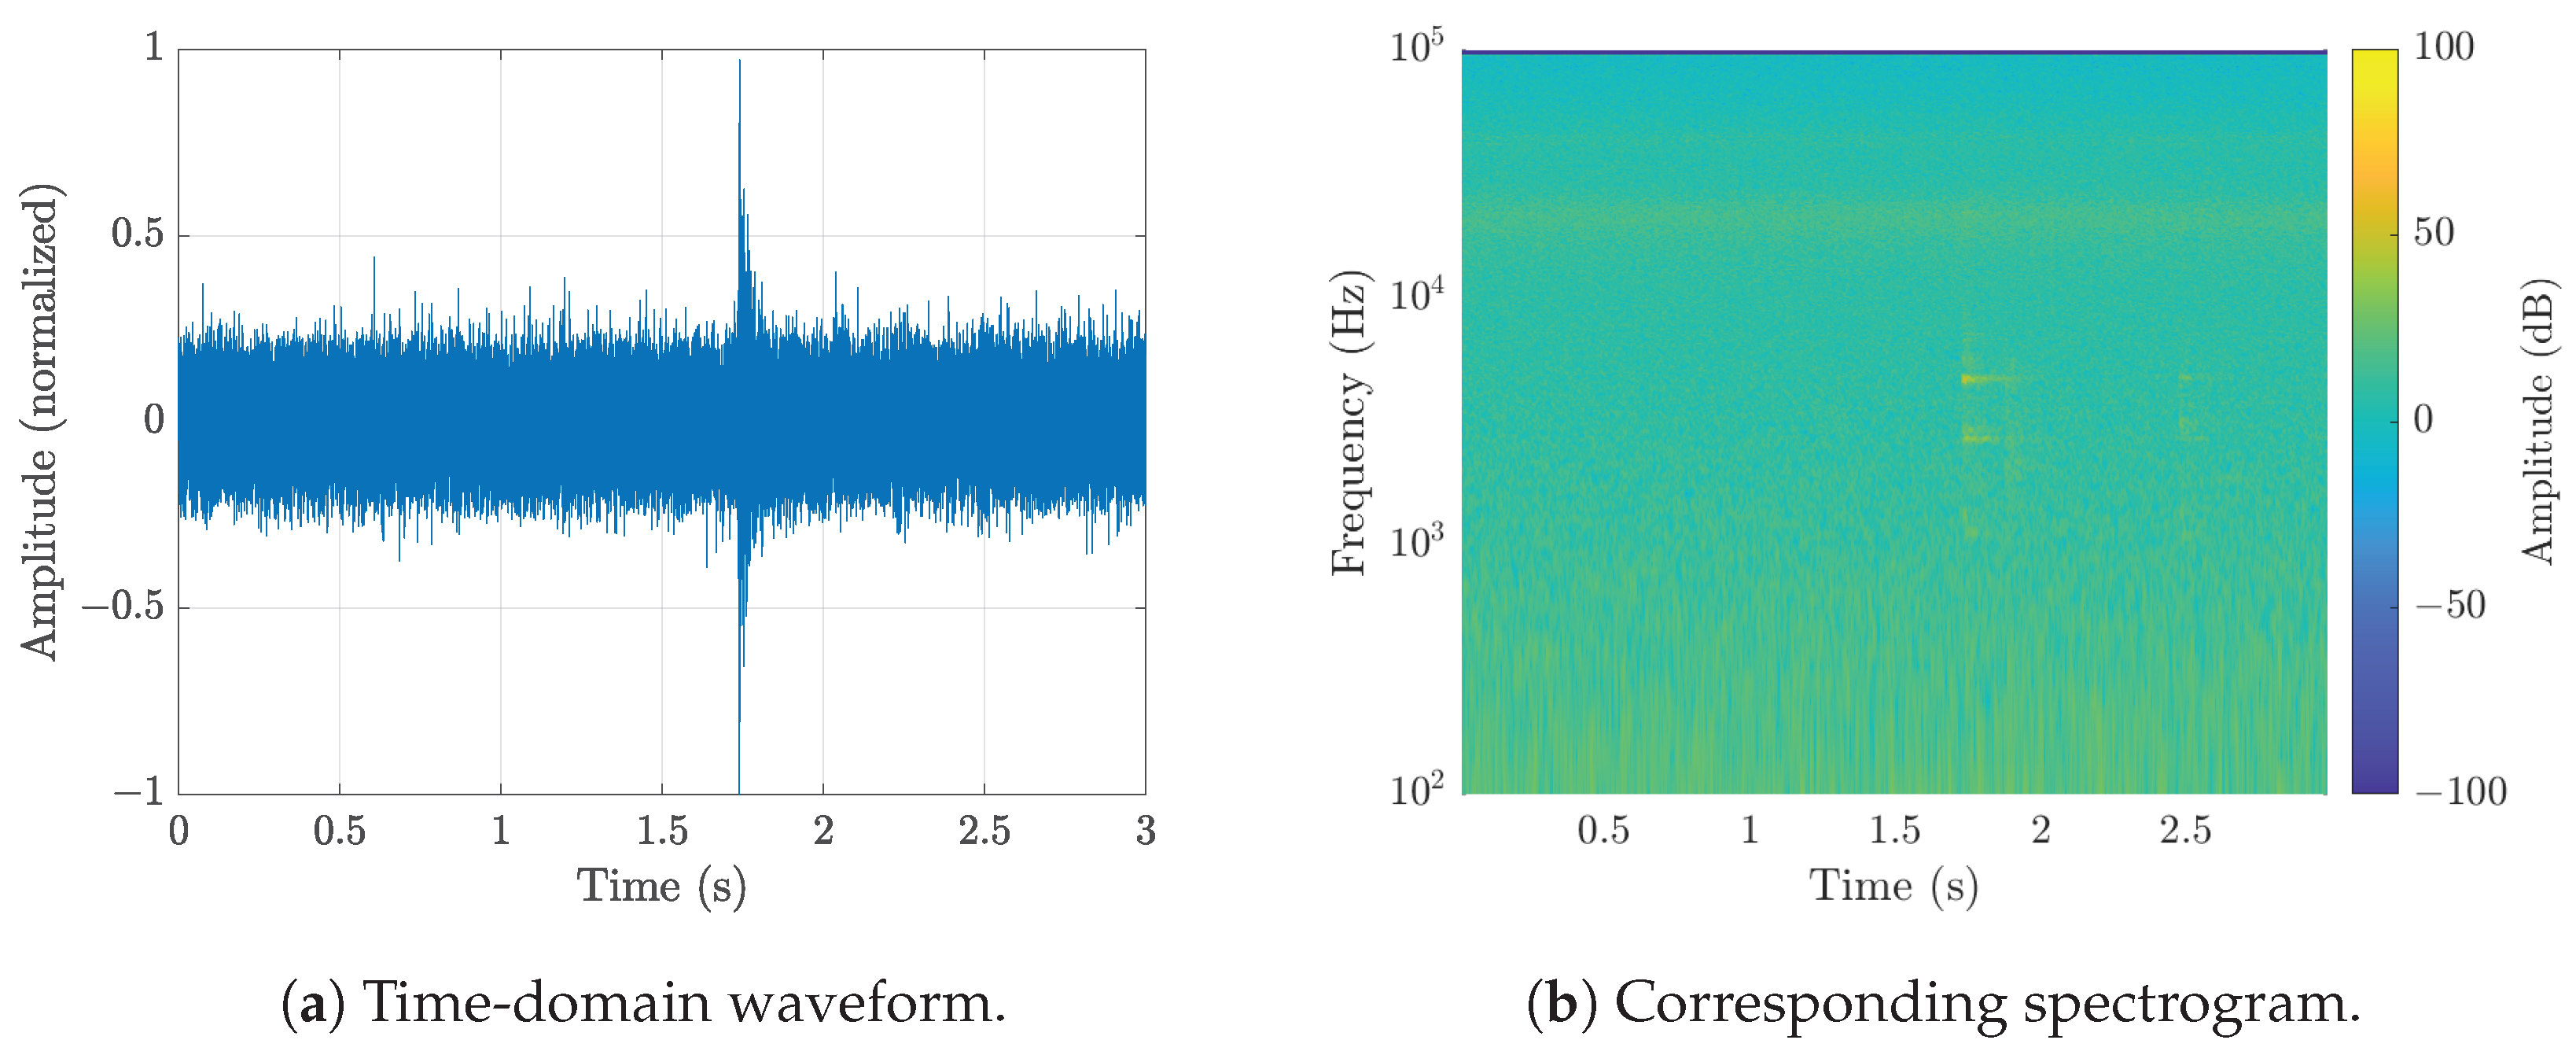
The system operated reliably throughout the entire deployment period, from installation to removal, without any malfunctions or performance issues. All files were successfully recorded with sufficient quality to support insect identification. Figure 12 displays the spectrogram of a specific period from an audio segment in which the presence of an insect was identified through manual listening.
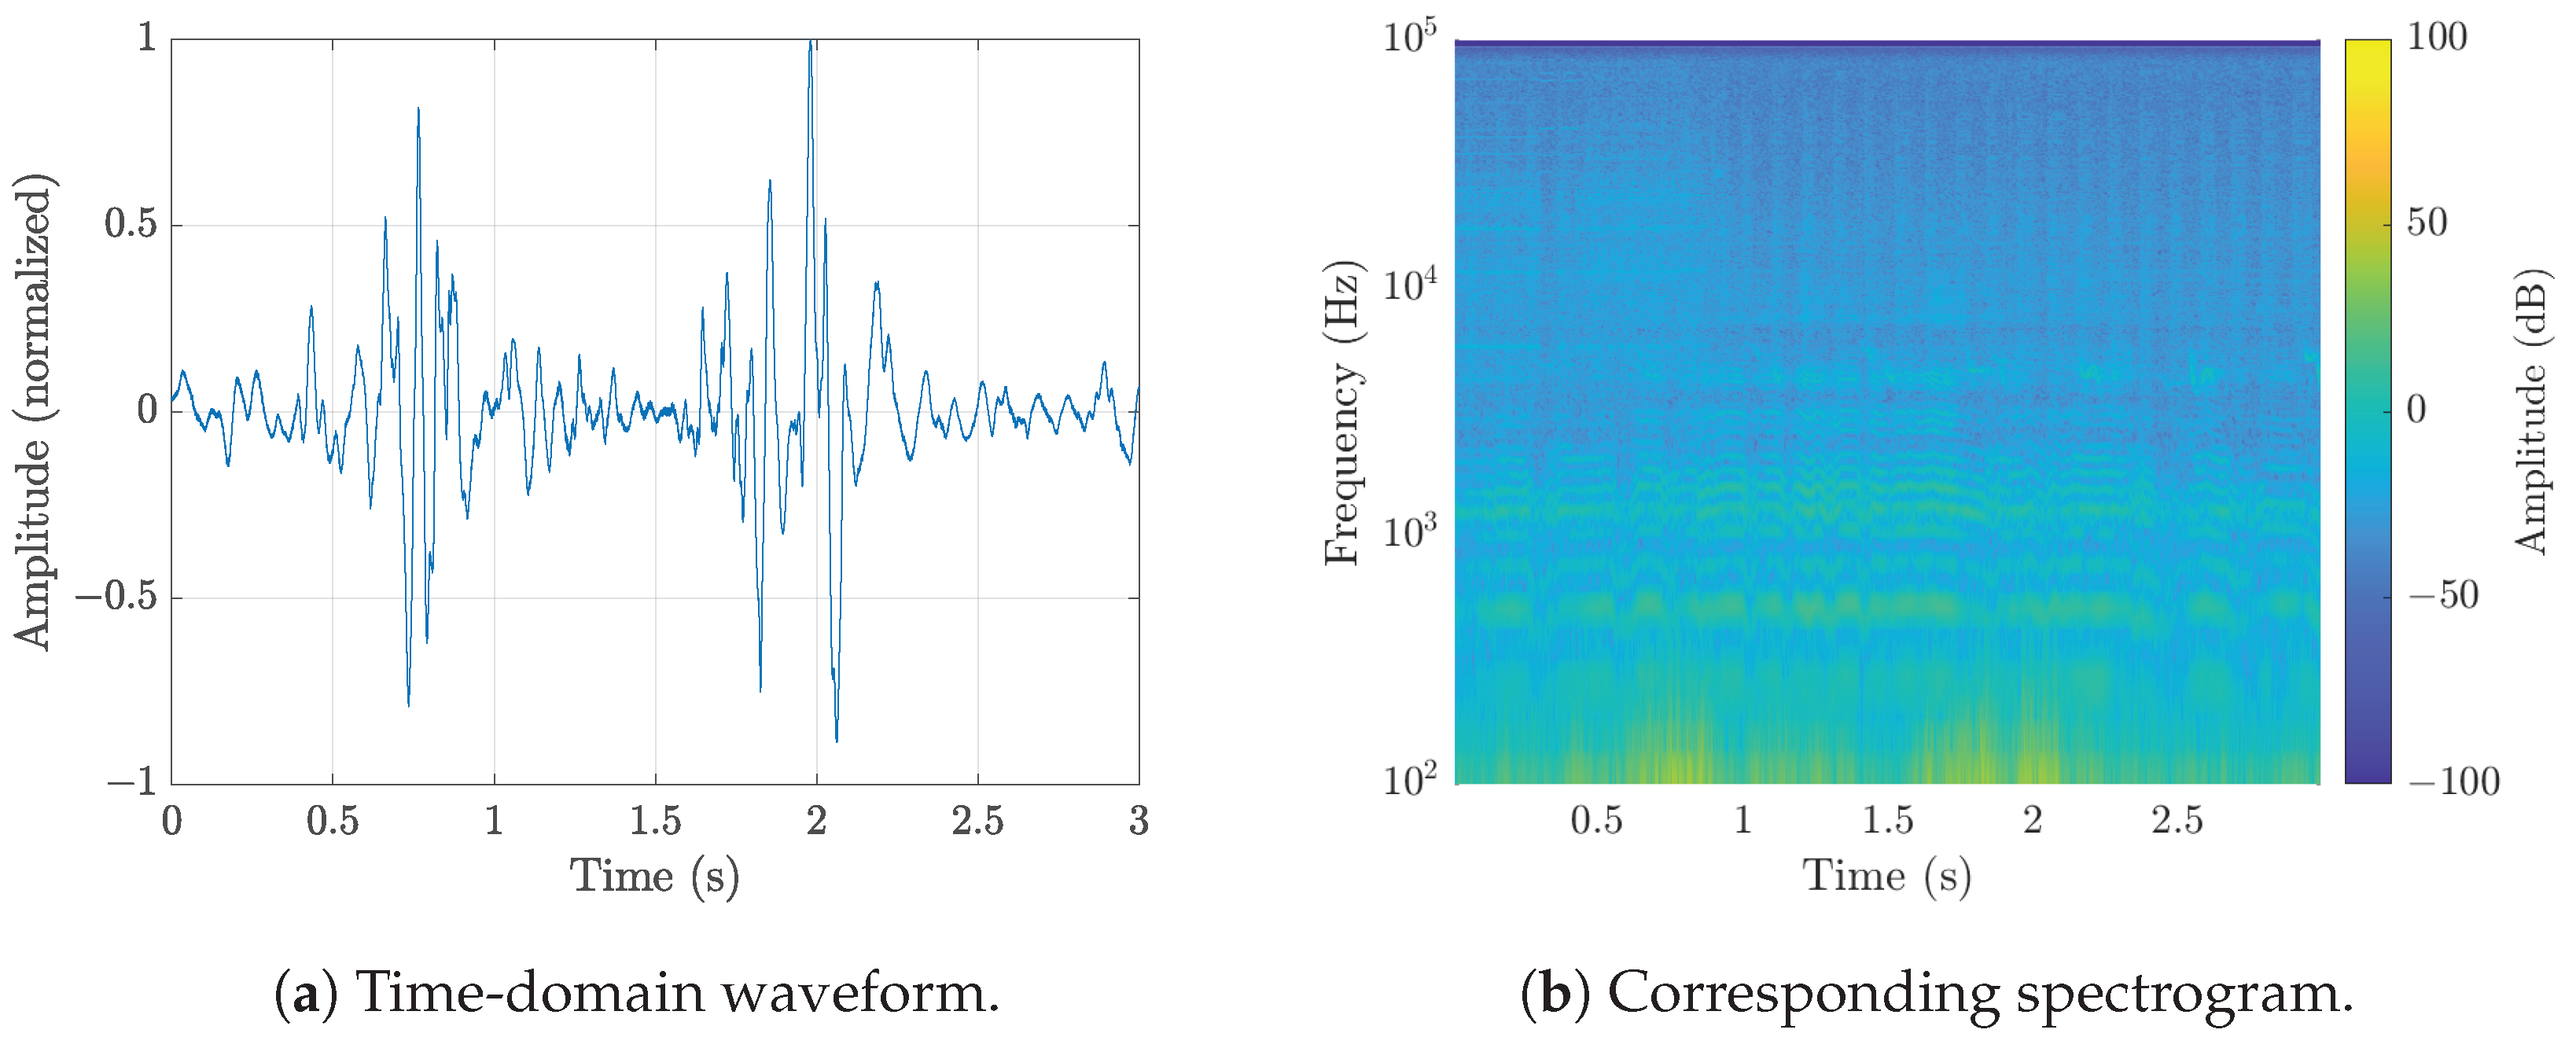
Figure 13 shows a signal of the same duration recorded using the bioacoustic monitoring system described in [24], displayed in the time domain and as a spectrogram. A comparison of the results shows that this system achieves superior performance among the tested devices, with a higher SNR. However, its high cost, lack of weatherproofing, and sampling rate limitations, which make it unsuitable for outdoor use, render it impractical for the objectives of this study. In contrast, Figure 14 presents a signal recorded with the AudioMoth system, which exhibits considerable self-noise. While this system has been shown to be effective for louder signals, as reported in [14], its SNR is inadequate for insect monitoring applications.

5. Insights, Lessons Learned, and Future Work

One of the most critical insights from the system development process was the importance of selecting low self-noise components. This requirement became especially evident when working with insect sounds, which are generally much quieter than those produced by other animals. After comparing several alternatives and evaluating their SNRs and directionality, the Behringer B5 microphone with the cardioid capsule was selected. The decision was supported by controlled experiments showing that this configuration provided a favorable balance between SNR, cost, and directionality. Using the satellite dish as an acoustic reflector further emphasized the benefits of using a directional microphone to focus on a target area while minimizing background noise.
Concerns regarding the hardware setup and component selection were validated in practice, as they contributed directly to the high quality of the recordings. This underscores the importance of carefully choosing each element of the recording system. Although the systems were carefully selected for their low self-noise, even lower self-noise devices would be desirable for recording certain insect species, as these are considerably quieter than other animals. In some recordings, for instance, birds are more easily identifiable than insects, even though the insects are probably closer to the microphone than the birds. On the other hand, the recording schedule functioned excellently, and the selected compression settings allowed the system to operate continuously for the entire planned period without requiring memory card replacement or data deletion.
Integrating multiple components into a single, field-ready acoustic monitoring system introduced several challenges. Chief among these was achieving a balance between data quality, storage capacity, and energy consumption. The prototype required robust and modular hardware capable of enduring outdoor conditions while maintaining a low noise floor and continuous power supply. All the physical design concerns proved important during deployment, ensuring continuous operation even under adverse weather conditions such as rain and strong winds. The waterproof structure functioned as intended, and all six installed systems operated without interruption or failure. The modular construction enabled effective adaptation to field conditions, and the positioning of the yellow satellite dish was successfully integrated with the growth of nearby plants.
Overall, both the hardware and software performed reliably, resulting in over 3400 h of recordings, from which insect sounds could be identified. Significant differences were observed between lab and field recordings. While lab conditions allowed for controlled experiments and high-quality data collection, field deployments introduced variables such as wind, birds, and varying ambient noise, as expected. The system was deployed for 25 days in rapeseed fields, which offered valuable insights into its mechanical durability and acoustic performance under real-world conditions. These experiences reinforced the need to design enclosures that protect sensitive components while maintaining functionality in diverse weather scenarios.
Signals with frequencies above the typically evaluated range were detected, reinforcing the importance of selecting an appropriate sampling rate. These signals may potentially originate from insect activity, which highlights the need for further investigation. To further improve the system, a more detailed analysis of the microphone’s performance with ultrasonic signals would be beneficial. The results could better inform the decision to maintain the current microphone or switch to an ultrasonic model. Additionally, comparisons between different microphone types—including ultrasonic microphones—should be conducted to assess the feasibility of using devices that do not require phantom power, thereby reducing overall energy consumption.
The prototype system generated a large volume of data, highlighting the need for efficient data management strategies. To address this, several improvements are proposed for an intermediate prototype aimed at collecting high-quality data for subsequent model training that will be implemented in the final IoT-based system for biodiversity monitoring. Although the addition of a camera would increase the overall data volume, it could significantly facilitate post-processing and analysis. By detecting visual changes near the satellite dish using automated models, the system could focus only on relevant acoustic segments and support species identification more efficiently. This targeted approach may ultimately reduce the amount of acoustic data that needs to be analyzed and improve annotation quality. Reducing energy consumption remains a key priority for the next development stages, especially given the goal of enabling real-time insect monitoring. Achieving this will require not only optimizing energy usage but also improving the overall efficiency of the hardware system. A crucial step in this process is analyzing the audio files collected with the current prototype to better understand the signal characteristics, including insect sound features, background noise, and other interfering elements. This analysis will inform the design of more efficient data processing strategies. Additionally, exploring alternative energy sources may help reduce the system’s dependency on conventional power supplies.
A review of existing acoustic monitoring systems revealed that most were designed for louder animals, such as birds and frogs, and often lacked the sensitivity and directionality required for insect monitoring. Furthermore, many of these systems did not include embedded processing capabilities, relying instead on post-hoc analysis. This study addresses these limitations by proposing a system specifically tailored for low-amplitude insect sounds, emphasizing low self-noise hardware and potential for real-time processing.
Our suggestion for other researchers aiming to develop similar systems is to begin by carefully selecting and testing components, especially microphones and power sources. It is essential to validate performance in both laboratory and field conditions, as environmental factors can significantly impact data quality. Efforts should also be made to balance the ambition of comprehensive data collection with practical constraints related to energy, storage, and processing. Finally, documenting all challenges, trade-offs, and system failures is crucial, not only for iterative improvements but also to support the broader research community in developing effective and efficient monitoring systems.

6. Conclusions

In this paper, we presented the concept and implementation of an acoustic trap for insect sound monitoring. By combining the informed choice of a microphone with a Raspberry Pi Zero 2 W, a HiFiBerry DAC+ADC Pro, a RTC board, and a power bank capable of supplying phantom power, the first prototype of the system was developed. The development process underscored the critical role of selecting appropriate electronic components and implementing a robust mechanical design to ensure high-quality signal acquisition and reliable system performance under field conditions. Furthermore, the appropriate configuration of parameters such as sampling rate and compression method was essential to achieve efficient, high-quality and high-frequency data acquisition and storage.
Specific tests of each component were conducted in controlled environments before deploying the system under real field conditions. For example, tests included the analysis of energy consumption, the evaluation of the microphone’s capability to record high-frequency signals, and comparisons to select specific components. These preliminary assessments were important to ensure the proper functioning of the system in the field. Consequently, the prototype’s functionality was verified, yielding 25 days of recordings across six rapeseed fields and generating more than 1.5 TB of audio data. The objective of this study was successfully achieved by developing an acoustic recording system designed to function as an acoustic trap for insect identification. Throughout the project, we addressed key technical and practical challenges, including component selection, mechanical design, and system configuration. By documenting the main requirements, encountered difficulties, and lessons learned, this work provides valuable insights that can support and guide the academic community in implementing similar systems for future research endeavors.
This system contributes to ongoing efforts in autonomous insect acoustic monitoring by enabling continuous, high-quality audio data collection in field environments. While further development is required to integrate the device into a comprehensive IoT ecosystem and address power management and environmental robustness, the encouraging results obtained here provide a solid foundation for future improvements.

Author Contributions

Conceptualization, C.S., B.F., D.S. and A.R.; methodology, C.S., B.F., D.S. and A.R.; software, C.S.; validation, C.S., B.F. and D.S.; formal analysis, C.S., B.F. and D.S.; investigation, C.S., B.F., D.S. and A.R.; resources, A.R.; data curation, C.S., B.F. and D.S.; writing—original draft preparation, C.S., B.F. and D.S.; writing—review and editing, C.S., B.F., D.S. and A.R.; visualization, C.S., B.F. and D.S.; supervision, A.R.; project administration, A.R.; funding acquisition, A.R. All authors have read and agreed to the published version of the manuscript.

Funding

This research has received financial support from Stiftung Zukunftsfonds Asse under project grant number 2023-066A.

Data Availability Statement

The data presented in this study are available on request from the corresponding author due to privacy.

Acknowledgments

The authors gratefully acknowledge Jörn Körner for his invaluable assistance in assembling and installing the systems in the field. We would also like to thank Doreen Gabriel and Tim Wünschirs from the Julius Kühn Institute for their availability and support during the installation and maintenance of the systems, as well as for their valuable guidance throughout the study. The authors also express their gratitude to the farmers for granting access to their fields, especially Gunnar Breustedt for his coordination efforts and communication with the other participating farmers.

Conflicts of Interest

The authors declare no conflicts of interest.

Abbreviations

The following abbreviations are used in this manuscript:
DACDigital Analog Converter
ADCAnalog Digital Converter
GPIOGeneral Purpose Input/Output
RTCReal-Time Clock
LCDLiquid Crystal Display
PCBPrinted Circuit Board
SNRSignal-to-Noise Ratio
FLACFree Lossless Audio Codec
FFmpegForward Moving Picture Experts Group
WAVWaveform Audio File Format
PCMPulse Code Modulation
AIArtificial Intelligence

References

  1. Zwerts, J.A.; Stephenson, P.; Maisels, F.; Rowcliffe, M.; Astaras, C.; Jansen, P.A.; van Der Waarde, J.; Sterck, L.E.; Verweij, P.A.; Bruce, T.; et al. Methods for wildlife monitoring in tropical forests: Comparing human observations, camera traps, and passive acoustic sensors. Conserv. Sci. Pract. 2021, 3, e568. [Google Scholar]
  2. Mutanu, L.; Gohil, J.; Gupta, K.; Wagio, P.; Kotonya, G. A Review of Automated Bioacoustics and General Acoustics Classification Research. Sensors 2022, 22, 8361. [Google Scholar] [CrossRef]
  3. Chung, A.W.L.; To, W.M. Mapping Soundscape Research: Authors, Institutions, and Collaboration Networks. Acoustics 2025, 7, 38. [Google Scholar] [CrossRef]
  4. Stowell, D. Computational bioacoustics with deep learning: A review and roadmap. PeerJ 2022, 10, e13152. [Google Scholar] [CrossRef] [PubMed]
  5. Sharma, S.; Sato, K.; Gautam, B.P. A Methodological Literature Review of Acoustic Wildlife Monitoring Using Artificial Intelligence Tools and Techniques. Sustainability 2023, 15, 7128. [Google Scholar] [CrossRef]
  6. Alberti, S.; Stasolla, G.; Mazzola, S.; Casacci, L.P.; Barbero, F. Bioacoustic IoT Sensors as Next-Generation Tools for Monitoring: Counting Flying Insects through Buzz. Insects 2023, 14, 924. [Google Scholar] [CrossRef]
  7. Passias, A.; Tsakalos, K.A.; Rigogiannis, N.; Voglitsis, D.; Papanikolaou, N.; Michalopoulou, M.; Broufas, G.; Sirakoulis, G.C. Insect Pest Trap Development and DL-Based Pest Detection: A Comprehensive Review. IEEE Trans. AgriFood Electron. 2024, 2, 323–334. [Google Scholar] [CrossRef]
  8. Kyalo, H.; Tonnang, H.; Egonyu, J.; Olukuru, J.; Tanga, C.; Senagi, K. Automatic synthesis of insects bioacoustics using machine learning: A systematic review. Int. J. Trop. Insect Sci. 2025, 45, 101–120. [Google Scholar] [CrossRef]
  9. European Parliament and Directorate-General for Parliamentary Research Services; Daheim, C.; Poppe, K.; Schrijver, R. Precision Agriculture and the Future of Farming in Europe—Scientific Foresight Study; European Parliament: Brussels, Belgium, 2016. [Google Scholar]
  10. Dokic, K.; Blaskovic, L.; Mandusic, D. From machine learning to deep learning in agriculture – the quantitative review of trends. IOP Conf. Ser. Earth Environ. Sci. 2020, 614, 012138. [Google Scholar] [CrossRef]
  11. Xie, J.; Hu, K.; Zhu, M.; Guo, Y. Data-driven analysis of global research trends in bioacoustics and ecoacoustics from 1991 to 2018. Ecol. Inform. 2020, 57, 101068. [Google Scholar] [CrossRef]
  12. Schoeman, R.P.; Erbe, C.; Pavan, G.; Righini, R.; Thomas, J.A. Analysis of Soundscapes as an Ecological Tool. In Exploring Animal Behavior Through Sound: Volume 1: Methods; Springer International Publishing: Cham, Switzerland, 2022; pp. 217–267. [Google Scholar] [CrossRef]
  13. Zhang, M.; Yan, L.; Luo, G.; Li, G.; Liu, W.; Zhang, L. A novel insect sound recognition algorithm based on MFCC and CNN. In Proceedings of the 2021 6th International Conference on Communication, Image and Signal Processing (CCISP), Chengdu, China, 19–21 November 2021; IEEE: New York, NY, USA, 2021; pp. 289–294. [Google Scholar]
  14. Hill, A.P.; Prince, P.; Piña Covarrubias, E.; Doncaster, C.P.; Snaddon, J.L.; Rogers, A. AudioMoth: Evaluation of a smart open acoustic device for monitoring biodiversity and the environment. Methods Ecol. Evol. 2018, 9, 1199–1211. [Google Scholar] [CrossRef]
  15. Vella, K.; Capel, T.; Gonzalez, A.; Truskinger, A.; Fuller, S.; Roe, P. Key Issues for Realizing Open Ecoacoustic Monitoring in Australia. Front. Ecol. Evol. 2022, 9. [Google Scholar] [CrossRef]
  16. Verma, R.; Kumar, S. AviEar: An IoT-based Low Power Solution for Acoustic Monitoring of Avian Species. IEEE Sensors J. 2024, 24, 42088–42102. [Google Scholar] [CrossRef]
  17. Manzano-Rubio, R.; Bota, G.; Brotons, L.; Soto-Largo, E.; Pérez-Granados, C. Low-cost open-source recorders and ready-to-use machine learning approaches provide effective monitoring of threatened species. Ecol. Inform. 2022, 72, 101910. [Google Scholar] [CrossRef]
  18. Larsen, A.S.; Schmidt, J.H.; Stapleton, H.; Kristenson, H.; Betchkal, D.; McKenna, M.F. Monitoring the phenology of the wood frog breeding season using bioacoustic methods. Ecol. Indic. 2021, 131, 108142. [Google Scholar] [CrossRef]
  19. Kahl, S.; Wood, C.M.; Eibl, M.; Klinck, H. BirdNET: A deep learning solution for avian diversity monitoring. Ecol. Inform. 2021, 61, 101236. [Google Scholar] [CrossRef]
  20. Nokelainen, O.; Lauha, P.; Andrejeff, S.; Hänninen, J.; Inkinen, J.; Kallio, A.; Lehto, H.J.; Mutanen, M.; Paavola, R.; Schiestl-Aalto, P.; et al. A mobile application–based citizen science product to compile bird observations. Citiz. Sci. Theory Pract. 2024, 9, 24. [Google Scholar] [CrossRef]
  21. Sanborn, A.F.; Phillips, P.K. Scaling of sound pressure level and body size in cicadas (Homoptera: Cicadidae; Tibicinidae). Ann. Entomol. Soc. Am. 1995, 88, 479–484. [Google Scholar] [CrossRef]
  22. Madhusudhana, S.; Klinck, H.; Symes, L.B. Extensive data engineering to the rescue: Building a multi-species katydid detector from unbalanced, atypical training datasets. Philos. Trans. R. Soc. B 2024, 379, 20230444. [Google Scholar] [CrossRef] [PubMed]
  23. Müller, J.; Mitesser, O.; Schaefer, H.M.; Seibold, S.; Busse, A.; Kriegel, P.; Rabl, D.; Gelis, R.; Arteaga, A.; Freile, J.; et al. Soundscapes and deep learning enable tracking biodiversity recovery in tropical forests. Nat. Commun. 2023, 14, 6191. [Google Scholar] [CrossRef]
  24. Branding, J.; von Hörsten, D.; Wegener, J.K.; Böckmann, E.; Hartung, E. Towards noise robust acoustic insect detection: From the lab to the greenhouse. KI-Künstliche Intell. 2023, 37, 157–173. [Google Scholar] [CrossRef]
  25. Ribeiro, A.P.; da Silva, N.F.F.; Mesquita, F.N.; Araújo, P.d.C.S.; Rosa, T.C.; Mesquita-Neto, J.N. Machine learning approach for automatic recognition of tomato-pollinating bees based on their buzzing-sounds. PLoS Comput. Biol. 2021, 17, e1009426. [Google Scholar] [CrossRef] [PubMed]
  26. Çoban, E.B.; Perra, M.; Pir, D.; Mandel, M.I. EDANSA-2019: The Ecoacoustic Dataset from Arctic North Slope Alaska. In Proceedings of the DCASE, Nancy, France, 3–4 November 2022. [Google Scholar]
  27. Karar, M.E.; Reyad, O.; Abdel-Aty, A.H.; Owyed, S.; Hassan, M.F. Intelligent IoT-Aided Early Sound Detection of Red Palm Weevils. Comput. Mater. Contin. 2021, 69, 4095–4111. [Google Scholar] [CrossRef]
  28. Zamanian, H.; Pourghassem, H. Insect identification based on bioacoustic signal using spectral and temporal features. In Proceedings of the 2017 Iranian Conference on Electrical Engineering (ICEE), Tehran, Iran, 2–4 May 2017; IEEE: New York, NY, USA, 2017; pp. 1785–1790. [Google Scholar]
  29. Noda, J.J.; Travieso-González, C.M.; Sánchez-Rodríguez, D.; Alonso-Hernández, J.B. Acoustic classification of singing insects based on MFCC/LFCC fusion. Appl. Sci. 2019, 9, 4097. [Google Scholar] [CrossRef]
  30. Prince, P.; Hill, A.; Piña Covarrubias, E.; Doncaster, P.; Snaddon, J.L.; Rogers, A. Deploying acoustic detection algorithms on low-cost, open-source acoustic sensors for environmental monitoring. Sensors 2019, 19, 553. [Google Scholar]
  31. Yin, M.S.; Haddawy, P.; Ziemer, T.; Wetjen, F.; Supratak, A.; Chiamsakul, K.; Siritanakorn, W.; Chantanalertvilai, T.; Sriwichai, P.; Sa-ngamuang, C. A deep learning-based pipeline for mosquito detection and classification from wingbeat sounds. Multimed. Tools Appl. 2023, 82, 5189–5205. [Google Scholar]
  32. Branding, J.; von Hörsten, D.; Böckmann, E.; Wegener, J.K.; Hartung, E. InsectSound1000 An insect sound dataset for deep learning based acoustic insect recognition. Sci. Data 2024, 11, 475. [Google Scholar] [CrossRef]
  33. Faiß, M.; Stowell, D. Adaptive representations of sound for automatic insect recognition. PLoS Comput. Biol. 2023, 19, e1011541. [Google Scholar] [CrossRef]
  34. Hexasoft. Acheta Domestica Femelle. 2006. CC0 1.0 Universal Public Domain Dedication. Available online: https://commons.wikimedia.org/wiki/File:Acheta_domestica_femelle.png (accessed on 13 September 2025).
  35. Almbauer, M. Erdhummel (Bombus terrestris) 2. 2018. CC0 1.0 Universal Public Domain Dedication. Available online: https://commons.wikimedia.org/wiki/File:Erdhummel_(Bombus_terrestris)2.jpg (accessed on 13 September 2025).
  36. Heng, V. Episyrphus balteatus. 2022. CC0 1.0 Universal Public Domain Dedication. Available online: https://commons.wikimedia.org/wiki/File:Episyrphus_balteatus_200921170.jpg (accessed on 13 September 2025).
  37. Krisp, H. Rote Keulenschrecke (Gomphocerippus rufus) Weiblich. 2020. CC BY 4.0 International. Available online: https://commons.wikimedia.org/wiki/File:Rote_Keulenschrecke_Gomphocerippus_rufus_weiblich.jpg (accessed on 13 September 2025).
  38. Gabler, P. Tettigonia viridissima. 2021. CC0 1.0 Universal Public Domain Dedication. Available online: https://commons.wikimedia.org/wiki/File:Tettigonia_viridissima_156296293.jpg (accessed on 13 September 2025).
  39. Santer, R.D.; Allen, W.L. Optimising the colour of traps requires an insect’s eye view. Pest Manag. Sci. 2024, 80, 931–934. [Google Scholar]
  40. Yin, M.S.; Haddawy, P.; Nirandmongkol, B.; Kongthaworn, T.; Chaisumritchoke, C.; Supratak, A.; Sa-Ngamuang, C.; Sriwichai, P. A lightweight deep learning approach to mosquito classification from wingbeat sounds. In Proceedings of the Conference on Information Technology for Social Good, Rome, Italy, 9–11 September 2021; pp. 37–42. [Google Scholar]
  41. Sarria-S, F.A.; Morris, G.K.; Windmill, J.F.; Jackson, J.; Montealegre-Z, F. Shrinking wings for ultrasonic pitch production: Hyperintense ultra-short-wavelength calls in a new genus of neotropical katydids (Orthoptera: Tettigoniidae). PLoS ONE 2014, 9, e98708. [Google Scholar] [CrossRef]
  42. Microchip Technology. ATmega328/P: 8-bit AVR Microcontrollers with 32K Bytes In-System Programmable Flash; Microchip Technology Inc.: Chandler, AZ, USA, 2016. [Google Scholar]
  43. Microchip Technology. SAM3X/SAM3A 32-Bit ARM Cortex-M3 Microcontroller; Microchip Technology Inc.: Chandler, AZ, USA, 2012. [Google Scholar]
  44. Lytrix. Teensy4-i2s-TDM: Teensy 4 I2S TDM Audio Library with AK4619 Support. 2025. Available online: https://github.com/Lytrix/Teensy4-i2s-TDM (accessed on 25 August 2025).
  45. Raspberry Pi Foundation. Raspberry Pi Zero 2 W Technical Specifications; Technical Product Page; Raspberry Pi Foundation: Cambridge, UK, 2021. [Google Scholar]
  46. HiFiBerry Team. HiFiBerry DAC+ADC Pro Hardware Specification; Technical Datasheet; HiFiBerry: Zurich, Switzerland, 2023; Available online: https://www.hifiberry.com/docs/data-sheets/datasheet-dac-adc-pro/ (accessed on 21 July 2025).
  47. Maxim Integrated. DS1302: Trickle-Charge Timekeeping Chip; Rev 2; Datasheet; Maxim Integrated: San Jose, CA, USA, 2022. [Google Scholar]
  48. Balingbing, C.B.; Kirchner, S.; Siebald, H.; Kaufmann, H.H.; Gummert, M.; Van Hung, N.; Hensel, O. Application of a multi-layer convolutional neural network model to classify major insect pests in stored rice detected by an acoustic device. Comput. Electron. Agric. 2024, 225, 109297. [Google Scholar] [CrossRef]
  49. Banga, K.S.; Kotwaliwale, N.; Mohapatra, D.; Babu, V.B.; Giri, S.K.; Bargale, P.C. Assessment of bruchids density through bioacoustic detection and artificial neural network (ANN) in bulk stored chickpea and green gram. J. Stored Prod. Res. 2020, 88, 101667. [Google Scholar] [CrossRef]
  50. Robles-Guerrero, A.; Saucedo-Anaya, T.; Guerrero-Mendez, C.A.; Gómez-Jiménez, S.; Navarro-Solís, D.J. Comparative study of machine learning models for bee colony acoustic pattern classification on low computational resources. Sensors 2023, 23, 460. [Google Scholar] [CrossRef]
  51. Zhang, R.R. PEDS-AI: A novel unmanned aerial vehicle based artificial intelligence powered visual-acoustic pest early detection and identification system for field deployment and surveillance. In Proceedings of the 2023 IEEE Conference on Technologies for Sustainability (SusTech), Portland, OR, USA, 19–22 April 2023; IEEE: New York, NY, USA, 2023; pp. 12–19. [Google Scholar]
  52. XVive. P1 Portable Phantom Power. Available online: https://xvive.com/audio/product/p1-portable-phantom-power/ (accessed on 17 July 2025).
  53. Vonyx. VDX10 Phantom Power. Available online: https://www.maxiaxi.de/vonyx-vdx10-phantomspeisung-48-volt-universal-phantom-power-supply-phantom-leistungsversorgung-mit-adapter-fur-studio-kondensator-mikrofone/ (accessed on 17 July 2025).
  54. Morris, G.; Mason, A. Covert stridulation: Novel sound generation by a South American katydid. Naturwissenschaften 1995, 82, 96–98. [Google Scholar] [CrossRef]
  55. Anderson, M.; Anderson, B. An Analysis of Data Compression Algorithms in the Context of Ultrasonic Bat Bioacoustics. Bachelor’s Thesis, Linnaeus University, Department of Computer Science and Media Technology, Växjö, Sweden, 2022. [Google Scholar]
  56. Low, M.L.; Naranjo, M.; Yack, J.E. Survival sounds in insects: Diversity, function, and evolution. Front. Ecol. Evol. 2021, 9, 641740. [Google Scholar] [CrossRef]
  57. Nordic Semiconductor. Power Profiler Kit II Current Measurement Tool for Embedded Development, 1st ed.; Nordic Semiconductor: Trondheim, Norway, 2020. [Google Scholar]
  58. Deutscher Wetterdienst (DWD). Climate Data Center (CDC)—Precipitation and Wind Data for Lower-Saxony, April 2025. 2025. Available online: https://www.dwd.de (accessed on 6 August 2025).
Figure 1. Spectral and visual comparison of selected insect species. (a) Insect spectogram. Acheta domesticus, Gomphocerippus rufus, and Tettigonia viridissima: audios obtained from InsectSet47 & InsectSet66 [33]. Bombus terrestris and Episyrphus balteatus: audios obtained from InsectSound1000 [32]. (b) Acheta domesticus: image [34]. (c) Bombus terrestris: image [35]. (d) Episyrphus balteatus: image [36]. (e) Gomphocerippus rufus: image [37]. (f) Tettigonia viridissima: image [38].
Iot 06 00058 g001
Figure 2. System installed in the field.
Iot 06 00058 g002
Figure 3. Internal view of the system’s electronic box.
Iot 06 00058 g003
Figure 4. Schemes showing the measurement setup. (a) Loudspeaker positions on a 7 × 7 grid (A−G, 1−7). The 16 highlighted points correspond to the area physically occupied by the dish, where speakers were magnetically attached. (b) Position of the loudspeakers relative to the microphone and the satellite dish.
Iot 06 00058 g004
Figure 5. Heatmaps showing the signal amplitude distribution at 3 kHz and 18 kHz using two different microphone capsules. Color represents the relative normalized amplitude at each loudspeaker position, with green indicating the lowest signals and red the highest. (a) Omnidirectional capsule at 3 kHz. (b) Omnidirectional capsule at 18 kHz. (c) Cardioid capsule at 3 kHz. (d) Cardioid capsule at 18 kHz.
Iot 06 00058 g005
Figure 6. Schematics of the measurement setup with the elevated satellite dish and the corresponding results. Colors represent the relative normalized amplitude at each loudspeaker position, with green indicating the lowest levels and red the highest. (a) Setup with loudspeakers positioned on the ground and the satellite dish placed 20 cm from the microphone. (b) Results for the omnidirectional capsule. (c) Results for the cardioid capsule.
Iot 06 00058 g006
Figure 7. Comparison of self-noise levels for two phantom power supply options, measured without a connected microphone.
Iot 06 00058 g007
Figure 8. Testing the microphone’s capability for ultrasonic recordings.
Iot 06 00058 g008
Figure 9. WAV-FLAC compression ratio of audio recorded at different sampling rates.
Iot 06 00058 g009
Figure 10. Power consumption of the system.
Iot 06 00058 g010
Figure 11. Acoustic traps deployed in a rapeseed field in Lower Saxony, Germany. (a) Deployment locations of traps 1 and 2, and (b) traps 3–6 in rapeseed fields. Map data from OpenStreetMap (www.openstreetmap.org/copyright). (c) System on the first day of installation in early April 2025. (d) System at the end of April 2025.
Iot 06 00058 g011
Figure 12. Audio segment in which an insect presence was identified by manual listening.
Iot 06 00058 g012
Figure 13. Audio segment from the study by [24].
Iot 06 00058 g013
Figure 14. Audio segment recorded using the AudioMoth system.
Iot 06 00058 g014
Table 1. Comparison of microphones used in related studies and the selected microphone. Microphone specifications not reported in the original studies were obtained from manufacturers’ official websites or from expert technical analyses.
MicrophoneUsed in StudyPrice (July 2025)SNRSensitivityDirectivity
Adafruit-I2S MEMS microphone aBalingbing et al., 2024 [48]$6.95 (∼€6.00)65 dB−26 dBV/PaOmnidirectional
CZN-15E Electret Condenser Microphone bBanga et al., 2020 [49]€0.5060 dB−58 dBV/PaOmnidirectional
Brüel & Kjær-Type 4955 microphone cBranding et al., 2023 [24]€5,200.0087.5 dB0.83 dBV/PaOmnidirectional
Electret MAX4466 dRobles-Guerrero et al., 2023 [50]$6.95 (∼€6.00)60 dB−44 dBV/PaOmnidirectional
Primo Low coast EM172 eYin et al., 2023 [31]£12.78 (∼€15)80 dB−28 dBV/PaOmnidirectional
Røde Videomic Me Cardioid Mini-Shotgun mic fZhang, 2023 [51]€79.9975 dB−33 dBV/PaDirectional
Behringer B-5 gPresent study€31.0078 dB for cardioid, and 76 dB for omnidirectional−38 dBV/PaTwo interchangeable capsules: omnidirectional and directional
Table 2. Power consumption.
Power Consumption in [mW]Estimated Runtime in [h]
Raspberry PiPhantomSystem totalBattery capacity in [Wh]
meanstdmeanstdmeanstd102050100288
1170.72213.96326.841.561497.56214.046.6813.3633.3966.78192.31
Table 3. Summary information about recording files obtained from acoustic traps.
Trap No.Size (GB)File Count
118935,189
219233,736
315829,057
417936,385
519134,864
619235,306
Disclaimer/Publisher’s Note: The statements, opinions and data contained in all publications are solely those of the individual author(s) and contributor(s) and not of MDPI and/or the editor(s). MDPI and/or the editor(s) disclaim responsibility for any injury to people or property resulting from any ideas, methods, instructions or products referred to in the content.