1. Introduction
During constantly advancing digitalization, the Internet of Things (IoT) was introduced as a collective term for technologies designed for networking physical and virtual objects. A wide variety of communication technologies are used to enable these objects to work together. When such technologies are implemented in the industrial landscape, it is referred to as the Industrial Internet of Things (IIoT).
Until now, data acquisition (DAQ) via sensors has often relied on very low-cost components, as these provide sufficient accuracy in most application scenarios and the low cost means that the barrier to entry could supposedly be kept low. As a result, however, it so happens that the limited technology is assigned a suitable use case instead of creating an appropriate solution for a real-world problem.
Now, as the possibilities and limits of IoT technology are widely known, the demand for implementations that go beyond this is increasing, which, in turn, has increased the demands on the periphery. The combination of modern software methods and advanced or high-resolution sensors is thus the next logical development step. Significantly, the development is related to Industry 4.0 ventures and artificial intelligence (AI) as a subfield of machine learning (ML). The IIoT gateway that is presented in this article should also ensure functionality, using open protocols and utilizing as much open-source software as possible so that there is a high degree of compatibility and implementability.
The IIoT device can primarily be used for the acquisition of high-frequency measurement signals, whereby the use of piezo acceleration sensors in accordance with the IEPE standard is ensured. Furthermore, feature extraction can be performed on the acquired measurement data and further processed and analyzed in an AI application. The following subtasks are considered:
- -
The selection of suitable transducers;
- -
The acquisition of the measurement signals;
- -
The development of an IIoT gateway;
- -
The extraction of suitable features from the measurement signals;
- -
The training of a neural network for the classification of the measurement signals.
The subsequent functionalities have been realized:
- -
The development of a measuring box with hardware for DAQ of vibration signals up to 51.2 kHz measuring frequency as substitution of laboratory equipment;
- -
The use of open-source software to avoid license-related restrictions;
- -
The use of binary file formats (TDMS) to store the measurements;
- -
The in-house development of a measurement program and an AI application;
- -
Experimental testing of the measurement box;
- -
Self-sufficient operation of the measuring box also in AI application mode
First, the hardware requirement is determined for a typical application scenario with a vibrating process in an industrial context. The hardware consists of several components, which have been assembled in the next step. For the development of the system, a simple test bench has been built with a vibration source that is controllable, or which can be replaced with a few steps. The IIoT gateway is based on a Raspberry Pi with a Linux operating system running Python source code, which handles both measurement DAQ and pre-processing (feature extraction, e.g., fast Fourier transform (FFT), root mean square (RMS), variance, skewness, kurtosis, shape factor, crest factor, entropy). The sensors are recorded via a special and novel transducer, which is directly connected to the board via general purpose input/output (GPIO) interface. Vibration data are written as a file and characteristic data, so-called features, are passed on to a server and also displayed via an IoT-typical interface. Ultimately, the data are tested for applicability using machine learning methods. For this purpose, a Convolutional Neural Network (CNN) is trained, and the resulting classification is evaluated. The measurement files to be recorded with the IIoT gateway are compared with measurement files from a professional DAQ system to check substitutability.
2. State of the Art
Consumer hardware in the IoT domain, such as controllable lighting, cameras, smart buttons, sensors, and other products typically attributed to home automation, are often equipped with proprietary systems, and must rely on third-party hardware or software to ensure compatibility with an IoT ecosystem—although newer products have simplified native embeddability. Often, platforms from Google (Assistant Smart Home) and Amazon (Alexa Home Assistant) or open software solutions (e.g., Home Assistant, openHAB) find application among residential users [
1].
In the industrial context, a variety of species-like gateways can be found, which provide the basic functionality of collecting and transmitting data. IIoT setups also aim to connect to IoT ecosystems, but commercial server and service providers, such as Amazon AWS or Microsoft Azure, are used here [
2].
To transmit data, IIoT gateways resort to protocols typical for IoT (e.g., message queuing telemetry transport (MQTT), constrained application protocol (CoAP), data distribution service (DDS), hypertext transfer protocol (HTTP), JavaScript object notation (JSON), file transfer protocol (FTP), Websocket) as well as industrial interfaces from machine control (e.g., open platform communications united architecture (OPC-UA), ModBus, Profinet, EtherNet, IO-Link, CANopen) and store the collected data in databases (e.g., structured query language (SQL), InfluxDB) or files stored locally, on servers, or so-called data lakes (indicative of large centralized collections of data) [
3].
The main differences between available IIoT gateways are compatibility with specific hardware components, software flexibility, ease of use and availability of interfaces to external platforms. At the core, there is usually a Linux system as a system-on-a-chip (SOC) with prepared software modules for simplified connection of sensors, etc. and a customized user interface (frontend), which allows the setting and data traffic of the underlying software to be managed (backend). Often, the control of the connections and data traffic is based on the open-source software NodeRED (data stream-based programming with Javascript).
Further software building blocks are usually retrofitted as Docker containers, as the option is generally provided by the manufacturer of an IIoT box. A system for virtualizing applications, such as Docker containers on the IoT side and Docker/Kubernetes containers on the server side as well as managing them should always be assumed [
4]. The more open the system is designed, and therefore can be provided with updates, the more durable and customizable a device is. Unfortunately, this is often restricted to make the support effort manageable on the manufacturer side. Manufacturers are therefore forced to make a compromise between ease of use and functionality, which can vary between manufacturers and, in the best-case scenario, is oriented towards the target groups of the respective product.
This leads to many products on the market, which on the one hand has led to competition-driven, rapid development, but also to an unmanageable variety of IIoT systems. It is therefore up to the customers to deal intensively with the topic and to ensure that their own company does not become dependent on a single manufacturer. This can be prevented by always working with open-source software, assuming an update option, and only working with file formats and transmission protocols that represent cross-manufacturer and cross-platform standards. Avoiding proprietary formats and software when setting up an IIoT project can thus be described as a minimum requirement for making the project future-proof.
For many scenarios, the sensors used provide measurement data at low frequency (usually 100–500 Hz, sporadically 1600–6700 Hz), moderate accuracy (±10%) and low resolution (8–12 bits). Building blocks and circuit boards are used, which are also installed in smartphones or are known from the maker scene [
5]. This results from the desire to manage the costs and keep the entry barrier as low as possible. On the other hand, it allows less innovative thinking and leads to the search for use cases for existing products rather than to the development of an adequate solution for existing problems. As a result, the areas of application are currently still limited, even though the technology itself is widely used.
This leads to the conclusion that the demand for IoT will continue to grow strongly in the future, insofar as further areas of application can be developed. An extension of currently available options is the implementation of measurement systems for the acquisition of high-frequency measurement data. These are particularly required for the analysis of vibrations on machines and components [
6].
The usual procedure to perform high-frequency and precise measurements makes use of specialized measurement hardware and usually requires a classical computer, an operating system and suitable measurement software (e.g., a DAQ system with LabView or Flexlogger from National Instruments (NI)) for operation. Only on such expectedly high-priced systems can DAQ boards be installed which provide the connectivity and support the interconnect standard for integrated electronics piezo-electric (IEPE) sensors. These IEPE accelerometers offer some advantages over cheaper and frequently used micro-electro-mechanical systems (MEMS) variants and are used in measurement projects with particularly high demands on frequency range, measurement range, sensitivity, and noise sensitivity.
For the use of measurement data in an AI or ML application, the values must be prepared accordingly and compiled into a data set. Collected measurement data must also be annotated in a meaningful way; this can be performed automatically or, in many cases, manually and represents a crucial step [
7].
2.1. IIoT
Applications in the field of IIoT are versatile but have their commonality in the networking of devices in an industrial context. The main tasks of IIoT are the collection of data, its visualization, and its provision. One finds this type of networking significantly in manufacturing, energy supply, and other areas of industry. It is common that only small changes must be made to existing systems to expand them into an IIoT node. Usually, a machine or location are equipped with additional sensors and a computer or controller, which, e.g., enable automation, self-monitoring, or remote maintenance. Existing signals from the machine controller can also be read out via industrial interfaces and added to the data set, insofar as the machine provides for output via a service port or one can be retrofitted. Network connectors of the type RJ45 (“Ethernet”), simple four-wire connections, controller area networks (CANs), or DB-9 connectors for serial communication ports (COM) of the types of RS232/422/485 are frequently used for these connections. This covers a large part of the industrially used connection standards; however, after successful connection, further factors, such as password-protected control or proprietary, non-publicly documented formatting and the designation of signals, may prevent use in the IIoT context [
8].
Furthermore, the data collected via such IIoT devices can be aggregated and analyzed. The usual approach allows for a central collection point of the data, which can be a server in a data center or located directly at the physical location of the users [
9].
2.2. Cloud and Edge Computing
Three areas are generally distinguished in the distribution of computing power. If computing power is required in an industrial plant (on site), e.g., because a fast response time between measurement, evaluation, and output is required or because operation of the system should also be possible without an internet connection, this is referred to as edge computing. If part of the computing power is to be outsourced to a server center, this is called cloud computing. This makes sense if the same data are accessed from different locations or because the same program executions must be carried out with several data sources from different locations and the effort and costs can be reduced with centralization [
10].
As a third pillar, local computing describes any form of computing power that becomes available through devices owned by users. This includes PCs, laptops, smartphones, etc., and can be represented by viewers only or by processors. The IIoT gateway described in this work is an edge device and provides for communication with an edge or cloud server during operation but can also be operated completely autonomously and offline after all operations to train an AI model have been completed [
11].
2.3. Piezoelectric Sensors
Piezoelectric sensors use the piezoelectric effect, which describes the occurrence of a change in electrical polarization and the generation of an electrical voltage on solids during elastic deformation. Piezoelectric ceramics and single-crystalline materials are used for this purpose. Piezo sensor types can be force, acceleration, and pressure sensors, but also measuring microphones for recording sound pressure. The main advantages of piezoelectric sensors are their ability to detect very small quantities or changes in quantities and the wide measuring range. In addition, the technology is characterized by a compact design, an almost unlimited lifetime (when using quartz crystals), a wide operating temperature range, and a low sensitivity to disturbance variables [
12].
2.4. IEPE Industry Standard
An industry standard has been introduced for piezoelectric sensors with IEPE. This designates piezoelectric sensors with built-in impedance converter electronics. However, some manufacturers use a proprietary designation such as integrated circuit piezoelectric, (ICP), although it covers the same standard. The integrated electronics convert high-impedance signals from the piezoelectric material into a low-impedance voltage signal, allowing the sensor signal to be transmitted over long lines with minimal loss. The principle of IEPE is that both the supply current and the sensor signal are transmitted via a coaxial cable. The sensor electronics require a constant power supply in the range of 2 and 20 mA, whereby the provision of 4 mA has become established for measuring instruments. However, if particularly long cable lengths are to be realized, a higher current becomes necessary [
13].
2.5. ML and AI
Overfitting is a problem which occurs when not enough data or insufficiently distinguishable data are available, and it can happen with fully connected neural networks (ANNs) or CNNs. Overfitted models tend to provide very inconsistent results when they are presented with previously unknown data, as they have memorized data, yet do not recognize the problem they are trying to solve. In general, CNNs are better at avoiding overfitting compared to ANNs. This is because of their unique architecture, including convolutional and pooling layers, which extract meaningful spatial features and reduce dimensionality, preventing the model from memorizing the training data.
CNNs do not entirely connect all input neurons with all neurons of the next layers continuously with each other but divide the input data into several subareas or fields. Each of these subfields is first considered individually and combined in further layers. On the one hand, this leads to a strong reduction of tangles, and thus, requires less computational effort and to a more robust recognition of patterns because only correlations between areas are searched for instead of comparing the whole input. Patterns can thus appear in different places in the data set and still be matched. An example of this in image recognition is the determination of partial areas, such as eyes in faces, or in vibration analysis such as the occurrence of sporadic deflection in the signal. The calculation of the sub-areas results in an increased comparability; the layers up to the actual classification are called feature layers. In this phase, the input data set is further refined and prepares the information for decision making in the final layers [
14].
For the AI model used in the IIoT gateway, transfer learning of a CNN is applied. A pre-trained model is used (MobileNet) which is already adjusted to recognize patterns in many categories, and only the last layers, which are used for classification, are re-trained. In this way, successful training can be performed with far less data and the time required for model creation can be reduced. It also reduces the risk of overfitting.
CNNs are well suited for processing image information and any other data sets that can be expressed in a similar form to an array. The ImageNet model used expects an input size of 224 × 244 × 3 in the first layer. With a sufficiently large amount of data, three arrays of 59,536 data points each can be passed. If fewer data points are available, the same model can be used via extrapolation, providing a good way to test data sets in AI applications in a “rapid prototyping” style. As an example, for the extrapolation of fields that are smaller than the expected input field of the model, the representation of spectrograms in images with the fixed resolution of 224 × 224 pixels is presented in this work. This results in several neurons being given the same values. However, this condition can be improved by transitions between existing data points, for this the effects of different “shading” setting in Matplotlib are shown. In this work, information about frequency responses extracted from vibration signals are passed in three two-dimensional arrays and are therefore constructed in the same way as images with color channels.
2.6. Feature Extraction and Frequency Analysis
Evaluable information is to be drawn from measured data. For this purpose, various algorithms are applied, and conversions are made to determine features that allow conclusions to be drawn about states. The new derived values should be as revealing as possible and not redundant. The goal is to gain knowledge and to generate comparability. Furthermore, feature extraction is used to design normalized, similar data for transfer to a model. This is necessary to ensure the function and reliability of AI models [
15].
To draw further insights from an oscillation signal, Fourier transform (FT) can be used to decompose a periodic signal into a continuous frequency spectrum. The method is used in many areas of science, economy, and media design and is considered one of the most important mathematical algorithms. Specifically, the discrete Fourier transform (DFT) and the short-time Fourier transform (STFT) are used in this work.
In contrast to the FFT, the temporal change of the frequencies can also be represented in a spectrogram. For this purpose, successive FT are performed. With the same number of data points in the input signal, this leads to a reduced resolution on the frequency axis compared to the single FT. On the other hand, the time course of a spectrogram can be used to trace the subranges from which the strength of a frequency was composed in the FT. The FFT therefore only gives information about how strongly a frequency is represented over the whole signal. From the spectrogram, it can be read when and how strongly the frequencies are represented within the set time steps. By plotting an FFT with frequencies on the Y-axis and the strength on the X-axis, the correlation to a spectrogram can be seen.
Another optional step is the conversion to the logarithmic scale during data preparation. This is especially recommended when recording room sound or working with a sound pressure sensor, because the logarithmic representation of the measured values better mimics human hearing and thus improves the traceability of signals, the evaluation, and the subjective impression. The main intention of the log-frequency spectrogram is to redefine the frequency axis in such a way that it corresponds to the logarithmically equidistant frequency distribution of the equally distributed musical scale [
16].
Consequently, for the generation of fingerprints for classifications, more meaningful data sets can be generated, which increase the prediction success. However, the conversion may also be useful for measurements with other vibration transducers, e.g., accelerometers for structure-borne sound detection, and a comparison of the two variants should be performed. The conversion does not affect the shape of the array. After the conversion, many more areas with distinguishable values emerge, providing better opportunities for correlation findings of the AI model.
2.7. Key Indicators
For the calculation of individual key indicators from the time series or the recorded analog signals of the sensors, manual calculation can be performed and functions from libraries such as SciPy can be used. Another option is to use libraries specifically designed for the automated extraction of metrics from time series. Two examples are TSFEL and TSFRESH. Both contain the basic function for a simplified generation of a variety of metrics from time series. For this work, the TSFRESH library was chosen because of its lower system requirements, ease of use, and more available metrics: TSFRESH extracts metrics with 77 algorithms compared to TSFEL, which provides only 60. The output of TSFRESH can also be exported labeled, so that a direct assignment of the key figures and further processing, e.g., in a dictionary for retrieving individual values or for sending to a monitoring system, is simplified. The key figures are usually stored in a database and the time history is used for analytical considerations or monitoring. This is done, for example, when setting up a digital twin and the associated process monitoring.
The input of time series, in the case of the IIoT gateway measurement data from analog signals, can take place as a single file or by transferring entire data sets, which are processed successively. The files with the time series are loaded and divided into sections, according to the settings. This is followed by the calculation of the key figures of the individual sections. Finally, the results are stored in a table or dataframe [
17]. Afterwards, it can be saved in any format or processed directly in the source code.
2.8. Data Pipelines
Creating and merging sensors, big data lakes, and ML models into an AI application in an industrial context is a massive undertaking. Developing a new project requires expertise and experience at every step, from DAQ to storage, data engineering, and data science. To automate this process and create a scalable solution, the concept of data orchestration through pipelines comes into play [
18].
A data pipeline is an arbitrary collection of ordered transformations. Functions are written in reusable source code building blocks. Data sets are given standardized input and output functions, while settings are passed with parameter files. A pipeline assembles the components, implementing procedures such as versioning and explicability. It can be implemented with open-source software such as Kedro, SciPy, and Tensorflow [
19].
2.9. Measurement File Format TDMS
The technical data management streaming file (TDMS) represents a binary exchange format from the developer NI. It is very well suited for recording measurement data, since contents can be searched, and the file sizes are smaller compared to other forms such as comma separated values (CSV) or Microsoft Excel (XLS). While the TDMS format is primarily designed for use with NI software such as LabView, DiaDem, and VeriStand, it can also be processed in MathWorks Matlab, Microsoft Excel (with importer), Apache OpenOffice as well as the programming languages in the Net palette and Python. For Python, the program library “npTDMS” can be used [
20].
The structure of TDMS files provides for the storage of general properties such as the title and author or editor to the measurement in the top hierarchy of the file (data set). The next level are channel groups, under which properties can be entered, such as information about the test unit or the test device. The measurements are stored in the form of channels, each of which is assigned to a channel group and to which properties can also be assigned, such as sensor information, time steps, and the physical unit of the measurement.
2.10. Classification, Pattern Recognition, and Predictive Maintenance
The main application areas for AI recognition methods in the industrial context are quality control, defect or anomaly detection, and process optimization. In quality control, mainly image or pattern recognition is used. Anomaly detection can also be achieved via pattern recognition, but in many cases, so-called auto-encoders are used. Process optimization, on the other hand, is more a further utilization of insights drawn from many AI evaluations. In addition, there are still many individual solution approaches that cannot be easily categorized and for the future, especially with advancing development in the field of AI model creation, it is to be expected that even more application areas will open [
21].
An example of quality control via AI methods is the recognition of features of components. This includes the visual inspection of surfaces and shape, such as looking for scratches or bends, or element recognition, such as counting individual parts in a package.
Predictive maintenance and predictive quality can be mentioned as an example of process optimization. Extensive vibration analysis can be used to gain knowledge about the condition of the machine, the tool, and the workpiece. If sufficient data can be collected on all conditions that occur, such as a new versus a completely worn saw blade, maintenance can be planned, and tool life can be improved (total effective equipment performance). Such implementations in turn lead to an increase in overall production effectiveness [
22].
From the results of pattern and anomaly detection and from the recording of key indicators, conclusions can be drawn about the causes of faults. This process is called root cause analysis (RCA). It assumes that there is a physical relationship between the fault and the resulting vibration or measurement. For each machine, a unique vibration pattern can be captured and for each machine type there is a typical vibration behavior [
23].
3. Materials and Methods
As a conclusion on the state of the art, it can be stated that from the research on the topic of IIoT and AI in the industrial environment, it has become apparent that there are some solutions for DAQ and exploitation. Yet, these are either associated with high acquisition costs or do not fully meet the requirements in the low-budget sector. For example, high costs make it difficult to set up larger sensor networks and represent a huge barrier to entry, especially for small and medium-sized enterprises (SME). In the case of low-cost solutions, cutbacks in measurement technology must be accepted, which also limits the evaluation options.
An area is emerging between the low-cost and high-end solutions where this IIoT gateway fits in. Thus, the device is composed of measurement technology from the high-end solutions and computer technology from the low-end. The cost of such a device reflects this balancing act and, especially for SMEs, represent an affordable solution.
3.1. Hardware
The main board of the measuring box is an SCC from the Raspberry Pi Foundation [
24]. The Raspberry Pi Model 4b with 8 GB of RAM (LPDDR4-3200 SDRAM) was selected because it is currently the newest and most powerful variant. The processor is a Broadcom BCM2711 (Quad Core Cortex-A72 with ARM v8 processor architecture) with 1.5 GHz clock speed. The board has a GPIO connector with serial peripheral interface (SPI), which is used to control the DAQ board. Furthermore, a total of four universal serial bus (USB) and two high-definition multimedia interface (HDMI) ports as well as a network connection are available. Power is supplied via a dedicated USB-C port. There is also a communication module for wireless network connections (2.4 GHz and 5.0 GHz IEEE 802.11ac) and Bluetooth 5.0 connections with support for Bluetooth Low Energy (BLE). A ribbon connector is provided for connecting camera and display modules, respectively. Further specifications are:
- -
Gigabit ethernet;
- -
40 pin GPIO header;
- -
4-pole stereo audio and composite video port;
- -
H.265 (4kp60 decode), H264 (1080p60 decode, 1080p30 encode);
- -
OpenGL ES 3.1, Vulkan 1.0;
- -
Micro-SD card slot for loading operating system and data storage;
- -
5 V DC via USB-C connector (minimum 3 A);
- -
5 V DC via GPIO header (minimum 3 A);
- -
Optional Power over Ethernet (PoE) HAT available;
- -
Operating temperature: 0–50 °C ambient.
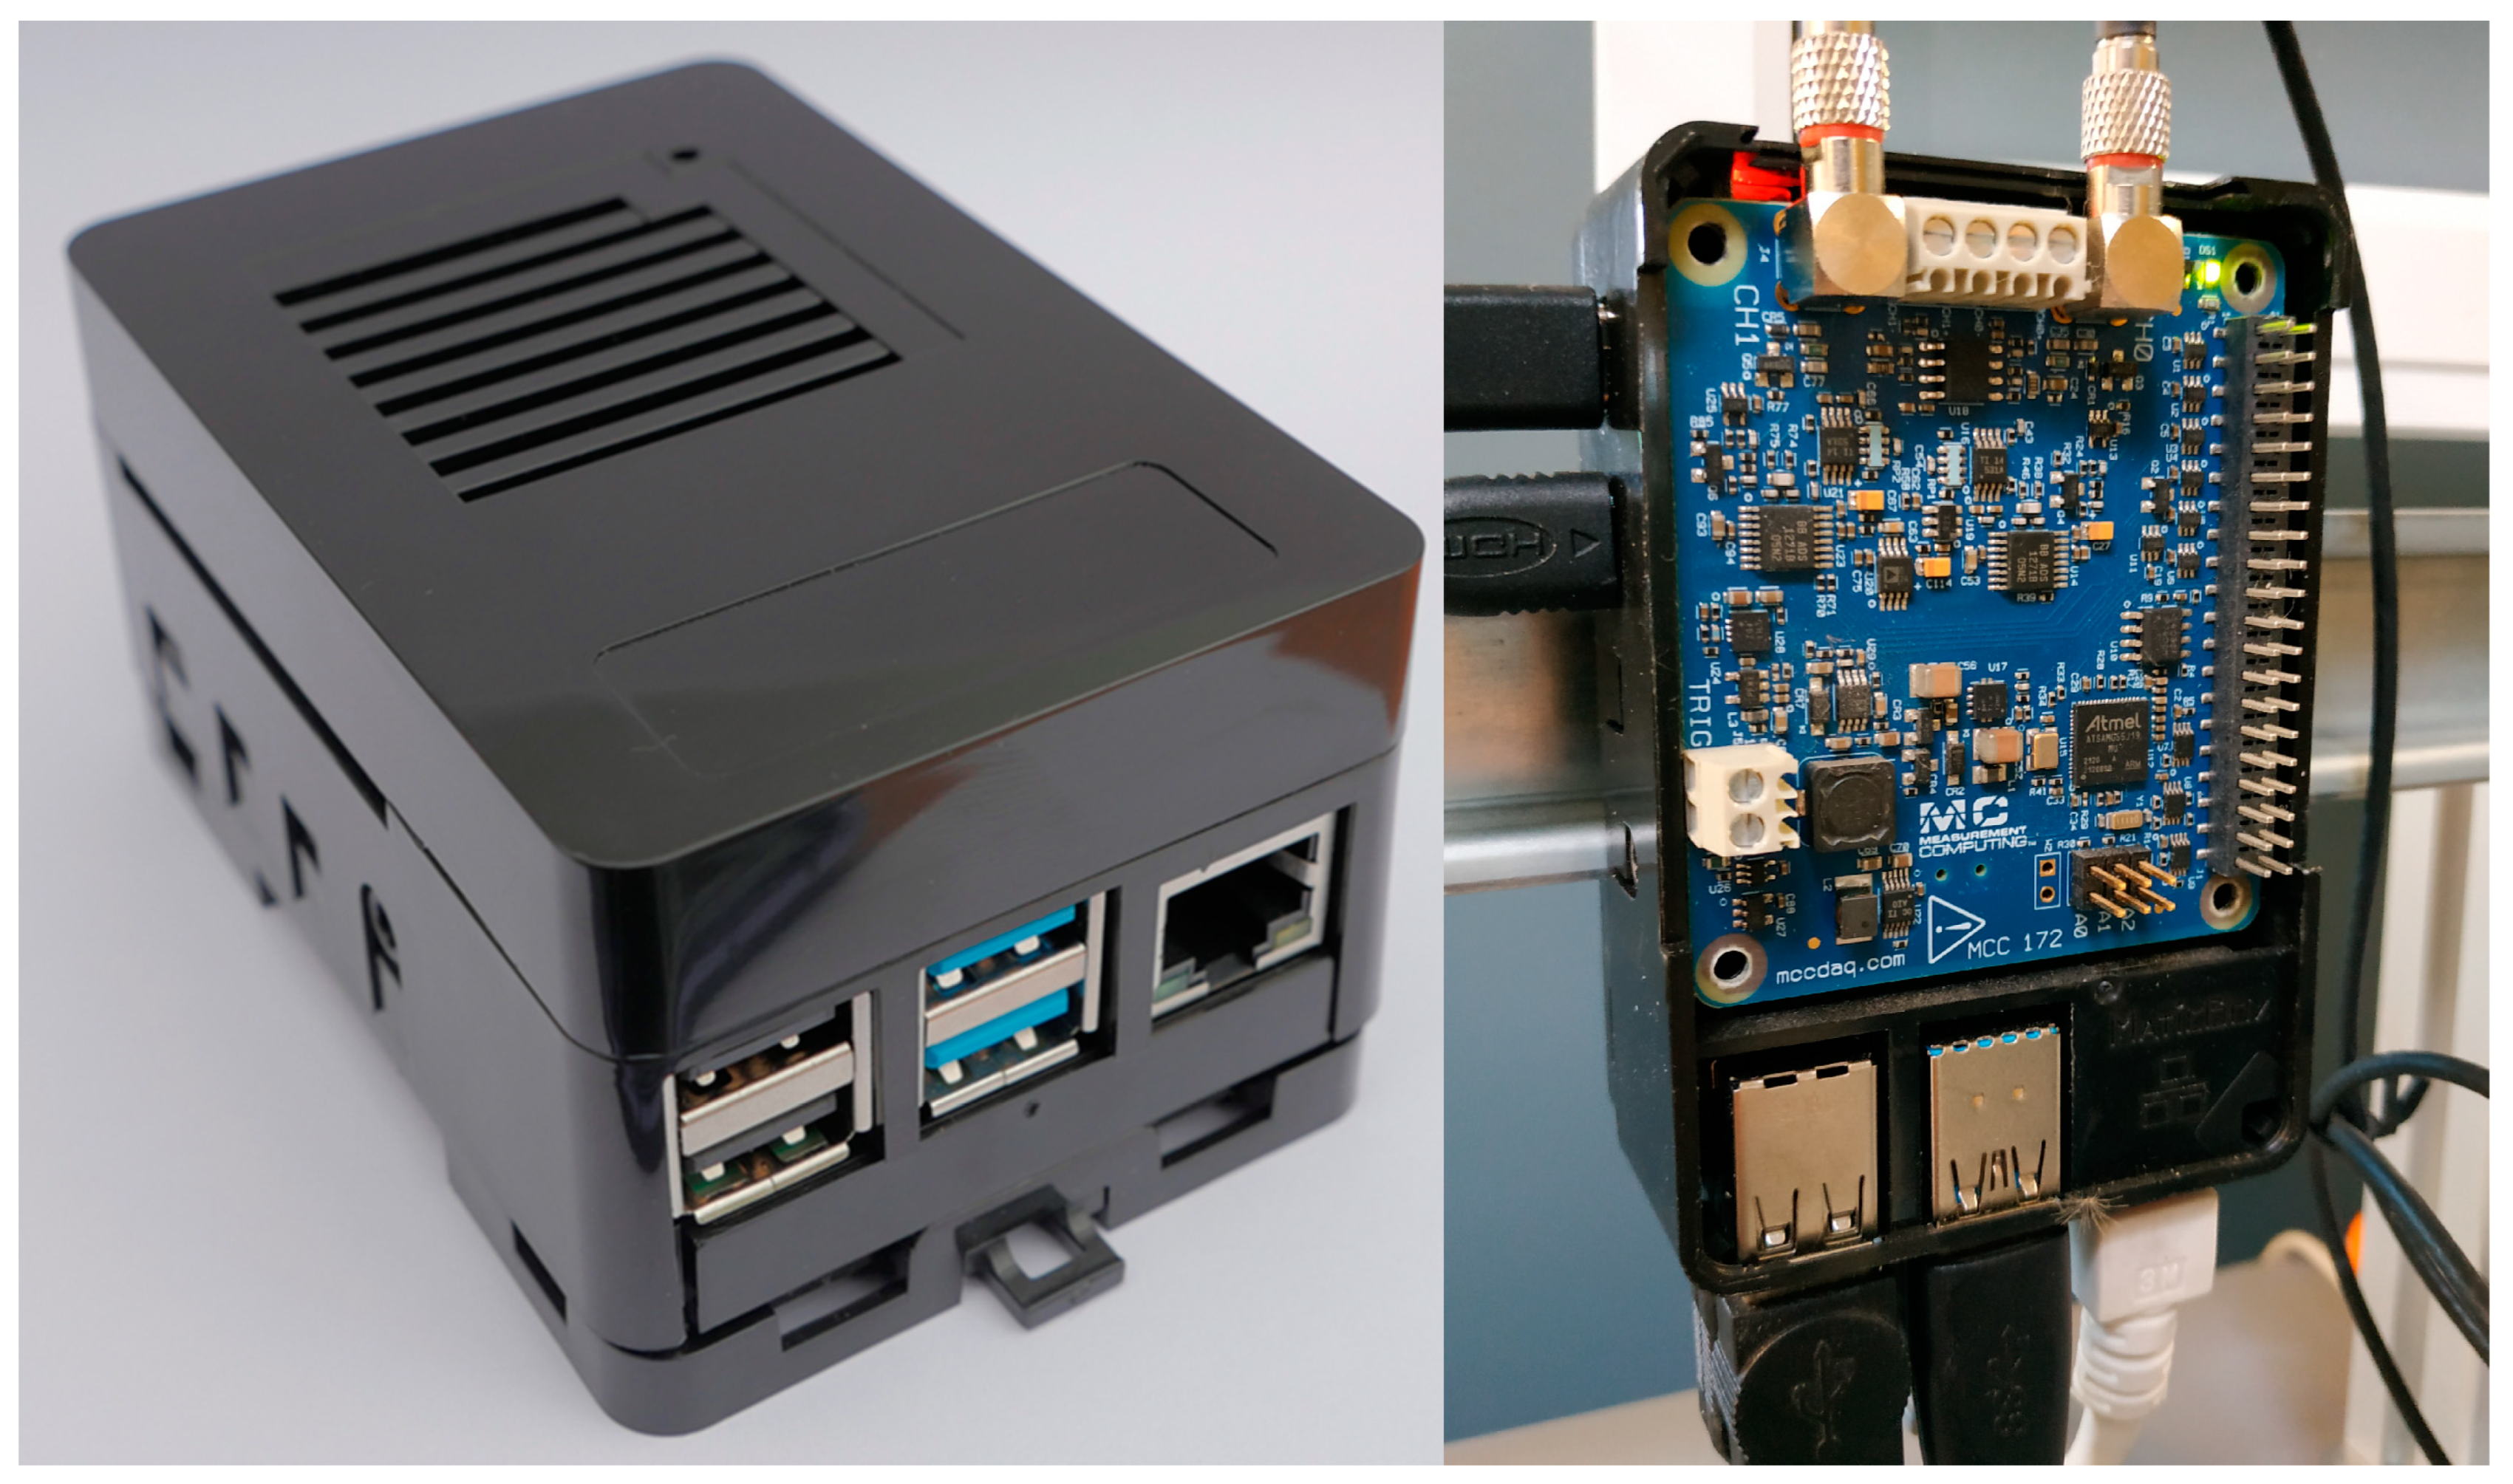
The MCC172 transducer from Measurement Computing (MC) was selected for DAQ [
25]. The MCC172 expansion module connects to the motherboard via the GPIO connector and is only compatible with the Raspberry Pi platform. The design is a so-called hardware attached on top (HAT) in the series of DAQ HAT from MC. It is a 2-channel board for acquisition of IEPE sensors with 24-bit resolution and a sampling rate of up to 51.2 kS/s per channel. Several sensors can be combined, and a maximum sampling rate of 307.2 kS/s can be acquired over all available channels. MC provides freely available software libraries for Python and C/C++, enabling in-house developments.
There are two signal amplifiers and two 24-bit analog-to-digital converters on the board, which are synchronized with each other via a central “clock logic”. The micro-controller takes the signals from the two channels simultaneously and transmits them to the Raspberry Pi via SPI. There is also a module for recording a trigger signal to start a measurement with external signals [
26].
The selected components are installed in the MaticBox4 case from LeapMatic. The case is designed for the dimensions of the Raspberry Pi 4 and, in addition to a favorable price, offers advantages such as a modular design and various options for mounting. Two lids are available: one flat and one with an extended height. The larger lid offers enough space to accommodate the MCC172 expansion module and offers additional space for a fan or an additional expansion, e.g., There is also a recess on the back of the housing, exactly where the connections of the measuring card are located (cf.
Figure 1).
The bottom of the enclosure, in addition to being screwed to a surface, also offers mounting on a support rail, which allows it to be mounted in control cabinets, etc., in an industrial context [
27]. The housing meets all requirements for the device. According to the field of application, this can be deviated from in later iterations, as any additional requirements demand a different choice.
3.2. Operating System
The operating system used is a Linux distribution based on Debian that was specifically developed for Raspberry Pis. This is adapted for the ARM processor architecture and is available at the time of editing under “Raspberry Pi OS” as a port of Debian version 10 “Buster” and version 11 “Bullseye”—formerly, the operating system was released under the name “Raspbian”. Version 10 “Buster” has been selected for the gateways, as there are sporadic incompatibilities with the newer version 11 “Bullseye”—e.g., the remote maintenance software, Anydesk, is not compatible. The use of processor performance and memory usage must be reduced, since only the 32-bit version is available for version 10 “Buster” in the manufacturer’s official source (Raspberry Pi Imager). There is the possibility of obtaining a 64-bit version manually, but it is in an unstable state (beta). Since a new version, “Bullseye”, of the operating system has already been released and is being further developed, it can be expected that the 64-bit offshoot of the old version, “Buster”, will not undergo any further development. An upgrade to version 11 “Bullseye” should only take place when full compatibility with all programs and libraries used can be ensured. No further adjustments should be required to any source code created in this work in the event of an operating system upgrade.
3.3. Programming Language and Libaries
Programming takes place in the language, Python, using version 3.7.3. It is a programming language of the type, “High-Level”, and therefore, in abstraction and complexity, it is removed from the level of machine language. The main advantages are the portability between operating systems without further adjustments at the source text and the availability of a multiplicity at publicly accessible application packages, the so-called libraries. Many of them are required for the execution of the scripts created, which must be installed on the end device in the correct versions. Almost all packages can be installed via the management program, “pip”, or via “pip3”; only the libraries, “DAQHats”, for the control of the measuring card and for the framework, “Tensorflow”, for data stream-oriented programming, and ML must be installed manually.
Manual procurement is necessary for the installation of the Tensorflow framework, since an older version (max. 1.14.0) is automatically installed by the package management program, which has incompatibilities with certain model formats and layer setups. In addition, the database accessed by the package management program does not store any other compatible version number, so manual procurement and installation are necessary. Furthermore, it is necessary to refer to a “community-built” version and find a reliable source for it or compile locally a version for the desired end device following the official instructions for Raspberry Pi builds from Tensorflow. For the IIoT gateway, a precompiled Wheel installation file was selected [
28]. The file name reflects the version number and processor architecture, which should meet the requirements of Tensorflow version 2.4.0 and ARMv7l. For the development of this work, the following libraries have been used:
- -
Daqhats [
29]; functions to control the measurement hardware of MCC172;
- -
Numpy [
30]; program library for easy handling of vectors, matrices, and multidimensional arrays;
- -
Pandas [
31]; program library for data structures (data frames) and operators for accessing numerical tables and time series;
- -
SciPy [
32]; software environment for scientific computing and visualization;
- -
Matplotlib [
33]; program library for mathematical representations;
- -
TSFRESH [
34]; program library for the extraction of figures from time series;
- -
Tensorflow [
35]; framework for data stream-oriented programming and building ML applications. Especially computational operations for artificial neural networks on multidimensional data fields (arrays or tensors).
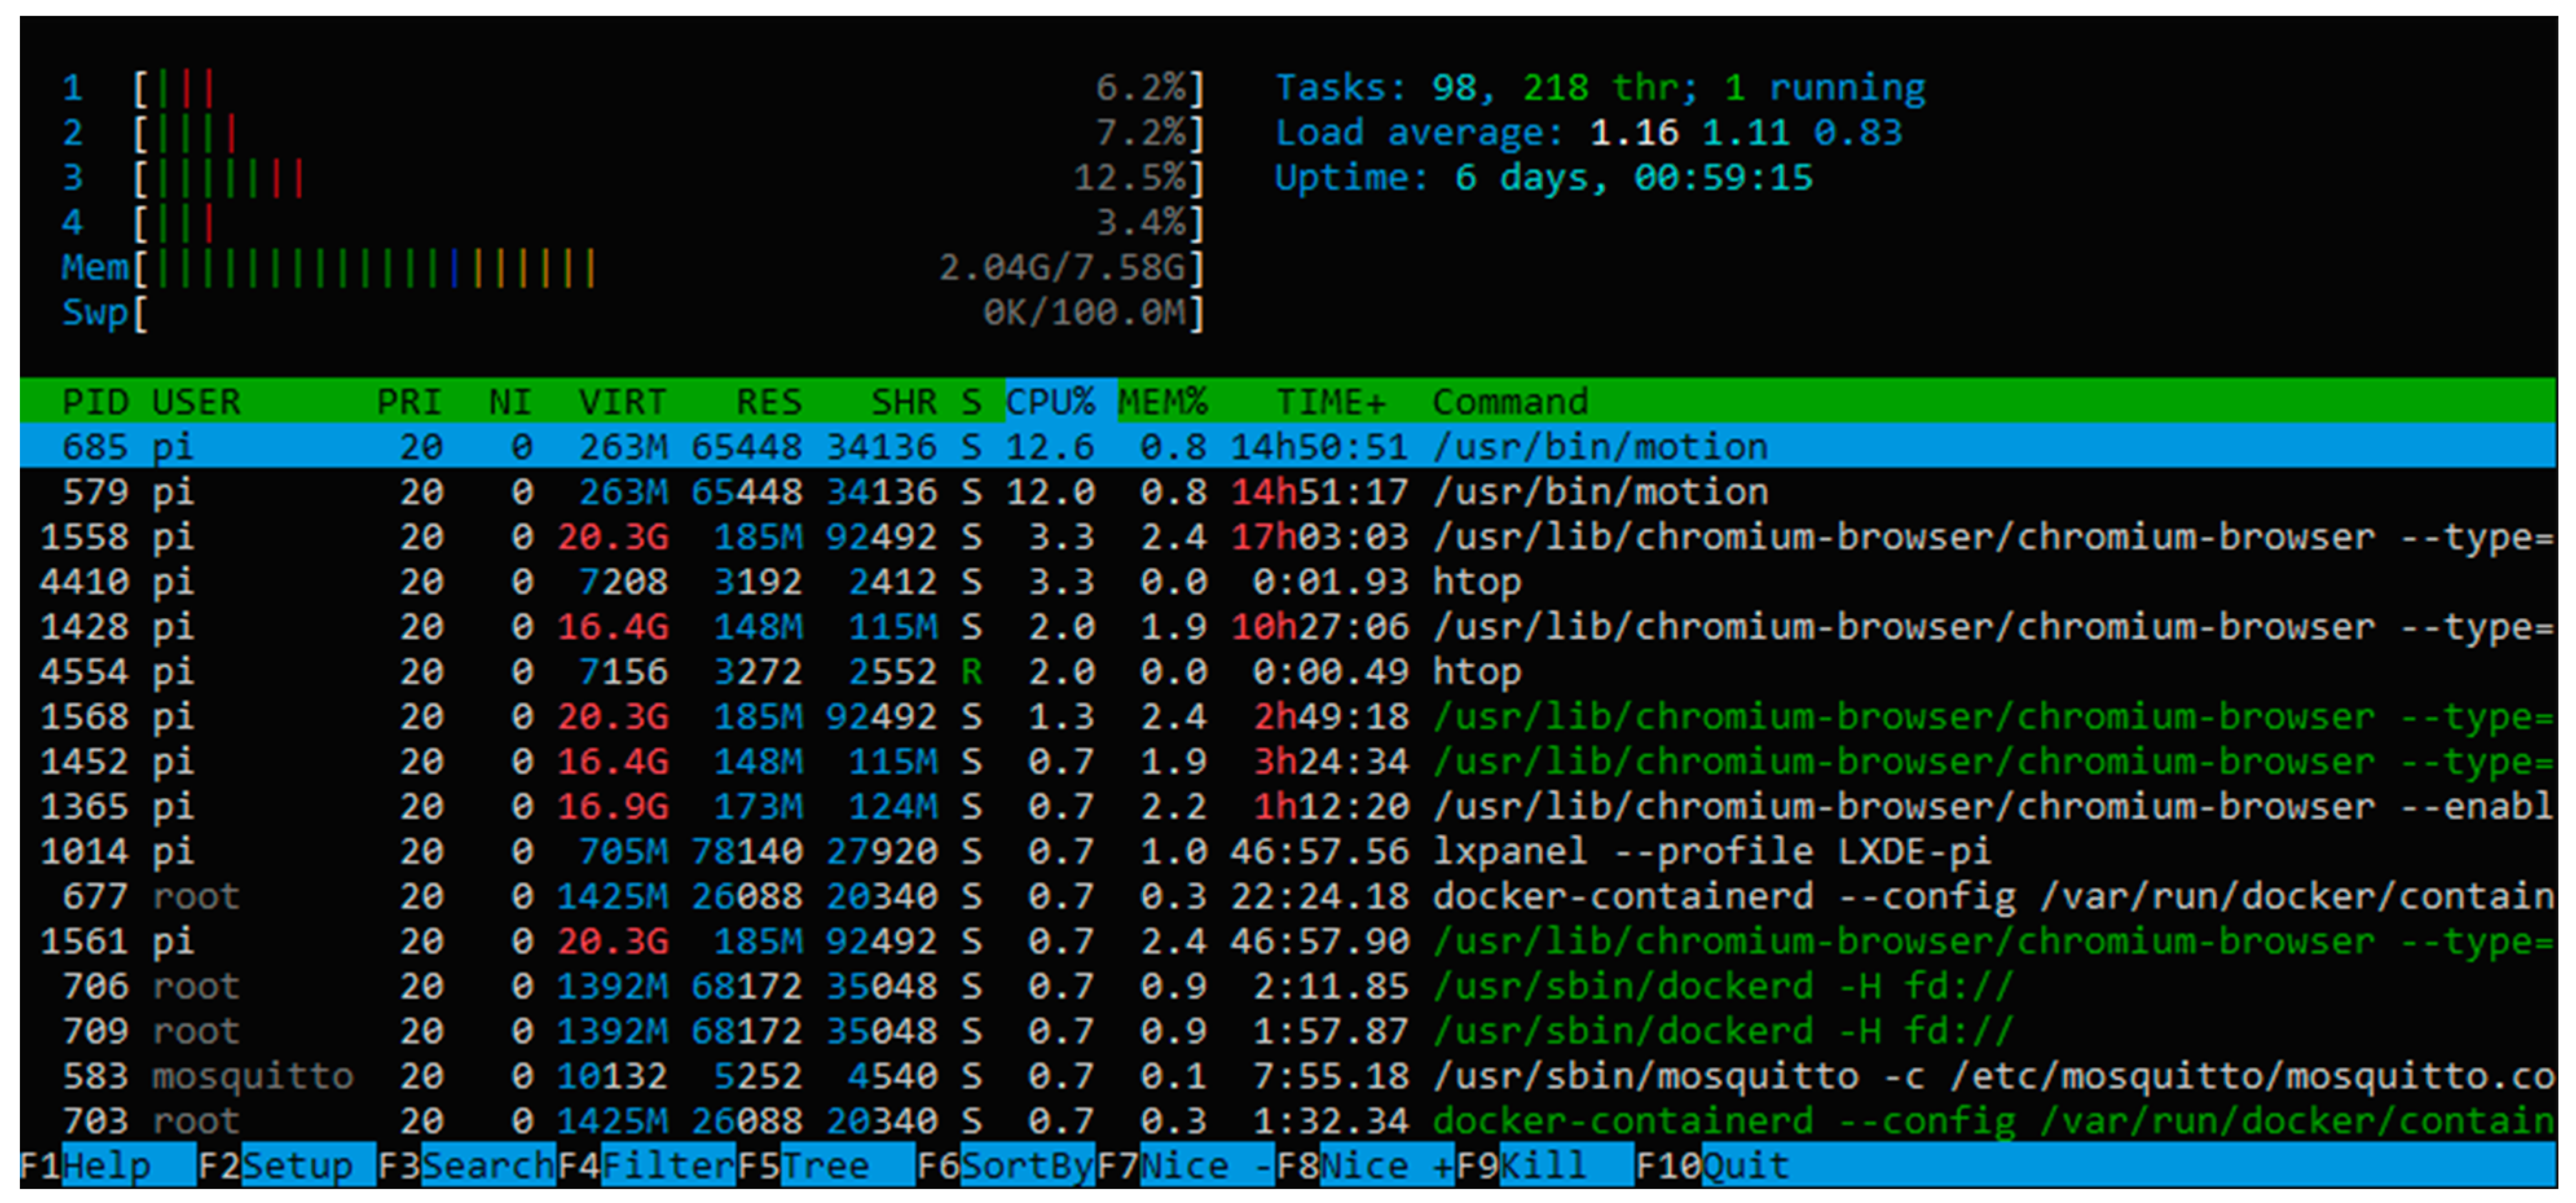
Figure 2 shows the system and memory utilization of the IIoT gateway in operation. The performance is sufficient and that there are still resources left, although this can vary greatly with the size of the model to be executed.
3.4. File Synchronization and Software Updates
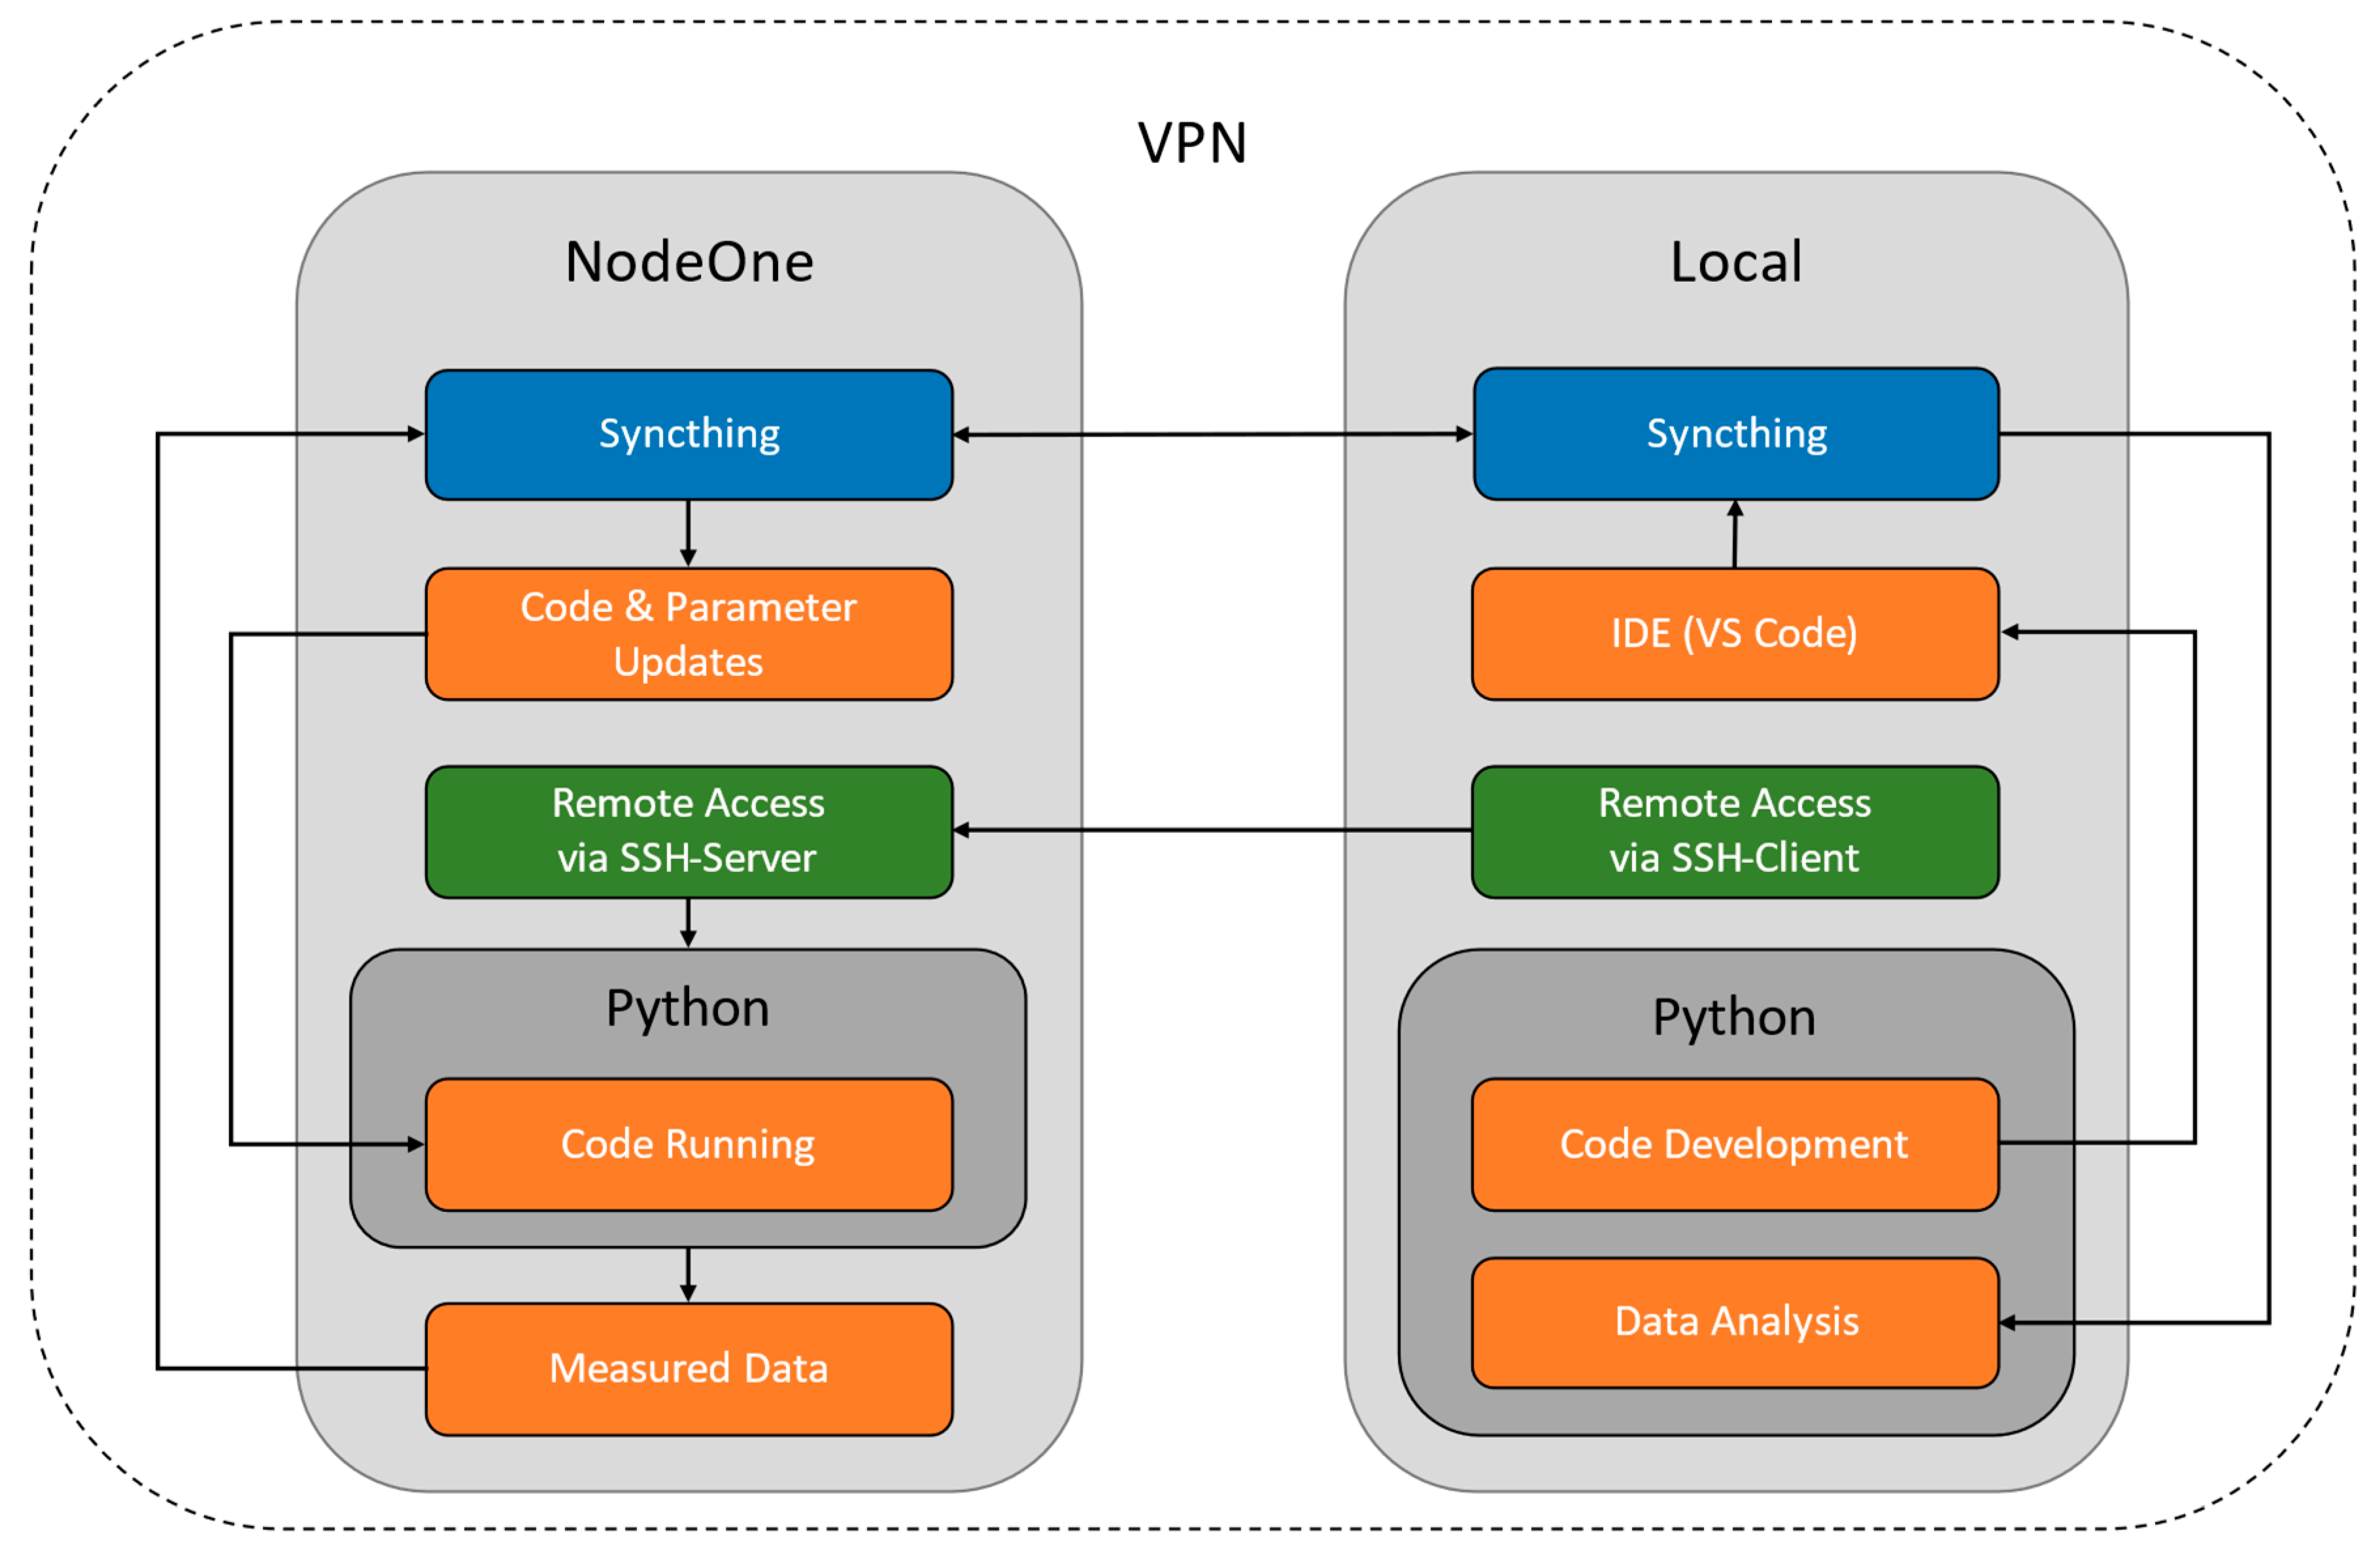
The IIoT gateway is intended to be operated in “headless mode”, i.e., it must be possible to control and configure it without a monitor and via remote access. The concept presented in
Figure 3, is used during the development phase, and is extended later in the deployment via connections to a central server or a server located at the edge.
For file exchange, a peer-to-peer (P2P) connection, a direct computer-to-computer connection, is established using the open-source software Syncthing [
36]. This allows data synchronization in an environment without an internet connection, as long as a network connection is established between the devices, since no central provider-side file server is used. If an update is to be performed on an IIoT gateway that is not on the local network, a virtual private network (VPN) can be set up to enable synchronization over an internet connection. To enable a similar peer-to-peer relationship, a decentralized VPN can be established. Alternatively, a remote desktop connection can be used, e.g., to perform operating-system-level configurations in cases that are not possible via SSH connection.
During the development of the Python source code, which is to run on the gateway, and the analysis of collected measurement data, a common folder was defined and coupled via Syncthing. The special feature of the synchronization software Syncthing is the assignment of folders by individual identifier, which can also be set over a variety of end devices. If a file is added or changed on the local computer, the synchronization takes place simultaneously on all registered systems such as several IIoT gateways. The main applications for this data reconciliation in the course of this work are handling and transferring script files during development, receiving measurement data during initial analysis, and distributing updates after delivery.
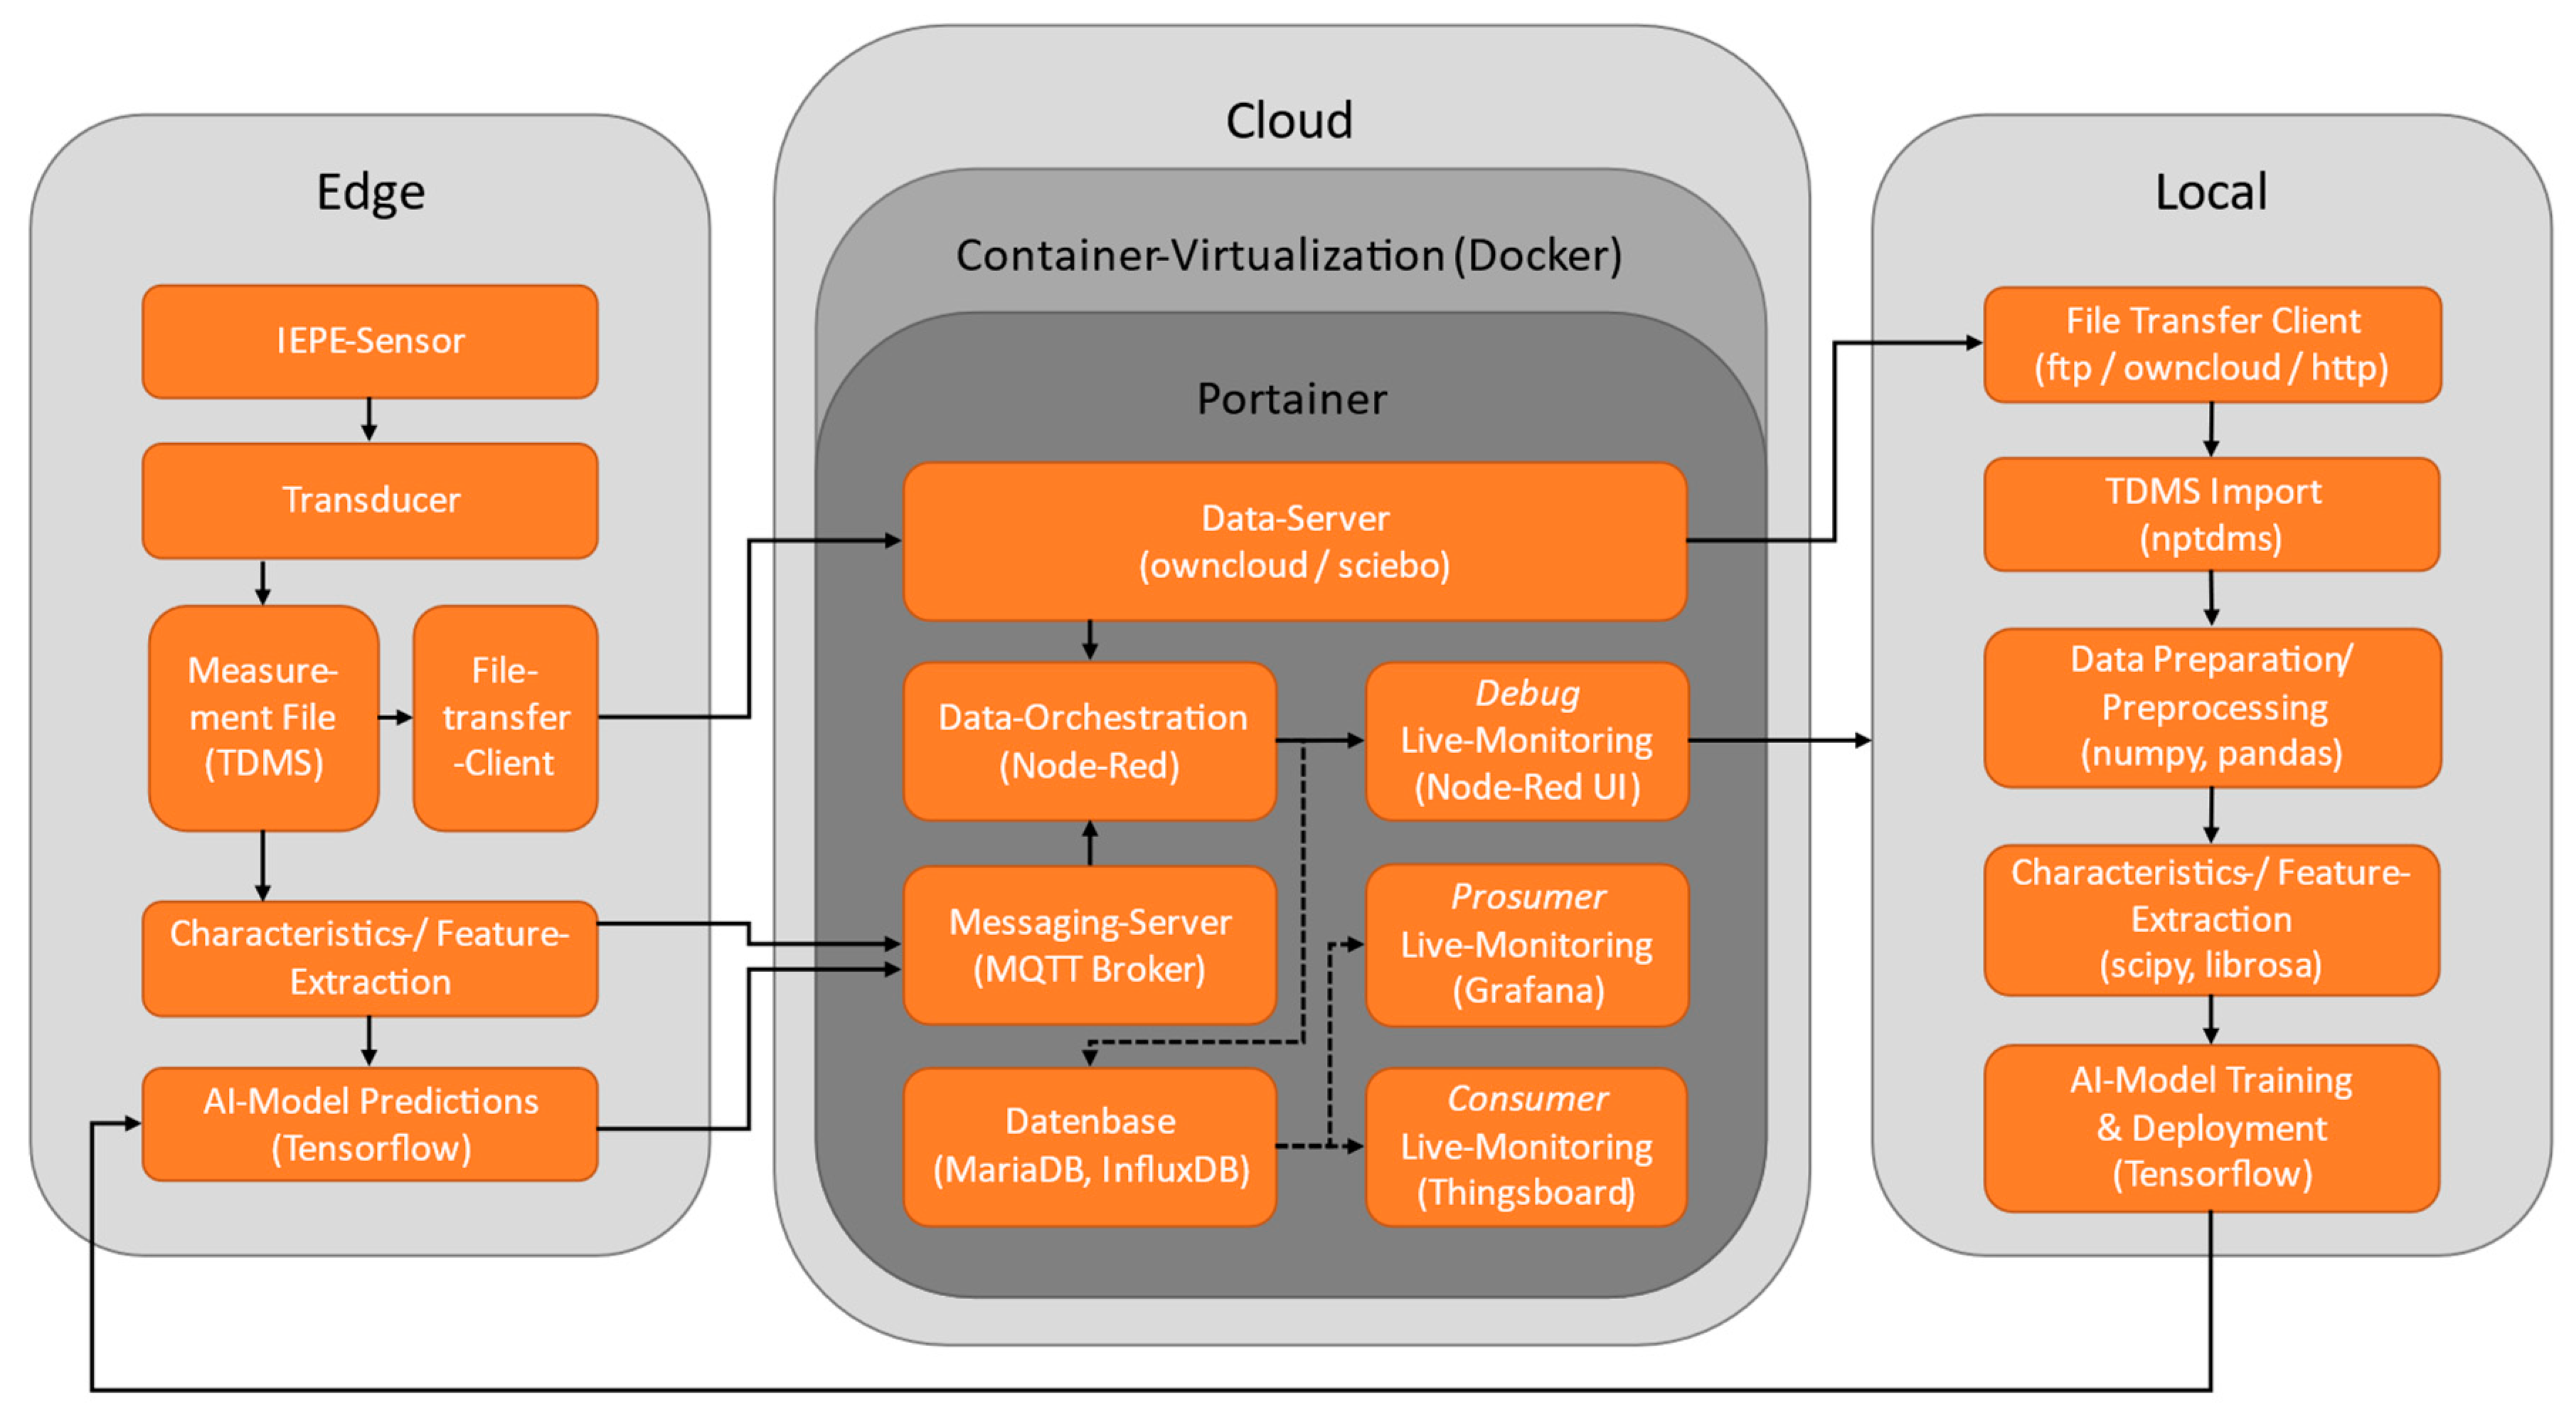
3.5. Data Flow between Edge Device, Cloud Server, and Local Computer
The IIoT gateway is designed to function as a stand-alone device or as one of many measuring points in an industrial application and must meet the requirement of being able to operate both autonomously and in a network with other participants. Since the measurement and processing of signals are to take place directly on site, e.g., at an industrial machine, the IIoT gateway is to be regarded as an edge device. In
Figure 4, the IIoT gateway is entered as an edge. The central collection point for collected data is the server (marked as “cloud”), which can be installed both at the edge and in the cloud. Last, the local computer represents the third component and is used to process data, create AI models, and retrieve results from the cloud’s display capabilities.
After an AI model is loaded onto the IIoT gateway, operation with AI application can be performed even without an internet connection (offline or only with network connection within the edge).
The MQTT messaging service can also be operated without an internet connection, insofar as an MQTT broker can be reached via an available network connection (cf.
Figure 5). Thus, AI classification and other measurements can be performed on a local machine and the results displayed on an edge server. An edge server can be operated as a failover that collects files and messages from edge devices if the internet connection is lost, so that no data are lost.
The data flow of measurement signals starts at the IEPE sensor, which transmits voltages through the cable to the sensor. The measuring sensor installed in the edge device records the signals and makes them available in the program sequence. Now, the measurement data are written into measurement files (TDMS) and are available for direct further processing or for transmission to another location. The transmission of the data can take place via Syncthing or to a file server. The software running on the server is installed in virtualized “containers” using Docker. The Docker system ensures that software packages can be handled more easily because necessary additional software is automatically included in the packages. An overview is provided by the software Portainer, a kind of software orchestration for Docker containers [
37].
The open-source software, Owncloud, is used for the file server [
38]. Files can be transferred using a desktop client through automatic folder synchronization or with a Python client. For the experiment, the files were transferred via Syncthing, simplifying iterative work in the local network.
Once the IIoT gateway has generated the measurement files, in addition to file transfer, they can be passed to a function block for extracting metrics and features. Key data can now be transmitted to the MQTT broker via the MQTT protocol. The extracted features are used for processing in an AI application, insofar as a trained model has already been transferred. Additionally, the results from AI classifications can be transmitted to the server via MQTT protocol for display or storage.
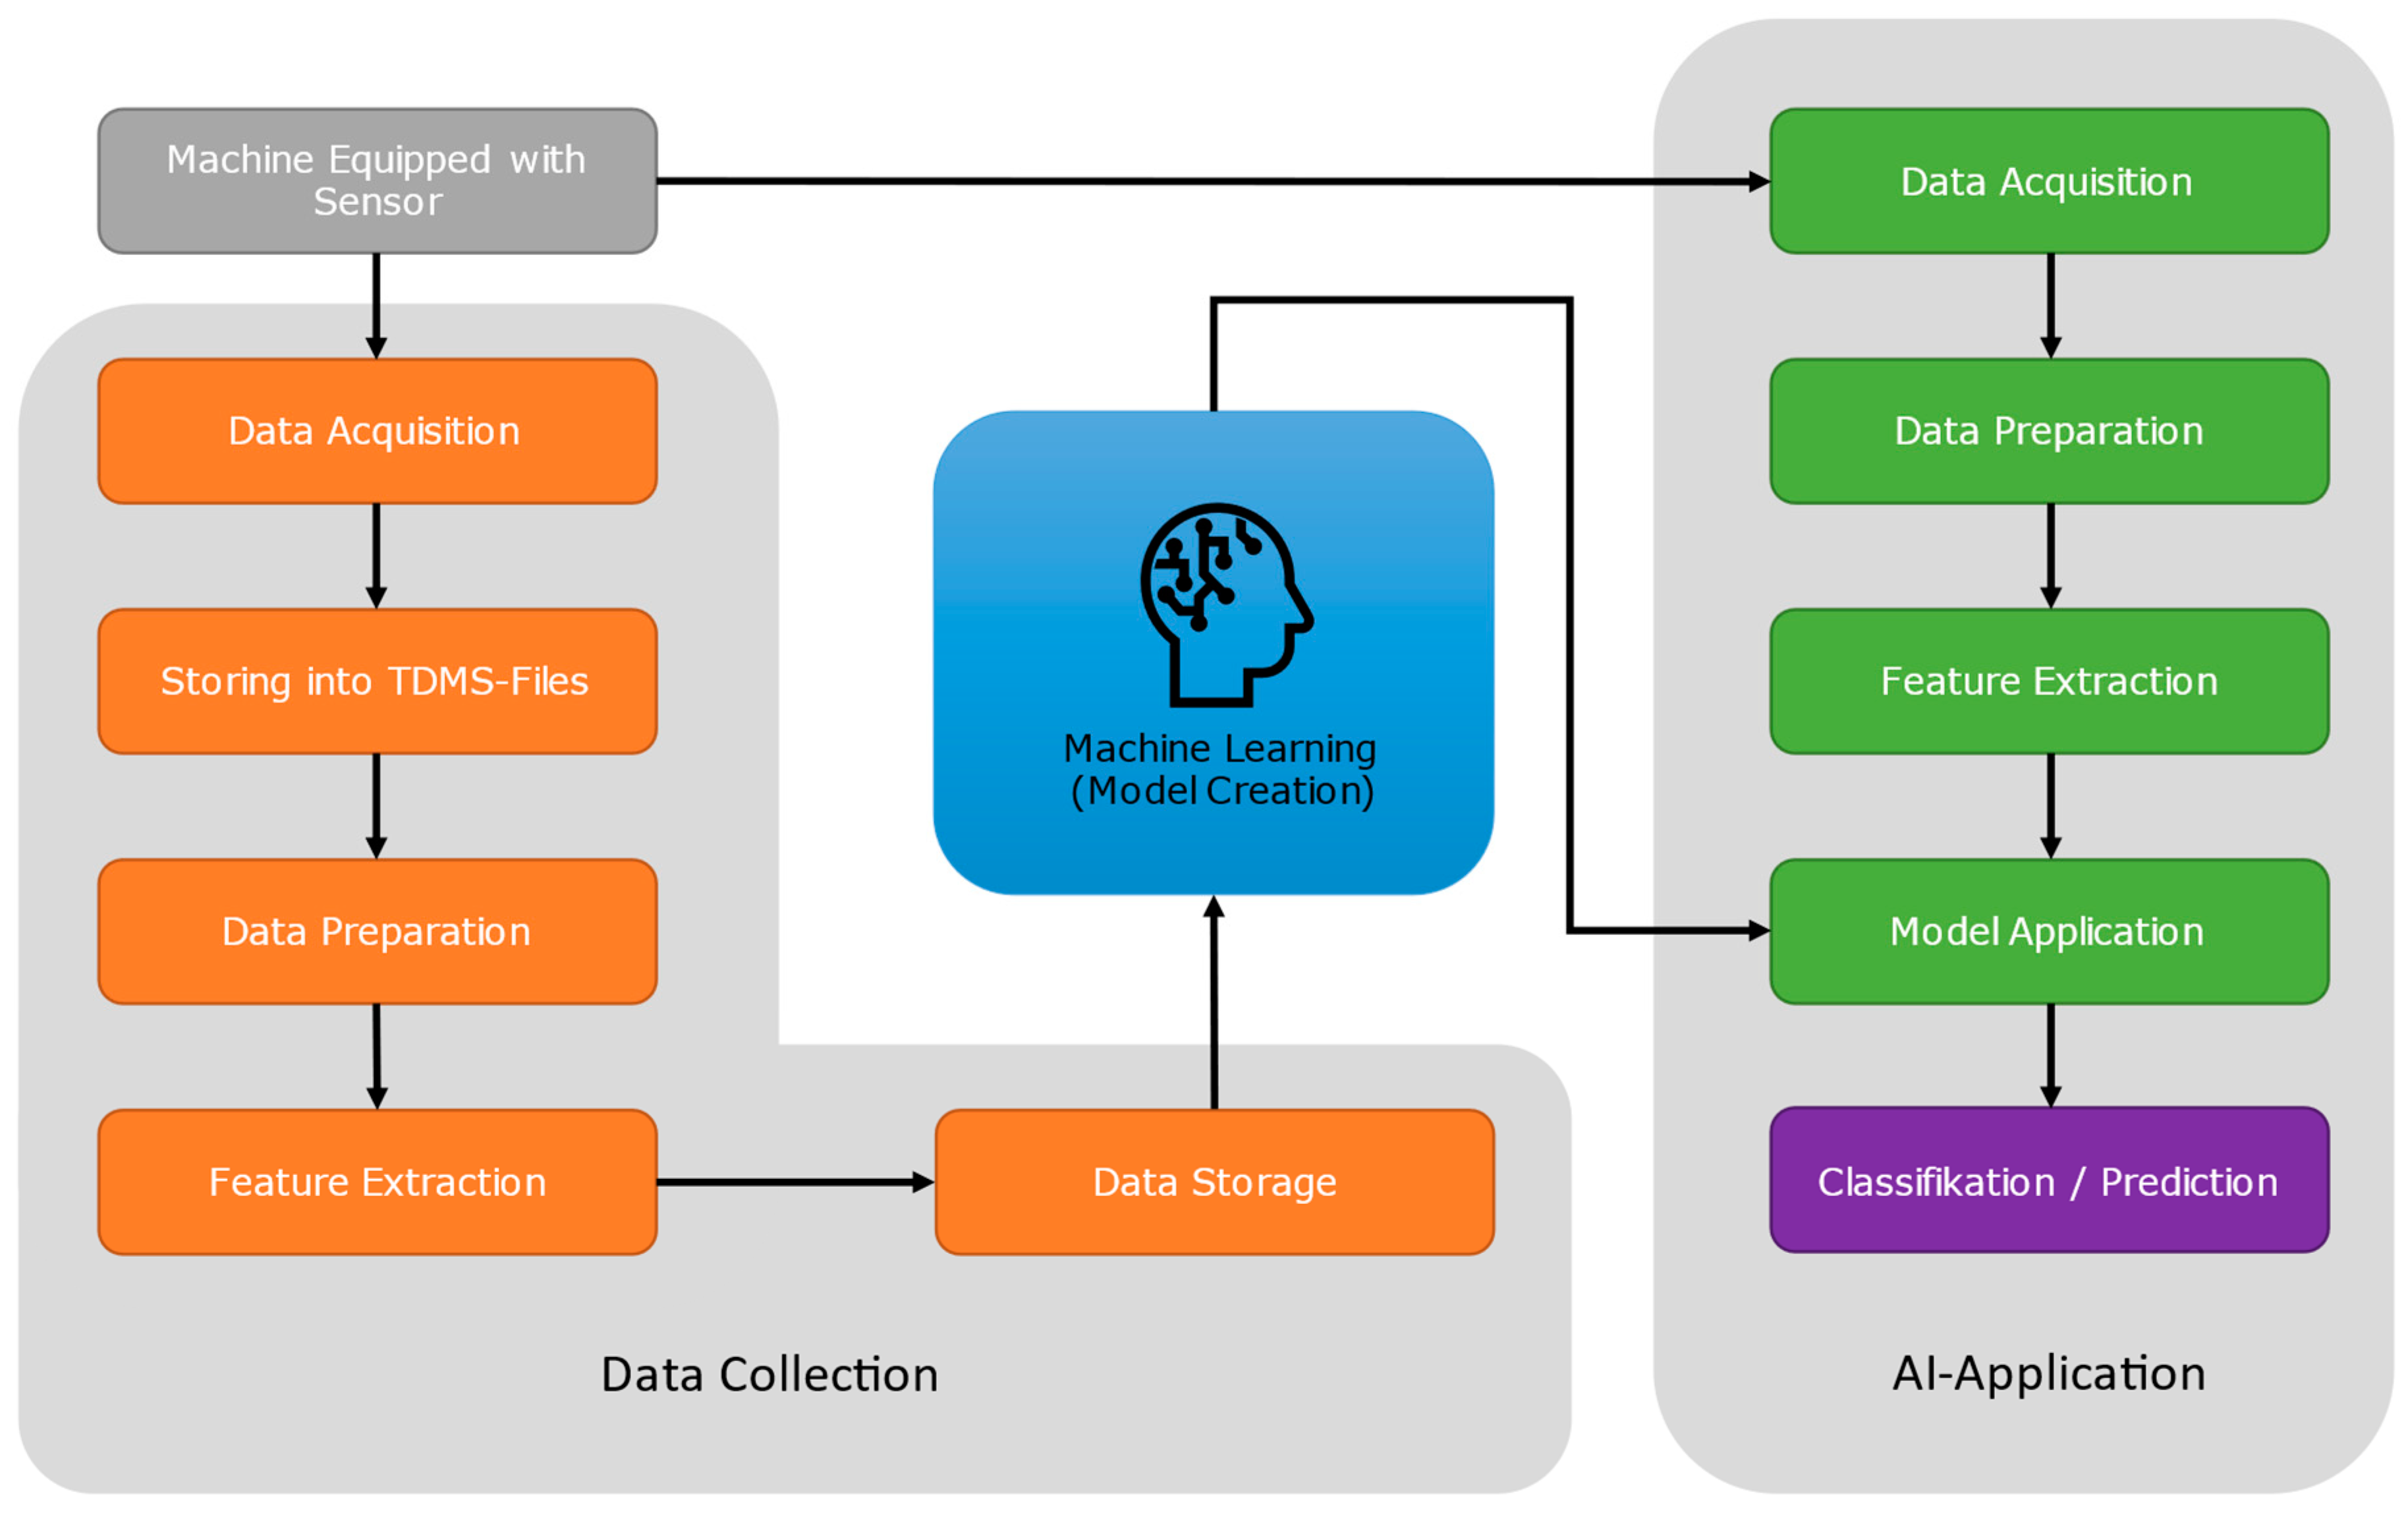
To conduct the experiment, the measurement files were transferred directly to a local computer for further processing. Here, the TDMS measurement files are first imported using Python and then passed on to the data preparation. From here, metrics and features are extracted, which are passed to the AI model training in the next step. After successful model creation, the model is transferred to the IIoT gateway.
In addition to the Owncloud file collection point, the cloud or server also contains the NodeRed data orchestration. This controls where individual data packets are forwarded or stored. The connection to a database is provided since the aim is to build a digital twin from the merger of several measuring stations. NodeRed provides a variety of input and output capabilities and can also be used for mathematical calculations of data and information from one or more sources. Input nodes also include protocols such as UPC-UA and ModBus, so machine data can be read, analyzed, and compiled on the server.
Thus, NodeRed represents the industry standard for data orchestration in IoT and digital twins. For the development of the IIoT gateway, the internal user interface NodeRed UI was used. In the presented IIoT gateway, the program flows are divided into two sections: DAQ and, after model creation, the use of the model in an AI application. In each case, input data are converted via a concatenation of functions and made available for the next processing step.
3.6. Setup of a Neural Network
Google’s Teachable Machine application was used to build a neural network. It is a web-based application that can use different input data sets such as images, sound recordings, and video streams to perform transfer learning on a pre-trained model (MobileNet) [
39]. In order to use the acquired vibration data or the extracted feature datasets with Teachable Machine, the internal data preparation must be mimicked.
Features in the form of spectrograms were extracted from the acquired measurement data and converted to the input format of the model. The data sets are passed for the training phase as PNG images with 244 by 244 pixels in three color channels. Thus, a single-input field (array) in live mode must have the form (1, 244, 244, 3). As parameters, a number of 50 epochs, a batch size of 16, and a learning rate of 0.00105 are used. Further details cannot be adjusted in the app.
After the training is complete, model creation statistics from Tensorboard are available from the backend of Tensorflow, which are used for validation. The resulting model is downloaded in Keras format as an “h5” file and transferred to the IIoT gateway. The execution of the experiment and the results from the model training are described in
Section 4.
4. Results
In the following sections, an experimental application for the IIoT gateway is described in detail. The experiment encompasses AI-based detection of engine noises with a sound pressure sensor.
4.1. Description of the Experiment
First, measurement data with an IEPE sound pressure sensor (microphone) of engine noises are recorded and classified with AI. Two different states of motors are used for this purpose, so that measurement data for two classes are available. The states are a motor with normal running (class1) and a motor with an out-of-round running (class2). Using the measurement data, two AI models are trained using transfer learning and transferred back to the IIoT gateway. The measurement data are transferred to data sets with extracted features with two different parameters and the two trained models are compared with each other.
For the measurement DAQ, sound pressure is measured with an IEPE sensor, which consists of two components: a type 4189 vibration transducer (pre-polarized free-field microphone) and a type 2671 amplifier. The frequency range of the sensor is between 6 Hz and 20 kHz; the sensitivity of 51.4 mV/Pa was taken from the calibration card and entered to the parameter file via the measurement program. The microphone is decoupled from the surface and mounted 10 cm in front of a loudspeaker. A total of 600 measurements are recorded for each class with a duration of 1 s and a measurement frequency of 1600 Hz.
4.2. Execution of the Experiment
The measurement files are converted into a data set with two classes. The vibration signals are converted into spectrograms with a dimension of 33 frequencies times 28 time steps. Recurring frequency changes are represented in the measurement signal, and these are found at a temporally different position depending on the start time of the measurement. By the choice of a short window, more time steps are available over the signal length of one second in the representation of the spectrogram, in which the deflections can be seized. In AI transfer learning, the following parameters are applied in the experiment:
- -
Epochs: 50 (number of runs of the learning process)
- -
Batch size: 16 (the number of training examples in a forward/backward pass)
- -
Learning rate: 0.001 (how fast the neural network adapts to new input)
4.3. Evaluation of the Experiment
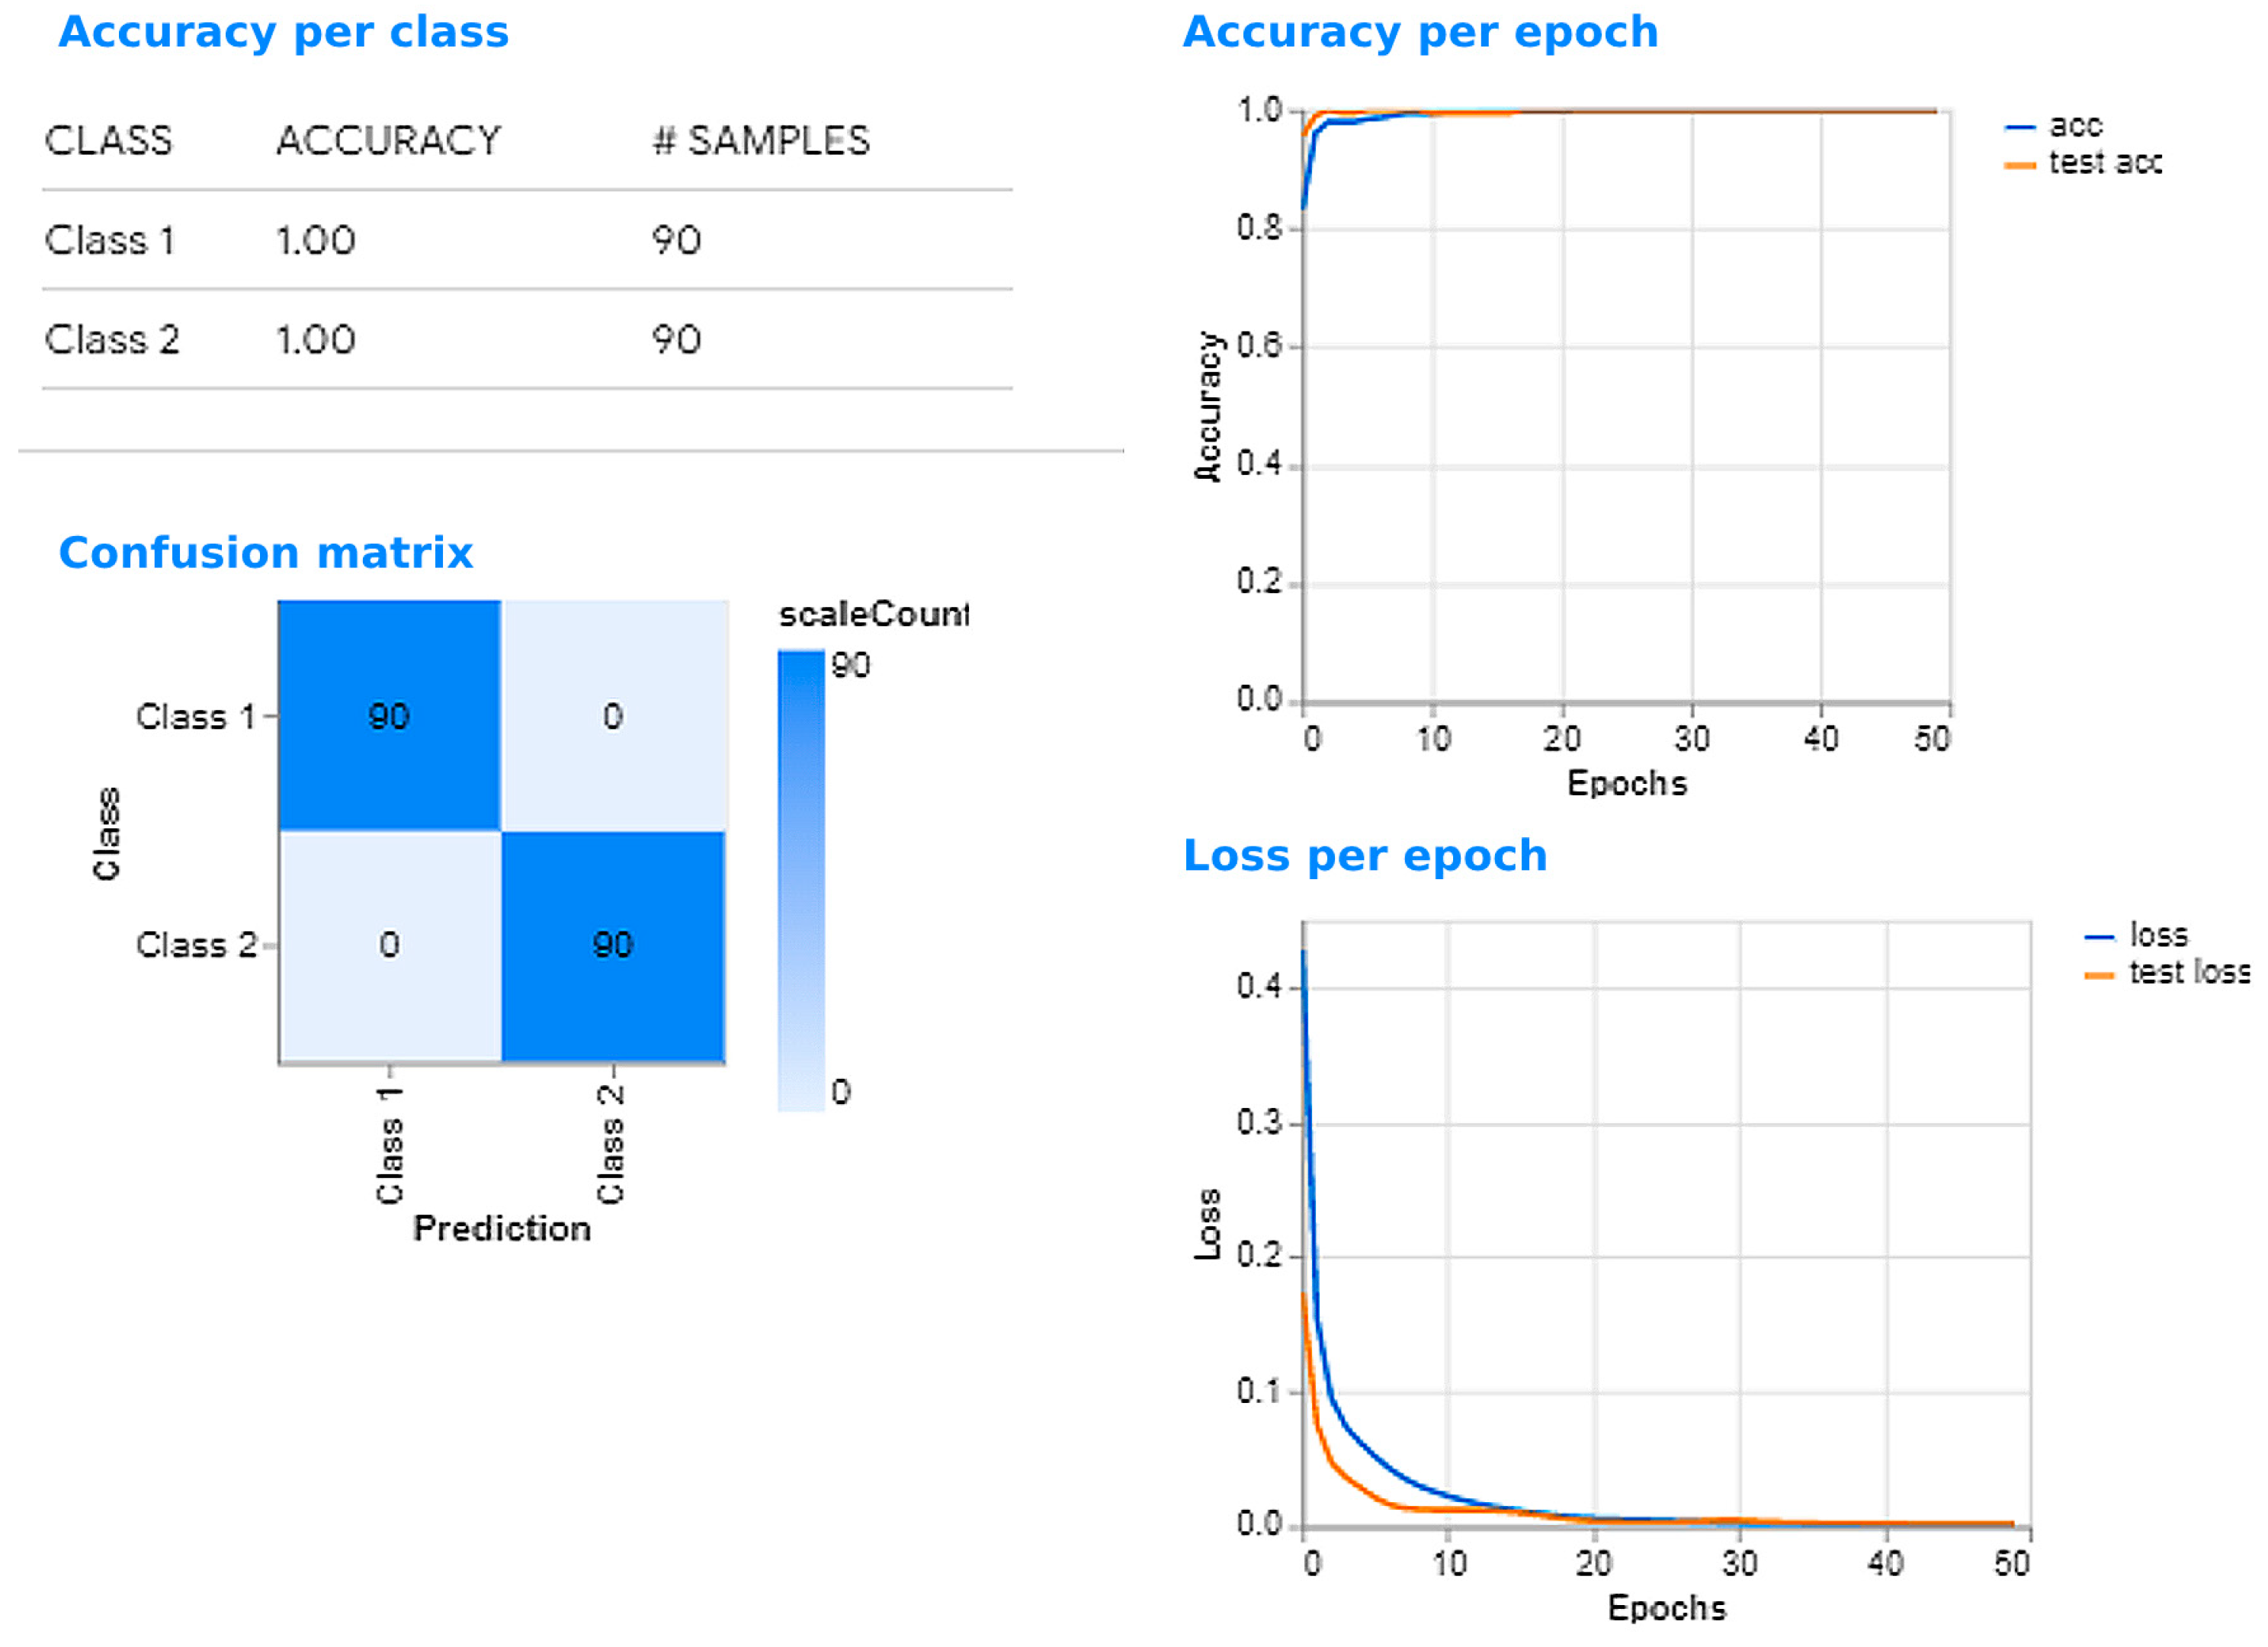
The blue lines show the behavior of the data sets used for training and the orange lines represent the remaining data unknown to the model, which were separated for evaluation (cf.
Figure 6).
The losses describe the sum of errors and are entered per epoch (run) as an average value in the history. The more an output value deviates from the expected value, the larger the error value. The training algorithm uses the loss value to update parameters in the model. The accuracy value (“acc”) describes the prediction performance from the model in percentages and serves as an interpretable metric.
If losses increase and accuracy decreases, the model only learns by rote but does not build understanding. If, on the other hand, losses and accuracy increase, there may be “overfitting” and the model fails to find meaningful values for the weighting matrix (“weights”) and bias vectors (“biases”). If the loss values decrease over the epochs and the accuracy values increase, the model seems to learn correctly.
For the “gouraud” data set, the losses decrease to a low level and the trajectories remain flat. The accuracies are already consistent in the upper range (about 99.9%) after 10 epochs. Again, the training is completed after 50 epochs. A hit rate of 100% is diagnosed for the test data set with 90 data points.
4.4. Validation of the Experiment
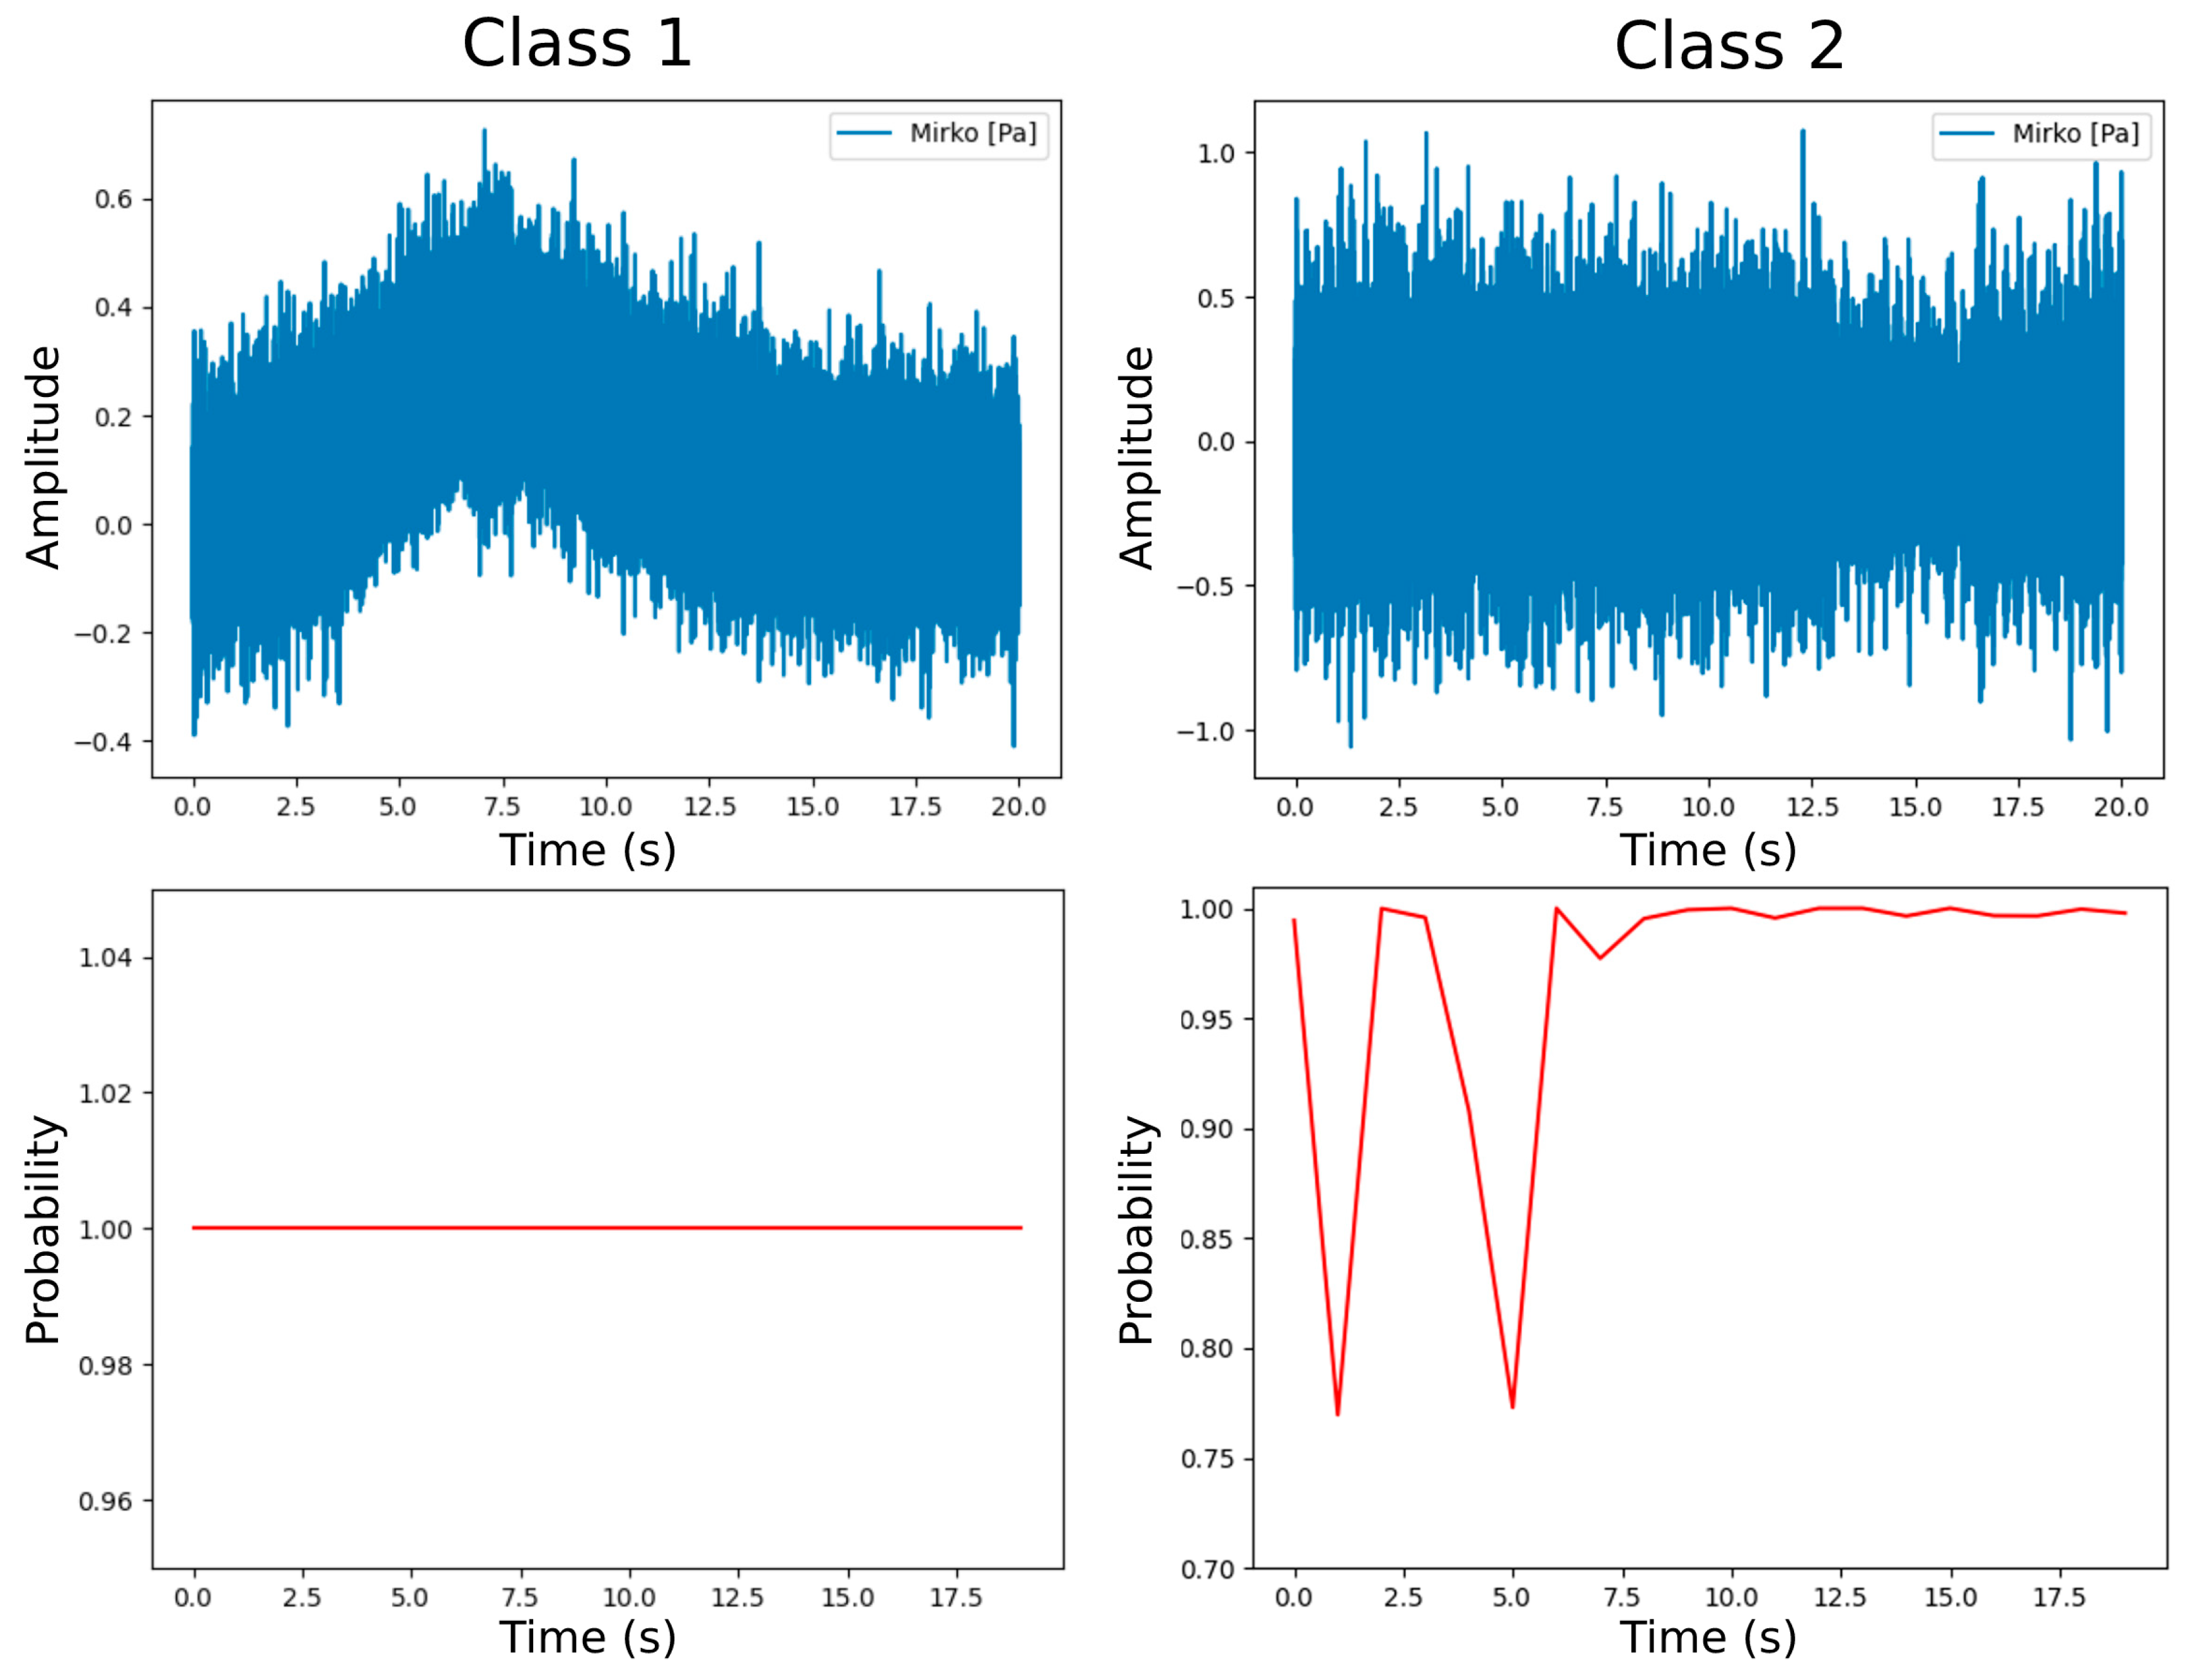
For the validation, the “gouraud” model from the training was selected.
Figure 7 shows the results of the validation with the “gouraud” model. The upper plot shows the time series of the measurement signal to the respective class and the lower plot shows the probabilities or accuracies from the AI model. The achieved results represent a consistent AI classification. For “class1”, 99.99% accuracy was obtained in the whole run and for “class2”, the result was also accurate, with few outliers and reached an average of 96.97% accuracy. Applying the shading setting “gouraud” to datasets extrapolated for a larger model input format is thus a useful tool to increase classification accuracy.
5. Discussion and Conclusions
The trained AI model from the experiment can generate good accuracy and has also shown in live operation on the IIoT gateway that it demonstrates good classification accuracy in the application. The representation settings during feature extraction have a large impact on the quality of the generated datasets. The model has already achieved good results despite small datasets, showing that the applicability of the presented learning process is suitable for rapid prototyping projects.
Within the scope of measurements with sampling rates of up to 51.2 kHz and a resolution of 24 bits, the IIoT gateway can generate measurement data of the same quality as with systems from laboratory technology. Furthermore, it is possible to exchange the hardware after a measurement task has already been started with laboratory technology and is to be continued with the IIoT gateway and vice versa. Since the measurement data can be acquired in the same quality and the measurement files have the same format and present the same compatibility, a trained AI responds to extracted feature datasets from both systems in the same way. An AI model can be trained with measurement data from a system with laboratory technology or with data collected with the IIoT gateway and can work with both types of systems in operation. In addition to the measurement card built into the IIoT gateway, other modules for the acquisition of voltages, temperature measurements with thermocouples, and for voltage output are available. Thus, there is a possibility of further substitutions in other areas besides the acquisition of sound and vibration.
Alternative products generally do not have the same open-source software capabilities and are more expensive to purchase. The presented IIoT gateway was designed to substitute measurement hardware that originates from the field of laboratory equipment and is used in the industrial environment for measurement tasks for research purposes or use by end customers. One motivation is the cost reduction for such measurement tasks, especially since measurement hardware for the acquisition of high frequency signals in high resolution is expensive. For the cost-effectiveness analysis, a comparison of the IIoT gateway with measurement systems from NI is performed. For a fair comparison, components that have differing characteristics are only charged proportionally (e.g., with twice as many connection options compared to the IIoT gateway, only half the price is applied). The costs for sensors and cables are left out, as these are the same for all systems.
Two product categories emerge from NI’s product line that provide measurement with similar characteristics: the NI C-DAQ and NI PXI systems. The NI C-DAQ system consists of external housings with slots for measurement cards which are connected to an additional computer to be purchased via USB or network connector. The NI PXI is a three-part system in which a housing, a plug-in computer, and plug-in measurement modules are assembled. For the comparison, the most favorable hardware was selected, which made it possible to perform measurements with the same or similar sampling rate and resolution with the possibility to connect IEPE sensors via a BNC connector.
In the case of the NI C-DAQ system, the simplest form was used with a C-DAQ 9171 housing [
40], which provides a slot for measurement modules, and the NI 9234 measurement module [
41], which has the same sampling rate of 51.2 kHz and 24-bit resolution as the IIoT gateway. Since the measurement module provides four inputs instead of two, only half of the price was included in the comparison (the full price is EUR 2930). A computer is also required for operation, for which a minimum cost of EUR 500 is assumed in the comparison.
The NI PXI system is the high-priced variant, which provides the most hardware variance and can be retrofitted with a variety of specialized measurement hardware [
42]. For the comparison, the components with the lowest financial outlay were picked out to enable comparable measurements. With the PXIe-1090 chassis, exactly two slots are available for modules, although these are not the same modules as in the C-DAQ system [
43]. The computer must be purchased additionally in the PXI system as a so-called PXI controller; the favorable variant is the PXIe-8821. The PXIe-4464 measurement module for sound and vibration measurements provides four BNC connections for IEPE sensors at a sampling rate of 204.8 kHz and 24-bit resolution [
44]. This also provides more ports than with the IIoT gateway and is prorated. The sampling rate of the PXI system is also above the available 51.2 kHz of the MCC172 measuring card, which is installed in the IIoT gateway. Since most measurement tasks do not require sampling rates above 51.2 kHz, no further reduction of the comparison price is applied for the comparison.
It is worth mentioning that NI’s measurement hardware has other features that are not mapped by the IIoT gateway prototype. Examples include direct compatibility with LabView software and other products from NI’s range, and the reading of electronic data sheets (TEDS) from compatible sensors.
Table 1 shows that a cost reduction in the range of 85.11–92.74% is possible with the IIoT gateway. In addition, the subscription license that has to be renewed annually according to the price model of NI LabView is omitted due to the use of open-source software. In the most favorable case, the measurement software NI FlexLogger [
45] is used, which costs only EUR 495 compared to the NI LabView license with EUR 1820 per year [
46].
The IIoT gateway sets itself apart from classical solutions through the combination of measurement hardware, a computer, and an AI application. With the ability to record IEPE sensors at a measurement frequency of up to 51.2 kHz, complex measurement tasks can be performed for which laboratory technology was previously used. The presented IIoT gateway was designed to substitute measurement hardware that originates from the field of laboratory equipment and is used in the industrial environment for measurement tasks for research purposes or use by end customers. One motivation is the cost reduction for such measurement tasks, especially since measurement hardware for the acquisition of high frequency signals in high resolution is expensive.
In summary, the following results and advantages have been achieved. The advantages and disadvantages are summarized in
Table 2:
- -
The development of a measurement box with hardware for DAQ of vibration signals up to 51.2 kHz measurement frequency as a substitution for high-end laboratory equipment. A Raspberry Pi 4 with the MCC172 measurement card was used, meeting the specifications required for the measurements.
- -
The self-development of all parts to avoid expensive bought-in components. The hardware was assembled from inexpensive components and the software was developed in-house. Only freely accessible program libraries were used. Only open-source software was used, so that the entire process from DAQ to AI evaluation could be carried out without cost-incurring software licenses.
- -
The acquired measurement data are stored in binary TDMS files, which have full compatibility with external programs.
- -
The in-house development of measurement program and AI application. All function blocks and program flows for the measurement program and AI application with Tensorflow were created independently.
- -
One experiment with two datasets of different quality has been performed to prove the overall functionality.
- -
Autarkic operation of the measurement box even in AI application mode. The AI application could be implemented directly on the measurement box; more powerful computing capacities are not necessary.
- -
Compatibility with IEPE sensors as well as a large selection of sensors with different measuring ranges.
- -
A favorable price and the use of solely open-source software (no follow-up costs due to licenses or subscriptions)
- -
A more efficient workflow, as the time required from a preliminary investigation to the acquisition of measurement data and AI application can be greatly reduced. In this way, high-frequency measurement data can be used for preliminary examination and the subsequent steps can be carried out directly on the same instrument.
Table 2.
Advantages and disadvantages of the IIoT gateway.
Table 2.
Advantages and disadvantages of the IIoT gateway.
| Advantages | Disadvantages |
|---|
| Acquisition of measurement signals with high measurement frequency up to 51.2 kHz in high quality | Measuring card does not support reading out electronic data sheets from sensors with TEDS (transducer electronic data sheet) |
| Compatibility with IEPE sensors | No official embeddability of the measuring card in LabView and MatLab (but there are open-source approaches) |
| Large selection of sensors with different measuring ranges | Measurement card is currently only fully compatible with the official Raspberry Pi board |
| Use of open-source software (no follow-up costs due to licenses or subscriptions) | For more complex AI models, seamless live operation is limited by the performance of the ARM processor (remedies include a “Tensor Processing Unit” (TPU), faster Raspberry Pi versions, or evaluation in the cloud). |
| Autonomous operation of AI application | TDMS measurement data does not have the full range of functions (special functions that are not needed in normal operation) |
The developed IIoT gateway is a useful extension of existing measurement technology and uses concepts from the field of IoT. Due to the possibility of autonomous AI recognition and remote measurement tasks, the gateway can also be integrated into systems where machine-to-machine communication is used. The data collection, analysis, and AI model creation process presented in the experiment can be used for preliminary investigations, feasibility studies, and AI rapid prototyping. The insights into extrapolating data help to make a wide range of acquired data usable with the same model through transfer learning. With sufficient validation, it can also be used to create permanent solutions, although training a specialized model is recommended for larger data sets.
By supporting container virtualization, software packages can be post-installed and additional functionality can be added to the device. The use of open-source software enables operation without purchasing licenses or time-limited subscriptions, so there are no follow-up costs. During development, care was taken to ensure a high degree of compatibility both with file formats and in communication with other devices. Measurement files acquired with the IIoT gateway can also be used with NI software and vice versa. A wide range of protocols enable communication with computers, servers, machine controllers, and other devices attributed to the IoT. The initial cost is extremely low for a measurement device with high measurement frequency and resolution, and especially compatibility with the IEPE sensor standard. The low initial costs and use without follow-up costs alone open new areas of application. Where in research operations an expensive measurement system with laboratory technology was often used for a certain period, a much cheaper IIoT device can now be used and can remain permanently installed if required at low cost. The transition from research to application is thus greatly shortened.
The concept of configuring measurement tasks simplifies the process and the device can be fully controlled remotely. Once the hardware has been installed at the measurement location, all further steps can be carried out from any other location, thus simplifying the support of the sensor network with spatial distance. The implemented update system allows easy maintenance of already installed measurement boxes and ensures that the latest software version can always be made available on all devices. This scalability is important, e.g., to be able to implement and operate larger measurement projects with a small team.
The IIoT gateway is designed to be part of a network, with many participants providing data. Therefore, the evaluation possibilities are not limited to what is possible with the device operating alone. Rather, there is the possibility of collecting data from IEPE sensors available in monitoring and evaluation platforms that often use only low-cost MEMS sensors or other simpler sensor types. Innovative new platforms for performing predictive maintenance, process optimization, and evaluation through AI methods will welcome the opportunity to use high-frequency measurement data and adapt their tools to the improved data situation. Some vendors have already recognized this trend and developed species-like solutions.
In the field of IIoT, the combination of modern software concepts such as AI applications with high-quality sensor technology in a self-sufficient “smart sensor” is the next logical stage of development, and the IIoT gateway is an example of what such a fusion can look like.


