Abstract
In this paper, we present and evaluate an ultra-wideband (UWB) indoor processing architecture that allows the performing of simultaneous localizations of mobile tags. This architecture relies on a network of low-power fixed anchors that provide forward-ranging measurements to a localization engine responsible for performing trilateration. The communications within this network are orchestrated by UWB-TSCH, an adaptation to the ultra-wideband (UWB) wireless technology of the time-slotted channel-hopping (TSCH) mode of IEEE 802.15.4. As a result of global synchronization, the architecture allows deterministic channel access and low power consumption. Moreover, it makes it possible to communicate concurrently over multiple frequency channels or using orthogonal preamble codes. To schedule communications in such a network, we designed a dedicated centralized scheduler inspired from the traffic aware scheduling algorithm (TASA). By organizing the anchors in multiple cells, the scheduler is able to perform simultaneous localizations and transmissions as long as the corresponding anchors are sufficiently far away to not interfere with each other. In our indoor positioning system (IPS), this is combined with dynamic registration of mobile tags to anchors, easing mobility, as no rescheduling is required. This approach makes our ultra-wideband (UWB) indoor positioning system (IPS) more scalable and reduces deployment costs since it does not require separate networks to perform ranging measurements and to forward them to the localization engine. We further improved our scheduling algorithm with support for multiple sinks and in-network data aggregation. We show, through simulations over large networks containing hundreds of cells, that high positioning rates can be achieved. Notably, we were able to fully schedule a 400-cell/400-tag network in less than 11 s in the worst case, and to create compact schedules which were up to 11 times shorter than otherwise with the use of aggregation, while also bounding queue sizes on anchors to support realistic use situations.
1. Introduction
Indoor positioning systems (IPSs) have received a great deal of attention from the academic and industrial communities over the last two decades. Positioning is an important application field for the Internet of Things (IoT) since, in addition to the ability to communicate with “things”, there is often a requirement to track their position [1]. Moreover, positioning and IoT are mutual enablers. On the one hand, IoT technologies can be used to perform a form of position tracking, e.g., by use of RFID tags or by measuring the RSSI of BLE beacons [2], and, on the other hand, real-time and accurate positioning adds significant value to IoT-capable devices. Many IoT applications benefit from, or simply require, positioning features. These include: tracking resources on construction sites for efficiency or to prevent theft [3], preventing workers from getting close to hazardous areas with geofencing [4], dynamic positioning of cargo in logistics [5], and determining the position of objects or humans inside buildings [6,7], be it for room management or for energy-efficiency.
A large variety of techniques have emerged relying on various communication media, such as radio-frequency, visible or infrared light, and acoustic waves [8,9]. With respect to RF-based systems, WiFi, Bluetooth, RFID, and ultra-wideband (UWB) systems are the most common, achieving accuracy levels that range from a few meters down to a few tens of centimeters [9]. Due to its capacity for precise time-of-arrival estimation, ultra-wideband (UWB) has received more traction for accurate indoor positioning than WiFi, Bluetooth and RFID. Another reason is the standardization of a Ultra wideband (UWB) physical layer in the IEEE 802.15.4 standard for low-rate wireless personal area networks [10], an IoT technology, and the subsequent availability of affordable, off-the-shelf transceivers from manufacturers, such as Decawave [11]. This trend continues with the forecast of IEEE 802.15.4z [12] promising increased data rate, longer range, lower energy consumption and higher security for new applications. This revision is being promoted by the UWB Alliance, a non-profit organization seeking to increase user-awareness of UWB as an alternative to GPS for indoor use. Recent availability of products, such as Apple’s AirTag and Samsung’s Galaxy SmartTag+, that embed UWB technology, is another sign of the success of this technology.
UWB-based IPS typically relies on a set of fixed-position anchors that exchange UWB frames with mobile tags. Typical protocols are two-way ranging (TWR) or time difference of arrival (TDoA). In the former, an estimate of the distance (range) between nodes is obtained, based on measuring the propagation time, while in the latter, the time of arrival of a beacon signal transmitted by the mobile tag is measured on different anchors that are time-synchronized. Whatever the approach, anchor measurements are then transferred to a location engine which has more computational resources to apply a trilateration algorithm, or to solve a system of hyperbolic equations to estimate the positions of the mobile tags. To transfer the measurements, most existing UWB-based systems rely on a separate backbone network. For example, LocURa [13] collects measurements using a serial/UART link and then transmits them over an Ethernet network. A similar approach was used by Macoir et al. [14] where the different cells of the network were connected through multiple Ethernet segments. Using another wireless technology, such as Wi-Fi or LoRa as a backbone in addition to UWB, has also been demonstrated [15,16].
In this paper, we consider the use of a pure wireless deployment where both the ranging exchanges between anchors and tags and the transmission of the measurements towards a location engine are performed over the same UWB network. A pure wireless indoor positioning system (IPS) is desirable when a fixed backbone network is not available or is difficult to setup, such as in temporary, emergency or mobile deployments. It can also be convenient when the building does not make it easy to install new mains-powered anchors. We discuss the principles of our architecture and then focus on how to schedule communications over such a network. Our solution relies on UWB-TSCH [17], a medium access protocol that combines time, frequency and code multiplexing. A UWB-TSCH timeslot can carry either a ranging or a data exchange. Within a timeslot, multiple concurrent exchanges can be performed over a different frequency channel and/or using a different code. Our paper discusses a centralized algorithm that schedules when (in time) and where (in frequency and code) each communication must happen. This algorithm, which relies on a well-known heuristic [18], aims at minimizing the UWB-TSCH slotframe duration, hence maximizing the ranging rate. The schedule is fixed but the localization rate is dynamically adapted depending on the local density of mobile tags. Using this approach, we reduce the amount of control traffic involved in the registration of mobile tags to a cell (a subset of nearby anchors). We discuss how the time to compute a new scheduling evolves with the network size. Finally, we evaluate our algorithm both by simulation, and in a real-world testbed deployed within an office environment.
To summarize, the contributions made in this paper are as follows:
- We design a pure-wireless UWB indoor positioning system architecture.
- We provide a fully-working implementation of UWB-TSCH including a ranging timeslot suitable for asymmetric double-sided two-way ranging and a protocol for collecting the ranging measurements. Its implementation is open-source and publicly available.
- We present the localization scheduling algorithm (LSA), a centralized scheduling algorithm for ranging and backbone communications. Its implementation is open-source and publicly available.
- We evaluate LSA on large networks of hundreds of cells, through simulation, to assess the quality of the scheduling and its computation time.
- Based on the obtained results, we propose, implement and evaluate several improvements to increase the achievable positioning rate and make it more practical, i.e., message aggregation, multi-sink support and buffer size bounding.
Our paper focuses on a scheduling algorithm for supporting an indoor positioning system (IPS). Our algorithm can also by used, with few modifications, to carry sensor data trough the network, allowing mobile IoT devices to carry environment information with the added value of the location.
Our paper is organized with the following structure. Section 2 introduces the background of this paper, including UWB radio communications, media access control and ranging. Section 3 presents existing work related to UWB positioning systems and scheduling of communications in time-slotted channel hopping networks. Section 4 gives an overview of the pure wireless UWB-based indoor positioning system architecture that we use as context in this paper. Then, Section 5 describes our scheduling algorithm and uses a simple example as support. Section 6 provides a simulation-based evaluation of the algorithm in various synthetic networks. Based on the observations of the evaluation section, Section 7 presents further improvements of the scheduling algorithm, such as message aggregation, multi-sink networks, and bounding the queue size, while Section 8 evaluates the computational performance of our algorithm. Finally, Section 9 offers some concluding remarks and discusses possible future extensions.
2. Background on UWB Positioning
In this section, we introduce the architecture of a typical positioning system relying on ranging measurements. To perform localization we consider two types of nodes. First, we call tags the mobile nodes that are free to move within the area of interest. The system we discuss needs to track the positions of the tags. Second, anchors are fixed nodes with known positions that are part of the positioning infrastructure. Determining the position of tags is performed by exchanging specific messages with anchors. In this paper, we rely on ranging techniques to estimate the distance between one tag and one anchor. The result of such an estimation is called a ranging measurement. In our system, the tags and anchors are not involved in the actual calculation of the positions. Instead, the ranging measurements performed by multiple anchors for a specific tag are forwarded to a central Localization engine that applies a trilateration algorithm to estimate the position of that tag. To allow for 2D positioning, at least three anchors are required, while for 3D positioning a fourth anchor would be necessary. The anchors that cover a specific zone form a cell. An anchor can participate in multiple adjacent cells. A tag that moves from cell to cell will be located through ranging measurements with different anchors.
Figure 1 depicts an example network composed of a single cell that contains three anchors a1, a2 and a3. A single tag, t1, is currently present in this cell. Two types of messages need to be carried in this network: Ranging messages are exchanged as part of the ranging technique while Data messages carry the resulting ranging measurements and are forwarded to the Localization Engine. Ranging messages are therefore only exchanged between one tag and the anchors of its cell while Data messages are forwarded from anchor to anchor until they reach the Localization Engine.
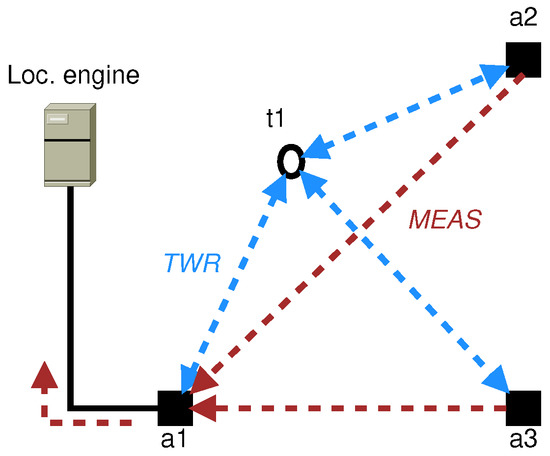
Figure 1.
Positioning system composed of a single cell that contains 3 anchors.
The subsequent sections provide more details. First, we detail the principles of a specific ranging technique called two-way ranging (TWR). We then discuss how the UWB radio technology allows centimeter-level accurate two-way ranging (TWR). Finally, we discuss how to make UWB communications deterministic and how to take advantage of frequency diversity.
2.1. Ranging and Positioning
Two-Way Ranging (TWR) protocols allow measurement of the time-of-flight (ToF) between pairs of nodes, and hence, estimation of their distance. The advantage of TWR protocols is that nodes need not share a common time reference. Figure 2a illustrates the simplest single-sided two-way ranging (SS-TWR) protocol [19], which requires exchanging only two messages. Node u initiates the protocol by scheduling the sending of a message to node v at time . Upon the reception of u’s message, node v replies after a predefined interval . When u receives v’s reply at time , it is able to determine the ToF by using Equation (1). Note that and are times measured in u’s time reference only.
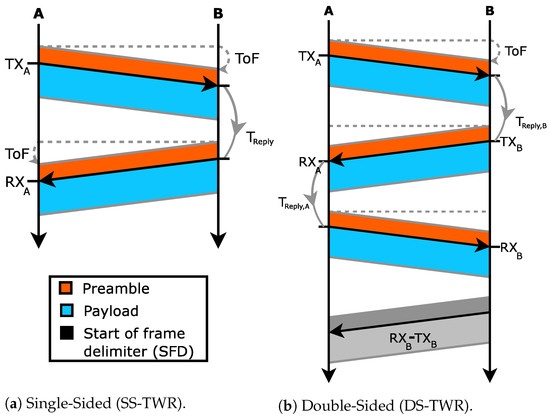
Figure 2.
Principles of single-sided two-way ranging (SS-TWR) and double-sided two-way ranging (DS-TWR) protocols. Messages are composed of a preamble (orange) and payload (blue). A timestamp is associated to the end of the preamble. Times , and are measured with node u’s clock reference.
The messages shown in Figure 2 are composed of two parts: first, a preamble made of predefined symbols, second, a payload made of random symbols. Special radio hardware can be used to associate a timestamp to the end of the preamble, known as the start of frame delimiter (SFD), allowing precise recording of transmission/reception times.
Variants of TWR can be used to reduce systematic errors. For example, differences in clock frequency between u and v could induce a small difference in the value of used by u and v. The double-sided two-way ranging (DS-TWR) illustrated in Figure 2b reduces such errors by averaging ToF measurements performed in both directions. Asymmetric double-sided two-way ranging (ADS-TWR) [19] is an improvement of the double-sided two-way ranging that allows the use of different predefined intervals , on each node, which allows transmission as soon as possible.
If a common clock reference is available, another way to perform localization is to rely on time difference of arrival (TDoA) protocols. In such schemes, a mobile node will typically send a beacon frame that is received at different times by anchor nodes . All the are measured with the same time reference. Each difference in reception times between a pair of anchors defines a hyperbola. Solving a system of two or more such hyperbola equations leads to the mobile node’s position.
TWR protocols require more transmissions than time of arrival (TDoA) protocols and are thus less scalable. However, TWR protocols are easier to implement since they do not require sub-nanosecond time synchronization among the nodes. Recall that a difference of 1 ns translates to an error of approximately 30 cm in ranging. In this paper, we rely on a TWR protocol.
2.2. Ultra Wideband Communications
UWB is a radio-frequency communication technology that uses a very large frequency spectrum, typically more than 500 MHz wide. In this paper, we rely on the IEEE 802.15.4a UWB physical layer (PHY) [10] which, being based on inpulse radio (IR), performs modulation by sending very narrow pulses. Short pulses make multi-path components resolvable. This has the double benefit that inter-symbol interference does not occur in multipath environments and that the arrival time of the first path component can be distinguished from later components. The time of arrival of a frame can therefore be precisely estimated, an important asset for two-way ranging techniques. Another benefit of UWB is that, since the energy of a transmission is spread over a very wide spectrum, the power spectral density (PSD) is below the noise floor. Therefore, UWB and narrow band technologies, such as WiFi and Bluetooth, can coexist without interfering with each other.
Different parameters control the UWB PHY complying with IEEE 802.15.4. First and foremost, different nominal bitrates are standardized: 110 kb/s, 850 kb/s and 6.8 Mb/s are supported by the DW1000 transceiver we use in this study. Sixteen channels are defined by the UWB PHY in this standard, of which four are supported by our transceiver in the 3.25–4.25 GHz range and another three between 5.75 GHz and 7.25 GHz. Within each channel two different “orthogonal” preamble codes can be used, allowing simultaneous communications [17,20]. Multiple preamble lengths are available, ranging from 64 to 4096 symbols, with longer preambles giving better message detection at the cost of lower throughput.
2.3. Media Access Control
The low power spectral density (PSD) of UWB turns into a drawback for medium access control. Indeed, performing clear channel assessment based on energy detection is impossible with UWB. As a consequence, carrier sense multiple access (CSMA) is impossible and the predominant channel access strategy until recently has been ALOHA [21]. To decrease the risk of collisions, a natural approach is to rely on time-division multiplexing, as proposed in the time-slotted channel hopping (TSCH) mode of operation of IEEE 802.15.4. Channel-hopping is also used in this mode to increase the robustness to interference. This scheme can be adapted to the UWB PHY, as we have shown in UWB-TSCH [17]. We show that precise timeslot synchronization is achievable with off-the-shelf hardware. In addition, increased throughput can be achieved by scheduling simultaneous communications over different channels.
In UWB-TSCH networks, each communication is assigned a pair (timeslot, channel), named a TSCH cell. A slotframe organizes the communication during a fixed duration of timeslots and along different channels. Within a slotframe, each timeslot is identified using a timeslot number (TSN). The communication pattern of the slotframe repeats infinitely. For this reason, a timeslot is also identified by an absolute slot number (ASN) counted from the start of the network.
Figure 3 presents a possible schedule for the example given in Figure 1. There are five communications to schedule: three two-way ranging exchanges (in blue) between the mobile tag t1 and each anchor (a1 to a3) and two forwarding transmissions of ranging results (in red) towards the sink of the network, a1. In addition to this, a shared timeslot (in gray) is scheduled to announce the network and keep it synchronized. Two concurrent communications are scheduled at different channel offsets in the timeslot with TSN = 2.
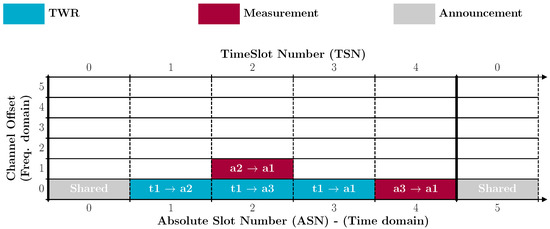
Figure 3.
Schedule corresponding to the example of Figure 1. The slotframe contains 5 timeslots and repeats over time.
To perform channel hopping and make communications more robust to interference, the physical channel used by a TSCH cell varies from slotframe to slotframe, as dictated by Equation (2). The channel offset and ASN are mapped to a physical channel/code by means of a lookup table F. In the IEEE 802.15.4 time-slotted channel-hopping (TSCH) MAC layer for 2.4 GHz PHY, the lookup table is a pseudo-random permutation of the channels, generated using a linear feedback shift register (LFSR). In our implementation, the main objective of TSCH is not to be robust to interference but to increase the channel usage by means of frequency multiplexing. Therefore, in our case, F is just a lookup table of channels. Table 1 provides the list of channels used in our experiments, with . The table only contains channels that are 499.2 MHz wide. When two channels use the same frequency (e.g., channels 0 and 4), they use different orthogonal preamble codes and different values of the pulse repetition frequency (PRF), meaning that they can be used concurrently [17,20].

Table 1.
Channels used in UWB-TSCH. All of them can be used concurrently as they use either different frequencies or different orthogonal preamble codes and pulse repetition frequency (PRF).
3. Related Work
Ultra wideband (UWB) was initially considered for high-rate short-range wireless communications. However, that use case has since been abandoned, specifically due to the lack of adoption on the consumer electronics market. UWB has since received a lot of attention from scientists and industry as an Internet of Things (IoT) technology for wireless sensor network (WSN) building and in support of very accurate positioning systems.
3.1. UWB as an IoT Technology
One of the earliest descriptions of UWB use in sensor network communication and tracking is UWEN, proposed by Ian Oppermann et al. [22]. They detail the physical and medium access layers of their design. The use of bit position modulation (BPM) and direct sequence (DS) allow a simple non-coherent receiver architecture and good spectral characteristics. Time-division multiplexing is used to control access to the media and the nodes are able to estimate the time of arrival (ToA) of frames. Abdellah Chehri and his co-authors [23] proposed an UWB-based sensor architecture for localization of workers and equipment in underground mines, an environment known to be hostile to radio transmissions. Their work focuses on the impact of a simulated mines radio channel on the performance of UWB ranging techniques. They do not address the networking aspects of UWB localization.
The interest in UWB communications has been even more significant since the introduction of the UWB PHY and medium access control (MAC) layers in the IEEE 802.15.4a [10] standard for low rate wireless personal area networks (LR-WPAN). Through that standard, UWB radio communication has become a technology suitable for IoT applications. Off-the-shelf transceivers compliant with that standard quickly became available on the market. Tingcong Ye et al. conducted an early experimental evaluation of UWB transceivers obtained from Decawave [24]. Jorge F. Schmidt et al. [25] studied the performance of UWB communications in an industrial environment. To this end, they measured the received signal strength and packet loss in a network involving a total of six nodes, deployed in an aircraft assembly hangar. They compared the obtained results to that of narrowband IEEE 802.15.4 at 2.4 GHz.
3.2. UWB-Based Indoor Positioning
The use of UWB for indoor positioning was surveyed by Abdulrahman Alarifi and his co-authors [26] in 2016. However, many more interesting results have appeared since. Abdulkadir Karaagac et al. [27] performed a small scale (four anchors, onetag) evaluation of off-the-shelf UWB and Bluetooth low energy angle-of-arrival indoor localization systems in an industrial site located in The Netherlands. They compared the performance, such as coverage and accuracy, of both systems with static and mobile tags. François Despaux et al. evaluated N-TWR [28], a two-way ranging protocol variant for UWB minimizing the number of messages exchanged with N anchors (hence the name). Pablo Corbalán et al. evaluated Chorus [29], a GPS-like approach to UWB localization in arbitrarily dense cells. The main idea of Chorus is to rely on time difference of arrival (TDoA) but with anchors concurrently sending carefully crafted out-of-phase beacons. The tags compute the time difference of arrivals by analysing the channel impulse response (CIR) of the combined anchor signals. This approach is, however, limited to small areas since it only considers localization in a single cell. Bernhard Großwindhager and his co-authors essentially explored the same principle in SnapLoc [30] which suffers from the same one-cell limitation. Davide Vecchia et al. [20] explored concurrent UWB communications and ranging exchanges on the same channel, using different preamble codes and tightly synchronized transmitters. Their work was limited to a single cell. SALMA [31], proposed by Bernhard Großwindhager et al, is another one-cell UWB architecture. Its main novelty is that it works with a single anchor, dramatically reducing the burden of deploying a positioning system. The core of its principles is in the exploitation of the multi-path components received due to reflection by obstacles and walls. Combined with a rough model of the environment, their system is able to resolve the position of a mobile tag based on different components that appear in the channel impulse response (CIR). Another proposal making use of the Channel Impulse Response (CIR) is that of Sebastian Kram et al. [32]. The objective of their work is to understand the impact of environmental complexity on the performance of CIR-based approaches, especially in non-line-of-sight (LOS) scenarios. The context is that of a car assembly facility where different parts and their mounting places needed to be positioned accurately. In their paper, Guenther Retscher et al. [33] consider the combined use of UWB ranging and Wi-Fi RSS, using a fusion algorithm to improve positioning accuracy. They rely on a total station to gobtain ground truth and conclude that accuracy is very sensitive to how well the area of interest is covered by anchors. Sreenivasulu Pala et al. propose a more advanced leading edge detection algorithm [34] to improve the estimation of a received signal’s time of arrival (ToA). More recently, Minghui Zhao and his co-authors proposed ULoc [35], a positioning system that relies on UWB angle of arrival (AoA) by means of a custom built multi-antenna anchor which provides the azimuth and polar angle of incoming signals. This allows increased system scale, allowing more tags to be located within the region of interest at lower communication and energy cost. Charles Champagne Cossette et al. propose a scheme to allow two devices to estimate their relative 3D position without an infrastructure [36]. This is different from the studies described previously which require anchors as references. To achieve this, each tag is equipped with a UWB transceiver and an inertiall measurement unit (IMU) with nine degrees of freedom. Their system requires that both tags move sufficiently within a measurement frame.
3.3. Networking Aspects of UWB Indoor Positioning System (IPS)
The above studies focused on the performance of single-hop communications and local positioning systems, not on networking-oriented challenges. Adrien Van den Bossche et al. [13] proposed LocURa, a 20 node UWB testbed for the purpose of performing real-world ranging and positioning experiments, instead of using simulations. Each node is built around a Teensy ARM Cortex-M4 board coupled with a DecaWave DWM1000 UWB transceiver module. The nodes are connected with a serial/UART link to Raspberry Pi controllers connected through a backbone network. Another UWB indoor positioning multi-cell network architecture was proposed by Nicolas Macoir and his co-authors [14], relying on a backbone of multiple Ethernet segments to connect anchors. To allow multiple users to roam to different cells, they proposed an ad-hoc MAC protocol. The same research group also proposed a general-purpose analytical model of UWB-based indoor localization [37] able to estimate different performance metrics, such as the localization rate in a wide variety of deployment schemes. This model, which allows testing of the scalability of different network architectures, was implemented as a MatLab script, which is unfortunately not publicly available. Zhengdong Li et al. [16] combined UWB positioning with a LoRa backbone.
In a previous study [17], we proposed UWB-TSCH, a combination of time division multiple access (TDMA) medium access control with frequency hopping, while retaining compatibility with the IEEE 802.15.4e time-slotted channel hopping standard. Time division multiple access (TDMA) allows deterministic medium access and reduced energy consumption, at the cost of maintaining temporal synchronization among the nodes. We implemented a fully working prototype under Contiki and evaluated its performance. In particular, as in the work of Davide Vecchia et al. [20], we showed that simultaneous transmissions on different channels, or on the same channel with different preamble codes, is indeed possible. Our approach requires the establishment of a communication schedule.
3.4. Time Slotted Channel Hopping (TSCH) Scheduling and Mobility
TSCH scheduling is a well-studied topic, as shown in the surveys by Rodrigo Teles Hermeto et al. [38] and Andreas Ramstad et al. [39]. Scheduling algorithms can first be divided into centralized and distributed algorithms. TASA [18], proposed by Maria Rita Palattella et al, is one of the first centralized scheduling algorithms, focusing on collect applications. It is basically an adaptation of the early work by Ramanathan et al. [40] for multi-hop radio network communications. Its limitation is that it only considers upward traffic along a tree. DeTaS [41] was later proposed by Nicola Accettura et al. as a distributed version of TASA. Orchestra [42], proposed by Simon Duquennoy et al, is another distributed approach that supports different application traffic. Its main characteristics is that no additional signalling is required to establish the schedule, as it relies on a hash of node identifiers to automatically allocate communications. Alice [43], proposed by Seohyang Kim et al, is a variant of Orchestra that hashes link identifiers instead, resulting in less frequent scheduling collisions. The IETF also standardizes the minimal scheduling function (MSF) [44] as part of the 6TiSCH framework, a distributed algorithm that dynamically allocates new communications in the schedule based on an estimation of the traffic load.
Finally, mobility in TSCH networks is a difficult topic that has not yet been heavily studied, with only a few results available to date. Jetmir Haxhibeqiri et al. [45] proposed use of an Ethernet backbone network and single-hop IEEE 802.15.4 links. Atis Elsts et al. designed Instant [46], a TSCH scheduling approach supporting mobile nodes. One of the salient features of Instant is that instead of using a routing protocol, it relies on Anycast to speed up neighbor discovery and to allow mobile nodes to quickly attach to their base station. Imed Romdhani and his co-authors discussed possible adaptations of IEEE 802.15.4 to better support mobility [47], but they do not consider the TSCH mode. Charalampos Orfanidis et al. [48] have recently studied how different distributed scheduling algorithms (Orchestra/Alice and MSF) perform under two simulated mobility scenarios. They conclude that none of the studied approaches handles mobility in a satisfying manner. In a recent technical report [49], Charalampos Orfanidis and others discuss how to maintain connectivity in a TSCH network of robots by adapting their motion speed.
4. System Overview
In our system, we assume that each anchor has a fixed position, is mains powered and is able to communicate with the root of the network using multi-hop communications. Tags are battery powered and can move freely. Anchors are typically arranged so as to cover the area of interest and are organized in cells of nearby anchors. A typical deployment would follow a grid topology, but our algorithm supports free-form topologies as long as the resulting graph remains connected. Each cell is typically composed of three to four anchors as we target 2D positioning. Even though three anchors are sufficient, four anchors per cell make the system more robust to temporary obstacles. The ranging measurements are forwarded to one sink in the network that acts as a localization engine and is responsible for making the positioning calculations. The routing of measurements is carried out along a fixed spanning tree rooted at the sink. To ensure forwarding along the paths to the sink, anchors may act as relays. The specifics of how the routing tree is established are beyond the scope of this paper, but it would typically be computed a priori as part of the network setup. We also envision a multiple sinks version of our architecture where a separate backbone network is used between the sinks. In such cases, the above routing tree is computed once for each sink.
Each cell is responsible for performing ranging measurements for local tags. To allow anchors in a cell to be aware of which tags are present, tags need to register with the cell (through one of its anchors). The number of tags within a cell can change with time as the tags are allowed to move freely. We want to avoid changing the schedule of UWB-TSCH communications each time a tag registers with a cell or leaves it. For this reason, our approach consists of provisioning each cell with a predefined number of ranging timeslots to accommodate the expected number of tags the cell would need to support. We denote such provisioned nodes by reserved tags. The estimation of the number of reserved tags of each cell would be performed prior to the network deployment and could be updated during its lifetime, for example once per day or per hour. The timescale for re-scheduling is an open research question that we address in our evaluation. At shorter timescales, the actual number of tags present in a cell might differ from the number of reserved tags. Ranging the tags associated to a cell is performed on a round-robin basis. When a cell contains more tags than reserved tags, the ranging rate decreases. Correspondingly, when fewer tags are present, ranging can be performed more frequently than initially planned. Our approach thus trades-off signalling and scheduling load for accurate localization rate.
A possible way to manage dynamic registration of tags to a cell is to rely on a contention access period (CAP) at the start of the slotframe. A CAP is a set of timeslots that are shared by all the nodes, in contrast to the remaining slotframe timeslots which are each dedicated to specific communications. The mode of access in the CAP timeslots is ALOHA. The number of CAP timeslots is a system parameter that needs to be estimated based on the expected number of tag registrations per cell and per unit of time. During all the CAP timeslots, the anchors and tags need to be either listening or sending messages.
After a tag has joined the TSCH network and selected its parent anchor [44,46], it registers to a cell by sending a Registration request message to that anchor during the CAP. The parent anchor assigns the registering tag to an unused reserved tag. Doing so, ranging timeslots are now assigned to the registering tag. The parent anchor then replies with a Registration confirmed message that informs the tag of its allocated timeslots and of the addresses of the anchors involved in each ranging exchange. This message is sent in broadcast during the CAP. Therefore, the nearby anchors also learn of the timeslots when they need to perform ranging measurements for that tag, as well as the address of the tag. In each of its assigned ranging timeslots, the tag turns its radio on but remains passive, waiting for the anchors to start the ranging and will only pursue the process if it recognizes its address in the first ranging message. The benefit of this approach is that if a tag moves to another cell, and has not yet updated its registration, it will not interfere with timeslots used in other cells.
The anchors maintain registrations as a soft-state, that is, registration will expire after some pre-defined period. If a tag wants to remain in a cell, it needs to re-send its Registration request before the registration time expires. More advanced schemes could be envisioned for the un-/registration process, such as sending explicit un-registration messages or spying on nearby exchanges to learn quickly that a tag has registered to a nearby cell. The use of the estimated tag position could also be used to perform cell handover proactively. We do not consider such schemes in this paper as our focus is on scheduling.
Figure 4 illustrates the above dynamic registration process in a cell that contains three anchors, provisioned with a 2-timeslots CAP and a single reserved tag. The anchors are named a1, a2 and a3 and the parent anchor is a1. Since there are three anchors and a single reserved tag, three ranging (TWR) timeslots were scheduled in that cell. When tag t1 wants to join that cell, it sends a Registration request message to a1 during the CAP. As a result, it is assigned by a1 with the single, unused, reserved tag and its associated ranging timeslots. t1 is informed of the assignment through the Registration confirmation message sent by a1 during the CAP of the next slotframe. In the same slotframe, all the anchors initiate ranging exchanges destined to t1 in their respective timeslots. This process repeats in the subsequent slotframes until a second tag, t2, also registers to the same cell. Since there is only one reserved tag in this cell, it must now be shared among the actual tags. Tags t1 and t2 will be ranged alternatively once every two slotframes.
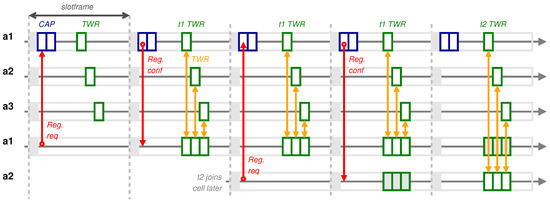
Figure 4.
Dynamic registration to a cell provisioned with a 2-timeslots CAP and a single reserved tag, without the need for re-scheduling UWB-TSCH communications.
4.1. Twr Timeslot for UWB-TSCH
To allow performing TWR exchanges in UWB-TSCH, we define a new dedicated timeslot structure. We rely on the asymmetric double-sided two-way ranging (ADS-TWR) protocol [19] presented in Section 2.1. This protocol uses four consecutive messages to perform a single ranging measurement. All four messages must be exchanged within a single timeslot, contrary to regular data timeslots which carry one data frame and optionally an acknowledgement frame. To design a timeslot, one must take into account the transmission times of every message to exchange, as well as some parameters, such as the guard times and turnaround delays. As the size of all the four asymmetric double-sided two-way ranging (ADS-TWR) messages is known in advance and fixed, the design of the timeslot mainly depends on the nominal bitrate. Recall that longer-distance communications can be achieved using the lowest bitrate (110 kbps) combined with a longer preamble. However the resulting timeslot duration is higher, which causes the effective network ranging capacity to decrease. Table 2 shows the parameters and timeslot duration used in our experiments.

Table 2.
TWR timeslot parameters.
Figure 5 shows a detailed view of the Asymetric Double-Sided Two-Way Ranging (ADS-TWR) timeslots of our prototype that rely on the Decawave DW1000 [11]. To better illustrate their different durations when using different nominal bitrates, the timeslots drawings are in the same proportion. For each bitrate, two timelines are shown, one for the two nodes, A and B, involved in the ranging exchange, A being the initiator. The start and end of the timeslot are denoted by the two extreme vertical bars. Every UWB frame starts with a preamble (SHR) used for detection by the receiver. The transition from preamble to content can be precisely timestamped. It can be noted that, to be able to receive the first frame, node B places its radio in reception state a bit earlier than expected to account for small differences in temporal synchronization with node A.
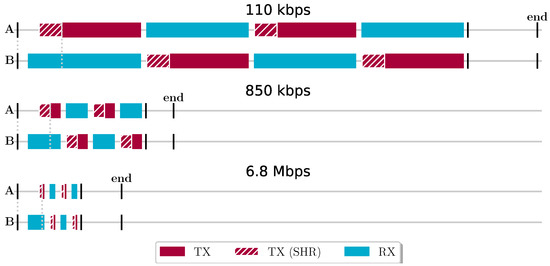
Figure 5.
Structure of an ADS-TWR timeslot for 3 different nominal bitrates supported by the Decawave DW1000 transceiver. Node A is the initiator of the TWR exchange, typically an anchor, and B is the responder, typically a tag.
4.2. Collecting Measurements
In our prototype application, we use UDP messages to carry the ranging measurements to the network sink. The UDP payload is composed of four fields: the tag and anchor addresses, the TSCH Time Slot Number (TSN) and the ranging value, as depicted in Figure 6. The tag and anchor addresses are IEEE 802.15.4 short addresses, each represented as 16-bit integers. The TSN is represented as a 16-bit positive integer. It can be used in case a tag is assigned to multiple reserved tags in the same cell, as discussed in Section 6.5. The ranging value is expressed in Decawave time units (15.65 picoseconds [50]) represented as a 16-bit 2’s complement signed number. The representable ranging values are thus between and , which correspond to s ( m).

Figure 6.
Structure of a ranging frame.
The length of IEEE 802.15.4 MAC protocol data unit (MPDU) is limited to 127 bytes [51]. The above message structure requires 13 bytes for the various headers (frame, 6LoWPAN, IP, UDP), 2 bytes for the trailer (frame check sequence, FCS) and 8 bytes per ranging measurement.
Support for the UWB-TSCH ranging slotframe, as discussed in Section 4.1, and for collecting the measurements with UDP, as discussed in this section, is completely implemented in a prototype publicly available on GitHub [55]. The scheduling algorithm discussed in Section 5 organizes the ranging exchanges and their transmission to the sink across the whole network.
5. Scheduling Algorithm
Our localized scheduling algorithm (LSA) is based on the traffic-aware scheduling algorithm (TASA) [18], a centralized, greedy algorithm that builds a slotframe by adding timeslots that satisfy concurrent communications until all the forecast traffic load is scheduled. The basic intuition is that we start with a routing graph to transport measurements to the sink which will then perform trilaterations. We also have an interference graph (e.g., from a site survey or propagation model) which is used in the scheduling algorithm to avoid potentially conflicting transmissions. Table 3 enumerates all the symbols and provides short descriptions used in the rest of the section.

Table 3.
Summary of mathematical notations.
5.1. Network Model and Definitions
Anchors, tags and cells. The positioning system is composed of two disjoint sets of nodes: is the set of anchors and the set of reserved tags. is the set of all nodes in the system. Anchors and tags are organized into cells. The set of cells is . An anchor can be part of multiple adjacent cells while a reserved tag is assigned to a unique cell. For each node , we note the set of cells to which u belongs. For any anchor , while for any reserved tag, . Each cell is provisioned with a number of reserved tags, hence a maximum number of localizations per slotframe is possible within that cell.
Routing graph. Every ranging measurement must be sent towards the root of the network, noted . For this purpose, every anchor has a path towards . Together, these paths form a spanning tree. We model this as a directed acyclic graph , where is the set of directed edges. For every anchor other than the root, there is a path , where , and , leading to the root. In this path, anchor is the parent / next-hop of a.
In addition to this, every reserved tag is assigned to the anchors in its cell. Let be a reserved tag. Then, for each anchor a in the cell , there is an edge . We will refer to these anchors as the parents of t and use the notation .
Example. Figure 7 shows an example positioning system composed of three cells, five anchors and four reserved tags. Each reserved tag performs ranging exchanges with its three assigned anchors. Some anchors communicate with reserved tags belonging to different cells (e.g., a3 is involved in the ranging of all the reserved tags). In addition to this, concurrent communications are possible in this system. For example, the following ranging exchanges can happen at the same time on different channels , and .
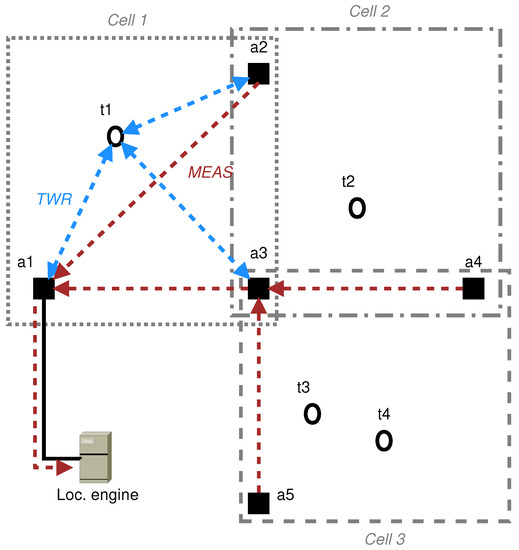
Figure 7.
Multi-cell positioning system.
Figure 8 shows the graph modeling the routing in the system depicted in Figure 7. Black edges represent links from anchors to their parent nodes and are used for forwarding ranging measurements to the sink. Blue edges represent links between reserved tags and anchors in their respective cells. These edges are used for ranging exchanges.
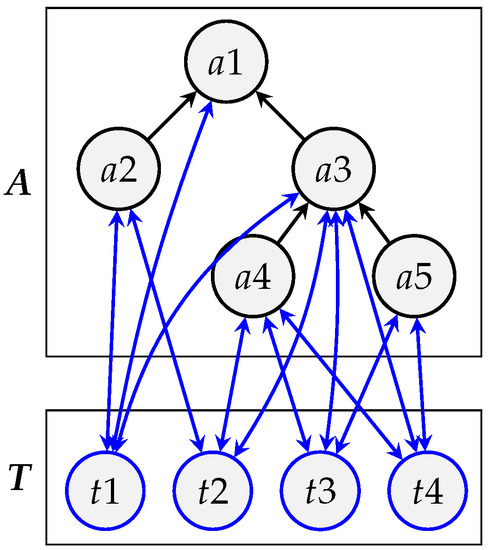
Figure 8.
Routing graph .
- Set of anchors
- Set of reserved tags
- Set of cells
- Root/sink
- Organization into cells: , , etc.
Interference graph. We model radio interference in our system with an undirected interference graph where is the set of edges indicating interference between a pair of nodes: belongs to if and only if u and v are within the radio range of each other. might, for example, be inferred through a site survey that consists of measuring the bi-directional packet delivery ratio (PDR) between each pair of nodes. If the packet delivery ratio (PDR) is higher than some threshold, the two nodes are considered in range of each other. It could also be based on the distance between nodes, assuming some interference radius.
Contrary to the anchors, no site-survey can be used for reserved tags as their location is not known in advance. It seems reasonable though to assume that a reserved tag has connectivity with every anchor in its assigned cell, that is
Although a reserved tag is assigned to a cell, the actual reserved tag might be located in a nearby cell, therefore interfering with communications farther away from its cell. However, we have no precise definition of the cell shapes or their geographical extent. To account for this, we augment so that reserved tags also have connectivity (and thus interfere) with nodes that are connected to their anchors. The augmented interference graph is defined such that
where is the interference between every reserved tag and the set of anchors one hop away from the parent anchors of that reserved tag, thus the set of anchors two hops away from that reserved tag, defined as:
and is (correspondingly to ) the interference between every reserved tag and the set of reserved tags one hop away from the parent anchors of that reserved tag, thus the set of reserved tags two hops away from that reserved tag, defined as:
and is the interference between every tag and the set of reserved tags one further hop away from the two-hop anchors (), defined as:
Example (Augmented interference graph for areserved tag). Figure 9 shows a network of two anchors with three reserved tags. It shows the interference between the anchors and the tags using a red dashed line. The union of three sets, noted as in green, in red, and in blue, extend the to form the augmented interference edge set .
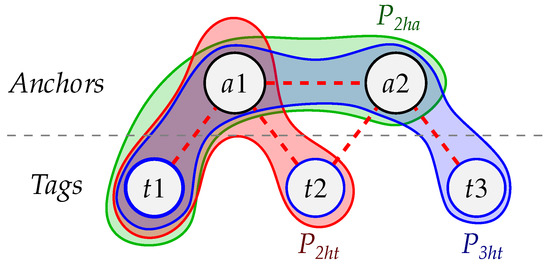
Figure 9.
Augmented interference graph for reserved tag t1.
More specifically, Figure 9 shows the interference of the t1 reserved tag. This device interferes with the anchor a1 (see red dashed lines). The rest of the interferences between anchors and reserved tags are:
- t2 with
- t3 with
- a1 with
- a2 with
The set is created by taking all the parent anchors of t1, i.e., just a1, and for each such anchor adding all the other anchors it interferes with, here just a2. Similarly, the set is created by taking all the parent anchors of t1, i.e., just a1, and for each such anchor adding all the reserved tags it interferes with, here just t2. Finally, the set is created by taking all the anchors of previously defined, i.e., here a1 and a2, and for each such anchor adding all the reserved tags it interferes with, here t2 and t3 (Note that in Figure 9 is shown without the tags that already belong to to highlight the difference).
5.2. Network Load
To schedule the necessary communications, our algorithm keeps track of the number of communications required by a node during the slotframe. Recall that two types of communications need to be scheduled: ranging exchanges and measurement forwarding. At the beginning of a slotframe, only reserved tags have pending ranging exchanges to be performed with their anchors. At the end of the slotframe, every ranging measurement must have reached the sink. Between these two points in time, the remaining traffic load of a node will vary.
To model this, the algorithm keeps track of the number of messages in the queue of every node u at every timeslot k of the slotframe. We note the number of messages with next-hop v queued at node u at the beginning of timeslot k. We distinguish the content of the queue based on the next-hop v since reserved tags perform communications with multiple anchors. Equations (3) and (4) express more formally how evolves.
- Initial queue depth: At the beginning of the slotframe (timeslot ), only reserved tags have pending TWR exchanges to perform while anchors have no traffic load. The number of times a reserved tagu performs a TWR with an anchor v depends on the cell to which it belongs. is the number of times per slotframe reserved tags must be ranged in cell c. For every edge , the number of messages with next-hop v queued at node u at timeslot k is:
- Evolution of queue depth: When a communication occurs in timeslot k, we update the queue depth so as to reflect the state at the beginning of the next timeslot (). There are four different cases to consider, as summarized in Figure 10. The queue depth decreases if (case 1) u is a reserved tag which performs a ranging exchange with anchor v or if (case 2) u is an anchor that forwards a measurement to its parent v. The queue depth increases if (case 3) u is an anchor involved in initiating a ranging exchange or if (case 4) u has received a measurement from a child. For every edge and for ,
 Figure 10. Evolution of queue depth from to during timeslot k. The communication that occurs during timeslot k is shown with a very thick edge. Blue nodes are reserved tags and blue edges are ranging exchanges.
For convenience reasons, we also define as the total number of messages in the queue of node u, as expressed in Equation (5).
Moreover, since there is no edge in going out of , we cannot apply the definition of to get the network load of despite it being very useful to know how many measurements have arrived at their final destination. We fix that by considering that a dummy edge exists in .
Example (Evolution of queue depth). In the below example, the network shown on Figure 11 is composed of four anchors (a1 to a4) and a single tag (t1). The anchors form a spanning tree of which a1 is the root. Tag t1 has two anchors a2 and a3. The initial traffic load is as follows: a4 has one message to transmit while t1 needs to perform ranging with a2 and a3.
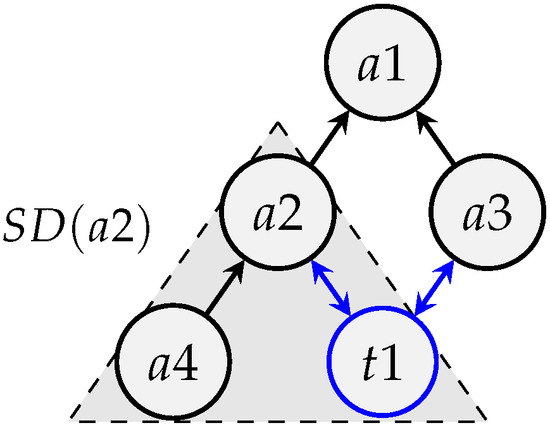
Figure 11.
Routing graph .
Table 4 shows a possible scheduling of the communications in this network. The resulting slotframe is shown at the top of the table. The initial load of nodes is given by the first column. Anchor has one message to transmit while reserved tag must perform a ranging exchange with and . All the other nodes have no initial load. The tables below show the communications that occur at every timeslot k of the slotframe as well as the evolution of for every edge of the network. Increases are shown in red while decreases are shown in green.

Table 4.
A possible slotframe for the example network of Figure 11. Updated value are in red and final value in green.
To generate a schedule, our algorithm proceeds first with the nodes which have the highest remaining load. The load of a node depends on its current queue depth but also on the traffic it will need to carry in the rest of the slotframe. To this end, we define in Equation (6) the total load of node u as the sum of the queue depths of the edges in its sub-DAG .
5.3. Concurrent Communications
One objective of our scheduling algorithm is to minimize the slotframe length, hence maximize the tag positioning rate. To reach that objective, the algorithm is allowed, under certain conditions, to exploit frequency, code and spatial diversity for the purpose of scheduling multiple communications within the same timeslot. Indeed, as discussed in Section 2.2, the IEEE 802.15.4 UWB PHY allows concurrent communications on different frequency channels. Moreover, concurrent communications using orthogonal preamble codes can also be performed on the same channel [20,52]. Finally, concurrent communications on the same channel, and using the same preamble code, can be scheduled at the same time if the involved nodes are sufficiently far away from each other so as to not interfere. This section explores which constraints must be satisfied by a set of pairs of nodes to be eligible to communicate in the same timeslot.
(Rule 1) Transceiver constraint. A transceiver cannot receive or transmit more than one message within the same timeslot. Hence, it is, for example, impossible for two nodes u, v to transmit data to the same parent d within the same timeslot (see Figure 12a). It is also not possible for a node u to receive a message from a child node v and send a message to its parent node d during the same timeslot (see Figure 12b). To model this, we rely on a matching of graph , that is, a set of edges from that do not share a common vertex. Any pair of edges taken from a matching of will satisfy the above transceiver constraint. Satisfying this constraint is a necessary and sufficient condition for frequency multiplexing, but only a necessary condition for spatial multiplexing.
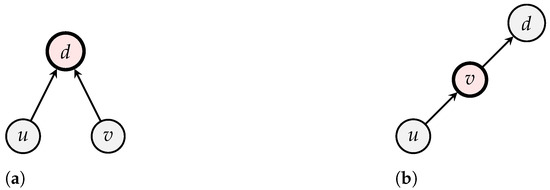
Figure 12.
One transceiver cannot be involved in multiple communications within the same timeslot. (a) Simultaneous transmission to the same parent. (b) Simultaneous reception and transmission.
(Rule 2) Interference constraint. Communications within timeslots are bidirectional. In the case of a ranging timeslot using TWR, the tag and anchor exchange four messages (see Section 2.1). In the case of a measurement timeslot, a data frame carrying the measurement is transmitted from one anchor to its next-hop and the latter replies with an acknowledgment frame. As a consequence, in a timeslot where a communication between a pair of nodes happens, one must consider that u and v will both be sending at some point, hence interfere with any receiver in their range. Moreover, u and v will also be receiving at some point, hence any other node with u or v in its range can interfere with the communication of .
From this observation, we can deduce the following rule: let and be two pairs of communications to be scheduled. They can happen at the same time using the same channel and code if, and only if, there is no edge in between two nodes taken from the two different communication pairs, that is the edges , , and do not exist in . This rule is illustrated in Figure 13.
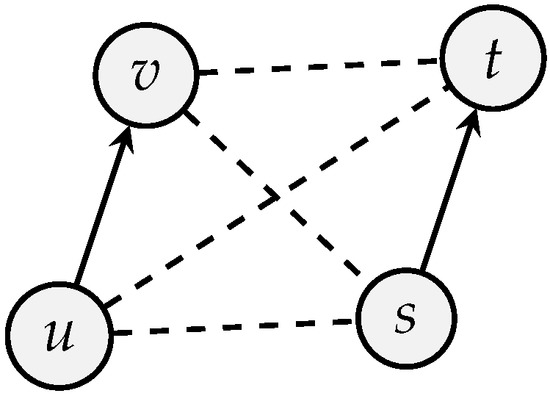
Figure 13.
Two communication and cannot be scheduled on the same channel/code if there is any edge in between a pair of vertices each taken from a different communication (dashed lines).
5.4. Algorithm
This Section details the operation of the localization scheduling algorithm (LSA). Its pseudo-code is shown in Algorithm 1 and its inputs are the routing graph , the interference graph , the number of available channels and for every cell c, the number of reserved tags. Note that is the total number of independent channels, that is, including the same channels with different preamble codes.
The algorithm starts with an empty slotframe. Every iteration k allocates a new timeslot and schedules at least one communication within that slot. Multiple communications can be scheduled within a timeslot if they meet the constraints of Section 5.3. The most loaded edges/nodes are selected first. To this end, the algorithm tracks the load of edges/nodes (q) and the total load of nodes (Q). The initial load is computed (line 2) according to Equations (3), (5) and (6). The load is updated at each iteration (line 12) based on the scheduled communications and Equation (4). The algorithm finishes when every measurement has reached the root of the network, that is when .
| Algorithm 1 Localization Scheduling Algorithm |
|
At each iteration, the algorithm performs a Matching of graph (call to Matching, line 6), using a recursive depth-first search (DFS) heuristic, starting with the root node (). This results in a set of edges without common vertices. Since a matching is not necessarily unique, the search is directed to select the most loaded edges and nodes first. When considering node v, the algorithm will first traverse to a child according to Equation (7), that is, among the children of v, node is the one that has the highest total load . The algorithm relies on the node identifiers to break ties. When an edge is traversed, it is considered as a candidate edge for the matching. The algorithm adds to if it has at least one communication pending () and it does not conflict with edges already in , that is neither or v are involved in edges already in .
The algorithm then selects in the edges corresponding to communications that can be scheduled within the same timeslot, on the same channel/code. This is done in two steps. First, an undirected graph is built (call to BuildConflictGraph, line 7) where an edge exists between two nodes u and v if they are involved in communications from that interfere with each other, according to (Rule 2) of Section 5.3. More formally, where is the set of nodes involved in edges from and is such that at least one of , , and is in .
Second, the algorithm colors nodes from such that two nodes u and v have different colors if there is an edge in (call to Coloring, line 8). The coloring heuristic, shown in Algorithm 2, iteratively builds a list of colors. Each color is a set of nodes involved in transmissions that can be scheduled in the same timeslot. The algorithm maintains two lists: contains the nodes that conflict with the current color and the nodes that do not conflict with it. is initialized with the nodes in ordered in decreasing order of Q while is initially empty. The algorithm then proceeds as follows. At each iteration, a node is taken from the head of one of the two lists and added to the coloring . If can be taken from , it is added in the current color (line 12). Otherwise, a new color is added with alone (line 7). To proceed to the next iteration, new sets and are determined so as to have only nodes that do not conflict with in and all the other remaining nodes in . The attentive reader will notice the following invariant: has no node in conflict with nodes in the last position of . The coloring algorithm stops when there are no nodes remaining or when the number of required colors is larger than the number of available channels.
Once the coloring is computed, it is just a matter of mapping the nodes it contains to their corresponding communications in the matching , building a timeslot with different channels corresponding to different colors, and adding this timeslot to the slotframe.
| Algorithm 2 Coloring of conflict graph with up to colors, directed by traffic load Q |
|
Example (matching heuristic details). Figure 14 and Figure 15 provide, respectively, the routing and interference graphs of a positioning system. We assume for the sake of this example that a4 and t3 are sufficiently far away from aa3 and t2 so as to not interfere with them. Table 5 summarizes the initial traffic load.
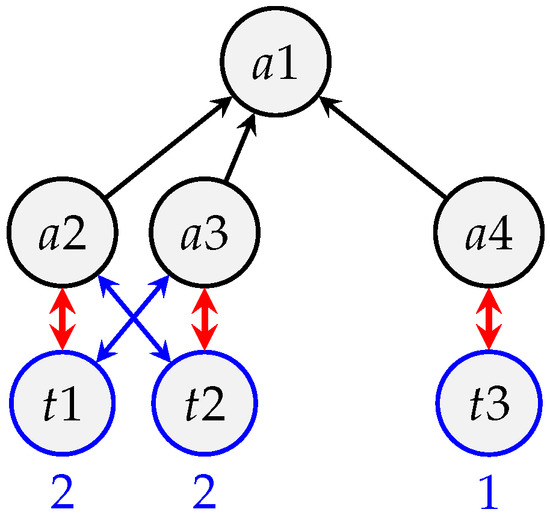
Figure 14.
Routing graph .
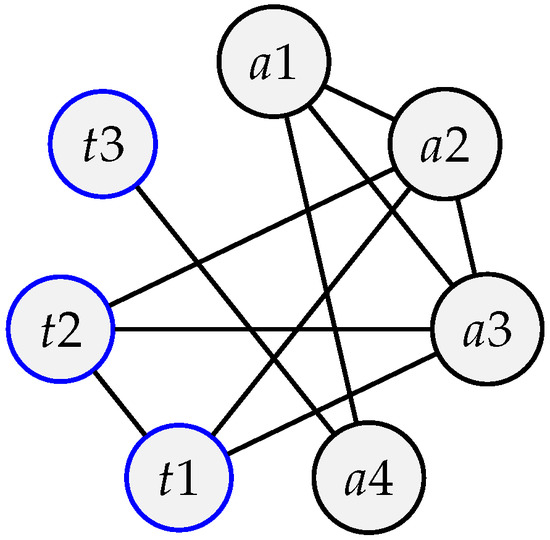
Figure 15.
Interference graph .

Table 5.
Global and local traffic loads.
Table 6 details the matching heuristic during the first iteration of Localization Scheduling Algorithm (LSA). The depth-first search (DFS) starts at the root node and picks the child with the highest sub-DAG load. Note that as a2 and a3 have the same load, the ties are broken on the lowest identifier. Edge is considered for addition to the matching but cannot as its load . The depth-first search (DFS) continues deeper with and adds to the matching . It then processes and considers but cannot add it to the matching as it conflicts (Rule 1 in Section 5.3) with an edge already in . The algorithm continues this way until it produces the following set of edges . This set of edges can then be scheduled with only two channels by the coloring heuristic.

Table 6.
Steps of the matching heuristic applied to the routing graph in Figure 16.
Example (coloring heuristic details). This example shows a complete execution of the coloring heuristic applied on a positioning system for which the conflict graph is provided in Figure 16. We assume the vertices in have been sorted according to Q, resulting in the following initial sequence .
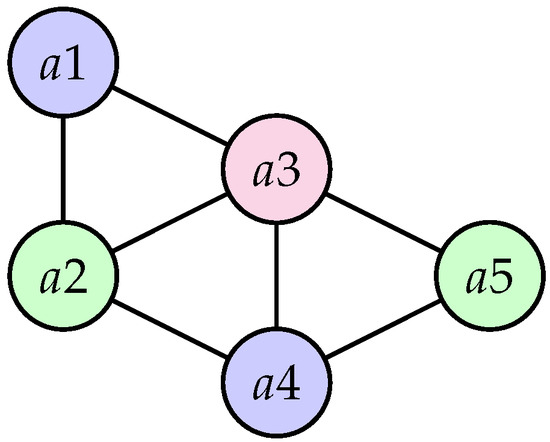
Figure 16.
Conflict graph .
Table 7 provides the details of the coloring heuristic execution. We assume the number of channels is unlimited. During the first iteration, the first node is . Since it is taken from the set of conflicting nodes, a new color is allocated. The remaining nodes are then split into those that conflict with a1 () and those that do not (). At the second iteration, since there are non-conflicting nodes, the algorithm picks and adds it to the last color. It then recomputes the lists of nodes that conflict or not with , that is and , respectively.

Table 7.
Steps of the coloring heuristic applied on the conflict graph shown in Figure 16.
6. Evaluation
In this section we detail our simulation-based experimentation and evaluation of the localization scheduling algorithm (Section 5.4). Our main objective is to maximize the localization rate. Therefore, we first evaluate how it varies with the network size and number of tags. Since the localization rate is directly related to the slotframe length, we use it as a metric. Second, we would like to know how good the algorithm is in terms of frequency/code and spatial multiplexing. To this end, we gradually increase the scheduling complexity by first constraining the scheduler to a single channel – equivalent to pure time division multiple access (TDMA), then allowing a growing number of channels and finally also enabling spatial multiplexing with various degrees of interference.
6.1. Simulator Description
To assess the quality of schedules produced by LSA, we implemented it as a Python application (source code publicly available on GitHub [56]), hereafter named simulator. It takes the system topology and parameters as input. The routing and interference graphs ( and ), the number of channels , the organization of anchors in cells, the list of reserved tags and their association to the set of anchors performing the localizations, as well as the number of localizations of each reserved tag, are all provided as configuration files.
To facilitate the configuration, the routing graph and the interference graph can be computed based on the positions of anchors. The unit disk graph (UDG) model (see Figure 17) is used to determine which anchors can communicate and/or interfere with each other. In this model, a node communicates (resp. interferes) with every other node located in a circle of radius (resp. ), with . The former radius is named communication range and the latter, interference range. The routing graph can be computed using a shortest path routing algorithm over the pairs of nodes able to communicate according to the Unit Disk Graph (UDG) model. The Euclidean distance is used as link cost.
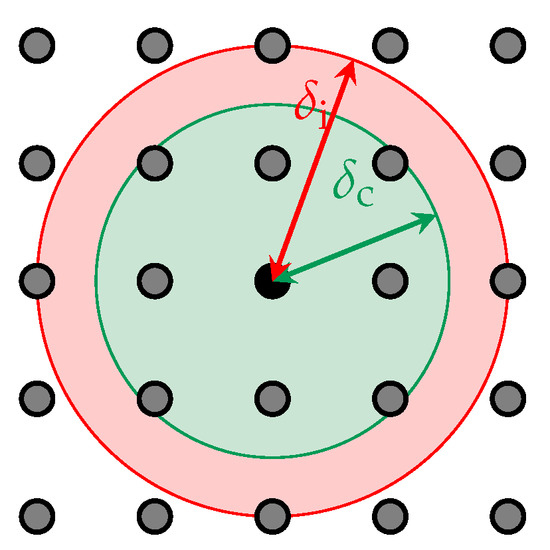
Figure 17.
The UDG model used in the simulator. The green circle of radius models the communication range, while the red circle of radius models the interference range.
To simplify experiments, the simulator also supports the automatic schedule creation for square grid topologies, where the sole parameters are the number of reserved tags, the number of localizations per cell and the communication range of the nodes. We configure each reserved tag to be localized by three anchors in the cell to which it belongs.
6.2. Simulation Setup
For the experiments presented in this paper, we rely on square grid topologies composed of up to 400 cells. Since our objective is to evaluate the scalability of LSA, we devised a strategy for growing square grids of controllable sizes. To this end, we gradually increase the number of cells participating in the network (and thus the number of anchors). To do this, a circle centred at the sink is progressively expanded. Cells that have their center inside the circle are included in the topology. Each case results in a circular topology with more cells and anchors than the previous one. This process is illustrated in Figure 18. We limit our experiments to a subset of the sizes generated by this process: 0, 4, 12, 16, 32, 52, 60, 80, 88, 112, 124, 156, 172, 208, 216, 256, 276, 316, 360, 368, 376, 388, 396 and 400 cells.

Figure 18.
Illustration of the grid topology generation process. In this example, the following radii are used: 0, 0.71, 1.59, 2.13 and 2.55.
Increasing the size of the network by adding cells to the grid border results in a non-linear increase of data transmission in the network to carry data to the sink due to multi-hop communications. Figure 19 shows the number of Ranging messages (TWR) and Data messages (Data) as a function of the number of cells, in two use cases. The first, with the sink in the centre of the network, and the second with the sink in a corner. When the sink is in a corner, there are more data transmissions in the network because, on average, cells are farther away from the sink. Figure 20 confirms this hypothesis, as it shows that the path length is doubled when the sink is in a corner in comparison to when it is in the centre of the network. As our objective is to maximize the positioning rate, we place the sink in the centre of the network.
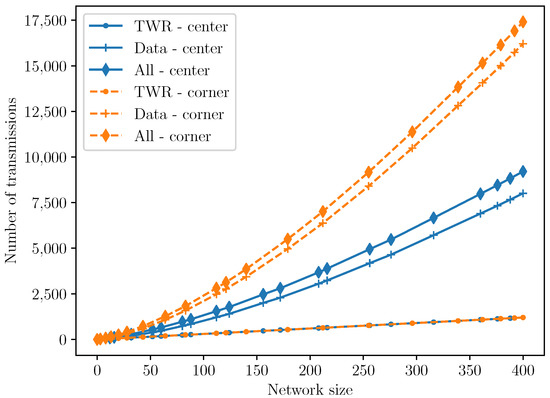
Figure 19.
Number of transmissions as a function of the network size. The differences in network sizes between the two sink placements can be attributed to the expansion process explained in Section 6.2.
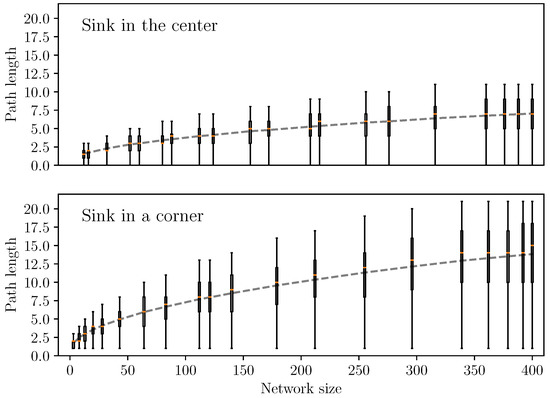
Figure 20.
Path length to the sink for each node according to the network size. The dashed curve shows the mean path length.
In addition, we will consider multiple interference ranges. Assuming the horizontal and vertical distances between two anchors are unity, the communicating range is fixed at , just larger than , the diagonal of a cell. The default interference range is , but we will perform simulations using the following set of interference ranges: .
6.3. Slotframe Length and Positioning Rate
In this first set of experiments, we focus on the slotframe length and the per-tag positioning rate. We consider a network where the sink is placed at the center and we vary the number of active cells from 0 to 400 as explained in the Setup Section 6.2. We assign a single reserved tag per cell, localized once per slotframe. For each network size, we consider different scenarios, as summarized in Table 8. “Global Time Division Multiple Access (TDMA)” refers to a schedule with a single channel and no concurrent communications. “n channel(s)” refer to schedules with n channels and spatial multiplexing enabled. All experiments with spatial multiplexing use the default interference range, equal to 2. Note that with Global TDMA, the slotframe length corresponds to the total number of transmissions as no frequency and spatial multiplexing are possible. For each scenario and network size, we run the simulator and plot in Figure 21 the resulting slotframe lengths.

Table 8.
Summary of slotframe length experimental scenarios.
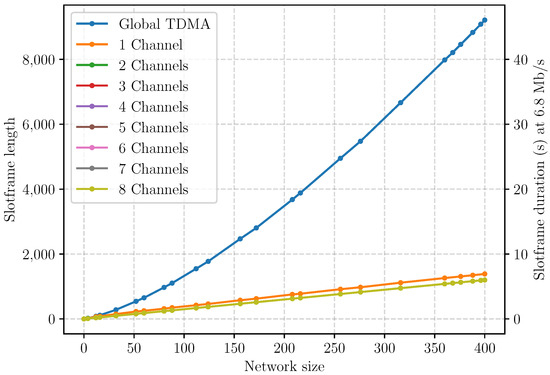
Figure 21.
Slotframe length as a function of the network size and the number of allowed channels.
We first observe a dramatic reduction of slotframe length when frequency or spatial multiplexing are enabled. With a network size of 400 cells, the slotframe length drops from 9210 with Global TDMA to 1386 with 1 channel, so, just by enabling spatial multiplexing with the same single channel, a 7-fold reduction is achieved. From two to eight channels the resulting curves overlap. Moreover, the decrease in slotframe length when enabling multiple channels is not as dramatic as when enabling spatial multiplexing. This is due to the sink being the destination of every ranging measurement. Since it can, at most, be involved in one communication within a timeslot, it acts as a bottleneck. In the case of a 400 cells network, with one reserved tag being localized by three anchors once per slotframe, the total number of ranging measurements that the sink must absorb is 1200. Hence, this is a lower bound for the slotframe size.
The low marginal gain of using more than two channels can be surprising. To better understand that result, we show in Figure 22 the total number of transmissions and number of transmissions per channel as a function of the slotframe timeslot number. We do this for all the n Channel(s) scenario. As expected, we observe that the slotframe length is about 1386 with a single channel but it reaches 1200 in all the other cases. We can also observe that LSA is able to make use of more channels when n is larger, but only at the beginning of the slotframe.
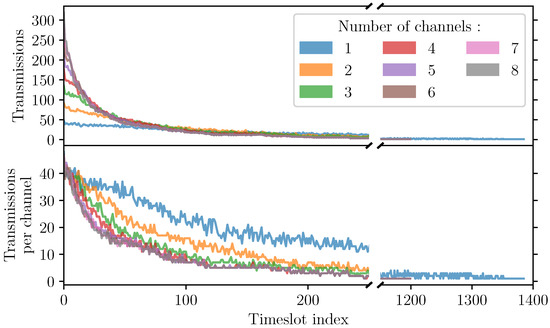
Figure 22.
Number of transmissions per timeslot and maximum number of transmissions per channel and timeslot. Note the split x-axis and different x-axis scales.
Figure 23 shows the achievable positioning rates. It presents the same results as in Figure 21, assuming that the UWB PHY layer is configured with the 6.8 Mbps nominal bitrate, which leads to a timeslot duration of 5 ms (see Section 4.1). For a network size of 400 cells using the Global TDMA setup, the slotframe of length 9210 translates to a duration of 46 s and a positioning rate of ≈0.02 Hz. With one Channel, the slotframe duration becomes 6.98 s (≈0.14 Hz). With two Channels there is one position update every 6 s (≈0.17 Hz).
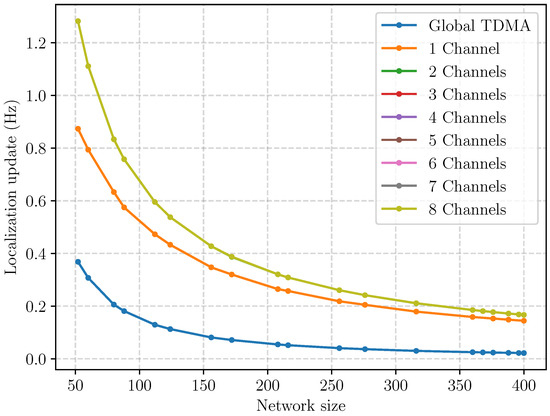
Figure 23.
Frequency of position update according to the number of channels at 6.8 Mb/s.
6.4. Impact of Interference Range
This section considers how the interference range affects the ability of LSA to schedule concurrent communications. The interference range influences the number of nodes that must remain inactive in a timeslot when another node is active. In the previous experiment, we used a default interference radius of two. Longer interference ranges translate to higher number of conflicting nodes, hence lower spatial multiplexing opportunities, resulting in possibly longer slotframes. To study the impact of the interference range, we have run the LSA on networks of 208, 400 and 625 cells, using 8 channels and with an interference range varying between 2 and 30 units. Figure 24 shows the resulting slotframe length and the average number of channels used for each timeslot during the slotframe.
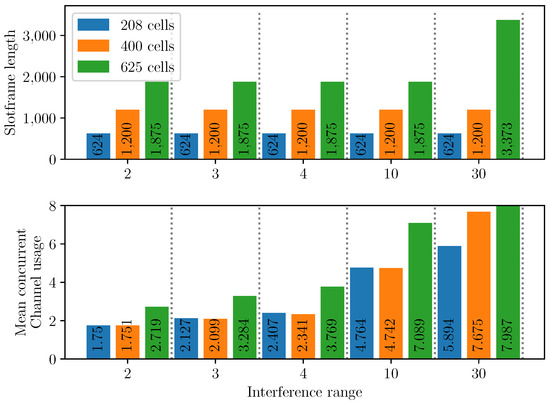
Figure 24.
Slotframe length and mean concurrent channel usages according to the interference range and the size of the network. tsch is configured with 8 channels.
We observe that increasing the interference range does not negatively affect the slotframe length for most of the parameter sets. The only exception is with the largest network size (625 cells) and longest interference range (30 units). In that case, the schedule length jumps from 1875 to 3373 timeslots. This can be explained by the fact that, as the opportunities to schedule concurrent communications on the same channel decrease when the interference range increases, the LSA relies more heavily on frequency multiplexing, hence more channels are used per timeslot. This can be observed in Figure 24 when looking at the mean concurrent channel usage. We show that, as the network size and interference range increase, this metric also increases. In the case of the 625 cells network and an interference range of 30, this value is maximal at 7.987 almost at the maximum of 8 channels.
To further validate this explanation, we take a closer look at the resulting slotframe structure. We do this only for the case of 400 cells. Figure 25 shows, for each timeslot in the slotframe, from bottom to top, the number of channels used, the maximum number of communications performed per channel and the total number of concurrent communications. We again observe that the majority of the concurrent communications are made at the start of the slotframe. This is expected, as the LSA uses a greedy approach to schedule the most concurrent communications as soon as possible. Increasing the interference range reduces opportunities for spatial multiplexing, and increases the demand for different channels. Looking at the number of channels used, we observe that starting with interference ranges of 10 and 30, all the channels are used, up to, respectively, timeslots 636 and 1132. With an even larger network size (625 cells), the LSA must fall back to extending the slotframe length, as we observed in Figure 24.
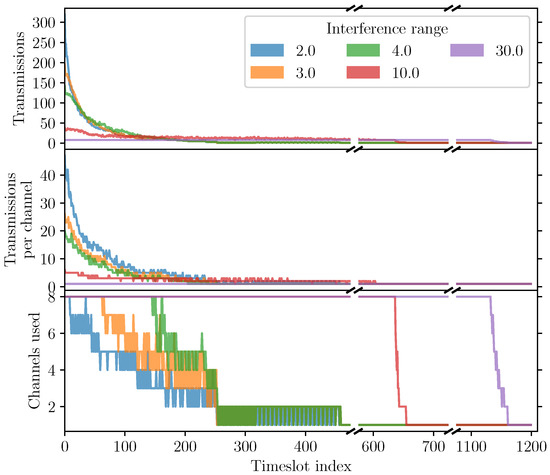
Figure 25.
Distribution of concurrent communications over the slotframe for different interference ranges. UWB-TSCH is configured with 8 channels. Note the split x-axis.
6.5. Non-Uniform Distribution of Reserved Tags
In the previous experiments, all tags were uniformly distributed over the cells. This section looks at what impact a non-uniform distribution might have. For this purpose, we consider a network of 400 cells organized as a grid with one reserved tag per cell. We assign 400 tags randomly. To assign a cell to a tag, we rely on a pair of uniform random variables to generate a position in the grid. We do this random assignment 10 times. Moreover, to obtain a basis for comparison, we also compute a schedule for a setup with exactly one tag per cell. In all the 11 cases (10 random + 1 uniform), the outcome is an identical slotframe of 1200 timeslots, that is, exactly the number of measurements that the sink needs to receive. Note that the slotframe is identical as the reserved tags are assigned uniformly while the tags are assigned randomly.
The impact of the random assignment is not on the slotframe length but on the positioning rate achieved by each tag. Assuming a nominal bitrate of 6.8 Mbps and its associated timeslot duration of 5 ms, every reserved tag is positioned once every 6 s. The positioning rate for one tag depends on how many other tags are in its cell. If ntags land in a cell with a single reserved tag, the positioning rate they will achieve is that of the reserved tag. In our scenario, if three tags land in the same cell, their positioning rate will be once every 18 s instead of once every 6 s. The resulting positioning rate thus depends on how the tags are distributed over the grid. We show that distribution in Figure 26. The distribution shows the fraction of tags that land in a cell with a total of ntags. The blue bar corresponds to the uniform assignment of tags, where every tag is alone in its cell, resulting in a positioning rate of Hz. The bars with other colors correspond to the random assignments. We can readily observe that most tags achieve a positioning rate that is inferior to the baseline. The mean positioning rate achieved with the random assignments is 0.107 Hz, or one positioning every 9.36 s.
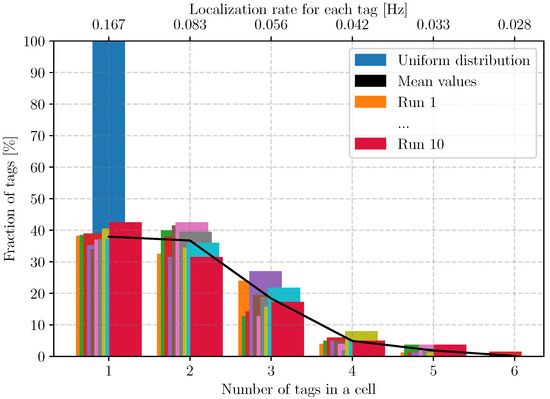
Figure 26.
Distribution of in cells and at the same time distribution of the achieved positioning rate.
In the above scenario, there was a single reserved tag pre-allocated in each cell. We also considered the case where more than one reserved tag is allocated per cell. Though we do not include the results in this paper, we observed that in such cases, the number of tags present in a cell can be inferior to the number of reserved tags, leading to a possible increase in positioning rate for the concerned tags. However, in such cases, there was little benefit for the positioning of these tags, as the timeslots where the ranging exchanges occur are very close to each other, a side effect of the LSA strategy which handles the ranging exchanges first. Modifications to the LSA would be required to better spread the multiple ranging exchanges of a tag over the slotframe.
We envision that in such a situation, where the planned occupation of cells differs from the observed occupation, the calculation of an updated scheduling is in order. Such re-scheduling could occur, for example, every day or every hour, depending on the system requirements. We show later, in Section 8, that the scheduling computation time remains reasonable (a few tens of seconds) even with the largest network size considered and in the most difficult configuration, meaning that this approach is not unrealistic. To further assess the gain of such re-scheduling, we ran the LSA using the observed assignment of tags as input; that is, each cell is pre-allocated with a number of reserved tags that corresponds to the observed number of tags in that cell. We do this for the 10 random allocations considered in the beginning of this section. The resulting slotframes are all of the same size (1200) and provide the expected maximum positioning rate of once every 6 s.
6.6. Local Queue of Nodes
In order to check if our resulting schedules were usable on low-cost embedded systems with very little memory space, we looked at the maximum number of messages stored in nodes during the execution of the schedule. When using a network with 400 cells, that is 1200 measurement messages to forward to the sink, we measured a peak of up to 130 messages in the queues of anchors close to the sink. This can be explained by the centrality of these nodes; they are each on the path of a large fraction of the measurements.
7. Scheduling Improvements
The first batch of experiments shown in Section 6 has led to some interesting observations. The most notable one is that the sink can very quickly become a bottleneck in the network when its load increases. We noticed that with a single sink, the slotframe length has a lower bound equal to the number of messages the sink must receive. In addition to this, we observed that anchors close to the sink also need to accumulate a large number of messages in their queues before getting the opportunity to forward them to the sink.
This section considers three possible improvements and how to take them into account in an adapted version of the LSA. First, we evaluate how using multiple sinks would help reduce the slotframe length. The expected outcome is Data messages will be directed towards different sinks, leading to reduced congestion close to each sink. Second, since data message are small, they could be aggregated by intermediate nodes during their journey to the sink, resulting in a reduced amount of required transmissions. Finally, we propose to bound the queue depth to avoid memory overflow on constrained devices.
7.1. Support for Multiple Sinks
In this section, we consider the use of multiple anchors as sinks to mitigate the congestion due to deploying a single sink and to increase the positioning rate. Using multiple sinks and choosing which anchors must be a sink is a complex task, as shown in the multiple strategies deployed to maximize wireless sensor network (WSN) lifetime [53,54]. In our case, the best option to maximize the positioning frequency is to minimize the maximum global queue () of each sink u. To achieve that objective, we choose the sinks so as to spread the network load in the most uniform way possible.
Adaptations to LSA are required to support multiple sinks. First, the set of anchors that act as sinks must be defined and the routing graph needs to be adapted to contain multiple trees rooted at each of the sinks in . For each anchor , we denote by the sub-graph of with s as root. Second, the stopping condition of Algorithm 1 (line 5) must be changed: the algorithm stops when no sink has remaining messages to receive. This can be achieved by delegating the stopping condition to a function such as Algorithm 3. Finally, we modify the matching procedure (called in line 6 of Algorithm 1) by Algorithm 4 so as to perform a depth-first search (DFS) starting at each sink, sorted by descending order of global queue depth. Note that this is equivalent to performing a single Depth-First Search (DFS), starting from a node that would be the parent of all sinks.
| Algorithm 3 Stopping condition of LSA |
|
| Algorithm 4 Matching function dedicated to sinks in LSA |
|
To evaluate the use of multiple sinks, we rely on the same grid topologies as described in Section 6.2 and only consider the largest one of 400 cells. We vary the number of sinks from one to all anchors, that is 441 anchors. Using a single anchor as a sink is a baseline for comparison, while using all anchors as sinks corresponds to a network using a separate backbone network interconnecting all the sinks, as proposed in [15]. The anchors acting as sinks have been chosen manually so as to spread the global queue () of each sink as uniformly as possible. Note that a perfect partition was not always possible since it is a discrete optimization problem. As a consequence, there is sometimes a small imbalance in the load of different sinks, but the loads remain within the same order of magnitude.
Figure 27 shows the length of the slotframe obtained by LSA for the different configurations. As expected, using more than one sink decreases the slotframe length. Using two sinks already almost divides the slotframe length by two and almost doubles the positioning rate. We can generalize this result: the length of the slotframe is reduced by a factor that is almost equal to the number of sinks. For example, passing from one to four sinks reduces the slotframe length by a factor 3.52. Finally, the extreme case of using all anchors as sink leads to the best performance with a slotframe length of five and a duration of s, translating to an update rate of 40 Hz for 400 tags. Obviously, this last case renders LSA useless. Our interest in doing such a comparison is in exploring the trade-off between pure-wireless and backbone-based positioning systems.
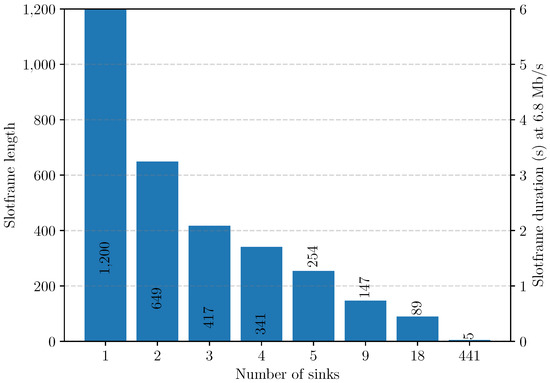
Figure 27.
Slotframe length as a function of the number of sinks. Scenarios with a 400 cells network, using 8 channels.
7.2. Message Aggregation
This section considers the aggregation of measurements when they go up the routing tree. Message aggregation has the potential to drastically reduce the length of the generated slotframe by decreasing the number of required transmissions. Recall from Section 4.2 that in our prototype application, we use UDP messages to carry those measurements. We repeat the message format in Figure 28 for convenience. The length of IEEE 802.15.4 MAC protocol data unit (MPDU) is limited to 127 bytes [51] and the UDP message structure requires 13 bytes for the various headers (frame, 6LoWPAN, IP, UDP) and 2 bytes for the trailer (frame check sequence, FCS). This leaves 112 usable bytes to transmit ranging measurements. Using this approach, the maximum number of ranging measurements that can be aggregated within a single message is then 14. Let us denote by the maximum number of measurements that can be aggregated in a single message.

Figure 28.
Structure of a ranging frame showing space left for aggregation of multiple measurements.
We now turn to adapt the LSA to aggregate measurements. The main idea is to restrict LSA from drawing from a node transmission queue () when it contains less than measurements. Obviously, this can only be done when the global traffic queue of that node is at least , otherwise the algorithm would never handle the transmission of such a node. Moreover, ranging exchanges cannot be aggregated. To implement this strategy, we modify the matching heuristic. In the previous version, when the DFS needed to get down to a child, it was directed first towards the one with the largest global queue depth () then, when an edge was traversed, it was considered for the matching if it was not conflicting with an edge already in the matching, and if its local queue was non-empty. We change that behavior as described below. Note that the queue sizes are always expressed in number of measurements, not in number of messages, as a single message may now carry multiple measurements.
To evaluate the aggregation strategy performance, we compare the slotframes produced by LSA without aggregation, and with various values of , up to 14. Our experiment is conducted in our usual grid topology with up to 400 cells. Figure 29 presents the resulting slotframe lengths for each scenario, as a function of the network size. The figure also translates the slotframe length to a slotframe duration, assuming the nominal bitrate of 6.8 Mbps, i.e., with a 5 ms timeslot duration.
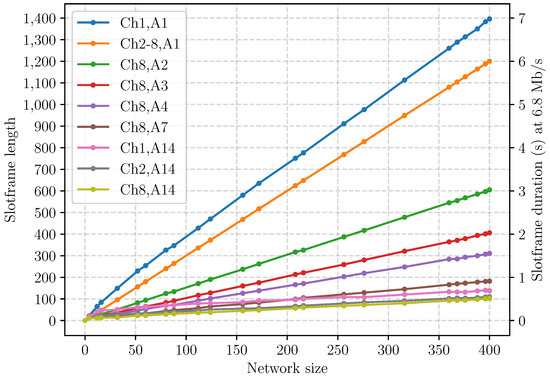
Figure 29.
Slotframe length as a function of network size (in cells) in different aggregation scenarios. Each scenario is named Chm,An with m the number of channels and n the amount of aggregation.
Each curve corresponds to a different scenario. Each one is named as Chm,An where m is the number of channels and n corresponds to . The baseline curves, entitled Ch1,A1 and Ch2-8,A1, report the behavior without aggregation () with, respectively, a single channel and more than one channel. Recall from Figure 22 that, in the latter case, a number of channels produce a slotframe of maximum length (1200). When we enable aggregation (), we allow the maximum of 8 channels to be used. We observe that using an aggregation of 2, 3 or 4 almost reduces the slotframe length by a factor , causing the positioning interval to go down from 6.0 s to 3.025 s, 2.03 s and 1.56 s, respectively, for the largest network. The marginal gain of more aggressive aggregation levels is lower. With the highest value, , and in the largest network, the slotframe duration is reduced to 101 timeslots (0.51 s), a factor of compared to without aggregation. A reduction factor of 14 is not reached, mainly because the ranging exchanges cannot be aggregated. The number of transmissions was reduced from 9210 to 2016.
7.3. Bounded Queue Depth
In Section 6, we mentioned that, under some scenarios, during the forwarding of measurements to the sink, the queue depth of some nodes can grow up to large numbers of messages. To account for the limited memory resources of constrained devices, we propose to bound the depth of these queues. Let us define as the maximum number of measurements that a node can contain, that is , . The value of this limit depends on the device resources and the requirements of the application and the real-time operating system (RTOS) in terms of memory.
In our experiments, we bound the queue depth to two full aggregated messages, that is to a value of measurements, for a total of 224 bytes. For this purpose, we again modify the matching algorithm of the LSA. We prevent an edge from being selected if allowing the corresponding communication could cause . As we know that a maximum of measurements can be popped from the queue of u, we consider this edge only if .
To evaluate this modification, we ran LSA on the 400 cells network. We vary the amount of aggregation, , and consider different numbers of sinks. Figure 30 shows the maximum queue depth observed on all the nodes (excluding sinks) during the complete execution of a slotframe. Figure 30a corresponds to and Figure 29b to . Without a bound, the peak queue depth reaches 130 measurements (1040 bytes). One can observe that there is a clear relation between network size and peak queue depth. These peaks occur at one hop from the sink and their magnitude depends on the size of the sub-DAG of the corresponding anchors. One can also notice that this relation between network size and peak queue depth holds for all scenarios, except for A14,SAll where every anchor is a sink. With the bounded queue depth, the peak queue depth remains equal to or under the limit. We also noticed that enabling the bounded queue depth keeps the resulting slotframe length equal to the original one to within one timeslot. The transmissions are reordered inside the slotframe without the need for additional timeslots.
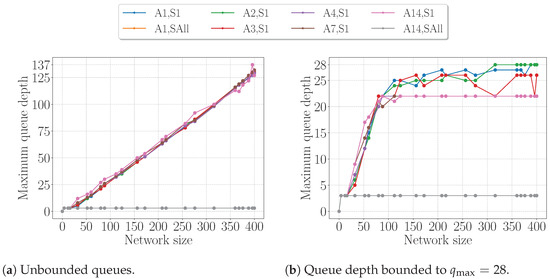
Figure 30.
Maximum queue depth observed during slotframe execution. UWB-TSCH is configured with 8 channels. Each scenario is named Am,Sn where m is the aggregation level, nagg, and m the number of sinks.
7.4. Combined Multi-Sink and Aggregation
To conclude this evaluation, this section considers all the scheduling improvements considered in the previous section, all at once. To this end, we rely on the usual grid-topologies with 400 cells, allow up to eight channels for frequency multiplexing, deploy different number of sinks, and either disable aggregation () or enable maximum aggregation (). Frequency re-use is made possible through spatial multiplexing, with an interference range configured to . We rely on the same sink placements as presented in Section 7.1.
Figure 31 shows how the resulting slotframe length varies according to the number of sinks and for the two aggregation levels. With a single sink placed at the center of the network and with no aggregation enabled, the resulting slotframe is 1200 timeslots long (6 s at a 6.8 Mbps bitrate). Enabling maximum aggregation reduces the slotframe length by a factor of almost 12, resulting in 101 timeslots and a positioning rate of 2 Hz. The reduction in slotframe length with an increase in the number of sinks is visible, but is much less marked when the aggregation is enabled as there is already less room for improvement. We can conclude that, even in a pure wireless deployment (single sink), the aggregation enables reaching very short slotframe lengths, hence high positioning rates. The performance achieved with maximal aggregation and a single sink (101 timeslots) is comparable to that of no aggregation and 18 sinks (98 timeslots). In this case, the system is already able to position 400 tags approximately 10 times a second.
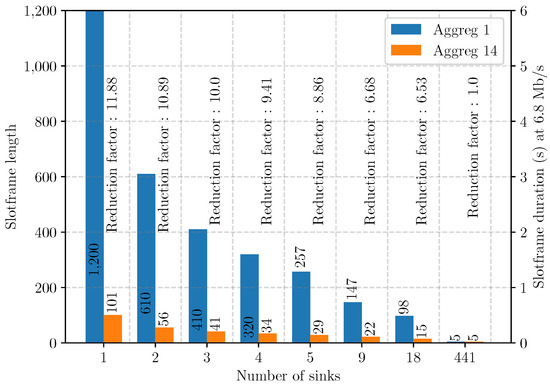
Figure 31.
Slotframe length as a function of the number of sinks with either no aggregation (nagg = 1) or maximal aggregation level (nagg = 14). The network contains 400 cells and the schedule can make use of up to 8 channels.
One can also observe that there is no benefit from aggregation when every anchor is a sink, since all messages go directly to a sink. The slotframe length in that case contains only five timeslots. Since there are 441 sinks for 1200 ranging measurements (3 ranging for 400 tags), the average number of communications required per sink should be less than three. The reason the slotframe length is five is that LSA is unable to schedule all these communications in only three timeslots due to some interference conflicts.
8. Schedule Computation Time
The localization scheduling algorithm is designed to operate on large networks. In this section, we measure its computation time in different scenarios to understand by what parameters it is affected the most. Moreover, we envision that it might be run periodically to take into account network changes or different distributions of the tags over the cells, as we discussed in Section 6.5. In such a scenario, the time required to compute a new schedule might become an important limitation.
To conduct our measurements, we again relied on our largest setup with cells. Assuming the anchors are spaced by 5 m, this network is able to cover an area of 10,000 squared meters (more than a football field). LSA is implemented in Python and we relied on version 3.5.3 of the run-time. The computation time was measured on a Dell XPS 15 2017, CPU Intel core I7-770HQ, 16 Gb RAM, Debian 9.13 with the graphics mode disabled (isolated mode). For every considered scenario, we ran LSA five times.
Figure 32 shows the relation between the network size and the mean computation time for several scenarios. Each scenario is noted Am,Sn where m is the aggregation level and n the number of sinks. The latter is either one sink (S1) or all sinks (SAll). Of all the experiments, the scheduling with one sink and no aggregation (A1,S1) takes the longest time, slightly more than 10 s. This was expected, as it requires the highest number of transmissions and leads to the longest slotframe. Recall that the number of iterations of the outer loop of LSA is directly related to the slotframe length as each iteration adds one timeslot.
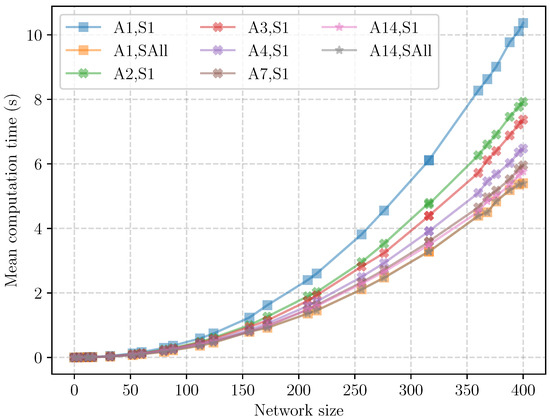
Figure 32.
Mean schedule computation time for different network sizes and scenarios using up to 8 channels, aggregation, and either a single sink or all anchors as sink.
Figure 33 focuses on how the number of sinks and the aggregation level affect the computation time. In these figures, the computation times are only reported for the largest network size. With only one sink and no aggregation, LSA takes 10.37 s to schedule the 1200 ranging exchanges and 8010 measurement forwarding to the sink. The shortest computation times occur either with the largest number of sinks, or with maximal aggregation. The reasons differ however. With every anchor being a sink, only ranging exchanges are scheduled, with no forwarding of measurements. Recall that the slotframe length in that case was only five timeslots! A surprising result is that although the slotframe is drastically reduced by a factor of 240, the computation time is only reduced by half. Recall that, in that scenario, only 1200 ranging exchanges are performed, no forwarding is required. However, the algorithm must spend time scheduling these ranging exchanges while taking into account the conflicting edges. With aggregation the amount of measurement forwarding is reduced from 8010 to 816, leading to only 5.77 s computation time.
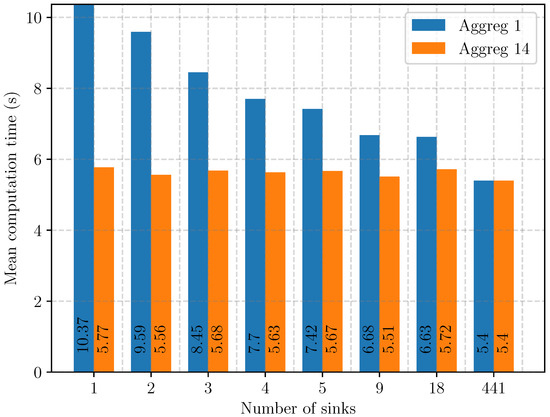
Figure 33.
Mean schedule computation time for scenarios with up to 8 channels, multiple sinks and no of maximum aggregation in a 400 cells network.
9. Conclusions
Indoor localization systems are receiving a great deal of attention currently due to the significant progress in radio technologies making the required equipment smaller, more precise/accurate, increasingly power efficient and available at decreasing costs. Ultra wideband is one of the most promising such radio technologies. Its standardization as a PHY layer in the IEEE 802.15.4a standard for low-power and low-rate wireless networks, an IoT technology, has spawned much research work. Many studies have focused on evaluating its transmission characteristics, using ingenious methods to perform ranging and positioning in small cells of a few anchors, or on the combination of such approaches with filters, machine learning and artificial intelligence, to make them even more precise even in harsh environments. However, very little effort has been invested in exploring the networking aspects involved in building large-scale, high-density UWB-based positioning systems. In our paper, we propose such an architecture.
Our proposal relies on a combination of time-division multiplexing to better share the medium access, and on frequency multiplexing, taking advantage of different channels and orthogonal codes for setting up concurrent communications. To be of practical use, this approach requires an a priori scheduling of communications. This paper has focused on such a scheduling algorithm. Moreover, we decouple mobility and communication scheduling by means of a static a priori reservation of communication slots that can then be dynamically assigned to tags as they register to cells. To this end, we started with TASA, a well-known centralized scheduling algorithm designed for application traffic in wireless sensor networks. We adapted it to accommodate the differences with our system requirements, such as the different network topologies, including tag-to-anchor and anchor-to-anchor communication links, the resulting graph being a directed acyclic graph (DAG) rather than a tree. We also modified the scheduling algorithm, so as to maximize the positioning rate by, for example, enabling in-network message aggregation. To make it more practical still in very constrained embedded systems, we also placed a configurable bound on the required maximum queue depth of every node that is guaranteed by the scheduling algorithm. With minimal modification our scheduler can also support IoT applications by carrying sensor information through the network, in addition to ranging measurements.
We developed an ad-hoc simulator to perform an in-depth evaluation of the scheduling algorithm under different system parameters, and in varying radio environments. Our simulator can either be provided with all the input parameters (e.g., network topology, interference graph, organization in cells, and so on), or it can be used to calculate the routing tree and interferences on its own. The simulator allows us examine the generated schedules in detail, such as, for example, what channels are used in a specific timeslot. We conducted several simulation experiments where we varied the system size up to several hundreds of cells, corresponding to deployments that would span areas in the tens of thousands of squared meters range. In such scenarios, we showed that the resulting slotframe is able to support thousands of ranging exchanges and their forwarding to the sink ten times a second. Although our initial goal was to target pure wireless deployments, we investigated hybrid approaches with an increasing number of sinks connected by separate backbone networks.
Some of the more notable achievements of this research include fully scheduling a 400-cell/400-tag network in less than 11 s in the worst case, with average scheduling times close to 5 s, rendering this a very scalable and practical implementation. Furthermore, regarding the quality of the resulting schedules, we are able to create compact schedules which are up to 11 times shorter than otherwise with the use of aggregation, providing competitive compactness to more resource-demanding dedicated backbone-based IPS systems. Finally, we are able to achieve all these results while also bounding queue sizes on anchors to support realistic use-cases on devices with limited packet queue sizes.
Our research opens the door to multiple research directions. First, we showed that when the planned assignment of tags to cells differs from the real one, the achieved positioning rate can be affected. One possible approach to solve that issue is to allow the scheduling to be recalculated based on the observed tag-to-cell registrations. From a computational perspective, this approach is realistic as we showed that, even with the largest network considered, the scheduling computation would not take much more than a few tens of milliseconds. However, how to distribute a new schedule to the network remains an open problem today. Another track for further research is in the multiple-sink approach where the selection of which anchor to select as sink was carried out using a trial and error approach in our experiments. This selection could be fine-tuned to best balance the communication load and maximize the positioning rate. In this paper, we did not look into how to formalize this as an optimization problem. Finally, the dynamic registration of tags to cells, proposed as context for this research, has not been formally turned into a real protocol, nor evaluated through simulation or a prototype. Using state-of-the-art support for mobility in TSCH networks, such as Instant [46], would be a possible approach to perform this registration. Directly related to this, understanding how fast the registration of a tag to a cell can be performed would be very useful to know and what applications such architectures could support.
We have a partial real-world implementation of the system described in this paper. The UWB-TSCH access scheme [17] is completely supported in the Contiki Real-Time Operating System (RTOS). The extension with a TWR timeslot presented in Section 4.1 is fully functional. The scheduling algorithm described and evaluated in this paper produces working schedules that can easily be installed in the nodes of the network. To this end, we have Python scripts that can automatically generate from the schedules the necessary C source-code to be included in the Contiki firmware. Our system is, thus, already fully working in a static configuration, that is, when the system already knows in what cell each tag is registered. The source-code for our real-world implementation is publicly available on Github so that anyone can reproduce our results. As mentioned in the previous paragraph, to make our system fully workable in a dynamic environment, we are currently working on implementing a dynamic tag-to-cell registration system, as envisioned in Section 4, and seeking to design a protocol to allow the schedule to be updated, e.g., when the distribution of the tags over the cells has changed significantly, as discussed in Section 6.5.
Author Contributions
Conceptualization, M.C. and B.Q.; methodology, M.C., B.Q. and R.-A.K.; software, M.C.; validation, M.C., B.Q. and R.-A.K.; formal analysis, M.C., B.Q. and R.-A.K.; investigation, M.C. and B.Q.; resources, B.Q.; writing—original draft preparation, M.C., B.Q.; writing—review and editing, M.C., B.Q. and R.-A.K.; visualization, M.C., B.Q. and R.-A.K.; supervision, B.Q.; funding acquisition, B.Q. All authors have read and agreed to the published version of the manuscript.
Funding
This research was supported by an FRIA grant from the Belgian F.R.S.-FNRS.
Institutional Review Board Statement
Not applicable.
Informed Consent Statement
Not applicable.
Data Availability Statement
Code of our simulator and network configuration used to evaluate this algorithm can be found on GitHub at https://github.com/maxcharlier/2021-python-LSA (access oned 28 December 2021).
Acknowledgments
We thank Virgile Brouillard and Thomas Lavend’homme for their involvement in early discussions on this topic.
Conflicts of Interest
The authors declare no conflict of interest.
References
- Figueiredo e Silva, P.; Kaseva, V.; Lohan, E.S. Wireless Positioning in IoT: A Look at Current and Future Trends. Sensors 2018, 18, 2470. [Google Scholar] [CrossRef] [Green Version]
- Mekki, K.; Bajic, E.; Meyer, F. Indoor Positioning System for IoT Device based on BLE Technology and MQTT Protocol. In Proceedings of the 2019 IEEE 5th World Forum on Internet of Things (WF-IoT), Limerick, Ireland, 15–18 April 2019; pp. 787–792. [Google Scholar] [CrossRef]
- Teizer, J.; Weber, J.; König, J.; Ochner, B.; König, M. Real-time Positioning via LoRa for Construction Site Logistics. In Proceedings of the 35th International Symposium on Automation and Robotics in Construction (ISARC); Teizer, J., Ed.; International Association for Automation and Robotics in Construction (IAARC): Taipei, Taiwan, 2018; pp. 1–8. [Google Scholar] [CrossRef]
- Zafari, F.; Papapanagiotou, I.; Christidis, K. Microlocation for Internet-of-Things-Equipped Smart Buildings. IEEE Internet Things J. 2016, 3, 96–112. [Google Scholar] [CrossRef] [Green Version]
- Liao, Y.; Liu, S. Research on Key Technologies of Smart Logistics Dynamic Positioning Based on NB-IOT. J. Phys. Conf. Ser. 2020, 1634, 012086. [Google Scholar] [CrossRef]
- Akkaya, K.; Guvenc, I.; Aygun, R.; Pala, N.; Kadri, A. IoT-based Occupancy Monitoring Techniques for Energy-Efficient Smart Buildings. In Proceedings of the 2015 IEEE Wireless Communications and Networking Conference Workshops (WCNCW), New Orleans, LA, USA, 9–12 March 2015. [Google Scholar] [CrossRef]
- Floris, A.; Porcu, S.; Girau, R.; Atzori, L. An IoT-Based Smart Building Solution for Indoor Environment Management and Occupants Prediction. Energies 2021, 14, 2959. [Google Scholar] [CrossRef]
- Xiao, J.; Zhou, Z.; Yi, Y.; Ni, L.M. A Survey on Wireless Indoor Localization from the Device Perspective. ACM Comput. Surv. 2016, 49, 1–31. [Google Scholar] [CrossRef]
- Zafari, F.; Gkelias, A.; Leung, K.K. A Survey of Indoor Localization Systems and Technologies. IEEE Commun. Surv. Tutor. 2019, 21, 2568–2599. [Google Scholar] [CrossRef] [Green Version]
- IEEE Std 802. 15.4a-2007 (Amendment to IEEE Std 802.15.4-2006); IEEE Standard for Information Technology—Telecommunications and Information Exchange Between Systems—Local and Metropolitan Area Networks—Specific Requirement Part 15.4: Wireless Medium Access Control (MAC) and Physical Layer (PHY) Specifications for Low-Rate Wireless Personal Area Networks (WPANs): Amendment 1: Add Alternate PHYs. IEEE: Piscataway, NY, USA, 2007; pp. 1–203. [CrossRef]
- DecaWave Ltd. DW1000 IEEE802.15.4-2011 UWB Transceiver Datasheet v2.11; DecaWave Ltd.: Dublin, Ireland, 2016. [Google Scholar]
- Sedlacek, P.; Masek, P.; Slanina, M. An Overview of the IEEE 802. In 15.4z Standard and its Comparison to the Existing UWB Standards. In Proceedings of the 29th International Conference Radioelektronika, Pardubice, Czech Republic, 16–18 April 2019. [Google Scholar] [CrossRef]
- Van den Bossche, A.; Dalcé, R.; Gonzalez, N.; Val, T. LocURa: A New Localisation and UWB-Based Ranging Testbed for the Internet of Things. In Proceedings of the International Conference on Indoor Positioning and Indoor Navigation (IPIN), Nantes, France, 24–27 September 2018; pp. 1–6. [Google Scholar] [CrossRef] [Green Version]
- Macoir, N.; Ridolfi, M.; Rossey, J.; Moerman, I.; De Poorter, E. MAC protocol for supporting multiple roaming users in multi-cell UWB localization networks. In Proceedings of the WoWMoM2018, the 19th IEEE International Symposium on a World of Wireless, Mobile and Multimedia Networks, Chania, Greece, 12–15 June 2018; pp. 1–7. [Google Scholar]
- Ridolfi, M.; de Velde, S.V.; Steendam, H.; Poorter, E.D. WiFi ad-hoc mesh network and MAC protocol solution for UWB indoor localization systems. In Proceedings of the Symposium on Communications and Vehicular Technologies, SCVT 2016, Mons, Belgium, 22 November 2016; pp. 1–6. [Google Scholar] [CrossRef] [Green Version]
- Li, Z.; Li, X.; Mou, G.; Jiang, D.; Bao, X.; Wang, Y. Design of Localization System Based on Ultra-Wideband and Long Range Wireless. In Proceedings of the 2019 IEEE 11th International Conference on Advanced Infocomm Technology (ICAIT), Jinan, China, 18–20 October 2019; pp. 142–146. [Google Scholar] [CrossRef]
- Charlier, M.; Quoitin, B.; Hauweele, D. Challenges in using Time Slotted Channel Hopping with Ultra Wideband communications. In Proceedings of the International Conference on Internet of Things Design and Implementation, Dublin, Ireland, 23–24 June 2011; pp. 82–93. [Google Scholar]
- Palattella, M.R.; Accettura, N.; Dohler, M.; Grieco, L.A.; Boggia, G. Traffic Aware Scheduling Algorithm for reliable low-power multi-hop IEEE 802.15. 4e networks. In Proceedings of the 2012 IEEE 23rd International Symposium on Personal, Indoor and Mobile Radio Communications-(PIMRC), Sydney, Australia, 9–12 September 2012; pp. 327–332. [Google Scholar]
- Jiang, Y.; Leung, V.C. An asymmetric double sided two-way ranging for crystal offset. In Proceedings of the 2007 International Symposium on Signals, Systems and Electronics, Montreal, QC, Canada, 30 July–2 August 2007; pp. 525–528. [Google Scholar]
- Vecchia, D.; Corbalán, P.; Istomin, T.; Picco, G.P. Playing with Fire: Exploring Concurrent Transmissions in Ultra-wideband Radios. In Proceedings of the 16th Annual IEEE International Conference on Sensing Communication, and Networking (SECON), Boston, MA, USA, 10–13 June 2019; pp. 1–9. [Google Scholar] [CrossRef]
- Tan, H.X.; Patro, R.K.; Chan, M.C.; Kong, P.Y.; Tham, C.K. Performance of Slotted-Aloha over TH-UWB. In Proceedings of the International Conference on Ultra-Wideband, Sydney, Australia, 27–30 August 2007. [Google Scholar]
- Oppermann, I.; Stoica, L.; Rabbachin, A.; Shely, Z.; Haapola, J. UWB Wireless Sensor Networks: UWEN—A Practical Example. IEEE Commun. Mag. 2004, 42, S27–S32. [Google Scholar] [CrossRef]
- Chehri, A.; Fortier, P.; Tardif, P.M. UWB-based sensor networks for localization in mining environments. Hoc Netw. 2009, 7, 987–1000. [Google Scholar] [CrossRef]
- Ye, T.; Walsh, M.; Haigh, P.; O’Flynn, B.; Barton, J. Experimental impulse radio IEEE 802.15. 4a UWB based wireless sensor localization technology: Characterization, reliability and ranging. In Proceedings of the 22nd IET Irish Signals and Systems Conference (ISSC), Dublin, Ireland, 23–24 June 2011. [Google Scholar]
- Schmidt, J.F.; Neuhold, D.; Klaue, J.; Schupke, D.; Bettstetter, C. Experimental Study of UWB Connectivity in Industrial Environments. In Proceedings of the 24th European Wireless Conference, Catania, Italy, 2–4 May 2018; pp. 1–4. [Google Scholar]
- Alarifi, A.; Al-Salman, A.; Alsaleh, M.; Alnafessah, A.; Al-Hadhrami, S.; Al-Ammar, M.A.; Al-Khalifa, H.S. Ultra Wideband Indoor Positioning Technologies: Analysis and Recent Advances. Sensors 2016, 16, 707. [Google Scholar] [CrossRef]
- Karaagac, A.; Haxhibeqiri, J.; Ridolfi, M.; Joseph, W.; Moerman, I.; Hoebeke, J. Evaluation of accurate indoor localization systems in industrial environments. In Proceedings of the 22nd IEEE International Conference on Emerging Technologies and Factory Automation (ETFA), Limassol, Cyprus, 12–15 September 2017; pp. 1–8. [Google Scholar] [CrossRef] [Green Version]
- Despaux, F.; van den Bossche, A.; Jaffrès-Runser, K.; Val, T. N-TWR: An accurate time-of-flight-based N-ary ranging protocol for Ultra-Wide band. Hoc Netw. 2018, 79, 1–19. [Google Scholar] [CrossRef] [Green Version]
- Corbalán, P.; Picco, G.P.; Palipana, S. Chorus: UWB Concurrent Transmissions for GPS-like Passive Localization of Countless Targets. In Proceedings of the 18th ACM/IEEE International Conference on Information Processing in Sensor Networks (IPSN), Montreal, QC, Canada, 15–18 April 2019; pp. 133–144. [Google Scholar] [CrossRef]
- Gro<i>β</i>windhager, B.; Stocker, M.; Rath, M.; Boano, C.A.; Römer, K. SnapLoc: An ultra-fast UWB-based indoor localization system for an unlimited number of tags. In Proceedings of the 2019 18th ACM/IEEE International Conference on Information Processing in Sensor Networks (IPSN), Montreal, QC, Canada, 15–18 April 2019; pp. 61–72. [Google Scholar]
- Großwindhager, B.; Rath, M.; Kulmer, J.; Bakr, M.S.; Boano, C.A.; Witrisal, K.; Römer, K. SALMA: UWB-Based Single-Anchor Localization System Using Multipath Assistance. In Proceedings of the 16th ACM Conference on Embedded Networked Sensor Systems; Association for Computing Machinery: New York, NY, USA, 2018; pp. 132–144. [Google Scholar] [CrossRef]
- Kram, S.; Stahlke, M.; Feigl, T.; Seitz, J.; Thielecke, J. UWB Channel Impulse Responses for Positioning in Complex Environments: A Detailed Feature Analysis. Sensors 2019, 19, 5547. [Google Scholar] [CrossRef] [Green Version]
- Retscher, G.; Gikas, V.; Hofer, H. Range validation of UWB and Wi-Fi for integrated indoor positioning. Appl. Geomat. 2019, 187–195. [Google Scholar] [CrossRef] [Green Version]
- Pala, S.; Jayan, S.; Kurup, D.G. An accurate UWB based localization system using modified leading edge detection algorithm. Hoc Netw. 2020, 97, 102017. [Google Scholar] [CrossRef]
- Zhao, M.; Chang, T.; Arun, A.; Ayyalasomayajula, R.; Zhang, C.; Bharadia, D. ULoc: Low-Power, Scalable and Cm-Accurate UWB-Tag Localization and Tracking for Indoor Applications. Proc. ACM Interact. Mob. Wearable Ubiquitous Technol. 2021, 5, 1–31. [Google Scholar] [CrossRef]
- Cossette, C.C.; Shalaby, M.; Saussié, D.; Forbes, J.R.; Le Ny, J. Relative Position Estimation Between Two UWB Devices With IMUs. IEEE Robot. Autom. Lett. 2021, 6, 4313–4320. [Google Scholar] [CrossRef]
- Ridolfi, M.; de Velde, S.V.; Steendam, H.; Poorter, E.D. Analysis of the Scalability of UWB Indoor Localization Solutions for High User Densities. Sensors 2018, 18, 1875. [Google Scholar] [CrossRef] [Green Version]
- Hermeto, R.T.; Gallais, A.; Theoleyre, F. Scheduling for IEEE802. 15.4-TSCH and Slow Channel Hopping MAC in Low Power Industrial Wireless Networks: A Survey. Comput. Commun. 2017, 114, 84–105. [Google Scholar] [CrossRef]
- Urke, A.R.; Kure, Ø.; Øvsthus, K. A Survey of 802.15.4 TSCH Schedulers for a Standardized Industrial Internet of Things. Sensors 2022, 22, 15. [Google Scholar] [CrossRef]
- Ramanathan, S.; Lloyd, E.L. Scheduling Algorithms for Multi-Hop Radio Networks. In Conference Proceedings on Communications Architectures and Protocols; Association for Computing Machinery: New York, NY, USA, 1992; pp. 211–222. [Google Scholar] [CrossRef]
- Accettura, N.; Vogli, E.; Palattella, M.; Grieco, L.; Boggia, G.; Dohler, M. Decentralized Traffic Aware Scheduling in 6TiSCH Networks: Design and Experimental Evaluation. IEEE Internet Things J. 2015, 2, 455–470. [Google Scholar] [CrossRef] [Green Version]
- Duquennoy, S.; Al Nahas, B.; Landsiedel, O.; Watteyne, T. Orchestra: Robust mesh networks through autonomously scheduled TSCH. In Proceedings of the 13th ACM Conference on Embedded Networked Sensor Systems, Seoul, Korea, 1–4 November 2015; pp. 337–350. [Google Scholar]
- Kim, S.; Kim, H.; Kim, C. ALICE: Autonomous Link-based Cell Scheduling for TSCH. In Proceedings of the 2019 18th ACM/IEEE International Conference on Information Processing in Sensor Networks (IPSN), Montreal, QC, Canada, 16–18 April 2019; pp. 121–132. [Google Scholar]
- Chang, T.; Vučinić, M.; Vilajosana, X.; Duquennoy, S.; Dujovne, D.R. 6TiSCH Minimal Scheduling Function (MSF). RFC 9033; Internet Engineering Task Force: Fremont, CA, USA, 2021. [Google Scholar] [CrossRef]
- Haxhibeqiri, J.; Karaağaç, A.; Moerman, I.; Hoebeke, J. Seamless roaming and guaranteed communication using a synchronized single-hop multi-gateway 802.15.4e TSCH network. Hoc Netw. 2019, 86, 1–14. [Google Scholar] [CrossRef] [Green Version]
- Elsts, A.; Pope, J.; Fafoutis, X.; Piechocki, R.; Oikonomou, G. Instant: A TSCH Schedule for Data Collection from Mobile Nodes. In Proceedings of the 2019 International Conference on Embedded Wireless Systems and Networks; EWSN ’19. Junction Publishing: Junction City, CA, USA, 2019; pp. 35–46. [Google Scholar]
- Romdhani, I.; Al-Dubai, A.Y.; Guibene, W. Mobility And Energy Extensions For The IEEE 802. 15.4 Standard. In Proceedings of the 13th International Conference on Advances in Mobile Computing and Multimedia, Brussels, Belgium, 11–13 December 2015; Association for Computing Machinery: New York, NY, USA, 2015; pp. 318–321. [Google Scholar] [CrossRef] [Green Version]
- Orfanidis, C.; Elsts, A.; Pop, P.; Fafoutis, X. TSCH Evaluation under Heterogeneous Mobile Scenarios. IoT 2021, 2, 656–668. [Google Scholar] [CrossRef]
- Orfanidis, C.; Pop, P.; Fafoutis, X. Active Connectivity Fundamentals for TSCH Networks of Mobile Robots. 2022. Available online: http://xxx.lanl.gov/abs/2201.08202 (accessed on 28 December 2021).
- DecaWave Ltd. DW1000 User Manual v2.18. 2016. Available online: https://www.decawave.com/product-documentation/ (accessed on 28 December 2021).
- IEEE Standard for Low-Rate Wireless Networks. IEEE Std 802. 15.4-2015 (Revision of IEEE Std 802.15.4-2011); IEEE: Piscataway, NY, USA, 2016; pp. 1–709. [CrossRef]
- DecaWave Ltd. APH010: DW1000 Inter Channel Interference v0.3; DecaWave Ltd.: Dublin, Ireland, 2017. [Google Scholar]
- Poe, W.Y.; Schmitt, J.B. Minimizing the maximum delay in wireless sensor networks by intelligent sink placement. Distrib. Comput. Syst. Lab Univ. Kaiserslaut. 2007, 67655, 1–20. [Google Scholar]
- Das, D.; Rehena, Z.; Roy, S.; Mukherjee, N. Multiple-sink placement strategies in wireless sensor networks. In Proceedings of the 2013 fifth international conference on communication systems and networks (COMSNETS), Bangalore, India, 7–10 January 2013; pp. 1–7. [Google Scholar]
- Charlier Maximilien. Fork of the GitHub Contiki Repository Supporting Decawave DW1000 UWB Transceiver and TSCH-UWB. 2021. Available online: https://github.com/maxcharlier/contiki-uwb-tsch (accessed on 28 February 2022).
- Charlier Maximilien. GitHub Repository of the Implementation of the LSA Algorithm Presented in This Paper. 2021. Available online: https://github.com/maxcharlier/2021-python-LSA (accessed on 28 February 2022).
Publisher’s Note: MDPI stays neutral with regard to jurisdictional claims in published maps and institutional affiliations. |
© 2022 by the authors. Licensee MDPI, Basel, Switzerland. This article is an open access article distributed under the terms and conditions of the Creative Commons Attribution (CC BY) license (https://creativecommons.org/licenses/by/4.0/).