4.1. Experimental Setup
In order to test the effectiveness of the guidelines for a trustworthiness model examined in the previous section, we need to simulate the binary game and all the possible behaviours. To this end, we make use of a full mesh network of devices, where each device interacts K times, not known beforehand by the devices, with each other device, alternating the roles of provider and requester. This way, all nodes can play all the possible strategies in the game. For each pairwise interaction, two players, one acting as a requester and the other as a provider, play the game and change their strategies according to their behaviour in the previous rounds and according to the adopted trust model.
According to Equation (
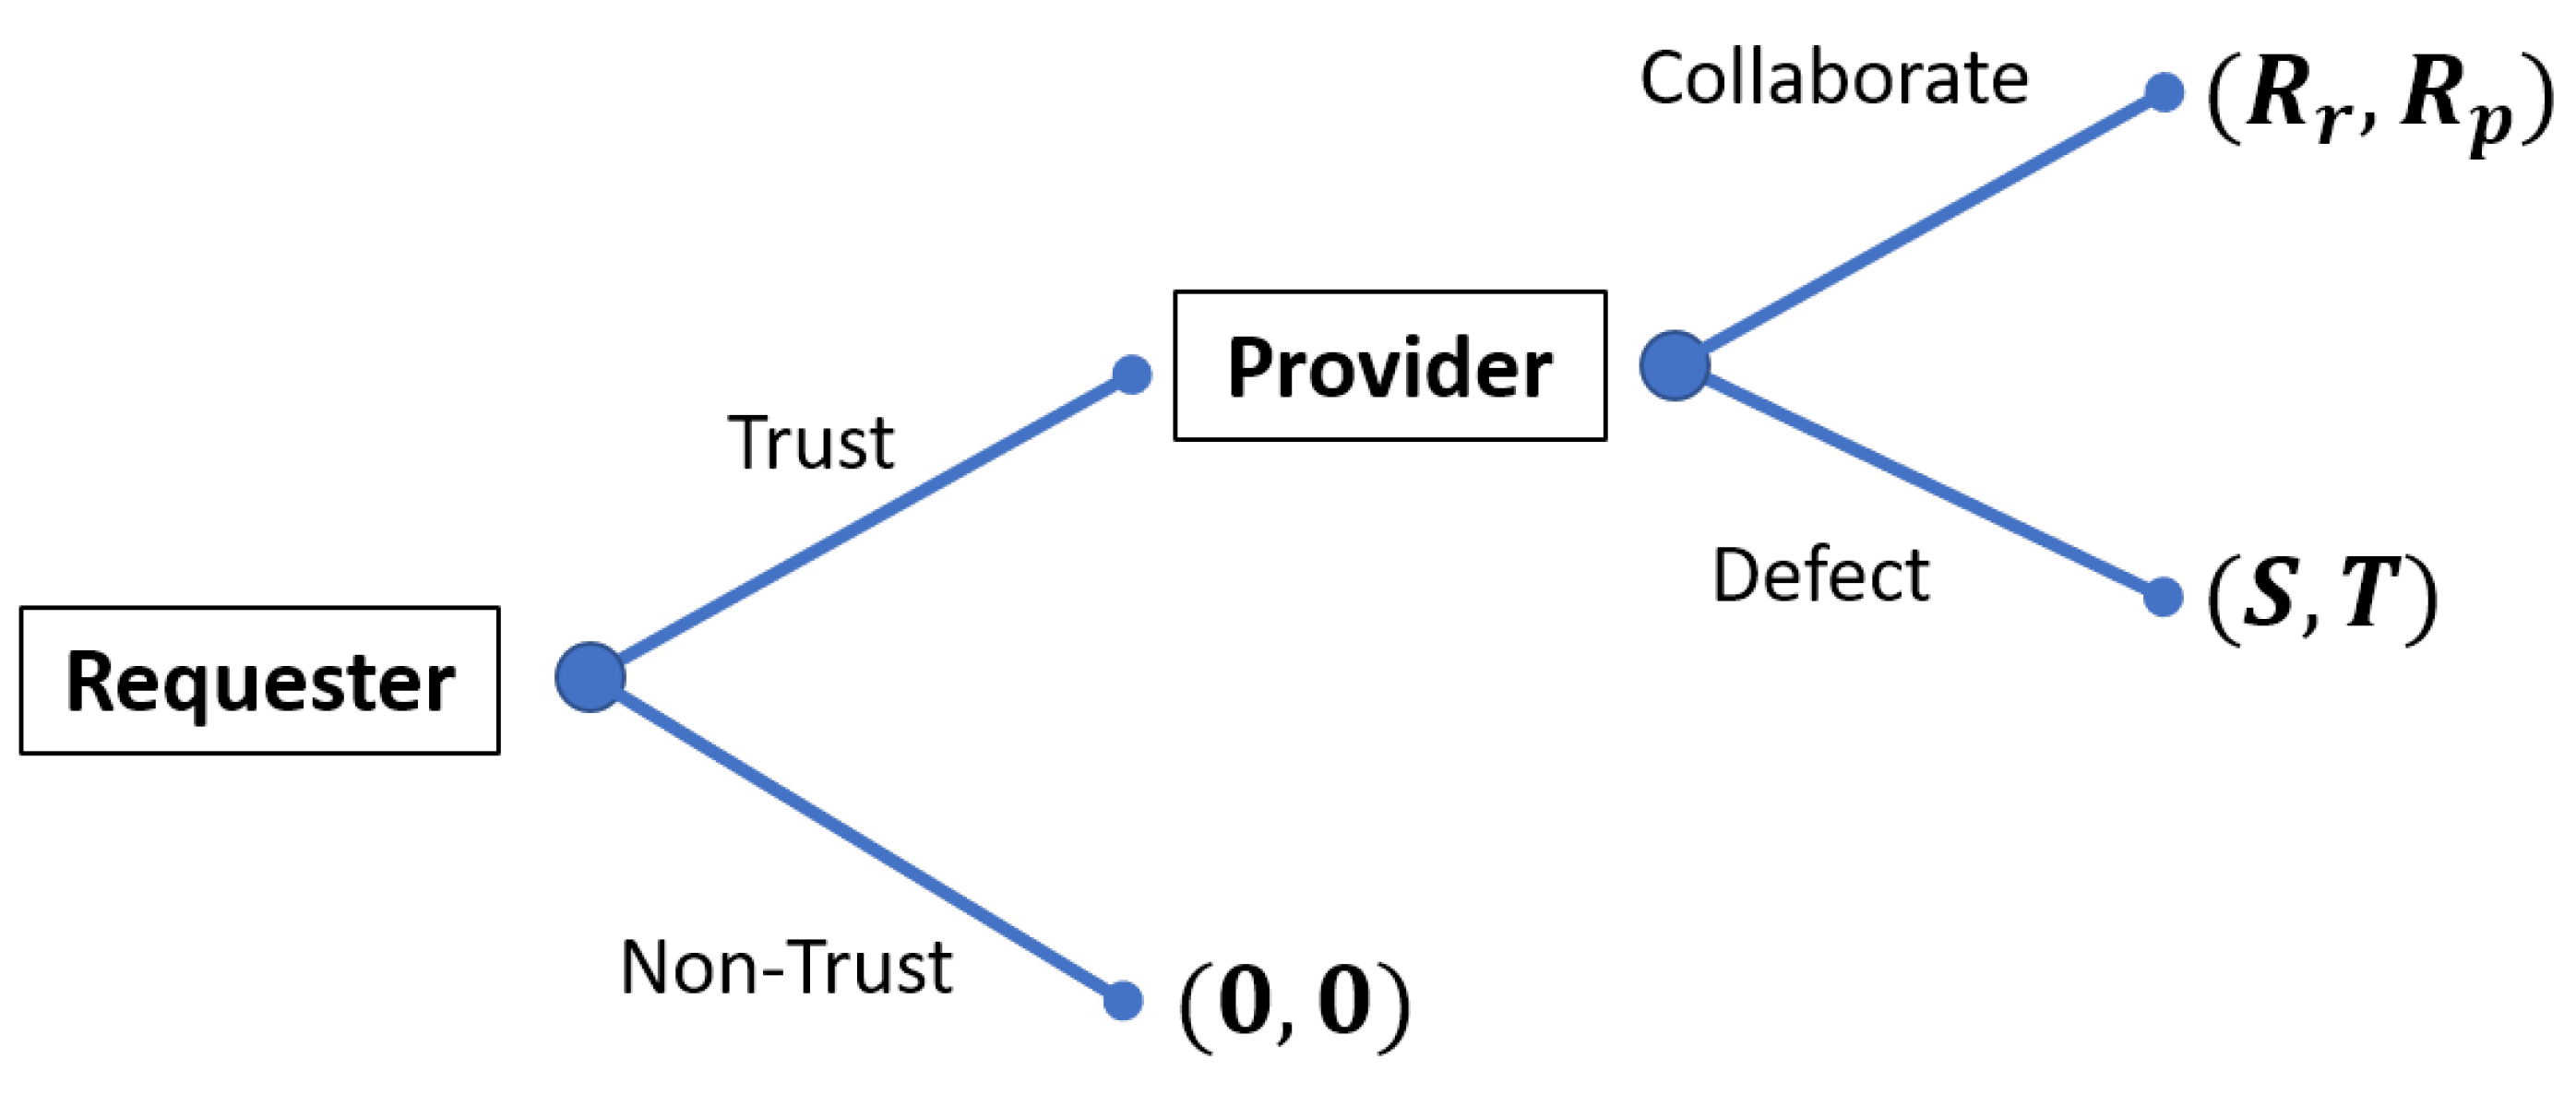
4), we can set the values of all the payoffs. Different values might be assigned to the parameters; however, if they respect the exposed relations, the final game would be the same. In this case, the greatest value is assigned to the requester’s benefit since it receives the required service, while the provider has a minor benefit related to its reputation. Taking into account the cost, the provider needs to use its own resources in order to solve the request, and then, the cost is higher w.r.t. the requester, where the cost is associated with the time spent to obtain the service and with the resources needed to send the request. For each game, the payoff for the two nodes, requester and provider, is computed according to the payoffs’ values, and the total payoff for a node is the sum of all the games.
The interactions follow the trust model based on the guidelines exposed in
Section 3 in order to detect the malicious behaviours and guarantee a high payoff for the benevolence. To do this, we set
equal to 0.1 in order to satisfy the condition
and
to grant the highest possible initial trustworthiness to all the nodes, while
and
are consequently evaluated for the specific set of simulations. The maximum admissible error for the algorithm is set to
in order to reach a compromise between the errors due to the cooperative nodes and the bad services provided by malicious nodes: considering an error probability equal to
,
that allows a number of consecutive errors starting from
equal to 3.
Moreover, malicious nodes are designed according to the description supplied in
Section 2.2. All the behaviours, both benevolent and malicious, are used to measure the effectiveness of the guidelines for the trust management model. The ME behaviour always provides bad services and defects in all transactions. Similarly, a node implementing the WA acts maliciously with everyone, but after a fixed number of transactions, 25 for our simulations, it resets its trust value by leaving and re-entering the network. Nodes performing the OOA change their state from ON to OFF, and vice versa, every
interactions, starting from the cooperative behaviour, which is harder to detect. Finally, the OSA node represents a smart attacker that modifies its
threshold, which is used in order to choose a behaviour. In the first set of simulations, the OOA node sets
so as to have more possibilities to act malicious and to increase its payoff.
Table 6 shows all the configuration parameters for the proposed simulations, the different payoffs used for the game and the trust model details.
4.2. Experimental Results
We evaluate the performance of the proposed guidelines by analysing the binary trust game in the simulated IoT network. Each device is alternately a requester or a provider and has interactions with all the other nodes.
We first examine a scenario with a population composed of only cooperative nodes and no trust management model: the goal is to understand which is the payoff that can be achieved in an ideal network. Each requester trusts all the providers, while providers have benevolent behaviour and collaborate in all interactions. The payoff average value for a single node is 24.75. This value consists of the maximum payoff achievable in a game of 100 interactions by a cooperative node. The node is not interested in preserving its own resources and then collaborates in each game.
Starting from the case with only cooperative nodes, we add malicious nodes to the network to illustrate how the attackers can obtain a greater payoff. Out of the total number of nodes in the network, we replace 5% of the nodes for each type of attack’s behaviour, so that the final network is composed of 80 cooperative nodes and 20 malicious nodes, evenly distributed among the four types of attacks. No trust algorithm is implemented, so the requesters will always choose to play the game, while malicious providers will behave according to the implemented attack.
Table 7 illustrates the resulting average payoffs for all the behaviours: the results show how cooperative nodes achieve the minimum payoff, which is lower than the previous scenario due to the negative payoff
S. Indeed, a requester interacting with a malicious provider will not receive any service, so its average payoff decreases from 24.75 to 16.00. On the other hand, malicious nodes receive the best payoff by acting maliciously: this payoff is higher w.r.t. the case with only cooperative nodes, because malicious nodes do not have to use their resource to produce the service (sense the environment or act on something). ME, WA and OSA can always defect without being detected due to the absence of the trustworthiness management model. The OOA behaviour presents a slightly lower payoff due to a certain number of transactions during the ON state, where the node performs benevolently; anyway, the malicious interactions allow them to receive a greater payoff w.r.t. the cooperative nodes.
The employment of a suitable trust model is essential in order to detect the malicious nodes and increase the payoff of the cooperative nodes. To this end, the next set of experiments examines the same network used in the previous scenario, i.e., with both cooperative and malicious nodes, but adopting a trust management model. Starting with the scenario where cooperative nodes always deliver the right service, i.e., they are not subject to errors, we design the trust model according to
Section 4.1:
and
in order to trust all nodes at start and to detect as fast as possible the malicious behaviours. Moreover,
and
are set based on
Table 3: for the case without errors for cooperative nodes,
to detect the attackers at their first malicious transactions and
to never increase the trust for intelligent malicious nodes, such as the OSA.
Table 8 illustrates the average payoffs of the nodes using the trust model previously described. The trust model is able to detect the ME, WA and OOA behaviours, thus reducing their average payoff with an advantage for the cooperative nodes. Even with a very low value of
, the model discards these malicious nodes after the first malicious transaction. The result is that when a malicious node acts as a provider, it will not be trusted, and then, it will not receive a payoff from any of the benevolent requesters: it will only be able to accumulate payoff when it acts as a requester and trusts other nodes. The WA behaviour resets its trust reputation after 25 interactions, then it has a slightly higher payoff than the ME attack, but nevertheless, it is detected immediately after the first malicious interaction. The OOA behaviour can achieve an even higher payoff compared to the other two behaviours by acting as a benevolent node and providing good services in its ON state (the first
M transactions); however, when the node switches to the OFF state, it is immediately detected at the first malicious interaction. Finally, the OSA behaviour exhibits the highest payoff equal to the cooperative nodes. The node performing the OSA changes its behaviour in order to be chosen as the provider and to not be discarded. However, since the model can detect a malicious node at its first interaction, the malicious node must always perform benevolently and thus achieve the same payoff as the cooperative nodes. Finally, we can observe how the average payoff of a cooperative node in this scenario is equal to 21.73, which is lower when compared to the payoff of 24.75 of the benevolent node in a completely cooperative network. This is tied to the presence of malicious nodes that decreases the average payoff for cooperative nodes even though the trust model detects them at the first interaction.
We now want to analyse the results when cooperative nodes can send bad services to the requester due to unintentional errors. The focus of the next test of simulations is to test how the trust model can be designed in order to take into account an error probability.
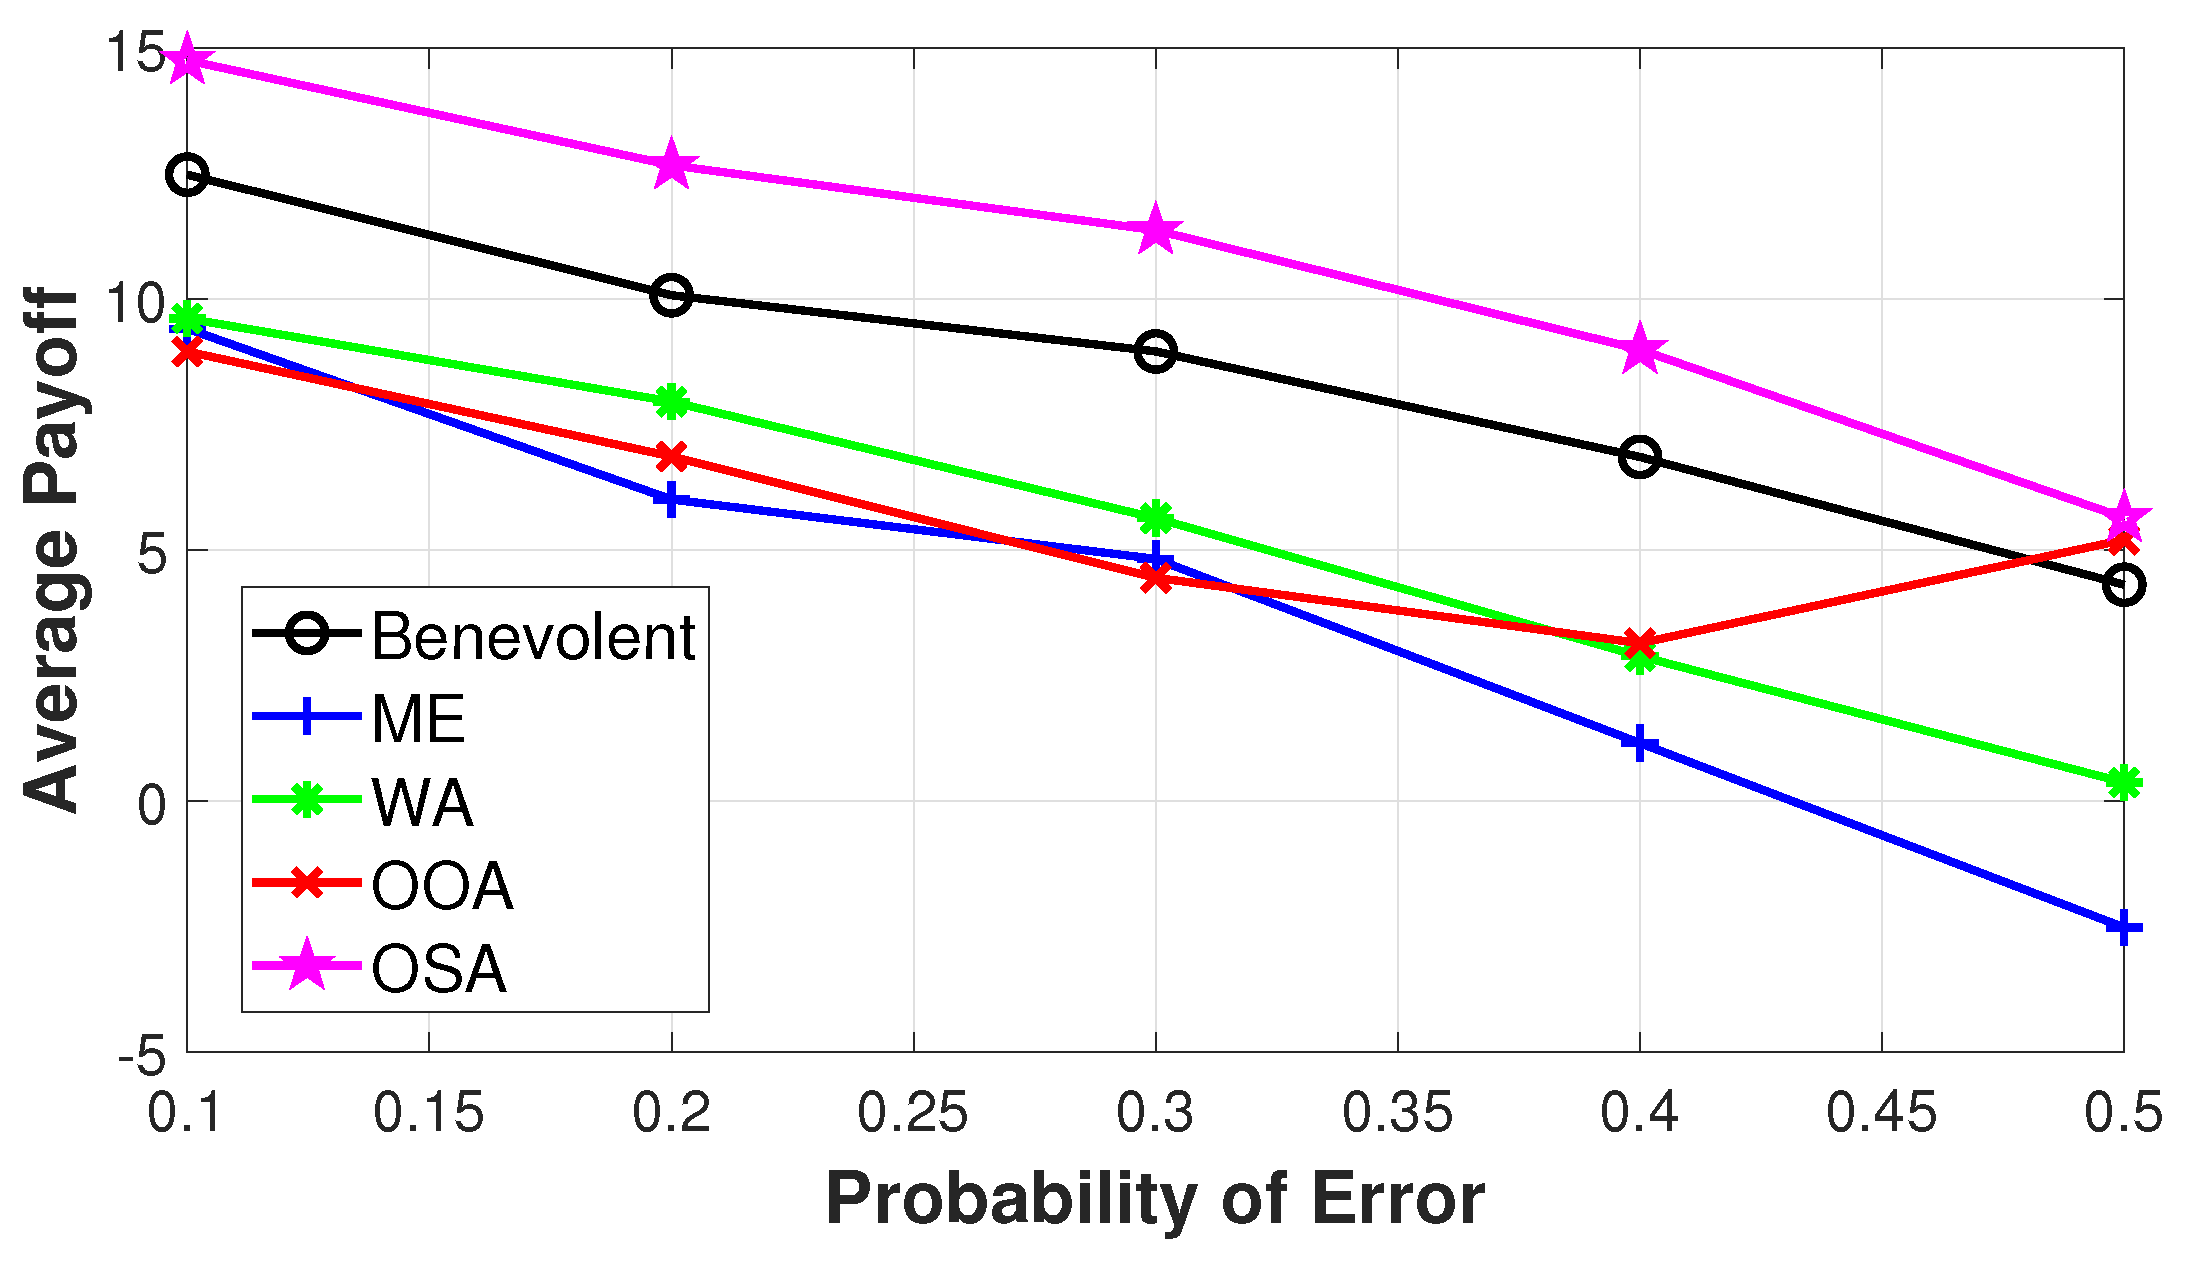
Figure 5 shows the average payoffs for different values of the error probability
p. For each value and considering
, the model can set
according to Equation (
24). The figure shows the average payoff for all the possible behaviours. The ME and WA behaviours show a lower payoff w.r.t. cooperative nodes, thus indicating how they are always detected: while the cooperative nodes make errors with a certain probability, ME and WA always send scarce services, and the model can easily detect them. Similarly, the OOA is discarded until an error probability of 0.5, because this behaviour is similar to a condition of a percentage of error equal to 50%. This results in a greater payoff of the OOA nodes with an error probability greater than 0.5. Furthermore, the OSA is able to reach the best payoff in all the simulations sending scarce services in a percentage equal to the probability of error (e.g., for a probability of error equal to 0.2, the OSA is able to act maliciously for 20% of its interactions). Moreover, OSA takes advantage of the admissible error set by the model sending for each requester a number of
bad services in the first interactions.
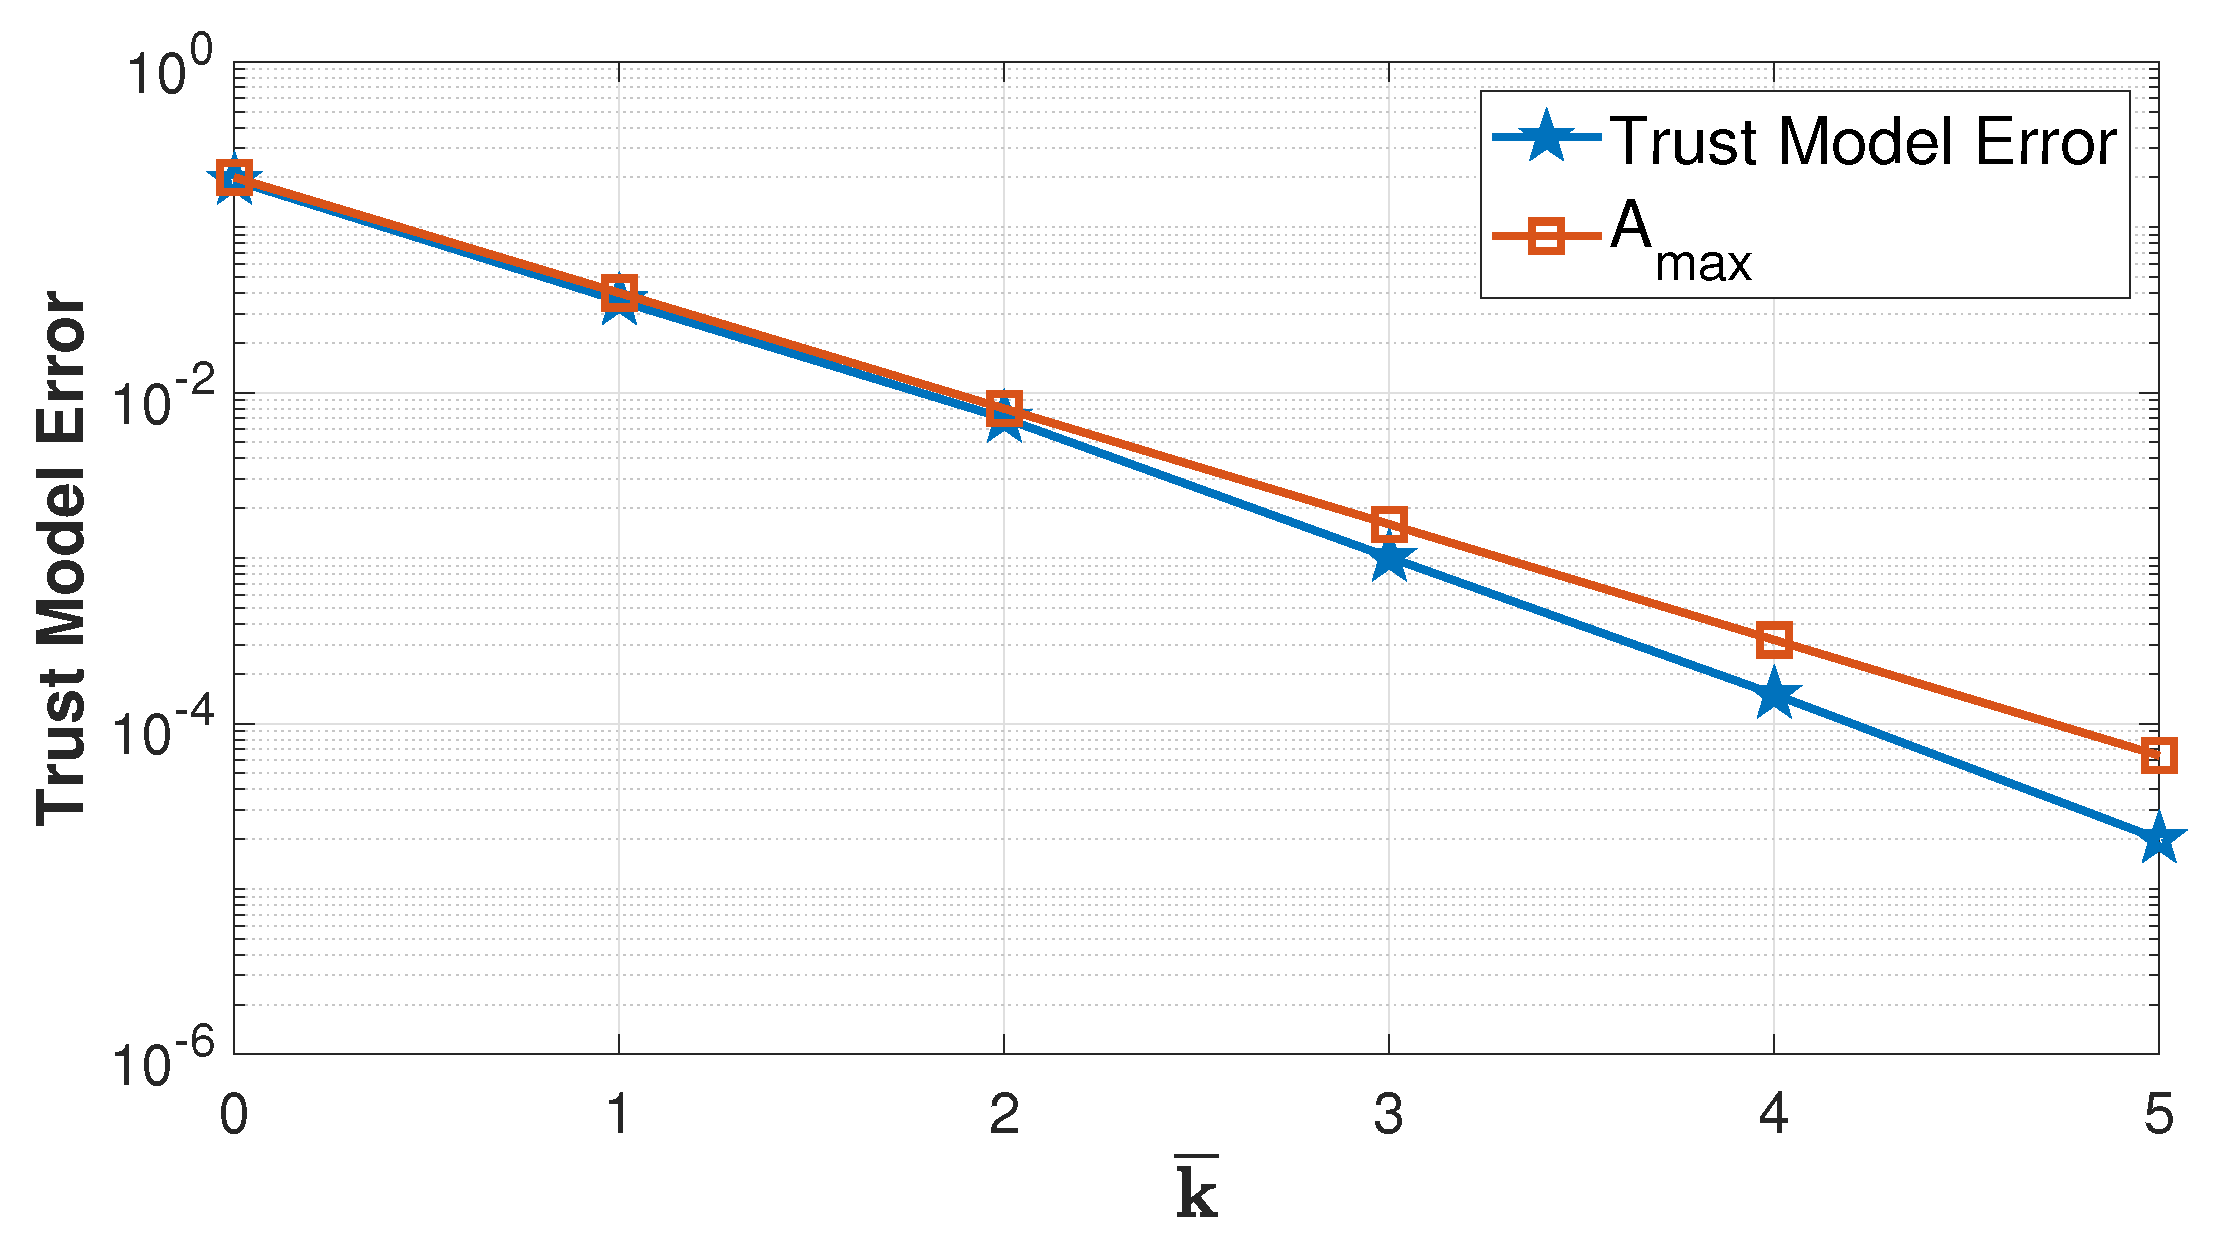
Figure 6 shows the trust model error in discarding cooperative nodes, considering a scenario with
cooperative nodes and a probability of error equal to
. The orange line shows the computed value for the maximum admissible error
as referenced. The Figure shows how the value of
is essential to overcome the probability of error of the cooperative nodes and obtain an acceptable error of the trust algorithms. By increasing the value of
, the model can decrease the number of discarded cooperative nodes, i.e., the trust model error, at the cost of increasing the vulnerability to attacks.
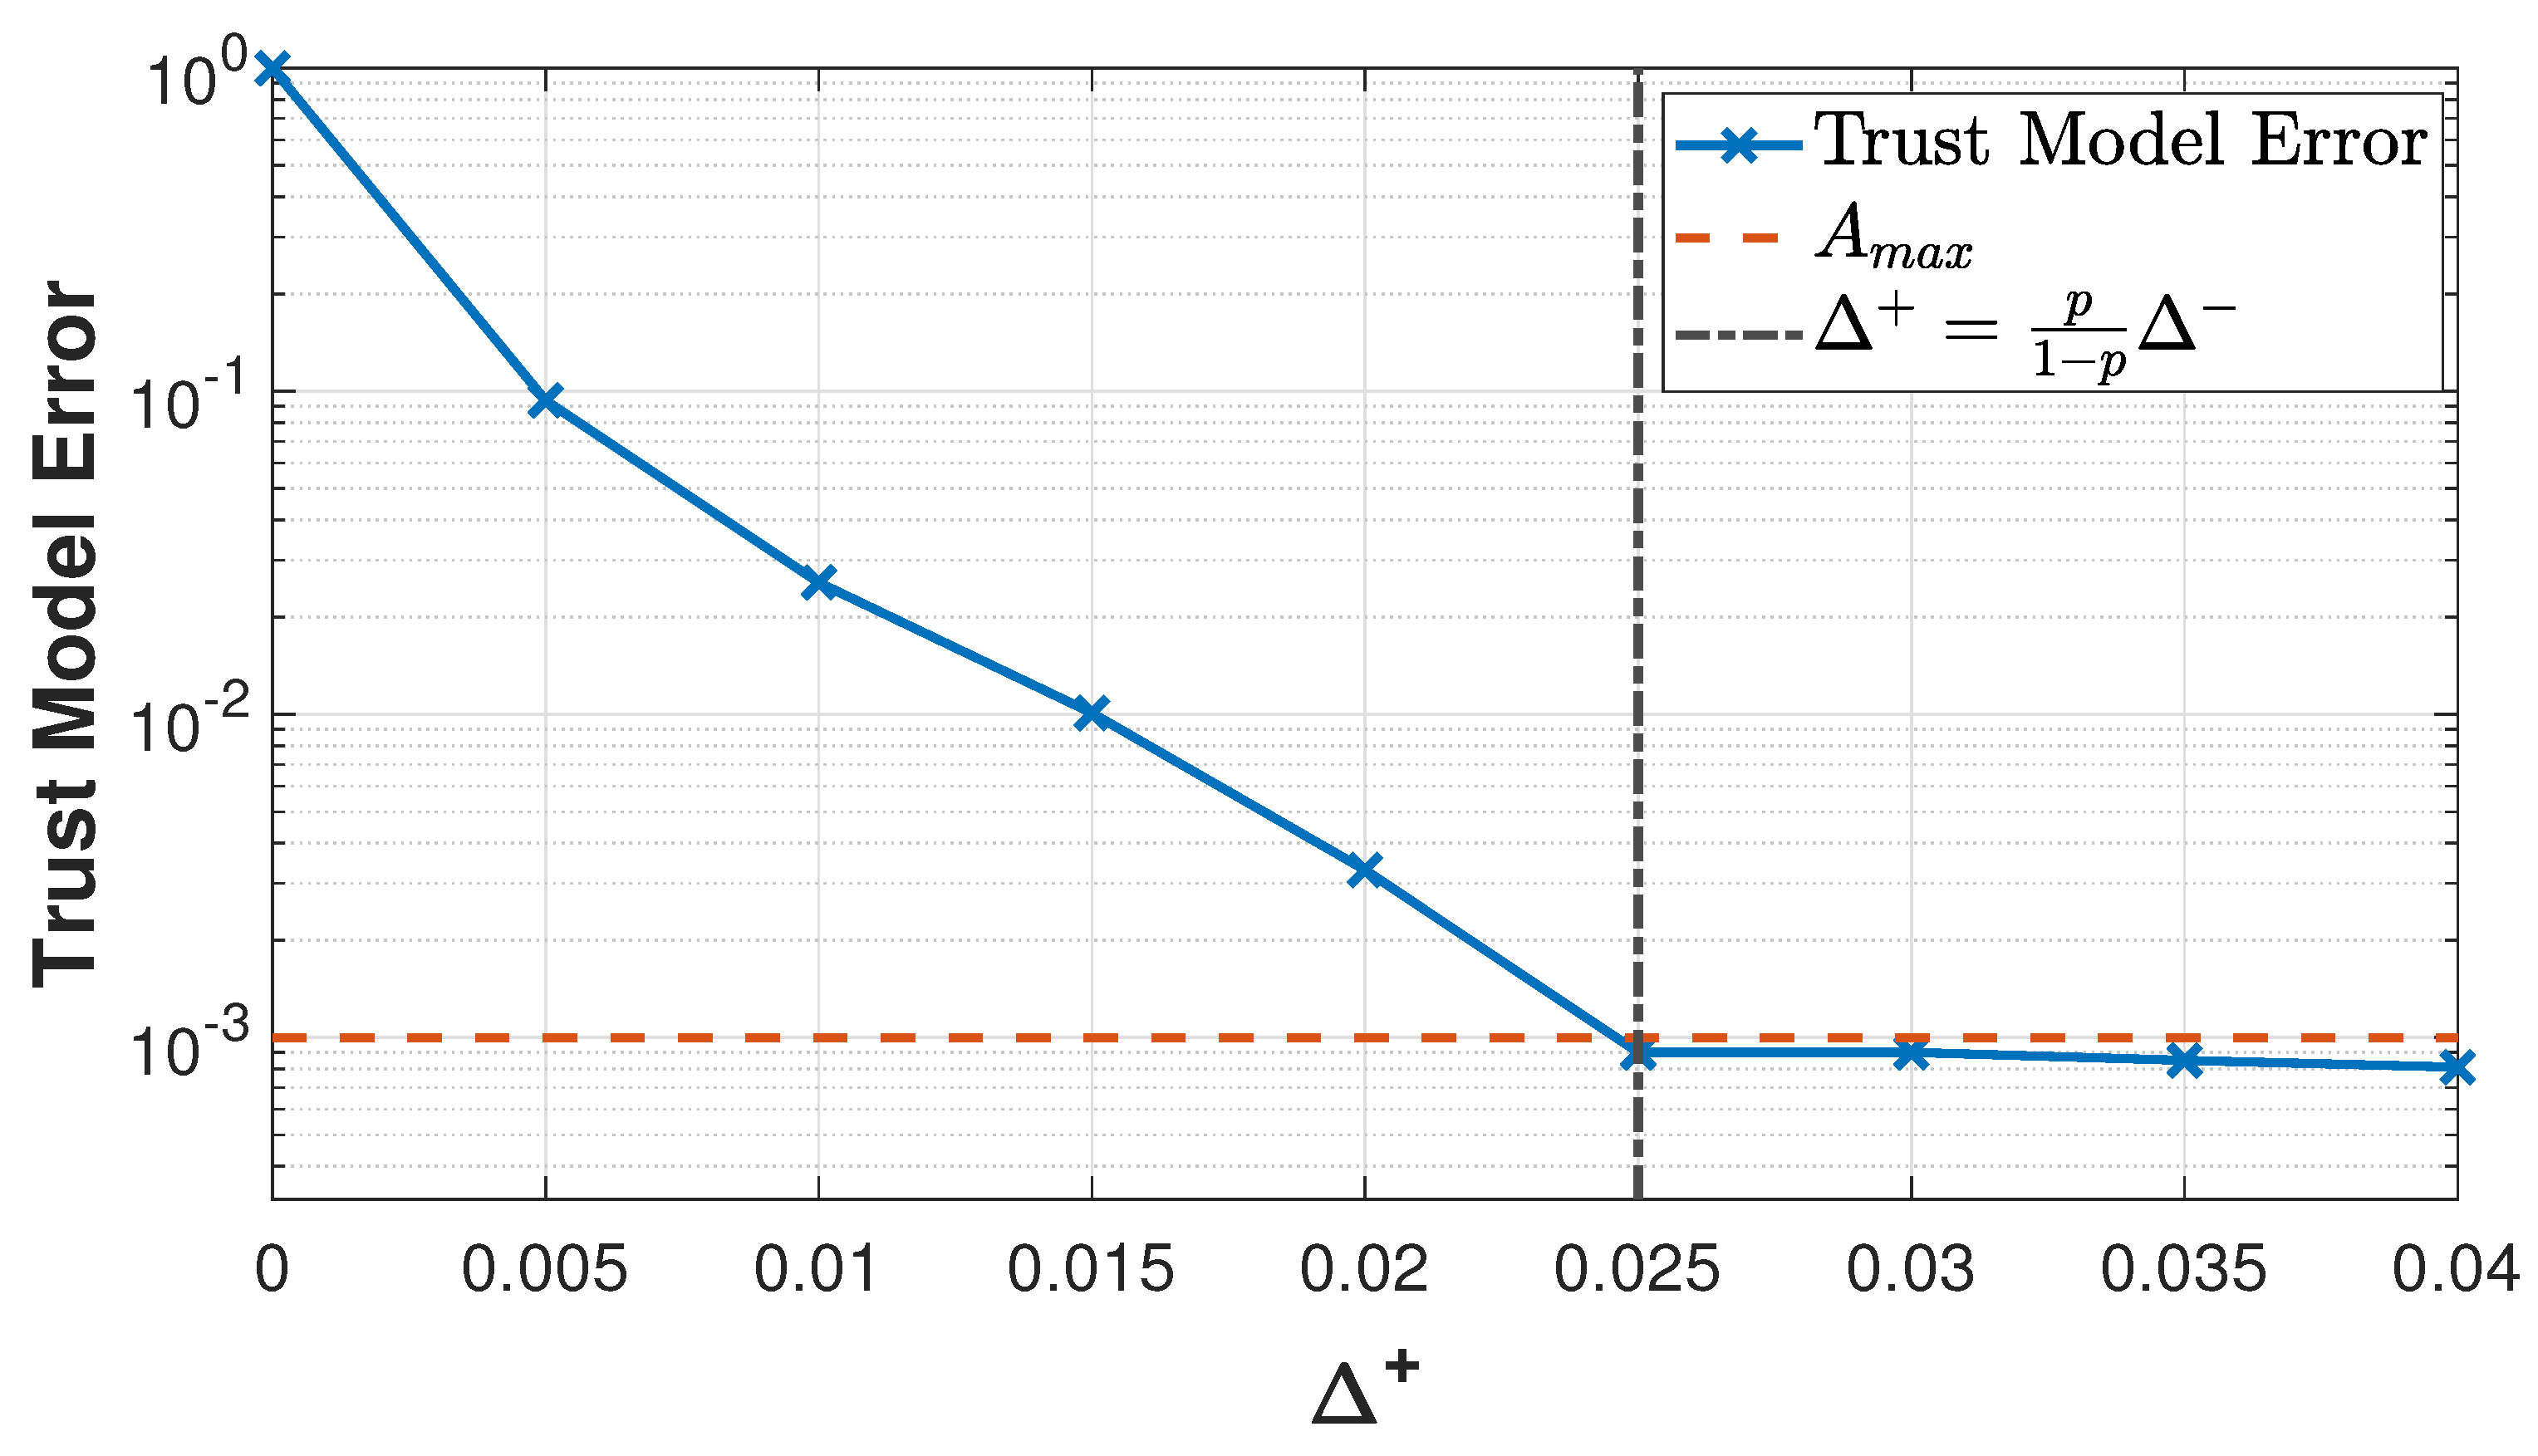
Furthermore, the importance of the parameter
is illustrated in
Figure 7. At the end of the simulation, i.e., after 100 transactions, the figure shows how the worst error is when
since the cooperative nodes are all discarded and no errors are allowed. The minimum value that allows a maximum admissible error
equal to 0.001 is
: this value allows cooperative nodes to avoid being discarded due to errors and, at the same time, enables the trust model to quickly identify the attacks.
Finally, the last two sets of simulations are aimed at understanding how malicious nodes can change their parameters in order to overcome the trust model. According to the previous simulations, the probability of error p is set equal to 0.2, and the simulations focus on an individual malicious node. Each malicious node tries to bypass the trust model in order to increase its own payoff at the expense of the cooperative nodes. The ME attack has no way to modify its behaviour, and with a probability of error , it is always detected during the first transaction by the trust model. Concerning the WA, a node can change how often it re-enters the network, but since its behaviour is similar to the ME attack, the node is always detected at the first malicious transaction. The worst-case scenario is when a node implementing the WA re-enters the network after each malicious interaction, and the WA can never be detected. However, the high cost of leaving and re-entering the network with a different identity limits this behaviour.
Analysing the OOA behaviour, a node has two choices available: which state is used for the first transactions and the duration of each state, i.e., the value of
M. As stated in the previous section, the best choice for a node is to start with a benevolent behaviour in order to increase its trust value.
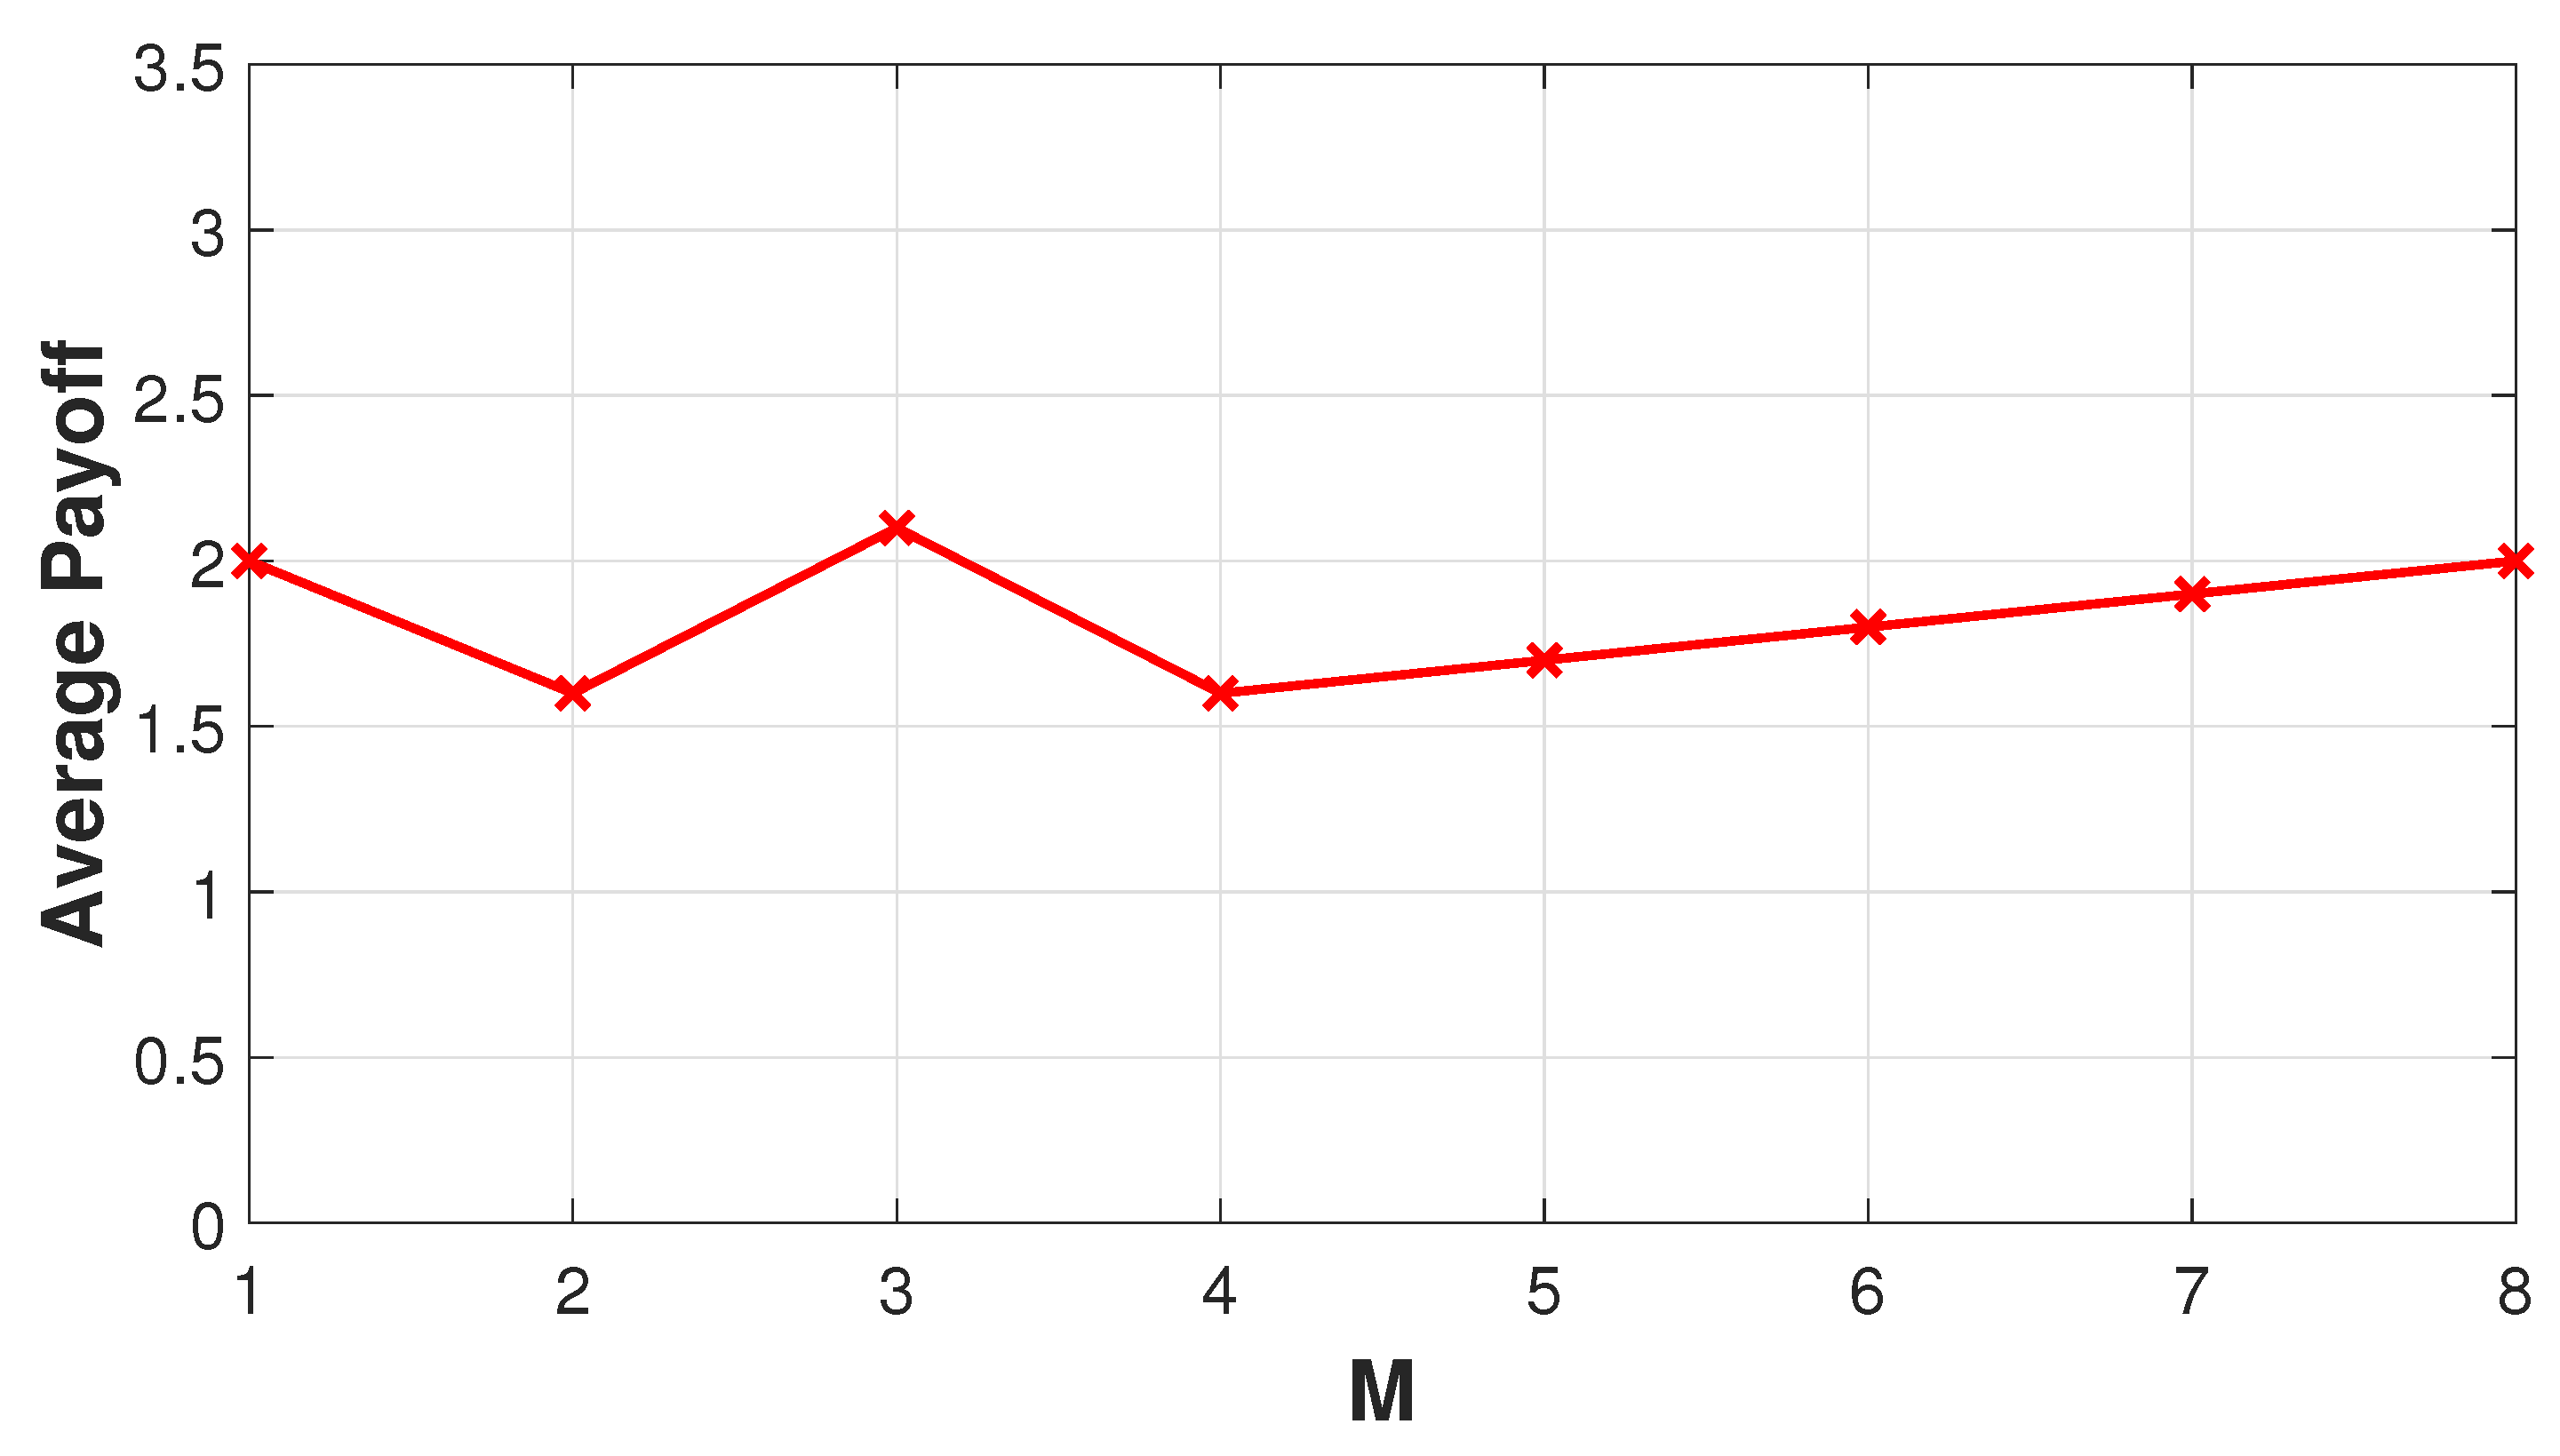
Figure 8 illustrates then the average payoff of a node implementing the OOA with different values of
M. With an error probability equal to 0.2 and
set to 0.001, the model can allow a number of
consecutive errors starting from the first interaction. This means that a node performing the OOA will be detected as malicious after four malicious interactions. The average payoff is then tied to the number of benevolent interactions the node performs when it is in the ON state, so that the average payoff increases for
. Before this condition, the average payoff shows an oscillatory behaviour due to the variation in the number of cooperative transactions.
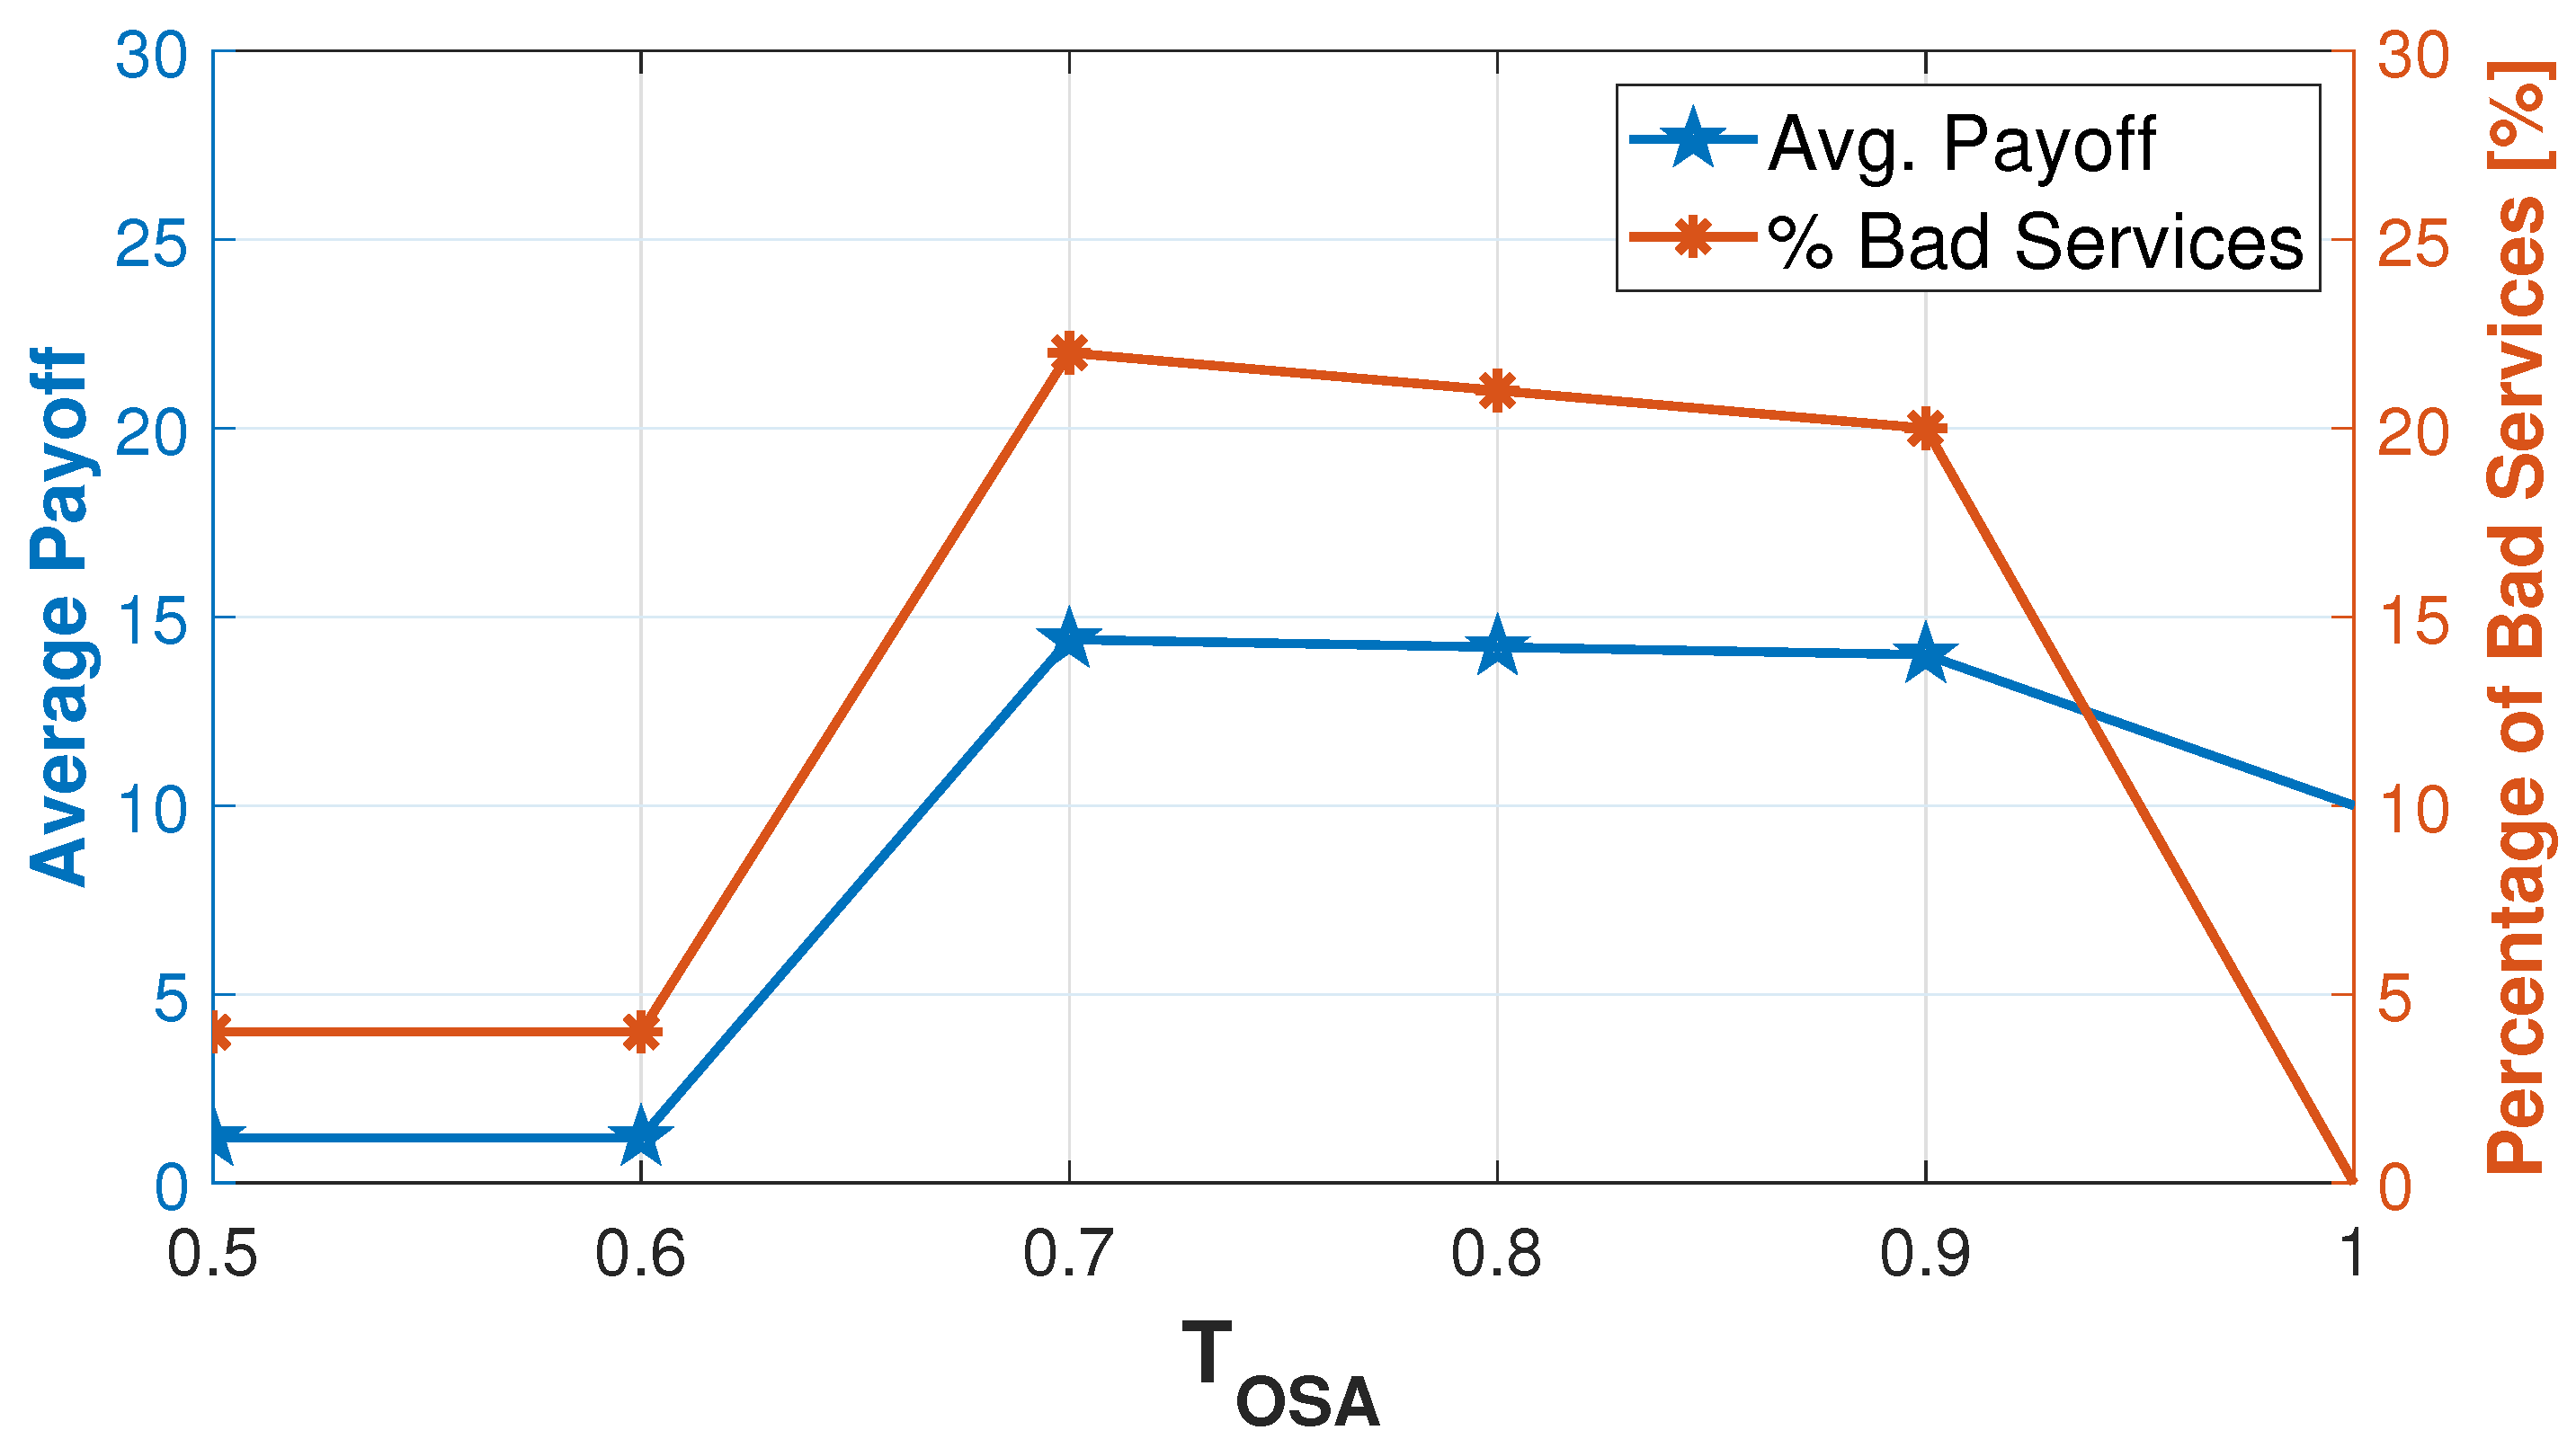
Finally, the behaviour of the OSA node is described in
Figure 9. The model threshold
is set according to Equation (
24) with a value near
, because
. The figure shows how the best value for
is equal to
, where the node can perform the highest number of bad services, and thus, its average payoff is maximum. We can also note how the percentage of bad services the OSA behaviour is able to deliver is higher than the error probability of a node (
): this is due to the ability of the OSA to exploit the tolerance margin due to the maximum admissible error by the algorithm,
. With
, the node is immediately detected, and its payoff is lower; while with
, the node does not fully exploit malicious opportunities, and then, it cannot achieve the maximum payoff.
