Abstract
Global environmental challenges, including eutrophication and hypoxia in enclosed water bodies, require innovative solutions for sustainable water quality management. Lake Biwa, Japan’s largest freshwater lake, suffers from hypoxia in its bottom layers due to strong summer stratification that inhibits vertical mixing. To address this issue, the present study employed a three-dimensional hydrodynamic–ecosystem model to numerically evaluate the effectiveness of training walls (guiding dikes) at river mouths in enhancing vertical mixing and improving bottom-layer oxygenation. Simulations revealed that the installation of guiding dikes significantly altered horizontal advection and promoted vertical mixing, particularly during winter, when weakened stratification allowed snowmelt inflows to sink along the dikes. As a result, local increases in dissolved oxygen concentrations of up to 0.4 mg/L were observed in the bottom layer. These findings demonstrate that guiding dikes can effectively improve oxygen supply to hypoxic zones, especially during periods of low stratification, providing a promising strategy for lake management in temperate regions experiencing seasonal snowmelt.
1. Introduction
Global warming and anthropogenic pressures are rapidly reshaping oxygen dynamics in aquatic systems from oceans to freshwater lakes. The global oceanic oxygen inventory has declined by more than 2% over the past five decades [1], and deoxygenation continues to expand across coastal and marginal seas worldwide [2]. In addition, pervasive stressors such as marine plastic pollution [3,4,5], sea-level rise [6], and climate-driven intensification of thermal stratification [7] interact synergistically, suppressing vertical mixing. This results in oxygen depletion in deeper waters and threatens fisheries, biodiversity, and ecosystem services [7,8,9].
The consequences of hypoxia are not confined to marine environments but are increasingly evident in lakes. Studies of the North American Great Lakes, European lakes, and large Asian lakes have shown that warming prolongs stratification and reduces opportunities for vertical circulation [10,11,12,13,14,15]. The earlier onset and delayed breakdown of stratification [12], together with accelerated lake warming caused by atmospheric stilling in the Northern Hemisphere [13], are recognized as direct drivers of bottom-water hypoxia. Climate-driven oxygen loss in northern lakes has recently been highlighted [16]. These findings underscore the role of lakes as sentinels of climate change [14], sensitively integrating atmospheric forcing, catchment processes, and internal dynamics into oxygen responses.
Lake Biwa, the largest freshwater lake in Japan, exemplifies this global phenomenon in a unique regional context. During summer, strong stratification suppresses vertical mixing and severely limits oxygen transport to the hypolimnion [17]. Consequently, bottom dissolved oxygen (DO) in the northern basin approaches critical thresholds annually, triggering mass mortality of benthic communities and the release of nitrogen and phosphorus from sediments [18,19]. These processes reinforce internal loading and create a negative feedback loop that further complicates water quality restoration. Long-term observations also suggest a shift toward incomplete winter mixing (incipient oligomixis), raising concerns about permanent alterations to the lake’s oxygen regime [20].
Various engineering interventions have been trialed internationally. Hypolimnetic oxygenation and artificial mixing have been applied in lakes and reservoirs in North America, Europe, and China, demonstrating improvements in bottom oxygen concentrations and suppression of sediment nutrient fluxe [21,22,23,24]. Yet, in large monomictic lakes such as Lake Biwa, the steep bathymetry, large volume, and complex hydrodynamics render direct application of generic methods challenging.
Against this backdrop, river-mouth training walls—hereafter guiding dikes—offer a promising but underexplored approach. Traditionally constructed to stabilize navigation channels and control sediment transport [25,26], such structures also modify local flow fields, stratification, and residual circulation [27]. Large-scale river engineering has shown that flow guidance can reshape estuarine morphology and density stratification [25,26,28]. These findings suggest that guiding dikes may hold untapped potential to enhance vertical mixing and oxygen delivery in large lacustrine systems.
Recent advances in three-dimensional coupled hydrodynamic–ecosystem models provide a powerful framework for evaluating such interventions. These models simulate physical transport processes alongside biogeochemical responses, enabling quantitative assessments of how engineered structures influence vertical mixing, nutrient cycling, and oxygen dynamics [29,30].
Here, a three-dimensional coupled hydrodynamic–ecosystem modeling framework is applied to Lake Biwa to evaluate the potential of guiding dikes as a hypoxia mitigation strategy. Unlike conventional interventions such as hypolimnetic aeration or mechanical mixing, which require continuous external energy input, the novelty of this work lies in demonstrating that structural flow guidance can passively exploit natural density currents to enhance vertical mixing and oxygen delivery to the hypolimnion. Variations in dike placement and geometry are examined to determine their effects on (i) vertical mixing and stratification strength, (ii) the spatial and temporal distribution of bottom-water oxygen, (iii) sediment–water nutrient fluxes, and (iv) robustness under meteorological and hydrological variability. By establishing a mechanistic link between inflow guidance, vorticity modification, and hypoxia alleviation, this study expands the conceptual framework of lake restoration from direct oxygen supplementation to structural modulation of natural hydrodynamics. These insights not only provide site-specific design principles for Lake Biwa but also offer a transferable paradigm for sustainable, low-energy hypoxia countermeasures in enclosed and semi-enclosed aquatic systems worldwide.
2. Methodology
In this study, Lake Biwa was selected as the target domain to evaluate the effectiveness of channeling structures (guiding dikes) in mitigating hypoxia. The analysis was conducted using a coupled hydrodynamic–ecosystem model developed for Lake Biwa. This model builds on the three-dimensional hydrodynamic and ecological framework developed by Koue et al. [17,31] and was further enhanced by incorporating a sediment model that accounts for redox reactions, as proposed by Koue [32]. The coupled model has been extensively evaluated in previous applications to Lake Biwa, where it successfully reproduced hydrodynamic fields, stratification, and seasonal variations in dissolved oxygen [17,31,32]. Accordingly, the model configuration established in these earlier studies was adopted as the baseline framework for the present analysis.
The seasonal characteristics of the lake were explicitly considered, since, as pointed out in previous studies, heat balance and circulation patterns vary markedly with season and exert a strong influence on water quality dynamics. For example, seasonal heat fluxes can prolong or shorten stratification periods, thereby directly affecting oxygen transport to the hypolimnion [33]. To capture these seasonal dynamics, the model incorporated annually varying meteorological forcing and hydrological boundary conditions, allowing the reproduction of stratification and hypolimnetic oxygen depletion during summer, as well as vertical circulation and oxygen replenishment during winter.
2.1. Computational Domain
Figure 1 illustrates the computational domain of the Lake Biwa model. The horizontal domain covers the entire lake, ranging from 34.9771° N to 35.5187° N and from 135.8531° E to 136.2906° E, encompassing an area of 35.5 km × 65.5 km. The horizontal grid resolution is 500 m × 500 m, with a total of 71 × 131 grid cells. The vertical grid has a uniform spacing of 0.5 m. A Cartesian coordinate system is adopted, with the southwestern corner of the domain defined as the origin: the x-axis is oriented eastward, the y-axis northward, and the z-axis downward, perpendicular to the lake surface.
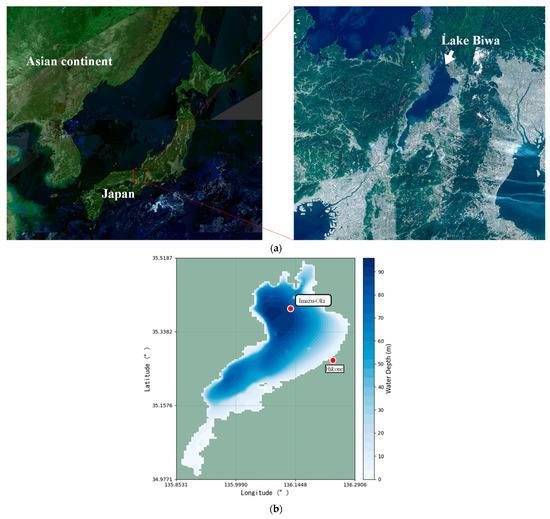
Figure 1.
Computational domain of the Lake Biwa model. (a) The location of Lake Biwa in Japan Geospatial Information Authority of Japan Web Cite (URL: https://www.gsi.go.jp/tizu-kutyu.html) (accessed on 15th May 2015). (b) Bathymetric chart in Lake Biwa.
2.2. Hydrodynamics Model
In this study, the three-dimensional hydrodynamic model proposed by Koue et al. [17] was used. The hydrodynamic component of the model computes flow direction, flow velocity, and water temperature at each mesh point.
2.2.1. Governing Equations
The basic equations of the flow field model assume the Boussinesq approximation and the hydrostatic approximation in the vertical direction and consist of the equation of motion of the fluid, the equation of continuity, and the advection–diffusion equation for the water temperature [17]. The governing equations are described in the Cartesian coordinate system as follows. Momentum equations (x, y direction) are written as
The hydrostatic equation is given by
The continuity equation is written as
The conservation equation for temperature is written as
where u, v, and w are the x, y, and z components of current velocity (m s−1), T is the water temperature (K), p is the pressure (N m−2), ρ is the density of water (kg m−3), ρ0 is the reference density of water (=103 kg m−3), g is the acceleration due to gravity (=9.8 m s−2), f is the Coriolis parameter (=8.34 × 10⁻⁵ s−1 corresponding to 35° N), νh is the horizontal eddy viscosity for momentum equations (=1.0 m2 s−1), κh is the horizontal eddy diffusivity (=1.0 m2 s−1), νz is the vertical eddy viscosity (m2 s−1) for momentum equations, and κz is the vertical eddy diffusivity (m2 s−1).
where is the horizontal current velocity (m s−1). Vertical eddy viscosity and diffusivity are respectively given by
2.2.2. Initial Conditions
The initial condition was set to 0 m s−1 for the current velocity. The initial water temperature on 1 April 2006 was calculated using linear interpolation of data collected on 20 March and 10 April 2006. The initial conditions for nutrients such as nitrogen and phosphorus were set based on the data observed twice a month at Imazu-oki by the Lake Biwa Environmental Research Institute. The observations were conducted by the Lake Biwa Environmental Research Institute twice a month at the monitoring point in Imazu-oki (35°23′41″ N, 136°07′57″ E), the depth of which was 0.5 m, 5 m, 10 m, 15 m, 20 m, 30 m, 40 m, 60 m, 80 m, and approximately 90 m.
2.2.3. Boundary Conditions
The following formula gives the boundary conditions for the current velocity at the lake’s surface, taking wind stress into account.
where τx and τy are the surface wind frictional stresses calculated by
where ρa is the density of air (kg m−3), Cf is the wind frictional constant, Uax and Uay are respectively the x and y components of wind velocity (m s−1), and Ua is the wind speed from a height of 10 m above the surface (m s−1).
The heat flux through the water surface consists of short-wave solar radiation (S↓), latent heat flux (Ql), sensible heat flux (Qs) and net long-wave radiation (Lnet). The heat balance equation on the water surface is given by
At the bottom and side walls, no-slip condition is imposed. Normal gradients of water temperature are also set to zero to provide thermal insulation.
The Grid Point Value derived from Japan Meteorological Agency’s Meso-Scale Model (GPV MSM) was used to calculate air temperature, atmospheric pressure, wind direction and speed, and relative humidity over Lake Biwa. GPV MSM data have a spatial resolution of 0.0625° (longitude) × 0.05° (latitude) (approximately 5 km) and a temporal resolution of an hour. The data were horizontally interpolated into the hydrodynamic model’s surface meshes.
Hourly observations at the Hikone local meteorological observatory (35°16′30″ N., 136°14′36″ E.) were used to calculate solar radiation. The lake’s solar radiation was assumed to be horizontally uniform.
The hydrological model calculated the boundary conditions for the water volume and temperature associated with inflow from each river and outflow from the lake.
2.3. Ecosystem Model
The three-dimensional ecosystem model for Lake Biwa follows the framework developed by Koue [31,32]. It considers inorganic nitrogen species including ammonium (NH4–N), nitrite (NO2–N), and nitrate (NO3–N), and inorganic phosphorus as phosphate (PO4–P). Carbon is represented as particulate organic carbon (POC) and dissolved organic carbon (DOC).
To enhance model fidelity, a sediment sub-model was integrated to represent the dynamics of nitrogen, phosphorus, and organic matter in the sediment layer. This sub-model accounts for spatial and temporal variations of organic and inorganic nitrogen/phosphorus species, adsorbed nutrients, and dissolved oxygen in both sediment and porewater. Processes considered include sedimentation, diffusion, aerobic and anaerobic decomposition, adsorption/desorption, nitrification, and denitrification. A schematic of the model structure is shown in Figure 2.
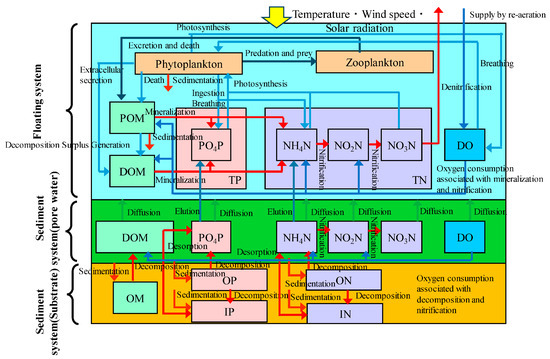
Figure 2.
Schematic diagram of the ecosystem model.
2.4. Guiding Dike Configurations
To account for the influence of river inflows on Lake Biwa, boundary conditions were prescribed using simulated outputs rather than direct field measurements. Daily water temperature and discharge for fifty-six rivers were derived from a hydrological model through interpolation. The six major rivers together contribute approximately 60% of the total inflow, which averages 177.5 m3 s−1 annually. For this study, river inflow data were updated daily, and the boundary conditions for discharge and temperature of each inflow and the sole outflow were determined with the hydrological model [34].
To control the inflow pathways of river water into Lake Biwa, channel-like structures—hereafter referred to as guiding dikes—were virtually implemented along the lakebed. Figure 3 shows the flow rates of the six major rivers flowing into Lake Biwa. Among these, the Ane River, Ado River, and Echi River were selected as target rivers for the installation of guiding dikes, based on their relatively large discharge near the central offshore region of Imazu-oki, a water quality observation site in the northern basin. The guiding dike configurations were evaluated according to the case settings listed in Table 1. All guiding dikes were aligned with the natural inflow directions of the respective rivers. Figure 4 shows the locations where the guiding dikes were applied.
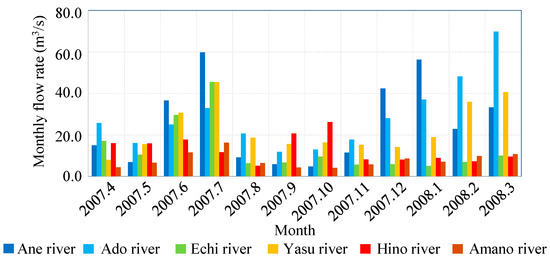
Figure 3.
Monthly discharge of the six major rivers flowing into Lake Biwa (m3/s).

Table 1.
Configuration cases for guiding dike installation.
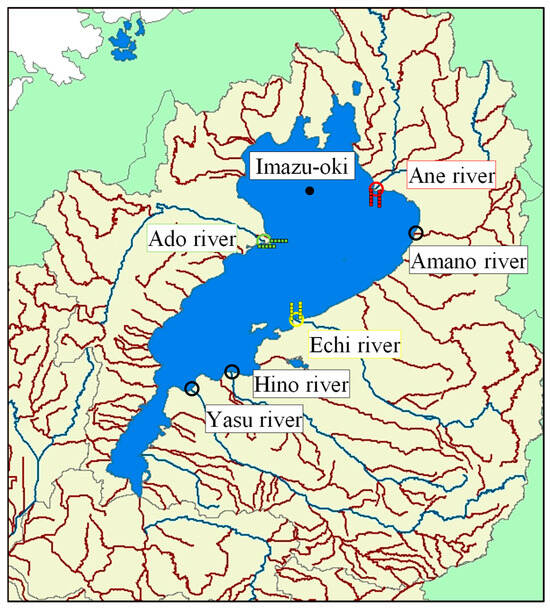
Figure 4.
Locations of guiding dike installation (◯: the position of the river mouth, red: the highest-discharge river of these 3 rivers, green: the second-highest-discharge river (of the three), yellow: the lowest-discharge river (of the three), ☐: computational mesh used for the guiding dikes).
The design parameters of the guiding dikes (length, height, and interval) were set as idealized conditions to evaluate their potential hydrodynamic effects, rather than to propose actual construction. Their dimensions were chosen to be large enough to influence river plumes, while remaining simple and uniform across cases for comparative purposes. In reality, large-scale guiding dikes could affect navigation, sediment transport, and shoreline processes, and their construction and maintenance may not align with the environmental management policies of Lake Biwa, which prioritize conservation and ecological balance. Thus, the present study treats the guiding dikes as a conceptual tool to investigate the physical mechanisms of flow control and their potential implications for hypoxia mitigation, rather than as a direct engineering proposal.
2.5. Simulation Period
The hydrodynamic model simulation was conducted with a one-year spin-up period from 1 April 2006 to 31 March 2007, followed by a one-year analysis period from 1 April 2007 to 31 March 2008. The temperature and velocity fields used in the ecosystem model were derived from the output of the hydrodynamic model and updated every three hours. The simulation period for the ecosystem model was set to match that of the hydrodynamic model, with the same one-year spin-up period (1 April 2006–31 March 2007) and one-year target analysis period (1 April 2007–31 March 2008).
2.6. Statistical Metrics Used for Reproducibility Assessment
To evaluate the reproducibility of water temperature, the mean absolute error (MAE), mean bias (MB), and correlation coefficient (R) were used between observed and simulated values. The definitions of these metrics are as follows:
where N is the total number of data points, Mi and Oi represent the simulated and observed water temperatures at each location and time, respectively, and and denote the mean of simulated and observed values.
3. Results
3.1. Assessment of Water Temperature Reproducibility
Table 2 presents the depth-specific seasonal averages of observed temperatures and Baseline simulation results at Imazu-oki, together with the corresponding MAE, MB, and R values, evaluated for each season (spring: April–June; summer: July–September; autumn: October–December; winter: January–March).

Table 2.
MAE, MB, and R between observed and Baseline-simulated water temperatures at Imazu-oki at 0.5 m, 20 m, and 80 m.
The MAE remained consistently below 1.66 °C across all depths and seasons. In particular, errors were as small as 0.49 °C at 0.5 m depth in autumn and 0.65 °C at 80 m depth in winter, indicating that the simulation reproduced the observed water temperatures with high accuracy. The MB values also fell within a reasonable range, without evidence of systematic bias. For example, the maximum MB was 1.48 °C at 0.5 m depth in spring, while the minimum was –1.15 °C at 80 m depth in summer. In autumn and winter, MB values at 20 m depth—below the thermocline—remained below 1.65 °C. Although correlation coefficients were relatively low at 20 m and 80 m depths in summer, strong correlations were obtained in spring and autumn. At 0.5 m depth, in particular, R exceeded 0.99 in both spring and autumn, demonstrating excellent agreement between the simulation and observations. Overall, the model reproduced the thermal structure of the water column with high fidelity.
3.2. Hydrodynamic Responses to Guiding Dike Implementation
Figure 5 shows the horizontal flow fields at 5 m depth for the Baseline case and Case 3, in which guiding dikes were implemented at the Ane, Ado, and Echi rivers, on representative dates for each season (1 May, 1 August, and 1 November 2007; 1 February 2008). Because surface layers are strongly influenced by wind, the analysis focuses on flows at 5 m depth. Flow velocities are indicated by color, with red denoting the maximum (0.4 m s−1) and blue the minimum (0.001 m s−1). Table 3 summarizes the mean vorticity in the northernmost region of the northern basin for both the Baseline and Case 3.
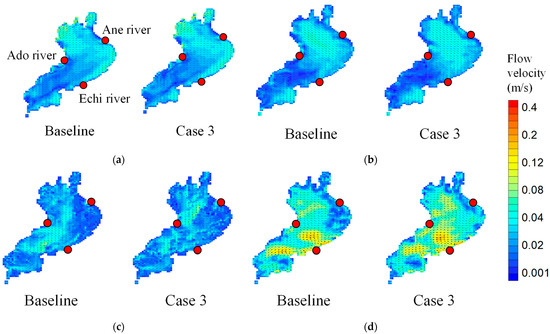
Figure 5.
The horizontal flow fields at a depth of 5 m for the Baseline case and Case 3 on (a) 1 May 2007, (b) 1 August 2007, (c) 1 November 2007, and (d) 1 February 2008 (◯: the red position of the river).

Table 3.
The mean vorticity in the northernmost region of the northern basin for both the Baseline and Case 3.
The installation of guiding dikes induced pronounced modifications in the horizontal flow field, most evident in the velocity increases near the river mouths. These changes were accompanied by marked shifts in vorticity. In winter, the strongest negative anomalies in vorticity were detected, reflecting an intensification of clockwise circulation.
Hydrodynamically, the guiding dikes constrained and redirected river inflows, thereby enhancing shear and vorticity in the vicinity of the river mouths. This increase in vorticity promoted secondary circulations and turbulent eddies, which in turn amplified vertical mixing. The intensified negative vorticity observed in winter indicates a reinforced clockwise circulation, producing a less stable flow regime conducive to the downward transport of oxygen-rich surface water. Importantly, snowmelt inflows during late winter and early spring further augmented river discharge, strengthening density contrasts and amplifying the mixing response to the guiding dikes. Thus, the dikes acted as hydrodynamic catalysts, coupling river-driven momentum input with basin-scale circulation, and establishing a mechanistic link between vorticity modification and enhanced vertical mixing.
Figure 6 shows the vertical distribution of differences in Brunt–Väisälä frequency between the Baseline and Cases 1–4 at Imazu-oki, expressed as seasonal averages for spring (April–June), summer (July–September), autumn (October–December), and winter (January–March). Following the installation of guiding dikes, reductions in Brunt–Väisälä frequency emerged at depths of 10–20 m below the thermocline during spring and summer, intensified at 30–50 m in autumn, and extended to depths exceeding 60 m in winter. The progressive deepening and weakening of the thermocline evident in Figure 6 reflect a direct consequence of vorticity-driven enhancement of vertical mixing induced by the dikes.
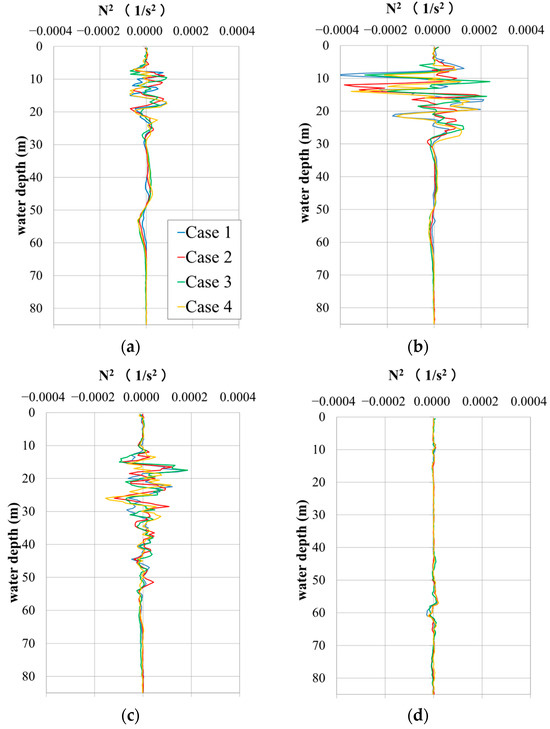
Figure 6.
The vertical distribution of the differences in Brunt–Väisälä frequency between the Baseline and Cases 1–4 at Imazu-oki in (a) Spring, (b) Summer, (c) Autumn, (d) Winter.
Snowmelt-derived river inflows, characterized by relatively low temperature and density in spring, further destabilized stratification and amplified the mixing response. By facilitating the downward transport of oxygen-rich surface water into oxygen-depleted bottom layers, the guiding dikes mitigated seasonal hypoxia and delayed the onset of critical oxygen thresholds. This process improved habitat conditions for benthic communities and reduced the likelihood of nutrient release from anoxic sediments, thereby strengthening ecosystem resilience.
Collectively, these findings demonstrate that guiding dikes not only redirected horizontal inflows but also triggered density instabilities that promoted vertical exchange, establishing a mechanistic link between engineered flow control, enhanced bottom-water oxygenation, and ecological recovery. This highlights the potential of hydrodynamic interventions as an adaptive strategy for sustaining water quality and biodiversity in enclosed aquatic systems under increasing climatic stress.
Table 4 show the differences in Brunt–Väisälä frequency between the Baseline and Cases 1–3 during the winter season. Figure 7 presents the north–south cross-sectional distributions of (a) Brunt–Väisälä frequency and (b) vertical velocity along the outflow axis of the Ane River for the Baseline and Cases 1–4 on 17 February 2008. On this date, a high precipitation event led to increased river discharge, clearly revealing the effects of the guiding dikes. Compared to the Baseline, Cases 1–4—where guiding dikes were implemented at the Ane River—exhibited a marked reduction in Brunt–Väisälä frequency and an enhancement of downward (negative) vertical velocity offshore of the river mouth. These results suggest that the inflow of snowmelt water was channeled along the guiding dike toward the bottom layer, thereby promoting vertical mixing. Furthermore, in Cases 2 and 4, negative vertical velocities were also observed beyond the immediate vicinity of the Ane River, accompanied by a broader distribution of low Brunt–Väisälä frequency zones.

Table 4.
The differences in Brunt–Väisälä frequency between the Baseline and Cases 1–3 during the winter season.
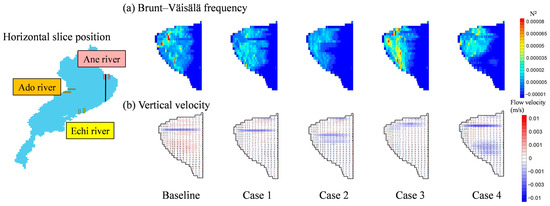
Figure 7.
The north–south cross-sectional distributions of (a) Brunt–Väisälä frequency and (b) vertical velocity along the outflow axis of the Ane River for the Baseline and Cases 1–4 on 17 February 2008.
Figure 8 shows the east–west cross-sectional distributions of (a) Brunt–Väisälä frequency and (b) vertical velocity along the vicinity of the Ado River for the Baseline and Cases 1–4 on the same date. In Cases 2–4, where guiding dikes were installed at the Ado River, a reduction in Brunt–Väisälä frequency and an increase in downward vertical velocity were observed offshore of the river mouth. In particular, Case 4 exhibited a stronger downward vertical velocity than the other cases. These findings suggest that higher guiding dikes may enhance the penetration of riverine water into the deeper layers of the lake by suppressing lateral diffusion.
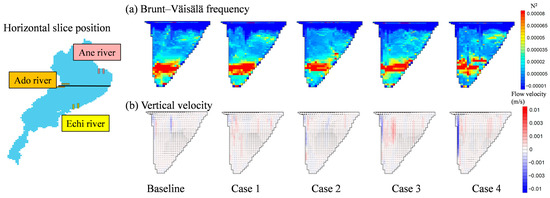
Figure 8.
The east–west cross-sectional distributions of (a) Brunt–Väisälä frequency and (b) vertical velocity along the vicinity of the Ado River for the Baseline and Cases 1–4 on 17 February 2008.
3.3. Seasonal Responses of Dissolved Oxygen to Guiding Dike Implementation
Figure 9 presents the time series of dissolved oxygen (DO) concentrations at Imazu-oki for the Baseline and Cases 1–4. The installation of guiding dikes generally resulted in lower DO concentrations around the thermocline compared to the Baseline. This reduction is likely attributable to enhanced mixing near the thermocline caused by the dike installation, which increased water temperature in this layer and consequently lowered the oxygen saturation concentration. Since Figure 9 does not show a clear difference in the bottom-layer DO concentrations among the cases, the difference values were calculated and are presented in Figure 10.
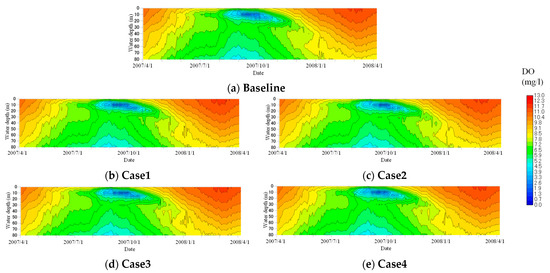
Figure 9.
The time series of dissolved oxygen (DO) concentration in case of the Baseline and Cases 1–4 at Imazu-oki.
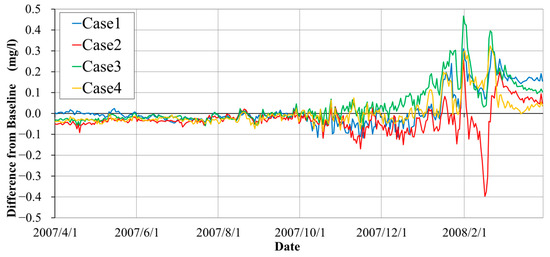
Figure 10.
The time series of the differences in dissolved oxygen (DO) concentration between the Baseline and Cases 1–4 at a depth of 80 m at Imazu-oki.
Figure 10 shows the time series of the differences in dissolved oxygen (DO) concentration between the Baseline and Cases 1–4 at a depth of 80 meters at Imazu-oki. As hypoxia tends to develop near the lake bottom, the comparison focuses on 80 m depth, where oxygen depletion is most likely to occur.
From spring through autumn, the differences in DO concentration between the Baseline and Cases 1–4 remained within ±0.1 mg/L, indicating minimal changes. This suggests that although some vertical mixing occurred in the bottom water layer, it did not substantially alter the DO concentrations during this period. In contrast, during the winter season, localized increases in DO concentration were observed near the bottom in response to the installation of guiding dikes. Notably, in early February, Case 3 exhibited a maximum DO increase of approximately 0.4 mg/L. In Case 2, a temporary decrease in DO concentration was observed in February. This was likely due to vertical mixing between bottom water and the slightly warmer water just above, which led to warming of the bottom water and a consequent reduction in the saturation concentration of dissolved oxygen. However, by mid-February, DO levels in Case 2 began to recover, and by the end of the period, all cases showed higher DO concentrations than the Baseline. These results demonstrate that guiding dikes can modestly enhance oxygen supply to the bottom layer, particularly during winter, thereby supporting compliance with the 2 mg L−1 habitat threshold critical for sustaining benthic ecosystems.
4. Discussions
Building on the results, this study demonstrates that guiding dikes reshape flow fields at river mouths and channel snowmelt inflows into deeper strata, thereby enhancing vertical mixing and alleviating seasonal hypoxia in Lake Biwa. The horizontal velocity anomalies observed near river mouths (Figure 5) were associated with intensified vorticity (Table 3), indicating that inflow redirection by guiding dikes increased shear and promoted secondary circulations. This hydrodynamic response was further confirmed by vertical profiles of Brunt–Väisälä frequency and vertical velocity (Figure 6, Figure 7 and Figure 8), which consistently revealed reductions in stratification strength and enhanced downward velocities, particularly during winter. Collectively, these results establish a mechanistic link between inflow guidance, vorticity modification, and vertical mixing that ultimately alleviates seasonal hypoxia in Lake Biwa. In winter, when stratification weakens, guided inflows promoted downward velocities and reduced buoyancy frequency, leading to localized increases in bottom dissolved oxygen (DO) of up to 0.4 mg L−1.This finding highlights that guiding dikes can passively exploit natural density contrasts to improve hypolimnetic ventilation without external energy input.
Extensive work has been devoted to engineered interventions that counteract hypolimnetic oxygen depletion in lakes and reservoirs. Hypolimnetic aeration and oxygenation (HA/HO) systems have been implemented in numerous reservoirs worldwide, achieving sustained oxygenation of bottom waters. For instance, Austin et al. [35] reported hypolimnetic oxygen additions of up to 6500 kg O2 per day, effectively preventing anoxia in two Midwestern reservoirs. Similarly, Beutel et al. [21] synthesized decades of applications, concluding that HO/HA consistently enhances bottom DO while suppressing internal phosphorus release. These interventions, however, rely on continuous external energy inputs and complex infrastructure, making them costly and operationally intensive. By contrast, guiding dikes function passively, relying on natural inflows to achieve comparable hypolimnetic oxygen improvements, albeit on more localized spatial and temporal scales.
Artificial downwelling and density-current diffusers represent another class of interventions. Chaaya et al. [36] reviewed such systems, noting their ability to drive oxygen-rich surface water below the pycnocline, thereby ventilating hypoxic layers. Recent optimization studies in coastal systems have further demonstrated the potential of strategically placed oxygenation systems to suppress hypoxia [37]. The mechanism identified in the present study—guiding snowmelt inflows along dikes into the hypolimnion—mirrors these artificial downwelling strategies, but without the need for mechanical pumping. This suggests that guiding dikes could be regarded as a “low-energy analogue” of artificial downwelling, with design geometry substituting for mechanical forcing.
Selective withdrawal offers yet another point of comparison. Zouabi-Aloui et al. [38] and subsequent modeling studies demonstrated that adjusting withdrawal depth in reservoirs can destabilize stratification and influence hypolimnetic oxygen dynamics. While selective withdrawal manipulates the outflow side, guiding dikes manipulate the inflow side, redirecting density currents to deepen penetration and mixing. Together, these approaches highlight the potential of coordinated inflow–outflow management to achieve system-wide improvements in oxygen dynamics.
The key novelty of this study lies in clarifying a mechanistic pathway that links inflow guidance by guiding dikes to vorticity modification, enhanced vertical mixing, and ultimately hypoxia alleviation. Unlike hypolimnetic aeration/oxygenation or artificial downwelling systems, which depend on continuous external oxygen supply or mechanical pumping, guiding dikes operate passively by reshaping natural density currents. This passive redirection induces shear and baroclinic instabilities at the inflow front, strengthening vertical exchanges and facilitating oxygen transport into the hypolimnion. By demonstrating that structural interventions can trigger inherent hydrodynamic instabilities to achieve bottom oxygenation, the present study expands the conceptual framework of hypoxia mitigation beyond direct oxygen supplementation, establishing structural modulation of natural flow dynamics as a viable and sustainable alternative.
The results further reveal that the effectiveness of guiding dikes is seasonally contingent, being greatest in winter when stratification weakens and density contrasts are maximized by snowmelt inflows. This seasonal specificity provides a new perspective on hypoxia control: rather than constant intervention, targeted enhancement of winter mixing can deliver oxygen to the hypolimnion before the onset of summer stratification, potentially improving resilience against seasonal oxygen depletion.
Despite their promise, guiding dikes are not a universal remedy. Their efficacy depends on sufficient density contrasts in inflowing rivers; under warm-winter conditions, when snowmelt fails to cool adequately, inflows may remain trapped in the mid-layer, reducing ventilation benefits. Similarly, the spatial extent of oxygenation is limited to zones influenced by river plumes, contrasting with the broader coverage achievable by HO/HA systems. These constraints highlight the need for integrative designs that combine guiding dikes with other interventions—for example, using selective withdrawal to complement inflow guidance, or deploying low-intensity oxygenation systems during anomalously warm winters.
Future research should focus on three directions: (i) optimizing dike geometry (height, length, orientation, and offshore extent) for maximum mixing efficiency; (ii) testing robustness under climate change scenarios with long-term coupled simulations; and (iii) comparative analyses in other enclosed and semi-enclosed systems, from stratified reservoirs to coastal seas such as the Baltic Sea [39,40], to evaluate generalizability.
The findings of this study contribute to a growing recognition that structural flow modifications can be as effective as direct oxygen supply in mitigating hypoxia. Just as hypolimnetic oxygenation systems have evolved into key management tools for eutrophic lakes, guiding dikes may represent a scalable, energy-efficient complement, particularly suited to freshwater systems with significant seasonal inflows. By explicitly linking structural interventions to hydrodynamic instabilities and biogeochemical responses, this study provides a transferable framework for designing adaptive strategies in lakes and semi-enclosed seas worldwide.
5. Conclusions
The implementation of guiding dikes was found to significantly alter both horizontal advection and vertical mixing dynamics in Lake Biwa. Seasonal variations in horizontal flow fields revealed pronounced changes in vorticity, particularly during winter, when weakened stratification allowed bottom-layer flows to be more readily supplied. In terms of vertical mixing, the buoyancy frequency exhibited depth-dependent fluctuations that reflected seasonal stratification. Notably, during winter, rivers equipped with guiding dikes exhibited distinct reductions in buoyancy frequency and enhanced downward (negative) vertical velocity, suggesting that snowmelt inflows traveled along the dikes to the lake bottom, thereby promoting vertical mixing.
This enhanced vertical mixing led to improved oxygen supply to the bottom layer. From spring through autumn, mixing of bottom water masses induced only minor changes in dissolved oxygen concentrations. However, in winter, intensified vertical mixing driven by the guiding dikes locally increased bottom-layer dissolved oxygen concentrations by up to 0.4 mg L−1.
These results indicate that appropriately designed guiding dikes can effectively enhance bottom-layer oxygenation, particularly during periods of weakened stratification. By exploiting natural density currents rather than relying on external oxygen supply, guiding dikes offer a sustainable complement to conventional interventions.
Funding
This research was partially supported by the Ministry of the Environment and the Environmental Restoration and Conservation Agency (2RL-2301).
Data Availability Statement
The original contributions presented in this study are included in the article. Further inquiries can be directed to the corresponding author.
Acknowledgments
The conduction of simulation was supported by Ryuto Kawamura.
Conflicts of Interest
The author declares no conflicts of interest.
References
- Schmidtko, S.; Stramma, L.; Visbeck, M. Decline in global oceanic oxygen content during the past five decades. Nature 2017, 542, 335–339. [Google Scholar] [CrossRef]
- Breitburg, D.; Levin, L.A.; Oschlies, A.; Grégoire, M.; Chavez, F.P.; Conley, D.J.; Garçon, V.; Gilbert, D.; Gutiérrez, D.; Isensee, K.; et al. Declining oxygen in the global ocean and coastal waters. Science 2018, 359, eaam7240. [Google Scholar] [CrossRef]
- Jambeck, J.R.; Geyer, R.; Wilcox, C.; Siegler, T.R.; Perryman, M.; Andrady, A.; Narayan, R.; Law, K.L. Plastic waste inputs from land into the ocean. Science 2015, 347, 768–771. [Google Scholar] [CrossRef]
- Geyer, R.; Jambeck, J.R.; Law, K.L. Production, use, and fate of all plastics ever made. Sci. Adv. 2017, 3, e1700782. [Google Scholar] [CrossRef] [PubMed]
- Law, K.L.; Morét-Ferguson, S.; Maximenko, N.A.; Proskurowski, G.; Peacock, E.E.; Hafner, J.; Reddy, C.M. Plastic accumulation in the North Atlantic subtropical gyre. Science 2010, 329, 1185–1188. [Google Scholar] [CrossRef]
- Nerem, R.S.; Beckley, B.D.; Fasullo, J.T.; Hamlington, B.D.; Masters, D.; Mitchum, G.T. Climate-change–driven accelerated sea-level rise detected in the altimeter era. Proc. Natl. Acad. Sci. USA 2018, 115, 2022–2025. [Google Scholar] [CrossRef] [PubMed]
- Rabalais, N.N.; Diaz, R.J.; Levin, L.A.; Turner, R.E.; Gilbert, D.; Zhang, J. Dynamics and distribution of natural and human-caused hypoxia. Biogeosciences 2010, 7, 585–619. [Google Scholar] [CrossRef]
- Vaquer-Sunyer, R.; Duarte, C.M. Thresholds of hypoxia for marine biodiversity. Proc. Natl. Acad. Sci. USA 2008, 105, 15452–15457. [Google Scholar] [CrossRef] [PubMed]
- Diaz, R.J.; Rosenberg, R. Spreading dead zones and consequences for marine ecosystems. Science 2008, 321, 926–929. [Google Scholar] [CrossRef]
- Paerl, H.W.; Paul, V.J. Climate change: Links to global expansion of harmful cyanobacteria. Water Res. 2012, 46, 1349–1363. [Google Scholar] [CrossRef]
- Adrian, R.; O’Reilly, C.M.; Zagarese, H.; Baines, S.B.; Hessen, D.O.; Keller, W.; Livingstone, D.M.; Sommaruga, R.; Straile, D.; van Donk, E.; et al. Lakes as sentinels of climate change. Limnol. Oceanogr. 2009, 54, 2283–2297. [Google Scholar] [CrossRef] [PubMed]
- Woolway, R.I.; Merchant, C.J. Worldwide alteration of lake mixing regimes in response to climate change. Nat. Geosci. 2019, 12, 271–276. [Google Scholar] [CrossRef]
- Woolway, R.I.; Merchant, C.J.; Van Den Hoek, J.; Azorin-Molina, C.; Nõges, P.; Laas, A.; Mackay, E.B.; Jones, I.D. Northern Hemisphere atmospheric stilling accelerates lake thermal responses to a warming world. Geophys. Res. Lett. 2019, 46, 11983–11992. [Google Scholar] [CrossRef]
- O’Reilly, C.M.; Sharma, S.; Gray, D.K.; Hampton, S.E.; Read, J.S.; Rowley, R.J.; Zhang, G. Rapid and highly variable warming of lake surface waters around the globe. Geophys. Res. Lett. 2015, 42, 10–773. [Google Scholar] [CrossRef]
- Williamson, C.E.; Saros, J.E.; Vincent, W.F.; Smol, J.P. Lakes and reservoirs as sentinels, integrators, and regulators of climate change. Limnol. Oceanogr. 2009, 54, 2273–2282. [Google Scholar] [CrossRef]
- Jane, S.F.; Hansen, G.J.; Kraemer, B.M.; Leavitt, P.R.; Mincer, J.L.; North, R.L.; Rose, K.C. Widespread deoxygenation of temperate lakes. Nature 2021, 594, 66–70. [Google Scholar] [CrossRef]
- Koue, J.; Shimadera, H.; Matsuo, T.; Kondo, A. Evaluation of thermal stratification and flow field reproduced by a three-dimensional hydrodynamic model in Lake Biwa, Japan. Water 2018, 10, 47. [Google Scholar] [CrossRef]
- Osaka, K.I.; Yokoyama, R.; Ishibashi, T.; Goto, N. Effect of dissolved oxygen on nitrogen and phosphorus fluxes from lake sediments and their thresholds based on incubation using a simple and stable dissolved oxygen control method. Limnol. Oceanogr. Methods 2022, 20, 1–14. [Google Scholar] [CrossRef]
- Nakashima, Y.; Shimizu, A.; Maruo, M.; Sohrin, Y. Trace elements influenced by environmental changes in Lake Biwa:(I) Seasonal variations under suboxic hypolimnion conditions during 2007 and 2009. Limnology 2016, 17, 151–162. [Google Scholar] [CrossRef]
- Nakada, S.; Imai, A.; Shimotori, K.; Yamada, K.; Yamamoto, H.; Okamoto, T. What interrupted monomictic mixing in Lake Biwa? Heat budget analysis using a circulation model. Hydrol. Sci. J. 2023, 68, 2298–2316. [Google Scholar] [CrossRef]
- Beutel, M.W.; Horne, A.J. A review of the effects of hypolimnetic oxygenation on lake and reservoir water quality. Lake Reserv. Manag. 1999, 15, 285–297. [Google Scholar] [CrossRef]
- Gantzer, P.A.; Bryant, L.D.; Little, J.C. Effect of hypolimnetic oxygenation on oxygen depletion rates in two water-supply reservoirs. Water Res. 2009, 43, 1700–1710. [Google Scholar] [CrossRef] [PubMed]
- Singleton, V.L.; Rueda, F.J.; Little, J.C. A coupled bubble plume–reservoir model for hypolimnetic oxygenation. Water Resour. Res. 2010, 46, 12. [Google Scholar] [CrossRef]
- Liu, S.; Zhao, L.; Xiao, C.; Fan, W.; Cai, Y.; Pan, Y.; Chen, Y. Review of artificial downwelling for mitigating hypoxia in coastal waters. Water 2020, 12, 2846. [Google Scholar] [CrossRef]
- Spearman, J.R.; Dearnaley, M.P.; Dennis, J.M. A simulation of estuary response to training wall construction using a regime approach. Coast. Eng. 1998, 33, 71–89. [Google Scholar] [CrossRef]
- Luan, H.L.; Ding, P.X.; Wang, Z.B.; Yang, S.L.; Lu, J.Y. Morphodynamic impacts of large-scale engineering projects in the Yangtze River delta. Coast. Eng. 2018, 141, 1–11. [Google Scholar] [CrossRef]
- Geyer, W.R.; MacCready, P. The estuarine circulation. Annu. Rev. Fluid Mech. 2014, 46, 175–197. [Google Scholar] [CrossRef]
- Li, X.; Liu, J.P.; Tian, B. Evolution of the Jiuduansha wetland and the impact of navigation works in the Yangtze Estuary, China. Geomorphology 2016, 253, 328–339. [Google Scholar] [CrossRef]
- Vinçon-Leite, B.; Casenave, C. Modelling eutrophication in lake ecosystems: A review. Sci. Total Environ. 2019, 651, 2985–3001. [Google Scholar] [CrossRef]
- Bruggeman, J.; Bolding, K. A general framework for aquatic biogeochemical models. Environ. Model. Softw. 2014, 61, 249–265. [Google Scholar] [CrossRef]
- Koue, J.; Shimadera, H.; Matsuo, T.; Kondo, A. Numerical simulation for seasonal and inter-annual change of dissolved oxygen in lake biwa, Japan. GEOMATE J. 2020, 18, 56–61. [Google Scholar] [CrossRef]
- Koue, J. Influence of Nutrient Desorbed from Sediments and Density Variations Driven by Organic Matter on Flow Patterns in Closed Water Bodies. Water 2025, 17, 100. [Google Scholar] [CrossRef]
- Cheng, T.; Wang, J.; Sui, J.; Zhao, H.; Hao, Z.; Huang, M.; Li, Z. A New Approach for Assessing Heat Balance State along a Water Transfer Channel during Winter Periods. Water 2022, 14, 3269. [Google Scholar] [CrossRef]
- Shrestha, K.L.; Kondo, A. Assessment of the Water Resource of the Yodo River Basin in Japan Using a Distributed Hydrological Model Coupled with WRF Model. In Environmental Management of River Basin Ecosystems; Part of the Series Springer Earth System Sciences; Springer: Berlin, Germany, 2015; pp. 137–160. [Google Scholar]
- Austin, D.; Scharf, R.; Chen, C.F.; Bode, J. Hypolimnetic oxygenation and aeration in two Midwestern USA reservoirs. Lake Reserv. Manag. 2019, 35, 266–276. [Google Scholar] [CrossRef]
- Chaaya, F.; Miller, B.; Gordos, M.; Tamburic, B.; Felder, S. Artificial destratification options for reservoir management. Sci. Total Environ. 2025, 967, 178738. [Google Scholar] [CrossRef]
- Li, Y.; Huang, T.; Tan, X.; Zhou, Z.; Ma, W. Destratification and oxygenation efficiency of a water-lifting aerator system in a deep reservoir: Implications for optimal operation. J. Environ. Sci. 2018, 73, 9–19. [Google Scholar] [CrossRef] [PubMed]
- Zouabi-Aloui, B.; Adelana, S.M.; Gueddari, M. Effects of selective withdrawal on hydrodynamics and water quality of a thermally stratified reservoir in the southern side of the Mediterranean Sea: A simulation approach. Environ. Monit. Assess. 2015, 187, 292. [Google Scholar] [CrossRef] [PubMed]
- Carstensen, J.; Conley, D.J.; Almroth-Rosell, E.; Asmala, E.; Bonsdorff, E.; Fleming-Lehtinen, V.; Gustafsson, B.G.; Gustafsson, C.; Heiskanen, A.S.; Janas, U.; et al. Factors regulating the coastal nutrient filter in the Baltic Sea. Ambio 2020, 49, 1194–1210. [Google Scholar] [CrossRef] [PubMed]
- Mi, C.; Rinke, K.; Shatwell, T. Optimizing selective withdrawal strategies to mitigate hypoxia under water-level reduction in Germany’s largest drinking water reservoir. J. Environ. Sci. 2024, 146, 127–139. [Google Scholar] [CrossRef]
Disclaimer/Publisher’s Note: The statements, opinions and data contained in all publications are solely those of the individual author(s) and contributor(s) and not of MDPI and/or the editor(s). MDPI and/or the editor(s) disclaim responsibility for any injury to people or property resulting from any ideas, methods, instructions or products referred to in the content. |
© 2025 by the author. Licensee MDPI, Basel, Switzerland. This article is an open access article distributed under the terms and conditions of the Creative Commons Attribution (CC BY) license (https://creativecommons.org/licenses/by/4.0/).