1. Introduction
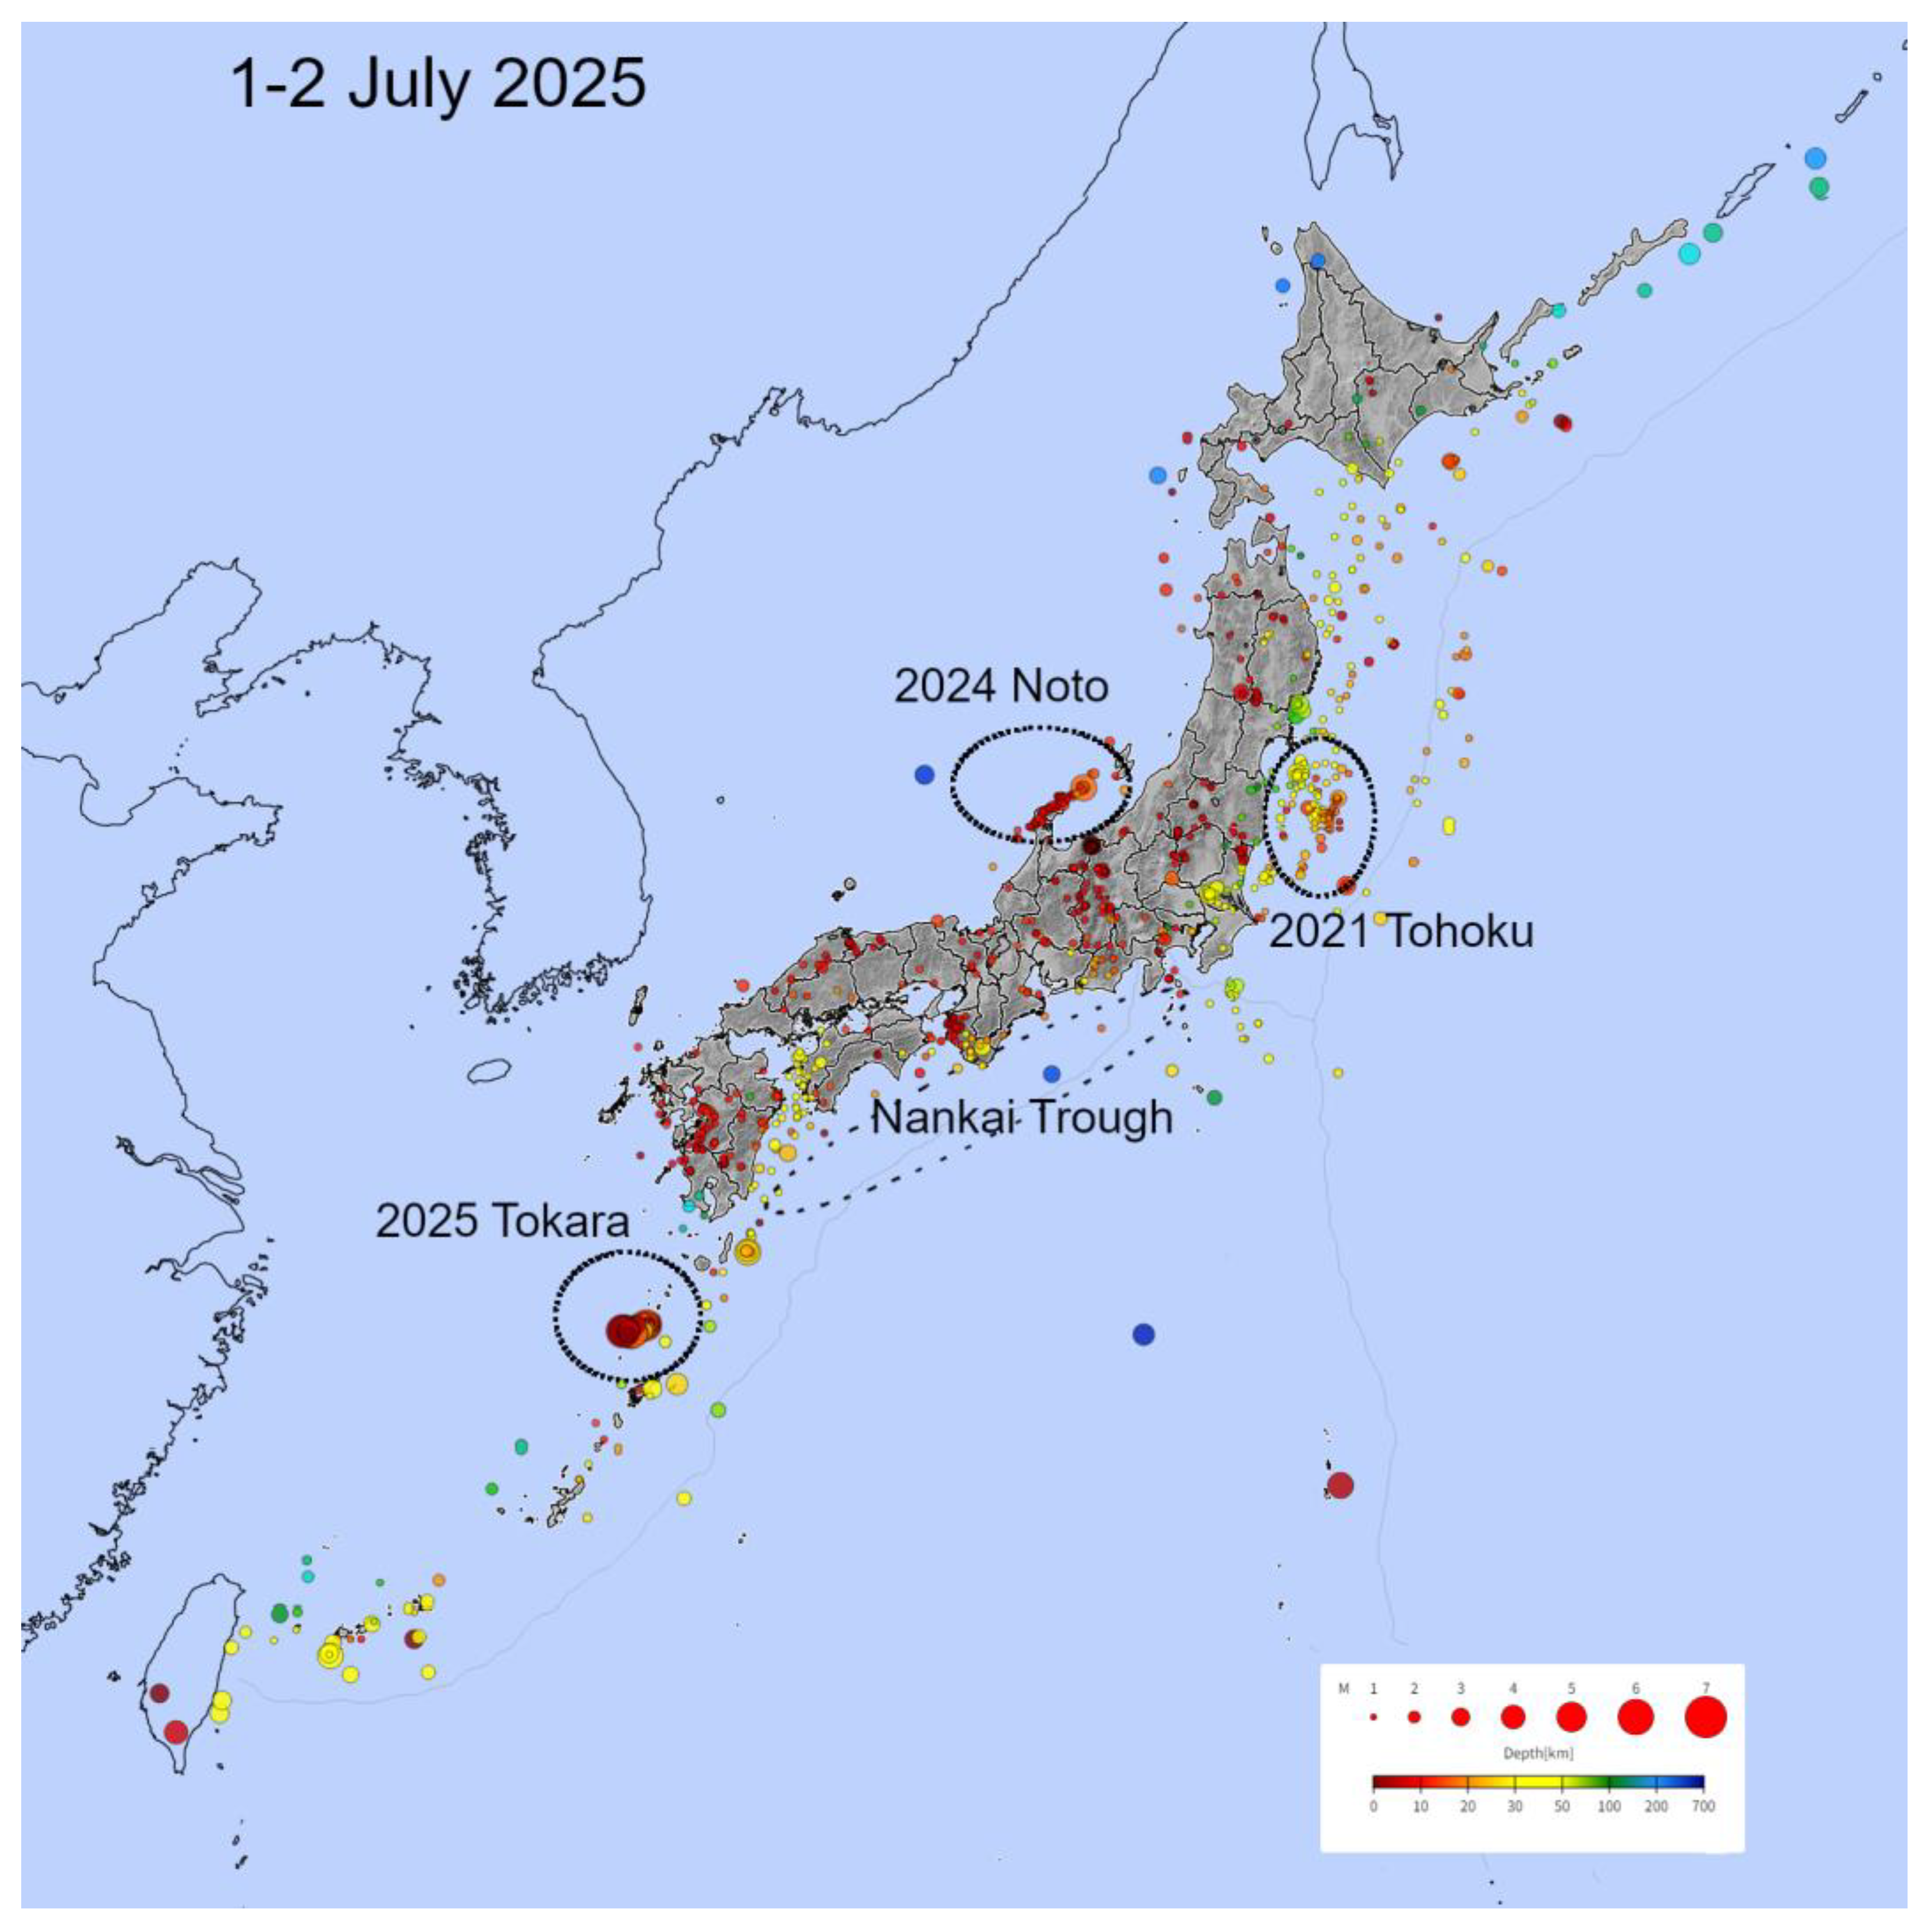
Recently, a month-long earthquake swarm has been occurring in the Tokara Islands, a volcanic archipelago situated in the southern seas, at a considerable distance from Japan’s main islands (
Figure 1) [
1,
2]. This has happened over 2000 times to date. This region encompasses the Kikai Caldera, which experienced a supervolcanic eruption approximately 7300 years ago [
3,
4], and represents the southern terminus of the Nankai Trough [
5], a zone of significant seismic concern. The Nankai Trough, a major subduction zone, spans roughly half of Japan’s Pacific coastline, where the Philippine Sea Plate subducts beneath the Eurasian Plate (
Figure 1). Historically, this zone has produced major earthquakes of magnitude 8 or greater approximately every 100 to 150 years. Due to its extensive area, seismic activity often occurs at multiple locations with slight temporal variations. The most recent significant earthquake sequence in this region occurred between 1944 and 1946, indicating that approximately 80 years have elapsed since then. The Tokara Islands, situated within this subduction zone, are part of a volcanic island chain susceptible to strike-slip faulting, volcanic eruptions, and frequent earthquake swarms [
1,
2]. Furthermore, in addition to the Kikai Caldera, nearby Kyushu Island has experienced supervolcanic eruptions, including those at Aira, Aso, and Ata, over the past 100,000 years, each resulting in the formation of large calderas.
Consequently, speculation regarding catastrophic eruptions and earthquakes has proliferated across social media platforms, prompting official denials from the Japan Meteorological Agency (JMA). However, a comprehensive explanation of the current seismic activity remains absent. This study attempts to provide such an explanation through the application of Exploratory Data Analysis (EDA), a contemporary statistical methodology. The application of EDA has revealed distinct distributional characteristics for earthquake intervals and magnitudes [
6]. EDA facilitates data analysis by visualising patterns while identifying an optimal statistical model. The primary method employed here is the quantile–quantile (QQ) plot, which compares the quantiles of the observed data with those of a theoretical distribution model. This approach enables a more rigorous assessment of distributional fit than a histogram; if the data conform to the model, the quantiles exhibit a linear relationship.
Specifically, earthquake intervals demonstrate exponential distribution, characterised by a single parameter, λ. The expected value and scale are both 1/λ; for instance, when λ = 1/6.8, an earthquake occurs, on average, every 6.8 h. In contrast, earthquake magnitudes conform to a normal distribution, defined by two parameters: μ (the mean) and σ (the standard deviation), representing the expected value and scale, respectively. This finding diverges from the long-established Gutenberg–Richter law, which typically describes earthquake magnitudes following a power-law distribution [
7]. By assuming a normal distribution for magnitudes, the likelihood of an earthquake of a specific magnitude can be estimated. For example, the z-score for a given magnitude is calculated as z = (magnitude − μ)/σ. Since the z-score follows a standard normal distribution,
N(0,1), a z-score of 2 corresponds to a probability of approximately 0.23% for a larger earthquake, as derived from standard normal distribution tables. This discovery enables precise measurement of parameters characterising seismic activity within specific temporal and spatial contexts, facilitating comparative analysis and evaluation.
The Tokara region has historically been characterised by frequent seismic activity. Several islands host active volcanoes, particularly Suwanose Island, which lies in proximity to the epicentral area and exhibits frequent eruptive behaviour. The relationship between volcanic and seismic phenomena is well-established; the energy released during tectonic plate movement may contribute to magma generation [
8,
9]. Seismic events may enhance volcanic eruption likelihood through induced strain [
10], whilst conversely, eruptions may trigger seismic activity. However, the relationship between eruptions and earthquakes at Suwanose Island demonstrates temporal complexity [
11]. During 2021, earthquake swarms occurred in April and December, about 300 times each, whilst eruptive activity continued throughout this period. The April swarm commenced approximately one week following a significant eruption, whereas the December swarm occurred several months subsequently. The spatial distribution of seismic events during this period exhibited similarities to the current earthquake swarm pattern. Presently, Suwanose Island has maintained volcanic activity since June 2023, with increased magma accumulation reported in May 2025. Many people living there are anxious and have evacuated, but this has had a major impact on the island’s main industries of livestock, fishing, and agriculture.
Figure 1.
Seismic records from 1 to 2 July, encompassing the full observation range of the epicentre, as monitored by JMA [
12]. The colour and size of the dots indicate the depth and the magnitude of the epicentre, respectively (bottom right). Notable aftershocks associated with the 2024 Noto and 2011 Tohoku earthquakes are evident. Additionally, the 2025 Tokara Islands earthquake swarm is highlighted with a circle. The approximate location of the Nankai Trough is also indicated.
4. Discussion
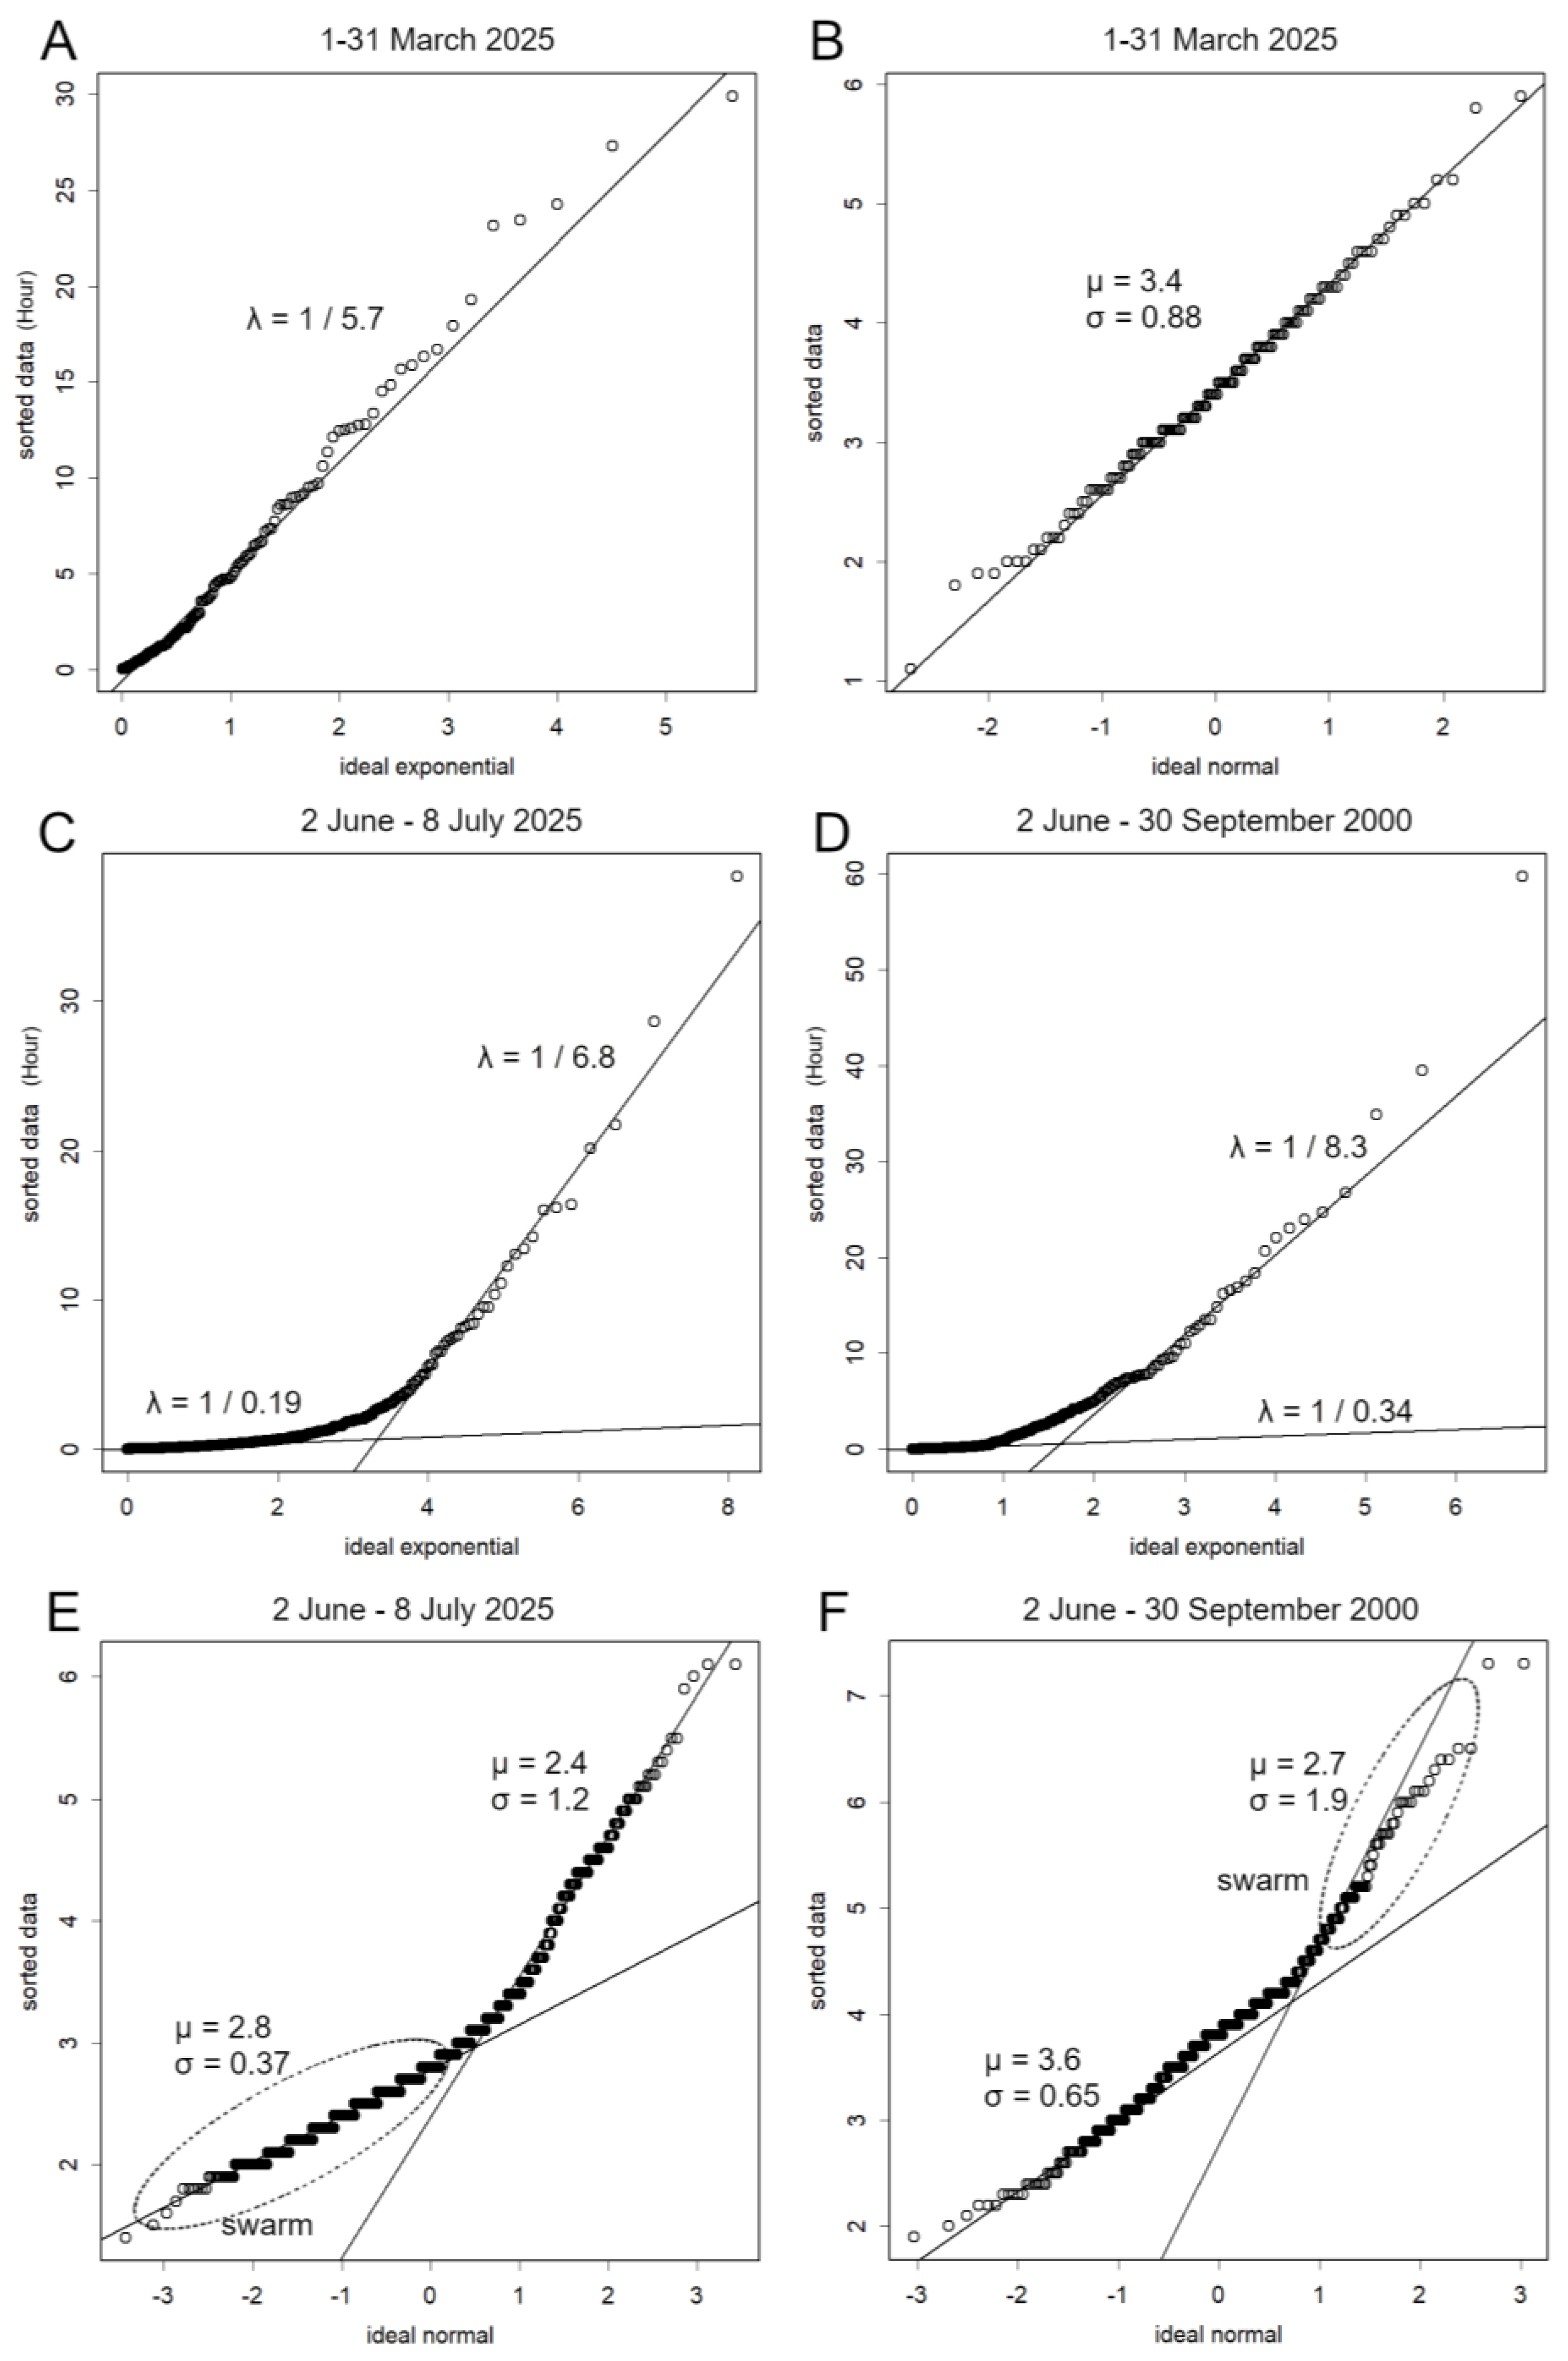
In the month preceding the Tohoku earthquake, the magnitudes’ σ reached 1.3 whilst μ was significantly elevated at 3.6 (
Figure S2). The frequency was exceptionally high, averaging 3.7 h even when earthquake swarm earthquakes were excluded from the analysis. This trend was particularly pronounced in the more immediate pre-seismic period, creating conditions conducive to large-magnitude earthquakes [
6]. The current situation in the Tokara Islands presents a markedly different pattern, characterised by lower σ values (
Figure 2). Consequently, there are presently no indications of an impending megathrust earthquake of Tohoku-class magnitude. Given that these data encompass the entirety of Japan, this suggests the absence of imminent major seismic activity across the Japanese archipelago.
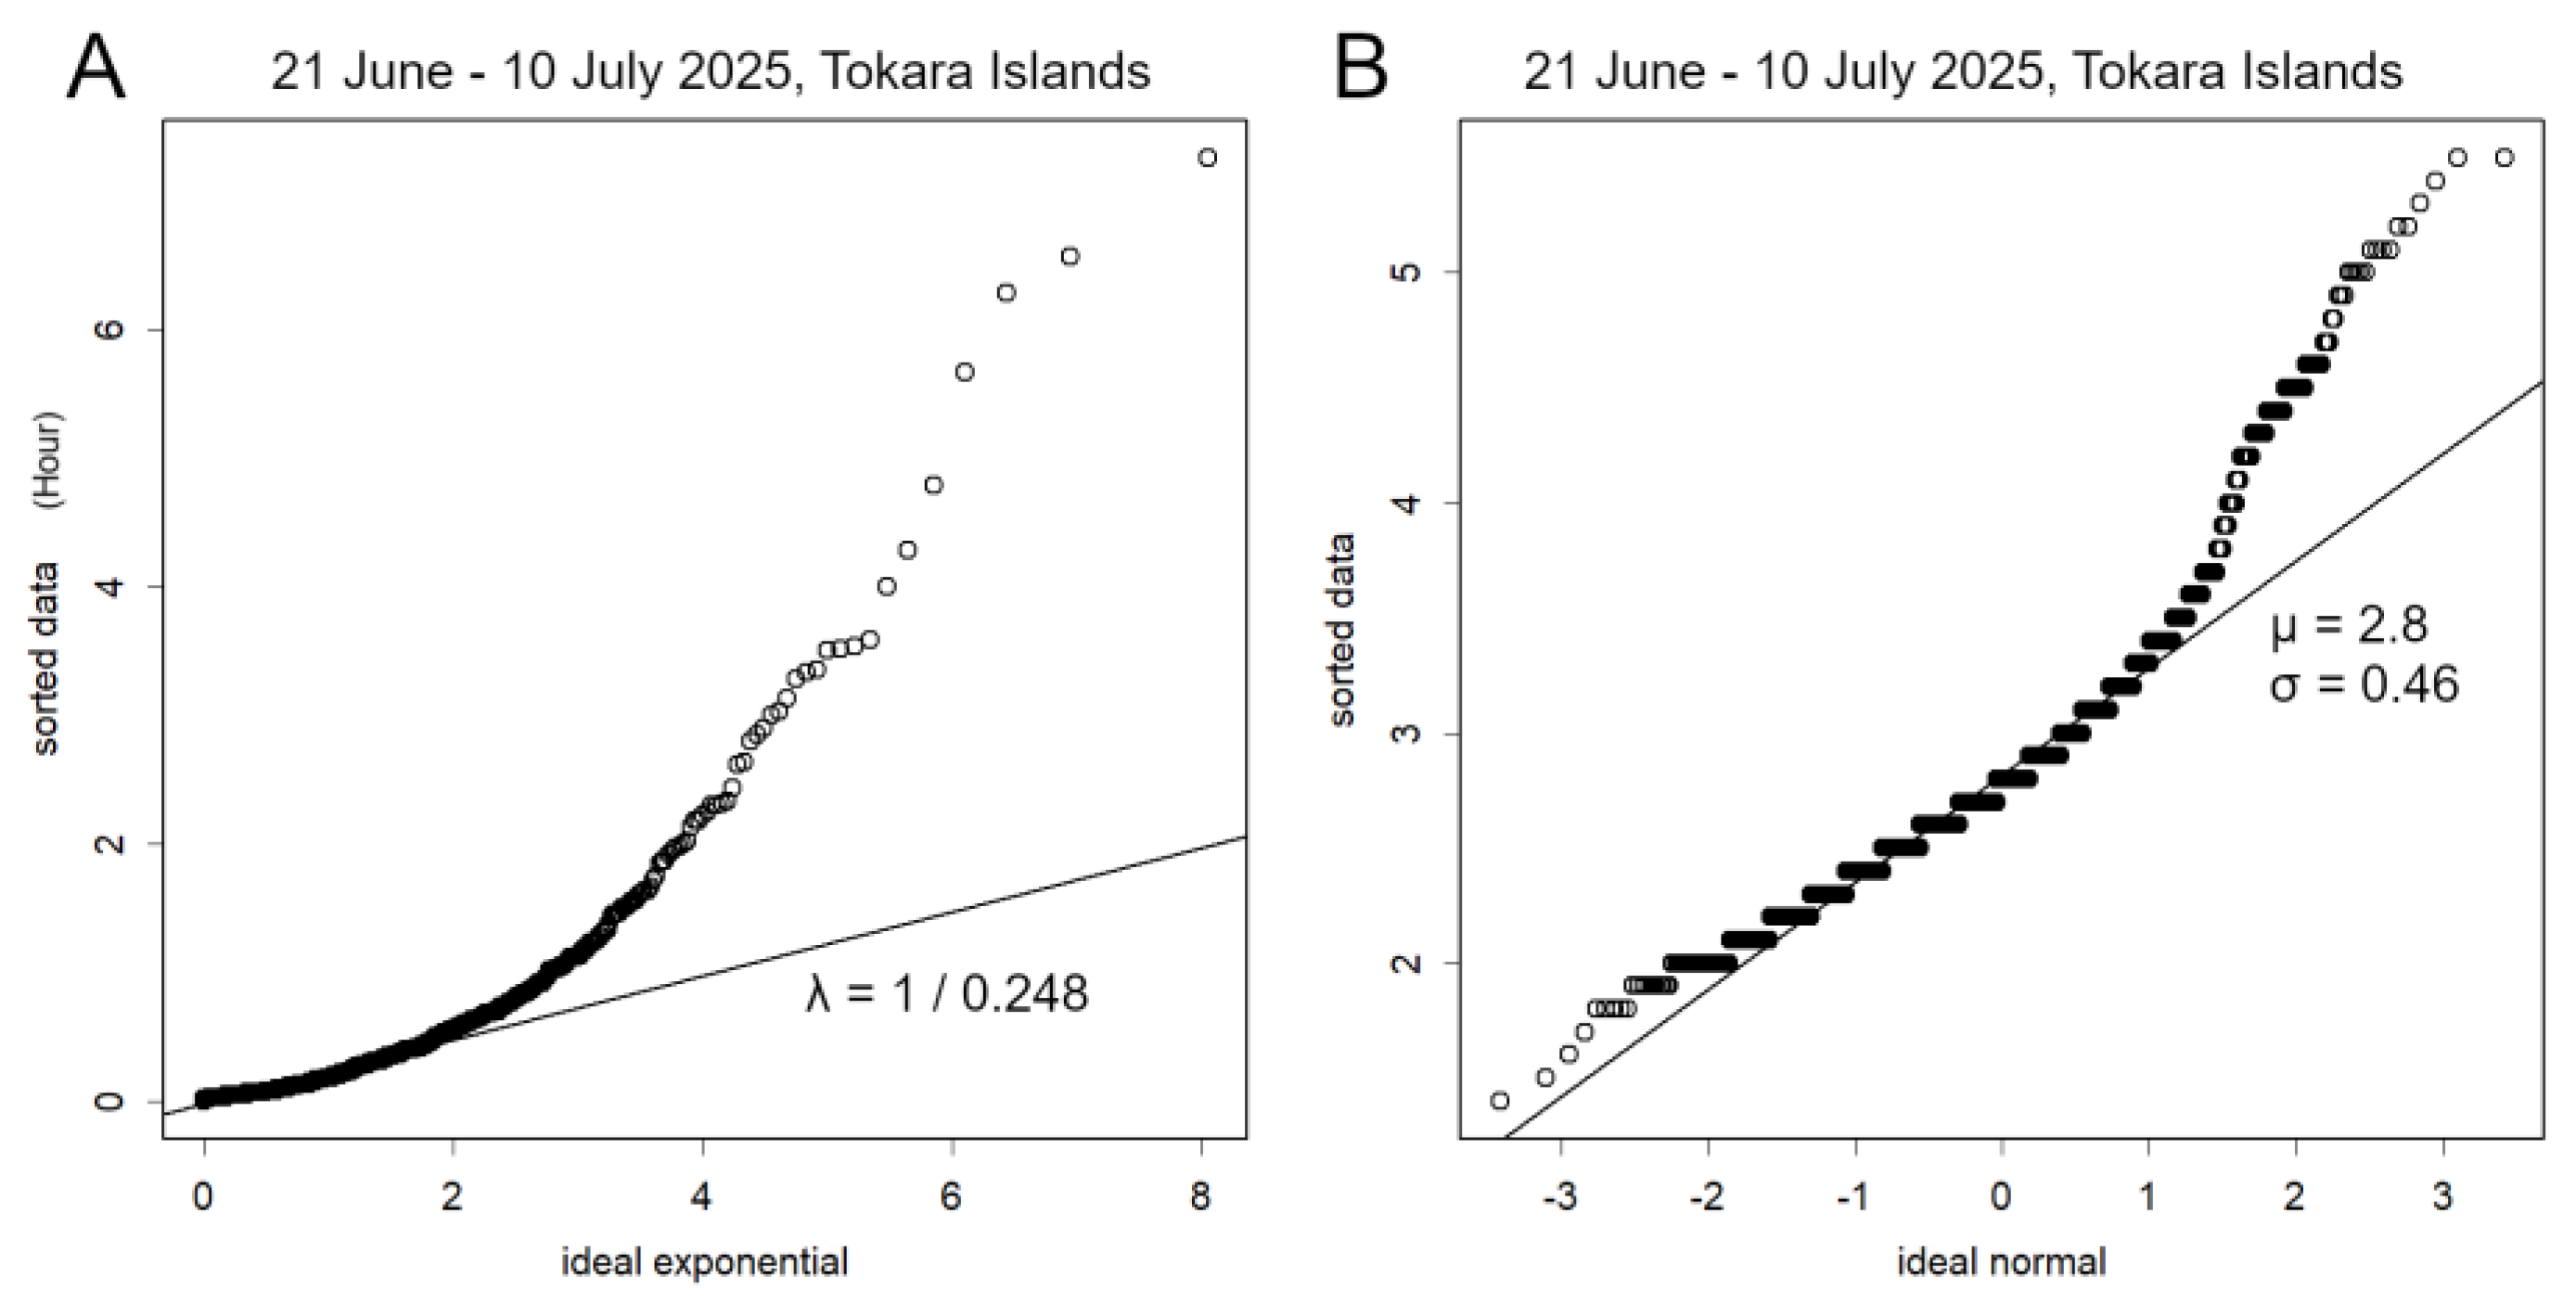
The magnitude distribution of earthquakes occurring between Akuseki and Takara Islands exhibits consistently low σ values, which have remained stable since 2021 (
Figure 3B). Therefore, high-magnitude earthquakes are not anticipated in this region, although frequent low-magnitude events will continue and σ is expected to increase as the swarm activity diminishes, hence occasional moderate events may occur stochastically. The relatively low energy signatures observed may be attributed to magma movement, which requires less energy than plate displacement due to magma’s lower viscosity compared to solid crustal material. In contrast, the earthquake swarms during the Miyake Island eruption may not have been primarily driven by magma movement but rather represented aftershock sequences from a major earthquake, with energy sources attributable to plate tectonics (
Figure 2D).
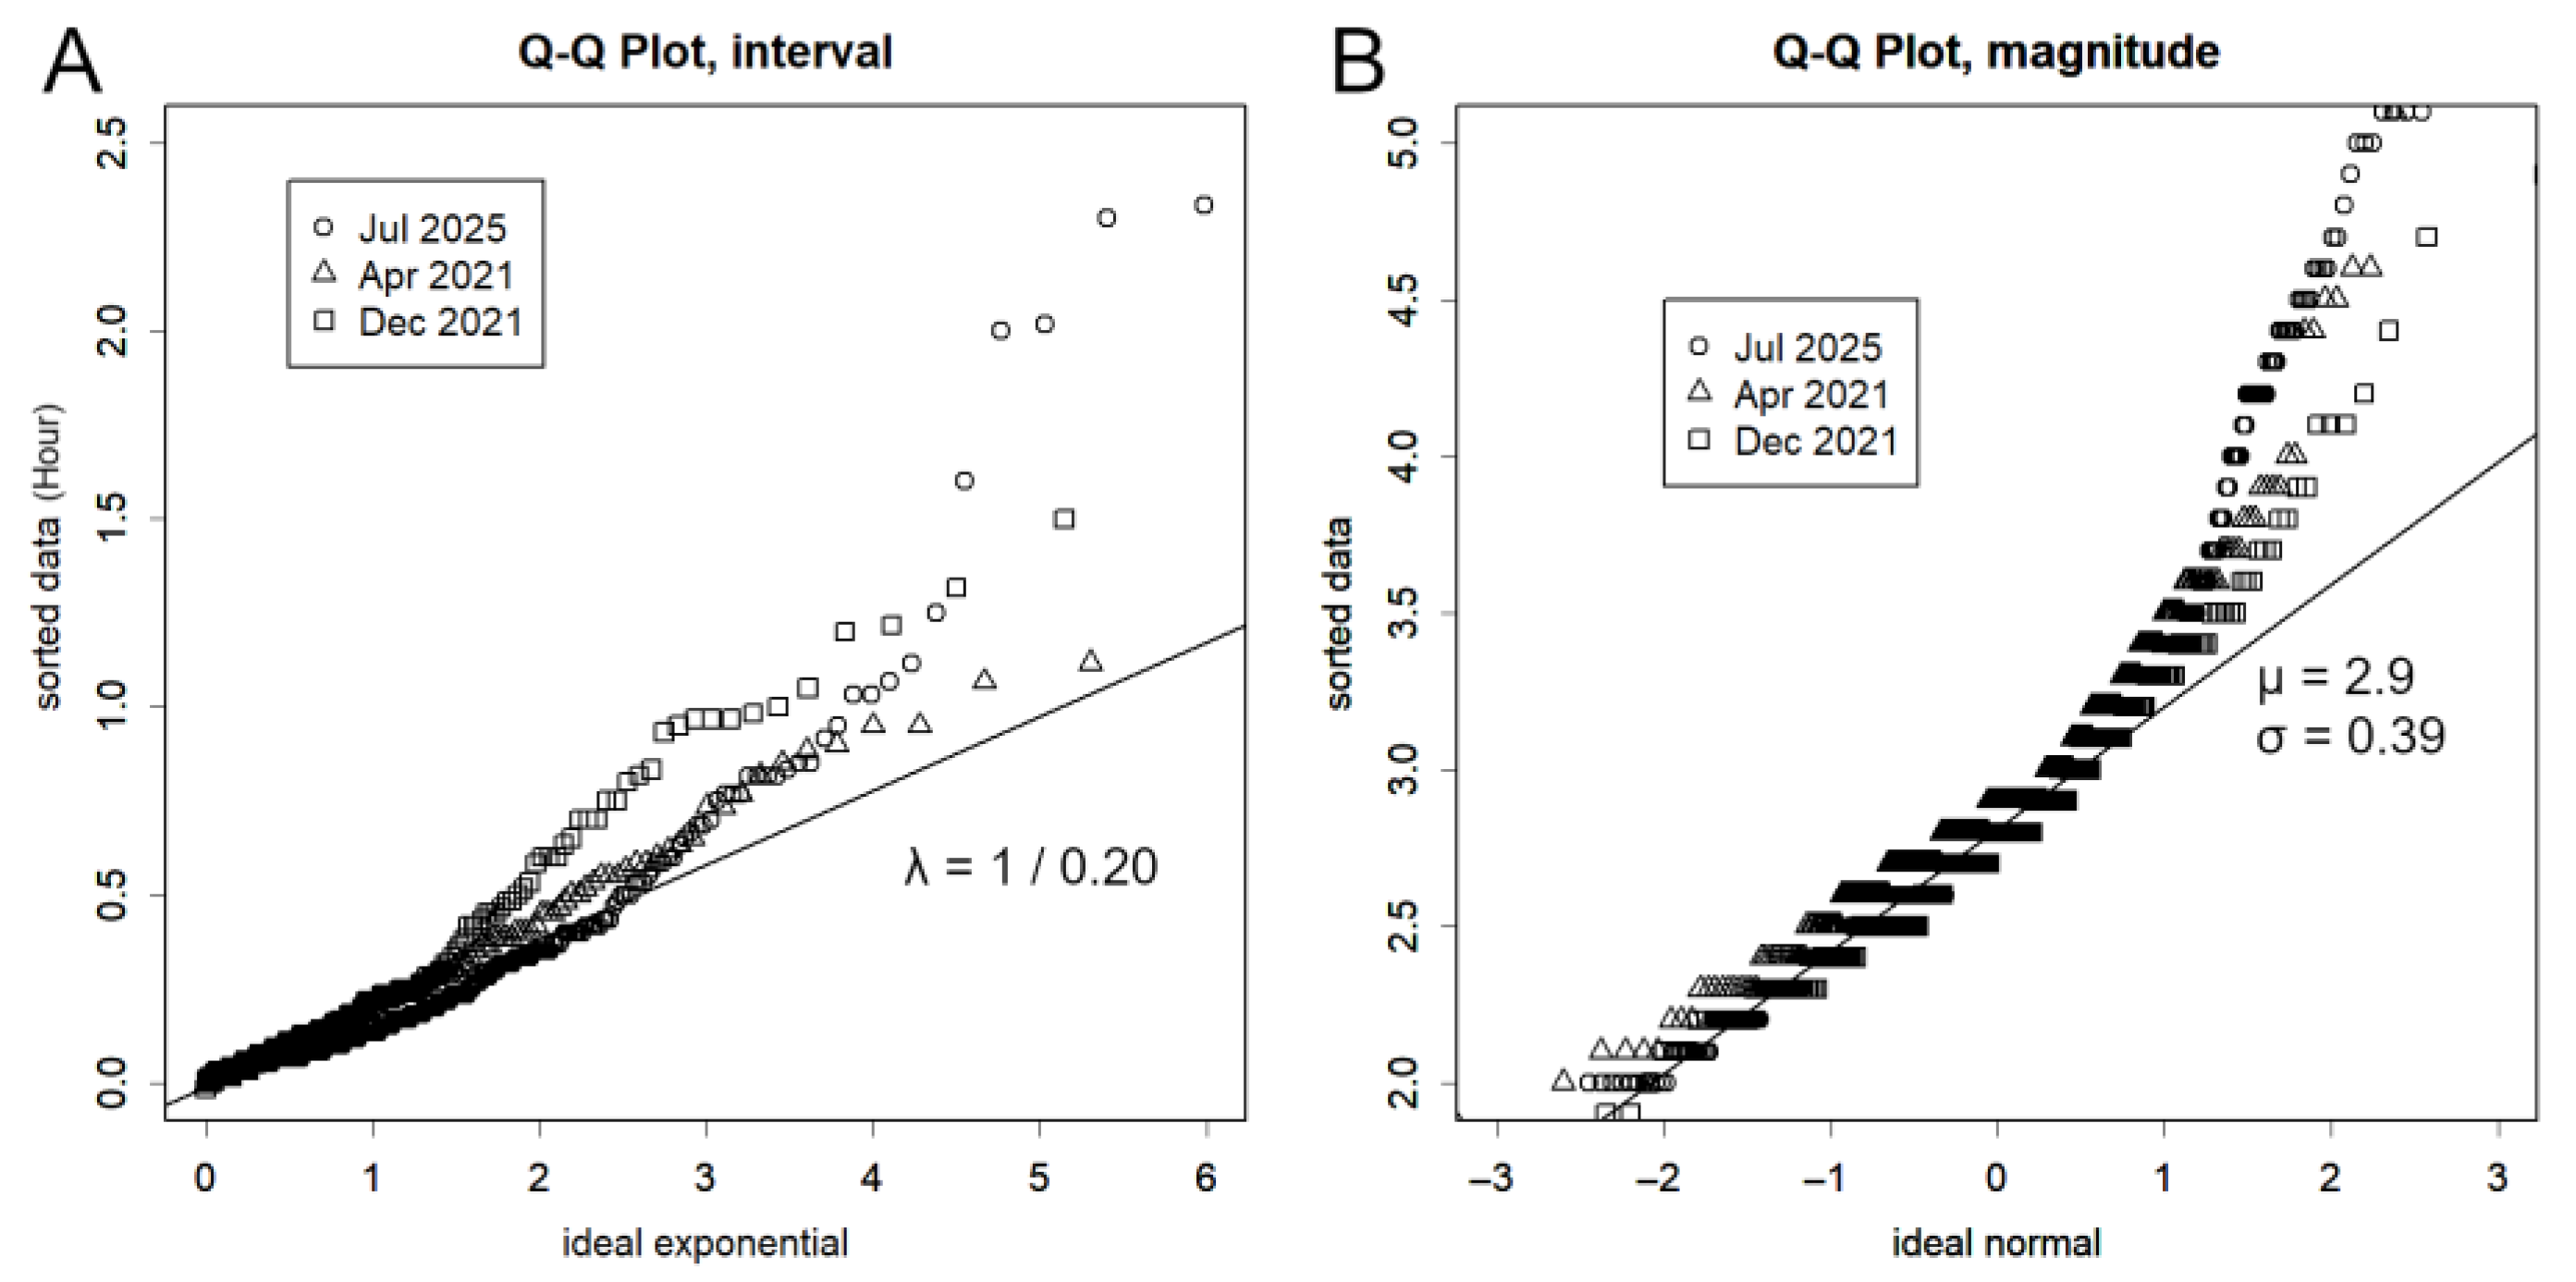
The current Tokara Islands earthquake swarm is likely driven by magma movement. The intermittent cessation of earthquakes and their relocation to different epicentral areas, along with variations in the magnitude distribution, suggest that changes in the locus of magma movement and the position of geological barriers impeding this movement trigger seismic activity. The temporal correlation between volcanic activity at Suwanose Island and earthquake swarms in 2021 and 2025, combined with nearly identical statistical parameters (λ for inter-event times and μ and σ for magnitudes) across these periods (
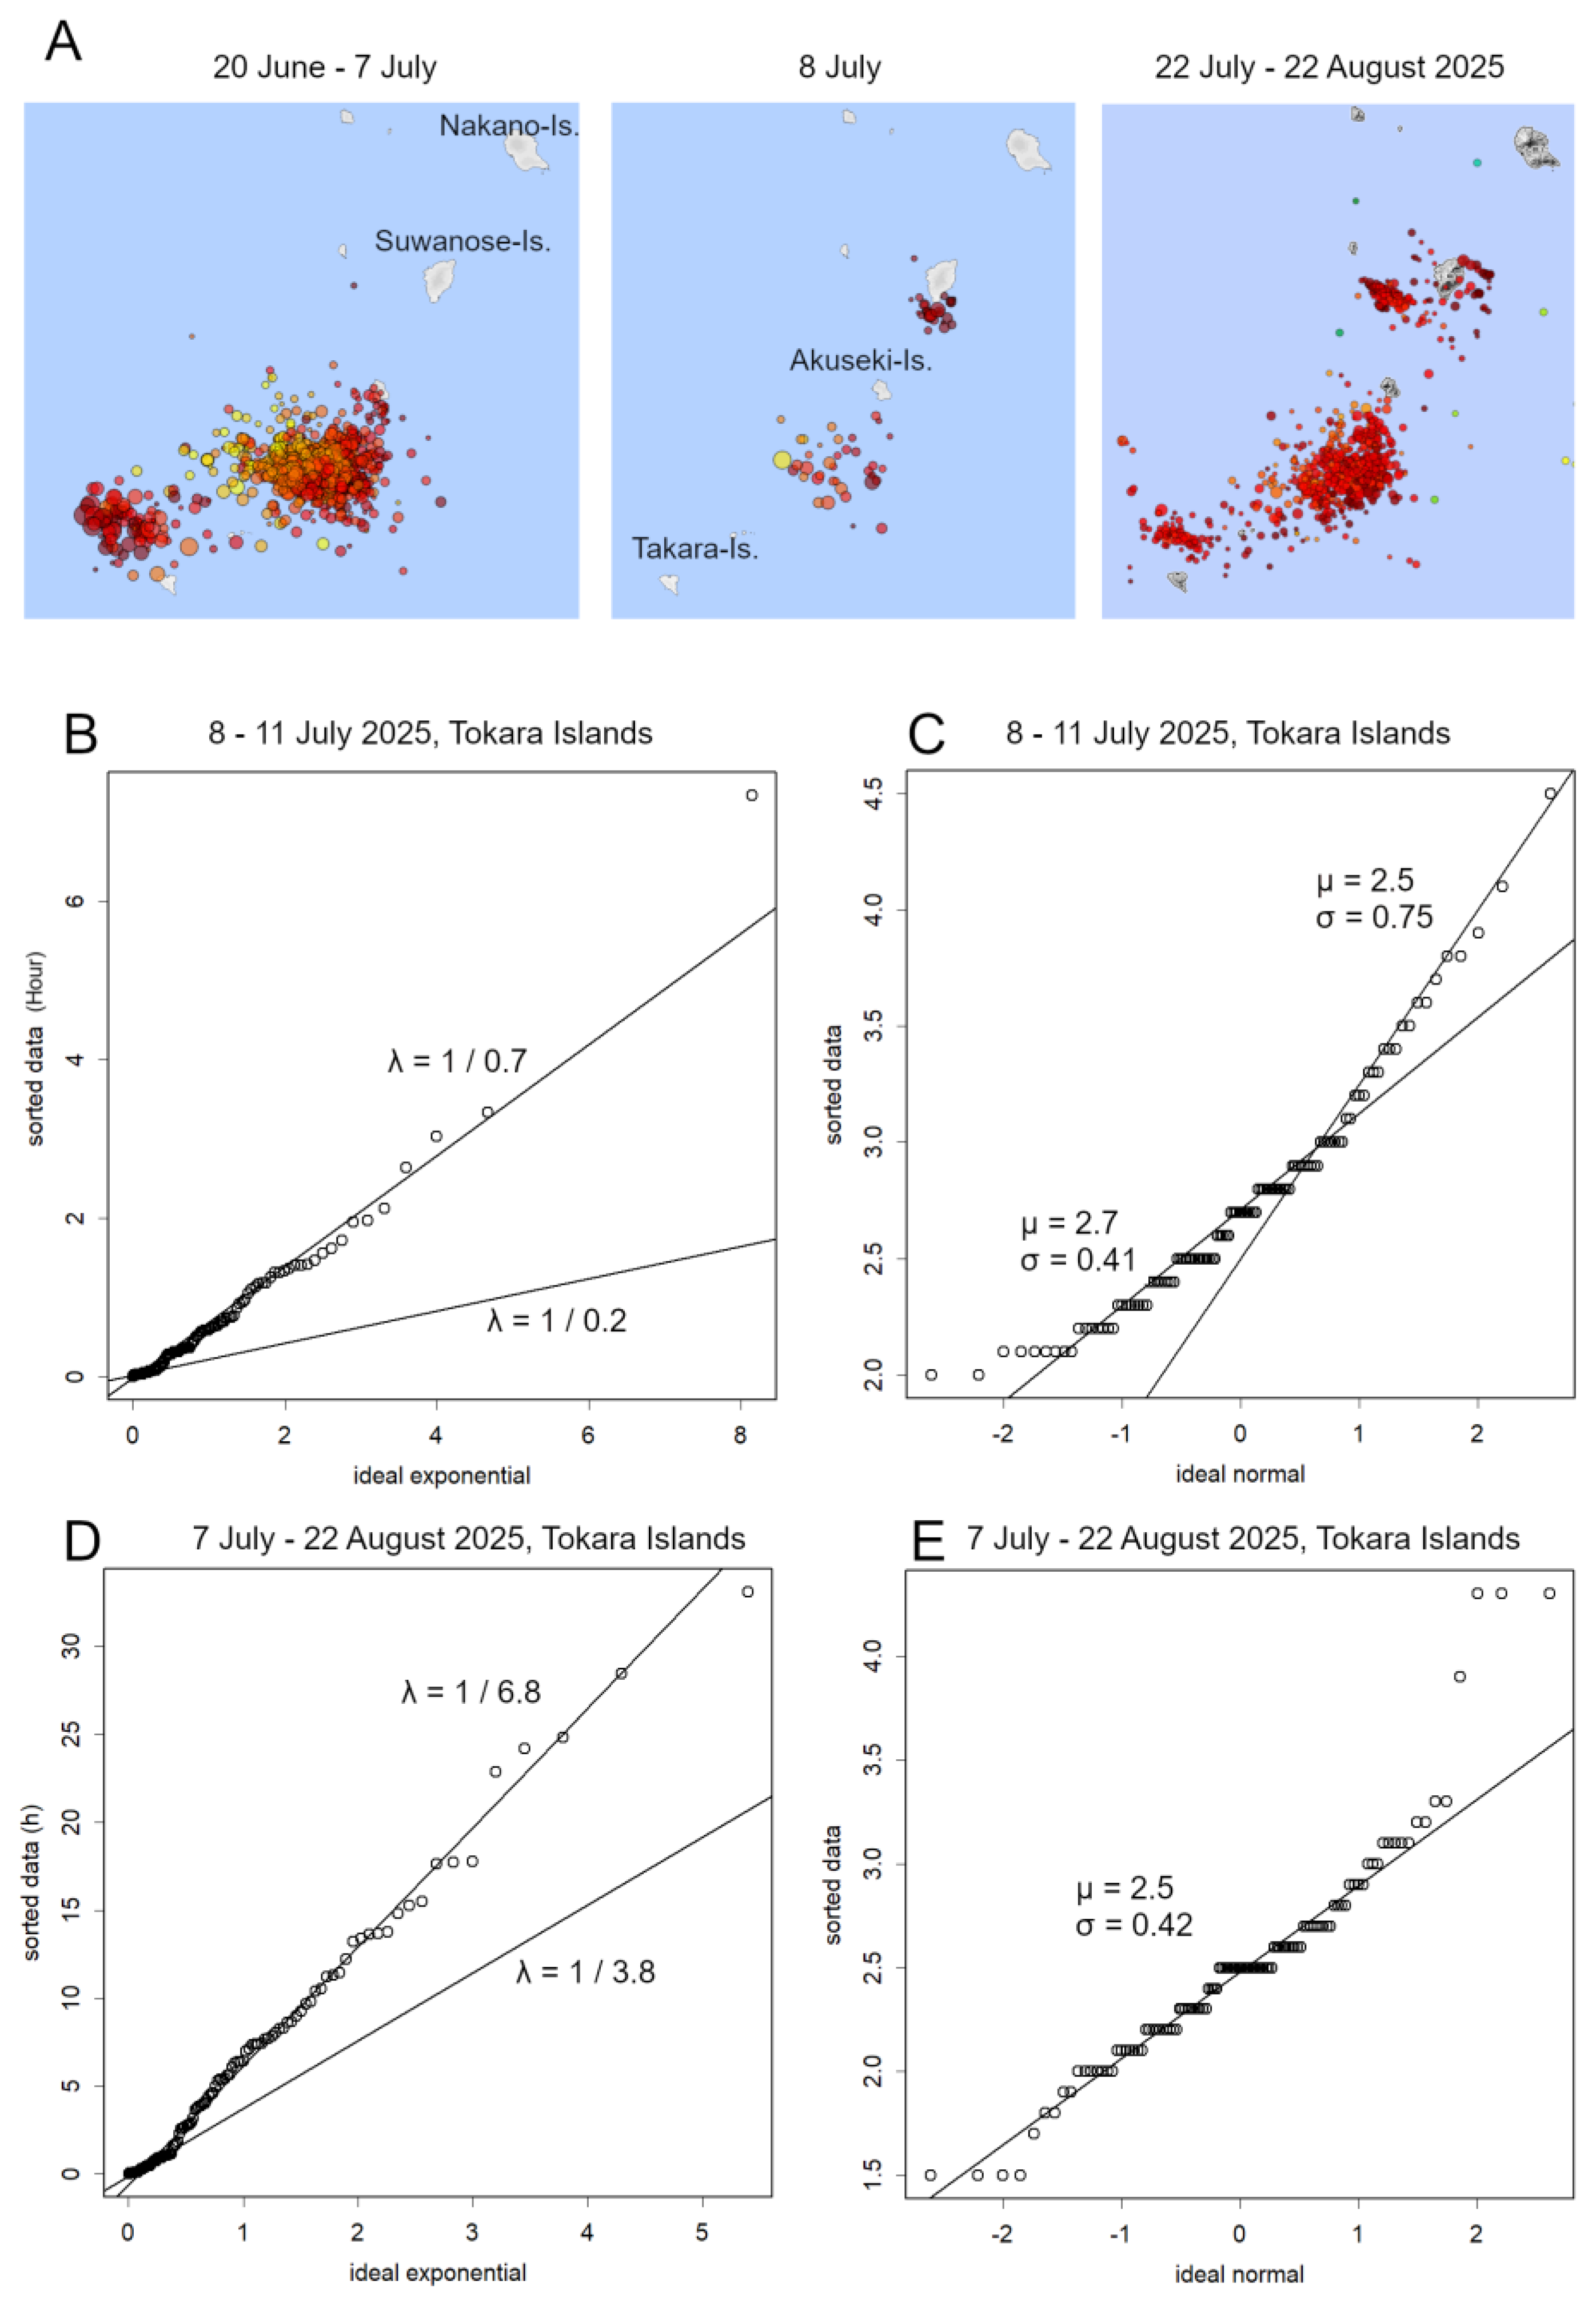
Figure 5), indicates the presence of a persistent magma conduit system and a geological structure predisposed to seismic activity. In contrast, large-scale eruptions, such as the 2015 eruption of Kuchinoerabu Island, which involved pyroclastic flows and evacuation advisories, often do not generate earthquake swarms. This suggests that magma movement alone is insufficient to cause earthquakes unless it encounters a geological structure that impedes flow. In the 2025 eruption of Suwanose Island, earthquakes also occurred in limited areas, each with different parameters (
Figure 4). Each of these structures is unique, and each appears to cause its own characteristic earthquake swarms.
Encouragingly, the current swarm appears to be gradually subsiding (
Figure 4D,E). The prolonged nature of current volcanic activity corresponds with the extended duration of the earthquake swarm. However, magma flow patterns appear to vary temporally, potentially triggering swarm activity at alternative locations with correspondingly different seismic parameters (
Figure 4). Given the ongoing volcanic activity at Suwanose Island, magma movement is likely to persist, with earthquake activity continuing until volcanic processes cease, occurring at a lower frequency
The potential for the current seismic and volcanic activity to remain confined to the ongoing eruption at Suwanose Island or to result in new eruptive centres remains uncertain [
14]. This uncertainty arises from the lack of published quantitative data on eruption magnitude [
15]. As demonstrated in this study, understanding the distributional patterns of earthquake inter-event times and magnitudes enables the estimation of parameters (λ, μ, and σ), which can be directly compared with other observational datasets. These parameters also facilitate the estimation of event frequencies, providing critical information for predictive modelling. Access to quantitative measurements of the 2021 Suwanose Island eruption and its associated seismic activity would enable robust comparisons with the 2025 conditions. Observations of potential shifts in island positions suggest the possibility of large-scale geological changes [
1]. For predictive purposes, the development of standardised methods for quantifying eruptive activity would be highly valuable. This study represents the second application of Exploratory Data Analysis (EDA) to seismic data in this context [
6], and its effectiveness in characterising distributional patterns is evident.
