Article

Gravity Data-Driven Machine Learning: A Novel Approach for Predicting Volcanic Vent Locations in Geohazard Investigation

1
Geohazards Research Center, King Abdulaziz University, Jeddah 21589, Saudi Arabia
2
Department of Petroleum Geology and Sedimentology, Faculty of Earth Sciences, King Abdulaziz University, Jeddah 21589, Saudi Arabia
3
Department of Geology/Geophysics, Alex Ekwueme Federal University, Ndufu-Alike Ikwo, Abakaliki P.M.B. 1010, Ebonyi State, Nigeria
4
Saudi Arabia Mining Company MAADEN, Riyadh 11537, Saudi Arabia
*
Author to whom correspondence should be addressed.
GeoHazards 2025, 6(3), 49; https://doi.org/10.3390/geohazards6030049
Submission received: 22 July 2025 / Revised: 21 August 2025 / Accepted: 25 August 2025 / Published: 29 August 2025

Abstract

Geohazard investigation in volcanic fields is essential for understanding and mitigating risks associated with volcanic activity. Volcanic vents are often concealed by processes such as faulting, subsidence, or uplift, which complicates their detection and hampers hazard assessment. To address this challenge, we developed a predictive framework that integrates high-resolution gravity data with multiple machine learning algorithms. Logistic Regression, Gradient Boosting Machine (GBM), Decision Tree, Support Vector Machine (SVM), and Random Forest models were applied to analyze the gravitational characteristics of known volcanic vents and predict the likelihood of undiscovered vents at other locations. The problem was formulated as a binary classification task, and model performance was assessed using accuracy, precision, recall, F1-score, and the Area Under the Receiver Operating Characteristic Curve (AUC-ROC). The Random Forest algorithm yielded optimal outcomes: 95% classification accuracy, AUC-ROC score of 0.99, 75% geographic correspondence between real and modeled vent sites, and a 95% certainty degree. Spatial density analysis showed that the distribution patterns of predicted and actual vents are highly similar, underscoring the model’s reliability in identifying vent-prone areas. The proposed method offers a valuable tool for geoscientists and disaster management authorities to improve volcanic hazard evaluation and implement effective mitigation strategies. These results represent a significant step forward in our ability to model volcanic dynamics and enhance predictive capabilities for volcanic hazard assessment.

1. Introduction

Volcanic eruptions present major risks to human safety, infrastructure, and surrounding ecosystems. Accurate identification of volcanic vent locations is therefore essential for improving hazard assessments, guiding mitigation strategies, and supporting emergency response planning.
Conventional methodologies for volcanic vent localization have historically relied on geological field mapping, geomorphological interpretation, and geophysical surveys. Geological and remote sensing techniques (aerial photography, multispectral imagery) provide valuable surface information but may fail to detect vents obscured by later eruptive deposits or erosion. Gravity-based methods, such as Bouguer anomaly mapping, residual gravity filtering, forward and inverse modeling, and 3D density distribution analysis, have been widely applied to infer subsurface structures such as magma chambers, feeder dykes, and fracture systems [1,2,3,4]. These methods can reveal density contrasts linked to magmatic intrusions but often suffer from limited spatial coverage, resolution constraints due to station spacing, and susceptibility to non-uniqueness in interpretation.
In recent years, machine learning (ML) approaches have emerged as effective tools for improving volcanic hazard assessments. By learning complex, non-linear relationships between geophysical variables and vent occurrence [5], ML algorithms can integrate multiple datasets such as gravity, magnetic, and topographic information to produce spatial predictions with improved accuracy [6]. Studies have applied supervised classifiers such as Logistic Regression, Gradient Boosting Machine (GBM), Decision Tree, Support Vector Machine (SVM), and Random Forest, as well as unsupervised clustering for volcanic feature detection. Advancements in ML-based approaches include the ability to handle large heterogeneous datasets, reduced bias from manual interpretation, and robust generalization to unobserved regions. However, these methods also have limitations: they require high-quality and representative training data, can be sensitive to spatial autocorrelation and class imbalance, and sometimes lack transparent geophysical interpretability, which is essential for scientific validation.
Despite these developments, there remains a clear research gap. While some studies have explored machine learning for volcanic vent prediction using magnetic or multi-geophysical datasets [5], no prior work has focused exclusively on leveraging gravity anomaly data for ML-based vent localization in the Rahat volcanic field (RVF). This gap is significant because gravity data directly reflect subsurface density variations that influence magma ascent pathways [7,8,9,10,11].
The present study addresses this gap by integrating high-resolution gravity data with multiple machine learning classifiers to predict potential volcanic vent locations in the RVF. By systematically comparing conventional and ML-based approaches, we aim to demonstrate the strengths of machine learning in enhancing predictive accuracy, while also acknowledging the limitations and uncertainties inherent to both approaches.
This research focuses on the Harrat Rahat volcanic complex (Figure 1), positioned within Saudi Arabia’s western Cenozoic lava fields. The region contains more than 900 visible volcanic vents encompassing maars, cryptodomes, craters, and scoria cones. Of these, 289 vents remain isolated by younger volcanic materials and lack association with the 234 separate volcanic rock formations documented during geological surveys [12]. Recent detailed analysis and cartographic work examined 32 geological formations that formed in northern Harrat Rahat after 1 Ma [13]. These formations include mugearite, tholeiitic and continental basalts, hawaiites, and intraplate alkali compositions (Figure 2). Additional geological background for this region can be found in Aboud et al. [7], Alqahtani et al. [8], and Robinson and Downs [12].
The RVF in western Saudi Arabia is dominated by extensive basaltic lava flows, scoria cones, maars, and tuff rings. Its eruptive history spans at least 10 million years, with the most recent eruption recorded in 1256 CE. The volcanic products range from alkali olivine basalts and hawaiites to more evolved mugearitic compositions, reflecting a mantle-derived magma source modified by fractional crystallization and crustal assimilation processes. Structural controls, including NW–SE and N–S fault systems, have played a key role in vent alignment and magma ascent pathways [8]. Gravity anomalies in the RVF often correlate with zones of magma storage or feeder dykes beneath vent clusters, making Bouguer anomaly data a sensitive proxy for subsurface magmatic architecture. Incorporating this geologic context ensures that the features used in the ML models have a direct physical link to volcanic processes that govern vent distribution.
Within the Harrat Rahat region, multiple volcanic vent systems are present, a characteristic often associated with volcanic centers hosting substantial high-temperature reservoirs [7,15]. A statistical framework for detecting eruptive episodes from exposed vents was created by Runge et al. [16]. The approach underwent validation using 968 vents across the Harrat Rahat volcanic complex, representing the period between 10 Ma and 0.6 ka. Some geoscientific studies [7,8,17,18,19,20] have been carried out in the Rahat region to explore its diverse potentials. Gravity data and seismic tomography results were adopted to derive a 3D subsurface geological structure at the Rahat volcanic field by Aboud et al. [7]. Volcanic vents and eruptive fissures at Harrat Khaybar were mapped using remote sensing and field studies [17], whereas at Harrat Ithnayn, Alshehri and Abdelrahman [18] used a time-domain electromagnetic method to detect groundwater aquifer at approximate depths of 15–200 m.
An inversion of gravity and magnetic anomalies for basement relief examination was done by Alqahtani et al. [8] at Harrat Rahat volcanic field. With a particle swarm optimization (PSO) approach, they estimated depth to the basement range at 0.10–624 m. Abdelfattah et al. [19] identified dual low-velocity zones within the upper crustal layer of northern Harrat Rahat: one at 15 km depth in the western sector and another at shallow 10 km depth eastward. Using Vertical Electrical Sounding (VES) techniques in southern Al-Madinah Al-Munawarah, Saudi Arabia, Metwaly et al. [20] determined hydraulic conductivity values of 3.5 m/day and transmissivity measurements of 369.6 m2/day. In this study, gravitational properties would be used with ML algorithms to help identify geological structures associated with volcanic activity.

2. Materials and Methods

The gravity data employed in this investigation was sourced from Alqahtani et al. [8]. A total of 149 gravity stations, spaced at intervals of 0.2–1 km, were processed to generate a residual Bouguer anomaly map (Figure 3). Alqahtani et al. [8] have extensively elucidated the intricate processing steps, encompassing various corrections applied to the dataset. The data presented in Figure 3 was utilized for further analysis in the current study.
The Bouguer anomaly dataset was selected for this study because it provides a refined representation of subsurface density variations after correcting observed gravity for elevation, latitude, and the gravitational attraction of surface masses. In volcanic terrains such as the Rahat volcanic field (RVF), these density contrasts are critical indicators of geologic structures influencing magma ascent [5,7,8]. Low Bouguer anomalies typically correspond to zones of partial melt, vesicular volcanic deposits, or fractured crustal segments that facilitate magma migration and vent formation. Conversely, high Bouguer anomalies may signify solidified intrusions, dense basaltic flows, or unfractured basement rocks that can act as barriers to magma movement [8]. By working with residual Bouguer anomalies, where regional trends are removed, we emphasize localized subsurface heterogeneities linked to magmatic pathways and potential vent locations. This geophysical basis makes the Bouguer anomaly data a direct and meaningful input for our ML models, ensuring that the predictive features are physically tied to volcanic processes.

2.1. Implementation Framework

(a)
Data Acquisition and Preparation: Gravity datasets incorporated longitude, latitude, and gravitational anomaly measurements from documented volcanic vent sites. Non-vent location data was integrated to establish contrasting patterns for model differentiation between volcanic and non-volcanic zones. Preprocessing addressed missing data points, normalized feature scales, and structured datasets for algorithm training.
(b)
The machine learning target parameter was established as binary classification indicating volcanic vent presence or absence at designated geographic positions.
(c)
Feature Development: The gravity data served as the features for the model.
(d)
Model Training: Training employed confirmed volcanic vent coordinates as positive instances (class 1) and non-volcanic locations as negative instances (class 0).
Data partitioning followed an 80-10-10 distribution: 80% randomly allocated for training purposes, with the remaining 20% divided equally between testing and validation phases at 10% each. This partitioning strategy optimized training dataset size while maintaining distinct subsets for hyperparameter tuning and objective performance assessment.
(e)
Model evaluation (accuracy, precision, recall, F1 score).
(f)
Prediction: The trained algorithm produced probability assessments for potential volcanic vent locations at untested coordinates using corresponding gravity anomaly features.
Comparative analysis across multiple algorithms typically yields superior results when selecting optimal models through comprehensive evaluation metrics for specific research applications. This investigation employed diverse machine learning approaches, each offering distinct advantages and suitability for different analytical tasks and data structures. Model assessment utilized conventional performance indicators including accuracy, precision, recall, F1 score, and AUC-ROC measurements for binary classification problems [21,22,23]. Performance comparison across these algorithms on our dataset enabled identification of the most suitable approach considering our data characteristics and research goals.
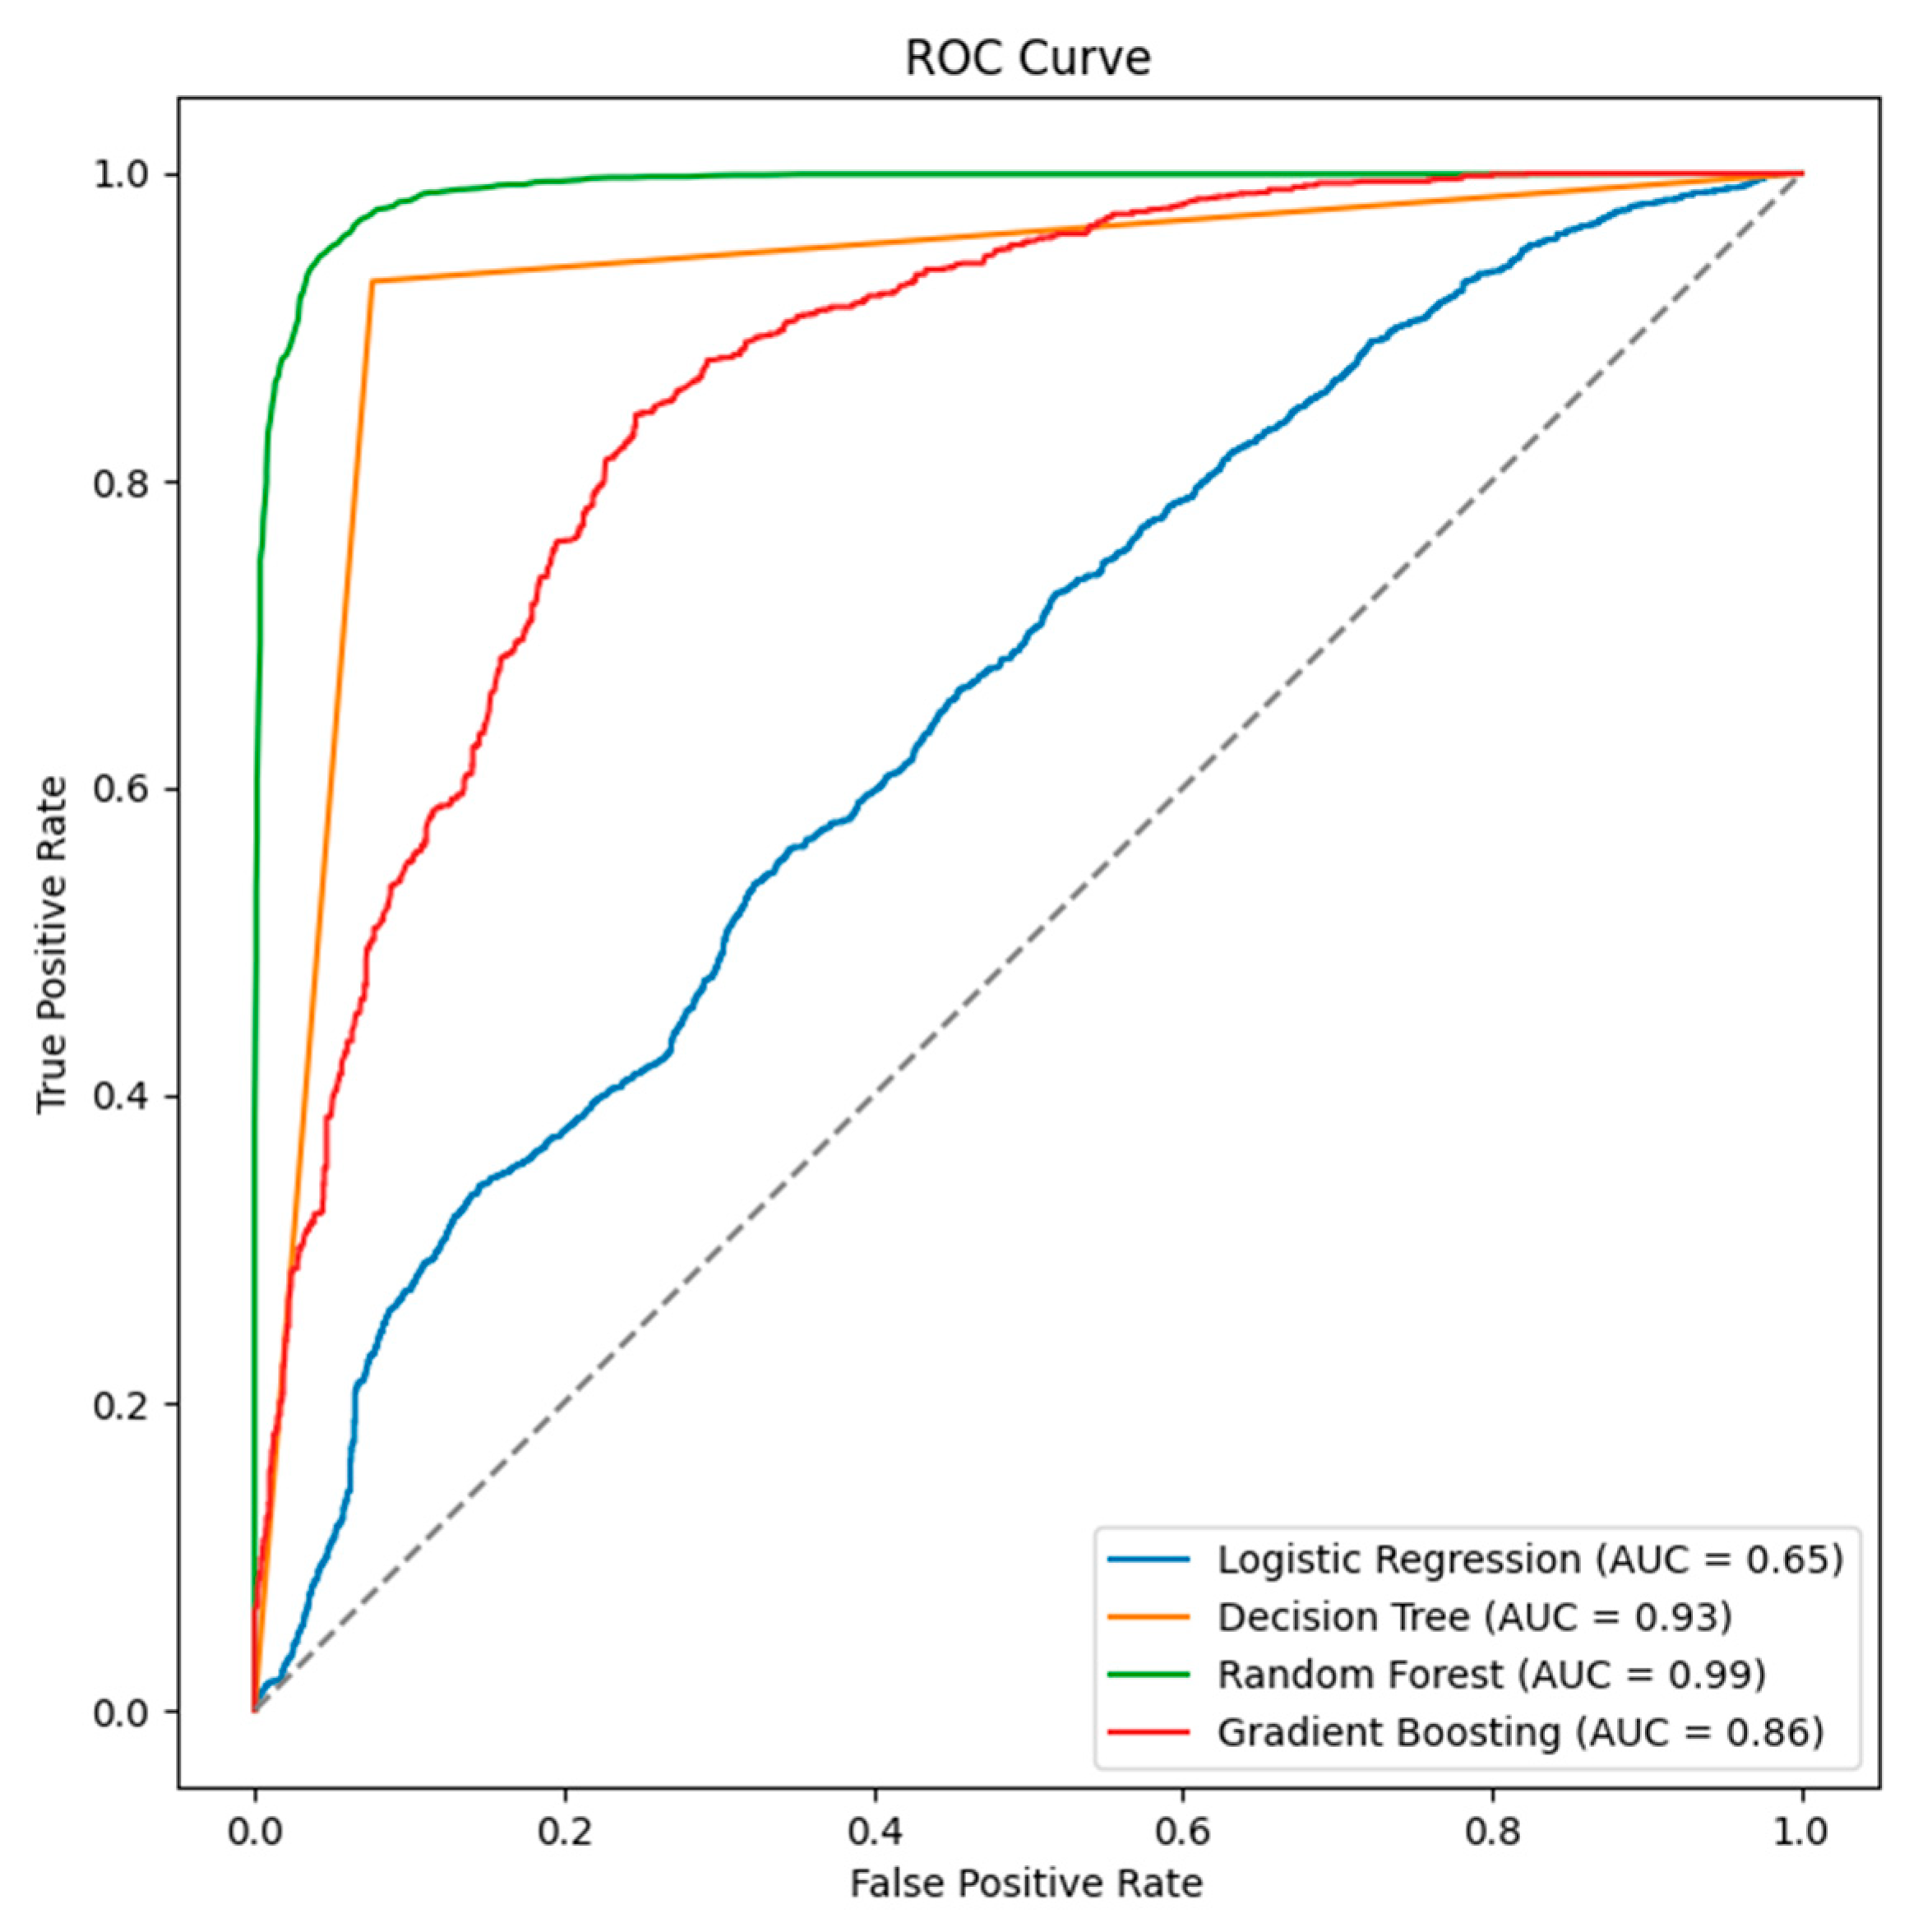
The ROC curve is a graphical tool that illustrates how well a model distinguishes between classes at different threshold levels. In contrast, the AUC provides a concise numerical value that reflects the model’s overall capacity to differentiate between positive and negative instances [24]. Together, the ROC and AUC metrics serve as critical tools for benchmarking classifier performance and identifying the most effective model among those tested.
1. 
Random Forest Algorithm
Random Forest operates as a collective of decision trees wherein individual trees contribute votes toward the dominant classification. Training occurs on bootstrapped dataset samples with randomly selected feature subsets at each decision node.
Given a collection of trees, the classification output for input data is determined by a set of equations [6,25]. This algorithm was selected due to its resilience when processing high-dimensional datasets and its capacity to reduce overfitting through ensemble averaging of multiple decision trees, providing exceptional accuracy for complex geophysical data analysis. Previous research has demonstrated successful Random Forest implementation [6,26,27,28,29,30].
2. 
Support Vector Machines (SVM)
SVM identifies the ideal decision boundary that divides classes while maximizing the separation distance. For a binary classification problem [31] with classes y i 1 ,   1 and features x i , the SVM objective is to maximize the margin 1 ω , subject to
y i ω x i + b 1 i
This is typically solved by minimizing
1 2 ω 2
subject to y i ω x i + b 1 ξ i with slack variables ξ i for non-linearly separable cases.
3. 
Logistic Regression
Logistic Regression is used for binary classification and models the probability that a given input x belongs to a particular class y 0 , 1 as follows [32]:
P ( y = 1 x ) = 1 1 + e ω . x + b
where ω = weight vector, and b = bias. The model is trained by maximizing the likelihood of the observed data.
4. 
Gradient Boosting Machines (GBM)
GBM comprises a collection of weak predictors (typically decision trees), where successive trees address the remaining errors from preceding models. Given a model, the goal involves minimizing a loss function   L y , F x through sequential model addition h m x [33]:
F m ( x ) = F m 1 ( x ) + α h m ( x )
where α is the learning rate.
5. 
Decision Trees
Decision Trees recursively partition the feature space to maximize information gain (or minimize impurity) at each split. For a dataset S with labels, the information gain I G for a feature X is as follows [34]:
I G S , X = H S v v a l u e s X S v S H S v
where H ( S ) is the entropy of S , and S v is the subset where feature X takes value v .
  • Performance Assessment Metrics
Accuracy: Quantifies the ratio of correct classifications relative to total sample size. The computation follows [6,35]:
(TP + TN)/(TP + TN + FP + FN)
where TP represents true positives, TN denotes true negatives, FP indicates false positives (incorrectly identifying non-vent regions as vents), and FN signifies false negatives (incorrectly classifying vent regions as non-vents).
Precision: Calculates the fraction of accurate positive predictions among all positive classifications generated by the algorithm. The formula is TP/(TP + FP).
Recall (Sensitivity): Determines the percentage of correct positive predictions relative to all genuine positive cases within the dataset. This equals TP/(TP + FN). Recall becomes critical when false negative costs are substantial.
F1-Score: Represents the harmonic average of precision and recall metrics. This measure balances precision and recall performance, computed via Equation (7) [5,6,21,36,37]:
F 1 S c o r e = 2 × ( p r e c i s i o n × r e c a l l ) ( p r e c i s i o n + r e c a l l )

2.2. Training Dataset Provenance and Partitioning Strategy

  • Dataset sources and labeling
All volcanic vent coordinates (label “1”) used in this study were sourced exclusively from the Rahat volcanic field (RVF). Verified vent positions were obtained from the comprehensive geological mapping and vent inventory provided by Robinson and Downs [12], supplemented by field-validated locations from Alqahtani et al. [8]. Non-vent samples (label “0”) were generated from spatial coordinates within the study area that do not intersect with any known vent location. These non-vent points were drawn from the same gravity dataset grid to ensure consistent spatial resolution. No data from other volcanic fields or regions were incorporated.
  • Labeling process
The binary classification target was created by assigning a value of “1” to coordinates matching verified vent locations and “0” to all other grid points in the gravity dataset. This approach ensures that the model learns from both positive (vent) and negative (non-vent) examples within the same geophysical context.
  • Data partitioning and sample sizes
The labeled dataset was randomly split into three subsets while maintaining the same proportion of vent and non-vent samples across each:
(a)
Training set: 80% of total samples
(b)
Validation set: 10% of total samples
(c)
Testing set: 10% of total samples
This stratified partitioning prevents class imbalance bias and ensures robust model evaluation.
  • Geospatial distribution maps
To ensure transparency and reproducibility, we generated geospatial distribution maps of vent and non-vent (every other region of the study area without marked vents) sample locations for the training, validation, and testing sets (Figure 3). This confirm that all subsets are spatially representative of the study area and that no geographic clustering bias was introduced during sampling.
A Python-based (Python 3.8) implementation was used to execute the machine learning workflow outlined in Section 2. This script facilitated the training, evaluation, and comparison of various models. The outcomes from these evaluations are summarized in Table 1.

2.3. Possible Limitations of the Dataset

(a)
Incomplete surface representation: Some vents may remain undetected due to burial beneath younger lava flows, pyroclastic deposits, or erosion, potentially leading to underrepresentation of the positive class.
(b)
Resolution constraints: The gravity station spacing limits the ability to resolve very small or subtle density anomalies.
(c)
Single dataset dependency: Additional datasets (from other methods) could improve predictive robustness.
(d)
Field validation—No direct field verification of predicted vent locations was conducted due to logistical constraints; this remains a recommended step for future work.

3. Results

To visualize and interpret model performance, Figure 4 and Figure 5 illustrate both the classification accuracy across models and the Receiver Operating Characteristic (ROC) curves, respectively, along with their corresponding Area Under the Curve (AUC) values.
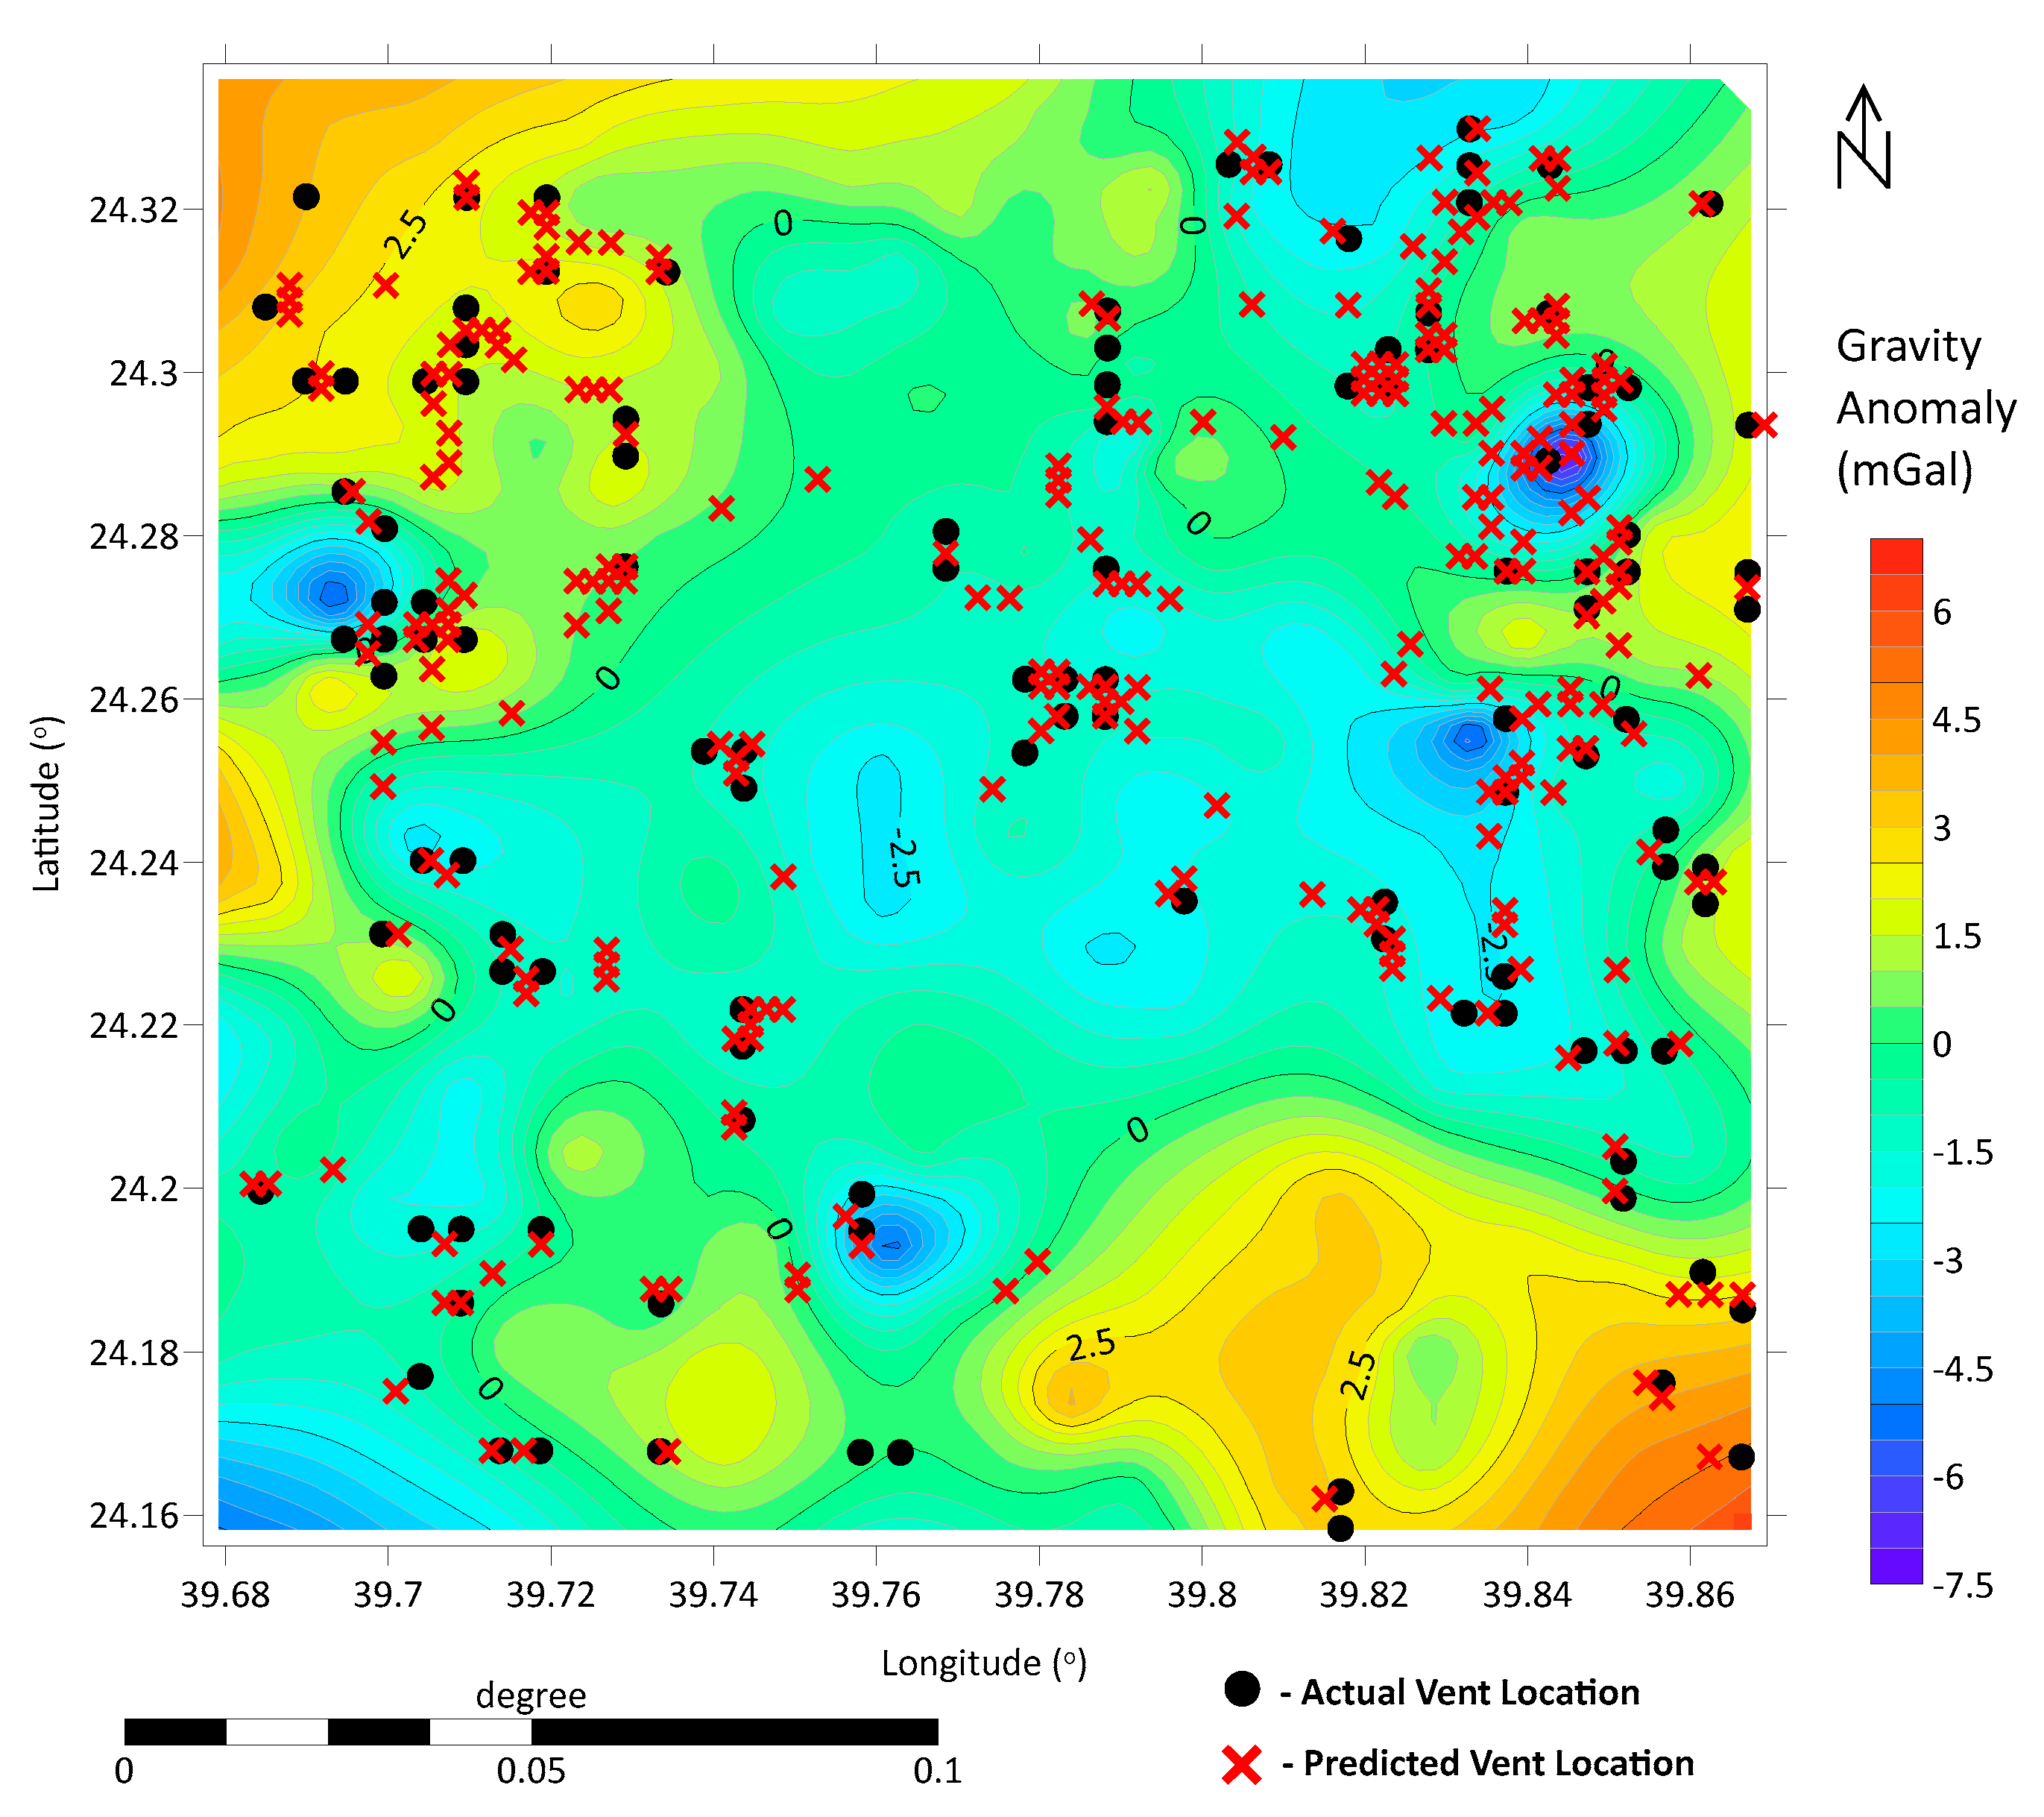
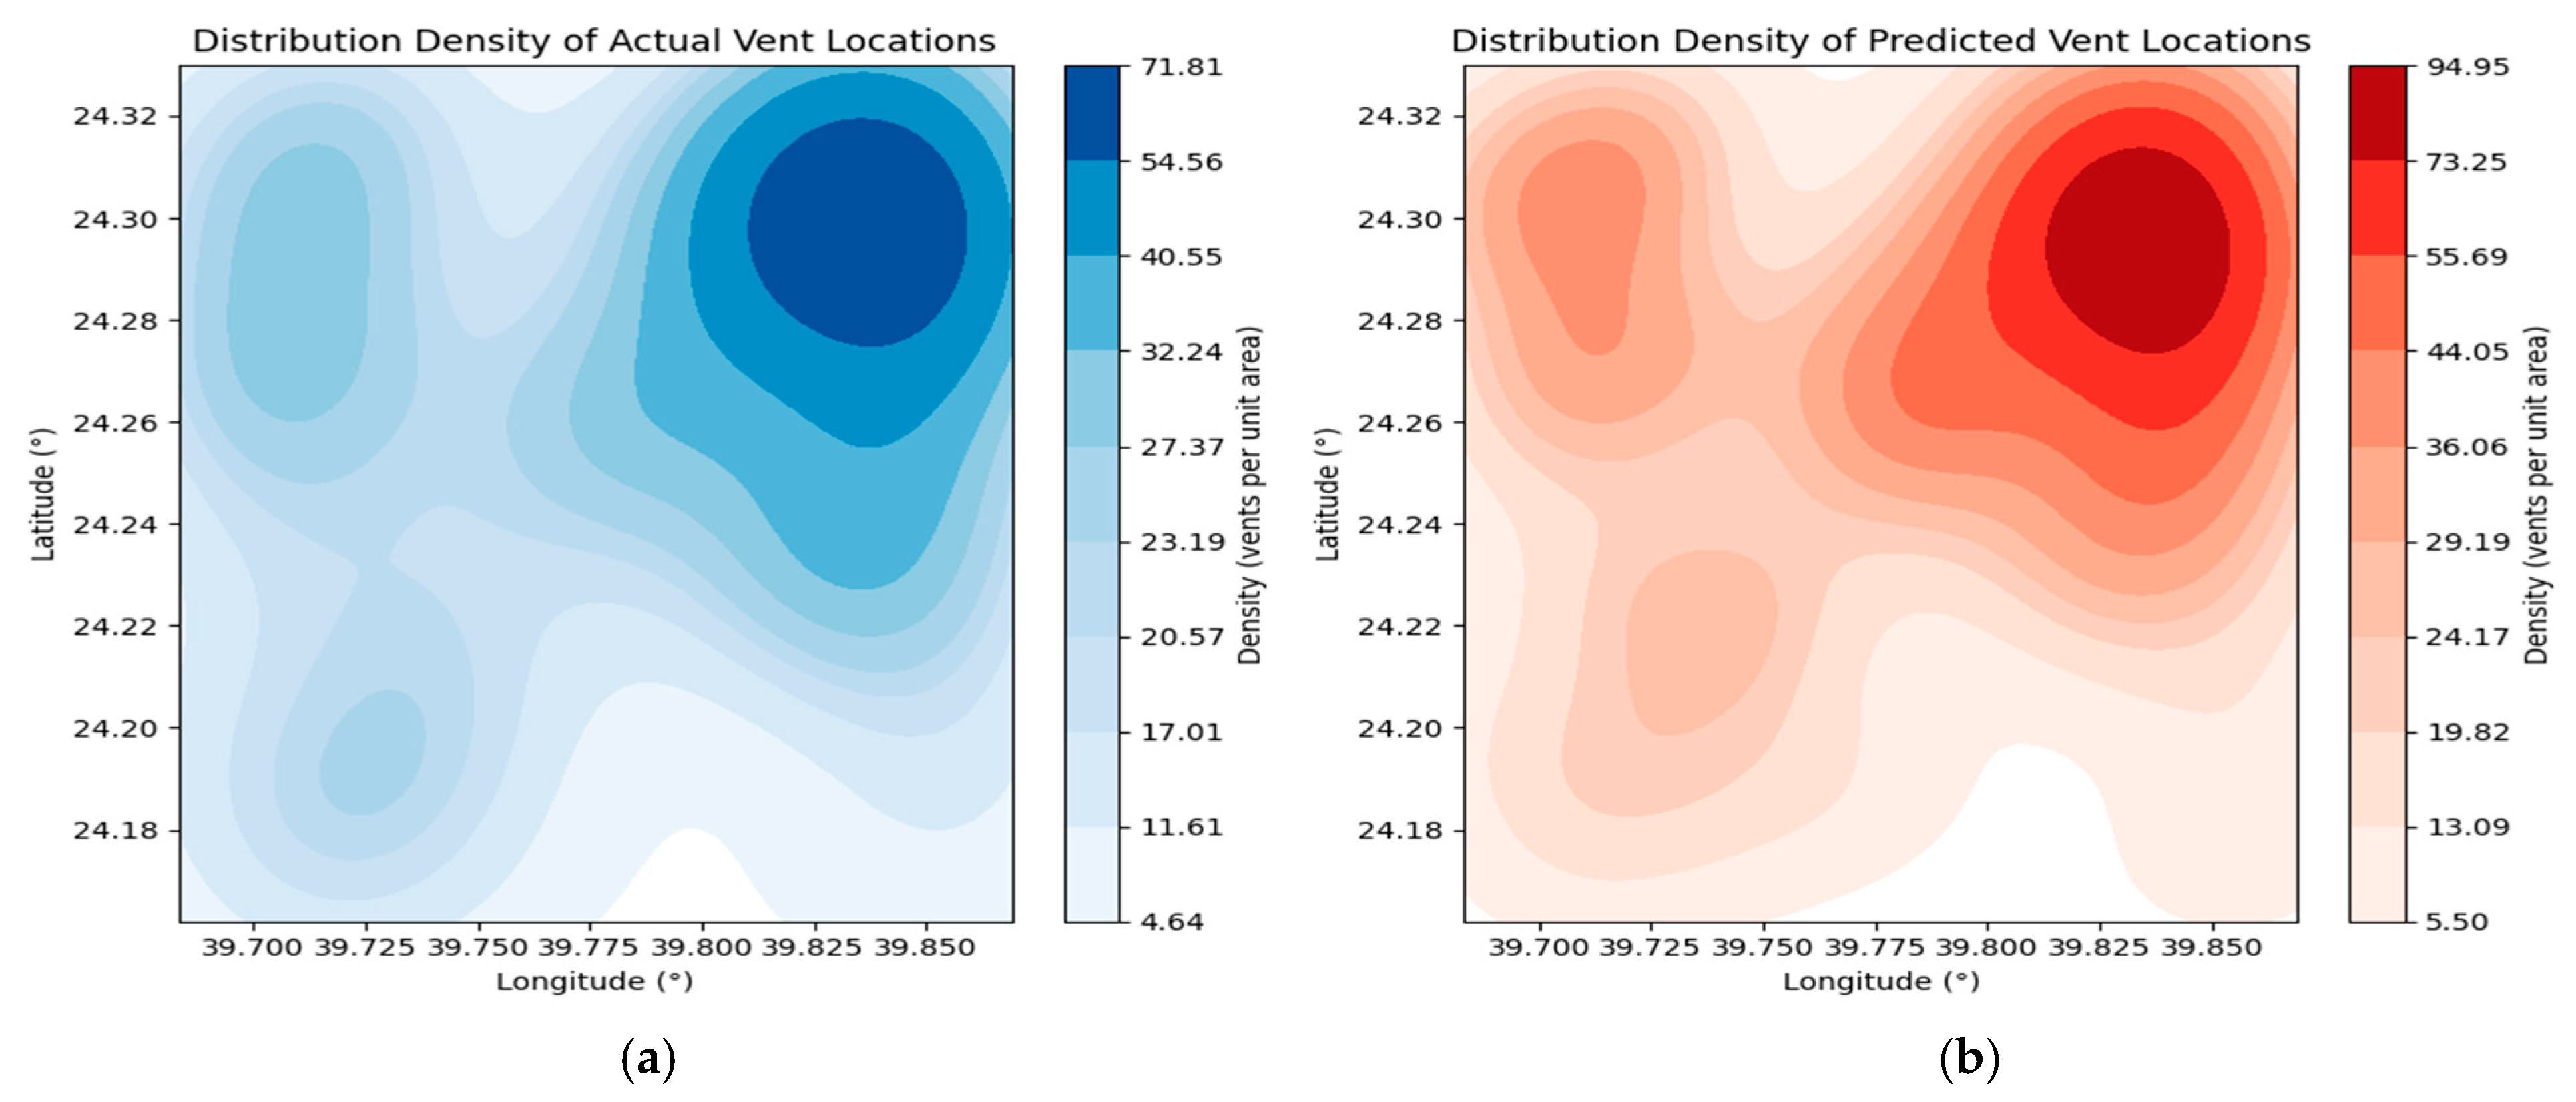
Figure 6 displays an overlay visualization of observed and forecasted volcanic vent positions. Figure 7 presents the spatial density patterns of real and modeled vent sites, demonstrating a density distribution correlation of 1. The density maps of actual and predicted vent locations (Figure 7) were created using a kernel density estimation (KDE) algorithm in Python’s seaborn/scikit-learn environment. This method estimates the spatial density of vent points by applying a Gaussian kernel across the study area, producing a continuous surface of vent concentration.This indicate a stronger positive correlation. The degree of certainty (DC) refers to the level of confidence or certainty associated with the predictions made by the Random Forest model. It represents the average confidence level of the model’s predictions across all samples in the dataset and provides insight into how certain or uncertain the model is about its predictions.

4. Interpretation of Results

The analysis aimed to interpret model performance, evaluate spatial prediction patterns, and investigate the relationship between gravity anomalies and volcanic vent occurrence within the RVF.

4.1. Comparative Performance of Machine Learning Algorithms

Five algorithms—Logistic Regression (LR), Support Vector Machine (SVM), Random Forest (RF), Gradient Boosting Machine (GBM), and Decision Tree (DT)—were evaluated using the independent testing dataset (10% of total labeled samples). RF achieved the highest prediction accuracy (95%), precision (94.6%), recall (95.5%), and F1-score (95.0%), with an AUC-ROC of 0.99. DT followed closely (accuracy: 92.7%, AUC-ROC: 0.96), while GBM showed moderate performance (accuracy: 79.6%, AUC-ROC: 0.88). LR and SVM yielded comparatively lower accuracy (60.0% and 55.9%, respectively), reflecting their limited ability to capture non-linear feature–vent relationships inherent in the gravity data. The performance gap between RF and other algorithms can be attributed to RF’s ensemble nature, robustness to overfitting, and capacity to model complex, high-dimensional decision boundaries.

4.2. Feature Importance and Geophysical Interpretation

Feature importance analysis from the RF model revealed that residual Bouguer anomaly magnitude was the dominant predictor, followed by local anomaly gradients and higher-order derivative features. These features correspond geophysically to density contrasts associated with magma chambers, feeder dykes, and fracture zones, structures that control magma ascent and vent formation. This supports the geophysical rationale for using gravity-derived inputs as predictive variables.

4.3. Spatial Patterns of Predicted Vents

The predicted vent locations exhibit strong spatial clustering in the northern RVF, consistent with regions of high actual vent density and prominent low-gravity anomalies. Additional predicted vents were identified in the northeastern, northwestern, and central areas, coinciding with mapped fault systems and linear gravity lows that may represent concealed feeder zones. A smaller number of predictions occurred in the southern RVF, an area characterized by weaker gravity anomalies and more dispersed vent patterns, likely reflecting a different magmatic or tectonic regime.

4.4. Agreement Between Predicted and Actual Vents

The spatial correlation between predicted and actual vents was quantified at 75%, with density distribution maps showing nearly identical clustering patterns (correlation coefficient ≈ 1.0). This high level of agreement suggests that the model effectively captured the underlying spatial structure of vent occurrence, even in regions with incomplete surface exposure.

4.5. Regional Sensitivity Variations

Performance varied regionally across the RVF. The northern sector, with dense vent clusters and strong anomaly contrasts, yielded higher sensitivity and predictive accuracy across all models. The southern sector’s reduced model performance likely reflects weaker anomaly signals and fewer training samples from that region. These variations highlight the influence of local geophysical context on model outcomes.

5. Discussion

This study represents the first application of a gravity data–driven machine learning framework for volcanic vent prediction in the RVF and, to our knowledge, in any volcanic province worldwide. No previous work has combined Bouguer anomaly data alone with multiple supervised classifiers for vent localization. The results (Table 1) show that integrating high-resolution gravity information with machine learning can successfully capture spatial patterns of vent occurrence that are both geophysically consistent and statistically robust, thereby opening a new pathway for volcanic hazard assessment.
Subsurface density variations play a primary role in magma ascent and vent formation. Low-density zones, often linked to partial melt regions, fractured crust, or volcanic breccias, facilitate magma migration, whereas high-density zones, such as solidified intrusions or massive basalt flows, can inhibit ascent [8]. In the RVF, clusters of actual and predicted vents (Figure 6) coincide with mapped low-gravity anomalies (Figure 3), confirming the physical link between density structure and vent distribution. This finding aligns with observations in other volcanic systems [16,38], where structural and compositional heterogeneities influence vent alignment.
Among the tested algorithms, the Random Forest (RF) classifier achieved the highest predictive skill (accuracy 95%, AUC-ROC 0.99, spatial correlation 75%), outperforming Decision Tree, Gradient Boosting, Logistic Regression, and SVM models (Table 1). RF’s strength lies in its ability to capture complex, non-linear relationships and its resilience to overfitting when hyperparameters are optimized. Figure 4 and Figure 5 illustrate the comparative performance and ROC curves, confirming RF’s superior classification ability. Performance varied across the field: the northern RVF, characterized by dense vent clusters and strong anomaly contrasts, yielded consistently high sensitivity, whereas the southern RVF, with weaker anomalies and fewer vents, was more challenging. These results indicate that prediction accuracy is influenced not only by algorithm selection but also by the strength and clarity of the underlying geophysical signal.
The method effectively identifies both exposed and potentially concealed vents. Several predicted vents correspond to structural lineaments and gravity lows without mapped surface expression (Figure 6), likely due to burial beneath younger lava flows or pyroclastic deposits or tectonic modification. This agrees with observations in northern Harrat Rahat, where only ~20% of eruptive products are exposed [12]. The main limitation is reliance on gravity data alone; non-volcanic density anomalies (intrusive bodies without eruption history) may be misclassified as vents. Integrating complementary datasets, such as magnetic, seismic, or InSAR deformation data, could reduce false positives and enhance predictive robustness.
This study did not include direct field reconnaissance to verify predicted vents due to logistical constraints. However, the identified sites (Figure 6) provide clear priorities for targeted validation using geological mapping, shallow geophysical profiling, or UAV-based imaging. While the RVF’s partial surface exposure presents challenges, successful validation would not only confirm concealed vents but also refine the predictive framework. The methodology could be transferred to other volcanic provinces with available gravity datasets, allowing regional customization based on local geologic and structural conditions.
The high agreement between predicted and actual vent density distributions (Figure 7; correlation coefficient 1) indicates that the approach reliably reproduces real-world spatial patterns. This predictive capability is particularly valuable in regions where vents may be buried or obscured, offering a means to guide hazard monitoring in the absence of complete surface data. As a proof of concept, this work demonstrates that gravity-driven machine learning can play a meaningful role in volcanic risk assessment, provided that its outputs are integrated with multidisciplinary datasets and field-based verification.

6. Conclusions

Through the application of machine learning methodologies, this study successfully identified potential volcanic vent sites within the northern segment of the Rahat volcanic field. Among the tested models, the Random Forest classifier demonstrated the highest predictive performance and was therefore adopted as the primary algorithm. The spatial distribution of predicted vents spans the entire study area, with a marked concentration in the northern zone, an area that also aligns with a significant gravity anomaly and a dense cluster of known vents.
The strong spatial agreement between predicted and actual vent locations, reflected by a 75% correlation and a 95% degree of certainty (DC), reinforces the reliability of the model’s output. These findings suggest that several of the predicted vent sites may currently be buried or obscured due to past volcanic deposits or structural geological changes, indicating the need for further field validation and geophysical investigations. Overall, the results of this study contribute meaningful guidance for prioritizing future volcanic monitoring efforts and enhancing early hazard detection strategies.

Author Contributions

Conceptualization, M.A. and E.A. (Ema Abraham); methodology, M.A., E.A. (Ema Abraham) and F.A.; software, E.A. (Essam Aboud) and E.A. (Ema Abraham); validation, F.A., E.A. (Essam Aboud) and E.A. (Ema Abraham); formal analysis, E.A. (Ema Abraham); investigation, M.A. and F.A.; resources, F.A.; data curation, M.A., E.A. (Essam Aboud), F.A. and E.A. (Ema Abraham); writing—original draft preparation, M.A. and E.A. (Ema Abraham); writing—review and editing, F.A. and E.A. (Ema Abraham); visualization, E.A. (Essam Aboud) and F.A.; supervision, E.A. (Ema Abraham); project administration, F.A.; funding acquisition, F.A. All authors have read and agreed to the published version of the manuscript.

Funding

Financial support for this research was provided by King Abdulaziz University’s Deanship of Scientific Research (DSR), Jeddah, through grant number (GPIP: 961-145-2024). The authors express gratitude to DSR for both technical assistance and funding provision.

Data Availability Statement

The used gravity data in this manuscript is available upon request to Essam Aboud (eaboudishish@kau.edu.sa).

Conflicts of Interest

Author Essam Aboud was employed by the company Saudi Arabia Mining Company MAADEN. The remaining authors declare that the research was conducted in the absence of any commercial or financial relationships that could be construed as a potential conflict of interest.

Abbreviations

AUC-ROCArea Under the Curve of the Receiver Operating Characteristic Curve
ASMAttribute Selection Measure
DCdegree of certainty
GBMGradient Boosting Machine
SVMSupport Vector Machine

References

  1. Marjoribanks, R. Geological Methods in Mineral Exploration and Mining; Springer: New York, NY, USA, 2010. [Google Scholar] [CrossRef]
  2. Giavarini, C.; Hester, K. Gas Hydrates: Immense Energy Potential and Environmental Challenges; Springer: New York, NY, USA, 2011. [Google Scholar] [CrossRef]
  3. Herz, N.; Garrison, E.G. Geological Methods for Archaeology; Oxford University Press: Oxford, UK, 1998; ISBN 9780195090246. [Google Scholar]
  4. Gravenstein, J.S.; Jaffe, J.A.; Paulus, R.A. Gas Monitoring and Pulse Oximetry; Springer: New York, NY, USA, 1986; Available online: https://www.sciencedirect.com/book/9780409902617/gas-monitoring-and-pulse-oximetry (accessed on 22 March 2023).
  5. Abdulfarraj, M.; Abraham, E.; Alqahtani, F.; Aboud, E. Advancements in Geohazard Investigations: Developing a Machine Learning Framework for the Prediction of Vents at Volcanic Fields Using Magnetic Data. Geosciences 2024, 14, 328. [Google Scholar] [CrossRef]
  6. Abraham, E.M.; Usman, A.O.; Amano, I. Machine Learning-Based Classification of Geological Structures from Magnetic Anomaly Data: Case study of Northern Nigeria Basement Complex. Mach. Learn. Appl. 2025, 20, 100678. [Google Scholar] [CrossRef]
  7. Aboud, E.; Abraham, E.; Alqahtani, F.; Abdulfarraj, M. High potential geothermal areas within the Rahat volcanic field, Saudi Arabia, from gravity data and 3D geological modeling. Acta Geophys. 2023, 72, 1713–1729. [Google Scholar] [CrossRef]
  8. Alqahtani, F.; Abraham, E.M.; Aboud, E.; Rajab, M. Two-dimensional gravity inversion of basement relief for geothermal energy potentials at the Harrat Rahat volcanic field, Saudi Arabia, using particle swarm optimization. Energies 2022, 15, 2887. [Google Scholar] [CrossRef]
  9. Battaglia, M.; Gottsmann, J.; Carbone, D.; Fernández, J. 4D volcano gravimetry. Geophysics 2008, 73, WA3–WA18. [Google Scholar] [CrossRef]
  10. Tilling, R.I.; Lipman, P.W. Lessons in reducing volcano risk. Nature 1993, 364, 277–280. [Google Scholar] [CrossRef]
  11. Rymer, H.; Brown, G.C. Gravity fields and the interpretation of volcanic structures: Geological discrimination of volcanic structures in Central America. J. Volcanol. Geotherm. Res. 1986, 27, 225–240. [Google Scholar] [CrossRef]
  12. Robinson, J.E.; Downs, D.T. Chapter R: Overview of the Cenozoic geology of the northern Harrat Rahat volcanic field, Kingdom of Saudi Arabia. In Active Volcanism on the Arabian Shield-Geology, Volcanology, and Geophysics of Northern Harrat Rahat and Vicinity, Kingdom of Saudi Arabia; Sisson, T.W., Calvert, A.T., Mooney, W.D., Eds.; U.S. Geological Survey Professional Paper 1862 [Also Released as Saudi Geological Survey Special Report SGS-SP-2021-1]; U.S. Geological Survey: Reston, VA, USA, 2023; 20p. [Google Scholar] [CrossRef]
  13. Downs, D.T.; Stelten, M.E.; Champion, D.E.; Dietterich, H.R.; Nawab, Z.; Zahran, H.; Hassan, K.; Shawali, J. Volcanic history of the northernmost part of the Harrat Rahat volcanic field, Saudi Arabia. Geosphere 2018, 14, 1253–1282. [Google Scholar] [CrossRef]
  14. Moufti, M.R.; Moghazi, A.M.; Ali, K.A. 40 Ar/39 Ar geochronology of the Neogene-Quaternary Harrat Al-Madinah intercontinental volcanic field, Saudi Arabia: Implications for duration and migration of volcanic activity. J. Asian Earth Sci. 2013, 62, 253–268. [Google Scholar] [CrossRef]
  15. Aboud, E.; Alqahtani, F.; Elmasry, N.; Abdulfarraj, M.; Osman, H. Geothermal anomaly detection using potential field geophysical Data in Rahat volcanic field, Madinah, Saudi Arabia. J. Geol. Geophys. 2022, 11, 1026. [Google Scholar]
  16. Runge, M.G.; Bebbington, M.S.; Cronin, S.J.; Lindsay, J.M.; Kenedi, C.L.; Moufti, M.R.H. Vents to events: Determining an eruption event record from volcanic vent structures for the Harrat Rahat, Saudi Arabia. Bull. Volcanol. 2014, 76, 804. [Google Scholar] [CrossRef]
  17. Alohali, A.; Bertin, D.; de Silva, D.; Cronin, S.; Duncan, R.; Qaysi, S.; Moufti, M.R. Spatio-temporal forecasting of future volcanism at Harrat Khaybar, Saudi Arabia. J. Appl. Volcanol. 2022, 11, 12. [Google Scholar] [CrossRef]
  18. Alshehri, F.; Abdelrahman, K. Groundwater aquifer detection using the time-domain electromagnetic method: A case study in Harrat Ithnayn, northwestern Saudi Arabia. J. King Saud Univ.-Sci. 2022, 34, 101684. [Google Scholar] [CrossRef]
  19. Abdelfattah, A.K.; Al-amri, A.; Alzahrani, H.; Abuamarah, B.A. Ambient noise tomography in the upper crust of North Harrat Rahat, Saudi Arabia. J. King Saud Univ.-Sci. 2022, 35, 102523. [Google Scholar] [CrossRef]
  20. Metwaly, M.; Abdalla, F.; Taha, A.I. Hydrogeophysical Study of Sub-Basaltic Alluvial Aquifer in the Southern Part of Al-Madinah Al-Munawarah, Saudi Arabia. Sustainability 2021, 13, 9841. [Google Scholar] [CrossRef]
  21. Powers, D.M.W. Evaluation: From precision, recall and F-measure to ROC, informedness, markedness and correlation. Int. J. Mach. Learn. Technol. 2011, 2, 37–63. [Google Scholar]
  22. Yilmaz, I. Landslide susceptibility mapping using frequency ratio, logistic regression, artificial neural networks and their comparison: A case study from Kat landslides (Tokat-Turkey). Comput. Geosci. 2009, 35, 1125–1138. [Google Scholar] [CrossRef]
  23. Caruana, R.; Niculescu-Mizil, A. An Empirical Comparison of Supervised Learning Algorithms. In Proceedings of the 23rd International Conference on Machine Learning, Pittsburgh, PA, USA, 25–29 June 2006. [Google Scholar] [CrossRef]
  24. Fawcett, T. An introduction to ROC analysis. Pattern Recognit. Lett. 2006, 27, 861–874. [Google Scholar] [CrossRef]
  25. Breiman, L. Random Forests. Mach. Learn. 2001, 45, 5–32. [Google Scholar] [CrossRef]
  26. Thottoth, S.R.; Das, P.P.; Khatri, V.N. Prediction of compression capacity of under-reamed piles in sand and clay. Multiscale and Multidiscip. Model. Exp. Des. 2024, 7, 2289–2305. [Google Scholar] [CrossRef]
  27. Menon, V.; Kolathayar, S. Optimizing nailing parameters for hybrid retaining systems using supervised learning regression models. Multiscale Multidiscip. Model. Exp. Des. 2024, 7, 4683–4698. [Google Scholar] [CrossRef]
  28. Li, Y.; Rahardjo, H.; Satyanaga, A.; Rangarajan, S.; Lee, D.T. Soil database development with the application of machine learning methods in soil properties prediction. Eng. Geol. 2022, 306, 106769. [Google Scholar] [CrossRef]
  29. Abraham, M.T.; Satyam, N.; Lokesh, R.; Pradhan, B.; Alamri, A. Factors Affecting Landslide Susceptibility Mapping: Assessing the Influence of Different Machine Learning Approaches, Sampling Strategies and Data Splitting. Land 2021, 10, 989. [Google Scholar] [CrossRef]
  30. Zhang, W.; Wu, C.; Zhong, H.; Li, Y.; Wang, L. Prediction of undrained shear strength using extreme gradient boosting and random forest based on Bayesian optimization. Geosci. Front. 2021, 12, 469–477. [Google Scholar] [CrossRef]
  31. Cortes, C.; Vapnik, V. Support-vector networks. Mach. Learn. 1995, 20, 273–297. [Google Scholar] [CrossRef]
  32. Cox, D.R. The regression analysis of binary sequences. J. R. Stat. Soc. Ser. B 1958, 20, 215–242. [Google Scholar] [CrossRef]
  33. Friedman, J.H. Greedy function approximation: A gradient boosting machine. Ann. Stat. 2001, 29, 1189–1232. [Google Scholar] [CrossRef]
  34. Quinlan, J.R. Induction of decision trees. Mach. Learn. 1986, 1, 81–106. [Google Scholar] [CrossRef]
  35. Lang, N. What Is Model Evaluation? Machine Learning. Data Base Camp. 2023. Available online: https://databasecamp.de/en/ml/model-evaluation-en (accessed on 12 February 2024).
  36. Manning, C.D.; Raghavan, P.; Schütze, H. Introduction to Information Retrieval; Cambridge University Press: Cambridge, UK, 2008. [Google Scholar] [CrossRef]
  37. Sasaki, Y. The Truth of the F-Measure; RIKEN Brain Science Institute Technical Report. 2007. Available online: https://www.researchgate.net/publication/268185911_The_truth_of_the_F-measure (accessed on 16 December 2024).
  38. Berthier, F.; Demange, J.; Iundt, F. Geothermal Resources of Harrat Khaybar and Harrat Rahat Progress Report 1400–1401 the Kingdom of Saudi Arabia; Saudi Arabian Deputy Ministry for Mineral Resources Open-File Report BRGM-OF-02-44; Ministry of Petroleum and Mineral Resources: Jiddah, Saudi Arabia, 1982; p. 116.
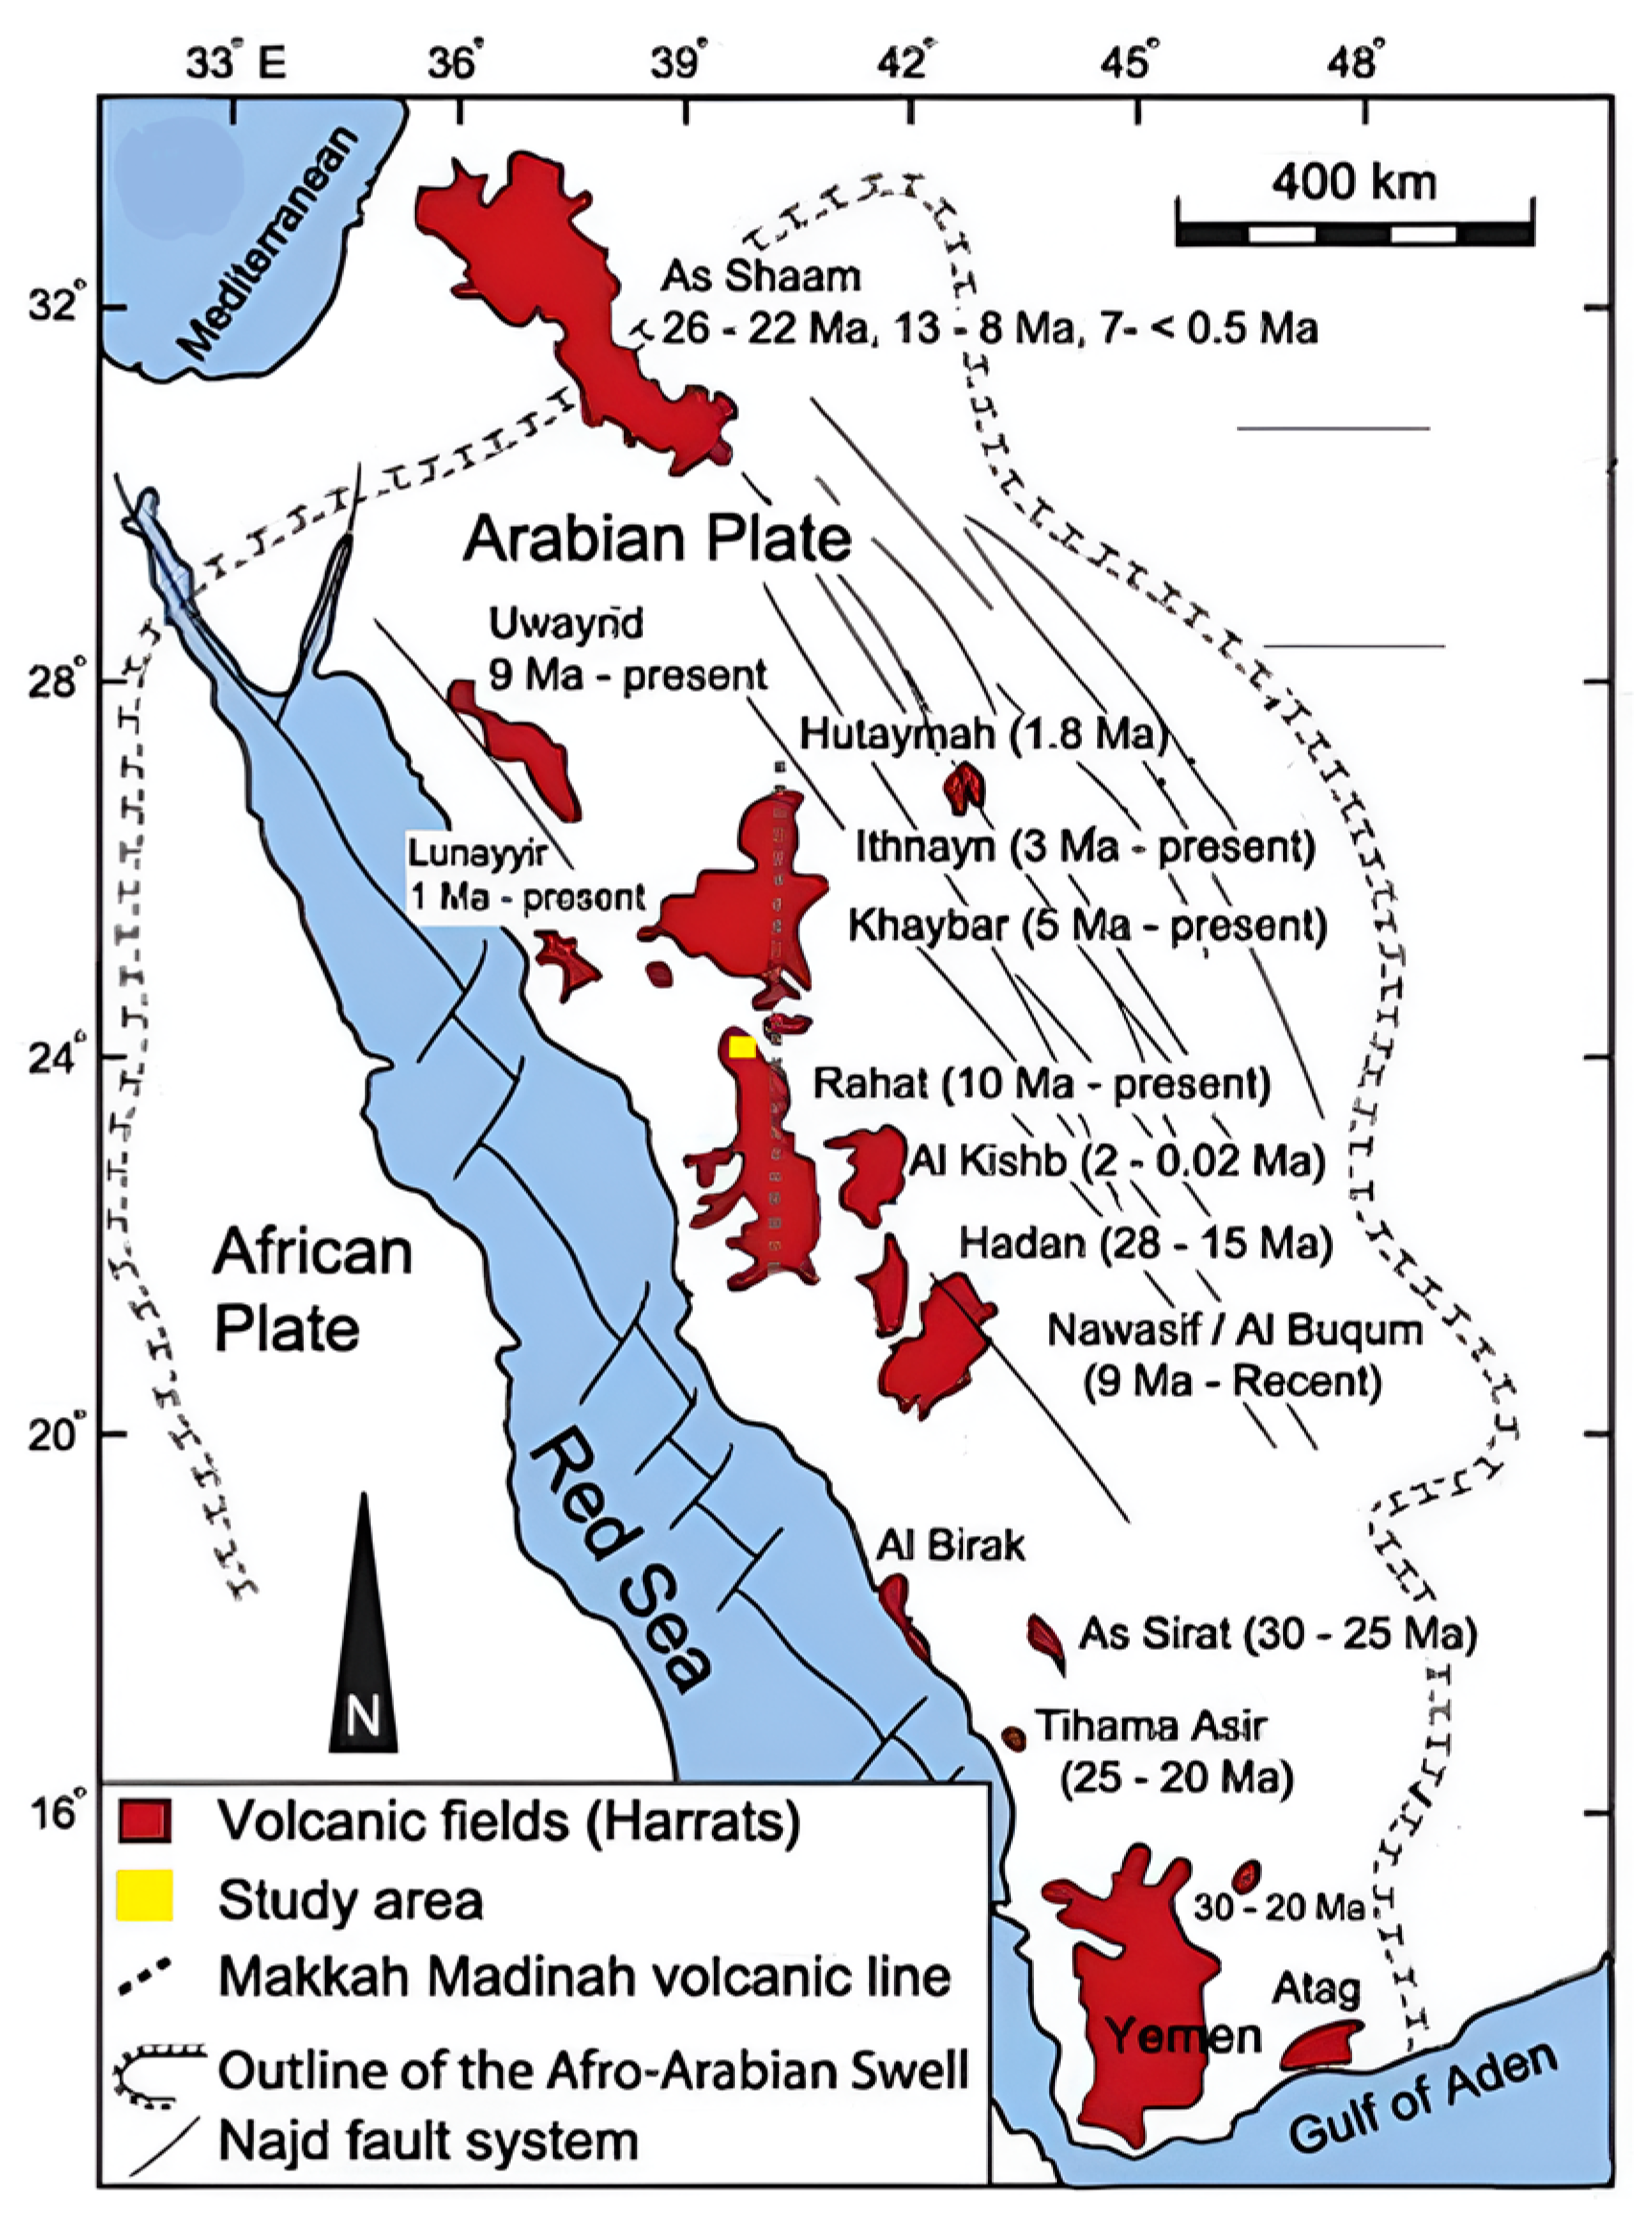
Figure 1. Western Saudi Arabia’s Cenozoic volcanic fields showing age distribution patterns (adapted from [14]). The yellow box indicates the research zone.
Geohazards 06 00049 g001
Figure 2. Geology of the study region [8].
Geohazards 06 00049 g002
Figure 3. Bouguer gravity anomaly map with known vent locations (vent sources: [8,12,13]).
Geohazards 06 00049 g003
Figure 4. Model performance plots of the tested models.
Geohazards 06 00049 g004
Figure 5. ROC analysis and AUC values for assessed algorithms. The ROC plot demonstrates the relationship between true positive rate and false positive rate across varying decision thresholds. Within the plot, the diagonal line extending from the bottom-left to the top-right (depicted in black) represents random guessing, while a curve bending towards the top-left corner indicates superior model performance, as demonstrated by the Random Forest model. Higher AUC metrics represent improved model proficiency at distinguishing positive from negative class instances.
Geohazards 06 00049 g005
Figure 6. Overlaid display of observed and forecasted volcanic vents plotted against the gravity anomaly map. The predicted outcomes reveal potential new vent locations while also identifying areas containing previously documented vents through our analytical methods. Spatial agreement between observed and modeled vent positions reaches 75% with a 95% degree of certainty (DC).
Geohazards 06 00049 g006
Figure 7. Kernel density estimation (KDE) maps showing the spatial distribution of (a) actual volcanic vent locations and (b) predicted volcanic vent locations in the Rahat volcanic field. Density surfaces were generated using a Gaussian kernel with a fixed bandwidth, applied uniformly to both datasets to ensure comparability. Warmer colors indicate higher vent concentration. The high degree of similarity between the two maps reflects the model’s ability to reproduce observed spatial patterns.
Geohazards 06 00049 g007
Table 1. Summary scores of evaluation metrics applied on methods.
ModelAccuracyPrecisionRecallF1-ScoreExecution Time
(mins)
1Logistic Regression0.6000.5920.6270.6090.080
2Decision Tree0.9270.9240.9300.9270.119
3Random Forest0.9500.9460.9550.9502.844
4Gradient Boosting0.7960.7680.8440.8052.436
5Support Vector Machine0.5590.5440.7020.61313.459
Disclaimer/Publisher’s Note: The statements, opinions and data contained in all publications are solely those of the individual author(s) and contributor(s) and not of MDPI and/or the editor(s). MDPI and/or the editor(s) disclaim responsibility for any injury to people or property resulting from any ideas, methods, instructions or products referred to in the content.