Article

How Exceptional Was the 2023–2024 Flood Sequence in the Charente River (Aquitania, South-West France)? A Geohistorical Perspective on Clustered Floods

by
Amélie Duquesne
* and
Jean-Michel Carozza
Department of Human and Social Sciences, La Rochelle University, LIENSs CNRS-UMR 7266, 17000 La Rochelle, France
*
Author to whom correspondence should be addressed.
GeoHazards 2025, 6(1), 3; https://doi.org/10.3390/geohazards6010003
Submission received: 4 December 2024 / Revised: 10 January 2025 / Accepted: 13 January 2025 / Published: 17 January 2025

Abstract

:
During winter 2023–2024, the Charente River experienced four successive flood events in six months, including one major flood and three moderate ones. These grouped floods affected a huge territory in the Charente valley, in particular the Territoire à Risque d’Inondation Important (TRI, i.e., Major Flood Risk Area) between Angoulême and Saintes (46 municipalities). Although they produced little immediate damage due to their slow kinematics and low flow speeds, they had a major impact on the functioning of the territory through prolonged house flooding and infrastructure disruption. This repeated flood sequence is all the more remarkable in that it occurs after the February 2021 extreme flood and a backdrop of severe and prolonged drought initiating in 2019. This article proposes to analyze grouped floods, a complex and little-studied hydrological phenomenon, from a geohistorical perspective in order to demonstrate that they are not emergent events and to look for historical precedents that show that these particular events have already occurred in the past but have been neglected or underestimated until now. Among past grouped flood sequences extending back to 1700, a significant similarity arises with the 1859–1860 flood sequence. In both cases, the first annual flood occurred early in the year in response to an early storm season and followed an uncommon hot and dry summer. Although the floods of 2023–2024 are well documented through both meteorological and hydrological data, as well as the surrounding context, the floods of 1859–1860 remain poorly constrained. By gathering a wide range of documentary sources and instrumental data, we try to better understand the context and the course of this past sequence of grouped floods, with particular emphasis on the first annual flood, the November 1859 flood. The analysis of similarities and divergences between sequences of past and recent grouped floods makes it possible to improve knowledge of their formation and course in order to better anticipate these particular events in the context of climate change.

1. Introduction

During the past three decades, Europe was affected by repeated high-intensity floods: October/November 2000 and July 2007 in the United Kingdom [1,2,3,4], August 2002, March-April 2006, June 2013, and June 2024 in Central Europe [5,6,7,8], July 2021 and November 2023 in North-Western Europe [9,10,11,12,13]. These disastrous events have demonstrated the high level of vulnerability of European societies and the need for flood risk reassessment based on historical data review. In this context, historical hydrology works have multiplied [14] in order to support future flood risk management and prevention strategies in Europe, for example, in the United Kingdom [15], Czech Republic [16], and Germany [17], and to enhance statistical and modeling approaches, in particular the reconstruction of historic flood discharges corresponding to high return periods to construct effective flood defenses, for example, in France [18], Germany [19], and the Netherlands [20].
Previous works on historical floods have focused on the long-term flood chronologies reconstruction from various historical and/or field sources [21,22,23,24] but also on reconstructing historic flood discharges, better understanding the temporal and spatial hydrometeorology of the flood events, reconstructing maps of the spatial extent of past flooding for comparison with risk mapping, analyzing the long-term trends of floods, including their frequency, magnitude, and seasonality, and improving statistical models to better predict future flood events. Knowledge on historical floods is crucial to anticipate the impacts of climate change on flood regimes and help to enhance the memory of floods and risk culture. Studies have been both European [23,24,25] and regional in scale, such as in the United Kingdom [26,27,28,29], Czech Republic [14,16,30,31,32], Germany [33,34,35,36,37], Netherlands [38], Switzerland [39,40], Spain [41,42,43,44,45], and Norway [46,47,48]. However, few studies have focused on the occurrence of repeated grouped floods at a sub-annual time scale.
Since the late 2000s, these works have also increased in number in France but remain focused on large, high-energy rivers with major human, material, functional, and patrimonial issues. This is the case for the Seine River [49], the Loire River [50,51,52], the Rhône River [53,54], or the Rhine River [20,36,55]. Small mountain rivers affected by flash floods have also received special attention because of their potentially destructive impact in the Languedoc [56,57,58,59], the Pyrenees [60,61,62], the Alps [63,64,65,66], the Massif Central [67,68], and the Vosges [69,70,71,72,73].
Small, low-energy rivers have received more limited attention to date, even though they are common in the plains of western and northern France, although these “ordinary rivers” [74] experience uncommon floods like during winter 2023. This is also the case with the Charente River [75]. The low level of attention by scholarly works can be explained by the unspectacular nature of these floods, causing little damage to people as a result of slow flood dynamics (water rises over several days, low flow velocities, moderate flood discharges). Floods in the Charente River are rarely deadly, and warning systems help evacuate the most threatened areas in advance. In addition, the repeated occurrence of floods of moderate intensity (return frequency between 2 and 5 years), the rarity of extreme floods, and the low human mortality and damage are not conducive to the production of documentary archives enabling the reconstruction of past floods. The scarcity of the historical sources available has severely limited the number of historical hydrology studies on these “ordinary rivers” and has consequently led to a lack of knowledge about past floods.
As they concern a large part of the territory, the knowledge on hydrometeorological background of the floods, their spatial extent, the reconstitution of the higher level they reach, the estimation of pic flow, and their return frequencies, as well as the reconstitution of long-term chronologies and trend analysis, including frequency, intensity, and seasonality, are crucial to better manage risks in the future. Indeed, climate change represents a major challenge for these ordinary rivers [76]. Rising temperatures, combined with increased precipitation, are expected to lead to more frequent and intense floods [77,78] and to major social, economic, and political impacts. The current frequency of floods in Europe is already exceptional compared to the last 500 years [24].
This year (2023–2024), the Charente River has experienced an unusual succession of four repeated floods in six months, including one major flood and three moderate ones. These events are all the more remarkable in that they come barely two years after the major flood in February 2021 and succeeds a severe and prolonged drought beginning in 2019. This phenomenon of grouped floods remains yet little studied, both from the point of view of their causes and their hydrological organization, and constitutes a risk that is often underestimated and unknown, particularly in urban areas. The understanding of these complex hydrological phenomena is a major issue for risk management in the context of climate change, where such events could multiply, leading to significant material damage and major disruption, particularly on low-energy rivers such as the Charente River, where flood durations are long (from a few days to several weeks).
This article proposes to analyze grouped floods, a rare (or scarcely studied) complex hydrological phenomenon, through a geohistorical approach. The main objectives are to demonstrate that repeated floods, such as those observed in 2023–2024 on the Charente River, are not isolated events and to search for historical precedents that show this type of event has occurred in the past but has been neglected or underestimated until now. The analysis of grouped flood sequences, whether past or recent, allows for the identification of both similarities and differences, providing better insight into the potential occurrence of future events in the context of climate change. However, this comparative approach has its limits, as these particular events occurred under different climatic conditions, data collection contexts, and societal vulnerability levels.

2. Study Area

2.1. The Charente River

Located on the Atlantic coast in southwest France, the Charente River is a low-energy (10 W·m−2) and low-gradient river (0.00086 m·m−1) (Figure 1). The watershed drains 10,550 km2. The river has its source in Chéronnac (296 m a.s.l.) and flows for 365 km before reaching the Atlantic Ocean at Port-des-Barques, where it forms a wide estuary (3 m a.s.l.). In the upper section, between Mansle and Angoulême, the Charente River adopts a complex anastomosed channel pattern [79] in the sense defined by Nanson [80]. Downstream of Angoulême, the fluvial pattern evolves towards a simplified anastomosing pattern and then switches to a meandering style with reduced lateral mobility downstream of Cognac [81,82,83].
The Charente River basin is composed of three major geological domains [84]. The first domain comprises metamorphic and granitic complexes from the Massif Central located in the upstream section. The second domain is characterized by monoclinal Jurassic limestone situated in the north of a line connecting Angoulême and Rochefort. The latter domain corresponds to folded anticline-syncline structures within Cretaceous sandy-clay detritic deposits to the south of this line. These deposits are overlapped by Holocene fluvio-marine deposits in the lower part of the catchment [85]. The impermeable clay-loam soils encourage water runoff. Infiltration potential is therefore limited, with the exception of the Angoumois karstic zone, including the Tardoire, Bonnieure, and Touvre basins. The Charente River basin shows a temperate oceanic climate classified as Cfb in the Köppen climate classification system. It is characterized by cool winters with a mean temperature of 6 °C in January and moderately warm summers with a mean temperature of 20 °C in July. Precipitation ranges between 700 mm in the coastal part and over 1000 mm in the eastern part, with an annual average rainfall of 800 mm [86].

2.2. The Charente River Floods Regime

The Charente River features a rain-evaporation regime representative of Atlantic lowland rivers. The flow regime can be described from the Chaniers gauging station [87] located in the middle Charente River (Figure 1). The high-water stage occurs from December to March with a maximum mean discharge in February (147 m3·s−1) and the low-water stage extends from July to October with a minimum mean discharge in September (17 m3·s−1) (Figure 2). The mean annual discharge is 66 m3·s−1 and two-year flood reach 283 m3·s−1. The highest discharge is 550 m3·s−1 and was recorded on 8 February 2021 and corresponds to a 20-year flood.
The floods of the Charente River mostly occur in winter, particularly between December and February, generated by prolonged and/or intense precipitation from westerly lows, the second flood season being spring [75]. Autumn floods are much rarer and occur after heavy rainfall in October. Two flood types are documented in the Charente River related to the characteristics of rainfall events (i.e., duration and intensity).
The first type concerns floods generated by short (a few days) but intense rainfall events at the basin scale. The flood wave is brief but often intense and particularly concerns the upper part of the watershed. When the flood wave propagates downstream, it is attenuated by overflows over the floodplain. Water levels are higher in Angoulême but more moderate in Saintes, as the contribution of downstream tributaries is weaker. The 1962 March-April flood is representative of this flood type. In the space of four days (25, 27–29 March), 105 mm of precipitation fell at the Saintes meteorological station, equivalent to 71% of the monthly total. The event was characterized by a short and intense water level in the upper watershed. The maximum water level reached 5.50 m on 1 April 1962 at Angoulême and 5.78 m on 5 April 1962 at Saintes.
The second type results from persistent rainfall events (one week or more). The flood wave lasts several days and intensifies downstream as a combination of persistent rainfall in the upper watershed and the contribution of tributaries (e.g., Antenne River, Né River, and Seugne River). Water levels are more moderate at Angoulême and higher at Saintes. The 1982 December flood corresponds to this type. In 1982, October and November were very rainy. In December, however, rainfall was abundant and continued for 17 days. The mean rainfall was 243 mm on the Charente, three times more than normal. The December 1982 100-year flood reached 5.57 m (620 m3·s−1) on December 22 at Angoulême and 6.84 m (815 m3·s−1) on 24 December at Saintes (Table 1).
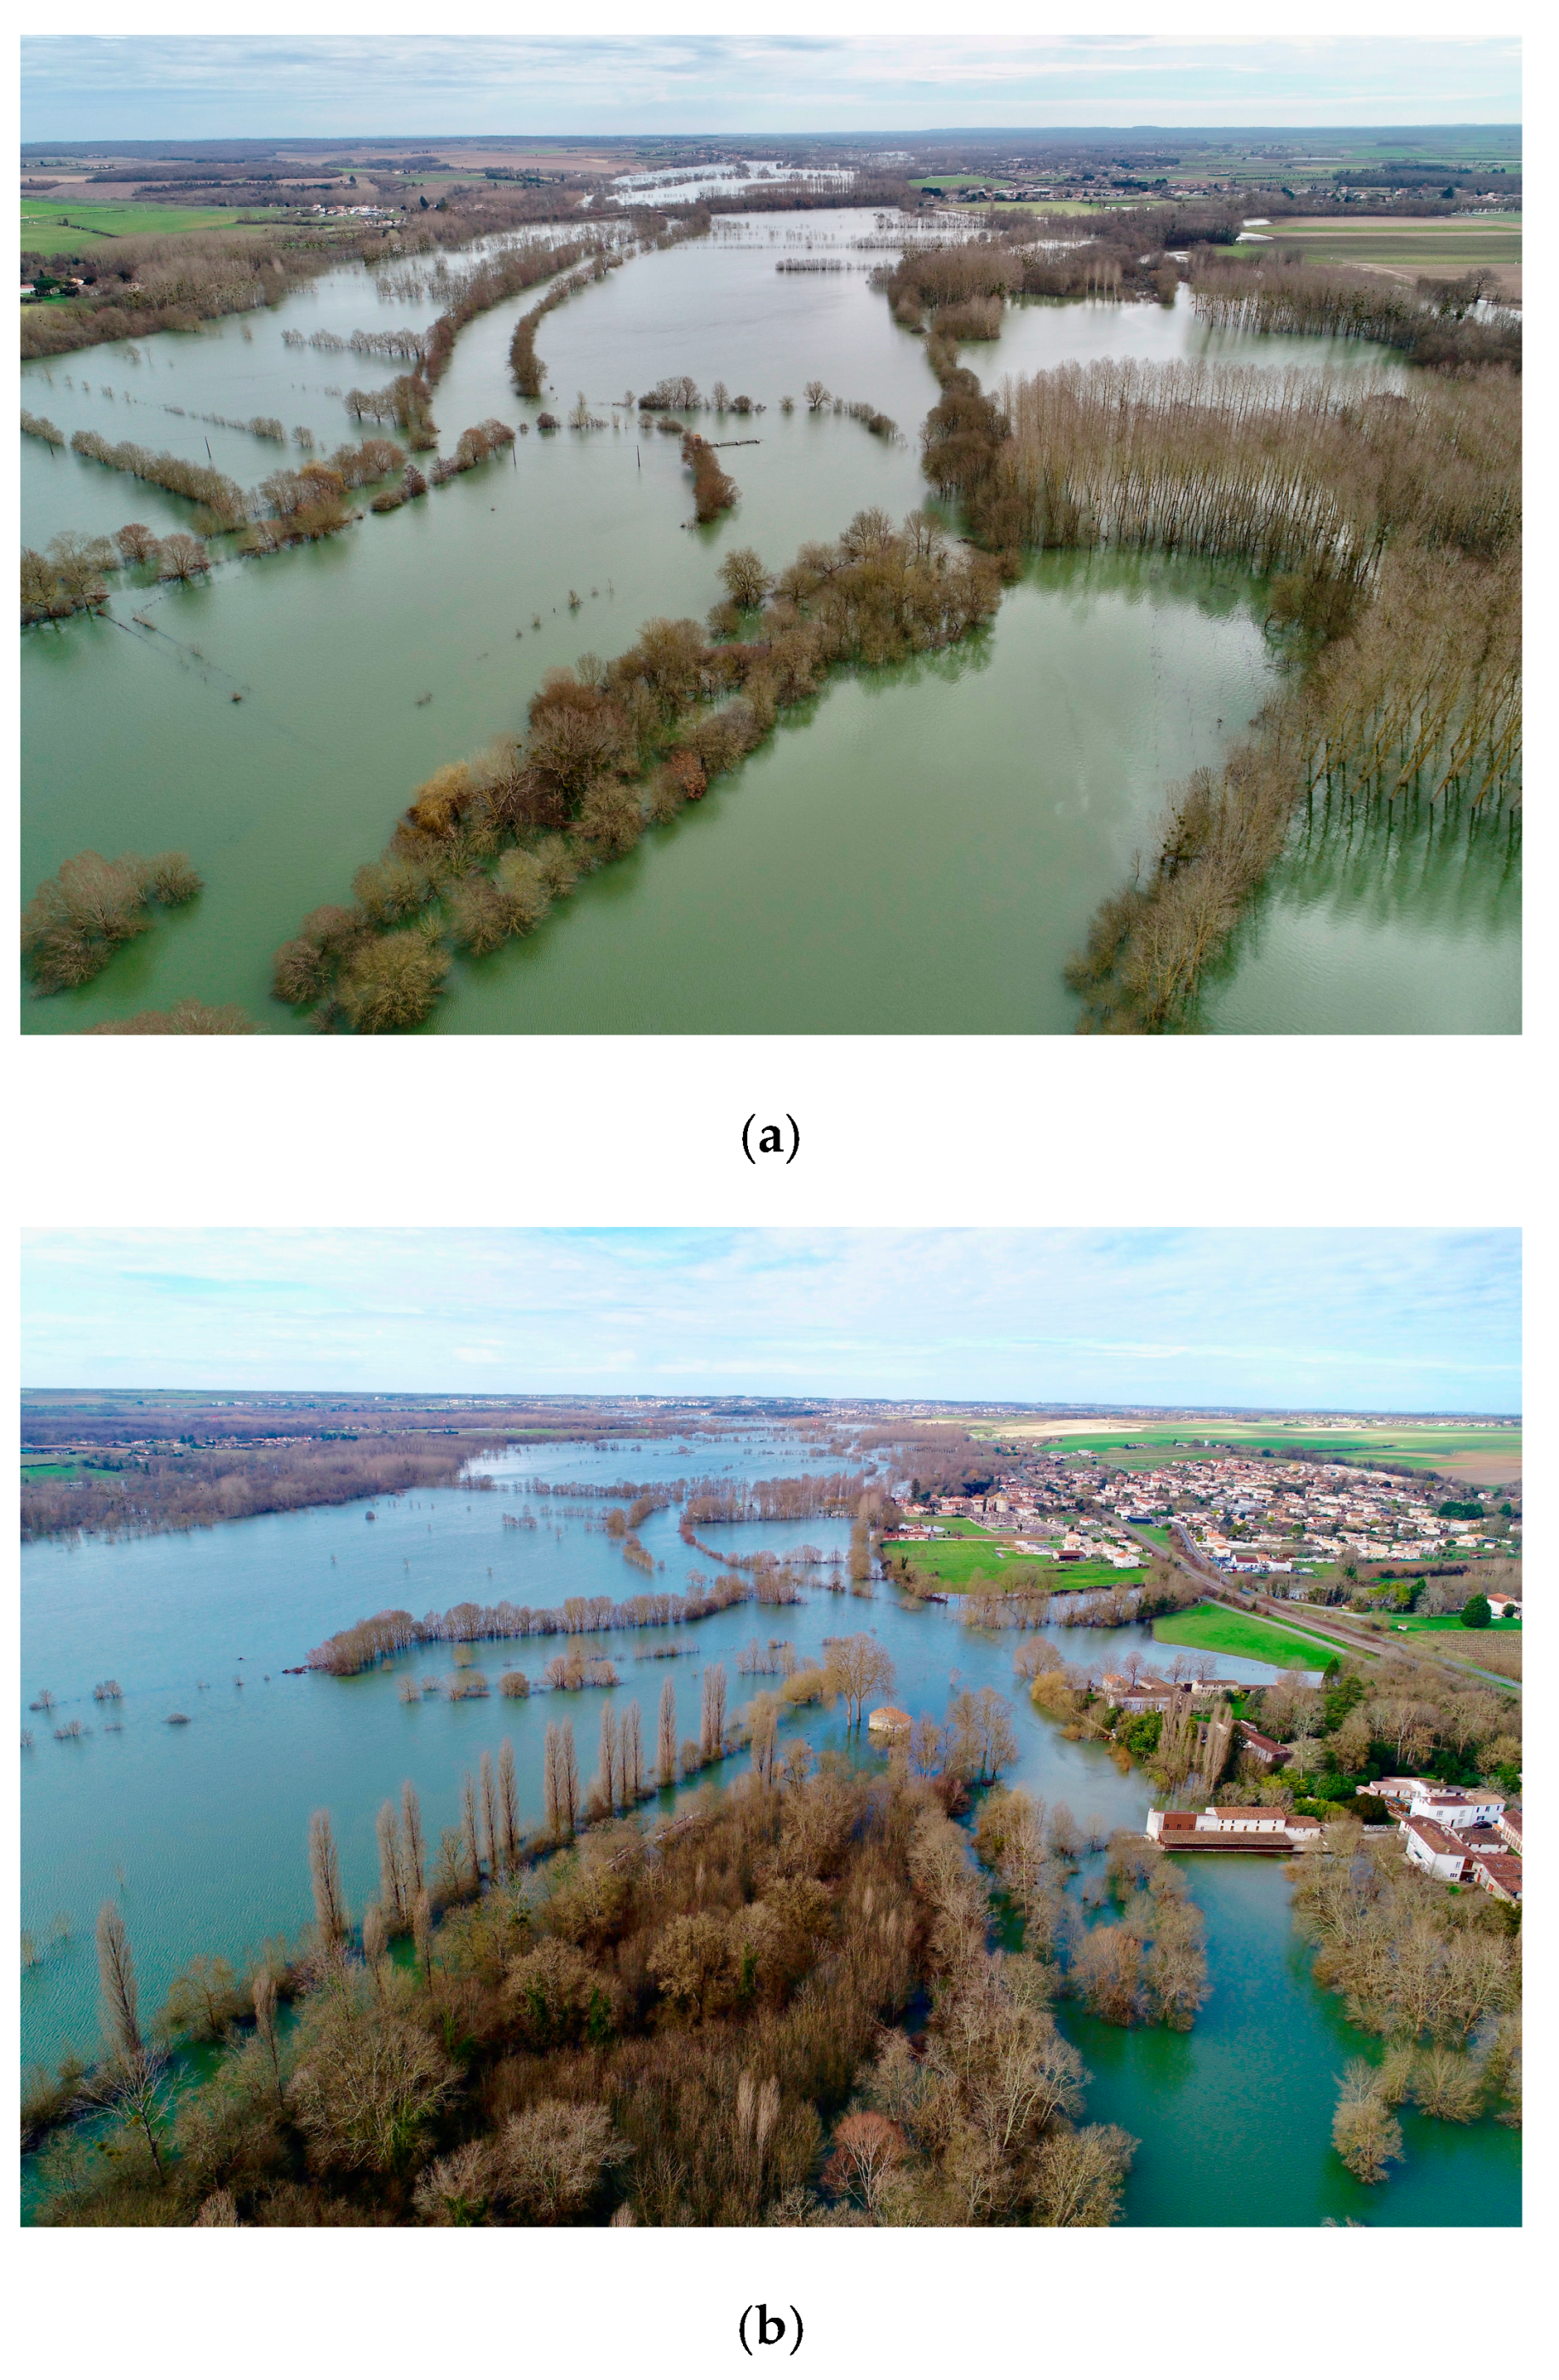
The floods of the Charente River are characterized by slow kinematics and extend over a wide floodplain up to three km in width (Figure 3). The water level rises very slowly and lasts from a few days to one week or more. The maximum flood wave spreads in 24 h from Mansle to Angoulême and in 48 to 72 h from Angoulême to Saintes. Water level decrease is even slower and ranges between 10 and 30 days. Flood periods are consequently very long (from a few days to several weeks).
Despite the intensity and duration of the floods, flow velocities are low. These floods are not life-threatening. However, they can cause significant damage and major disruption (roads cut off, houses flooded, damage to engineering structures, degradation of electricity, gas, and water supply networks, water pollution from waste, etc.) because the river flows through several towns, including Angoulême, Jarnac, Cognac, Saintes, and Rochefort.
The flood dynamics in the Charente River are a consequence of the river’s very low gradient, particularly in the downstream section as far as the estuary (i.e., ~0.00004 m·m−1), the weak width of the mean water channel, and the reduction in the floodplain (wooded areas, pastoral areas, etc.) by urbanization. The presence of bottlenecks in the floodplain also contributes to increased flood levels upstream and slows down the free flow of water during floods, particularly at Saintes, where the floodplain is abruptly reduced from 1 km to 40 m. The rising tide associated with high tidal coefficients can slow the evacuation of floodwaters and amplify the flood event in the downstream section of the river, at least as far as Saintes.

2.3. The 2023–2024 Floods Sequence

2.3.1. The November 2023 Flood

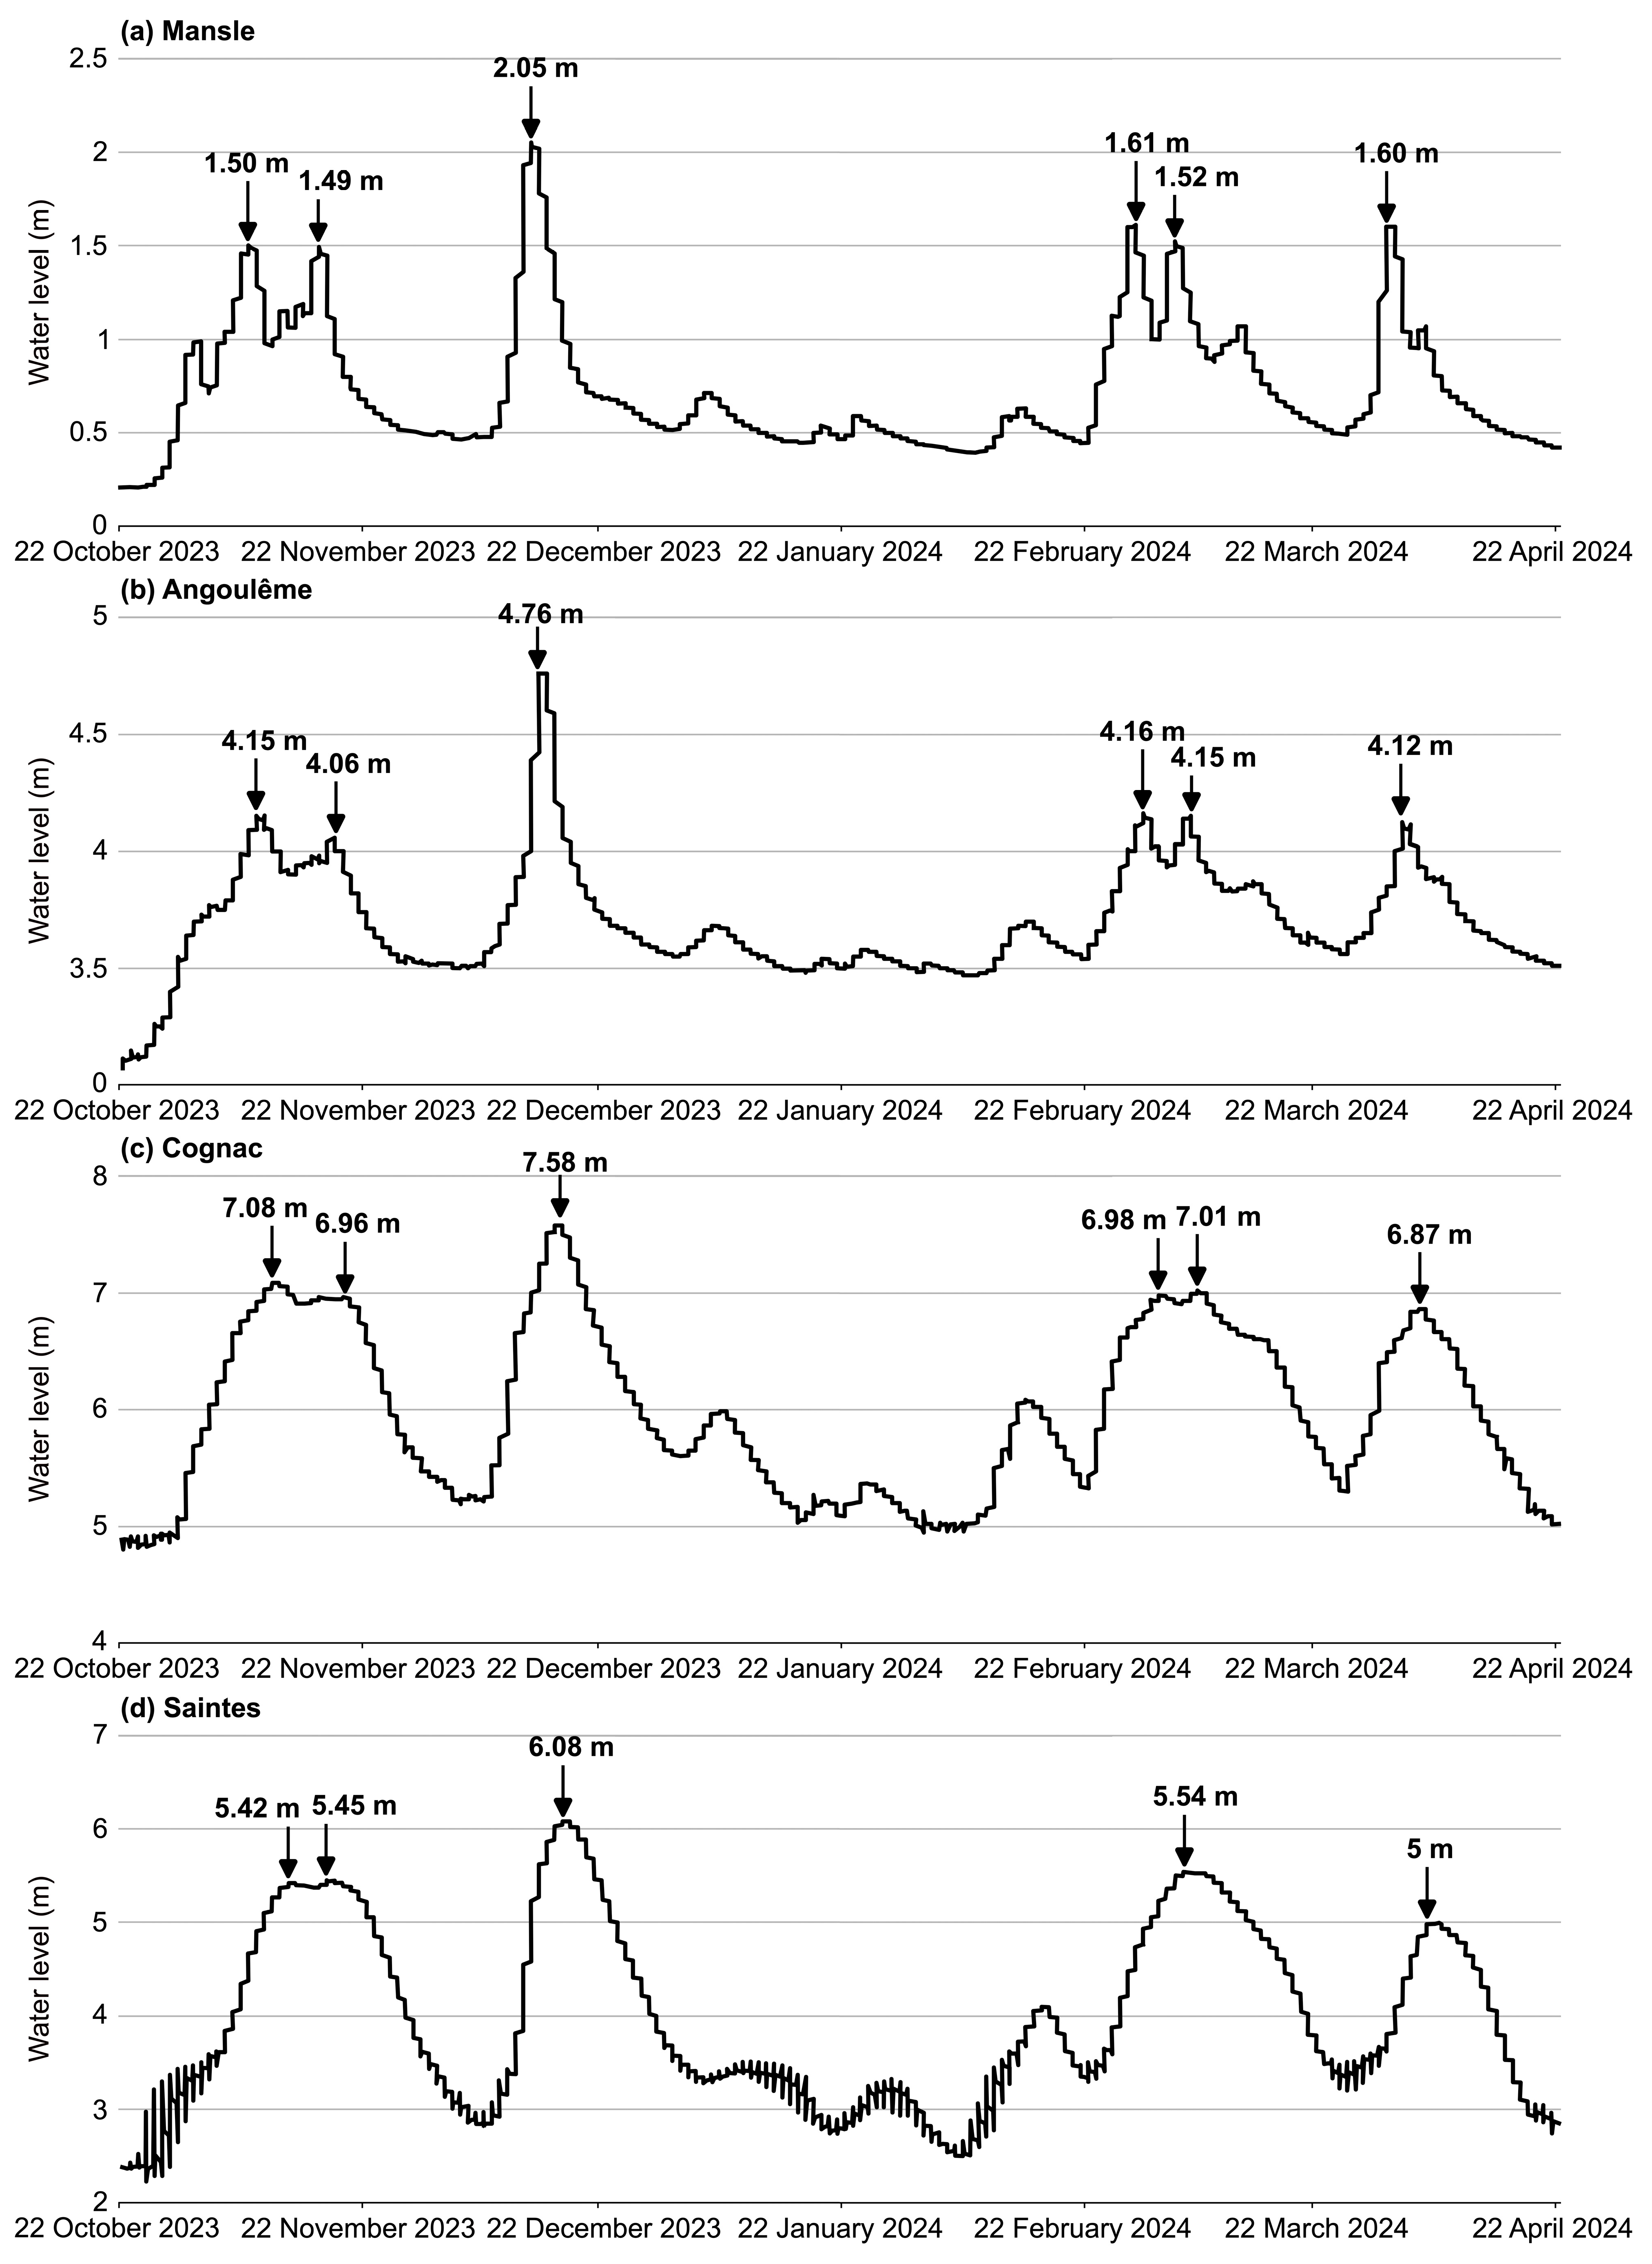
The November 2023 flood forms in the Upper Charente watershed, upstream of Mansle, after the first rainfall episode generated by storm Céline (27–30 October). This flood lasts between three and four weeks over the Charente watershed. The Charente River reaches a first flood peak of 1.50 m on 7 November at Mansle, 4.15 m on 8 November at Angoulême, 7.08 m on 10 November at Cognac, and 5.42 m on 12 November at Saintes (Figure 4). As the waters began to fall in the upper section, further heavy rainfall from storms Elisa (9–11 November) and Frédérico (14–16 November) generated a second distinct flood peak on the Upper Charente River and a period of relative calm between the two flood peaks on the Lower Charente River. The Charente River records a second peak of 1.49 m on 16 November at Mansle, 4.06 m on 18 November at Angoulême, 6.96 m on 19 November at Cognac, and 5.45 m on 17 November at Saintes. The November 2023 flood is associated with a 4-year flood on the Charente watershed.

2.3.2. The December 2023 Flood

The December 2023 flood is a generalized event affecting the Charente River and its tributaries. It begins towards the end of the first decade of December and lasts about two weeks over the Charente watershed. The Charente River shows one flood peak (Figure 4). The Upper Charente River reaches 2.05 m on 13 December at Mansle and 4.76 m on 14 December at Angoulême. As the waters begin to fall in the upstream section, the flood wave continues to propagate downstream of Angoulême and increases downstream of Cognac due to significant inflows from the Né and Seugne Rivers. The Charente River features a flood peak of 7.58 m on 16 December at Cognac and 6.08 m on 17 December at Saintes. The December 2023 flood corresponds to a 7-year flood on the Upper Charente River and a 10-year flood on the Lower Charente River.

2.3.3. The February–March 2024 Flood

The February–March 2024 flood begins at the end of the last decade of February and lasts almost a month on the Charente watershed. The Charente River reaches a first flood peak of 1.61 m on 28 February at Mansle, 4.16 m on 29 February at Angoulême, and 6.98 m on 3 March at Cognac (Figure 4). In response to a new rainfall episode, the Upper Charente River reacts by forming a second, very distinct flood peak. The river records 1.52 m on 4 March at Mansle, 4.15 m on March 6 at Angoulême, and 7.01 m on 7 March at Cognac. Downstream, because of the rapid propagation of the second flood wave, the Charente River features one flood peak, spread out over time. At Saintes, the maximum reaches 5.54 m on 5 March. The February–March 2024 corresponds to a 4-year flood.

2.3.4. The March–April 2024 Flood

The March–April 2024 flood ends this hydrological sequence (Figure 4). The flood occurs in the Upper Charente basin, upstream of Mansle, and lasts about two weeks. The Charente River records one flood peak. The Upper Charente River reaches a maximum of 1.60 m on 31 March at Mansle, 4.12 m on 2 April at Angoulême, 6.87 m on 4 April at Cognac, and 5 m on 6 April at Saintes. The March–April 2024 flood is associated with a 3-year flood in the Charente basin.
This succession of closely spaced, early floods is a situation that river managers have described as unprecedented and related to the changes in precipitation patterns resulting from climate change. We therefore looked at the flood chronology on the Charente River to see if there were any similar patterns and their meteorological context.

3. Materials and Methods

3.1. Meteorological Data

For the 20th and 21st centuries, annual, monthly, and daily precipitation and temperature data were gathered from several meteorological stations managed by Météo-France [91] located throughout the Charente watershed (Figure 1 and Table 2). For the 19th century, annual and monthly precipitation data were collected at two rainfall stations located in the Charente watershed (Rochefort and Saint-Jean-d’Angély). Temperature data were recovered at the La Rochelle meteorological station, situated outside the watershed. The pressure data and associated maps were obtained from Wetterzentrale [92] based on version 3 of the 20th Century Reanalysis system supported by the National Oceanic and Atmospheric Administration (NOAA), the Cooperative Institute for Research in Environmental Sciences (CIRES), and the Department of Energy (DOE) [93]. These data were used to analyze and describe the annual and seasonal weather conditions and individual weather events that precede each flood.

3.2. Hydrological Data

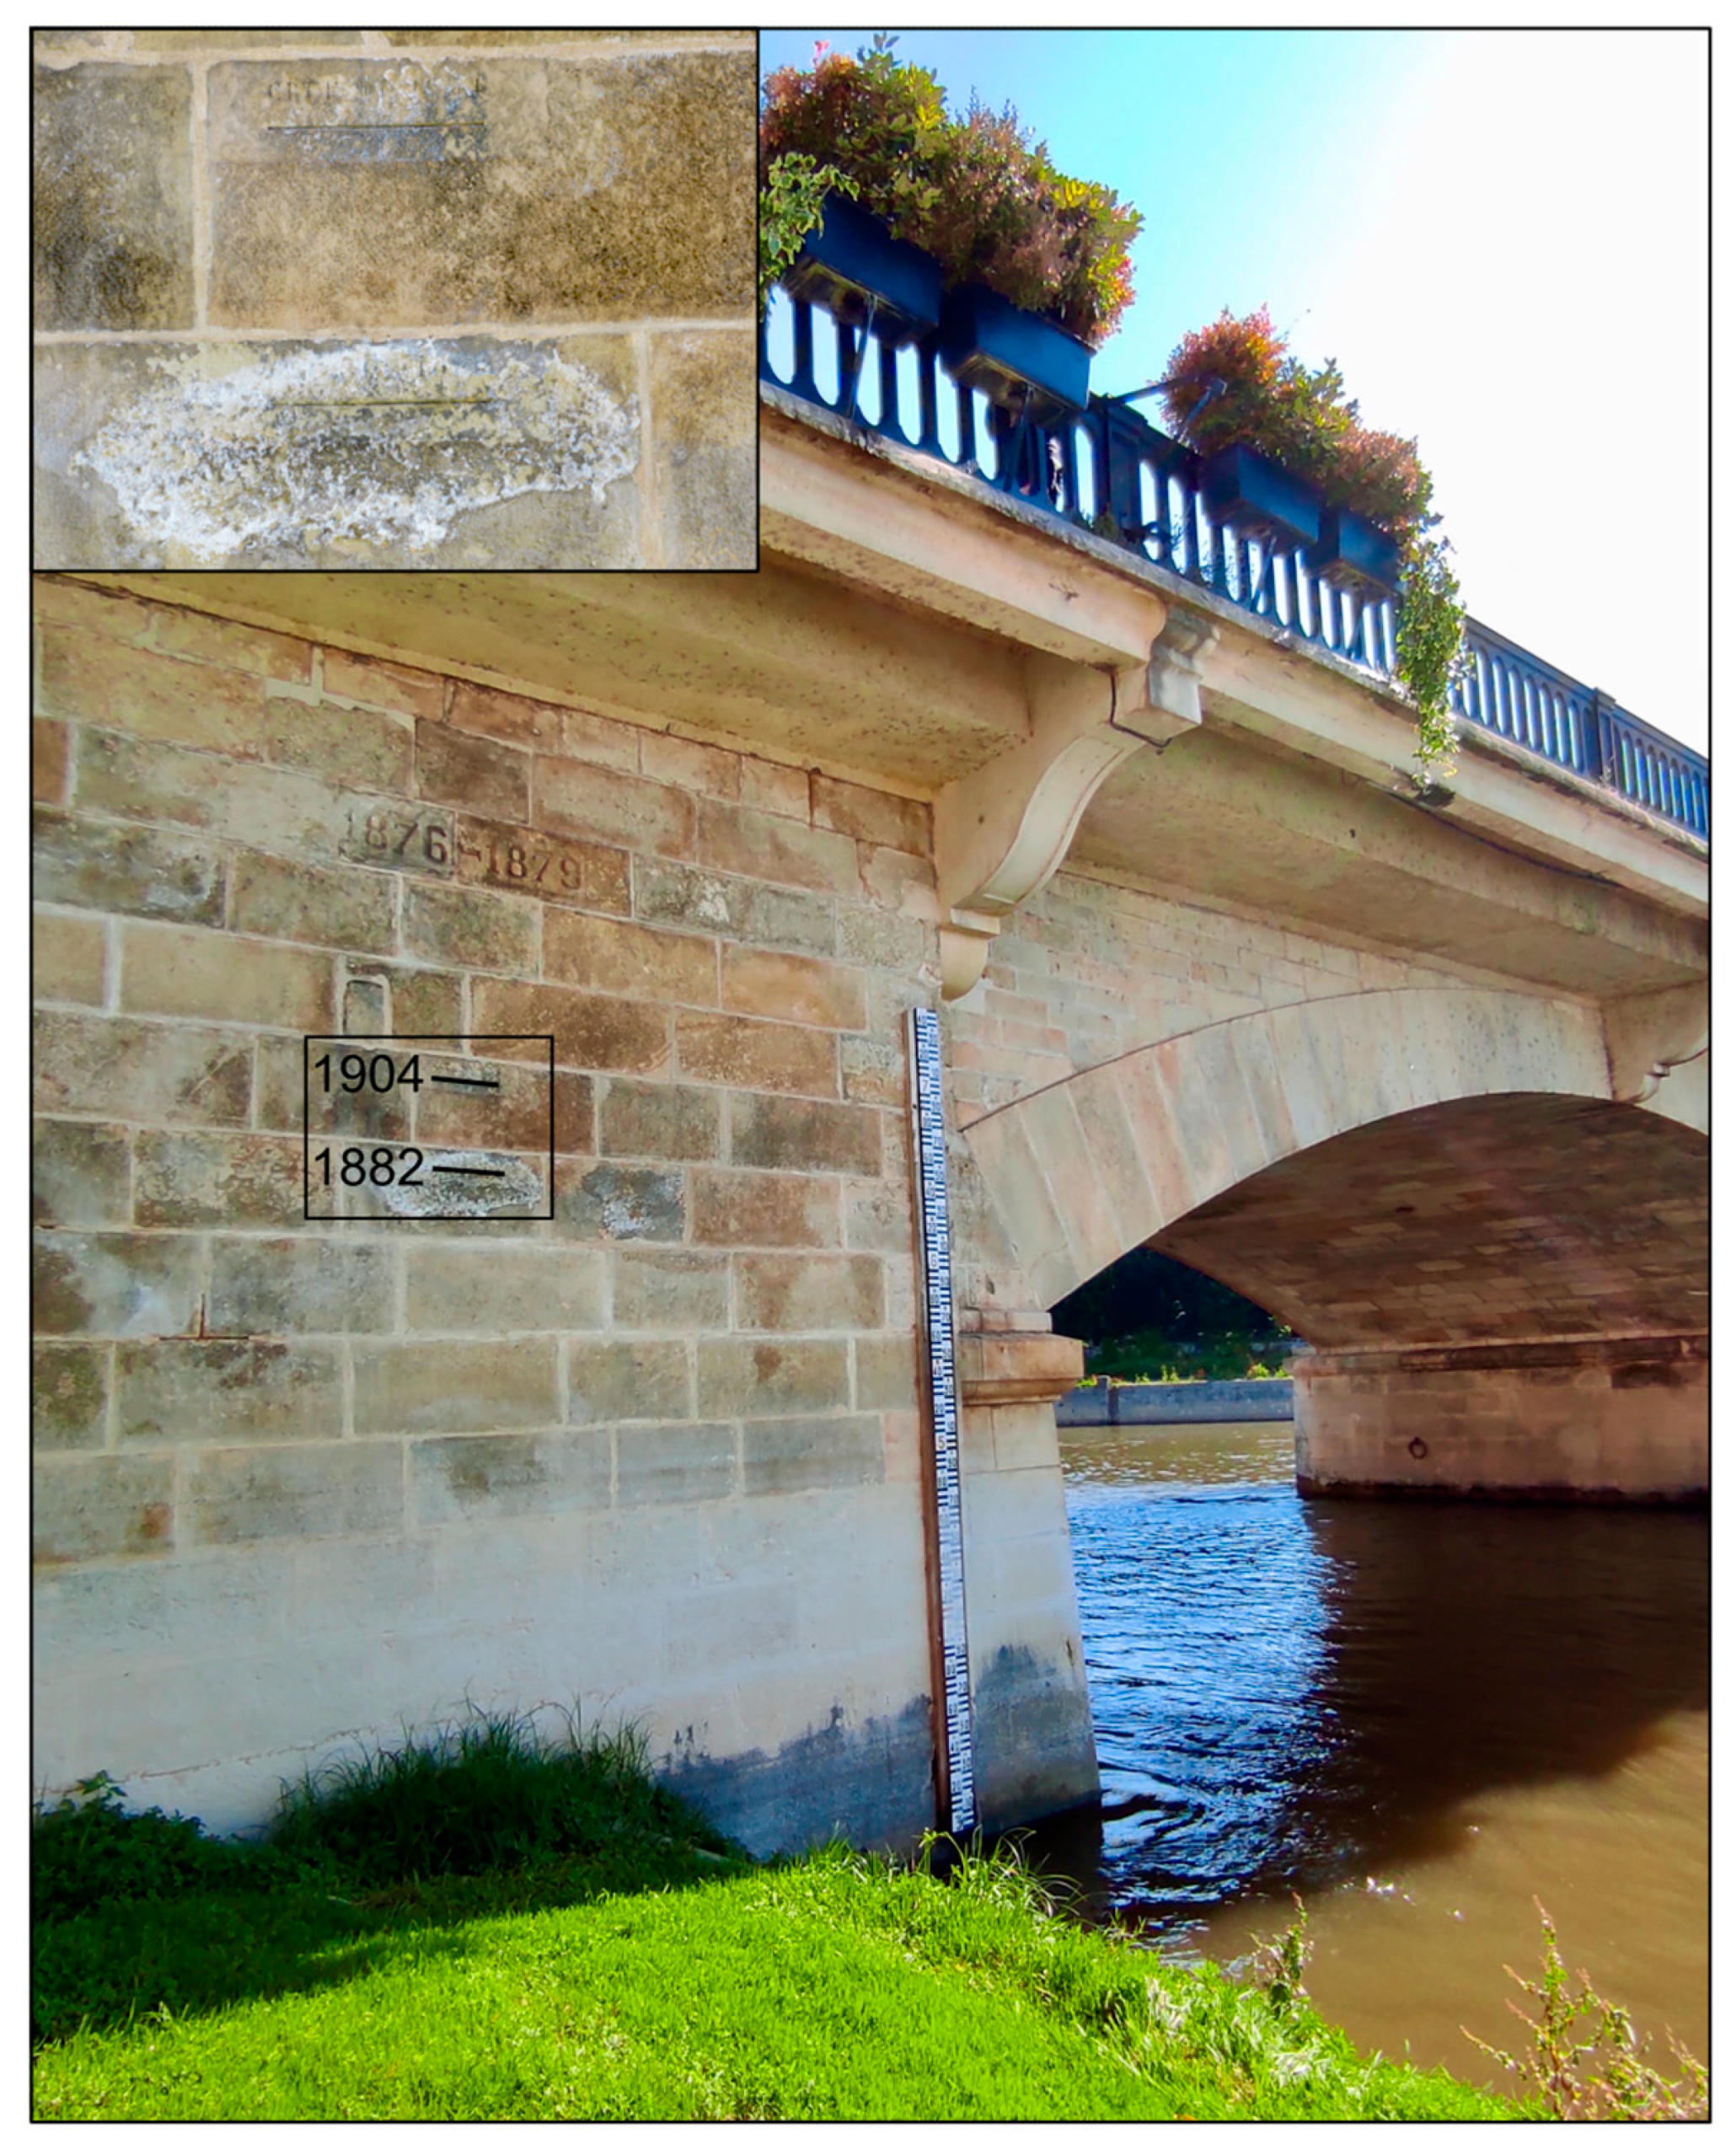
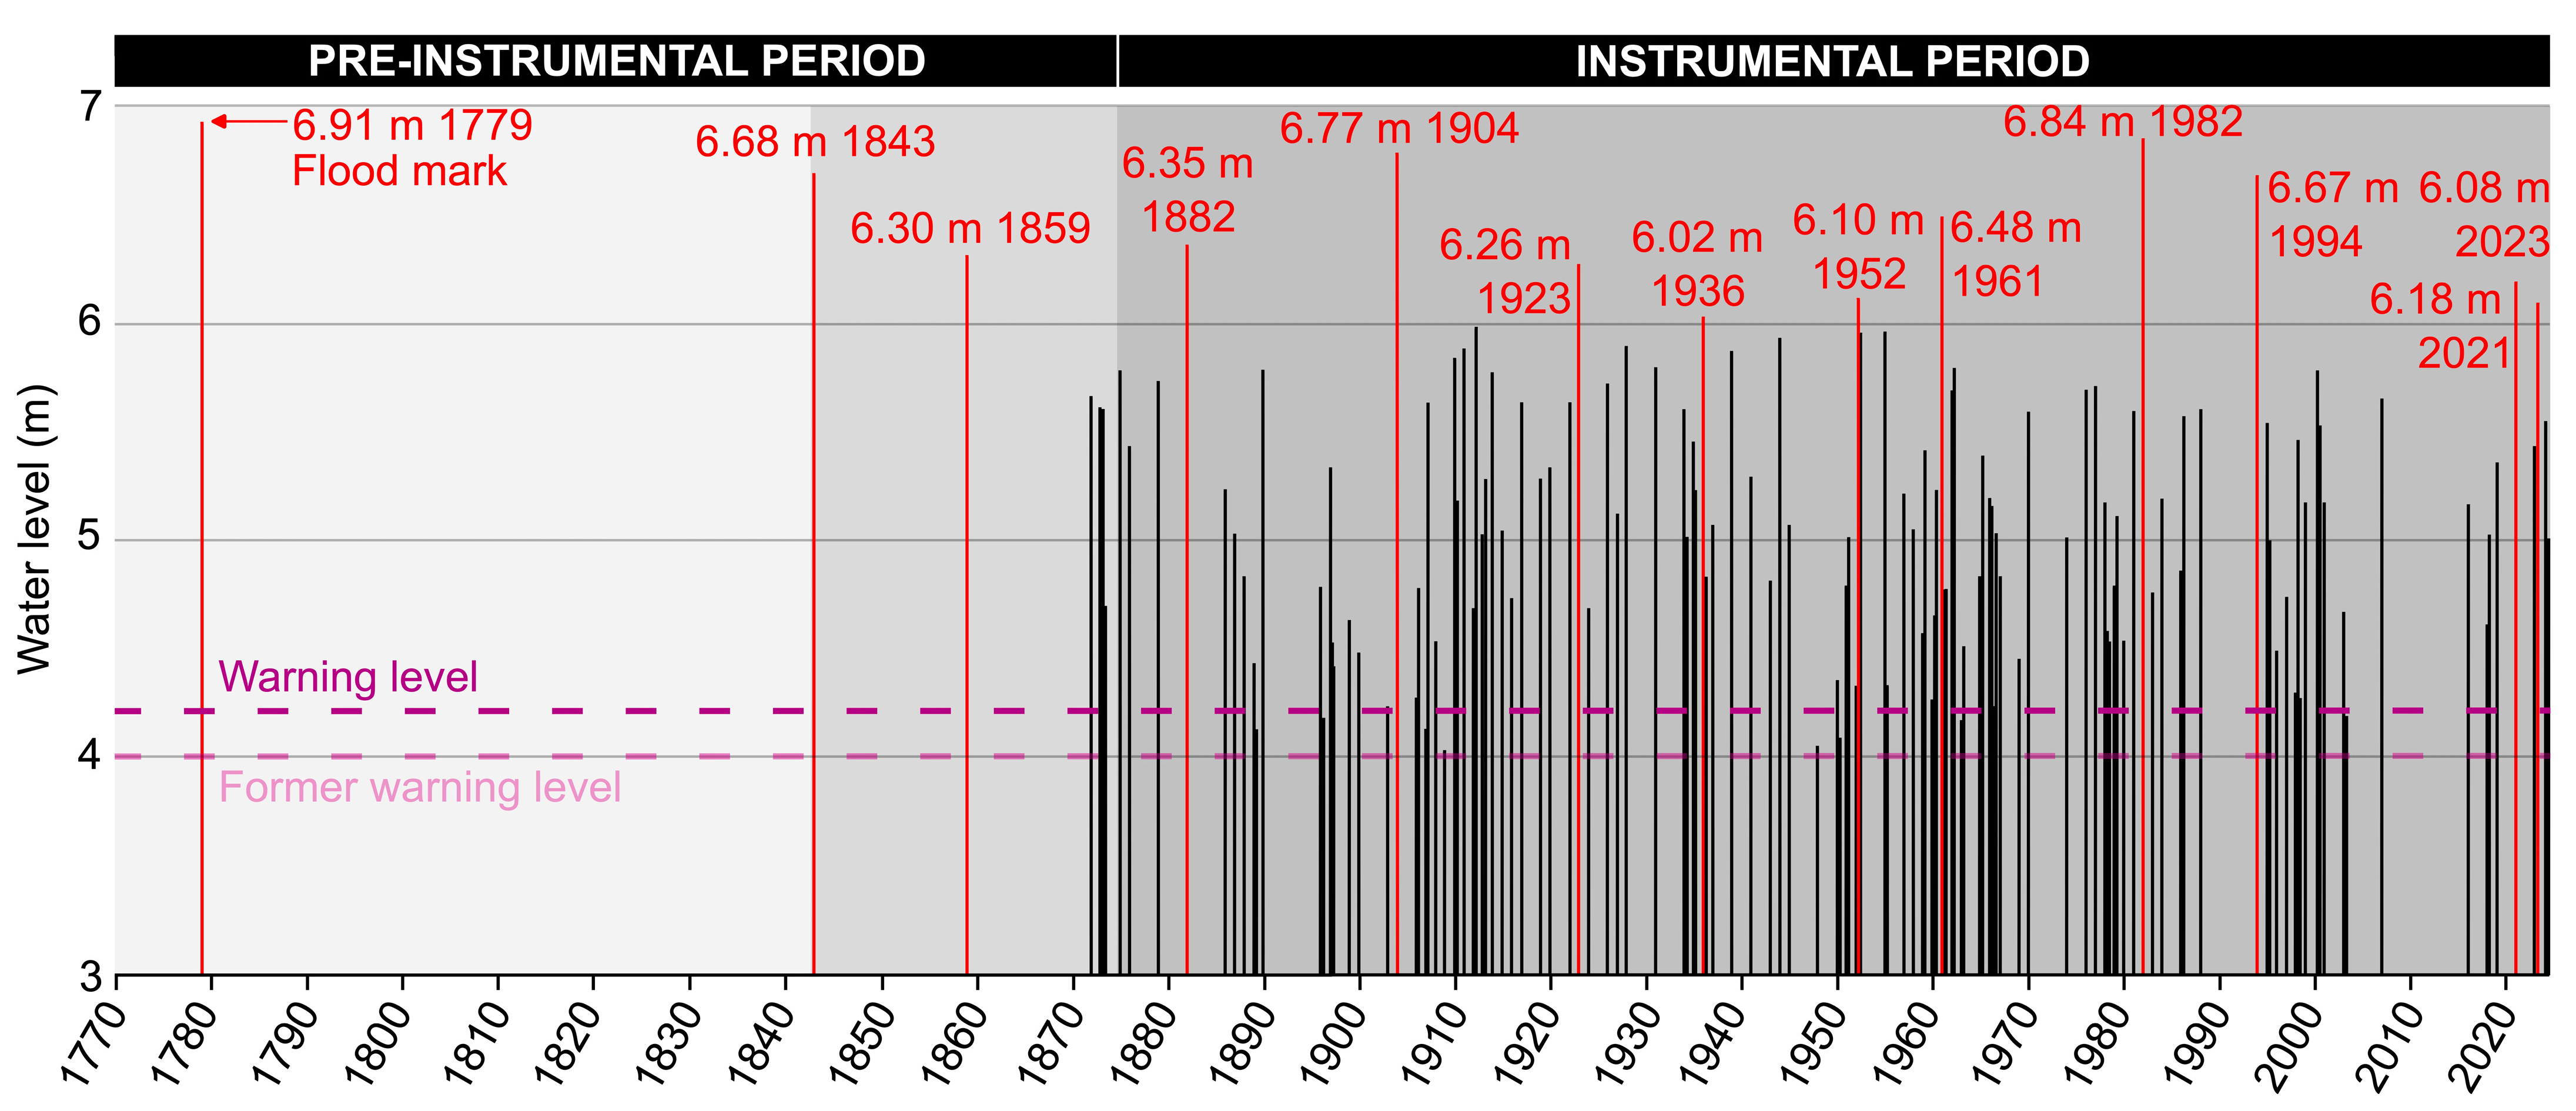
Water level measurements were collected from the website Vigie-crue [90] for several hydrological stations located on the Charente River (Figure 1 and Table 3) to reconstruct the course of the four floods of the 2023–2024 winter period. Historical water level data were retrieved from the archives of the Ponts-et-Chaussées engineering corps (1843–1916), the Service d’Annonce des Crues (1916–1987), and the Direction Régionale de l’Environnement, de l’Aménagement et du Logement de la Nouvelle-Aquitaine (1988–Actual) in order to place these recent events in the long flood chronology. A chronicle of water levels was reconstructed at Saintes at the limnimetric scale located upstream of the Pont Palissy during the 1875–2024 period as it presents the oldest data (Figure 5). Floods higher than the 4 m warning level at Saintes (n.b. 4.20 m today) were included. Water levels reached by floods before 1875 were added to this chronicle. Hydrological measurements between 1843 and 1875 were provided by a Ponts-et-Chaussées sub-engineer to the Société des Archives Historiques [94]. They must be considered with a degree of caution, as they were recorded at the level of the old bridge (January 1843 flood) or the hanging bridge, now Pont Palissy (November 1859, December 1872, January and March 1873 floods). This chronicle of water levels at Saintes is currently the most exhaustive on the Charente River.

3.3. Documentary Sources

For the pre-instrumental period, the data on the historical floods was compiled from various documentary sources, using the historical collection method proposed by Brázdil et al. [14] and Barriendos et al. [21]: secondary sources, historical archives, local newspapers, iconographic documents, and epigraphic records. These historical records, most dating from the 19th century, made it possible to document the number of annual floods as well as the seasonality and severity of the events when the hydrological data are incomplete or missing.

3.3.1. Secondary Sources

Secondary sources were first consulted but are very limited. Some historical floods affecting the Charente River during the 18th and 19th centuries are mentioned, notably in Champion [95]. This research is detailed and occasionally refers to the sources consulted (newspapers, books, etc.). However, this chronology of past floods is not exhaustive. Only catastrophic flood events were reported. Low-intensity floods are not considered noteworthy, due to their repeated frequency and limited material damage. Only floods attested by other sources have been included in this work.

3.3.2. Historical Archives

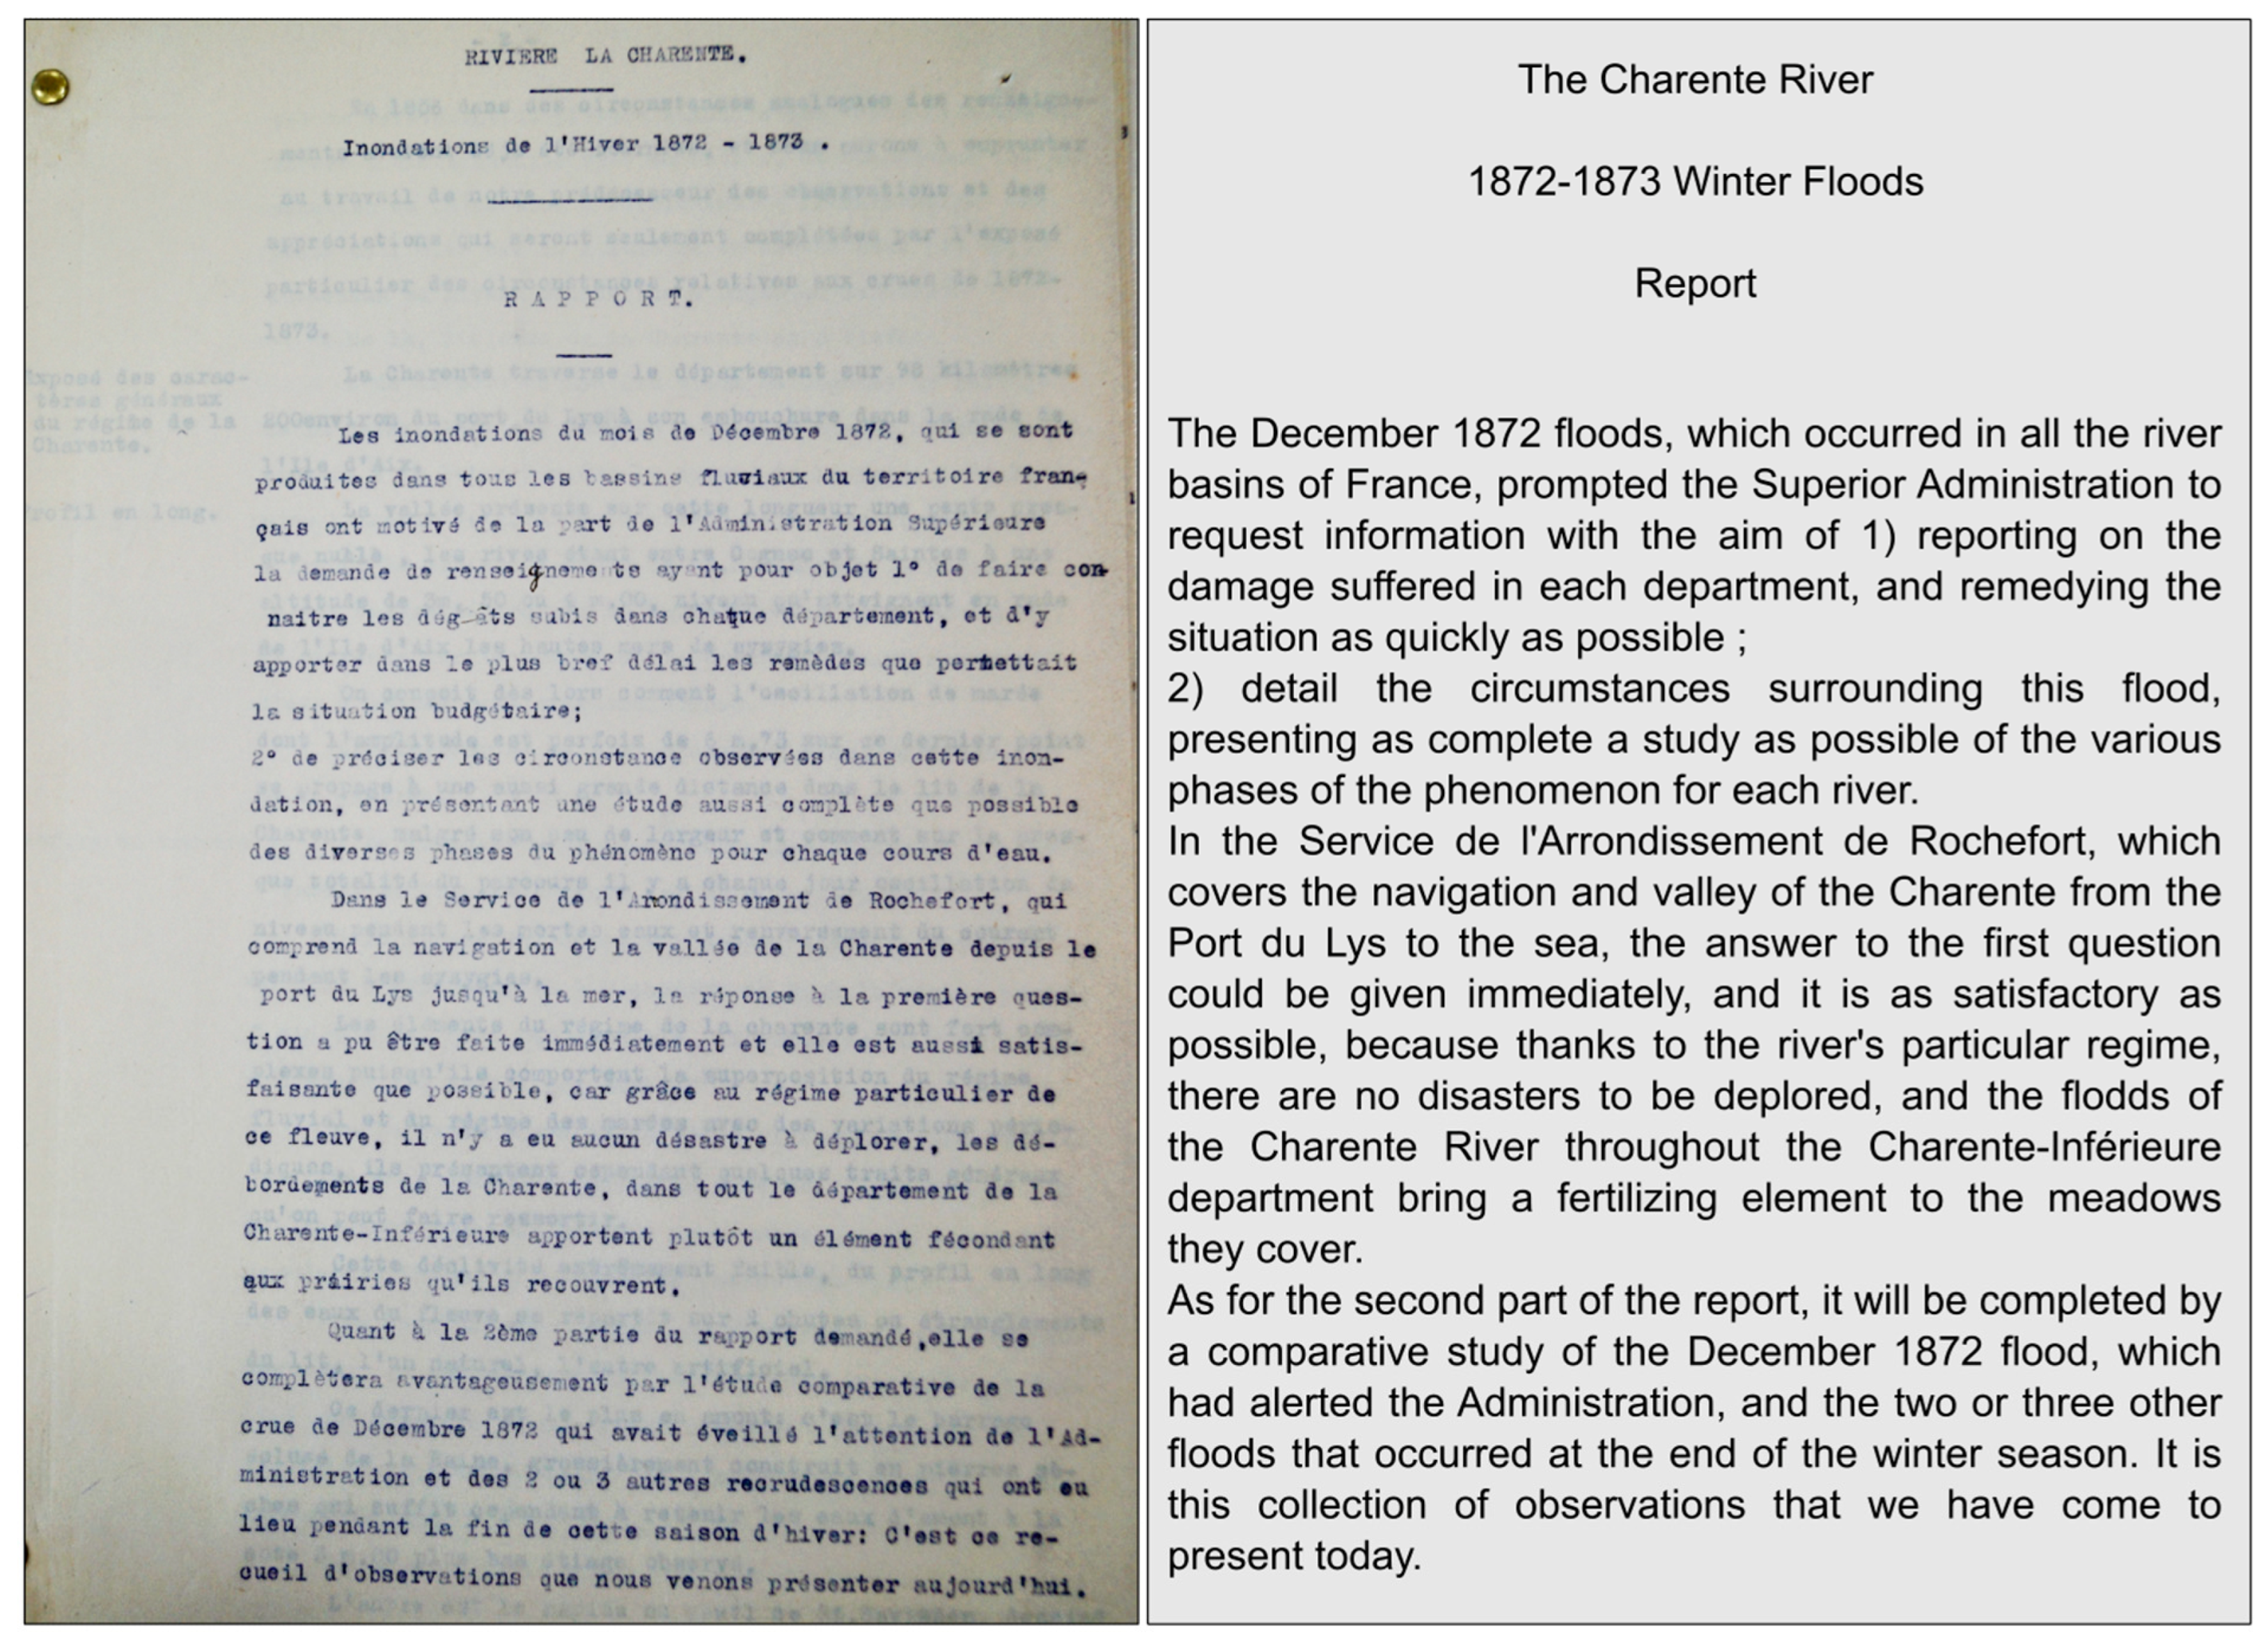
The research was carried out on four archival collections: the archives of the Département de la Charente, the archives of the Département de la Charente-Maritime, the municipal archives of Saintes, and the fonds régional et ancien des médiathèques de Saintes. The modern archives (documents from the 18th to early 20th centuries) were mainly produced by the Ponts-et-Chaussées engineer corps, responsible for the maintenance of rivers and fluvial infrastructures related to commercial navigation, river crossing, water mills, floods, etc. The engineers’ written reports provide several valuable pieces of information, including the date of the events, weather conditions, course of flood, location and type of material damage, level reached by water, reconstruction plans, and engineering works built against the floods (Figure 6). The contemporary archives (documents starting from 1940) are composed of documents deposited by the Etablissement Public Territorial du Bassin Charente and the Service d’Hydrologie Maritime of the Direction Départementale de la Charente-Maritime. These documents refer in particular to flood prevention and protection measures planned or implemented following the December 1982 and January 1994 floods.
Municipal archives of Saintes feature various documents, including complaints from residents of the river. These complaints provide information on the extent and damage of the flood. However, a degree of caution must be applied to these particular documents, as they can occasionally exaggerate the number of floods and their damage in order to obtain greater compensation.

3.3.3. Newspapers

From the first half of the 19th century, the floods on the Charente River are mentioned in local newspapers, particularly in the Echo Rochelais (1829–1941), the Charentais (1834–1895), the Indicateur de Cognac (1837–1944), the Tablette des Deux-Charentes (1843–1944), the Indépendant de la Charente-Inférieure (1848–1944), the Ère Nouvelle des Charentes (1871–1940), the Charente (1883–1940), and Sud-Ouest Charente-Maritime (from 1944 to date). Newspapers were consulted on the press websites of the Bibliothèque Nationale de France “retronews” [96] and the Département de la Charente “La Source” [97]. When newspapers were not available on the press websites (e.g., the Tablette des Deux-Charentes and the Indicateur de Cognac), these documents were consulted in the archival collections.
The exhaustive reading of the local newspapers made it possible to complete the chronology with previously unidentified floods on the Charente River. It also improves knowledge of past floods by providing information on previous floods, material damages, human losses, rescue operations, water level measurements, and actions taken by authorities during and/or after the flood event (Figure 7). News reported by local newspapers should be treated with caution: partial or misleading information, subjectivity of the author, excessive catastrophism, exaggeration of damage, and spatial inequality of information. Indeed, on this last point, the flood accounts pay significant attention to the consequences of the flood on the major cities crossed by the Charente River (Angoulême, Cognac, Saintes), where the issues are high; conversely, the small villages and rural areas are almost never mentioned.

3.3.4. Iconography

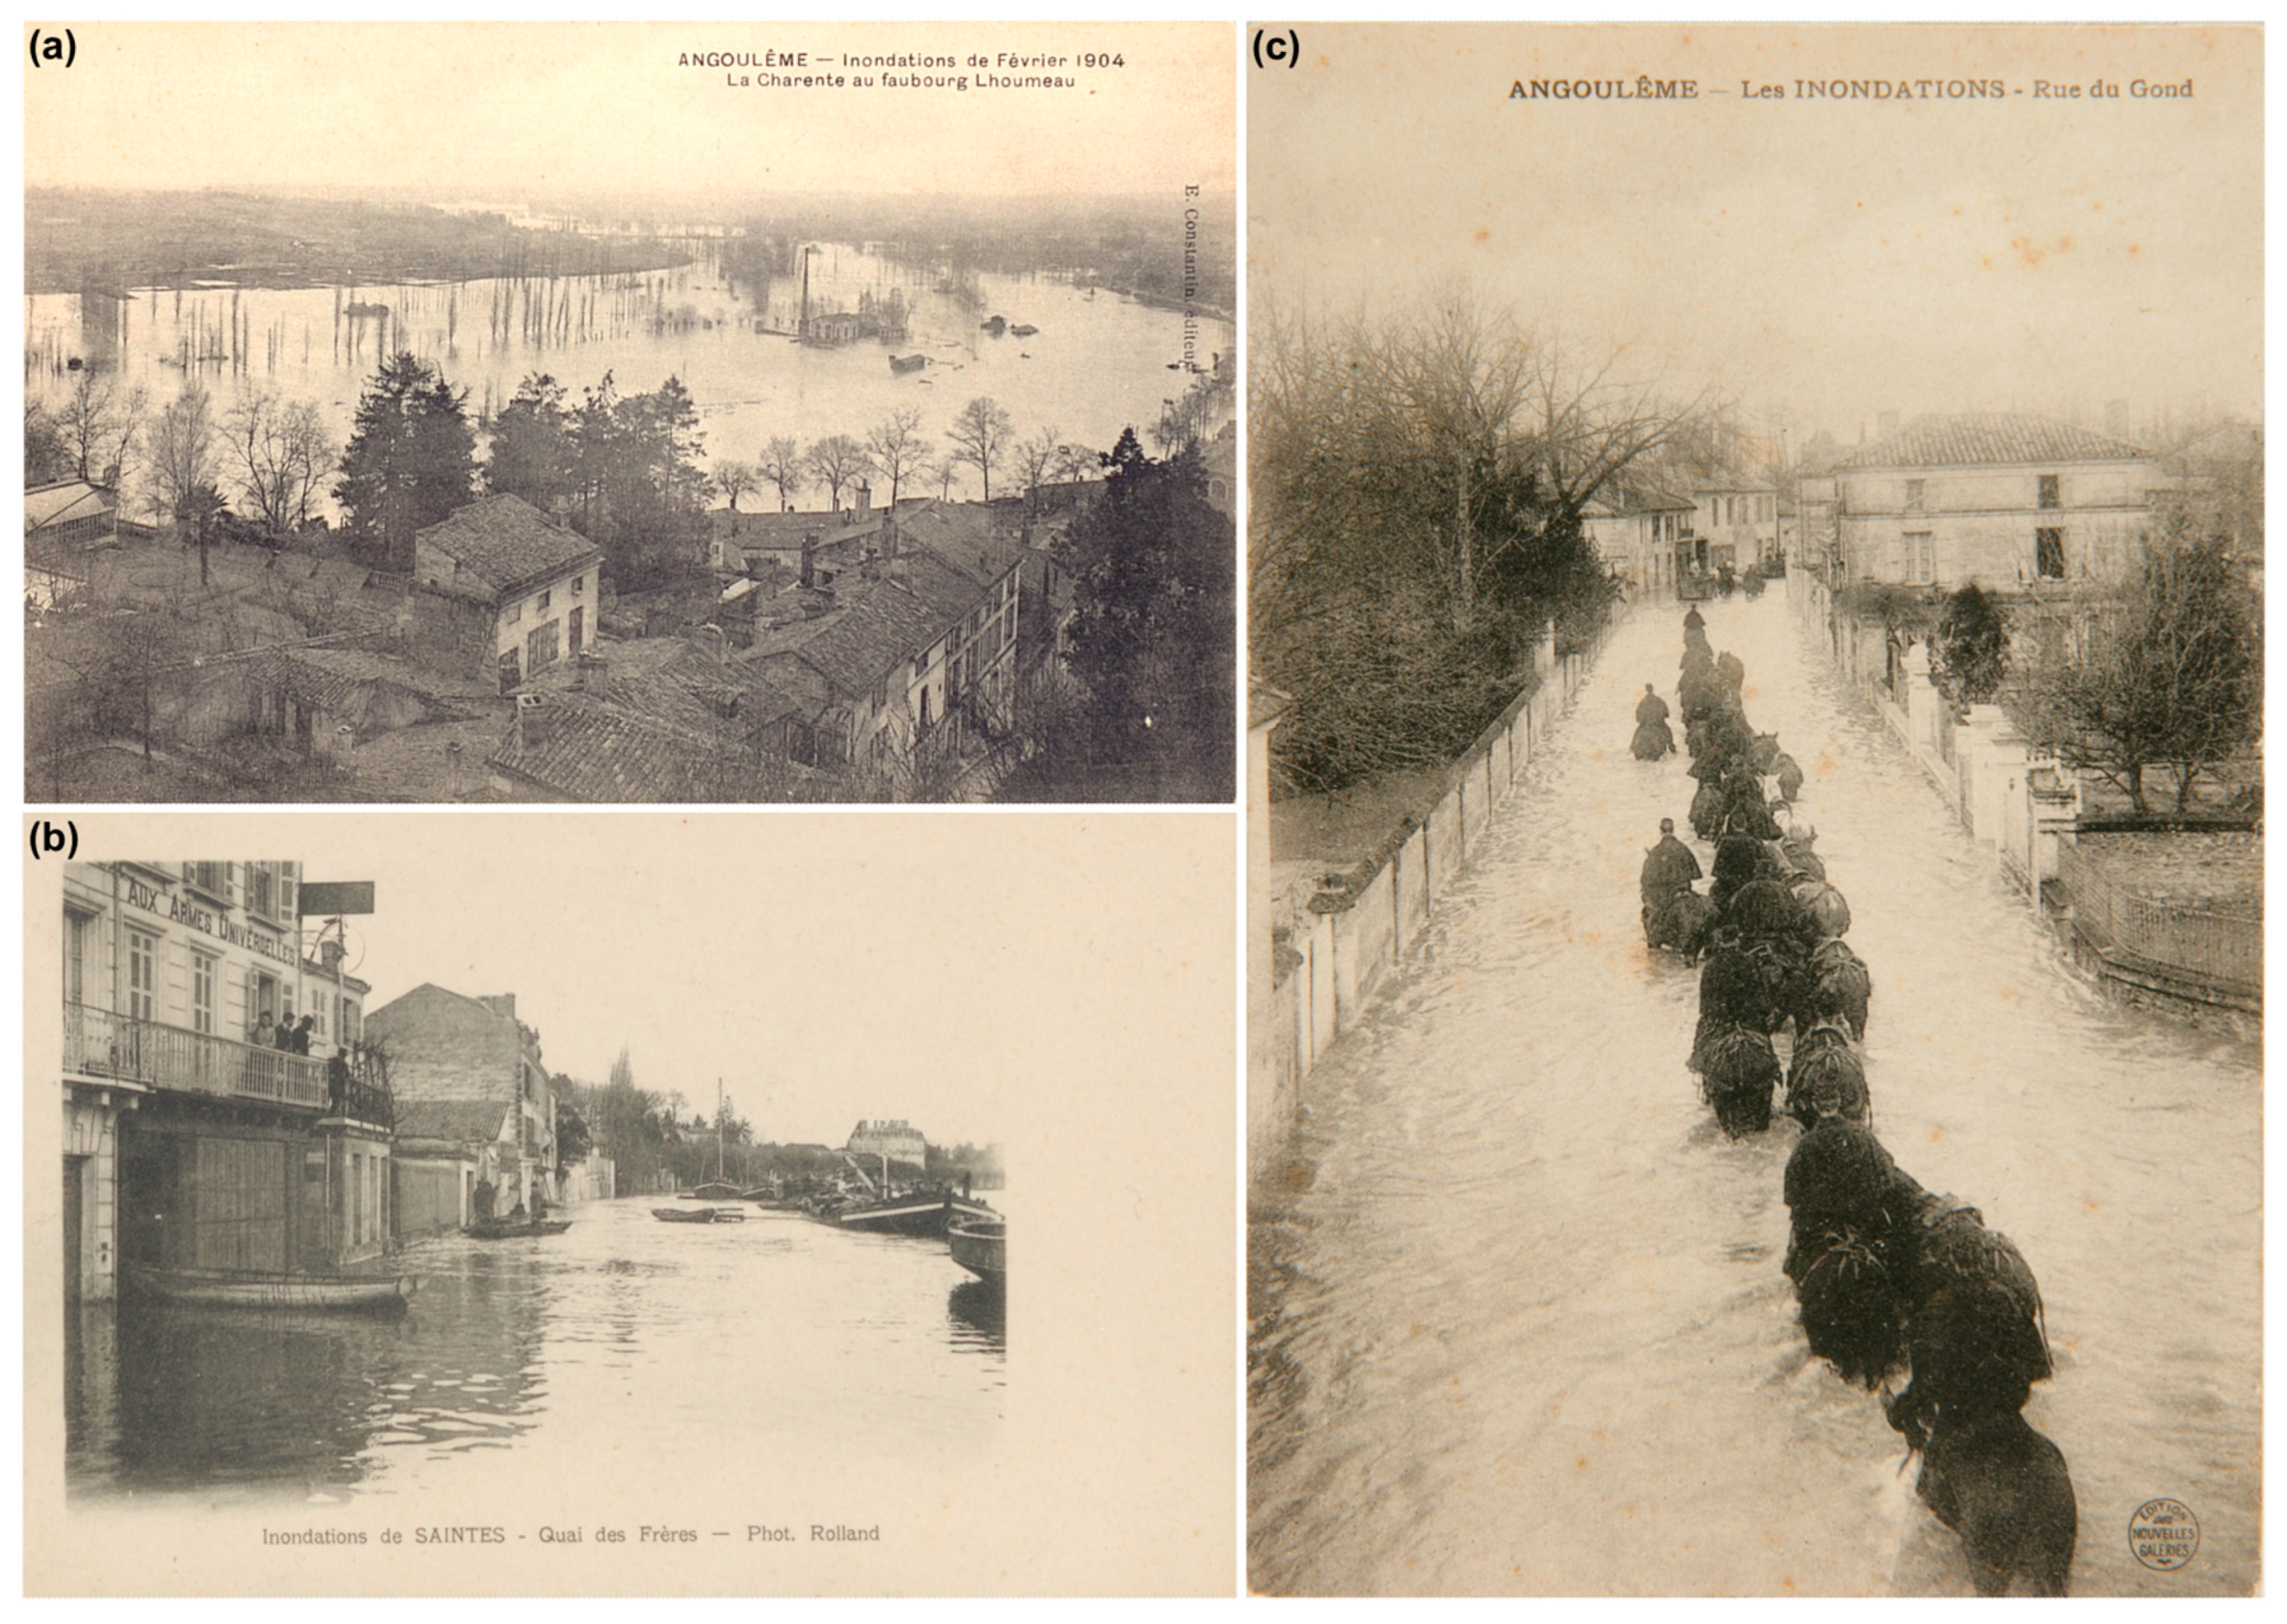
Postcards of past floods and pictures of recent ones were also used (Figure 8). They immortalize the remarkable nature of these extreme events and maintain the memory of the floods. These documents provide valuable information on the spatial extent, water level, and material damage of the flood. However, they are used with caution, as they reflect the experience and perception of their author and are dependent on technical advances in photography.

3.3.5. Epigraphic Records

The water levels reached during the past and most recent extreme floods were marked on buildings, bridges, or doors in the form of carved marks, painted marks, or specific plaques (Figure 5). These flood marks provide a visual representation of the flood event in the immediate environment in terms of spatial extent and water level. A total of 334 flood marks were identified in the Charente watershed [98]. In many cases, the only proof of a historical flood is a flood mark.

3.4. Processing of Historical Data

3.4.1. Historical Data Gathering

Historical data were collected by consulting inventories and selecting items by keywords. All available historical documents mentioning a flood, overflow, or similar event were consulted in their entirety. All events corresponding to a flood were included in the flood chronology on the Charente River. Each event was classified to one of the following zones: Upper Charente River (from its source to Angoulême), Middle Charente River (Angoulême to Saintes), Lower Charente River (downstream of Saintes to the estuary), and Charente River. This last class includes events occurring in at least two zones. An additional category was added to include flood events with no accurate location. Based on available historical data, the date of flooding, meteorological and rainfall conditions, flood dynamics (rising water level, duration of flood, decreasing water level), resulting damage and its location, water levels, and flood defense during (e.g., setting up surveillance in flooded areas) or after (e.g., project to build a canal to facilitate floodwater runoff) the flood were documented for each event. Finally, seasonality was analyzed on the basis of the season of occurrence of the flood event. If a flood occurs during two consecutive months, only the first month is recorded. If a flood occurs for two months between two consecutive seasons, only the first season is considered. Seasonality was determined according to the current hydrological seasons: winter—December, January, February; spring—March, April, May; summer—June, July, August, September; autumn—October, November.

3.4.2. Flood Chronology

The flood chronology on the Charente River was reconstructed since the 18th century based on documentary and instrumental data. The first version of this chronology in Duquesne and Carozza [75] was revised and completed on the basis of additional research in the local press. The flood chronology allows the analysis of the frequency, intensity, and seasonality of floods and highlight the occurrence of remarkable and complex events, in particular grouped floods.
However, this chronology is based on four major discontinuities [71]: (1) the discontinuity of the hazard attributed to changes in the hydro-sedimentary conditions of the river, climatic variations, and changes in land use; (2) the discontinuity of vulnerability of societies linked to changes in building construction techniques and materials, and to changes in the flood risk culture; (3) the discontinuity of perceptions of flood risk associated with the culture and memory of risk (intergenerational transmission, new inhabitants, instrumentalization of risk, etc.); and (4) the discontinuity of documentary sources in time and space. In fact, the flood chronology on the Charente River depends on the nature, quantity, quality, and reliability of the historical data available. The production of documentary sources is related to the damage caused by the flood and is therefore dependent on the vulnerability of societies and the perception of flood risk. While this long-term chronology references all extreme flood events accurately, it can overlook some events of low or moderate intensity, as these are not mentioned in documentary sources in the 18th and 19th centuries in the absence of significant material damage.
For older floods, chronological data are often limited, and hydrological observations are incomplete, particularly in the absence of daily flood bulletins, which makes it difficult to apply classical flood separation methods such as those proposed by Lang et al. [99] and Robson and Reed [100]. In the case of this work, only the time distance between peak flow is used as an independence criterion for past and recent flood sequences in order to apply uniform criteria. This approach overcomes the lack of continuous data.

3.4.3. Classification of Flood Events

The flood classification on the Charente River was performed in order to qualify the intensity of the flood event from the documentary sources collected. The classification criteria were determined from several previous studies [14,53,64,67,69,71,101]. However, these criteria were adapted to the specificities of the low-energy hydrological dynamics of the Charente River. In fact, the classification is based on material damage (agricultural damage, damage to engineering structures, damage to private and public property) and human losses (very rare).
Four categories were defined: low (C1), medium (C2), high (C3), and extreme (C4) flood events. Their characteristics are detailed in Duquesne and Carozza [75]. A fifth level (C-1) comprises floods mentioned in several historical documents but for which little or no information is available (e.g., date, spatial extent, material damage, water level, etc.) [14]. This specific level preserves information and avoids distorting results.
Each flood was analyzed separately. The classification of some floods was facilitated by the availability of the documents, but for others, particularly the older ones, it proved more complex. There is a risk of uncertainty, with the possibility of under- or overestimating the event. The main limit of this classification is linked to the availability of sources. The lack of documentary sources may be due to the absence of damage considered significant, but also to biases in the archives (lost, destroyed, or unclassified documents).

4. Results

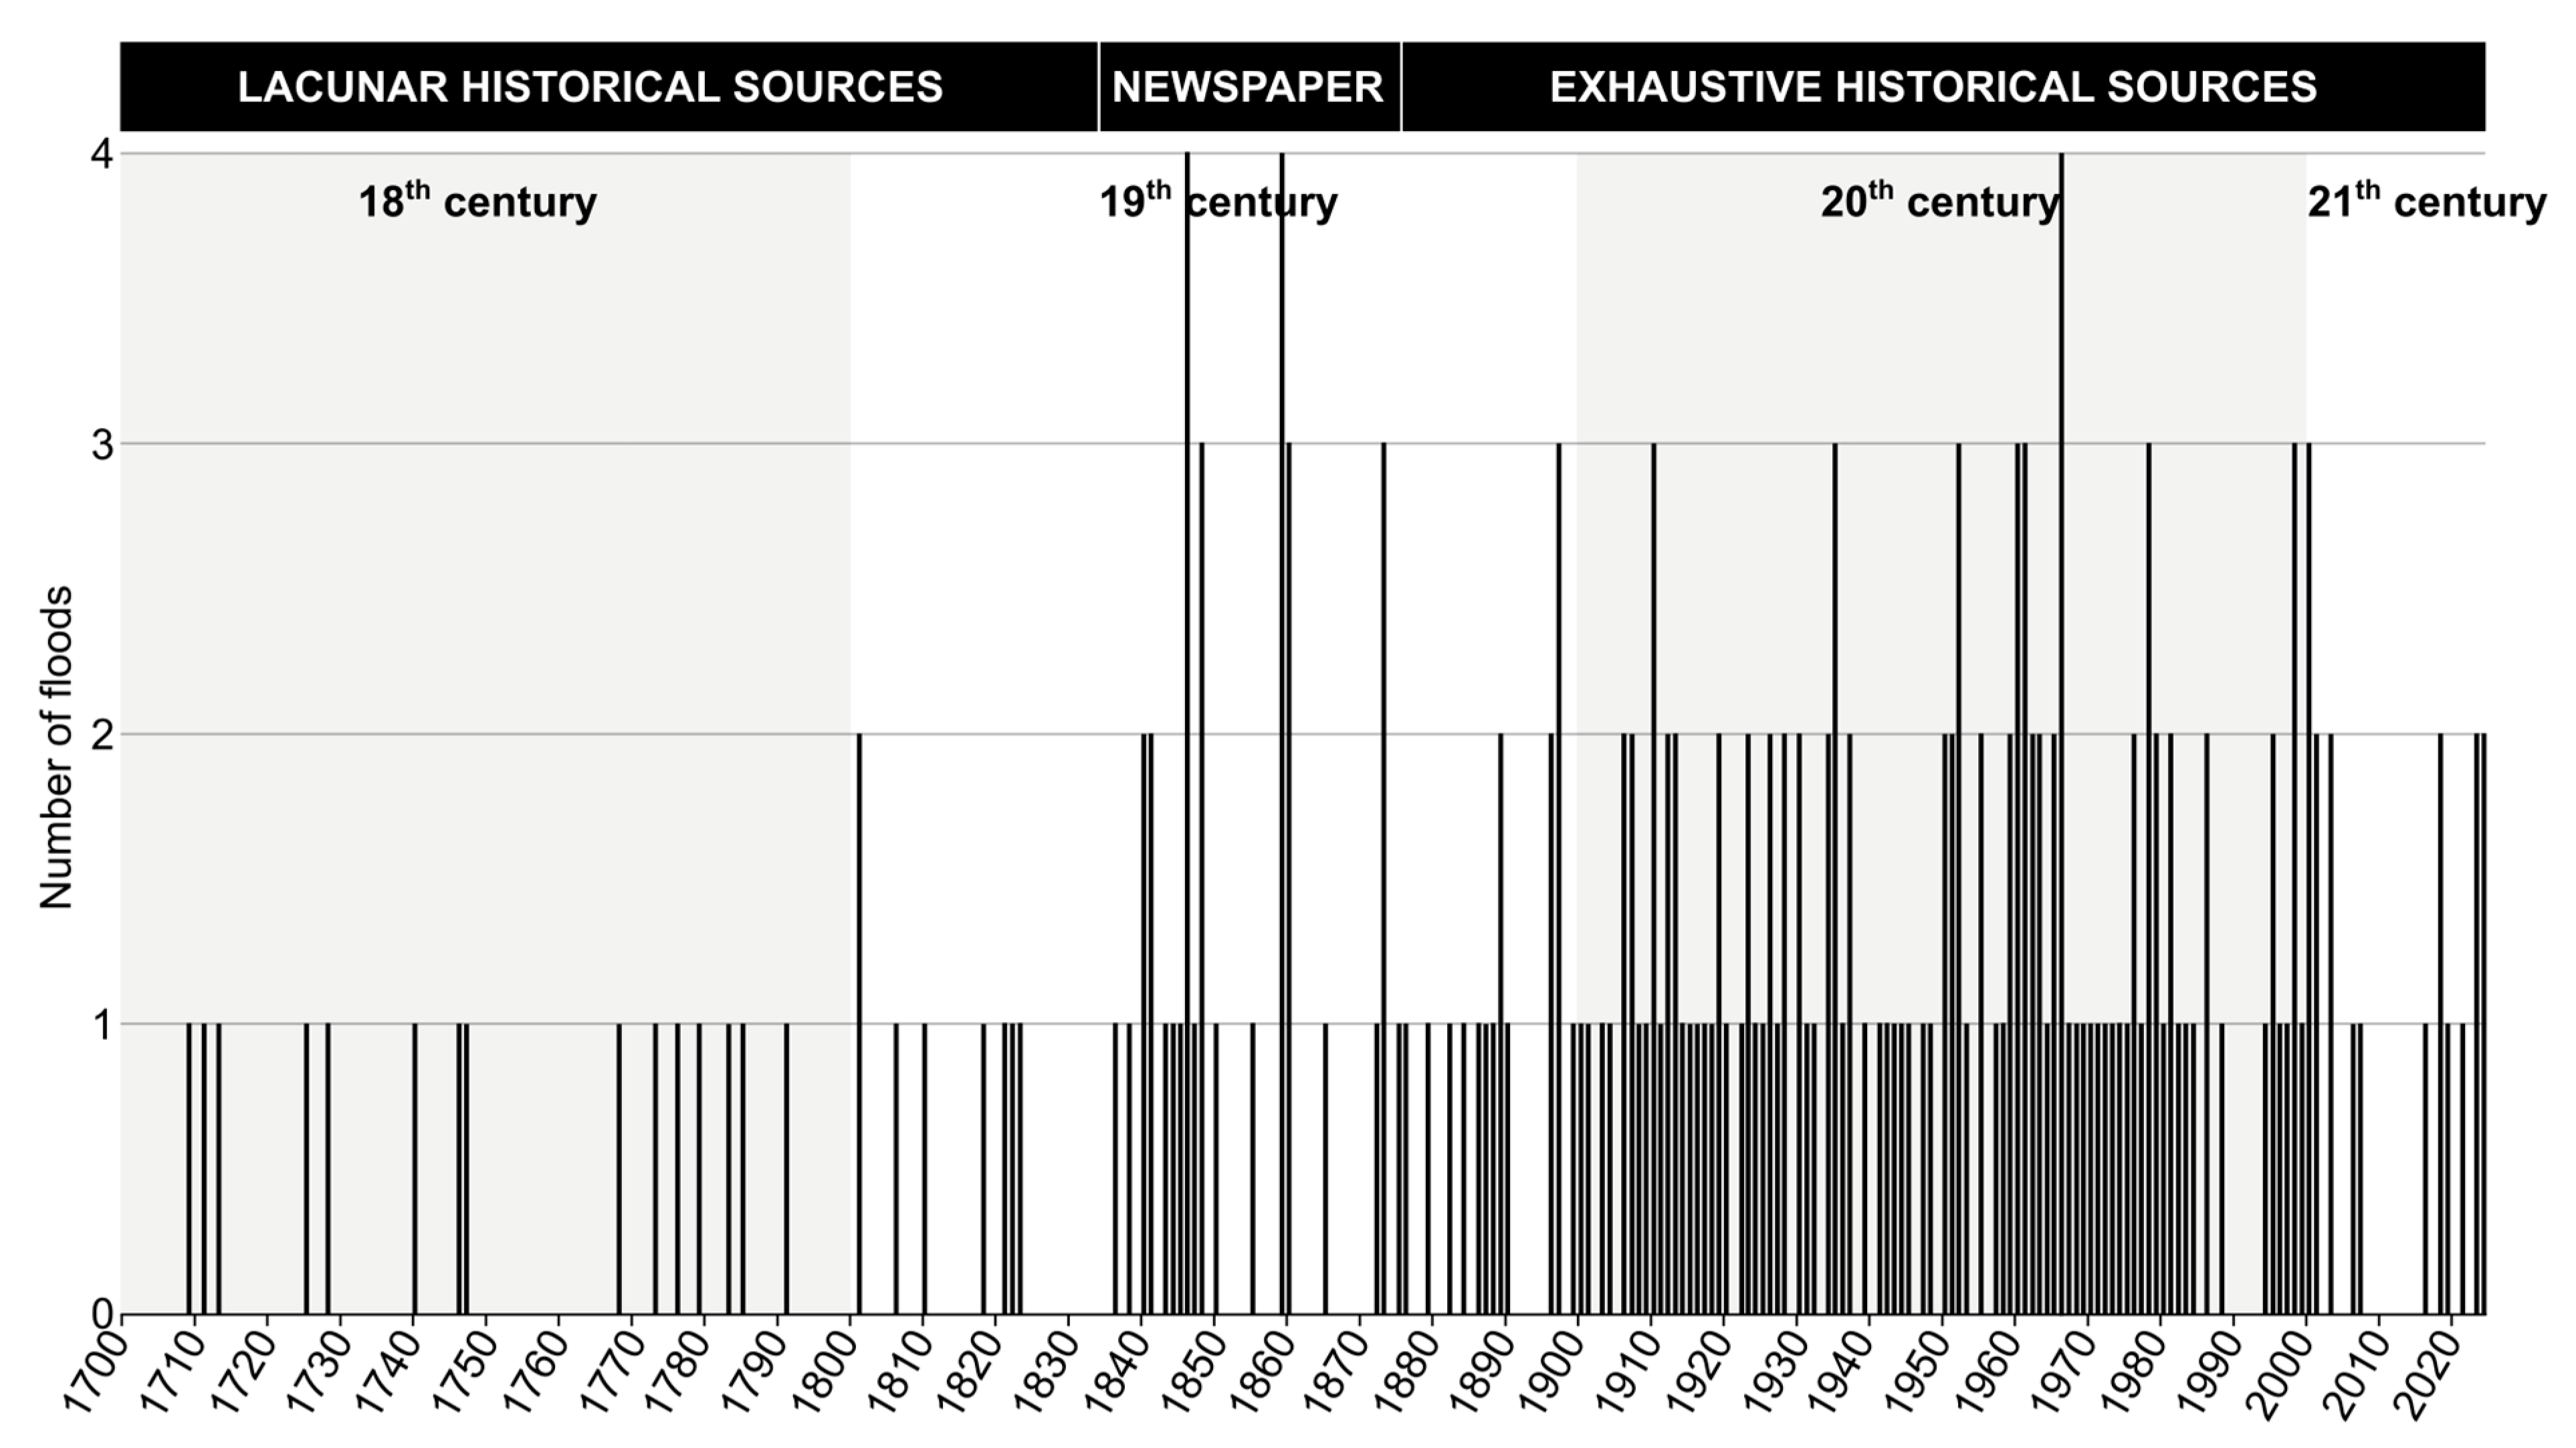
At the current time, the flood chronology on the Charente River records 211 individual floods between 1700 and 2024, based on the study of documentary sources and instrumental data (Figure 9). This inventory is an update of data from Duquesne and Carozza [75]. This flood chronology shows the irregularity of floods over time. In detail, only major floods were recorded during the 18th century, due to the lack of information in historical sources, where only extreme events are mentioned. Between 1835 and 1875, a number of unpublished floods were referenced from local newspapers, particularly small floods. Indeed, minor floods were probably not recorded in the historical archives, due to the lack of significant material damage and the absence of a flood monitoring service. Since 1875, the number of floods recorded has increased in relation to the hydrological observations carried out by the Ponts-et-Chaussés engineering corps, the creation of the Service d’Annonce des Crues at the beginning of the 20th century, which now records all floods, including those of low intensity, as well as the increase in the quantity and quality of available documentary sources. However, between 2002 and 2020, the number of floods decreased, which can be explained by a succession of dry periods and reduced rainfall in the watershed.
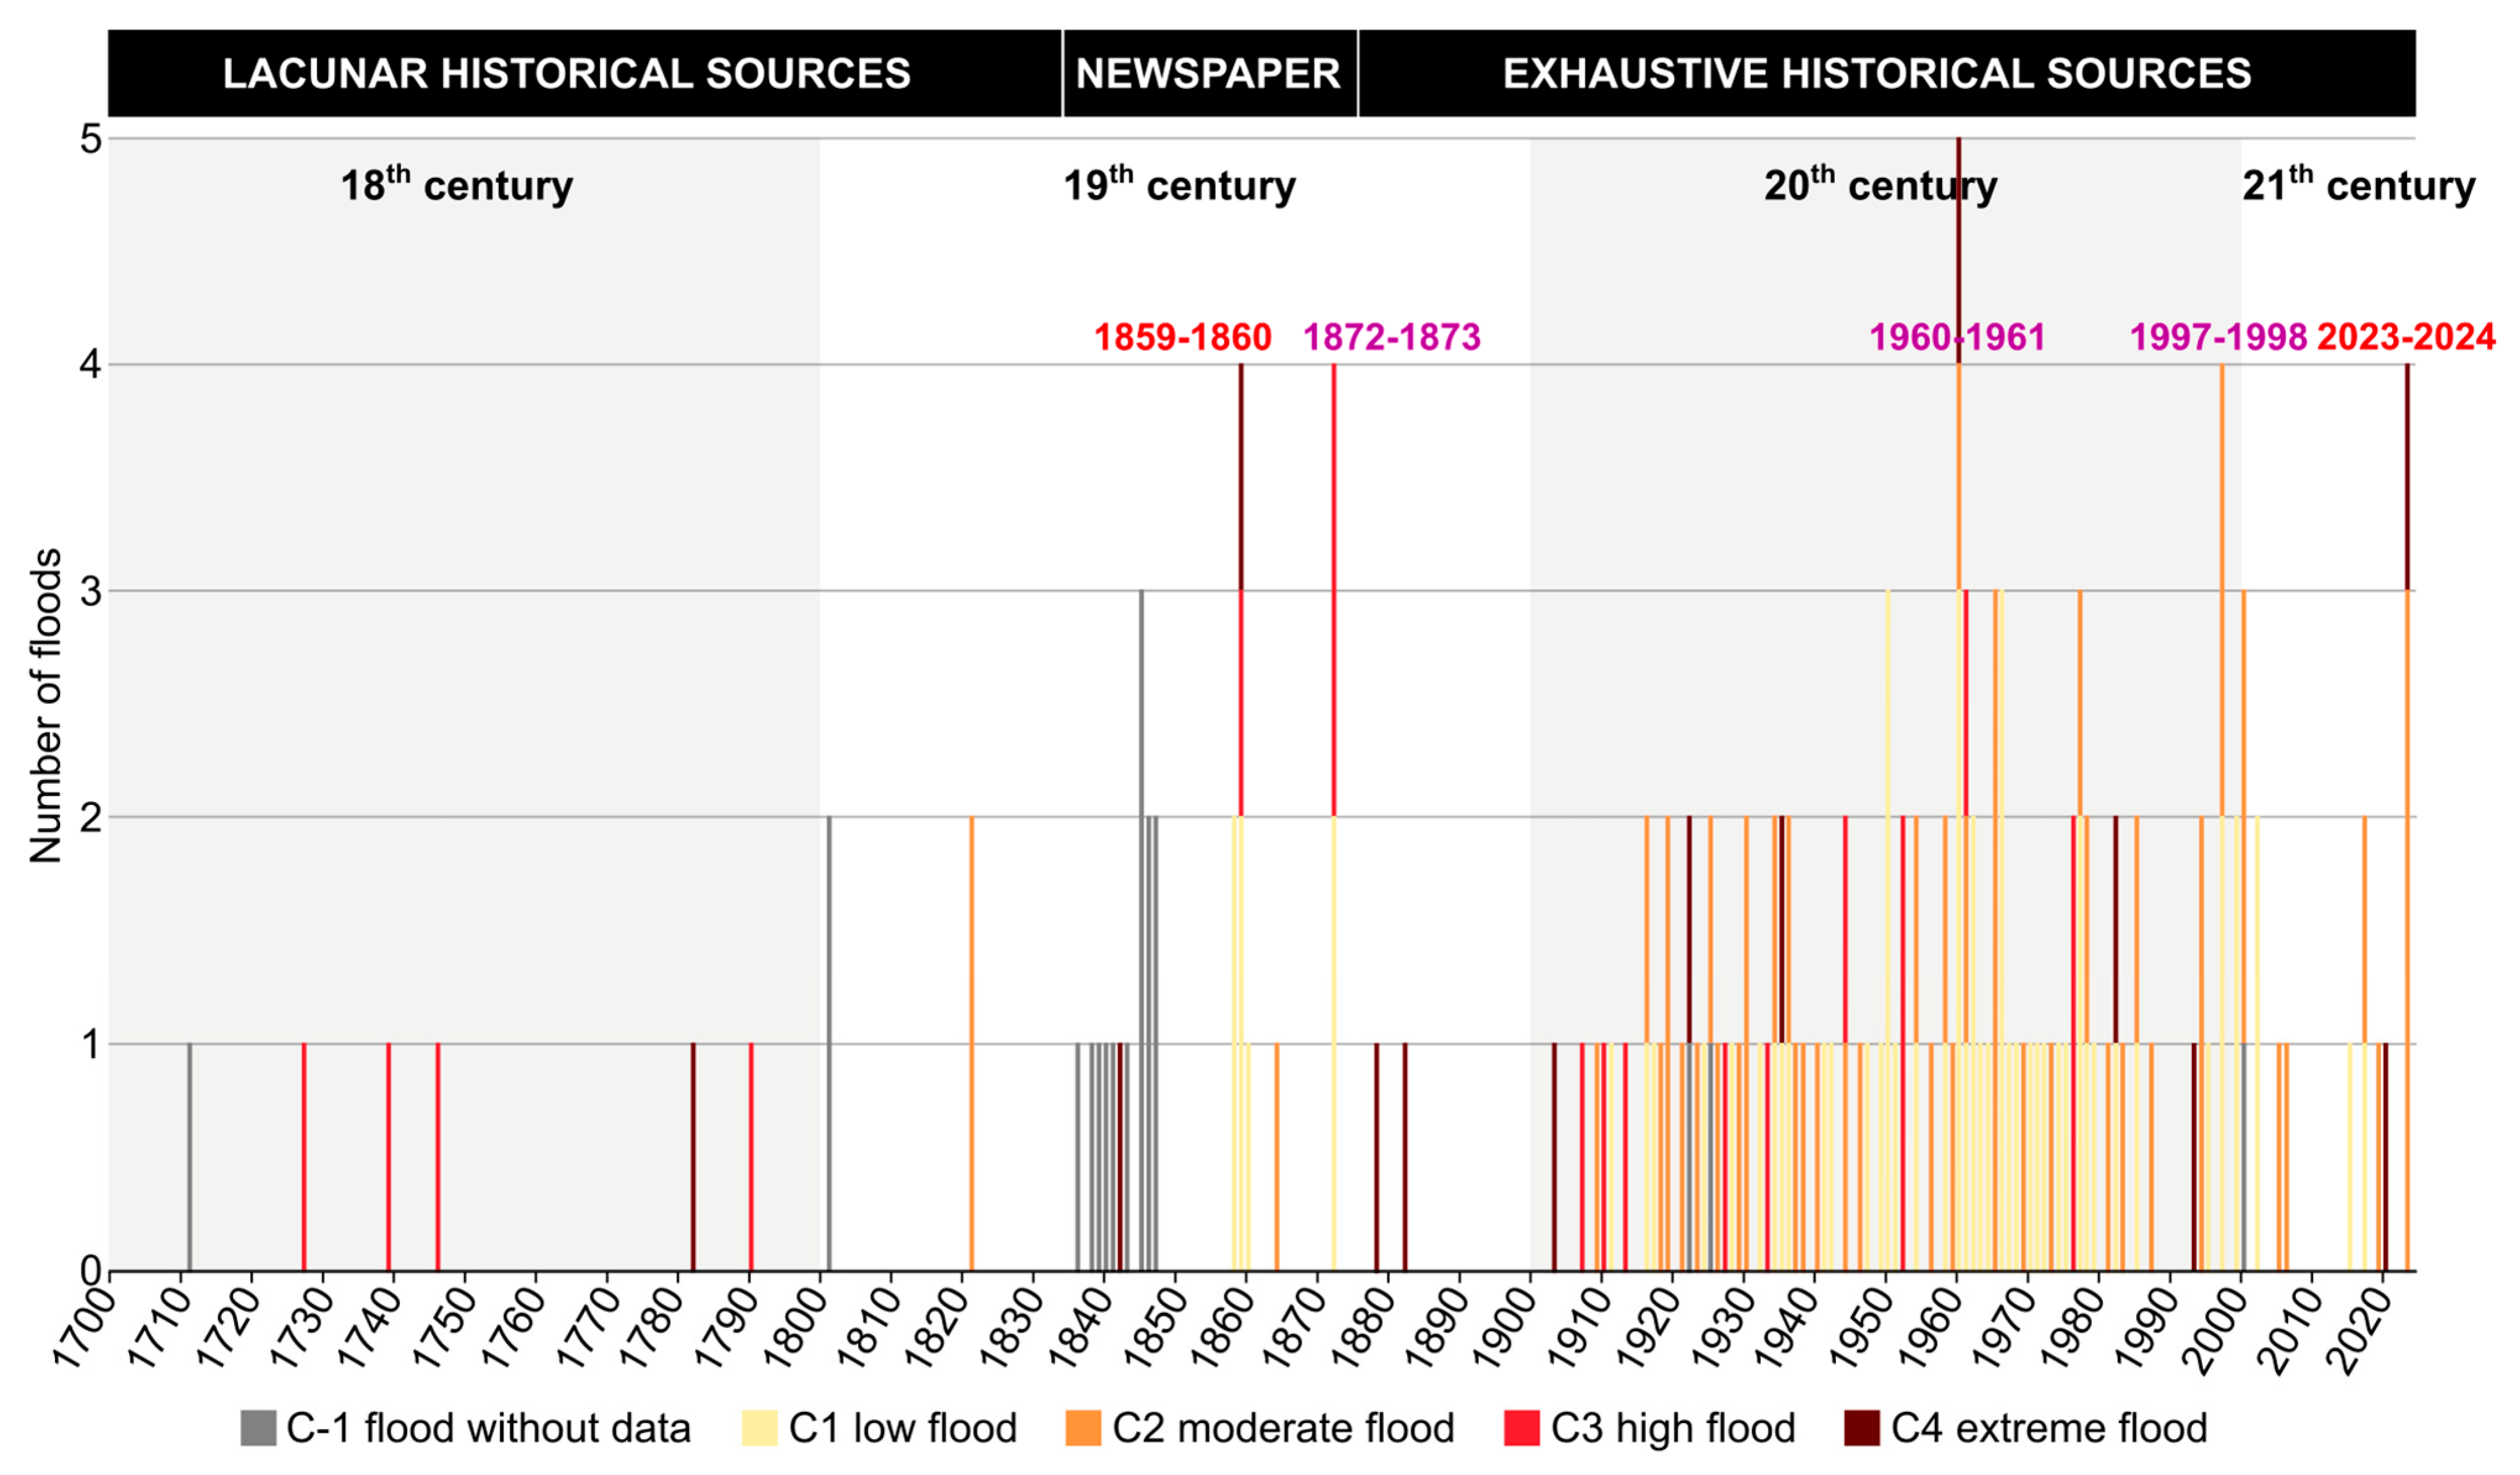
Grouped floods are not an emergent phenomenon on the Charente River during the hydrological winter, which extends from October to April (Figure 10). Since 1700, 38 sequences of grouped floods were recorded. However, the Charente River rarely records more than two grouped floods during this period, with 25 sequences of two clustered floods. The 2023–2024 hydrological sequence is therefore particularly remarkable, since it recorded four clustered floods in six months. Although this phenomenon is exceptional, historical records show that it has already occurred in the past. To date, only four other flood sequences feature this unusual repetitive character (i.e., four or five clustered floods): 1859–1860, 1872–1873, 1960–1961, and 1997–1998.
The similarities between the grouped flood sequences of 1872–1873, 1960–1961, 1997–1998, and that of 2023–2024 are limited to the number of floods. However, these grouped flood sequences show divergences in terms of seasonality and intensity of flood events, particularly for the first annual flood (Figure 10 and Figure 11). Indeed, the 1872–1873 hydrological sequence comprises an autumn flood, a winter flood, and two spring floods. Among these four events, the first two are classified as high floods, while the last two are of lesser magnitude. Although the first annual flood is early, it occurs in the last decade of November and extends into December, marking a break with the 2023–2024 sequence. The 1960–1961 hydrological sequence is particularly noteworthy for its five successive floods in four months, including an extreme flood (January 1961), a moderate flood (December 1960), and three low-intensity floods (two in November 1960 and one in February 1961). The November 1960 floods, one in the first decade and the other in the last, show an early start to the flood season. However, at the Saintes limnimetric station, these events are characterized by extremely modest water levels (4.26 m and 4.64 m, respectively) compared with the warning level established by the local authorities (i.e., 4.20 m). These flood events clearly distinguish from the November 2023 flood, marked by more significant water levels during the two maximums (5.42 m and 5.45 m). The 1997–1998 sequence consists of three winter floods and one spring flood of low to moderate intensity. This sequence differs from the 2023–2024 flood sequence by a late first annual flood, which begins around the last decade of December, and by the modesty of the water levels reached, which correspond to a 2- or 3-year flood.
Ultimately, only the sequence of grouped floods of 1859–1860 shows significant similarities with that of 2023–2024, both in terms of the number of floods and the precocity of the first annual flood (Figure 10). The November 1859 and November 2023 autumn floods occurred early, with remarkably prolonged flood durations, approximately three to four weeks. While the November 1859 flood is classified as an extreme flood (C4) because of the high water levels and the major material damage, the November 2023 flood, of moderate intensity (C2), reaches water levels similar to a 4-year flood (Figure 11). In both cases, water levels were particularly high compared to the warning level established by local authorities, which is rare for such early events.

5. Discussion

The 2023–2024 grouped floods are well documented, not only because of the meteorological and hydrological data available but also because it occurs in a favorable context for the production and diffusion of information. On the other hand, the 1859–1860 grouped floods remain relatively unknown to scientists, river managers, and residents of the Charente River, while the first annual flood, that of November 1859, is notable for its earliness and severity. This lack of knowledge is mainly due to the context in which few data are produced. In this period, only two limnimetric scales are installed, at Angoulême and Saintes, and hydrometric measurements are very rare, in the absence of a flood monitoring service. Meteorological data are also limited. Two precipitation stations are operational in the Charente watershed, and no temperature measurements are taken, except at the La Rochelle meteorological station, located close but outside the study area. To reconstruct the context and course of the November 1859 flood, several documentary sources were used to supplement the limited instrumental data available. This analysis highlights the similarities between the clustered flood sequences of 1859–1860 and 2023–2024 by focusing on the first annual flood, the November 1859 and November 2023 floods.
The November 1859 and November 2023 floods occur after particularly hot and dry summers. The mean seasonal temperature is 21.9 °C in 1859 (La Rochelle meteorological station) and 21.4 °C in 2023 (Saintes meteorological station). June records high temperatures, with a mean of 20.8 °C in 1859 and 22 °C in 2023. These high temperatures continue throughout July (24.4 °C in 1859 and 20.4 °C in 2023) and August (20.6 °C in 1859 and 21.7 °C in 2023). In both cases, rainfall is near seasonal normals. Cumulative summer precipitation ranges from 125 mm at Saint-Jean-d’Angély to 182 mm at Rochefort in 1859 and 123 mm at La Couronne to 149 mm at Saintes on the Middle Charente River in 2023.
The high temperatures in 1859 and 2023 last until mid-autumn. September in both years is particularly hot, with a mean temperature of 17.3 °C in 1859 and 21.9 °C in 2023. In both cases, the AMJJAS NAO index shows a high negative value close to −1.20 in 1859 and 2023 (index baseline period: 1901–2000) [102,103]. The JJA NAO index centered on the summer months features particularly strong negative values, near −1.60 in 1859 and −2.15 in 2023 [103]. This reflects the persistence of high pressure along the Atlantic coast.
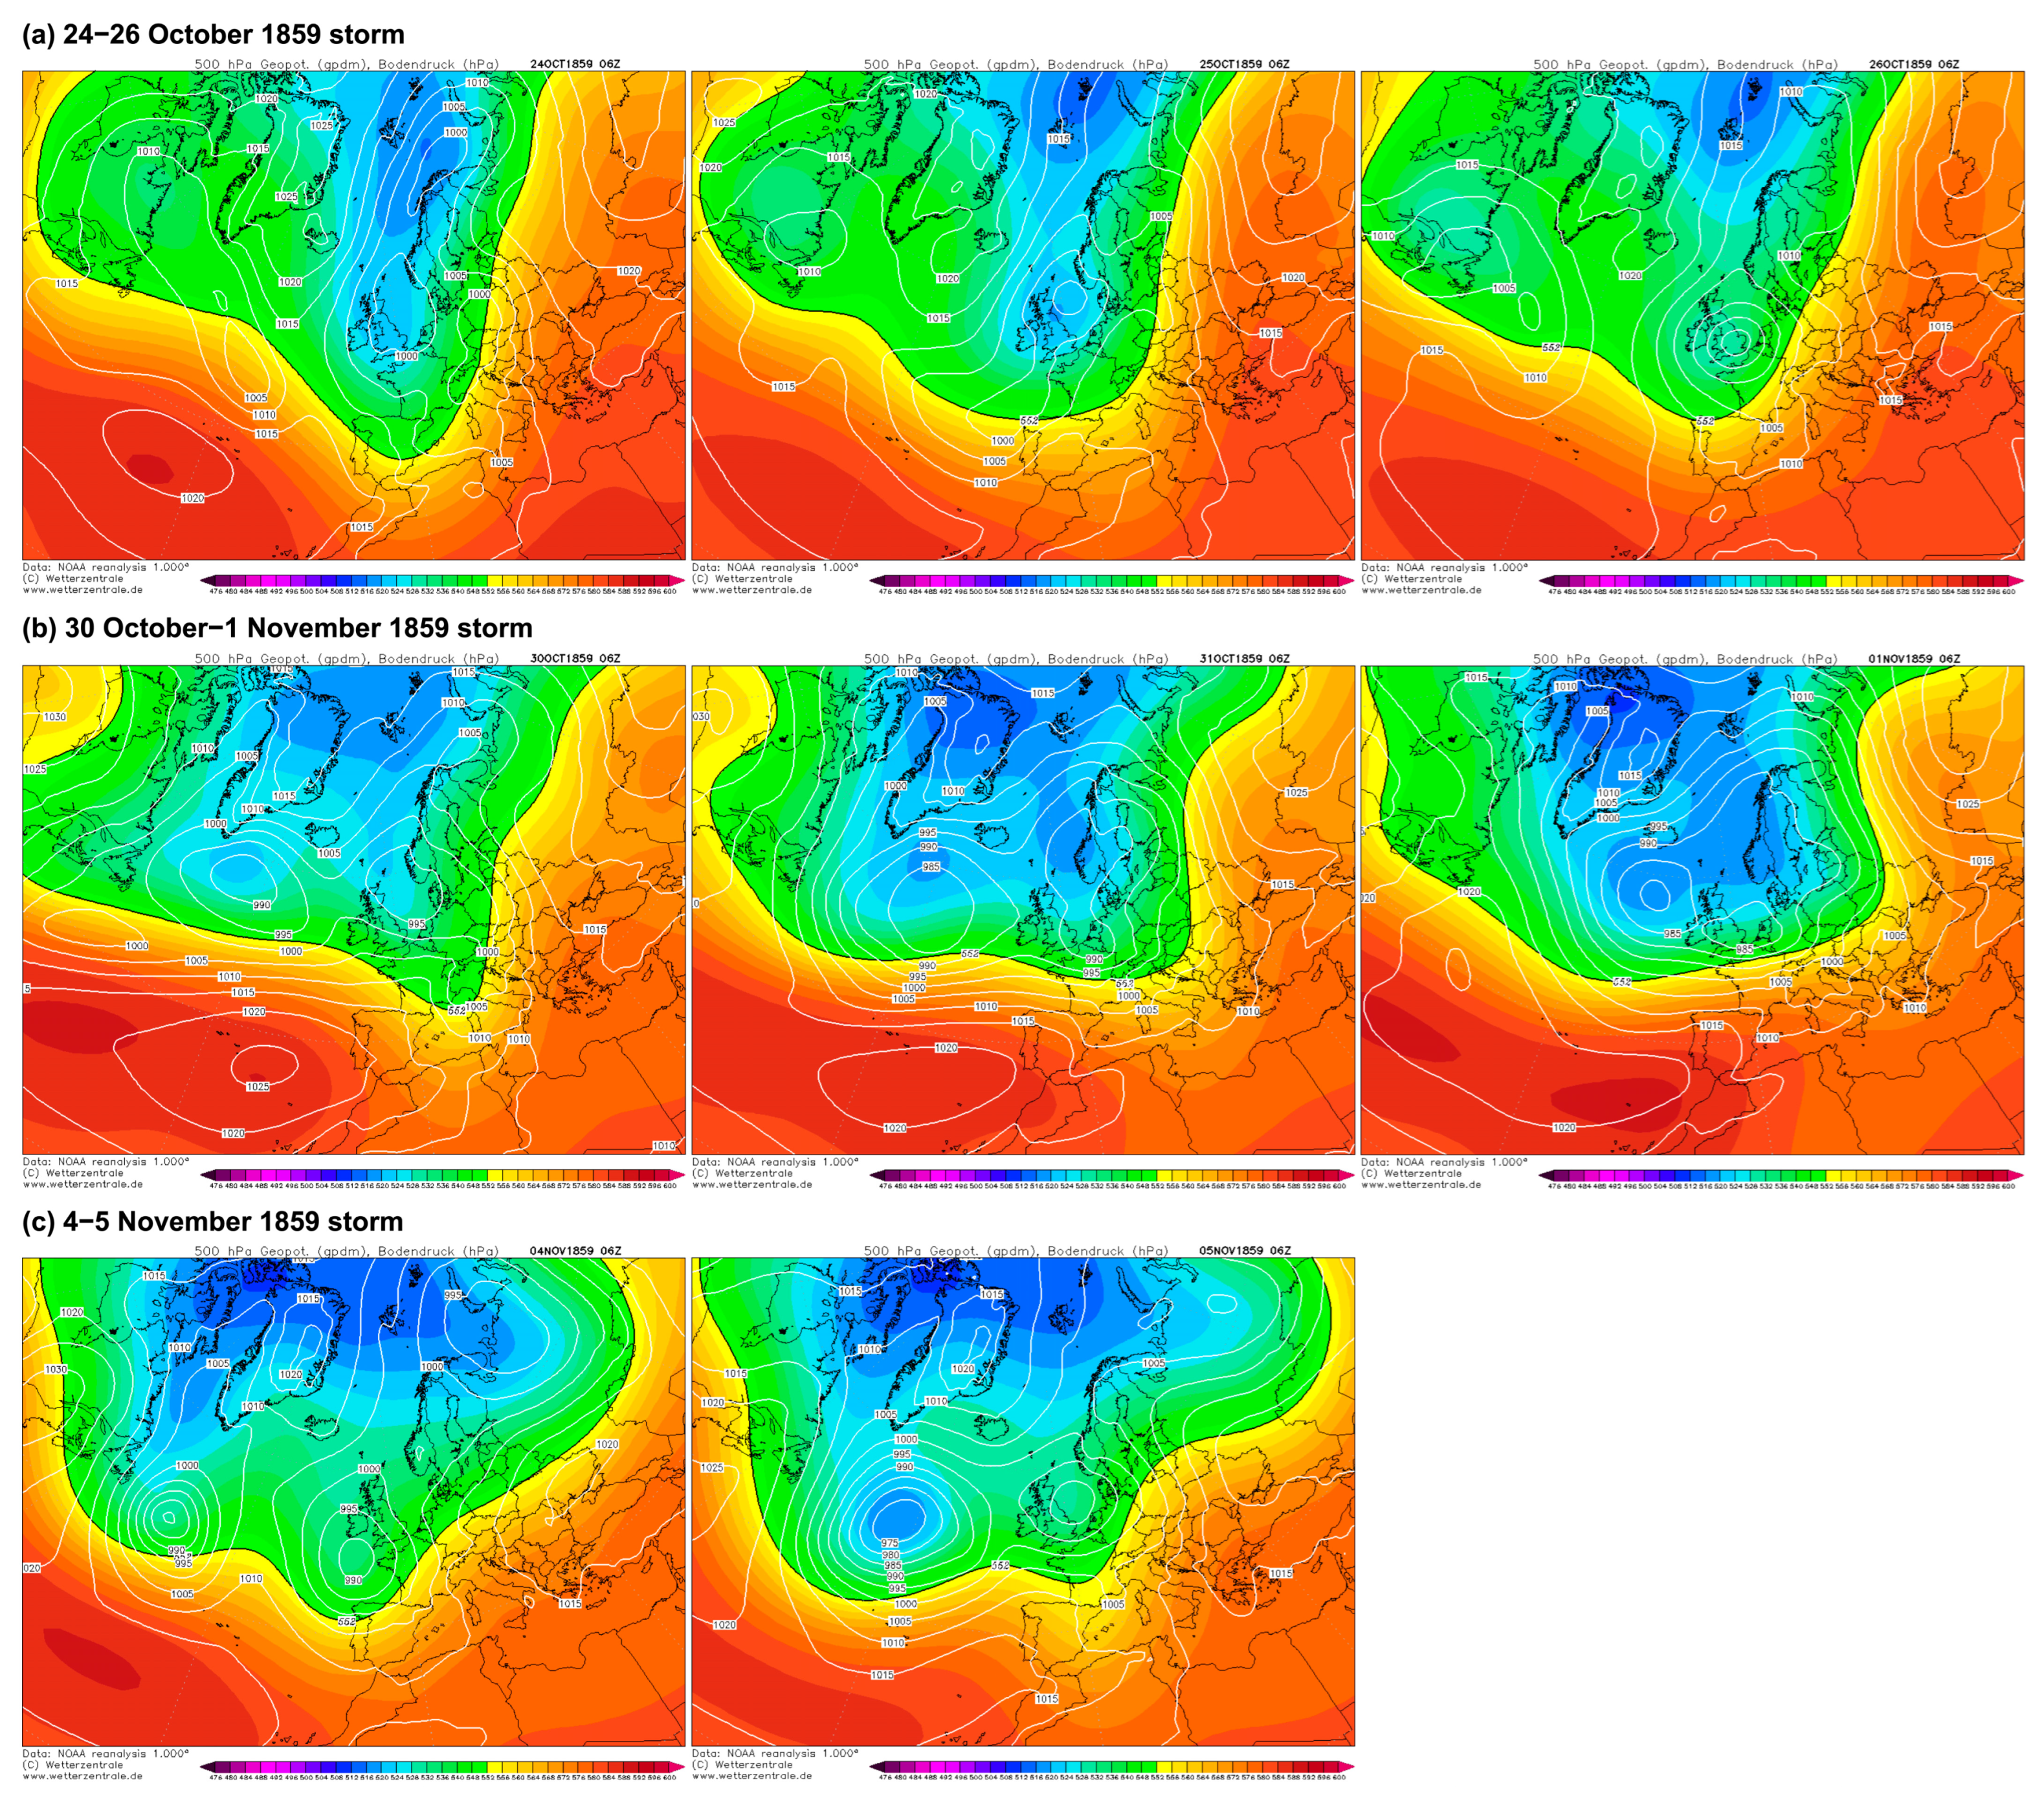
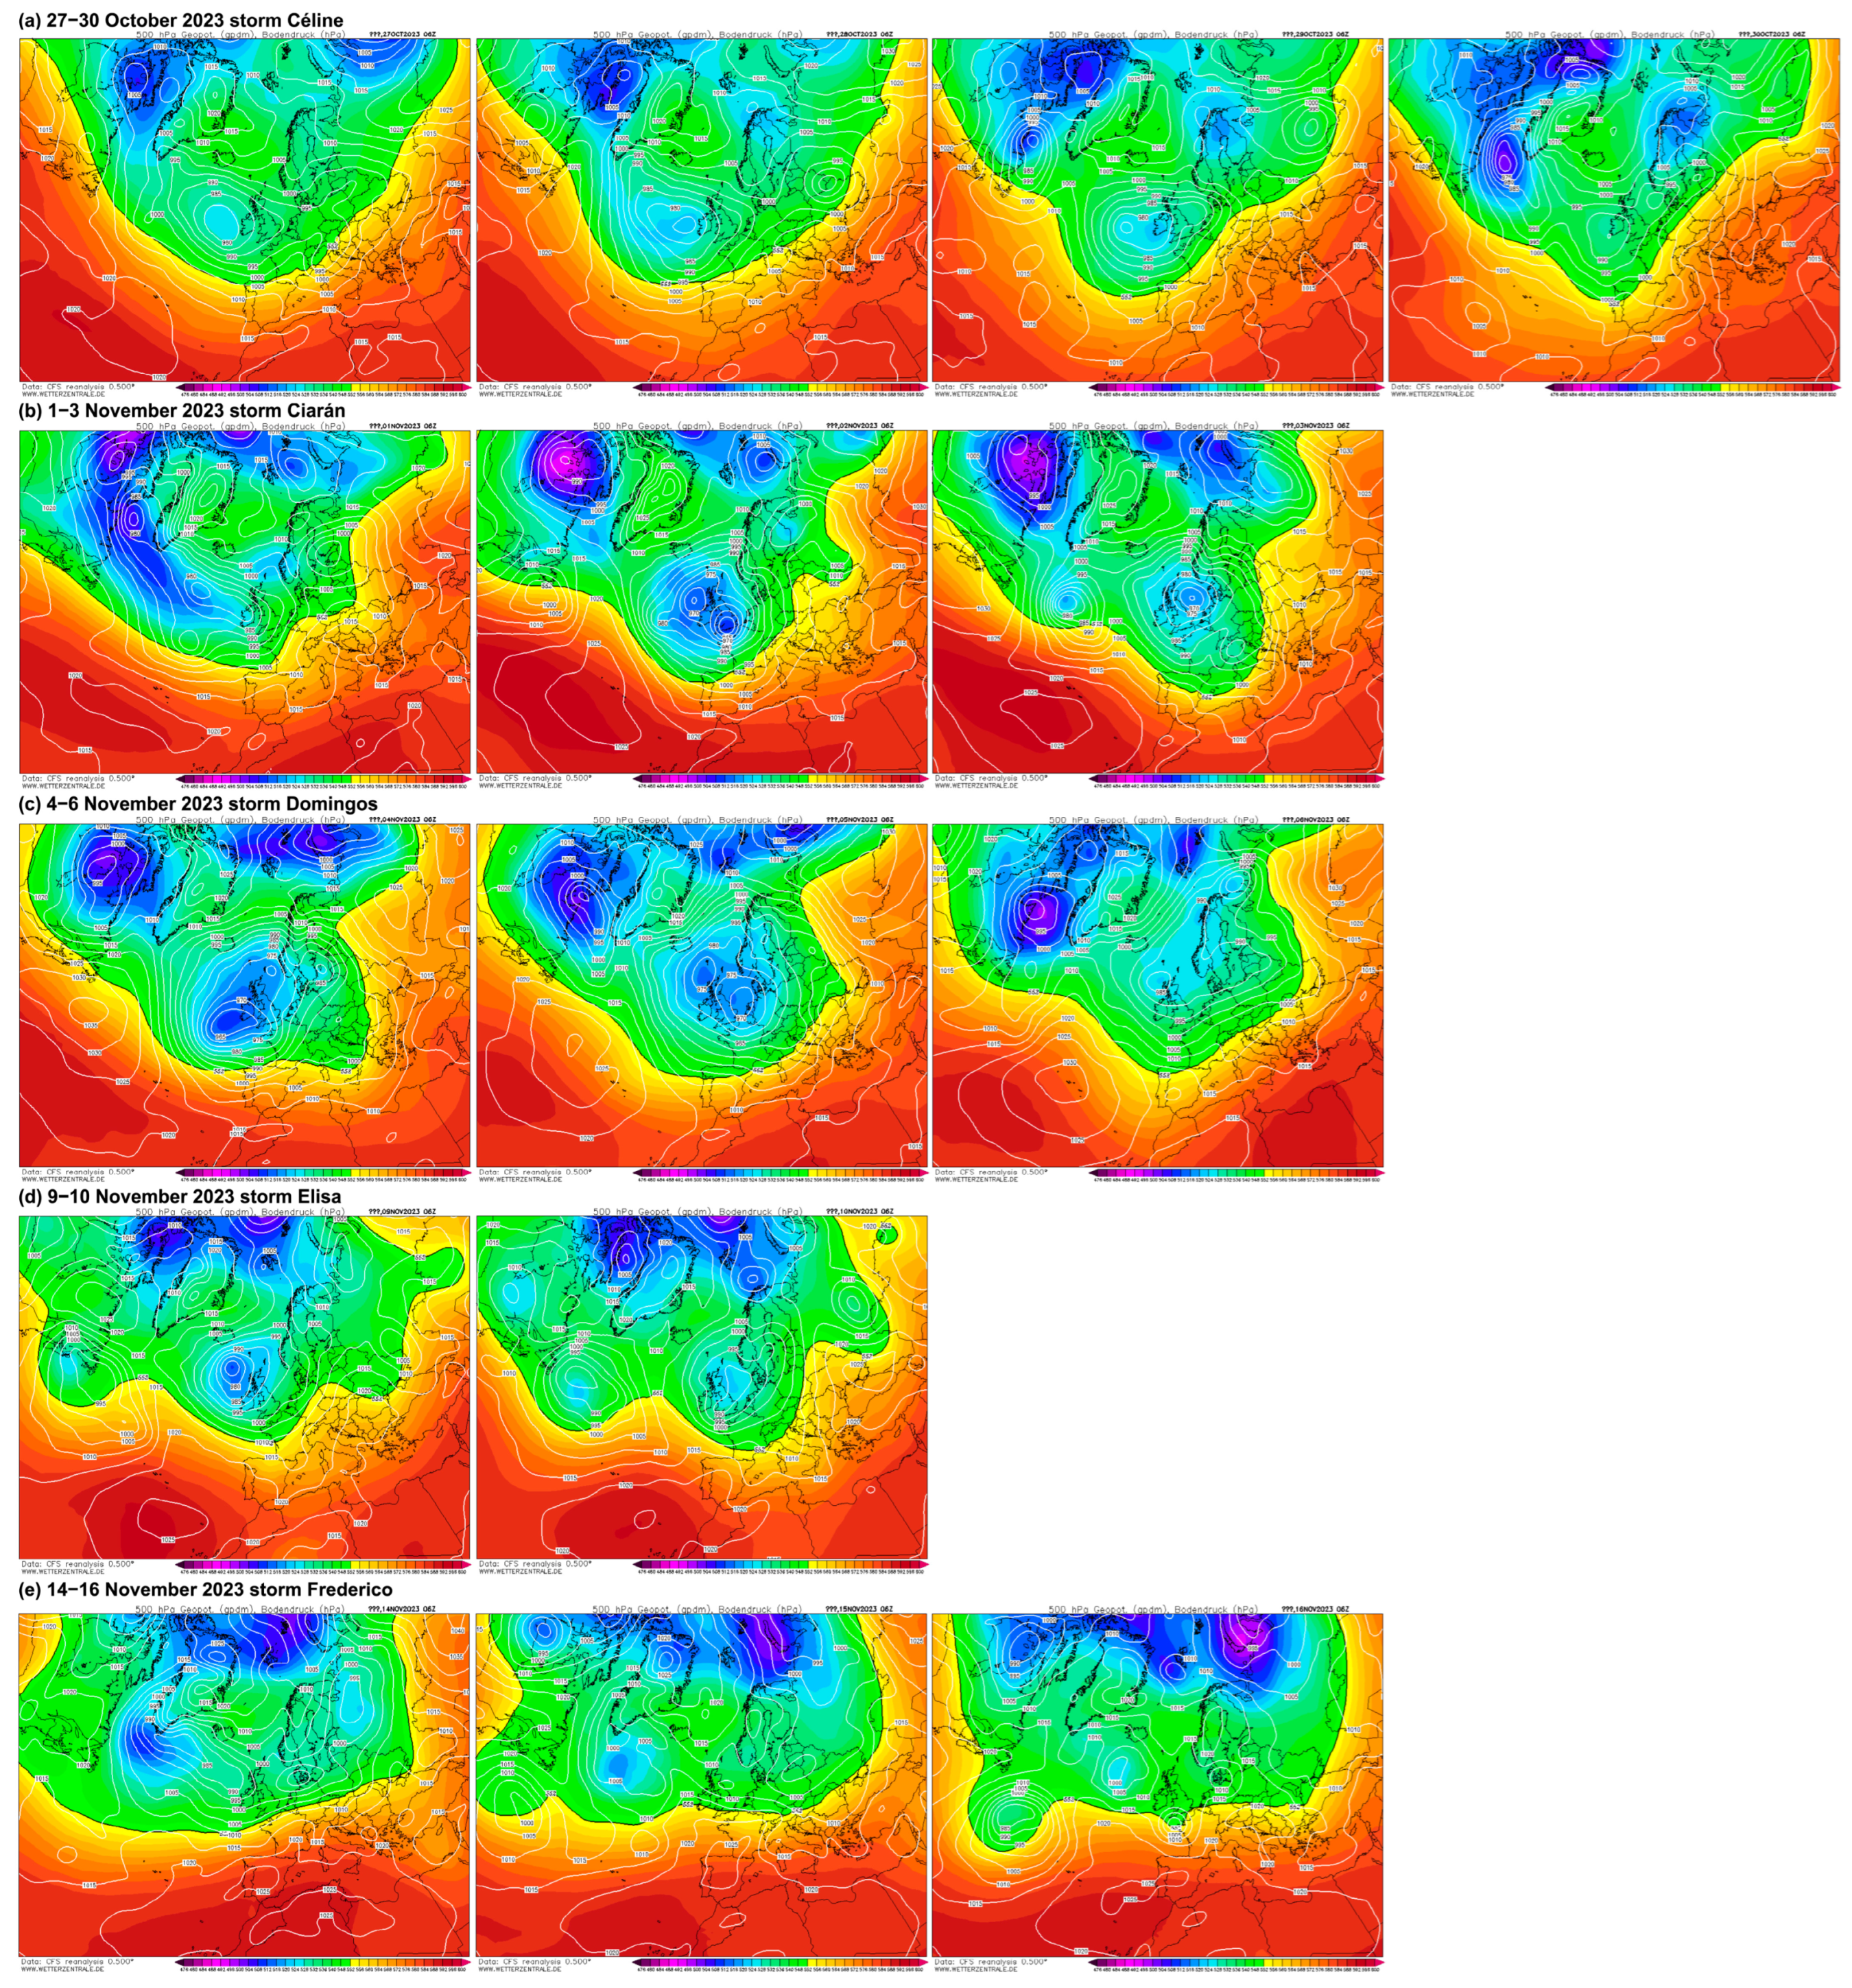
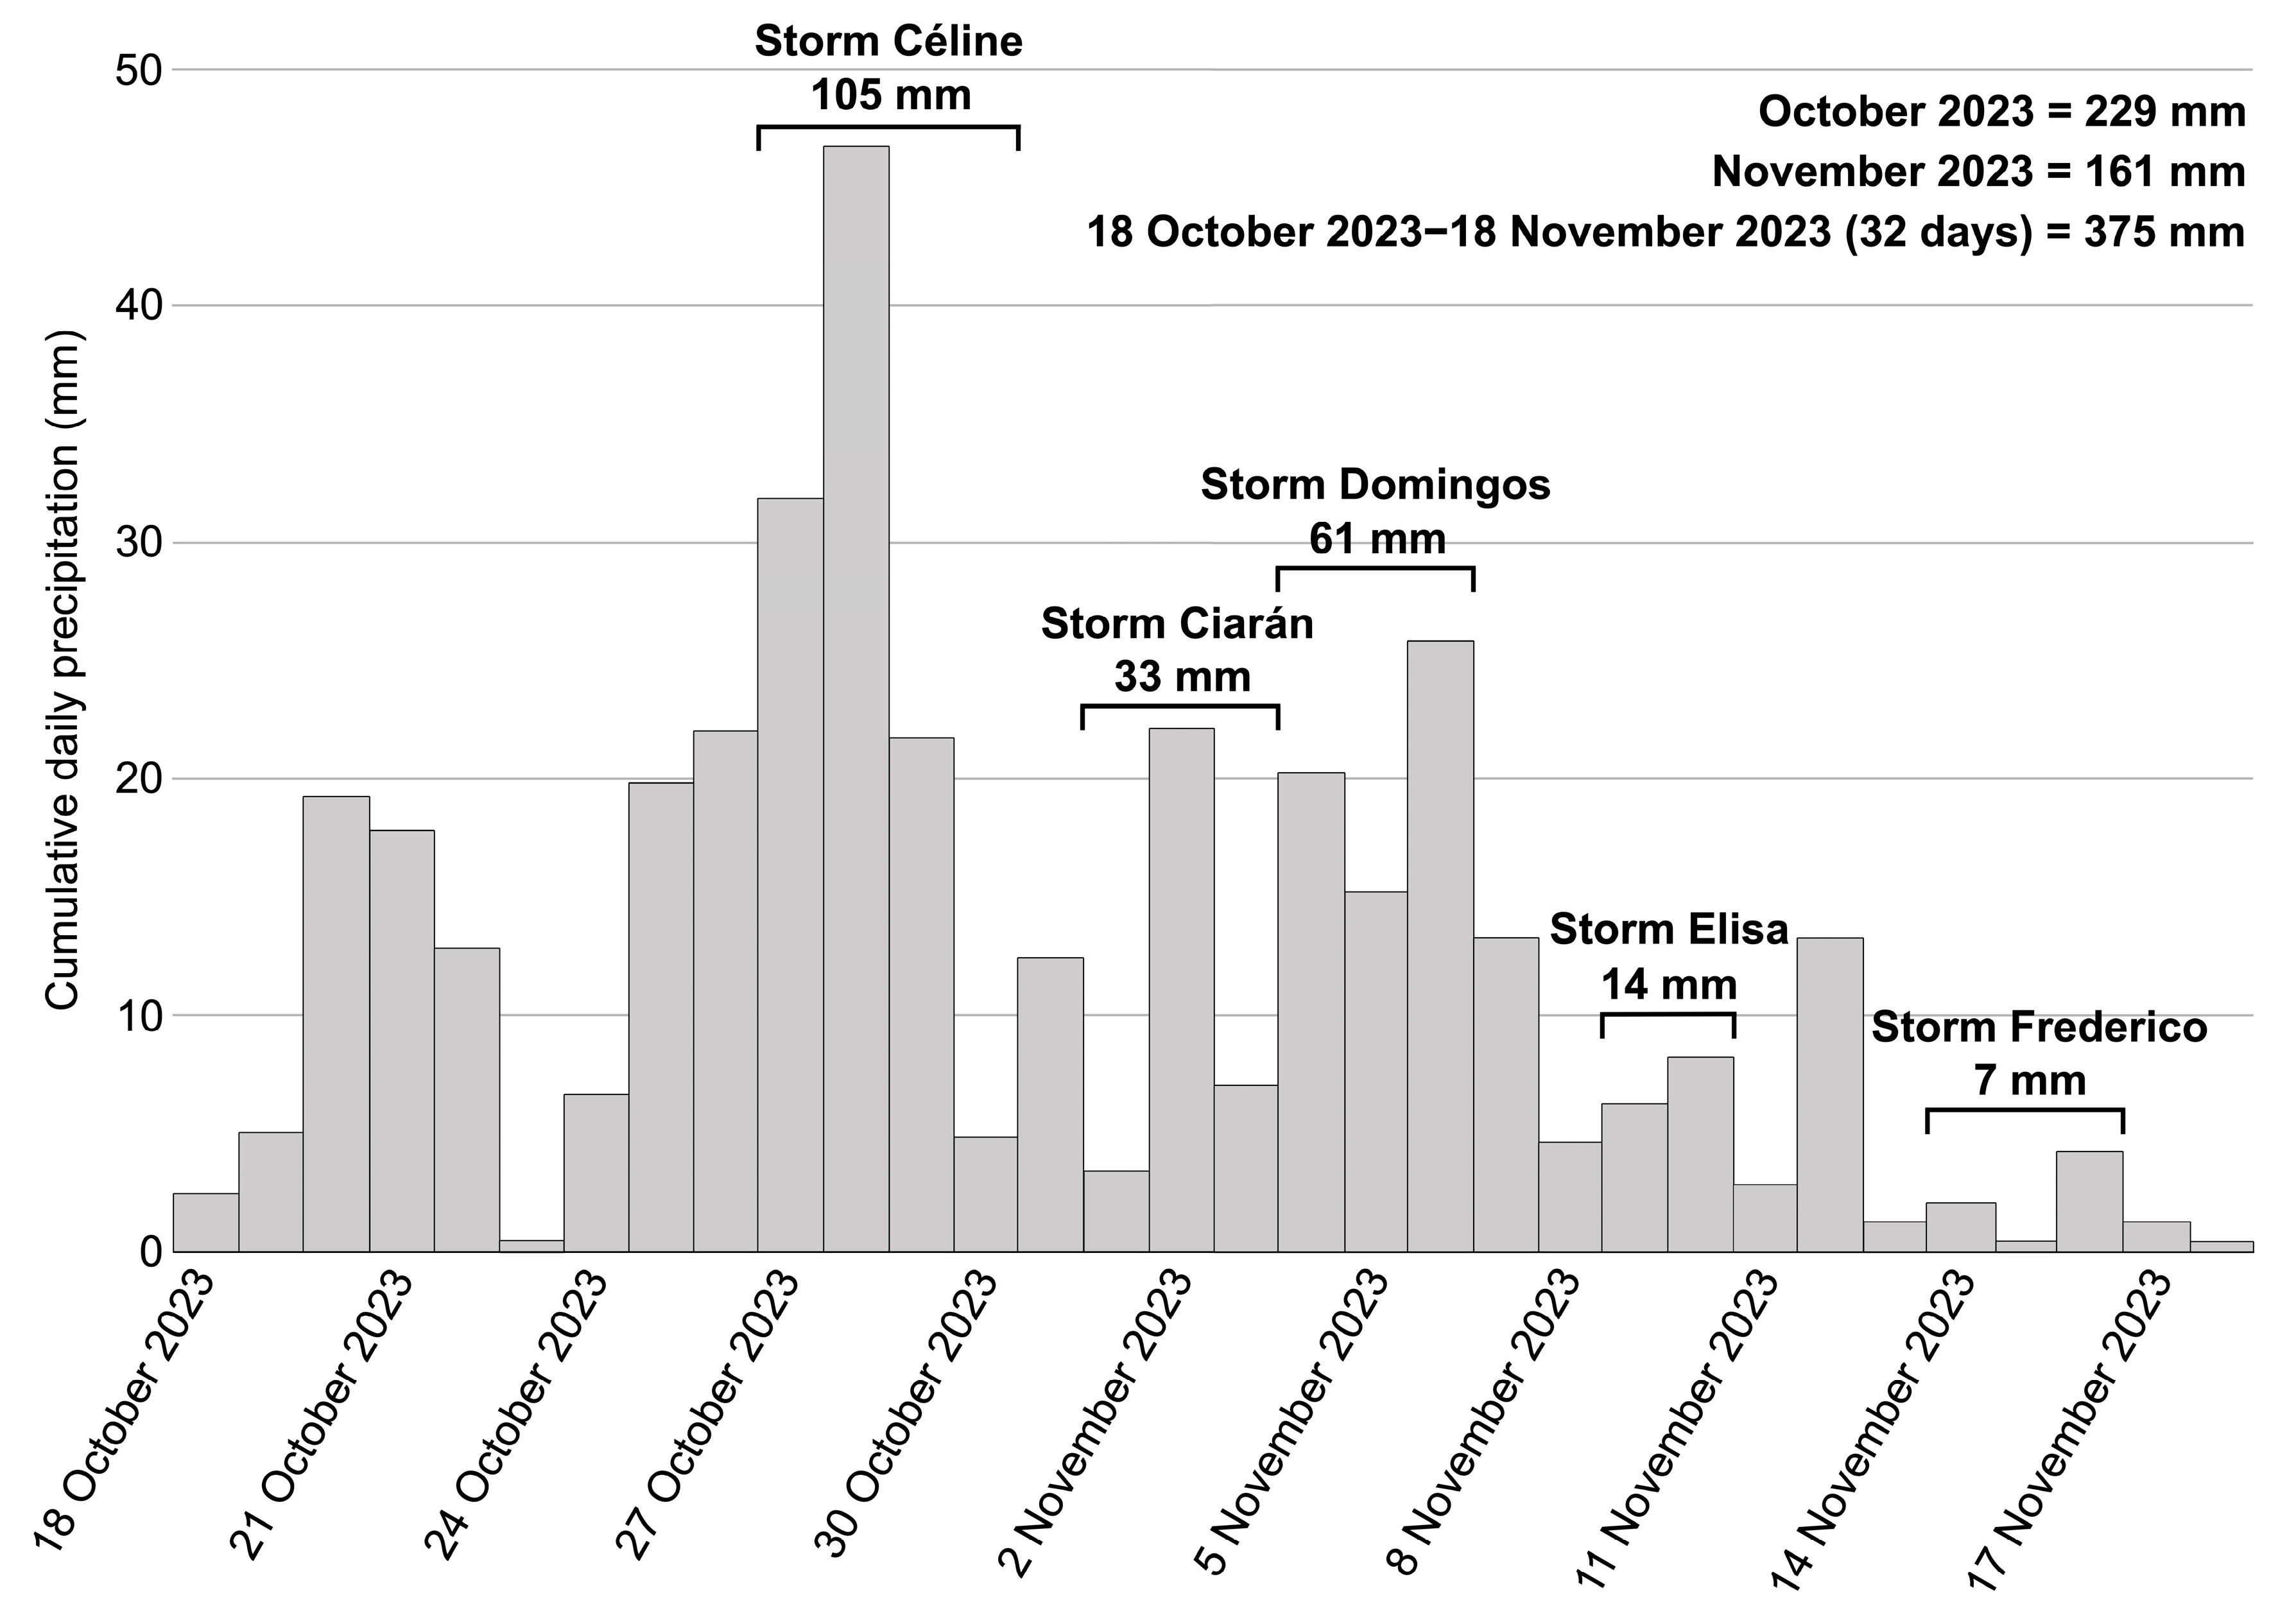
The 1859 and 2023 autumns are notable for the early onset of storms, coupled with heavy rainfall as early as the last decade of October. In 1859, cumulative autumn precipitation reaches 400 mm in La Rochelle, 396 mm in Rochefort, and 303 mm in Saint-Jean-d’Angély. In 2023, cumulative autumn rainfall is close to 418 mm in Angoulême and 517 mm in Saintes. The November 1859 and November 2023 floods occur in the context of a particularly long and intense rainfall sequence, caused by a very meridional positioning of the jet stream and a trajectory of disturbed oceanic flows from the North Atlantic. In both cases, the ONDJFM NAO index is negative [102] (index baseline period: 1901–2000), with a high negative SON NOA index of around −0.50 [103]. October shows a particularly high negative monthly NAO index, −1.14 in 1859 [104] and −2.03 in 2023 [105]. Between 24 October and 5 November 1859 and between 18 October and 18 November 2023, several storm events with heavy precipitation, which are rare at this time of year, occur at short intervals on the Charente watershed (Figure 12 and Figure 13).
Between 24 October and 5 November 1859, three major storms occur in the space of thirteen days (Figure 12). Newspaper sources report that the first storm, which occurs between 24 and 26 October, is particularly severe. It is accompanied by high gusts of wind and very heavy rainfall. Along the coast, swell and rising sea levels due to high tidal coefficients lead to local marine submersion. Tidal coefficients exceeded 90 on 25 and 26 October 1859 at Île d’Aix [106]. Inland, heavy rainfall caused small, localized floods on the Charente River. From 27 to 30 October, rainfall is intense and continuous. On 31 October and 1 November, a second storm, much stronger than the previous one, generated violent winds both on the coast and inland, but above all, heavy rainfall that caused extensive floods on the Charente River and its tributaries. Finally, on 4 and 5 November, a third storm, less violent than the previous two, generated further precipitation, amplifying the rise in water levels on the Lower Charente River.
Between 18 October and 18 November 2023, five storms with heavy rainfall occur in the space of twenty days (Figure 13 and Figure 14). Storm Céline (27–30 October), of moderate intensity, was responsible for strong winds of 90 to 100 km/h along the Charente coast, coupled with persistent rainfall. Two days later, a violent storm named “Ciarán” hit the Charente watershed between November 1 and 3. This storm generates violent winds of 130 to 150 km/h on the coasts and 90 to 110 km/h inland, accompanied by further heavy precipitation. Two days later, storm Domingos affects the Charente watershed from 4 to 6 November. Significant but less violent than the Ciarán storm, it generates further heavy rainfall and strong winds. Wind gusts of up to 152 km/h are recorded in Cognac. On 9 and 10 November, storm Elisa causes further heavy rainfall across the watershed. In mid-November, storm Frederico (14–16 November) ends this very disturbed period. Although much more modest than the four previous storms, it produces locally sustained rainfall, particularly over the northern part of the basin.
The November 1859 and November 2023 floods begin in the last days of October for the older and the first days of November for the more recent. In both cases, the floods were particularly long, lasting around three to four weeks in the Charente watershed. In 1859, the Charente reaches a maximum of 5.31 m on 3 November at Angoulême and 6.30 m on 5 or 6 November at Saintes. These particularly high-water levels place the November 1859 flood among the extreme floods, ranking it 4th for the Upper Charente River and 8th for the Lower Charente River (Figure 15). This extreme flood event corresponds to a 50-year flood on the Upper Charente River and a 30-year flood on the Lower Charente River. Material damage is considerable in the towns along the Charente River, particularly in Angoulême and Saintes (Figure 7). Although less intense in terms of water levels and material damage, the November 2023 flood reaches water levels close to a 4-year flood, which is rare for such an early autumn flood.

6. Conclusions

The grouped floods of 2023–2024 on the Charente River are exceptional in terms of both the repetition of the number of floods and the precocity of the first annual flood. Although this hydrological phenomenon is rarely observed, it is not unprecedented since the 18th century. Indeed, the 2023–2024 sequence presents high similarities with the 1859–1860 sequence. In both cases, the first annual flood occurred early in the year (i.e., the November 1859 and 2023 floods), after an exceptionally hot and dry summer that prolonged into mid-autumn. An almost uninterrupted succession of storms favored by the meridional positioning of the jet stream over the near Atlantic—a rare phenomenon at this time of year—caused particularly prolonged and extensive flooding. The November 1859 and 2023 floods reached exceptional water levels for this time of year, corresponding to a 50-year flood to a 30-year flood for 1859 and a 4-year flood for 2023.
This work highlights the importance of documentary sources and instrumental data in the understanding of past grouped floods in the Charente watershed. However, data for the 18th century and most of the 19th century (up to the 1870s) remain poorly documented. Documentary sources are few and far between, and information is generally not very detailed and often unreliable. While this lack of documentation can be explained by conservation bias (lost, destroyed, and/or unclassified documents), it is mainly attributed to the specific characteristics of the Charente River floods. Despite (very) long flood durations, flow speeds are low. The floods have had a limited impact on human life, both in the past and in the present. As a result, they produced few archives until the 1870s, even though they caused major material damage and dysfunction. This is the case for the November 1859 flood. The lack of instrumental data limits our ability to reconstruct the context and course of the flood. To overcome this limitation, the extension of used sources was carried out in archive centers to retrieve daily records of rainfall, temperature, wind, and sky conditions on a regional scale in order to clarify the context of the 19th-century floods.
The 2023–2024 clustered floods on the Charente River highlight the importance of improving our understanding of these still little-studied hydrological phenomena. The analysis of historical antecedents allows us to better understand the conditions of their formation and course in order to more effectively anticipate these events and their course in the context of climate change and land use evolution. This research also highlights the value of approaching grouped floods as a hydrological phenomenon in their own right, which remains a largely underestimated risk for the time being. Particularly in the context of low-energy rivers with slow flood kinetics, grouped floods are likely to produce very long-lasting floods, with significant impacts on the territories concerned. It is therefore essential to adapt flood severity indicators to this specific geomorphological context.

Author Contributions

Conceptualization, A.D. and J.-M.C.; methodology, A.D. and J.-M.C.; software, A.D. and J.-M.C.; validation, A.D. and J.-M.C.; formal analysis, A.D. and J.-M.C.; investigation, A.D.; resources, A.D. and J.-M.C.; data curation, A.D. and J.-M.C.; writing—original draft preparation, A.D. and J.-M.C.; writing—review and editing, A.D. and J.-M.C.; visualization, A.D. and J.-M.C.; supervision, A.D. and J.-M.C.; project administration, A.D. and J.-M.C.; funding acquisition, A.D. and J.-M.C. All authors have read and agreed to the published version of the manuscript.

Funding

This research received no external funding.

Data Availability Statement

The original contributions presented in this study are included in the article. Further inquiries can be directed to the corresponding author.

Acknowledgments

We would like to thank EPTB Charente for providing us with access to the website e-crue. We acknowledge the archives of the Département de la Charente-Maritime for providing permission to publish Figure 6, the archives of the Département de la Charente for Figure 8a,c and the fonds régional et ancien des médiathèques de Saintes for Figure 8b. We are also grateful to Wetterzentrale for providing permission to publish Figure 14 and Figure 15.

Conflicts of Interest

The authors declare no conflicts of interest.

References

  1. Howe, J.; White, I. The Geography of the Autumn 2000 Floods in England and Wales: Causes and Solutions. Geography 2002, 87, 116–124. [Google Scholar] [CrossRef]
  2. Marsh, T.J. A hydrological overview of the summer 2007 floods in England and Wales. Weather 2008, 63, 274–279. [Google Scholar] [CrossRef]
  3. Marsh, T.J.; Hannaford, J. The Summer 2007 Floods in England and Wales—A Hydrological Appraisal; Centre for Ecology & Hydrology: Lancaster, UK, 2007; p. 32. [Google Scholar]
  4. Kay, A.L.; Crooks, S.M.; Pall, P.; Stone, D.A. Attribution of Autumn/Winter 2000 flood risk in England to anthropogenic climate change: A catchment-based study. J. Hydrol. 2011, 406, 97–112. [Google Scholar] [CrossRef]
  5. Ulbrich, U.; Brücher, T.; Fink, A.H.; Leckebusch, G.C.; Krüger, A.; Pinto, J.G. The central European floods of August 2002: Part 1—Rainfall periods and flood development. Weather 2003, 58, 371–377. [Google Scholar] [CrossRef]
  6. Ulbrich, U.; Brücher, T.; Fink, A.H.; Leckebusch, G.C.; Krüger, A.; Pinto, J.G. The central European floods of August 2002: Part 2—Synoptic causes and considerations with respect to climatic change. Weather 2003, 58, 434–441. [Google Scholar] [CrossRef]
  7. ICPDR. The Analysis of the Danube Floods 2006; International Commission for the Protection of the Danube River: Vienna, Austria, 2008. [Google Scholar]
  8. ICPDR. Floods in June 2013 in the Danube River Basin. Brief Overview of Key Events and Lessons Learned; International Commission for the Protection of the Danube River: Vienna, Austria, 2014. [Google Scholar]
  9. Lehmkuhl, F.; Schüttrumpf, H.; Schwarzbauer, J.; Brüll, C.; Dietze, M.; Letmathe, P.; Völker, C.; Hollert, H. Assessment of the 2021 summer flood in Central Europe. Environ. Sci. Eur. 2022, 34, 107. [Google Scholar] [CrossRef]
  10. Faranda, D.; Bourdin, S.; Ginesta, M.; Krouma, M.; Noyelle, R.; Pons, F.; Yiou, P.; Messori, G. A climate-change attribution retrospective of some impactful weather extremes of 2021. Weather Clim. Dynam. 2022, 3, 1311–1340. [Google Scholar] [CrossRef]
  11. Kron, W.; Bell, R.; Thiebes, B.; Thieken, A.H. The July 2021 flood disaster in Germany. In HELP Global Report on Water and Disasters 2022; Secretariat of the High-level Experts and Leaders Panel on Water and Disasters (HELP): Tokyo, Japan, 2022; Chapter 2; pp. 12–44. Available online: https://www.wateranddisaster.org/category/documents/ (accessed on 3 November 2024).
  12. Thieken, A.H.; Bubeck, P.; Heidenreich, A.; von Keyserlingk, J.; Dillenardt, L.; Otto, A. Performance of the flood warning system in Germany in July 2021—Insights from affected residents. Nat. Hazards Earth Syst. Sci. 2023, 23, 973–990. [Google Scholar] [CrossRef]
  13. ClimaMeter. Available online: https://www.climameter.org/20231020-20231121-france-italy-floods (accessed on 3 November 2024).
  14. Brázdil, R.; Kundzewicz, Z.W.; Benito, G. Historical hydrology for studying flood risk in Europe. Hydrol. Sci. J. 2006, 51, 739–764. [Google Scholar] [CrossRef]
  15. PPS 25 (Planning Policy Statement 25). Development and Flood Risk; Communities and Local Government, HMSO: Norwich, UK, 2006; p. 50. [Google Scholar]
  16. Brázdil, R.; Dobrovolný, P.; Elleder, L.; Kakos, V.; Kotyza, O.; Kveton, V.; Macková, J.; Müller, M.; Štekl, J.; Tolasz, R.; et al. Historical and Recent Floods in the Czech Republic; Masaryk University: Brno, Czech Republic; Czech Hydrometeorological Institute: Prague, Czech Republic, 2005; p. 369. [Google Scholar]
  17. Merz, B.; Blóschl, G.; Vorogushyn, S.; Dottori, F.; Aerts, J.; Bates, P.; Bertola, M.; Kemter, M.; Kreibich, H.; Lall, U.; et al. Causes, impacts and patterns of disastrous river floods. Nat. Rev. Earth Environ. 2021, 2, 592–609. [Google Scholar] [CrossRef]
  18. Lang, M.; Moussay, D.; Recking, A.; Naulet, R. Hydraulic modelling of historical floods: A case study on the Ardeche river at Vallon-Pont-D’arc. In Palaeofloods, Historical Data & Climatic Variability: Applications in Flood Risk Assessment, Proceedings of the PHEFRA International Workshop, Barcelona, Spain, 16–19 October 2002; Thorndycraft, V.R., Benito, G., Barriendos, M., Llasat, C., Eds.; CSIC: Madrid, Spain, 2003; pp. 183–189. [Google Scholar]
  19. Ngo, H.; Bomers, A.; Augustijn, D.C.M.; Ranasinghe, R.; Filatova, T.; van der Meulen, B.; Herget, J.; Hulscher, S.J.M.H. Reconstruction of the 1374 Rhine river flood event around Cologne region using 1D-2D coupled hydraulic modelling approach. J. Hydrol. 2023, 617, 129039. [Google Scholar] [CrossRef]
  20. Van der Meulen, B.; Bomers, A.; Cohen, K.M.; Middlekoop, H. Late Holocene flood magnitudes in the Lower Rhine river valley and upper delta resolved by a two-dimensional hydraulic modelling approach. Earth Surf. Proc. Land. 2021, 46, 853–868. [Google Scholar] [CrossRef]
  21. Barriendos, M.; Coeur, D.; Lang, M.; Llasat, M.C.; Naulet, R.; Lemaitre, F.; Barrera, A. Stationarity analysis of historical flood series in France and Spain (14th–20th centuries). Nat. Hazards Earth Syst. Sci. 2003, 3, 583–592. [Google Scholar] [CrossRef]
  22. Benito, G.; Díez-Herrero, A.; Fernández De Villalta, M. Magnitude and frequency of flooding in the Tagus basin (Central Spain) over the last millennium. Clim. Change 2003, 58, 171–192. [Google Scholar] [CrossRef]
  23. Glaser, R.; Riemann, D.; Schönbein, J.; Barriendos, M.; Brázdil, R.; Bertolin, C.; Himmelsbach, I. The variability of European floods since AD 1500. Clim. Change 2010, 101, 235–256. [Google Scholar] [CrossRef]
  24. Blöschl, G.; Kiss, A.; Viglione, A.; Barriendos, M.; Böhm, O.; Brázdil, R.; Coeur, D.; Demarée, G.; Llasat, M.C.; Macdonald, N.; et al. Current European flood-rich period exceptional compared with past 500 years. Nature 2020, 583, 560–566. [Google Scholar] [CrossRef]
  25. Hall, J.; Arheimer, B.; Borga, M.; Brázdil, R.; Claps, P.; Kiss, A.; Kjeldsen, T.R.; Kriaucīuniene, J.; Kundzewicz, Z.W.; Lang, M.; et al. Understanding flood regime changes in Europe: A state-of-the-art assessment. Hydrol. Earth Syst. Sci. 2014, 18, 2735–2772. [Google Scholar] [CrossRef]
  26. Macdonald, N. Trends in flood seasonality of the River Ouse (northern England), from archive and instrumental sources since AD 1600. Clim. Change 2012, 110, 901–923. [Google Scholar] [CrossRef]
  27. Macdonald, N.; Black, A.R. Reassessment of flood frequency using historical information for the River Ouse at York, UK, (1200–2000). Hydrolog. Sci. J. 2010, 55, 1152–1162. [Google Scholar] [CrossRef]
  28. Macdonald, N.; Sangster, H. High-magnitude flooding across Britain since AD 1750. Hydrol. Earth Syst. Sci. 2017, 21, 1631–1650. [Google Scholar] [CrossRef]
  29. Macdonald, N.; Black, A.R.; Werritty, A.; McEwen, L.J. Historical and pooled flood frequency analysis for the River Tay at Perth, Scotland. Area 2006, 38, 34–46. [Google Scholar] [CrossRef]
  30. Brázdil, R.; Řezníčková, L.; Valášek, H.; Havlíček, M.; Dobrovolný, P.; Soukalová, E.; Řehánek, T.; Skokanová, H. Fluctuations of floods of the River Morava (Czech Republic) in A.D. 1691–2009: Interactions of natural and anthropogenic factors. Hydrolog. Sci. J. 2011, 56, 468–485. [Google Scholar] [CrossRef]
  31. Brázdil, R.; Faturová, D.; Šulc Michalková, M.; Řehoř, J.; Caletka, M.; Zahradníček, P. Spatiotemporal variability of flash floods and their human impacts in the Czech Republic during the 2001–2023 period. Nat. Hazards Earth Syst. Sci. 2024, 24, 3663–3682. [Google Scholar] [CrossRef]
  32. Brázdil, R.; Kotyza, O.; Dobrovolný, P. July 1432 and August 2002—Two millennial floods in Bohemia? Hydrol. Sci. J. 2006, 51, 848–863. [Google Scholar] [CrossRef]
  33. Mudelsee, M.; Börngen, M.; Tetzlaff, G.; Grünewald, U. No upward trends in the occurrence of extreme floods in central Europe. Nature 2003, 425, 166–169. [Google Scholar] [CrossRef]
  34. Mudelsee, M.; Deutsch, M.; Börngen, M.; Tetzlaff, G. Trends in flood risk of the River Werra (Germany) over the past 500 years. Hydrol. Sci. J. 2006, 51, 818–833. [Google Scholar] [CrossRef]
  35. Glaser, R.; Stangl, H. Climate and floods in Central Europe since AD 1000: Data, methods, results and consequences. Surv. Geophys. 2004, 25, 485–510. [Google Scholar] [CrossRef]
  36. Toonen, W.H.J.; Winkels, T.G.; Cohen, K.M.; Prins, M.A.; Middelkoop, H. Lower Rhine historical flood magnitudes of the last 450 years reproduced from grain-size measurements of flood deposits using End Member Modelling. Catena 2015, 130, 69–81. [Google Scholar] [CrossRef]
  37. Burger, K.; Dostal, P.; Seidel, J.; Imbery, F.; Barriendos, M.; Mayer, H.; Glaser, R. Hydrometeorological reconstruction of the 1824 flood event in the Neckar River basin (southwest Germany). Hydrol. Sci. J. 2006, 51, 864–877. [Google Scholar] [CrossRef]
  38. Tol, R.S.J.; Langen, A. A concise history of Dutch river floods. Clim. Change 2000, 46, 357–369. [Google Scholar] [CrossRef]
  39. Wetter, O.; Pfister, C.; Weingartner, R.; Luterbacher, J.; Reist, T.; Trösch, J. The largest floods in the High Rhine basin since 1268 assessed from documentary and instrumental evidence. Hydrolog. Sci. J. 2011, 56, 733–758. [Google Scholar] [CrossRef]
  40. Wetter, O. The potential of historical hydrology in Switzerland. Hydrol. Earth Syst. Sci. 2017, 21, 5781–5803. [Google Scholar] [CrossRef]
  41. Llasat, M.C.; Barriendos, M.; Barrera, A.; Rigo, T. Floods in Catalonia (NE Spain) since the 14th century. Climatological and meteorological aspects from historical documentary sources and old instrumental records. J. Hydrol. 2005, 313, 32–47. [Google Scholar] [CrossRef]
  42. Barriendos, M.; Rodrigo, F.S. Study of historical flood events on Spanish river using documentary data. Hydrol. Sci. J. 2006, 51, 765–783. [Google Scholar] [CrossRef]
  43. Sánchez-García, C.; Schulte, L.; Peña, J.C.; Carvalho, F.; Brembilla, C. A 500-year history of floods in the semiarid basins of south-eastern Spain. Geophys. Res. Abstr. 2016, 18, 104317. [Google Scholar]
  44. Sánchez-García, C.; Schulte, L.; Carvalho, F.; Peña, J.C. A 500-year flood history in the arid environments of southeastern Spain. The case of the Almanzora River. Global Planet. Change 2019, 181, 102987. [Google Scholar] [CrossRef]
  45. Sánchez-García, C.; Schulte, L. Historical floods in the southeastern Iberian Peninsula since the 16th century: Trends and regional analysis of extreme flood events. Global Planet. Change 2023, 231, 104317. [Google Scholar] [CrossRef]
  46. Engeland, K.; Aano, A.; Steffensen, I.; Støren, E.; Paasche, Ø. New flood frequency estimates for the largest river in Norway based on the combination of short and long time series. Hydrol. Earth Syst. Sci. 2020, 24, 5595–5619. [Google Scholar] [CrossRef]
  47. Engeland, K.; Wilson, D.; Borsányi, P.; Roald, L.; Holmqvist, E. Use of historical data in flood frequency analysis: A case study for four catchments in Norway. Hydrol. Res. 2018, 49, 466–486. [Google Scholar] [CrossRef]
  48. Hardeng, J.; Bakke, J.; Cederstrøm, J.M.; Forsmo, J.; Haugen, T.A.; Sabatier, P.; Støren, N.; Wilhelm, E.; van der Bilt, W.G.M. A 7000-year record of extreme flood events reconstructed from a threshold lake in southern Norway. Quat. Sci. Rev. 2024, 331, 108659. [Google Scholar] [CrossRef]
  49. Reghezza-Zitt, M. Paris Coule-t-il? Fayard: Paris, France, 2012; p. 350. [Google Scholar]
  50. Dacharry, M. Les grandes crues historiques de la Loire. Houille Blanche 1996, 6–7, 47–53. [Google Scholar] [CrossRef]
  51. Ramond, S. Réponses Hydrologiques de la Loire Moyenne aux Changements Environnementaux. Formation des Débits et Fonctionnement d’une Plaine Alluviale: Approches Hydrologiques et Géochimiques Multi-Scalaire. Ph.D. Thesis, École Doctorale Sciences Sociales, Paris, France, 2015. [Google Scholar]
  52. Mesmin, E.; Gautier, E.; Arnaud-Fassetta, G.; Foucher, M.; Martins, G.; Gob, F. Characterization of periods of high and low hydrological activity in the Loire River, France, between the 14th and mid-19th centuries. J. Hydrol. 2024, 633, 130932. [Google Scholar] [CrossRef]
  53. Pichard, G.; Roucaute, É. Sept siècles d’histoire hydroclimatique du Rhône d’Orange à la mer (1300-2000), climat, crues, inondations, Georges PICHARD et Émeline ROUCAUTE, 2014. Physio-Géo 2014, 9, 192. [Google Scholar]
  54. Pichard, G.; Arnaud-Fassetta, G.; Moron, V.; Roucaute, E. Hydro-climatology of the lower Rhône Valley: Historical flood reconstruction (AD 1300–2000) based on documentary and instrumental sources. Hydrol. Sci. J. 2017, 62, 1772–1795. [Google Scholar] [CrossRef]
  55. Toonen, W.H.J.; Middelkoop, H.; Konijnendijk, T.Y.M.; Macklin, M.G.; Cohen, K.M. The influence of hydroclimatic variability on flood frequency in the Lower Rhine. Earth Surf. Process. Landf. 2016, 41, 1266–1275. [Google Scholar] [CrossRef]
  56. Antoine, J.M.; Desailly, B. Base de Données Historiques sur les Inondations de la Cèze, des Gardons, du Vidourle et de l’Hérault dans le Département du Gard (XIIIe Siècle-XXe Siècle); Départementale de l’Equipement du Gard: Nîmes, France, 1994; 264p. [Google Scholar]
  57. Antoine, J.M.; Desailly, B.; Gazelle, F. Les crues meurtrières, du Roussillon aux Cévennes. Ann. Géographie 2001, 110, 597–623. [Google Scholar] [CrossRef]
  58. Blanchemanche, P. Crues historiques et vendanges en languedoc méditerranéen oriental: La source, le signal et l’interprétation. Archéol. Midi Médiév. 2009, 27, 225–235. [Google Scholar] [CrossRef]
  59. Berger, J.F.; Blanchemanche, P.; Reynès, C.; Sabatier, P. Dynamiques fluviales en basse vallée du vidourle au cours des six derniers siècles. confrontation des données pédosédimentaires à haute résolution temporelle à l’analyse fréquentielle des crues historiques. Quaternaire 2010, 21, 27–41. [Google Scholar] [CrossRef]
  60. Desailly, B. Crues et inondations en Roussillon. Le risque et l’aménagement. Rev. Géogr. Pyrén. Sud-Ouest 1990, 61, 515–519. [Google Scholar] [CrossRef]
  61. Antoine, J.M. Géohistoire des Catastrophes et des Risques Torrentiels. Une Histoire de l’Environnement Pyrénéen; Postdoctoral Report; Université Toulouse Le Mirail (Toulouse II): Toulouse, France, 2010. [Google Scholar]
  62. Antoine, J.M. Vulnérabilité et adaptation des sociétés montagnardes à la torrentialité au cours du petit âge glaciaire dans les pyrénées. Sud-Ouest Eur. 2011, 32, 53–66. [Google Scholar] [CrossRef]
  63. Miramont, C.; Guilbert, X. Variations historiques de la fréquence des crues et évolution de la morphogenèse fluviale en moyenne durance (France du Sud-Est). Géomorphologie 1997, 3, 325–337. [Google Scholar] [CrossRef]
  64. Cœur, D. La Plaine de Grenoble face aux Inondations: Genèse d’une Politique Publique du XVIIe au XXe Siècle; Quae: Versailles, France, 2008; p. 329. [Google Scholar]
  65. Wilhelm, B.; Arnaud, F.; Sabatier, P.; Magand, O.; Chapron, E.; Courp, T.; Tachikawa, K.; Fanget, B.; Malet, E.; Pignol, C.; et al. Palaeoflood activity and climate change over the last 1400 years recorded by lake sediments in the north-west European Alps. J. Quat. Sci. 2013, 28, 189–199. [Google Scholar] [CrossRef]
  66. Wilhelm, B.; Rapuc, W.; Amann, B.; Anselmetti, F.S.; Arnaud, F.; Blanchet, J.; Brauer, A.; Czymzik, M.; Giguet-Covex, C.; Gilli, A.; et al. Impact of warmer climate periods on flood hazard in the european Alps. Nat. Geosci. 2022, 15, 118–123. [Google Scholar] [CrossRef]
  67. Naulet, R. Utilisation de l’Information des Crues Historiques pour une Meilleure Prédétermination du Risque d’Inondation: Application au Bassin de l’Ardèche à Vallon Pont-d’Arc et St-Martin d’Ardèche. Ph.D. Thesis, Université Joseph Fourier (Grenoble I), Saint-Martin-d’Hères, France, 2002. [Google Scholar]
  68. Naulet, R.; Lang, M.; Ouarda, T.B.; Coeur, D.; Bobée, B.; Recking, A.; Moussay, D. Flood frequency analysis on the Ardèche river using French documentary sources from the two last centuries. J. Hydrol. 2005, 313, 58–78. [Google Scholar] [CrossRef]
  69. With, L. Approche Géohistorique de la Gestion et de la Prévention du Risque d’Inondation: Le Cas de la Vallée de la Lauch (Haut-Rhin) de 1778 à nos Jours. Ph.D. Thesis, Université de Haute-Alsace, Mulhouse, France, 2014. [Google Scholar]
  70. With, L. Approche géohistorique de la gestion et de la prévention du risque d’inondation: Le cas de la vallée de la Lauch (Haut-Rhin) de 1778 à nos jours. Actes des Séminaires CRESAT 2015, 12, 127–142. [Google Scholar]
  71. Martin, B.; Holleville, N.; Furst, B.; Giacona, F.; Glaser, R.; Himmelsbach, I.; Schönbein, J. La géohistoire des inondations au service de l’évaluation critique du zonage du Plan de Prévention des Risques d’Inondation: L’exemple de Thann (Haut-Rhin, France). Belgeo 2015, 1, 1–16. [Google Scholar] [CrossRef]
  72. Martin, B.; Giacona, F.; Furst, B.; Edelblutte, C.; Glaser, R.; Himmelsbach, I.; Holleville, N.; Schönbein, J.; Heitz, C.; Bossmeier, A. La variabilité spatio-temporelle des inondations dans le Fossé rhénan à la lumière de l’évolution de la vulnérabilité. VertigO 2017, 17, 1–23. [Google Scholar]
  73. Martin, B.; Giacona, F.; With, L.; Edelblutte, C.; Furst, B.; Holleville, N.; Vitoux, M.C.; Glaser, R.; Himmelsbach, I.; Schönbein, J.; et al. Concepts, Méthodes et Opérationnalité en Géohistoire des Risques, à Travers l’Exemple de la Géohistoire des Inondations dans le Fossé Rhénan; CNRS Éditions: Paris, France, 2019; pp. 279–300. [Google Scholar]
  74. Lespez, L.; Germaine, M.A.; Barraud, R. L’évaluation par les services écosystémiques des rivières ordinaires est-elle durable? VertigO 2016, 25, 1–20. [Google Scholar]
  75. Duquesne, A.; Carozza, J.M. Ecrire la géohistoire d’un fleuve à faible énergie: Les crues de la Charente entre Angoulême et Saintes. Physio-Géo–Géographie Phys. Environ. 2019, 14, 57–86. [Google Scholar] [CrossRef]
  76. IPCC. Climate Change 2021: The Physical Science Basis. Contribution of Working Group I to the Sixth Assessment Report of the Intergovernmental Panel on Climate Change; Masson-Delmotte, V., Zhai, P., Pirani, A., Connors, S.L., Péan, C., Berger, S., Caud, N., Chen, Y., Goldfarb, L., Gomis, M.I., et al., Eds.; Cambridge University Press: Cambridge, UK; New York, NY, USA, 2021; p. 2391. [Google Scholar]
  77. Seneviratne, S.I.; Zhang, X.; Adnan, M.; Badi, W.; Dereczynski, C.; Di Luca, A.; Ghosh, S.; Iskandar, I.; Kossin, J.; Lewis, S.; et al. Weather and Climate Extreme Events in a Changing Climate. In Climate Change 2021: The Physical Science Basis. Contribution of Working Group I to the Sixth Assessment Report of the Intergovernmental Panel on Climate Change; Masson-Delmotte, V., Zhai, P., Pirani, A., Connors, S.L., Péan, C., Berger, S., Caud, N., Chen, Y., Goldfarb, L., Gomis, M.I., et al., Eds.; Cambridge University Press: Cambridge, UK; New York, NY, USA, 2021; pp. 1513–1766. [Google Scholar]
  78. Ranasinghe, R.; Ruane, A.C.; Vautard, R.; Arnell, N.; Coppola, E.; Cruz, F.A.; Dessai, S.; Islam, A.S.; Rahimi, M.; Carrascal, D.R.; et al. Chapter 12: Climate change information for regional impact and for risk assessment. In Climate Change 2021: The Physical Science Basis. Contribution of Working Group I to the Sixth Assessment Report of the Intergovernmental Panel on Climate Change; Masson-Delmotte, V., Zhai, P., Pirani, A., Connors, S.L., Péan, C., Berger, S., Caud, N., Chen, Y., Goldfarb, L., Gomis, M.I., et al., Eds.; Cambridge University Press: Cambridge, UK; New York, NY, USA, 2021; pp. 1767–1926. [Google Scholar]
  79. Carozza, J.M.; Duquesne, A.; Vayssière, A. L’anastomose du fleuve Charente: Apports de la quantification des formes fluviales à la connaissance des processus géomorphologiques et des facteurs de contrôle. Géomorphologie Relief Process. Environ. 2023, 29, 5–23. [Google Scholar] [CrossRef]
  80. Nanson, G.C. Anabranching and anastomosing rivers. Treatise Geomorphol. 2013, 9, 330–345. [Google Scholar]
  81. Duquesne, A.; Plumejeaud-Perreau, C.; Carozza, J.M. Trajectoire d’évolution d’un cours d’eau à très faible énergie: Le cas de la Charente entre Angoulême et Saintes (Ouest de la France). Géomorphologie Relief Process. Environ. 2020, 26, 97–115. [Google Scholar] [CrossRef]
  82. Duquesne, A. Trajectoire d’Évolution d’un Cours d’Eau à Faible Énergie au Cours du Second Holocène: Le Fleuve Charente entre Angoulême et Saintes. Ph.D. Thesis, La Rochelle Université, La Rochelle, France, 2021. [Google Scholar]
  83. Duquesne, A.; Plumejeaud-Perreau, C.; Carozza, J.M. Trajectoire Trajectoire d’évolution des îles fluviales d’un cours d’eau anastomosé à faible énergie: L’exemple de la Charente entre Angoulême et Saintes (ouest de la France). In Géohistoire des Zones Humides. Trajectoire d’Artificialisation et de Conservation; Valette, P., Burens, A., Carozza, L., Cristian, M., Eds.; Presses Universitaires Du Midi: Toulouse, France, 2024; pp. 97–126. [Google Scholar]
  84. Enjalbert, H. La vallée moyenne de la Charente. Esquisse Morphol. Ann. Géographie. 1952, 61, 16–33. [Google Scholar] [CrossRef]
  85. Bourgueil, B. Évolution de la transgression flandrienne et du littoral charentais depuis 8500 BP. Géol. Fr. 2005, 1, 75–84. [Google Scholar]
  86. Bry, C.; Hoflack, P. Le bassin versant de la Charente: Une illustration des problèmes posés par la gestion quantitative de l’eau. Courr. Environ. INRA 2004, 52, 81–96. [Google Scholar]
  87. HydroPortail. Available online: https://www.hydro.eaufrance.fr/ (accessed on 24 November 2024).
  88. DREAL Poitou-Charentes. Rapport de Présentation de la Cartographie du Risque d’Inondation de la Charente sur le Secteur de Saintes-Cognac-Angoulême; DREAL Occitanie: Montpellier, France, 2014. [Google Scholar]
  89. Direction Départementale des Territoires et de la Mer. Révision des PPRI des Communes Riveraines de la Charente, de Saintes à la Limite Amont du Département—Commune de Saintes—Note de Présentation; Départementale des Territoires et de la Mer: Saintes, France, 2011. [Google Scholar]
  90. EPTB Charente (The Website e-crue). Available online: http://www.fleuve-charente.net/les-donnees-sur-leau/suivi-des-crues/la-plateforme-e-crue (accessed on 4 November 2024).
  91. Météo-France. Available online: https://www.data.gouv.fr/fr/organizations/meteo-france/#/datasets (accessed on 4 November 2024).
  92. Wetterzentrale. Available online: https://www.wetterzentrale.de/ (accessed on 4 November 2024).
  93. Slivinski, L.C.; Compo, G.P.; Whitaker, J.S.; Sardeshmukh, P.D.; Giese, B.S.; McColl, C.; Allan, R.; Yin, X.; Vose, R.; Titchner, H.; et al. Towards a more reliable historical reanalysis: Improvements for version 3 of the Twentieth Century Reanalysis system. Q. J. R. Meteorol. Soc. 2019, 145, 2876–2908. [Google Scholar] [CrossRef]
  94. Société des Archives Historiques. Bulletin de la Société des Archives Historiques—Revue de la Saintonge et de l’Aunis; Société des Archives Historiques: Saintes, France, 1904; Volume 24, p. 513. [Google Scholar]
  95. Champion, M. Les Inondations en France du VIe Siècle à nos Jours; Dunod: Paris, France, 1863; Volume 5, pp. 197–204. [Google Scholar]
  96. RetroNews. Available online: https://www.retronews.fr/ (accessed on 4 November 2024).
  97. La Source—Portail des Archives de la Charente. Available online: https://lasource.archives.lacharente.fr/archive/egf/FRAD016-CC-OpinionsPresse/n:142 (accessed on 4 November 2024).
  98. Vigicrues. Available online: https://www.reperesdecrues.developpement-durable.gouv.fr/ (accessed on 4 November 2024).
  99. Lang, M.; Ouarda, T.B.M.J.; Bobée, B. Towards operational guidelines for over-threshold modeling. J. Hydrol. 1999, 225, 103–117. [Google Scholar] [CrossRef]
  100. Robson, A.J.; Reed, D.W. Statistical Procedures for Flood Frequency Estimation; Volume 3 of the Flood Estimation Handbook; Centre for Ecology and Hydrology: Bailrigg, UK, 1999; pp. 273–283. [Google Scholar]
  101. Barriendos, M.; Coeur, D. Flood data reconstruction in historical times from non-instrumental sources in Spain and France. In Use of Systematic, Palaeoflood and Historical Data for the Improvement of Flood Risk Estimation. Methodological Guidelines; Benito, G., Thorndycraft, V.R., Eds.; Centro de Ciencias Medioambientales: Madrid, Spain, 2004; pp. 29–42. [Google Scholar]
  102. Jones, P.D.; Jonsson, T.; Wheeler, D. Extension to the North Atlantic oscillation using early instrumental pressure observations from Gibraltar and south-west Iceland. Int. J. Climatol. 1997, 17, 1433–1450. [Google Scholar] [CrossRef]
  103. Osborn, T.J. Winter 2009/2010 temperatures and a record-breaking North Atlantic Oscillation index. Weather 2011, 66, 19–21. [Google Scholar] [CrossRef]
  104. Luterbacher, J.; Xoplaki, E.; Dietrich, D.; Jones, P.D.; Davies, T.D.; Portis, D.; Gonzalez-Rouco, J.F.; von Storch, H.; Gyalistras, D.; Casty, C.; et al. Extending North Atlantic Oscillation Reconstructions Back to 1500. Atmos. Sci. Lett. 2001, 2, 114–124. [Google Scholar] [CrossRef]
  105. NOAA. Available online: https://www.ncei.noaa.gov/access/monitoring/nao/ (accessed on 28 November 2024).
  106. SHOM. Available online: https://maree.shom.fr/ (accessed on 21 December 2024).
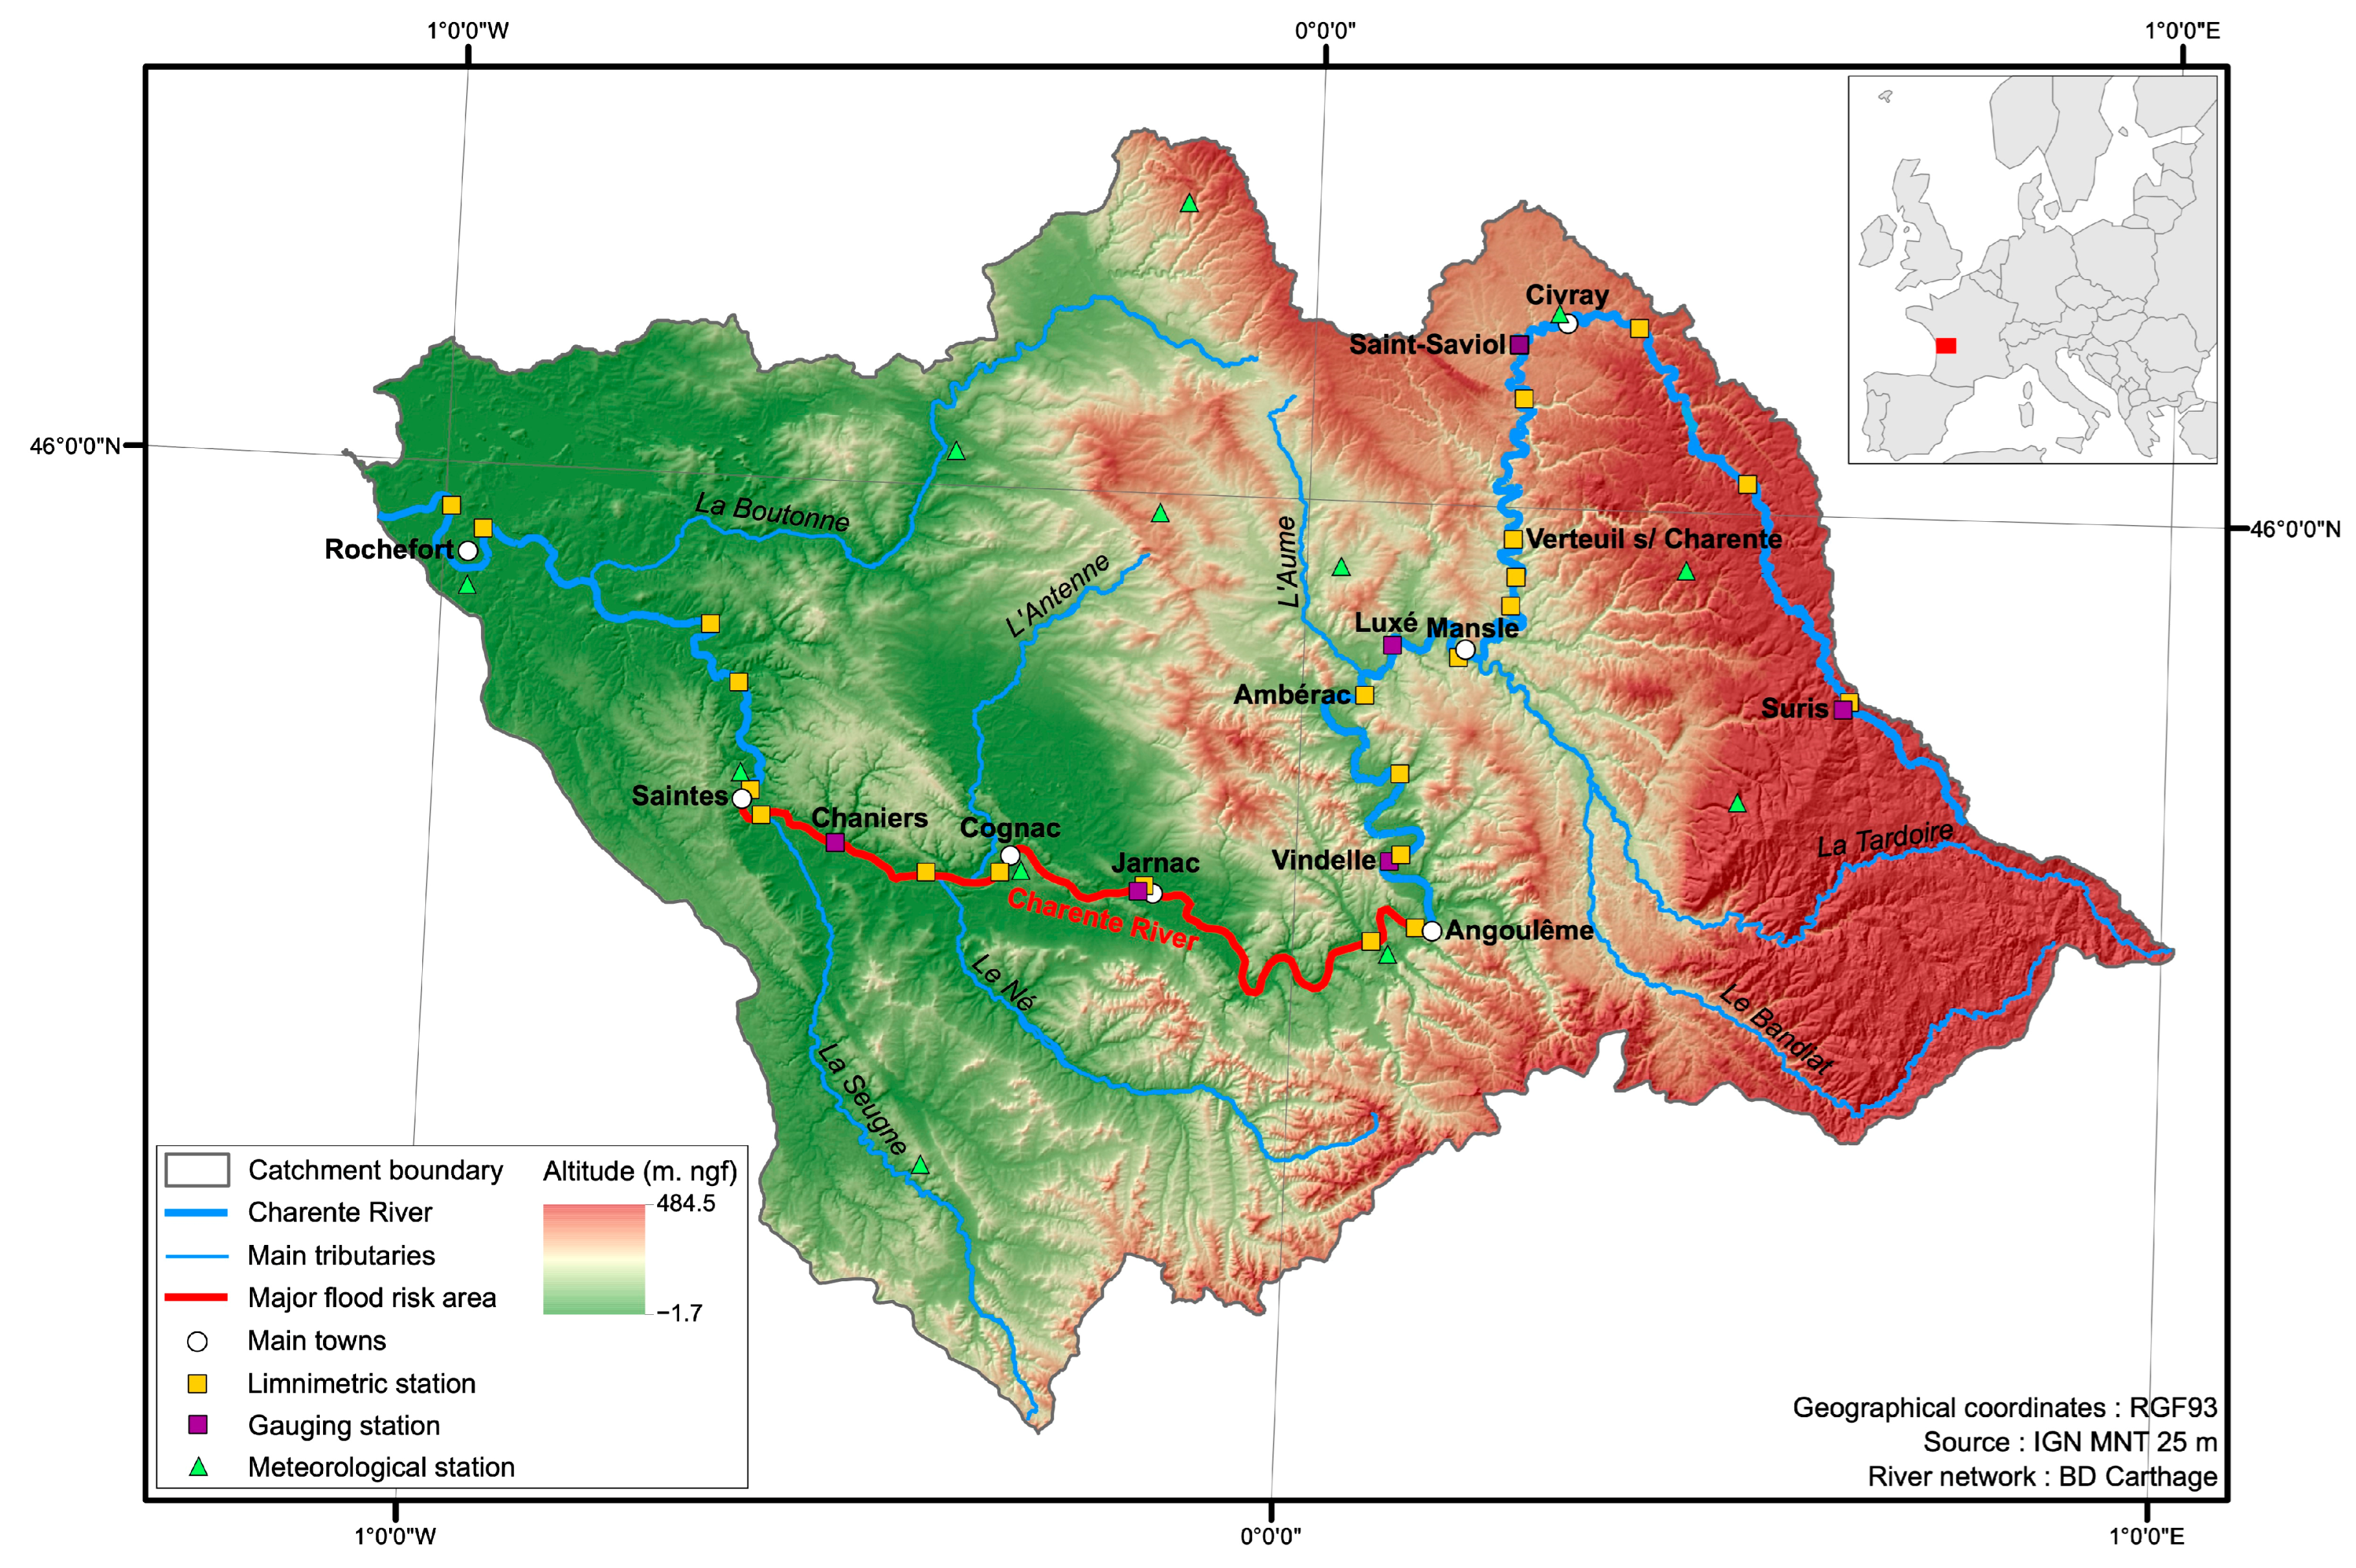
Figure 1. The Charente River catchment in France.
Geohazards 06 00003 g001
Figure 2. Hydrogram of the Charente River at the Chaniers gauging station on the calculated period 2004–2024 (from: HydroPortail [87]).
Geohazards 06 00003 g002
Figure 3. The February 2021 flood: (a) Flooding upstream of La Baine (Chaniers); (b) Flooding downstream of La Baine (Chaniers).
Geohazards 06 00003 g003
Figure 4. The 2023–2024 floods sequence limnigram on the Charente River at several limnimetric stations: (a) Mansle; (b) Angoulême; (c) Cognac; (d) Saintes (from: website e-crue [90]). Note that data in the Saintes gauging station are influenced by the tide at low water level.
Geohazards 06 00003 g004
Figure 5. Limnimetric scale and flood marks at the Palissy Bridge in Saintes.
Geohazards 06 00003 g005
Figure 6. Documentary record example: Report on the 1872–1873 floods by a Ponts-et-Chaussées engineer (from: Archives of the département de la Charente-Maritime, S6571).
Geohazards 06 00003 g006
Figure 7. Newspaper example about the Charente River. Article of the November 1859 flood from the Indépendant de la Charente-Inférieure of 5 November 1859 (from: website “retronews” [96]).
Geohazards 06 00003 g007
Figure 8. Postcards on the Charente River: (a) The February 1904 flood in Faubourg L’Houmeau at Angoulême (from: Archives of the Département de la Charente, 26 Fi 202); (b) The February 1904 flood in Quai des Frères at Saintes (from: Fonds Ancien et Régional des Médiathèques de Saintes, 3231 CP); (c) The 1907 flood in Rue du Gond at Angoulême (from: Archives of the Département de la Charente, 11 Fi15/281).
Geohazards 06 00003 g008
Figure 9. Number of floods per year (1 January to 31 December) in the Charente River between 1700 and 2024 (211 floods). Data completed from Duquesne et Carozza [75].
Geohazards 06 00003 g009
Figure 10. Number of grouped floods per winter period (October to April) by seasonality in the Charente River between 1700 and 2024. Only floods for which chronological data are available are shown (162 floods). Grouped floods sequences in bold are those studied in this paper.
Geohazards 06 00003 g010
Figure 11. Number of grouped floods per winter period (October to April) by intensity in the Charente River between 1700 and 2024. Only floods for which chronological data are available are shown (162 floods). Grouped floods sequences in bold are those studied in this paper.
Geohazards 06 00003 g011
Figure 12. Pressure fields over Europe during each storm between 24 October and 5 November 1859 in the early morning (6 a.m.). (a) 24–26 October 1859 storm; (b) 30 October–1 November 1859 storm; (c) 4–5 November 1859 storm. Pressure field maps based on version 3 of the 20th Century Reanalysis system supported by the NOAA, CIRES, and DOE [93] (from: Wetterzentrale [92]).
Geohazards 06 00003 g012
Figure 13. Pressure fields over Europe during each storm between 27 October and 16 November 2023 in the early morning (6 a.m.). (a) 27–30 October 2023 storm Céline; (b) 1–3 November 2023 storm Ciarán (c) 4–6 November 2023 storm Domingos; (d) 9–10 November 2023 storm Elisa; (e) 14–16 November 2023 storm Frederico. Pressure field maps based on version 3 of the 20th Century Reanalysis system supported by the NOAA, CIRES, and DOE [93] (from: Wetterzentrale [92]).
Geohazards 06 00003 g013
Figure 14. Rainfall sequence between 18 October and 18 November 2023 at the Saintes meteorological station (from: Météo-France [91]).
Geohazards 06 00003 g014
Figure 15. Chronicle of water levels at the upstream limnimetric scale of the Pont Palissy at Saintes. Floods with a water height of 6 m or more are considered extreme events in Saintes (in red on the figure).
Geohazards 06 00003 g015
Table 1. Water discharges at the main gauging stations on the Charente River (from: HydroPortail [87], TRI Angoulême-Saintes [88], and PPRI Saintes [89]).
Gauging
Station
SurisVindelleAngoulêmeJarnacChaniersSaintes
Surface (km2)1113722-466974127220
Mean annual discharge (m3·s−1)1430-6465-
2-year flood (m3·s−1)10188-215303320
5-year flood (m3·s−1)17289-273448450
10-year flood (m3·s−1)22356440310545535
20-year flood (m3·s−1)26420-343637620
50-year flood (m3·s−1)32503560--750
100-year flood (m3·s−1)--645--815
Calculation
Period
1991–20241977–2020-1990–20212004–2024-
Table 2. Current meteorological stations on the Charente watershed used in this study and located in Figure 1.
Meteorological StationLatitudeLongitudeAltitudeSystematic Measurements
Cognac45.665000−0.315833301946–2024
La Couronne45.6278330.099833581976–2024
Montemboeuf45.7871670.5430002471990–2024
Tusson45.9490000.062167881986–2024
Le Vieux Cérier45.9675000.4420001621990–2024
Nuaillé-sur-Boutonne46.019833−0.406667361933–2024
Saint-Germain-de-Lusignan45.458333−0.409667711969–2024
Saintes45.761167−0.652000381916–2024
Villiers-Couture45.987500−0.1520001061962–2024
Civray46.1603330.2986671431990–2024
Melle46.235000−0.1513331361989–2024
Table 3. Current hydrological stations on the Charente River consulted in this study and located in Figure 1.
Hydrological StationRiverLatitudeLongitudeSystematic Measurements
MansleCharente 45.877367320.179961012005–2024
AngoulêmeCharente45.653110300.153097851916−2024
CognacCharente45.68964247−0.339874271993−2024
SaintesCharente45.74707976−0.629727091875−2024
Disclaimer/Publisher’s Note: The statements, opinions and data contained in all publications are solely those of the individual author(s) and contributor(s) and not of MDPI and/or the editor(s). MDPI and/or the editor(s) disclaim responsibility for any injury to people or property resulting from any ideas, methods, instructions or products referred to in the content.