Article

At the Intersection of Flood Risk and Social Vulnerability: A Case Study of New Orleans, Louisiana, USA

1
Department of Geology & Geological Engineering, Colorado School of Mines, Golden, CO 80401, USA
2
Department of Civil and Environmental Engineering, College of Engineering and Computer Science, Syracuse University, Syracuse, NY 13244, USA
*
Author to whom correspondence should be addressed.
GeoHazards 2024, 5(3), 866-885; https://doi.org/10.3390/geohazards5030044
Submission received: 27 July 2024 / Revised: 29 August 2024 / Accepted: 30 August 2024 / Published: 2 September 2024

Abstract

:
Urban flooding is becoming more frequent and severe due to the impact of climate change, underscoring the urgent need for effective flood risk management. This study investigates the dynamics of flood risk through two decades, from 2000 to 2020, in New Orleans, United States—a city historically marked by catastrophic flooding events. This research also explores the spatial patterns of socially vulnerable neighborhoods at the census tract level and patterns that have changed over the two decades. The Modified Normalized Difference Water Index (MNDWI) was used to indirectly evaluate flood risks over time utilizing Landsat 5 and Landsat 8 satellite imagery and geospatial analyses. Thematic mapping and geospatial analysis were used to generate maps revealing neighborhoods at the intersection of high flood risk and social vulnerability in New Orleans. Integrating flood maps derived from satellite observations with Social Vulnerability Index (SVI) calculations provides a comprehensive view of flood dynamics in the context of social vulnerability in an urban setting. The final composite products provide insight into zones where past resilience-building and risk-reduction efforts have reduced vulnerability in New Orleans and identify zones requiring intervention. The findings demonstrate how integrated data-driven analysis can inform urban infrastructure and policy development, thereby promoting discussions on urban resilience and the nuanced understanding of interactions between urban settings and flood risks, potentially aiding in implementing adaptive strategies to build resilience in New Orleans.

1. Introduction

1.1. Background

Flooding is one of the costliest weather-related natural hazards, occurring worldwide and more frequently with increasing extreme weather events under climate change. A devasting flood can significantly impact low-income households, where fewer resources are available to prepare for and recover from flood hazards. Researchers [1,2,3,4,5] have recognized that flooding studies must go beyond just physical modeling or analyses of economic factors to thoroughly assess all ramifications of social vulnerability resulting in the design of more equitable flood risk mitigation strategies.
Social vulnerability assessment is gaining popularity globally with its incorporation into emerging disaster/hazard management studies [1,2]. This is further encouraged through the advocation of the Intergovernmental Panel on Climate Change, the United Nations, and the European Union to policymakers to develop just and equitable resilience strategies that include vulnerable groups [3,4]. As a result, emerging disaster reduction efforts consider social vulnerability a component in decision-making strategies to alleviate disaster risk. This is also the case for flood hazard and risk mitigation.
Flood risk and increasing exposure in urban areas is often driven by catchment hydrology and land use practices, as well as climate change [5]. Poor land use practices, such as converting wetlands [6] or floodplains to built-up areas, have resulted in socially vulnerable populations disproportionately inhabiting flood risk locations, which is common in most flood-prone locations globally. This study seeks to investigate the spatial distribution of communities at the intersection of high flood risk and social vulnerability over two decades, from 2000 to 2020, in New Orleans, USA. Historical flood events (e.g., Hurricane Katrina in 2005) in New Orleans revealed that socially disadvantaged populations tend to reside in the city’s low-lying areas, and flood impact is intensified on those populations due to their social vulnerability. In this research, we show that populations exposed to social vulnerability are characterized by lacking resources to prepare for, respond to, and recover from flood hazards. Hence, employing an integrated social vulnerability and flooding susceptibility approach could help better understand the current state of social vulnerability in the context of urban flood hazards in New Orleans and provide insights to policymakers for comprehensive risk assessments and management, as well as more effective distribution of resources during recovery from flood hazards.

1.2. Study Site—The City of New Orleans

New Orleans, a port city along the Mississippi River in southeastern Louisiana State near the Gulf of Mexico, is defined by its complex relationship with water. This unique position significantly influences flood risk within the area. Due to its location near the mouth of the Mississippi River Delta and proximity to the Gulf of Mexico (Figure 1), New Orleans has long been recognized as having a severe risk of riverine and coastal flooding that requires continuous attention [7]. Historical flood events (e.g., Hurricane Katrina in 2005) revealed that socially disadvantaged populations tend to reside in the city’s low-lying areas, and flood impact is intensified on those populations due to their social vulnerability, i.e., the limited capacity to anticipate, cope with, resist, and recover from the impact of a natural hazard.
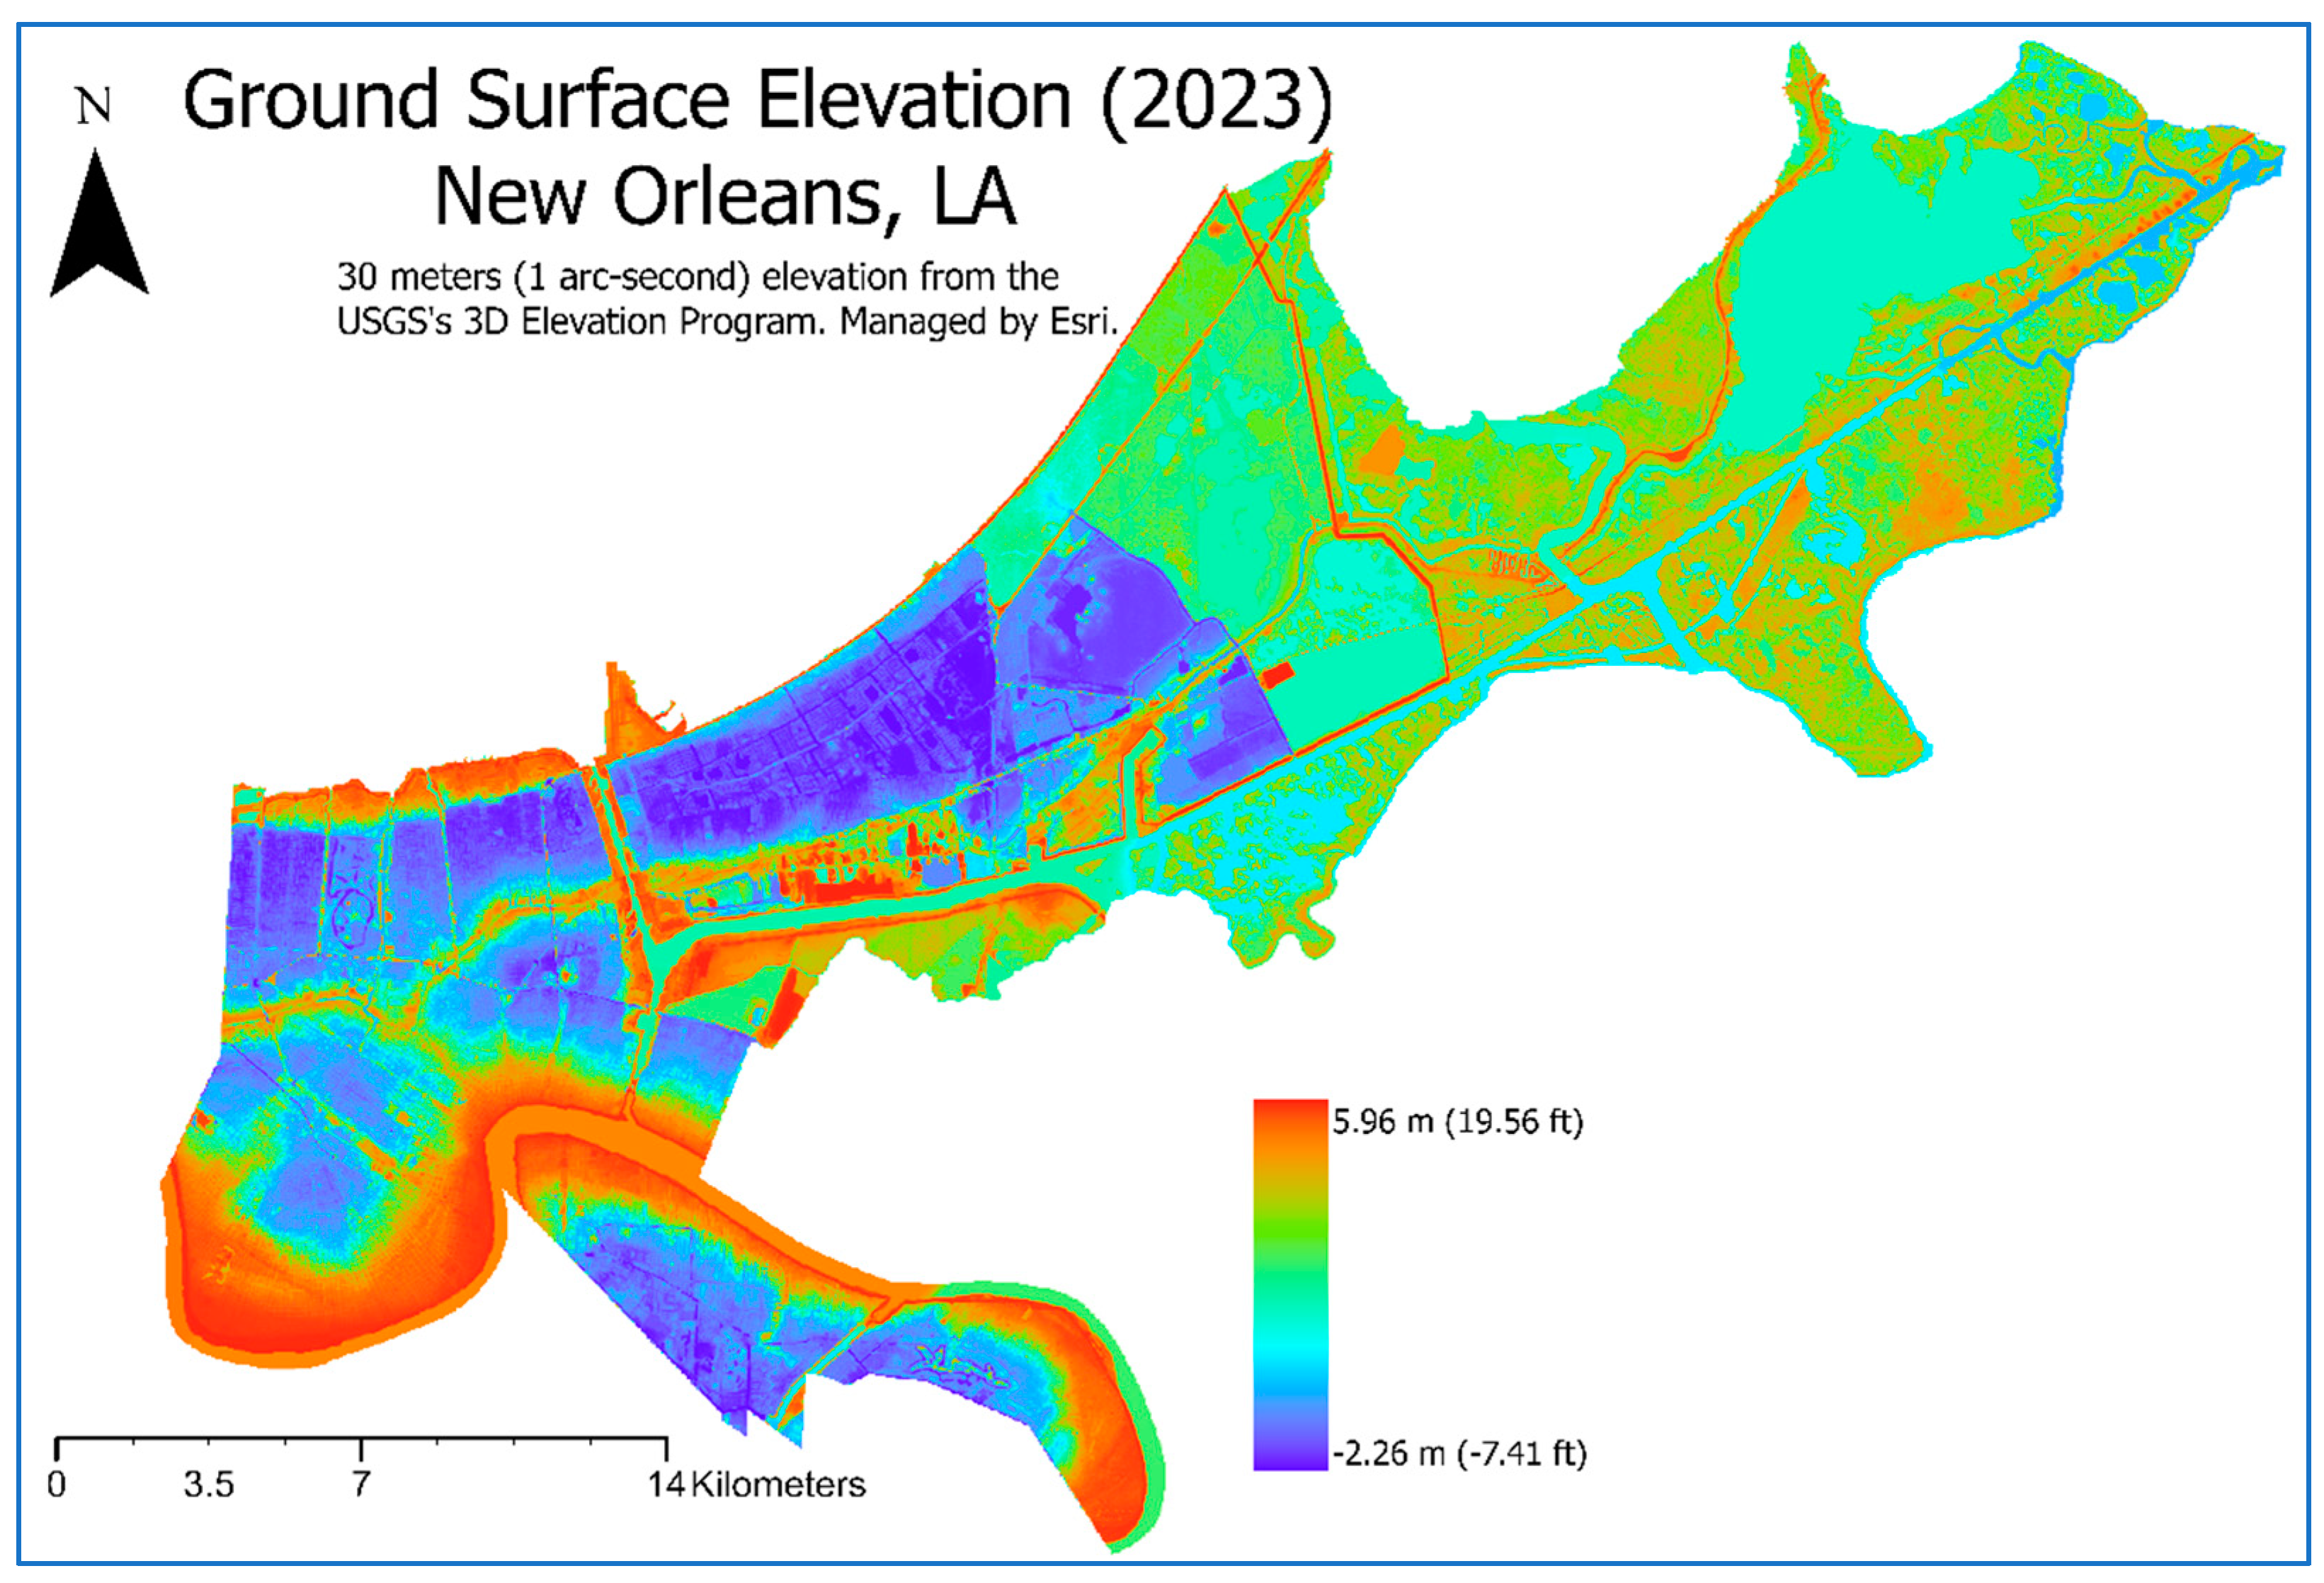
Natural flooding patterns have been permanently altered since the onset of the city’s development, as the construction of levees and pumping stations has redirected the flow of surface water [8]. New Orleans experiences the highest subsidence rates in south Louisiana [9], compounding the city’s low elevation (Figure 2) and further exacerbating its susceptibility to flooding [10].
New Orleans has a subtropical climate with hot, humid summers and mild winters. As one of the rainiest cities in the U.S., it receives an average of 1623 mm (64 inches) of annual precipitation [11], with the fall months being the driest (84 mm/3.3 inches) and the summer months being the wettest (188 mm/7.4 inches) [12]. The city’s geographical location subjects it to moist tropical air from the Gulf of Mexico, intensifying the frequency and magnitude of rain events [13]. Seasonal temperatures fluctuate from a cool 7 °C (55 °F) in January to 33 °C (92 °F) in July [12]. New Orleans experiences just 8.1 days of winter, defined by daytime highs that do not exceed 10 °C (50 °F) and nighttime lows that drop to 7 °C (45 °F), while hot days exceeding 32 °C (90 °F) occur 77 times yearly [14].

1.3. Geomorphology and Geology of New Orleans

New Orleans’ geomorphology is characterized by natural fluvial processes and human interventions that have shaped the city’s susceptibility to flooding. The deltaic plains underlying the city consist primarily of Holocene-aged soils deposited by the Mississippi River [15,16,17,18,19]. Over time, these sediment accumulations created a network of natural levees with foundations of inland swamps and marsh soils (Figure 3) that served as sites for early settlement and development [7]. In order to meet the urban expansion requirements due to population growth, the surface topography has been impacted by the reclamation of low-lying areas and the draining of swamps [15].
Subsidence is a characteristic trait of the geology of New Orleans. While natural soil compaction processes have contributed to this phenomenon, rapid urbanization has also greatly intensified the effects of subsidence on the area’s landscape [21]. The subsidence rates in New Orleans, particularly in the eastern region, are the highest in south Louisiana [22]. The draining of wetlands, the extraction of natural resources, and the disruption of sedimentation processes have encouraged this sinking process, further compounding the flood risk [10].

1.4. Legislation Aimed at Reducing Flood Risk

In 1965, the U.S. Army Corps of Engineers (USACE) was authorized through the Flood Control Act to reinforce the flood management structures in New Orleans (Public Law 89-298, 1965) following “Billion Dollar Betsy”—a massive hurricane that caused extensive damage [23]. This legislation provided federal funding to enhance flood control by improving existing infrastructure and building levees and floodwalls to mitigate risks in highly flood-prone and densely populated areas.
However, in 2005, Hurricane Katrina hit, causing widespread devastation and revealing the limitations of some of these flood management structures. The American Society of Civil Engineers Hurricane Katrina External Review Panel [24] determined that catastrophic levels of flooding and over $100 billion in property damage were primarily due to the failure of engineered levees and floodwalls. In response, the USACE proposed the Hurricane and Storm Damage Risk Reduction System (HSDRRS) to thoroughly reform the design standards that led to the infrastructure failure [25].
The devastation caused by Hurricane Katrina in 2005 highlighted historical systemic inequalities [16], with disadvantaged populations disproportionately enduring the worst of this disaster [17]. These populations often resided in the lowest-lying areas of the city, facing immediate consequences of flooding and long-term reconstruction challenges. The Federal Emergency Management Agency (FEMA) funds the City of New Orleans Structure Elevation Project through its Region VI Louisiana Recovery Office. This $10.65 million mitigation effort aims to reduce flood susceptibility in the city’s highest-risk zones by elevating existing residential structures and stabilizing the underlying ground surface to prevent subsidence [26].

1.5. Scope of Research

Flood risks are further escalated by the disparity in levels of social vulnerability across different neighborhoods [27]. The existing literature provides foundational knowledge on urban flood dynamics [6,7,8,9,10,28,29,30,31,32,33,34] and social vulnerability [1,2,3,4,5,28,34,35,36,37], emphasizing holistic urban planning strategies to support the city’s resilience against flooding.
This study intends to inform policymaking and urban planning to promote equitable and resilient development. Key objectives include evaluating spatial and temporal variations in flood risk throughout the city, analyzing the distribution of social vulnerability across census tracts, and exploring the connection between flood risk and social vulnerability to understand the city’s comprehensive flood risk profile.
This work hypothesizes that a combination of urban development patterns and the effectiveness of flood defense infrastructure influences the evolution of flood risk in New Orleans. Furthermore, neighborhoods with higher concentrations of economically challenged and racial/ethnic minority households may exhibit greater social vulnerability and flooding risks, particularly in areas with substandard housing and historical segregation patterns.

2. Methods

Locating neighborhoods at the intersection of high flooding risks and high social vulnerability is a geospatial problem. Geospatial analyses were conducted over different timeframes to understand the dynamics of the problem. The two factors, flooding and the Social Vulnerability Index (SVI), examined in this study were first analyzed individually, and risk maps were produced for each factor at each time frame. SVI is measured by an overall score based on 16 factors related to (1) socioeconomic status, (2) household characteristics and disability, (3) racial and ethnic minority status, and (4) housing type and transportation means. The U.S. Census has collected those factors regularly. Populations exposed to social vulnerability are characterized by lacking resources to prepare for, respond to, and recover from natural disasters such as flood hazards. These risk maps were then synthesized into overall risk maps for neighborhoods at the census tract level. Census tracts are small statistical subdivisions of a county that locals can update for each decennial census in the United States. There are 181 census tracts within the study area.

2.1. Data Acquisition

This Geographic Information System (GIS)-based research focuses on New Orleans, Louisiana, examining the links between flooding dynamics and social vulnerability using geospatial datasets, satellite imagery, and socioeconomic data. The various data types used to investigate the intersection of land use change, flooding, and social vulnerability in New Orleans and their respective sources are outlined in Table 1.

2.2. Flood Risk Assessment

Landsat 5 and Landsat 8 satellite data were obtained from the United States Geological Survey (USGS) Earth Explorer portal and processed using ArcGIS Pro 3.2.2 by ESRI in Redlands, California, USA. The datasets contain files for individual bands—each of which corresponds to a specific wavelength of visible or infrared light. The Landsat scenes were selected based on two parameters: cloud cover below 15% and similar date ranges (Table 2).
The lack of publicly available consistent flood hazard maps through time for New Orleans prompted the need to identify an alternative method for potential flood risk mapping. Although the Modified Normalized Difference Water Index (MNDWI) is not a direct measure of flooding potential, it is a suitable factor in monitoring changes related to water content in water bodies. When combined with the consideration of elevation (e.g., areas below sea level) and the proximity to water bodies (e.g., areas within a 100 m perimeter around all identified water bodies), the MNDWI can serve as a consistent indirect indication of flood potential/risk for New Orleans over two decades, since the focus of this study is to assess the change flood risk over the two decades, from 2000 to 2020. The MNDWI uses the ‘Green’ band and the Shortwave Infrared 1 (‘SWIR1’) band (Equation (1)). The ‘Green’ band wavelength ranges from 0.52 to 0.60 µm for Landsat 5 and from 0.53 to 0.59 µm for Landsat 8, while the ‘SWIR1’ band includes wavelengths from 1.55 to 1.75 µm for Landsat 5 and from 1.57 to 1.65 µm for Landsat 8.
M N D W I = ( G r e e n S W I R 1 ) ( G r e e n + S W I R 1 )
where Green and SWIR1 are the spectral reflectance measurements acquired in the Green (visible) and shortwave infrared regions of the electromagnetic spectrum, respectively.
The Jenks Natural Breaks (Jenks) classification method was used to separate calculated MNDWI values into distinct classes. The Jenks method was chosen because it reduces variance within classes and maximizes the variance between classes. This classification initially resulted in six initial categories, the first three of which were assigned predefined risk levels: ‘Negligible’ (Level 1), ‘Minor’ (Level 2), and ‘Significant’ (Level 3). The remaining categories underwent further spatial analysis to extract areas that are both near waterways and below sea level to classify them as the most critical level of risk—‘Severe’ (Level 5)—with the rest falling into the ‘Major’ (Level 4) risk class.
Each census tract was assigned a flood risk level based on the predominant risk level of the MNDWI values that fell within its boundaries. Specifically, the median, or the middle number of an array, was used to represent the central tendency of the MNDWI risk level for each census tract polygon, ensuring that the assigned risk level is resistant to outliers and a good representation of the flood risk within the tract’s geographical area.

2.3. Social Vulnerability Analysis

The Social Vulnerability Index (SVI) developed by the Centers for Disease Control and Prevention (CDC) combines socioeconomic and demographic data into a comprehensive score that reflects community resilience to environmental hazards (Agency for Toxic Substances and Disease Registry (ATSDR), 2022; Table 3). This analysis utilized SVI datasets from 2000, 2010, 2016, and 2020 at the census tract level, sourced from the CDC’s Geospatial Research, Analysis, and Services Program (GRASP) [38].
SVI scores are defined by a percentile ranking system, where values closer to 0 indicate lower levels of social vulnerability and values closer to 1 indicate higher social vulnerability [38,39]. This study analyzes each theme’s score alongside the overall SVI score to examine the specific factors that strongly influence vulnerability across different parts of New Orleans.
Values of −999 represent census tracts with either an unknown or zero population [38] and were not considered in the analysis. The minimum–maximum normalization equation (Equation (2)) facilitated comparative analysis between study years, resulting in SVI values scaled between 0 and 1 [38].
N o r m a l i z e d   S V I = X X m i n X m a x X m i n
where X is the original value, Xmin is the minimum value in the series, and Xmax is the maximum value. The equal interval categorization method provided a standardized approach for splitting the continuous SVI values into five discrete classes. Figure 4 illustrates the workflow of the SVI calculation.
In addition, Moran’s I statistic was applied to discern the presence and nature of spatial autocorrelation within the SVI datasets. This global statistic simultaneously measures spatial autocorrelation based on feature locations and feature values [39,40]. Global Moran’s I provides a single-summary measure of spatial autocorrelation, offering an overview of the pattern expressed by SVI data. A positive value indicates a clustered pattern, where high or low values of SVI are found near each other more than expected if underlying spatial processes were random. Conversely, a negative Moran’s I value suggests a dispersed pattern, where high values are likely to be found near low values. Moran’s I statistic was applied to determine whether the SVI data are randomly distributed, clustered, or dispersed across the study area [39,40,41,42,43]. Localized spatial clusters and outliers were identified using Moran’s I statistic, which pinpoint locations where hot or cold spots are statistically significant.
A hot spot analysis (Getis-Ord-Gi*), using a G statistic also known as the likelihood ratio test, detects statistically significant clusters of high values (hot spots) and low values (cold spots) in geospatial data [42,43]. Areas of pronounced vulnerability (i.e., hot spots) are highlighted. Statistically significant spatial patterns can be identified by applying the Hot Spot Analysis tool in ArcGIS to the SVI data over the two decades. The analysis reveals significant hot and cold spots in New Orleans, illustrating the distribution and intensity of underlying socioeconomic characteristics.

2.4. Composite Risk Mapping

The flooding risk and SVI maps were produced for multiple time frames: 2000, 2010, 2016, and 2020. As the literature demonstrates, many methods (e.g., weighted overlay, logistical regression, and methods based on physically informed equations using the raster calculator) can combine various factors in solving geospatial problems, such as flooding risk and landslide hazard assessments (e.g., [44,45,46]).
This study employs an equal-weight overlay approach to synthesize the MNDWI-derived flood risk assessments and social vulnerability analyses. The result is a composite risk profile that was subsequently classified into a risk matrix to compare the likelihood of various flood scenarios against their potential impacts. It offers a quantitative and visual representation of the risk levels faced in different parts of New Orleans.

3. Results

3.1. Flood Risk Assessment

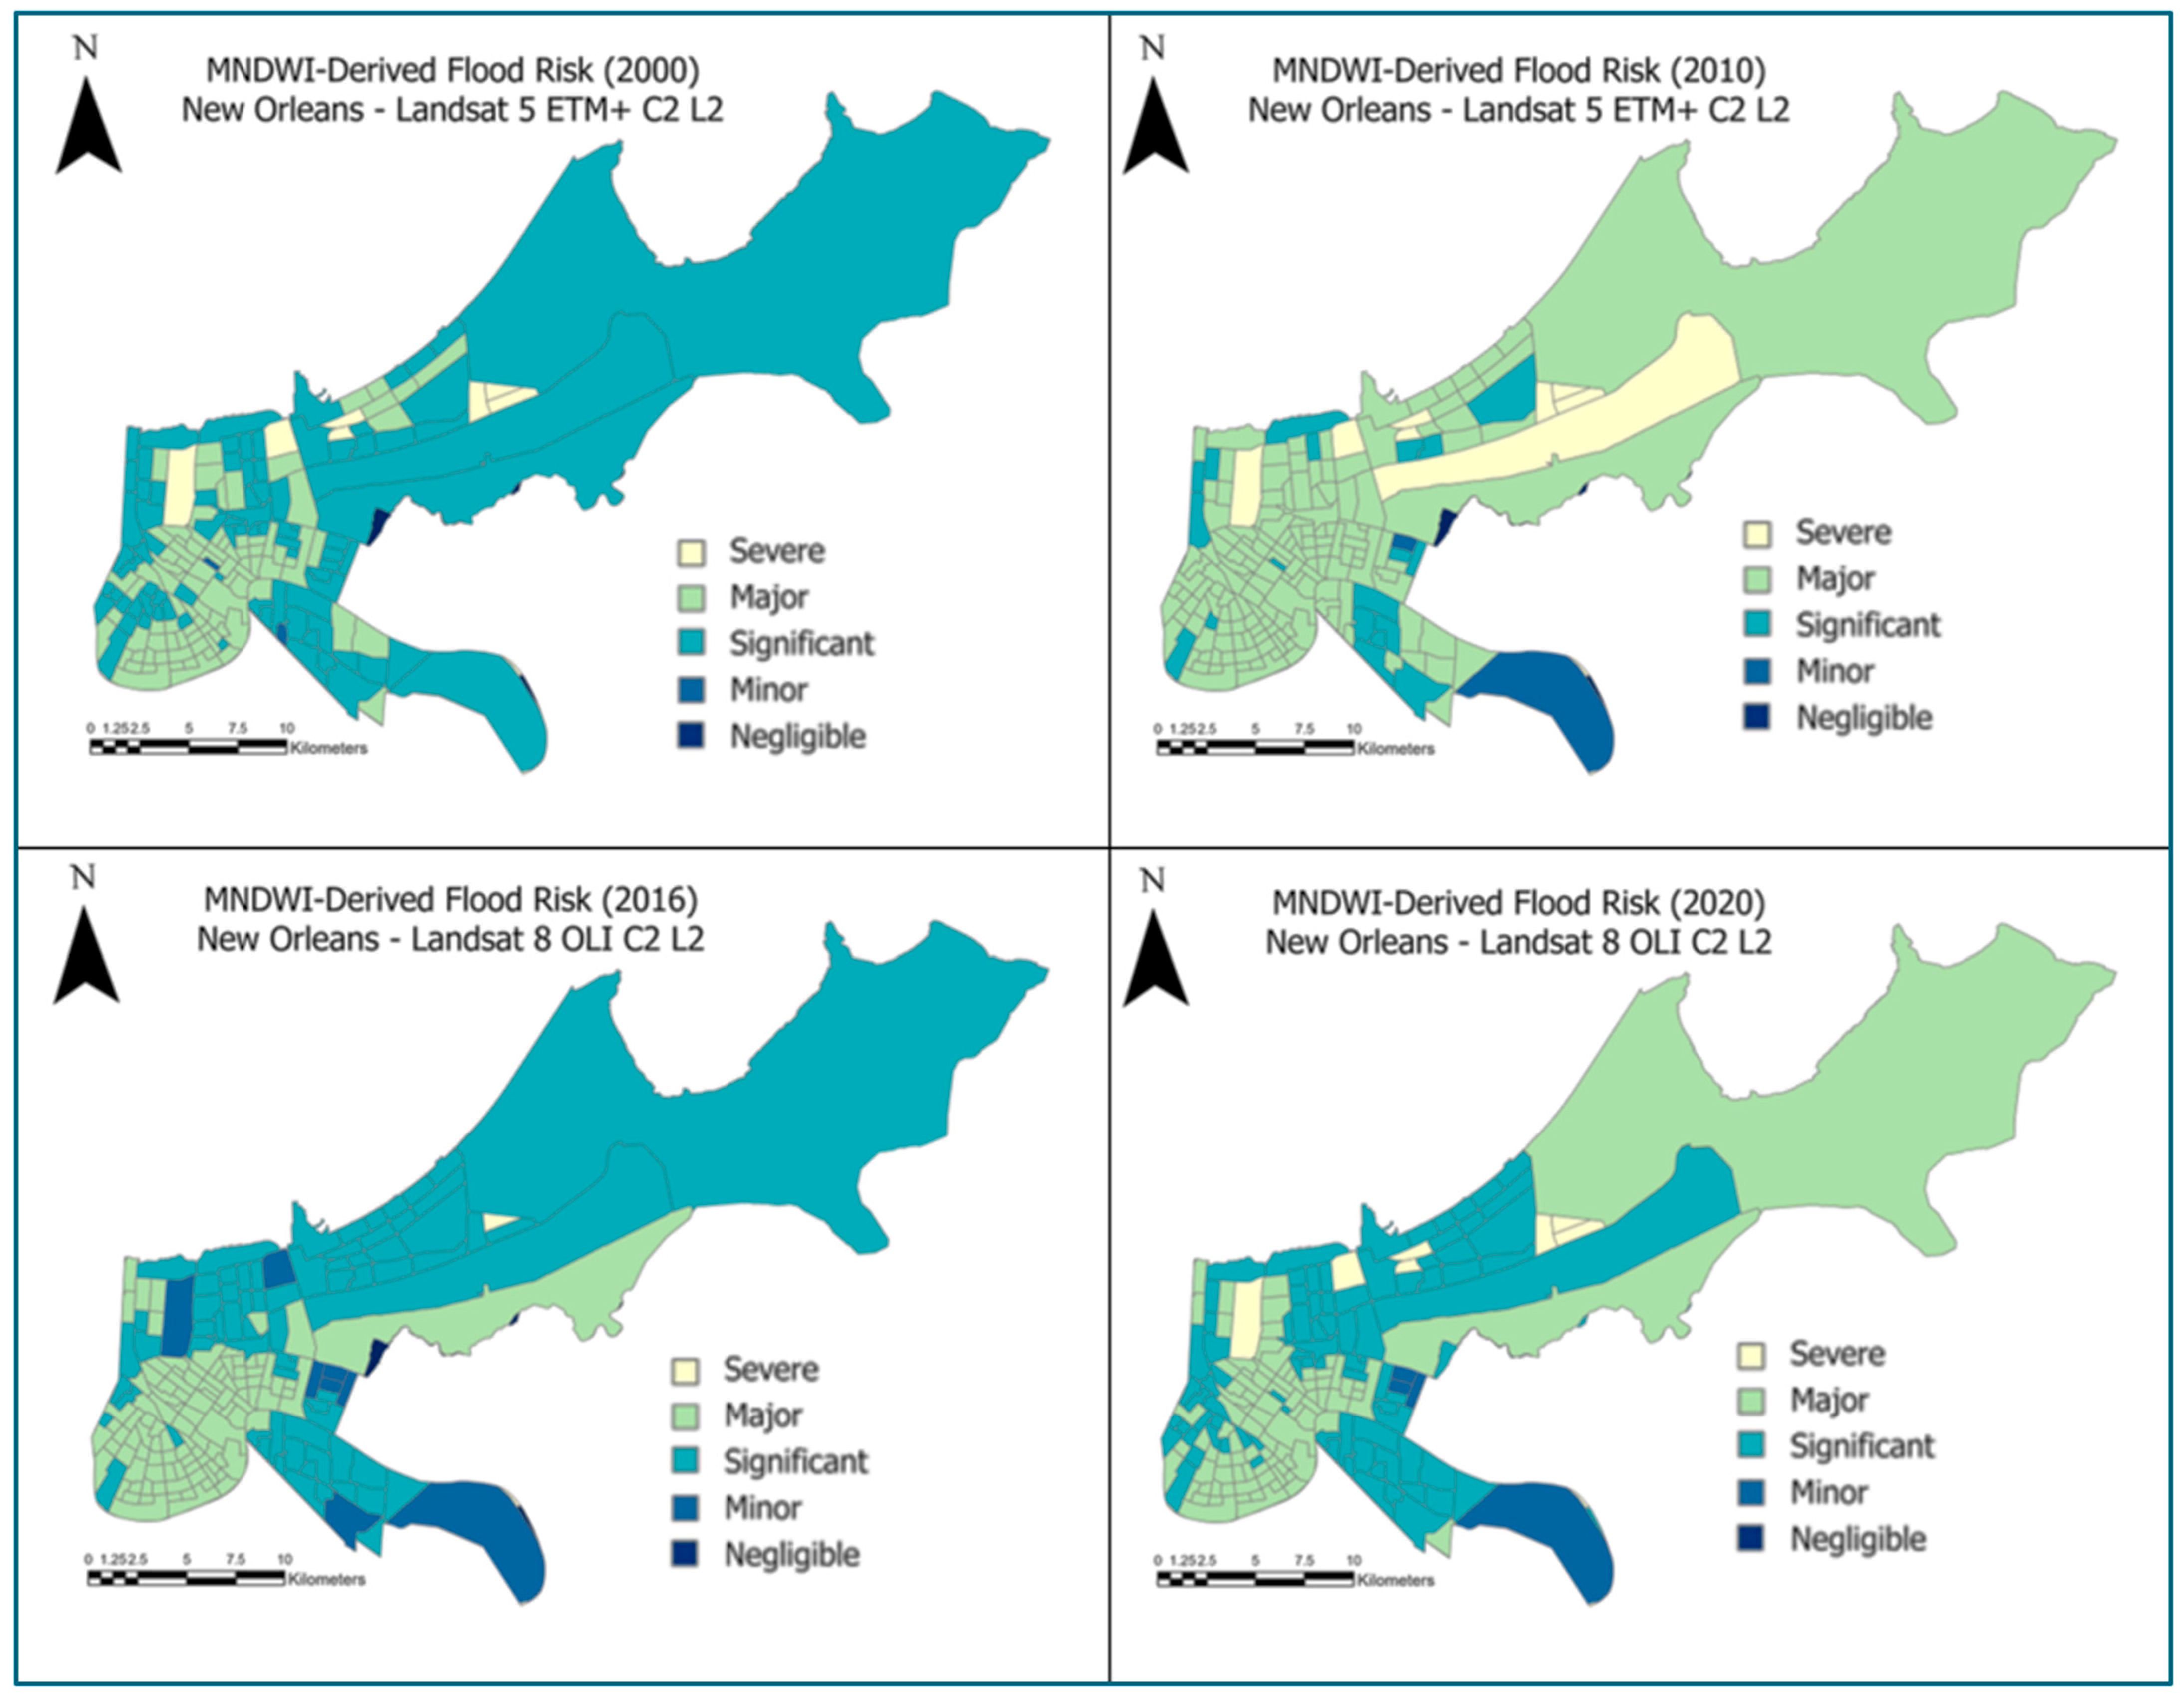
The results of the spatial–temporal analysis of flood risk in the study area are represented in a series of maps produced based on the MNDWI for years 2000, 2010, 2016, and 2020. This set of risk maps, structuring risk levels in five distinct classes—‘Negligible’, ‘Minor’, ‘Significant’, ‘Major’, and ‘Severe’—offers critical information on the city’s vulnerability to floods. Figure 5 shows the flood risk map within New Orleans for the years 2000, 2010, 2016, and 2020.
The MNDWI-derived risk map of the year 2000 shows that New Orleans was primarily classified at the ‘Significant’ risk level. The tracts in the low-elevation zones of the city’s core and along Lake Pontchartrain to the north were predominantly ranked as ‘Major’ risk, with a small number of ‘Severe’ tracts dispersed throughout the upper half of the city. Very few tracts were classified as ‘Negligible’ or ‘Minor’, pointing to the inherent vulnerabilities in the flood defenses that would be exposed by Hurricane Katrina five years later. Each successive version of this map provides an assessment of the post-Katrina flood risk landscape.
The flood risk map of the year 2010 shows a significant jump in flood risk levels over the year 2000 pre-Katrina assessment. Most of the city was now registered as a ‘Major’ risk, reflecting the ongoing effects of widespread flooding following the storm. The ‘Severe’ category saw a slight increase toward the eastern tracts, with no change in the ‘Negligible’ risk category. Conversely, there was a notable reduction in the ‘Significant’ risk class toward the city’s outskirts. The southernmost census tract improved from ‘Significant’ to ‘Minor’, illustrating the role that ground surface elevation plays in flood risk mitigation.
The flood risk profile of New Orleans had changed markedly by 2016. Census tracts at the ‘Major’ risk level were reduced to the southern half of the city, while the northern half improved to a ‘Significant’-level status. Improvements were recorded for all but two of the previously ‘Severe’ census tracts—one in the northeast region and another near the southernmost extent of the city. The ‘Minor’ risk class increased at this time, with isolated tracts dispersed throughout the study area. This overall decrease in high-risk rankings may indicate some success in long-term flood management or perhaps greater resilience to changes in precipitation.
The 2020 map shows distinct changes in flood risk across the city. While the number of census tracts in the ‘Severe’ class increased since 2016, this mirrors the distribution of this category in the year 2000 pre-Katrina landscape. Tracts at the ‘Major’ risk level spread into the northeast, with a subsequent reduction in the number of ‘Significant’ tracts. ‘Negligible’ and ‘Minor’ zones also shrunk, with the tract at the southernmost edge maintaining relatively low vulnerability.
This series of MNDWI-derived risk maps indirectly provides a comprehensive view of the changes in flood risks in New Orleans over twenty years. The analysis reveals a pattern of fluctuating risk levels, with most areas consistently facing heightened dangers and others benefitting from practical prevention efforts. These maps can serve as a critical tool in the ongoing effort to protect New Orleans against future flooding threats.

3.2. Social Vulnerability Analysis

Social vulnerability analyses included two steps: a spatial autocorrelation analysis using the Global Moran’s I and SVI risk or intensity analysis.

3.2.1. Global Moran’s I Cluster Analysis

The spatial autocorrelation of SVI scores was tested using the Global Moran’s I statistic, an inferential statistical analysis. Global Moran’s I statistic results are interpreted within the context of its null hypothesis, assuming that the analyzed SVI is randomly distributed within the study area. This statistic tests whether the spatial autocorrelation of social vulnerability rejects the null hypothesis based on the value of the Moran’s Index (MI), Z-score, and p-value (Table 4).
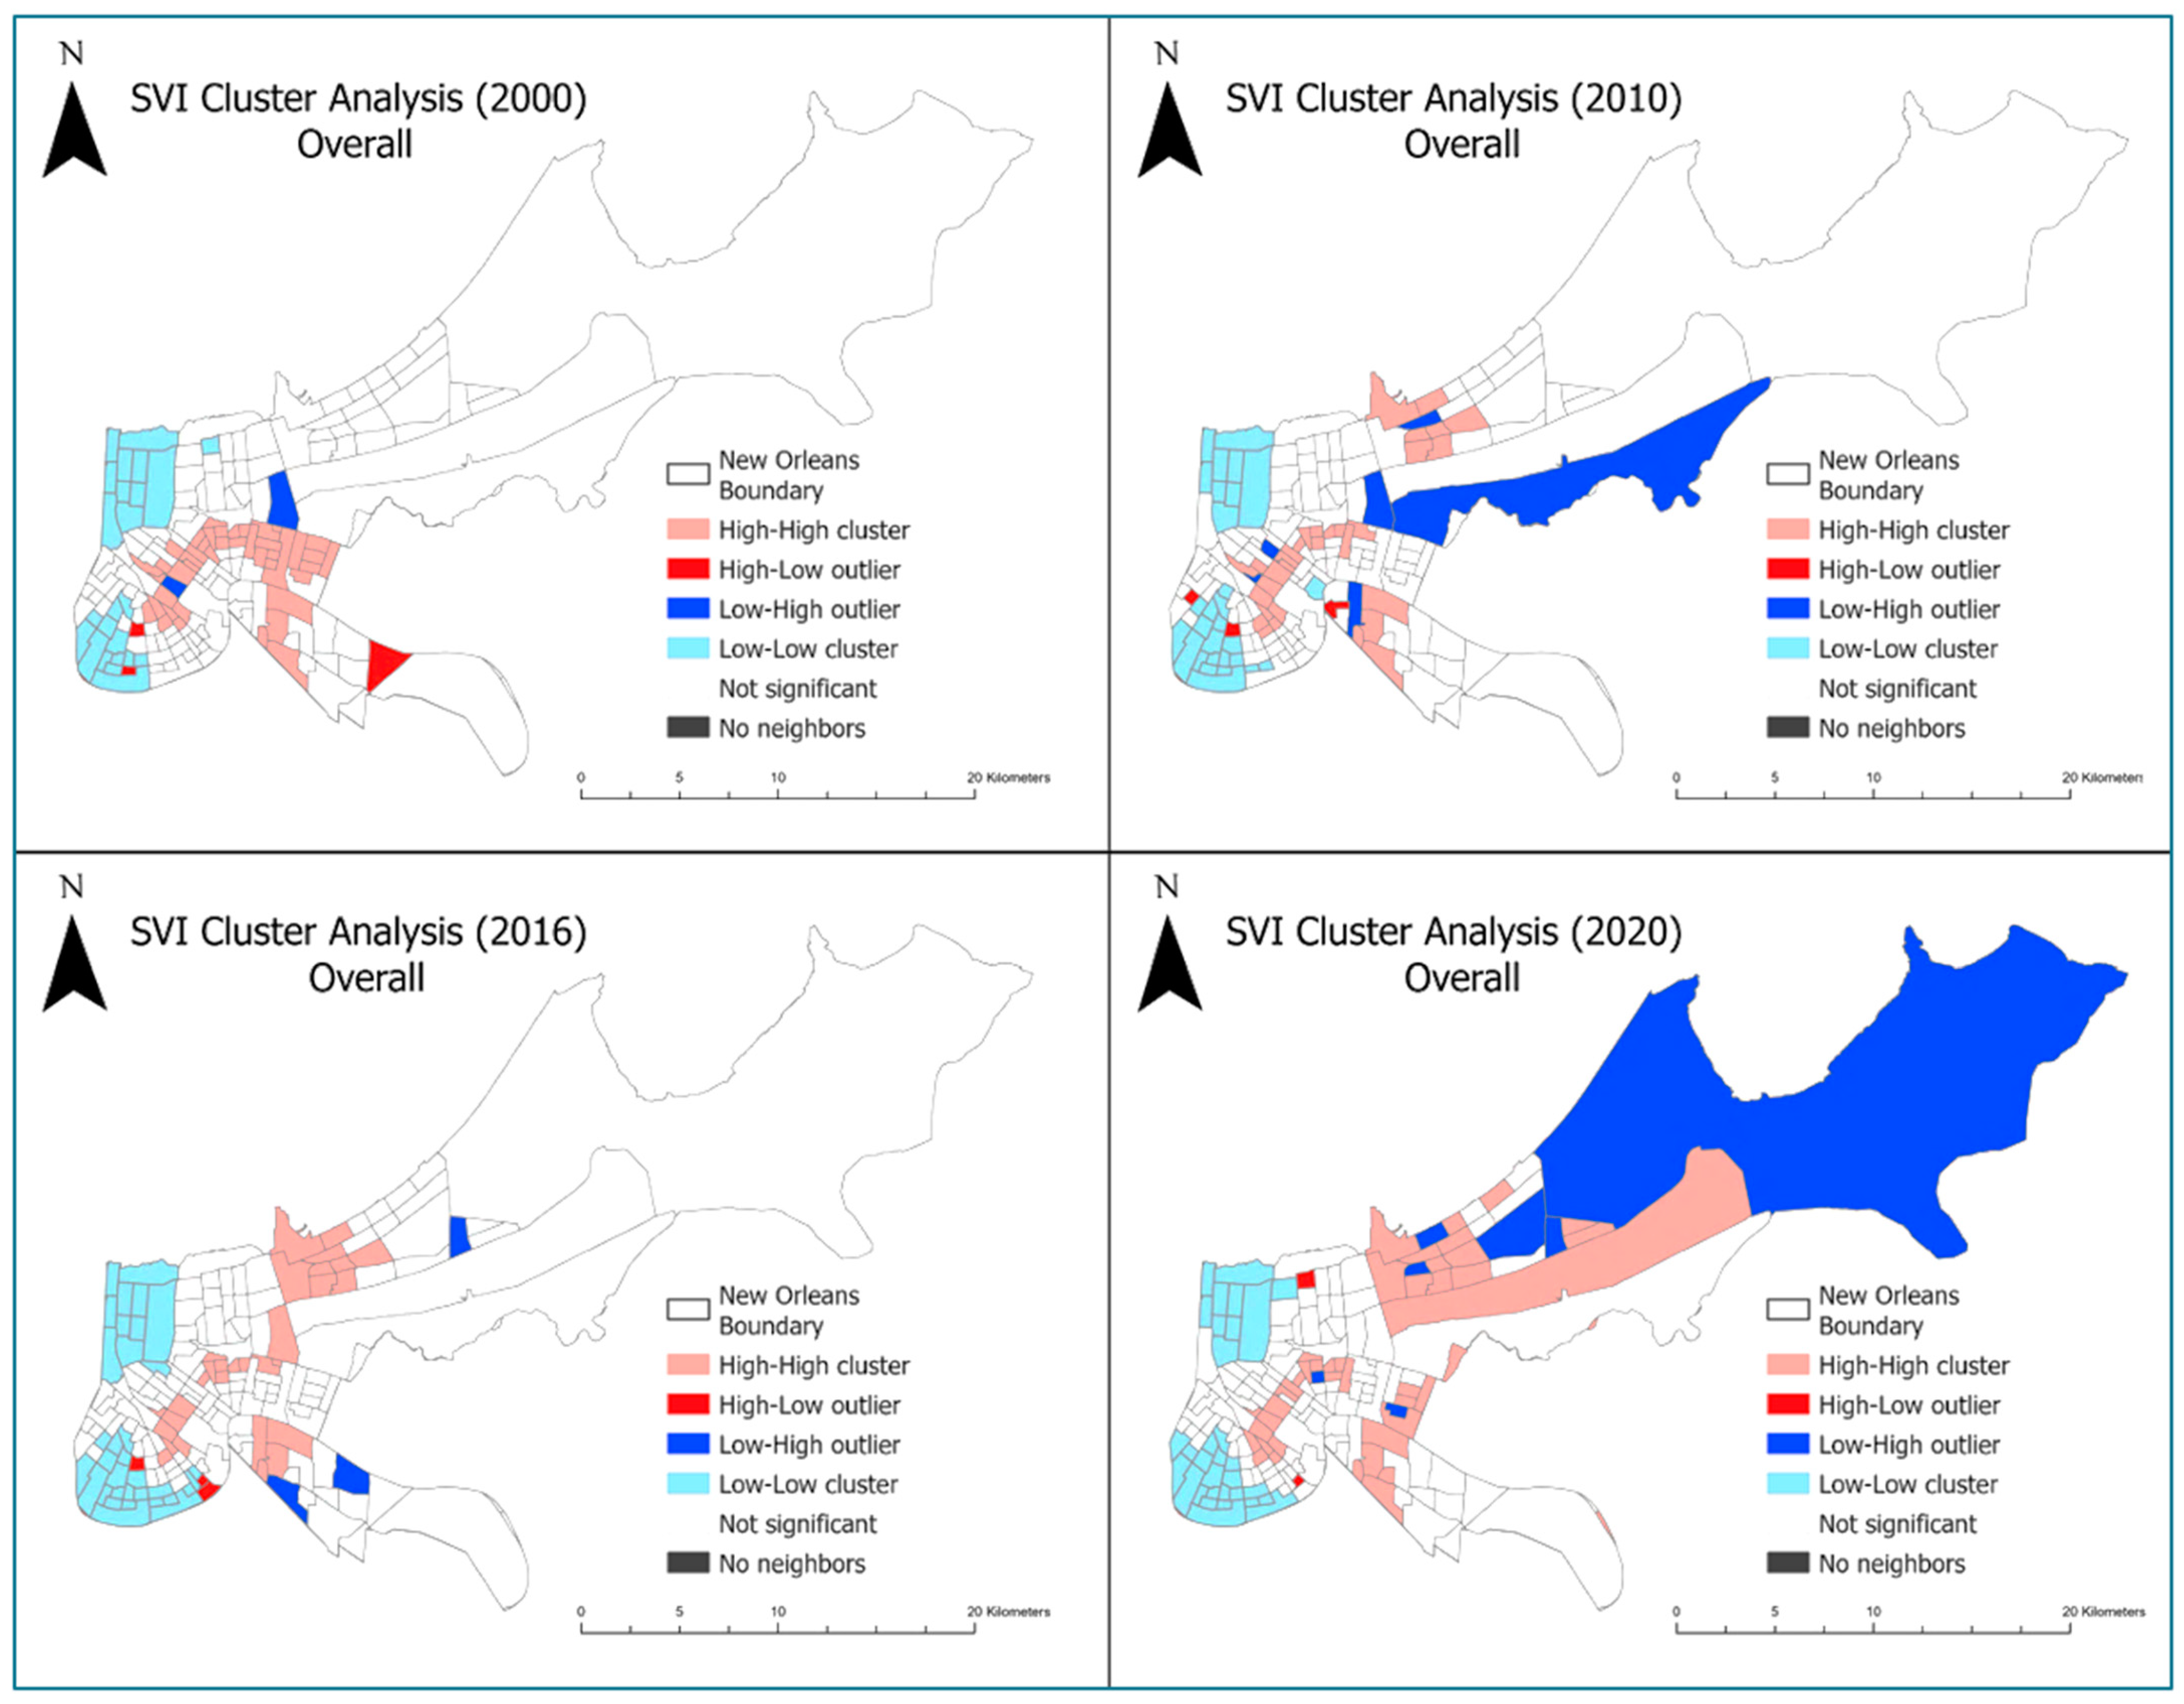
The analysis of Moran’s I for the Overall Theme shows the cumulative spatial autocorrelation across all themes over the studied time intervals (Figure 6).
The 2000 SVI cluster analysis map highlights social vulnerability patterns in New Orleans. With a Moran’s Index of 0.411032, Z-score of 1.058585, and p-value of 0.160780, spatial clustering is weak. High–high clusters dominate the south–central areas, indicating higher vulnerability, while low–low clusters in the west suggest better conditions. Scattered high–low and low–high outliers point to mixed conditions in specific tracts. The 2010 map reveals shifting social vulnerability clusters. A Moran’s Index of 0.323068, Z-score of 0.821797, and a p-value of 0.169317 reflect weak spatial autocorrelation. Central high–high clusters disperse, while the low–low clusters persist.
The 2016 Moran’s Index is 0.460140, the Z-score is 1.180311, and the p-value is 0.133454. High-high clusters remain in the central zones with the low-low clusters persisting in the west. By 2020, a Moran’s Index of 0.467426, Z-score of 1.223517, and p-value of 0.119863 indicate weak but increasing spatial autocorrelation. High-high clusters expanded to the east, with the easternmost tract representing a low-high outlier.
The progression of spatial autocorrelation from 2000 to 2020 In the Overall Theme shows notable consistency and intensification of clustering based on various systemic factors. This suggests that these factors are increasingly concentrated, highlighting areas of concern that should be targeted for risk reduction and resilience-building.

3.2.2. Hot Spot Analysis (Getis-Ord-Gi*)

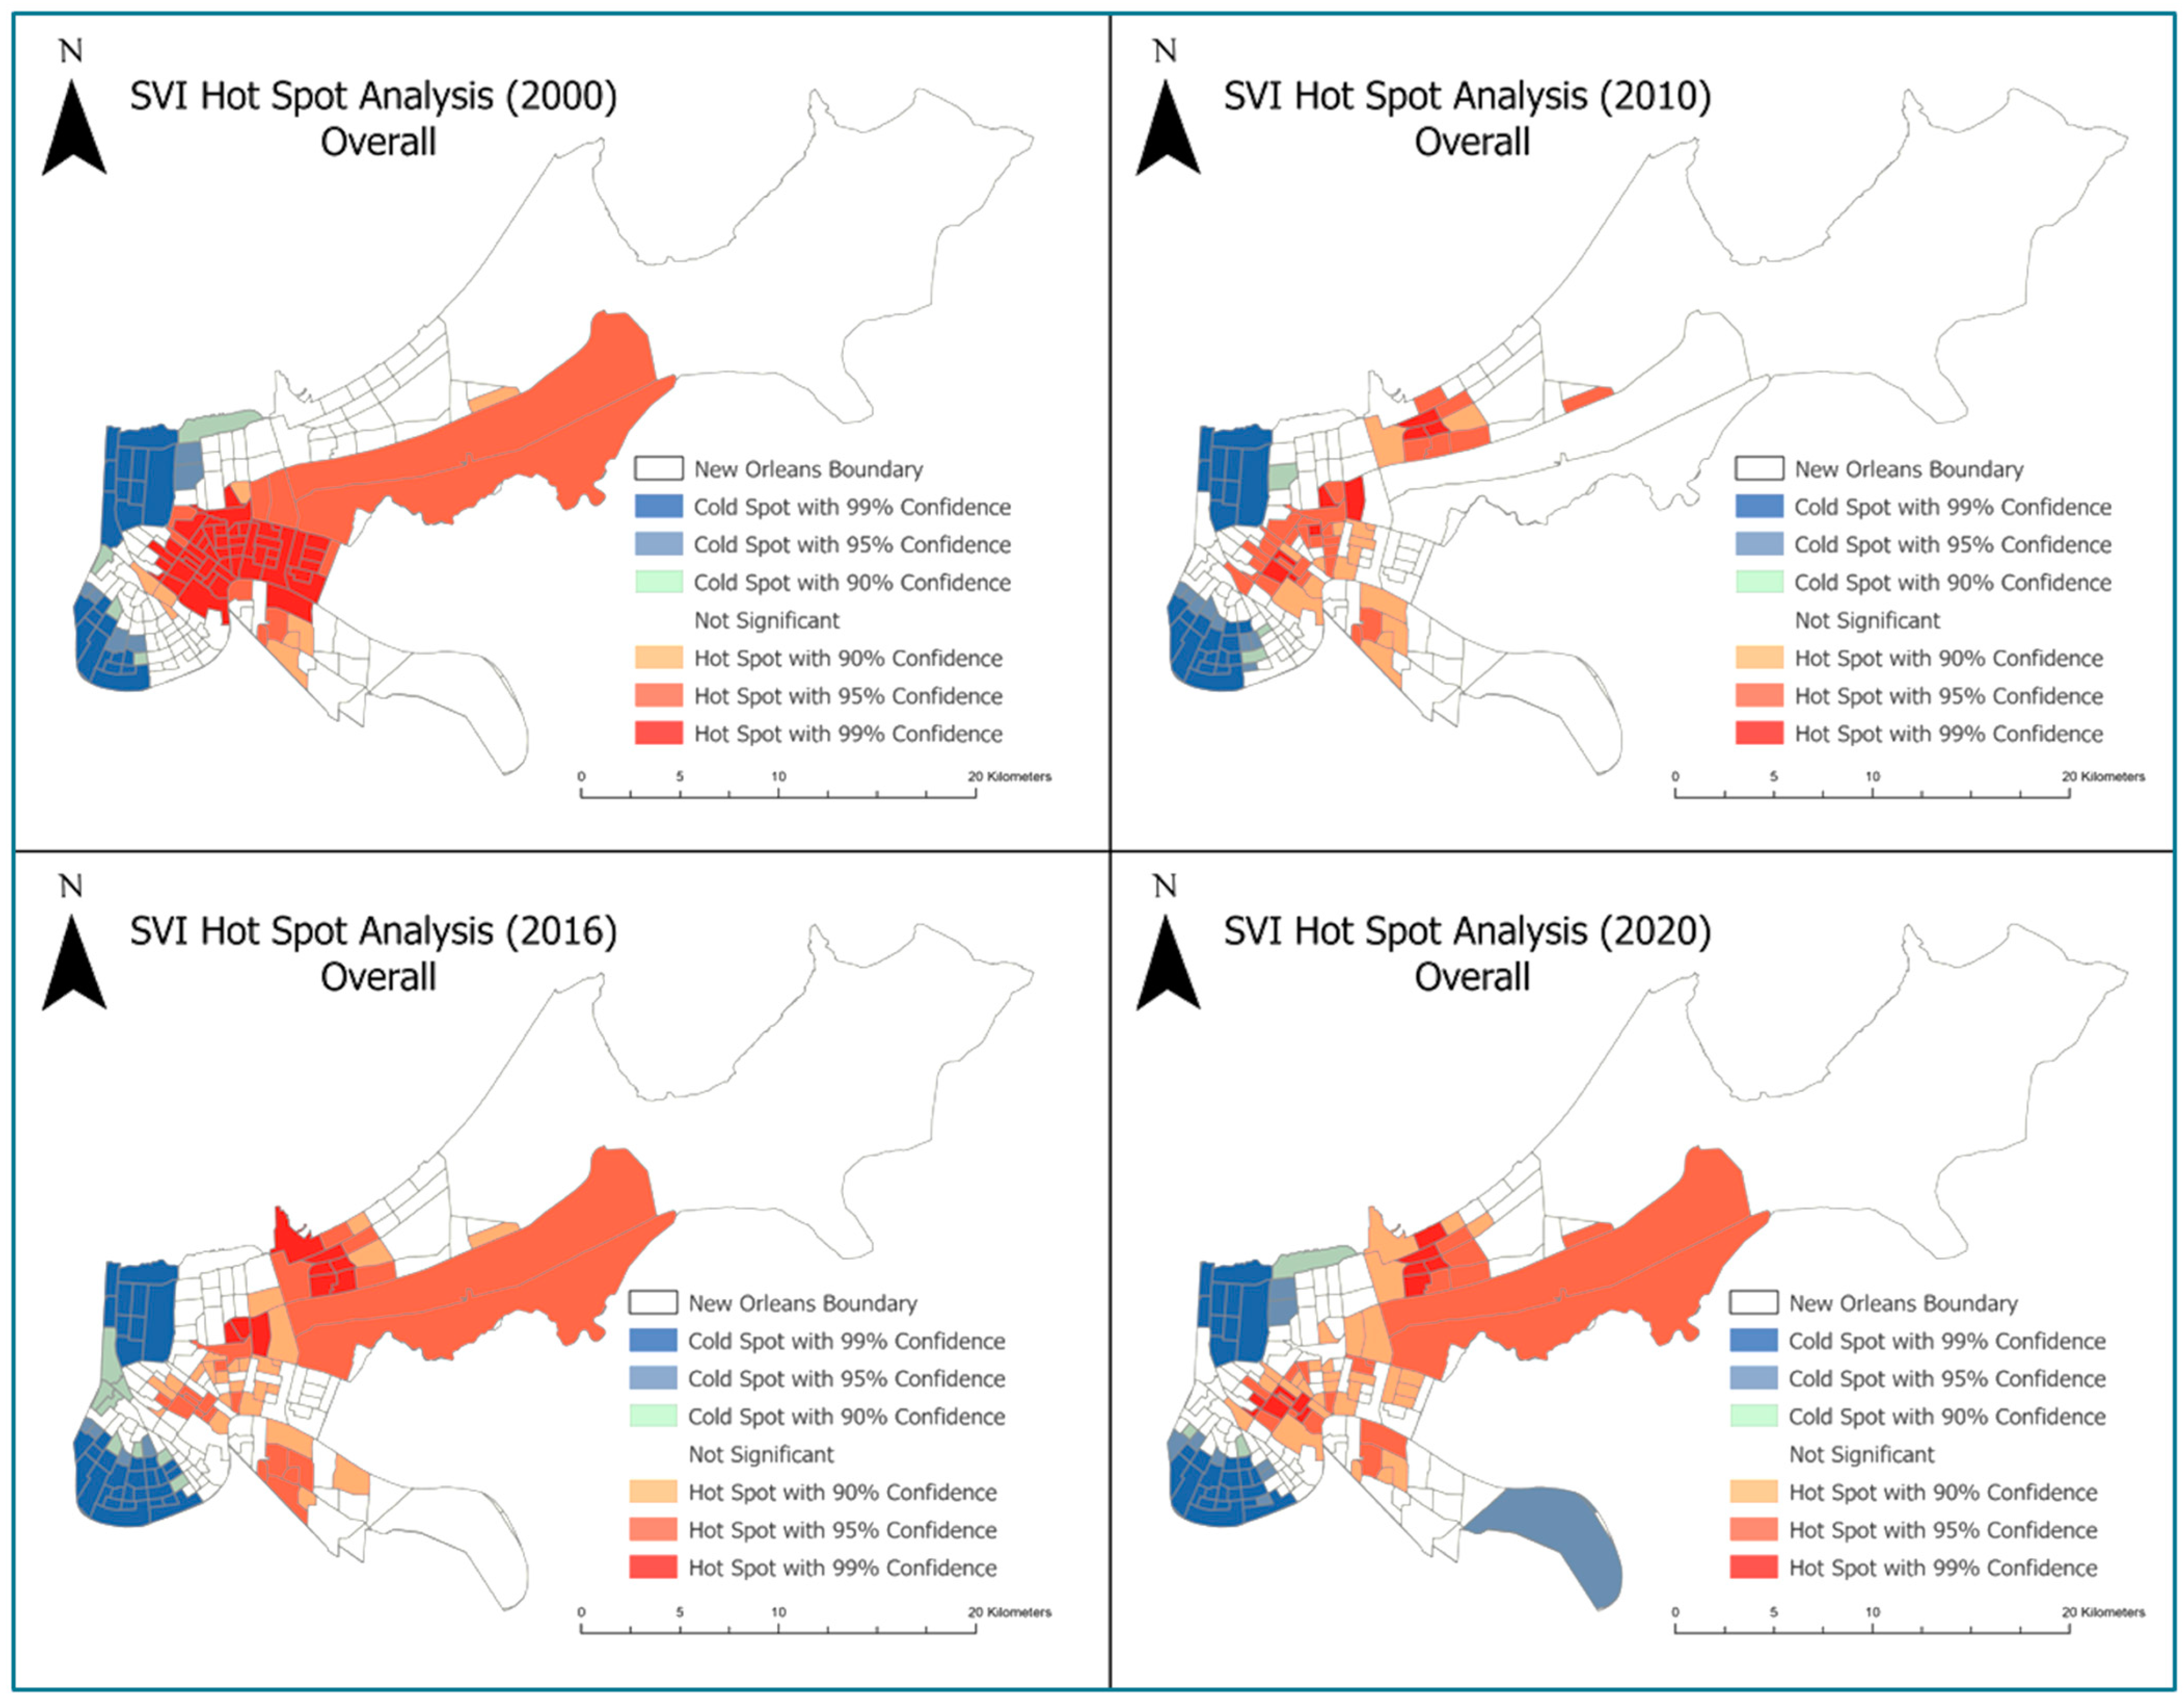
The hot spot analysis of each SVI theme uses the Getis-Ord-Gi* statistic to reveal significant hot and cold spots, illustrating the distribution and intensity of underlying socioeconomic characteristics. Figure 7 shows the changes in spatial patterns of the Overall Theme over the studied time frames over two decades.
The analysis for 2000 revealed distinct clustering patterns. High-confidence cold spots indicating lower vulnerability were prominent in the northwest and southwest corners, bordered by lower-confidence cold spots. Hot spots at 90% and 95% confidence surround the large concentration of high-confidence hot spots that dominated the city’s core. The distribution of cold spots at the 99% confidence level in the northwest remained stable in 2010, while those in the southwest expanded slightly. The large concentration of high-confidence hot spots seen in 2000 underwent a notable reduction and became significantly more dispersed throughout the region. Conversely, hot spots at the lower confidence levels increased, forming small clusters in the southernmost area, downtown, and in the north–central tracts.
The clusters of high-confidence cold spots remained largely the same by 2016, with more eastward expansion of the southwestern concentration. While the distribution of the 90%-confidence hot spots only shifted slightly after 2010, the 95%- and 99%-confidence hot spots spread through the north–central and south–central zones. In 2020, the distribution of high-confidence cold spots appeared to have stabilized. While cold spots at the 90% confidence level were reduced, new 95%-confidence cold spots began to emerge in the southernmost tract and east of the northwest cluster. Hot spots at the 99% confidence level showed a similar reduction, as they became even more dispersed than in 2016. The lower-confidence hot spots underwent minor shifts in this time period.
The distribution of high-confidence cold spots is consistent in the western part of New Orleans, highlighting areas that have remained stable over time. Unlike the cold spots, the hot spot concentrations tended to shift between themes throughout the study area. Theme 4, the housing type and transportation access variable, had the most consistent pattern of high-confidence hot spots between 2000 and 2020.

3.2.3. SVI Risk Analysis

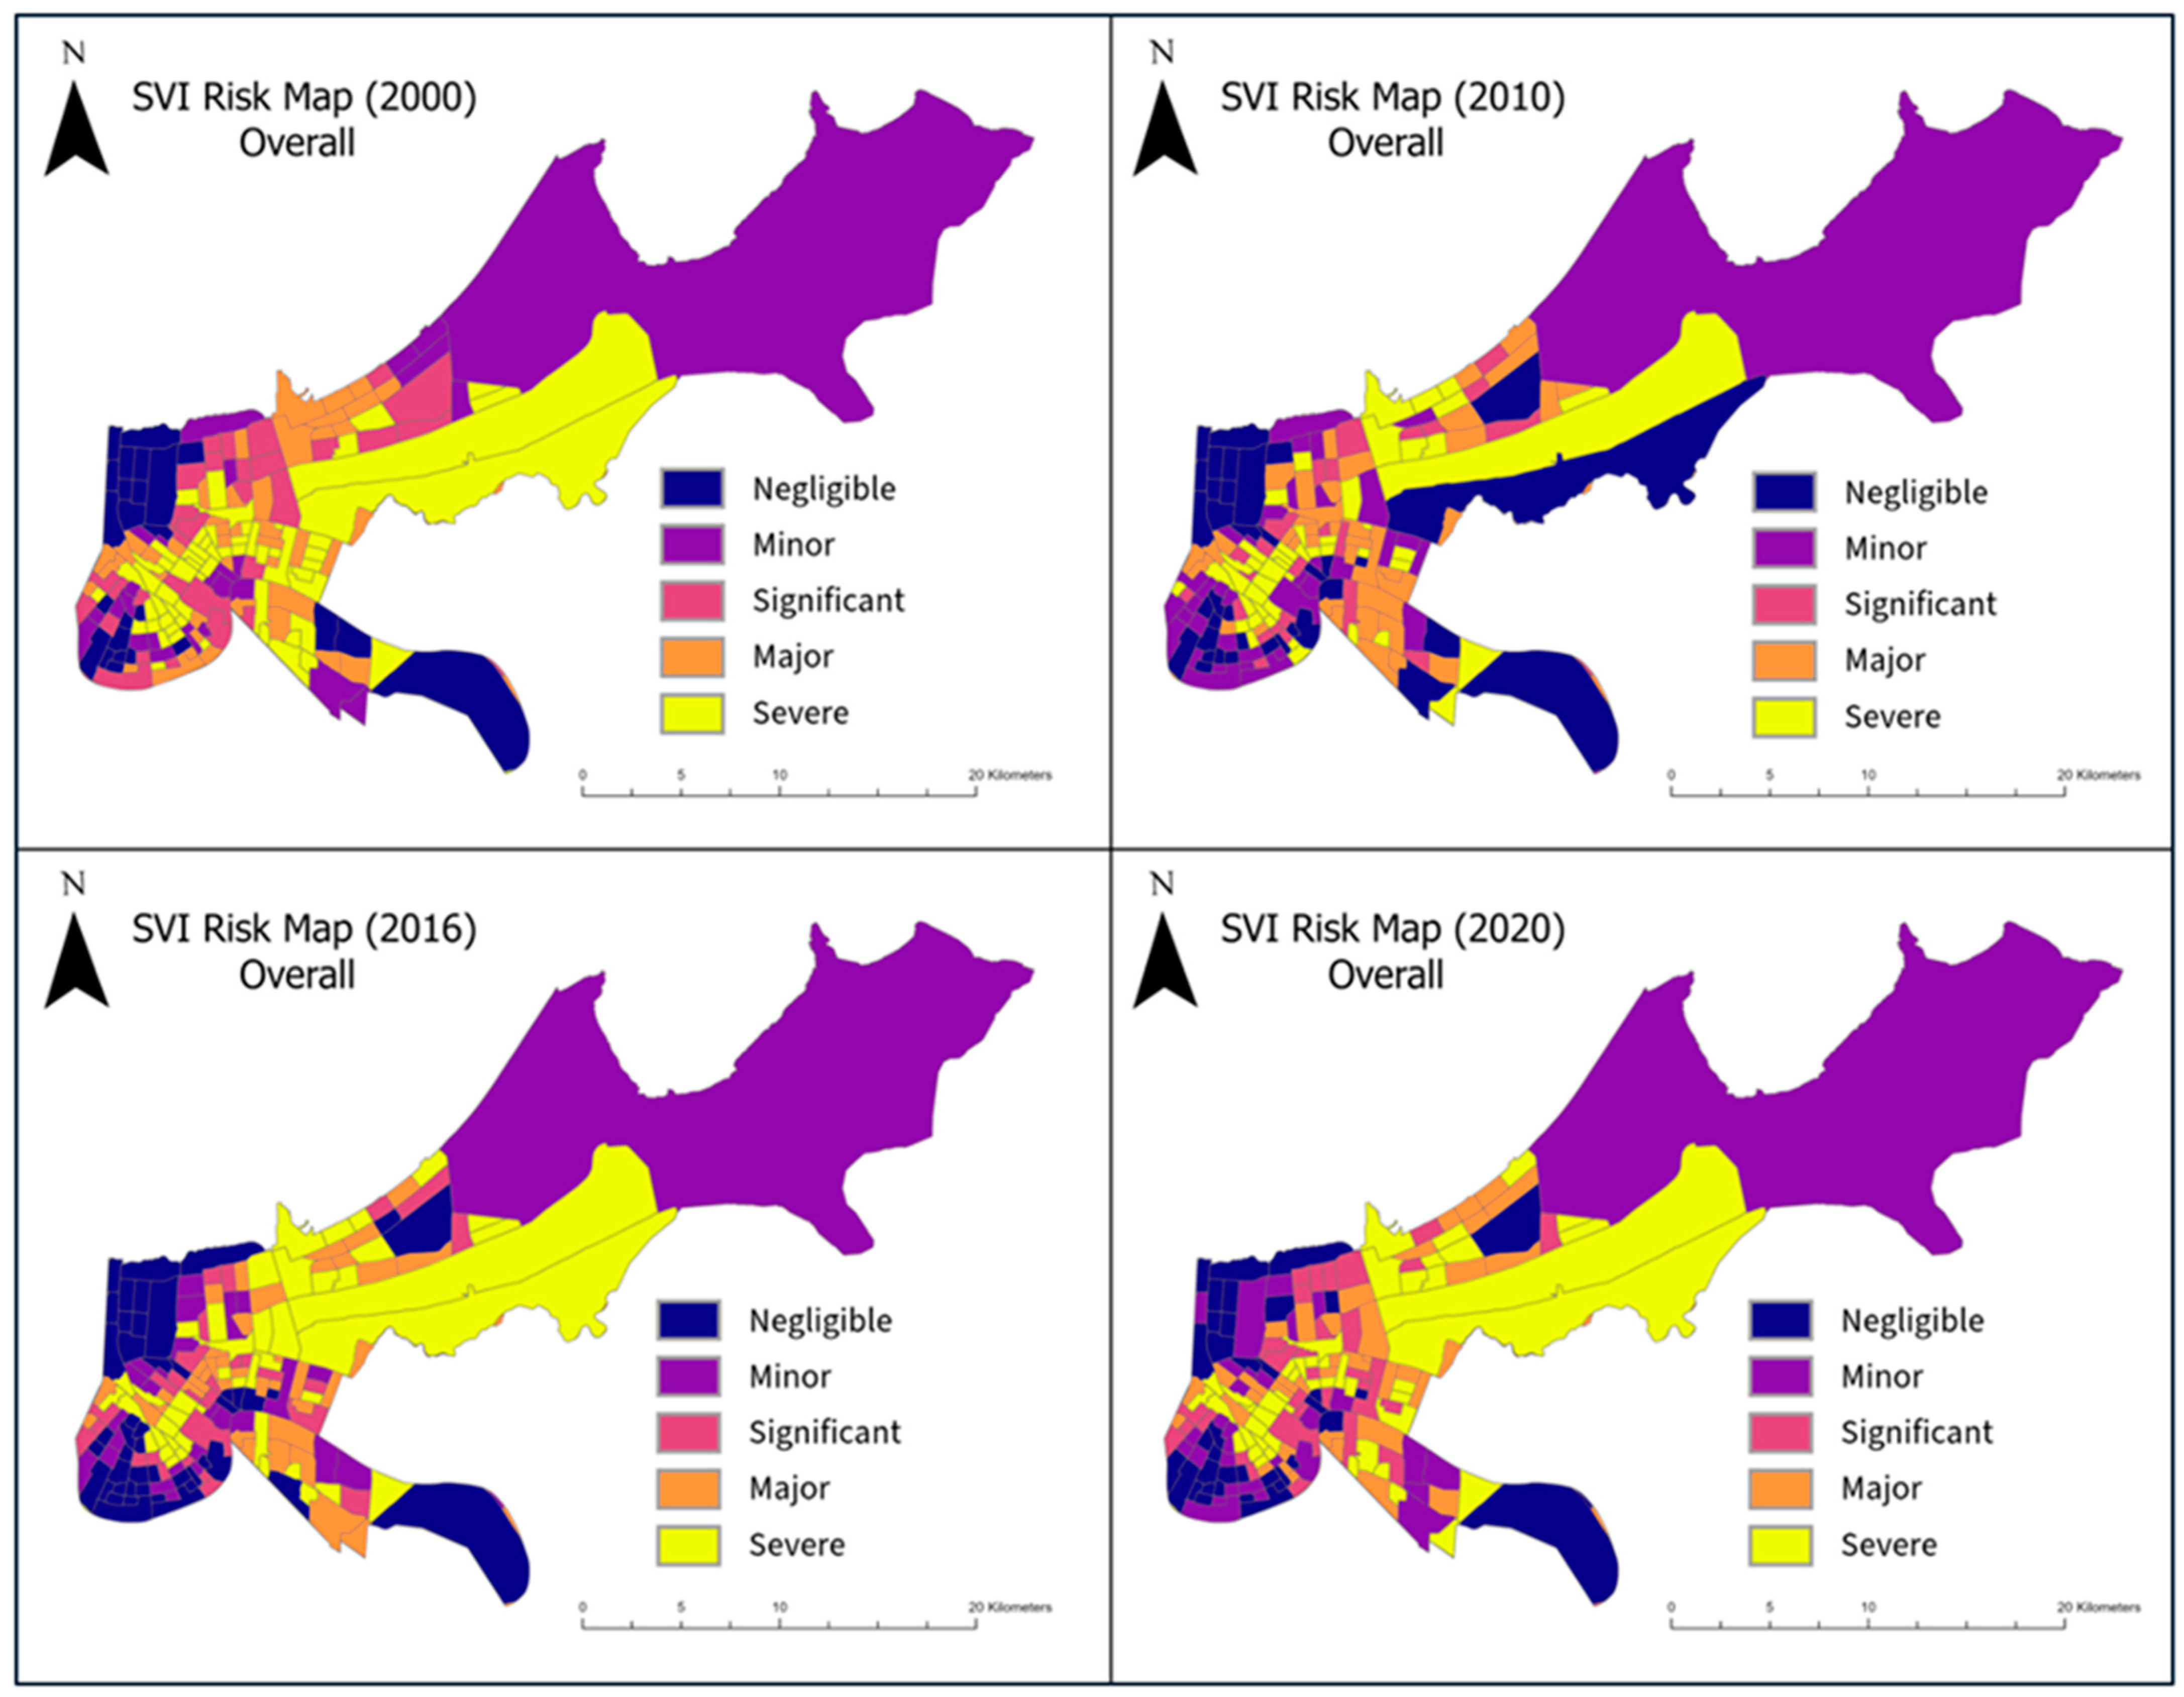
Figure 8 presents maps that summarize changes in overall SVI scores throughout New Orleans for the time series. The maps depict the five levels of risk, ranging from ‘Negligible’ (Level 1) to ‘Severe’ (Level 5).
The 2000 SVI risk map for New Orleans shows distinct patterns of social vulnerability. Areas exposed to ‘Negligible’ risk are concentrated in the northwest and scattered in the southern areas. ‘Minor’ risk zones are much more dispersed throughout the city, totaling approximately 25 tracts. Clusters of census tracts at the ‘Significant’ and ‘Major’ risk levels are spread around the core of the city, in the southwest along the Mississippi River, and in the eastern area along Lake Pontchartrain. ‘Severe’ risk tracts, the most widespread, are highly concentrated in the central areas. This concentration of high-risk census tracts indicates substantial challenges in addressing social vulnerabilities across the city. The 2010 SVI risk map reveals an increase in ‘Negligible’ and ‘Minor’ risk areas, particularly in the northwest and southwest corners and near downtown. Areas marked as ‘Significant’ risk were reduced in number, and dispersal increased. Conversely, ‘Major’-level tracts intensified in the most populated areas of the city, especially near the southwestern border. Though the number of ‘Severe’ risk areas declined, they remained consistent in the central areas.
The ‘Negligible’ risk class remained persistent in the northwest corner and in the southernmost tract by 2016, with some shifts back to the southwest corner and throughout downtown. The number of census tracts at the ‘Minor’ level decreased but remained on the eastern tract and throughout the western half of the study area. Areas at a ‘Significant’ risk maintained patterns seen in 2010, while the ‘Major’ risk areas contracted slightly. At this stage, ‘Severe’-level census tracts expanded to include the south–central tract and several tracts just north of downtown. The 2020 risk map reveals a reduction in ‘Negligible’ risk tracts in the west, many of which jumped to the ‘Minor’ category. The distribution of tracts at the ‘Significant’, ‘Major’, and ‘Severe’ levels remained stable.
The changes in patterns of risk over the years pinpoint the areas that have faced sustained challenges over the twenty-year period. This serves as a reference for identifying specific regions that have faced consistent challenges, potentially aiding rescue efforts and first responders in the event of a natural disaster. Additionally, the areas with consistently low vulnerability zones could potentially provide a template for successful adaptive strategies that work to increase resilience and mitigate future risks.

3.3. Composite Risk Mapping

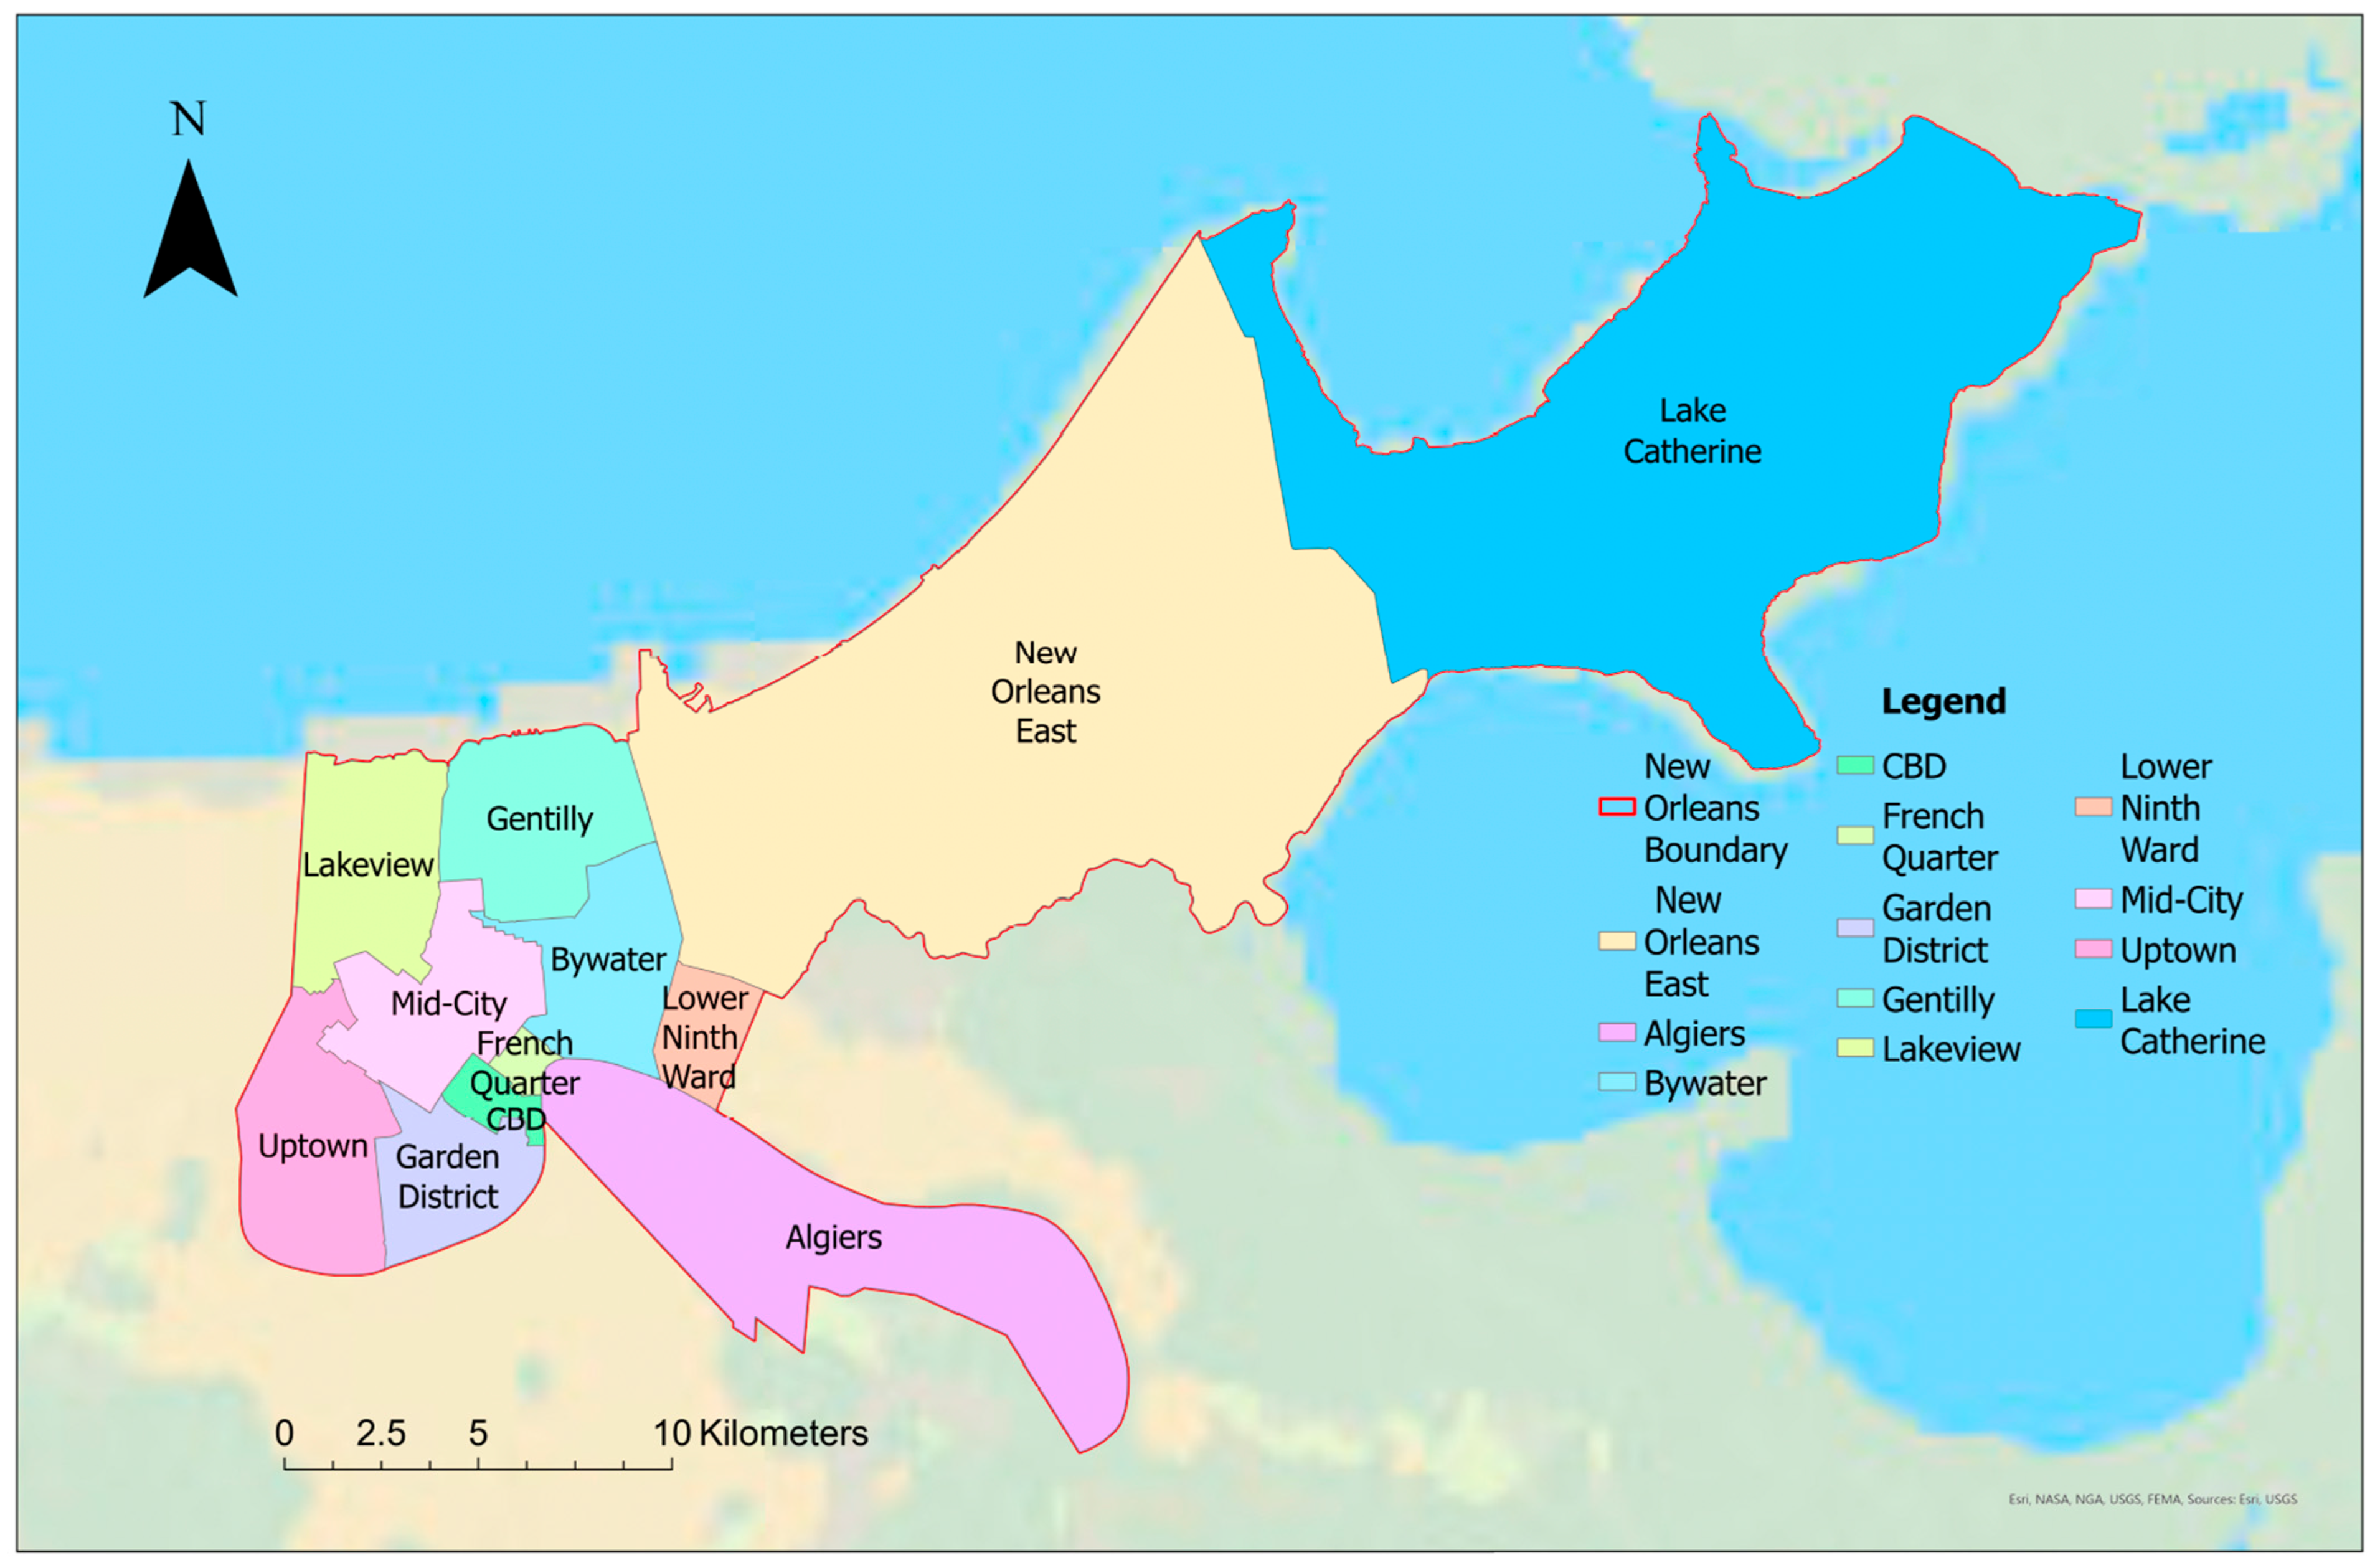
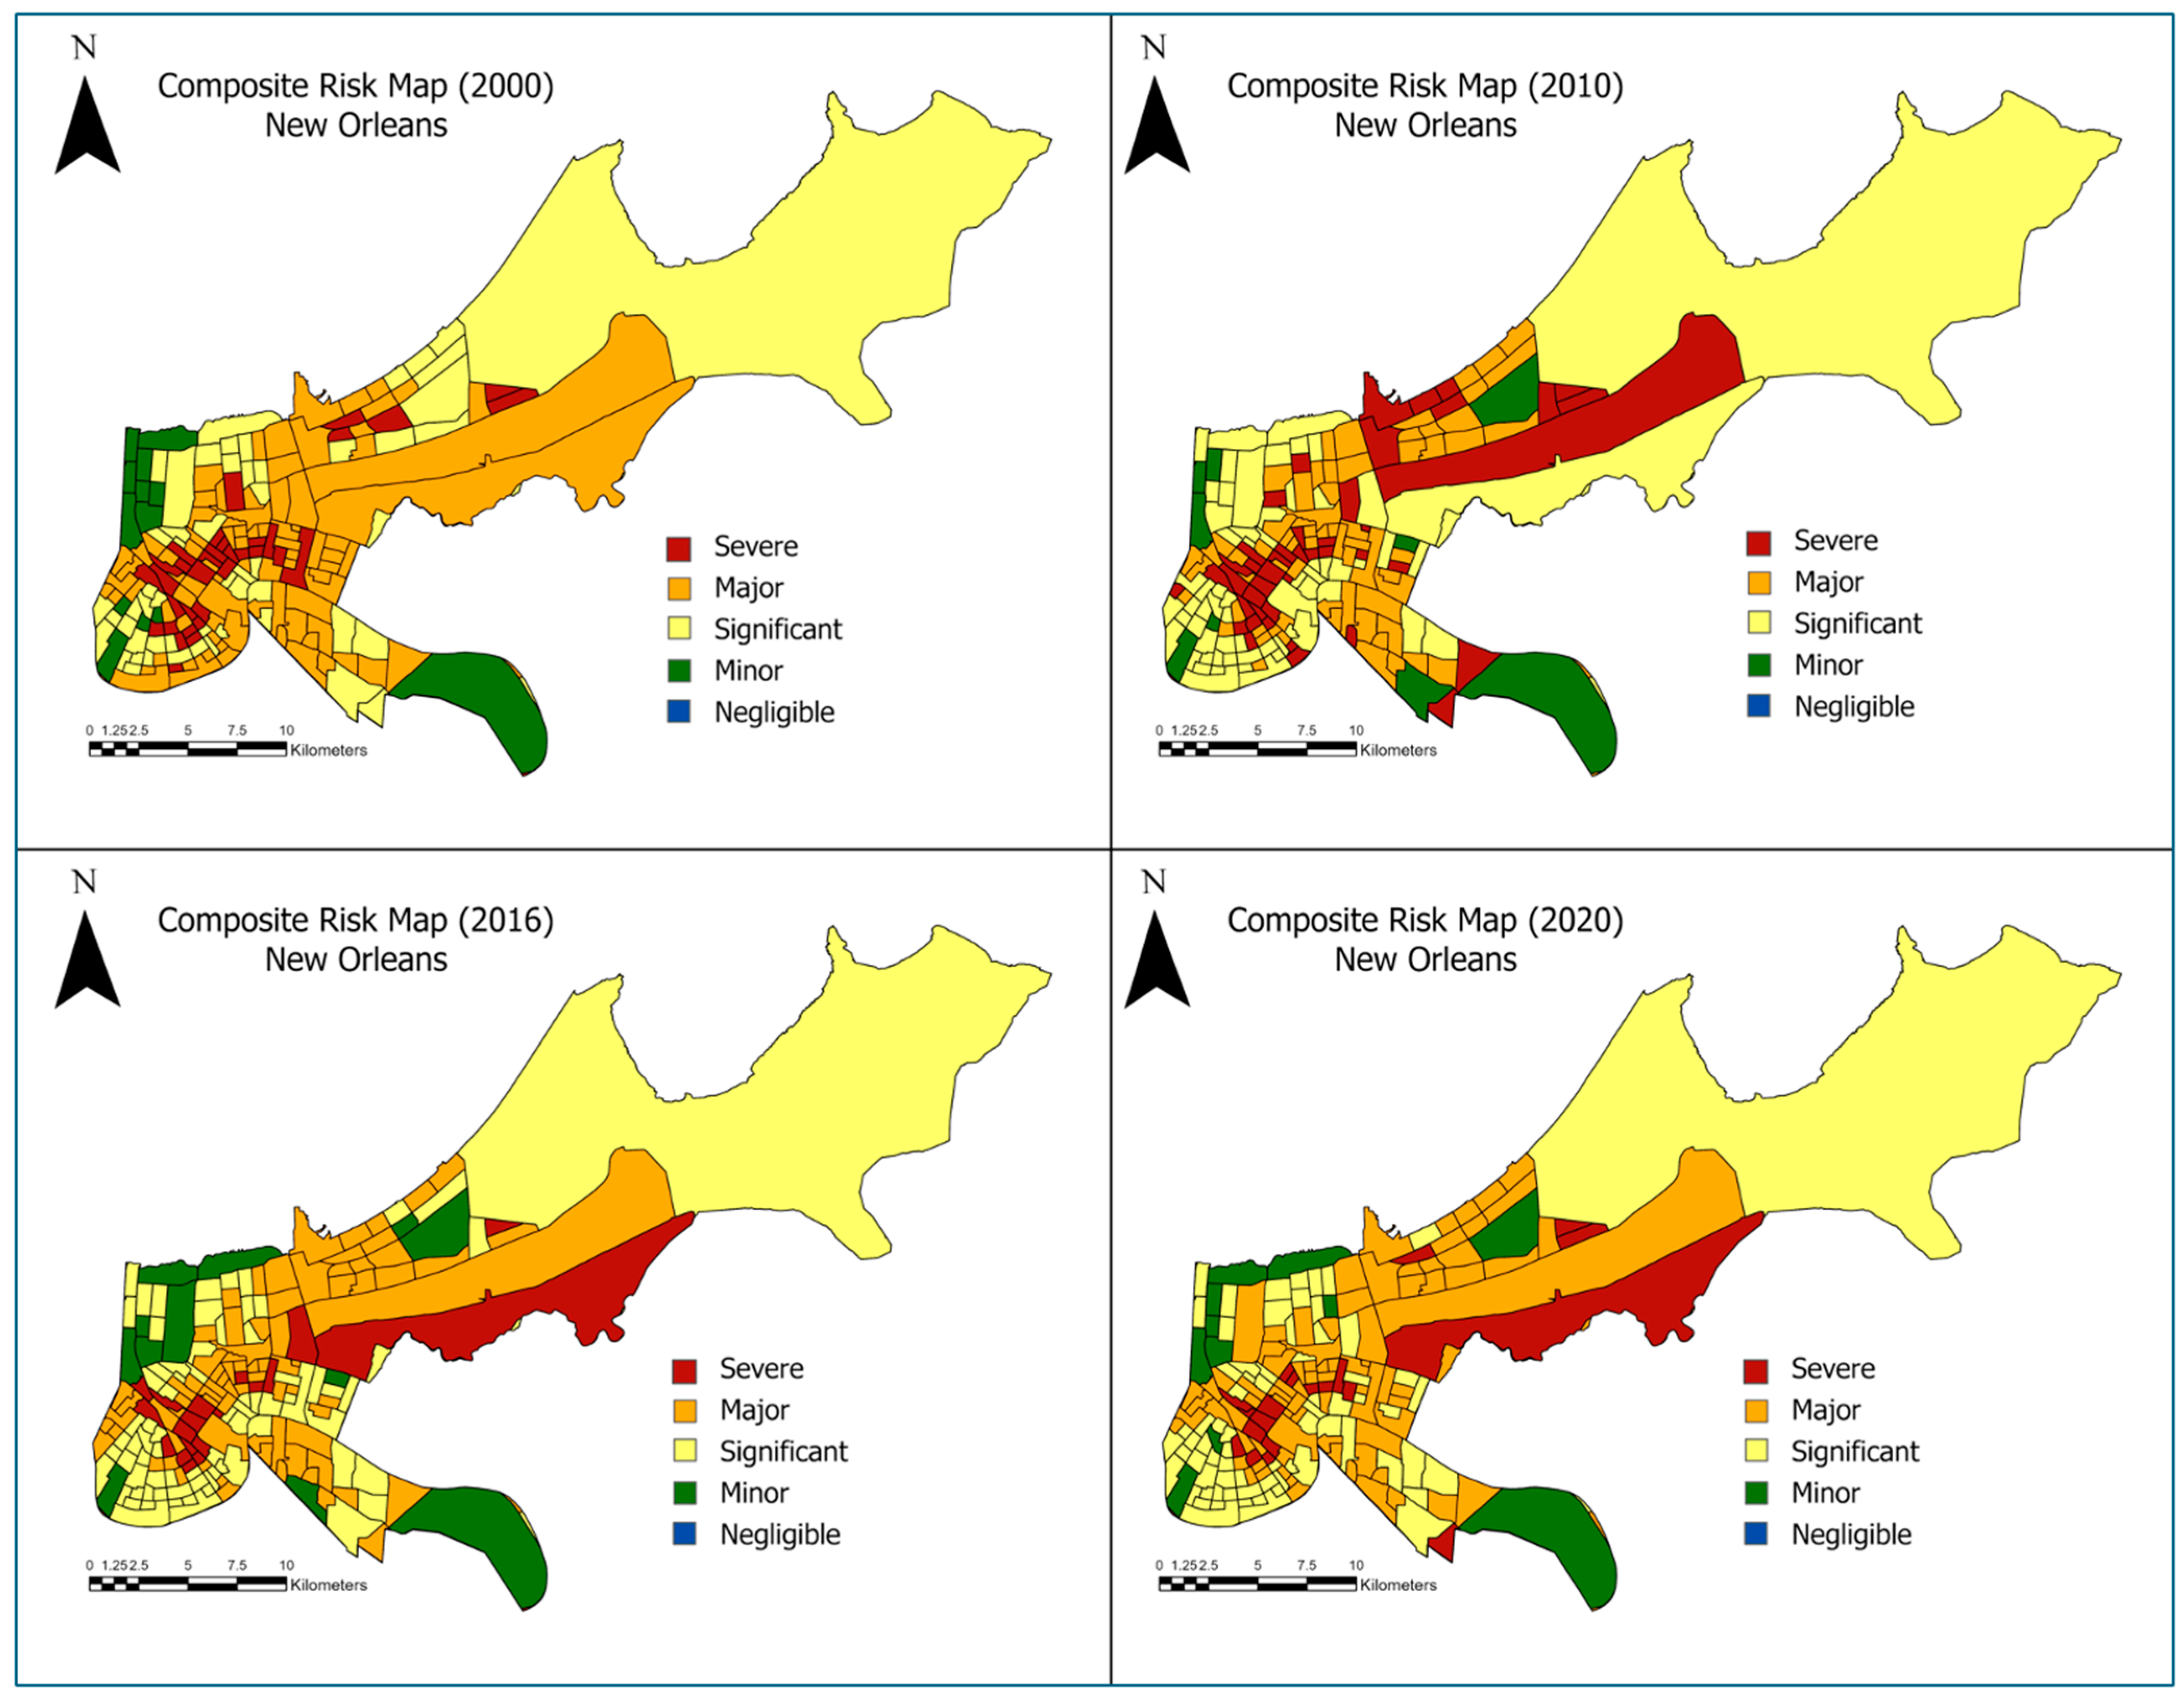
An equal-weight overlay analysis was applied to both the flooding and SVI assessments to produce composite risk maps for each period in the time series. These maps uncover the cycles of vulnerability and resilience in the face of environmental and socioeconomic challenges over time, allowing policymakers to easily identify areas that face persistent risks. A neighborhood boundary map (Figure 9) provides an essential geographical context for interpreting the risk profiles. The series of risk maps (Figure 10) represents the composite flood and social vulnerability risk levels for New Orleans over the years 2000, 2010, 2016, and 2020, highlighting areas with varying degrees of risk.
The 2000 composite risk map reveals a concerning picture of risk distribution across New Orleans. Tracts categorized at the ‘Severe’ level are concentrated in key neighborhoods. Several tracts are dispersed around New Orleans East and a portion of Mid-City and Bywater neighborhoods (Figure 10). Additional areas at the highest risk level include a census tract in the Gentilly and Garden District neighborhoods, a sizable portion of Mid-City, and a small portion of Mid-City. ‘Major’ risk areas encompass about half of New Orleans East, Gentilly, and a portion of the Bywater neighborhood. The census tracts in the Lower Ninth Ward neighborhood are also assigned to this level of risk. A small portion of the Uptown and the Central Business District (CBD) are identified as a ‘Major’ risk, extending into the southern parts of the Garden District and Uptown. The upper half of the Algiers neighborhood is also marked under this designation.
Lake Catherine, New Orleans East, and the northern part of the Gentilly neighborhood are included in the ‘Significant’ risk category, along with Lakeview and the Uptown neighborhood. The center of the Garden District, most of the French Quarter, and a minor part of Algiers also exhibit ‘Significant’ risk. Census tracts at the ‘Minor’ risk level are contained in Lakeview and a good portion of the Uptown and Algiers neighborhoods. Notably, no census tracts are classified under ‘Negligible’ risk, indicating that every part of the city faced some level of risk due to flooding and social vulnerability. This remains consistent for the entire twenty-year period.
‘Severe’ risk areas continued to grow through 2010, now extending further into New Orleans East and Mid-City. Slight increases were also noted in Gentilly, the Garden District, Uptown, Algiers, and the Lower Ninth Ward. The Bywater neighborhood experienced a reduction in this risk category. The New Orleans East neighborhood exhibited a decrease in ‘Major’ risk level census tracts, as did the Lower Ninth Ward, Garden District, and CBD neighborhoods. This category showed slight increases in the Bywater and Mid-City communities. The ’Significant’ risk category remained relatively consistent, especially in Lake Catherine, Lakeview, the CBD, and the French Quarter. The Garden District and Uptown saw an increase in tracts at this level. During this period, census tracts in the Lakeview neighborhood shifted from ‘Minor’ to ‘Significant’ risk. Once again, no tracts were categorized under ‘Negligible’ risk, highlighting the pervasive nature of risk across the city.
By 2016, the composite risk map indicated an overall reduction in areas with ‘Severe’ risk. The New Orleans East neighborhood saw this risk class shrink to about half its 2010 size, and it disappeared entirely from Gentilly and Algiers. Notable reductions were also observed in the Mid-City and Uptown regions, while other areas remained relatively consistent. ‘Major’ risk level areas expanded closer to their 2000 levels in New Orleans East and the CBD. Conversely, ‘Major’ risk declined markedly in the Bywater and Lower Ninth Ward neighborhoods. Census tracts in the ‘Significant’ risk class decreased in the Lakeview region, shifting toward the ‘Minor’ level, but remained otherwise consistent in distribution. The ‘Minor’ risk category only experienced small growth as it began encroaching into Gentilly.
The 2020 composite risk map maintained a broadly consistent distribution of risk compared to 2016, with only slight shifts occurring between risk levels. Tracts identified as ‘Severe’ risk grew slightly in New Orleans East, Algiers, and Bywater. ‘Major’ risk areas also grew slightly, especially in the Garden District and Lakeview, while Algiers underwent a marginal reduction. The ‘Significant’ risk distribution saw almost no change, with a very small reduction in Lakeview, Bywater, and the Lower Ninth Ward. Similarly, ‘Minor’ risk tracts showed minimal change. A new tract at this level developed in Gentilly and the upper part of the Uptown neighborhood, while the previously ‘Minor’ risk zones in New Orleans East and the Lower Ninth Ward shifted to higher risk levels.

4. Discussion

The results of this study offer a comprehensive analysis of flood risk and social vulnerability in New Orleans over a twenty-year period, providing important insights into the spatial and temporal evolution of these risks.

4.1. Flood Risk Assessment

The flood risk maps indirectly quantified through analysis of the MNDWI reveal critical changes in the flood risk profile of New Orleans. In 2000, the city predominantly fell into the ‘Significant’ category, providing a baseline of moderate risk in the pre-Katrina landscape. ‘Major’ and ‘Severe’ risk zones were identified in the lowest-lying areas and along Lake Pontchartrain. The devastating impact of Hurricane Katrina in 2005 was evident in the 2010 map. A substantial increase in census tracts marked as ‘Major’ risk reflected the lingering effects of widespread flooding brought about by intense precipitation and levee failures. Reductions in the ‘Major’ risk level with subsequent increases in ‘Minor’ risk by 2016 suggest improvements in flood management and resilience-building initiatives. However, the ‘Severe’ risk zones in 2020 mirrored the pre-Katrina distribution, highlighting the need for continuous and enhanced prevention efforts. These persistent vulnerabilities could aid in these efforts by bringing attention to specific areas requiring sustained attention and resources.

4.2. Social Vulnerability Analysis

Assessments of the changes in social vulnerability patterns across different themes were facilitated by Moran’s I cluster analysis and the Getis-Ord-Gi* hot spot analysis. The analysis of Theme 1 (Socioeconomic Status) indicates that the clustering of high-vulnerability areas has intensified over time, particularly in the central and southwestern parts of the study area. For Theme 2 (Household Characteristics and Disability), the high-vulnerability areas showed much more fluctuation as clusters became more dispersed in some regions and more concentrated in others. Results for Theme 3 (Racial and Ethnic Minority Status) demonstrated increases in high–high clusters by 2020, emphasizing the ongoing need for interventions to address segregation. Theme 4 (Housing Type and Transportation) had the most consistent concentration of high-vulnerability clusters of the entire time series. This analysis revealed that the city’s core, in particular, lacks adequate housing and transportation access, which could lead to widespread structural damage and slow evacuations if a major storm were to occur. Overall, the hot spot analysis points to the systemic nature of social vulnerability in New Orleans. Emphasizing the policy implications of these findings, it is crucial to integrate multifaceted interventions that address multiple SVI themes simultaneously, given that vulnerabilities are often interconnected.

4.3. Composite Risk Mapping

The composite risk maps provide a holistic assessment of flood risk and overall social vulnerability in New Orleans over time. At the start of the study, ‘Severe’ risk areas were mainly concentrated in the New Orleans East, Gentilly, and Upper Ninth Ward neighborhoods. The expansion of the ‘Severe’ classification in New Orleans East and Mid-City by 2010 reveals that the most vulnerable regions faced continued exposure to compounded risks, suggesting that existing mitigation strategies were insufficient. These areas saw small improvements leading into 2016, particularly in neighborhoods like Gentilly and Algiers, suggesting some progress in resilience-building measures. However, the concurrent increase in ‘Major’ risk areas paired with the minimal change in ‘Significant’ and ‘Minor’ risk levels indicates that vulnerabilities are being redistributed rather than resolved. The largely consistent distribution of risk in 2020 emphasizes the need for long-term interventions to effectively mitigate these vulnerabilities. The findings highlight the importance of the continuous monitoring and updating of risk maps to reflect changing conditions and inform adaptive management strategies.
The study calls attention to the crucial need for integrated and sustained efforts to address both flood risks and social vulnerabilities in New Orleans. By focusing on the most vulnerable areas and learning from regions that have shown improvement, the city can enhance its resilience to future flooding and socioeconomic challenges, ultimately creating a safer and more equitable environment for its residents.

4.4. Limitations and Assumptions

This research relies primarily on secondary or third-party datasets, often inheriting inherent data limitations or associated errors. Because the raw datasets (such as the Landsat imageries, SVI from the Centers for Disease Control and Prevention, United States Census data, etc., see Table 1) utilized in this study are freely available, we assume associated data limitations could be a limitation in this study. For this work, flood risk assessment utilized a non-traditional approach. Due to a lack of publicly available consistent flood hazard maps for New Orleans over the studied time frame (2000–2020), the Modified Normalized Difference Water Index (MNDWI), in combination with elevation and proximity to water bodies, was used to infer flood risk levels. This work assumed that since the MNDWI is derived using the Green and SWIR bands, which enhance water bodies and identify flooded areas, this rationale could be applied to historical flood years in New Orleans to identify flooded areas.

5. Conclusions

This study sought to investigate and bridge the knowledge gap between flood risk and social vulnerability in urban settings, e.g., the City of New Orleans. Using a combined remote sensing and geospatial analytical approach, composite risk maps at the intersection of flood risk and social vulnerability were produced. The following findings were deduced from the study:
  • The temporal analysis of flood risk in New Orleans between 2000 and 2010 revealed some areas where flood mitigation measures reduced vulnerability.
  • Despite flood risk intervention measures working in some areas in New Orleans, the spatiotemporal analysis of the composite risk maps revealed a probable resultant redistribution of risk. It highlighted increased continuous exposure to flood risk in most vulnerable areas, indicating insufficient flood mitigation strategies.
  • The composite risk maps highlighted the most vulnerable areas where flood mitigation measures should be concentrated after further investigation.
Inferences from this research could aid in planning for locations in need of urgent flood mitigation in the City of New Orleans and provide the information required for building flood resilience, thereby reinforcing the city in the era of a changing climate.

Author Contributions

Conceptualization, S.G.-R. and W.Z.; methodology, S.G.-R., D.I. and W.Z.; software, S.G.-R. and W.Z.; validation, D.I. and W.Z.; formal analysis, S.G.-R.; investigation, S.G.-R., D.I. and W.Z.; resources, W.Z.; data curation, S.G.-R.; writing—original draft preparation, S.G.-R.; writing—review and editing, D.I. and W.Z.; visualization, S.G.-R. and W.Z.; supervision, W.Z.; project administration, W.Z. All authors have read and agreed to the published version of the manuscript.

Funding

This research received no external funding except for a James Marshall and Margaret Link Memorial Endowed Scholarship.

Data Availability Statement

The datasets used in this study are from the public domain. For instance, the digital elevation data are from the United States Geological Survey, and the social vulnerability data are from the National Public Health Agency of the United States. Please refer to Table 1 for more details. The datasets are stored in a geodatabase, which can be downloaded from https://drive.google.com/file/d/1U0VuXefcA81Xj_vvnHm-Ymrth9Zbq6SP/view?usp=sharing (accessed on 30 August 2024).

Acknowledgments

The authors thank the James Marshall and Margaret Link Memorial Endowed Scholarship for supporting this research. Additionally, we thank the undergraduate students from the Colorado School of Mines Design II—Geology GIS classes of Spring 2022 and Spring 2023 for their data collection efforts.

Conflicts of Interest

The authors declare no conflicts of interest.

References

  1. Englund, M.; Vieira Passos, M.; André, K.; Gerger Swartling, Å.; Segnestam, L.; Barquet, K. Constructing a social vulnerability index for flooding: Insights from a municipality in Sweden. Front. Clim. 2023, 5, 1038883. [Google Scholar] [CrossRef]
  2. Fox, S.; Agyemang, F.; Hawker, L.; Neal, J. Integrating social vulnerability into high-resolution global flood risk mapping. Nat. Commun. 2024, 15, 3155. [Google Scholar] [CrossRef] [PubMed]
  3. IPCC. Summary for Policymakers. In Climate Change 2022: Impacts, Adaptation, and Vulnerability; Pörtner, H.-O., Roberts, D.C., Poloczanska, E.S., Mintenbeck, K., Tignor, M., Alegri, A., Craig, M., Langsdorf, S., Löschke, S., Möller, V., et al., Eds.; Cambridge University Press: Cambridge, UK, 2022; pp. 1–33. [Google Scholar]
  4. UNDRR. Global Assessment Report on Disaster Risk Reduction 2022: Our World at Risk: Transforming Governance for a Resilient Future; United Nations Office for Disaster Risk Reduction: Geneva, Switzerland, 2022; pp. 1–237. [Google Scholar]
  5. Tate, E.; Rahman, M.A.; Emrich, C.T.; Sampson, C.C. Flood exposure and social vulnerability in the United States. Nat. Hazards 2021, 106, 435–457. [Google Scholar] [CrossRef]
  6. Idowu, D. Assessing the Utilization of Remote Sensing and GIS Techniques for Flood Studies and Land Use/Land Cover Analysis through Case Studies in Nigeria and the USA. Ph.D. Thesis, Colorado School of Mines, Golden, CO, USA, 2021. [Google Scholar]
  7. Kelman, A. A River and Its City: The Nature of Landscape in New Orleans; University of California Press: Oakland, CA, USA, 2003; p. 310. [Google Scholar]
  8. Colten, C.E. Basin Street blues: Drainage and environmental equity in New Orleans, 1890–1930. J. Hist. Geogr. 2002, 28, 237–257. [Google Scholar] [CrossRef]
  9. Dixon, T.H.; Amelung, F.; Ferretti, A.; Novali, F.; Rocca, F.; Dokka, R.K.; Sella, G.; Kim, S.W.; Wdowinski, S.; Whitman, D. Subsidence and flooding in New Orleans. Nature 2006, 441, 587–588. [Google Scholar] [CrossRef] [PubMed]
  10. Jones, C.E.; An, K.; Blom, R.G.; Kent, J.; Ivins, E.R.; Bekaert, D. Anthropogenic and geologic influences on subsidence in the vicinity of New Orleans, Louisiana. J. Geophys. Res. Solid. Earth 2016, 121, 3867–3887. [Google Scholar] [CrossRef]
  11. Li, Z. Assessing Heat Vulnerability of New Orleans Using Multitemporal Remote Sensing and Demographic Data. Master’s Thesis, University of Michigan, Ann Arbor, MI, USA, 2021. [Google Scholar]
  12. National Weather Service: Climate. Available online: https://www.weather.gov/wrh/Climate?wfo=lix (accessed on 13 October 2023).
  13. Environmental Atlas of Lake Pontchartrain. Available online: https://pubs.usgs.gov/of/2002/of02-206/phy-environment/climate-intro.html (accessed on 13 October 2023).
  14. Hazard Mitigation Plan—New Orleans Profile. Available online: https://ready.nola.gov/hazard-mitigation/new-orleans-profile/#:~:text=The%20average%20annual%20precipitation%20is,nights%20with%20freezing%20lows%20annually (accessed on 18 November 2023).
  15. Dunbar, J.B.; Britsch, L.D., III. Geology of the New Orleans area and the canal levee failures. J. Geotech. Geoenviron. Eng. 2008, 134, 566–582. [Google Scholar] [CrossRef]
  16. Rogers, J.D.; Boutwell, G.; Watkins, C.; Karadeniz, D. Chapter 3: Geology of the New Orleans Region. In Investigation of the Performance of the New Orleans Flood Protection Systems in Hurricane Katrina on 29 August 2005; Seed, R.B., Ed.; Independent Levee Investigation Team: Berkeley, CA, USA, 2006; Volume 1, pp. 1–49. [Google Scholar]
  17. Semmens, S.N.; Zhou, W.; Robbins, B. Empirical assessment of blanket thickness as an indicator of backward erosion piping, Lower Mississippi Valley, USA. Nat. Hazards Rev. 2021, 22, 04021001. [Google Scholar] [CrossRef]
  18. Semmens, S.N.; Zhou, W. Predicting backward erosion piping hazard, Lower Mississippi Valley, USA. Q. J. Eng. Geol. Hydrogeol. 2020, 54, qjegh2020-035. [Google Scholar] [CrossRef]
  19. Zhou, W. GIS for Earth Sciences, 2021. In Encyclopedia of Geology, 2nd ed.; Alderton, D., Elias, S.A., Eds.; Academic Press: London, UK, 2021; Volume 6, pp. 281–293. [Google Scholar] [CrossRef]
  20. Rogers, J.D. Development of the New Orleans Flood Protection System prior to Hurricane Katrina. J. Geotech. Geoenviron. Eng. 2008, 134, 602–617. [Google Scholar] [CrossRef]
  21. van Asselen, S.; Verburg, P.H.; Vermaat, J.E.; Janse, J.H.; Merenlender, A. Drivers of wetland conversion: A global meta-analysis. PLoS ONE 2013, 8, e81292. [Google Scholar] [CrossRef]
  22. Ohenhen, L.O.; Shirzaei, M.; Ojha, C.; Sherpa, S.F.; Nicholls, R.J. Disappearing cities on US coasts. Nature 2024, 627, 108–115. [Google Scholar] [CrossRef]
  23. National Weather Service: Hurricane Betsy 1965. Available online: https://www.weather.gov/lch/1965Betsy-WindPressure (accessed on 18 November 2023).
  24. Andersen, C.F.; Battjes, J.A.; Daniel, D.E.; Edge, B.; Espey, W.; Gilbert, R.B.; Jackson, T.L.; Kennedy, D.; Mileti, D.S.; Mitchell, J.K.; et al. The New Orleans Hurricane Protection System: What Went Wrong and Why; American Society of Civil Engineers: Reston, VA, USA, 2007; p. 84. [Google Scholar]
  25. Deryugina, T.; Kawano, L.; Levitt, S. The economic impact of Hurricane Katrina on its victims: Evidence from individual tax returns. AEJ Appl. Econ. 2018, 10, 202–233. [Google Scholar] [CrossRef]
  26. U.S. Army Corps of Engineers: New Orleans District Engineering Division. Hurricane and Storm Damage Risk Reduction System Design Guidelines (Interim); U.S. Army Corps of Engineers: New Orleans, LA, USA, 2012; p. 606.
  27. Louisiana: City of New Orleans Structure Elevation Project. Available online: https://www.fema.gov/case-study/louisiana-city-new-orleans-structure-elevation-project (accessed on 20 November 2023).
  28. Ermagun, A.; Smith, V.; Janatabadi, F. High urban flood risk and no shelter access disproportionally impacts vulnerable communities in the USA. Commun. Earth Envion. 2004, 5, 2. [Google Scholar] [CrossRef]
  29. Idowu, D.; Zhou, W. Land use and land cover change assessment in the context of flood hazard in Lagos State, Nigeria. Water 2021, 13, 1105. [Google Scholar] [CrossRef]
  30. Huong, H.T.L.; Pathirana, A. Urbanization and climate change impacts on future urban flooding in Can Tho city, Vietnam. Hydrol. Earth Syst. Sci. 2013, 17, 379–394. [Google Scholar] [CrossRef]
  31. Idowu, D.; Zhou, W. Land Use Land Cover Assessment and Flood Hazard Mapping in Lagos State (Nigeria) Using Optical Remote Sensing Data. In Selected Studies in Geotechnics, Geo-Informatics and Remote Sensing. CAJG 2020; Ergüler, Z.A., Ed.; Advances in Science, Technology & Innovation; Springer: Cham, Germany, 2020. [Google Scholar] [CrossRef]
  32. Idowu, D.; Zhou, W. Global megacities and frequent floods: Correlation between urban expansion patterns and urban flood hazards. Sustainability 2023, 15, 2514. [Google Scholar] [CrossRef]
  33. Idowu, D.; Zhou, W. Spatiotemporal evaluation of flood potential indices for watershed flood prediction in the Mississippi River basin, USA. Environ. Eng. Geosci. 2021, 27, 319–330. [Google Scholar]
  34. Wdowinski, S.; Bray, R.; Kirtman, B.P.; Wu, Z. Increasing flooding hazard in coastal communities due to rising sea level: Case study of Miami Beach. Florida. Ocean Coast. Manag. 2016, 126, 1–8. [Google Scholar] [CrossRef]
  35. Hierholzer, E.; Bellamy, N.; Mannix, B.; Keenan, J. A quarterly technical assistance journal on disaster behavioral health. Dialogue 2017, 13, 1–14. [Google Scholar]
  36. Fussell, E.; Sastry, N.; VanLandingham, M. Race, socioeconomic status, and return migration to New Orleans after Hurricane Katrina. Popul. Environ. 2009, 31, 20–42. [Google Scholar] [CrossRef]
  37. Lee, S.; Dodge, J.L.; Chen, G. The cost of social vulnerability: An integrative conceptual framework and model for assessing financial risks in natural disaster management. Nat. Hazards 2022, 114, 691–712. [Google Scholar] [CrossRef] [PubMed]
  38. Agency for Toxic Substances and Disease Registry—CDC/ATSDR SVI Data and Documentation Download. Available online: https://www.atsdr.cdc.gov/placeandhealth/svi/data_documentation_download.html (accessed on 21 November 2023).
  39. Singh, D.; Singh, B. Investigating the impact of data normalization on classification performance. Appl. Soft Comput. 2020, 97, 105524. [Google Scholar] [CrossRef]
  40. Stojanova, D.; Ceci, M.; Appice, A.; Malerba, D.; Džeroski, S. Global and local spatial autocorrelation in predictive clustering trees. In Lecture Notes in Computer; Springer: Berlin/Heidelberg, Germany, 2011. [Google Scholar]
  41. Griffith, D.A. Spatial Autocorrelation: A Primer Resource Publications in Geography; The Association of American Geographers: Washington, DC, USA, 1987; p. 82. [Google Scholar]
  42. Getis, A.; Ord, J.K. The analysis of spatial association by use of distance statistics. Geogr. Anal. 1992, 24, 189–206. [Google Scholar] [CrossRef]
  43. Ord, J.K.; Getis, A. Local spatial autocorrelation statistics: Distributional issues and an application. Geogr. Anal. 1995, 27, 286–306. [Google Scholar] [CrossRef]
  44. Blais-Stevens, A.; Behnia, P. Debris flow susceptibility mapping using a qualitative heuristic method and Flow-R along the Yukon Alaska Highway Corridor, Canada. Nat. Hazards Earth Syst. Sci. 2016, 16, 449–462. [Google Scholar] [CrossRef]
  45. Zhou, W.; Minnick, M.; Chen, J.; Garret, J.; Acikalin, E. GIS-based landslide susceptibility analyses: Case studies at different scales. Nat. Hazards Rev. 2021, 22, 05021007. [Google Scholar] [CrossRef]
  46. Southerland, L.; Zhou, W. Comparison of two logistic regression models for landslide susceptibility analysis through a case study. Environ. Eng. Geosci. 2021, 27, 471–486. [Google Scholar]
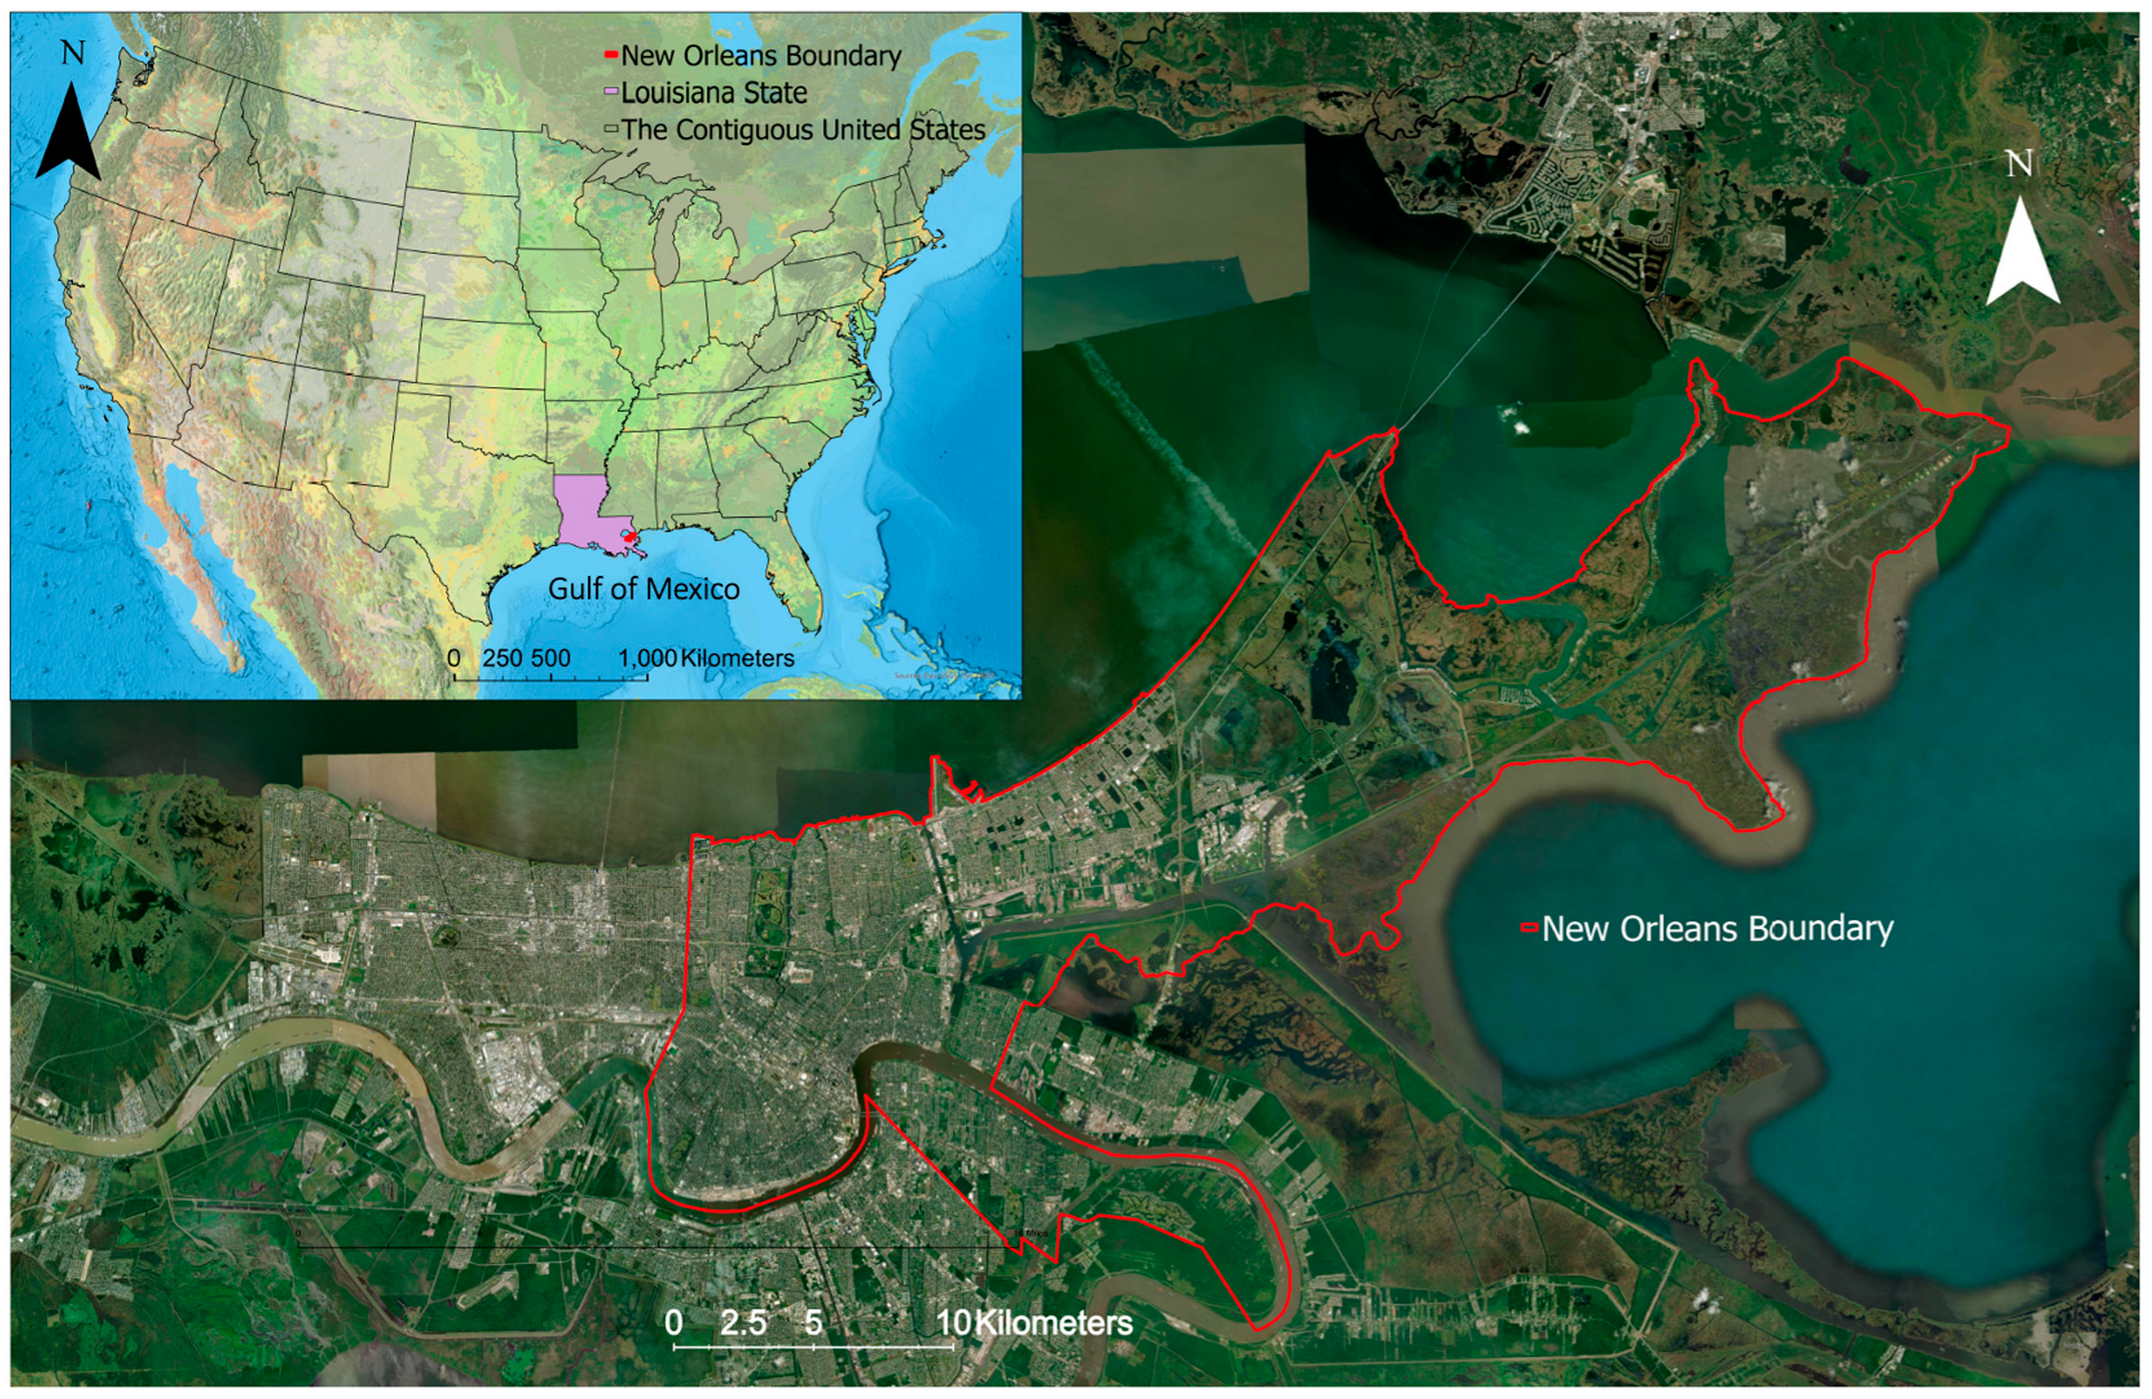
Figure 1. A map of New Orleans in Louisiana State, USA, shows the city’s location in the contiguous USA, the city’s boundary (in red), and the water bodies surrounding it.
Geohazards 05 00044 g001
Figure 2. This 2023 ground surface elevation map of New Orleans visualizes the city’s topography using data from the United States Geological Survey (UGSG) 3D Elevation Program. Elevation levels range from −2.26 m (−7.41 feet) to 5.96 m (19.56 feet), shown in a gradient from blue (lower elevations) to red (higher elevations).
Geohazards 05 00044 g002
Figure 3. Generalized cross-sectional schematic showing a natural levee crest formed by sediment deposition during flood events, with the levee backslope leading to adjacent low-lying areas (Modified from [20]).
Geohazards 05 00044 g003
Figure 4. The workflow for SVI calculation.
Geohazards 05 00044 g004
Figure 5. This series of MNDWI-derived flood risk maps for New Orleans, LA, from 2000 to 2020 categorizes flood risk into five levels: ‘Negligible’, ‘Minor’, ‘Significant’, ‘Major’, and ‘Severe’. The maps illustrate changes in flood risk over time using Landsat 5 ETM+ and Landsat 8 OLI data.
Geohazards 05 00044 g005
Figure 6. Moran’s I cluster analysis results for the Overall Theme across 2000, 2010, 2016, and 2020. The maps illustrate the spatial clustering of high and low SVI scores in New Orleans, showing high-high clusters (pale red), low-low clusters (pale blue), high-low clusters (true red), and low-high clusters (true blue).
Geohazards 05 00044 g006
Figure 7. SVI hot spot analysis using the Getis-Ord-Gi* statistic for the Overall Theme for 2000, 2010, 2016, and 2020. The maps highlight significant hot spots (shades of red) and cold spots (shades of blue) in New Orleans, LA, indicating areas with high and low social vulnerability, respectively.
Geohazards 05 00044 g007
Figure 8. SVI risk maps for New Orleans show changes in overall SVI scores from 2000 to 2020. The maps depict the distribution of five risk levels: ‘Negligible’ in blue, ‘Minor’ in purple, ‘Significant’ in pink, ‘Major’ in orange, and ‘Severe’ in yellow.
Geohazards 05 00044 g008
Figure 9. A simplified neighborhood boundary map of New Orleans. This map provides geographical context for interpreting the composite risk profiles generated from the overlay analysis of flooding and SVI risk assessments.
Geohazards 05 00044 g009
Figure 10. Composite risk maps derived from this study for New Orleans from 2000 to 2020, combining the MNDWI-derived flood risk and social vulnerability. The maps categorize risk into five levels: ‘Negligible’ in blue, ‘Minor’ in green, ‘Significant’ in yellow, ‘Major’ in orange, and ‘Severe’ in red, providing a visual representation of how risk distribution has evolved over the two decades.
Geohazards 05 00044 g010
Table 1. Summary of data sets utilized in the analyses.
DatasetData TypeData Source
Building Permits (2018)Feature ClassCity of New Orleans GIS
Flood Zone Map (2016, 2023)Feature Class LA State University, ESRI Living Atlas
Historical Imagery (2004–2023)ImageryGoogle Earth Pro
Ground Surface Elevation—30 m (2023)ImageryUnited States Geological Survey (USGS)
Historic Crests (MS River Station)Text File National Weather Service
Landsat 5 ETM+ C2 L2 (2000, 2010)Satellite ImageryUSGS
Landsat 8–9 OLI/TIRS C2 L2 (2015, 2020, 2023)Satellite ImageryUSGS
Orleans Parish BoundaryFeature ClassUnited States Census
Social Vulnerability Index (2000, 2010, 2016, 2020)Excel SpreadsheetCenters for Disease Control and Prevention
USA Detailed Water BodiesFeature ClassESRI Living Atlas
Table 2. Details of the Landsat imagery used in the study.
YearAcquisition DatePath/RowSpatial ResolutionDescription
200018 April022/03930 mLandsat 5 ETM+ C2 L2
201029 March
201613 MarchLandsat 8 OLI C2 L2
202021 February
Table 3. A list of variables, sorted by theme, to determine the Social Vulnerability Index (Adapted from ATSDR [38]).
ThemesVariables
Overall VulnerabilityTheme 1: Socioeconomic StatusBelow 150% Poverty
Unemployed
Housing Cost Burden
No High School Diploma
No Health Insurance
Theme 2: Household Characteristics and DisabilityAged 65 and Older
Aged 17 and Younger
Civilian with a Disability
Single-Parent Households
English Language Proficiency
Theme 3: Racial and Ethnic Minority StatusHispanic or Latino (of Any Race)
Black or African American
Asian
American Indian or Alaska Native
Native Hawaiian or Pacific Islander
Theme 4: Housing Type and TransportationMulti-Unit Structures
Mobile Homes
Crowding
No Vehicle
Group Quarters
Table 4. Global Moran’s I statistic for the spatial autocorrelation of SVI scores across four themes and overall vulnerability for 2000, 2010, 2016, and 2020. The table presents Moran’s Index (MI), Z-score, and p-value for each theme and overall score, indicating the presence and significance of spatial autocorrelation in social vulnerability.
YearThemeMIZ-Scorep-Value
2000Theme 10.4110321.0585850.160780
Theme 20.3601920.9768920.157249
Theme 30.2900800.6305430.184702
Theme 40.2828810.6921990.175980
Overall0.4077800.9619630.167249
2010Theme 10.3230680.8217970.169317
Theme 20.4140851.1493090.120244
Theme 30.2130160.3678350.175288
Theme 40.2248610.5103050.185805
Overall0.3464010.8766040.159512
Theme 10.4601401.1803110.133454
Theme 20.3590711.0044670.127298
2016Theme 30.3367180.7809580.150273
Theme 40.1724800.3892210.214547
Overall0.3805540.4596310.198585
Theme 10.4674261.2235170.119863
Theme 20.2502010.4974720.155912
2020Theme 30.5514251.4570200.114127
Theme 40.1896310.5342620.213180
Overall0.4172381.0350520.137502
Disclaimer/Publisher’s Note: The statements, opinions and data contained in all publications are solely those of the individual author(s) and contributor(s) and not of MDPI and/or the editor(s). MDPI and/or the editor(s) disclaim responsibility for any injury to people or property resulting from any ideas, methods, instructions or products referred to in the content.