Abstract
Slope stability analysis plays a crucial role in geotechnical engineering, particularly in regions susceptible to seismic activity. The inherent non-homogeneity and uncertainty of soil properties pose significant challenges in assessing slope stability under seismic conditions. To address these complexities, a novel and efficient methodology named DUBLA-PDM-PCK is proposed. In this methodology, the effects of soil non-homogeneity and uncertainty, along with the time and spatial variations of seismic loading, are systematically considered. The deterministic framework integrates discretized upper bound limit analysis (DUBLA) to accommodate soil non-homogeneous characteristics, and the pseudo-dynamic method (PDM) to model seismic loading variability. Then, a robust and efficient probabilistic analysis method, PCK-MA, is implemented utilizing adaptive Polynomial Chaos Kriging metamodeling, Monte Carlo Simulation, and Analysis of Covariance to investigate the uncertainty of the parameters. This approach treats nine key parameters, including soil cohesion, friction angle, non-homogeneous coefficients, horizontal and vertical seismic coefficients, period, and amplification factor, as random variables to assess their uncertainty effects on failure probability (stability level) and sensitivity indices. The DUBLA-PDM-PCK methodology offers a streamlined and reliable tool tailored for assessing slope stability in seismic environments, demonstrating notable efficiency in addressing soil variability and seismic loading uncertainties. Its application holds promise for guiding engineering practices and enhancing understanding of slope behavior in regions prone to seismic hazards.
1. Introduction
Landslides, characterized by the downward movement of rock, soil, and debris on a slope, represent prevalent geological disasters worldwide. These events occur as a result of various factors, such as heavy rainfall, human-induced modifications, or earthquakes, with earthquakes being particularly significant triggers of instability in susceptible regions. Earthquake-induced landslides pose substantial threats to natural environments and human infrastructure, causing widespread damage, altering landscapes, and resulting in loss of life. Moreover, inherent soil variability due to natural geological processes persists, and this variability can influence the probability of slope failure. Therefore, gaining a deeper understanding of slope seismic stability while considering uncertainties is crucial for mitigating the impacts of geohazards.
Numerous studies have been conducted offering valuable insights into the analysis of slope seismic stability [1,2,3,4,5,6]. However, certain limitations and shortcomings persist, which will be discussed in the following sections.
- (1)
- The pseudo-static method is widely adopted for its simplicity in considering seismic effects [5,7]. However, this method treats seismic effects as uniform inertial forces with constant accelerations, neglecting the dynamic aspects of earthquakes, including acceleration amplification, shaking duration, and intensity–frequency characteristics [1,8,9]. To address these limitations, the pseudo-dynamic approach has been introduced to account for time and space variations in ground shaking [10]. This method has been applied in various geotechnical contexts, including retaining walls [11], slopes [12], and tunnels [13]. However, it is predominantly used for deterministic analyses, often overlooking parameter uncertainties such as variations in amplification factor or seismic period, aspects that will be explored in this study.
- (2)
- Deterministic methods commonly employed for slope seismic analysis include the limit equilibrium method (LEM) [14,15], numerical simulation [2,6], and upper bound limit analysis (UBLA) [1,16,17]. However, the LEM lacks the capability to consider the soil stress–strain relationship, which can lead to biased outcomes due to assumptions regarding failure surfaces and inter-slice forces [18]. While numerical simulations can yield reasonable results, they often come with heavy computational burdens. The upper bound limit analysis offers a good balance of accuracy and efficiency; however, traditional approaches like the log-spiral mechanism may involve tedious integral calculations, especially for non-homogeneous cases [1]. To address these challenges, the discretized upper bound limit analysis (DUBLA) was introduced based on a “point-to-point” technique. DUBLA allows for the creation of a discretized mechanism with spatially varying soil parameters while ensuring computational efficiency by avoiding mass discretization [19]. In this study, DUBLA is utilized for slope seismic stability analysis to overcome the limitations of traditional methods and provide accurate and efficient results.
- (3)
- The probabilistic analysis of slope seismic stability employs various methods, including Monte Carlo Simulation (MCS) [2,3,4], Subset Simulation (SS) [12], and the First Order Reliability Method (FORM) [20]. However, sampling methods like MCS and SS are time-consuming as they require multiple simulations. Approximation methods such as FORM may not provide accurate estimates for complex cases due to assumptions of linear limit state surfaces. The active learning method has received much attention with the development of surrogate models (such as the metamodel and Artificial Neural Network) as cheap proxies of computational models [21]. Pan et al. [22] utilized Polynomial Chaos Expansion (PCE) metamodels to enhance the efficiency of slope seismic stability analyses, demonstrating the effectiveness of PCE metamodels in improving computational efficiency and accuracy in these analyses.
To enhance the performance of the active learning method in slope stability analysis, this study implements an advanced approach based on Polynomial Chaos Kriging (PCK) metamodeling. PCK combines the benefits of Polynomial Chaos Expansion (PCE) and Kriging interpolation, offering a more efficient solution compared to using PCE and Kriging independently. Additionally, traditional probabilistic methods such as Monte Carlo Simulation (MCS) are applied to generate comprehensive results, including Failure Probability (Pf), Probability Density Function (PDF), Cumulative Distribution Function (CDF), and statistical moments of the system response. This integrated approach leverages the strengths of PCK metamodeling and traditional probabilistic methods to enhance the accuracy and efficiency of slope stability analysis.
Furthermore, in probabilistic analysis, several random variables are considered, and it is valuable to investigate the impact of these input variables on the model response through sensitivity analyses. Global Sensitivity Analysis (GSA), which comprehensively assesses the entire space of input variables, is a widely utilized technique [23,24]. In this study, Analysis of Covariance (ANCOVA), a type of GSA, will be employed to generate informative sensitivity indices, particularly for correlated input variables. This approach aims to provide insights into the relative importance and interactions of different parameters on the outcomes of the slope stability analysis.
This study introduces an efficient methodology, DUBLA-PDM-PCK, which combines DUBLA, the PDM, and PCK to facilitate a rapid and reliable assessment of slope stability in seismic-prone regions with consideration of the soil non-homogeneity and parameter uncertainty effects. The methodology is initially presented, followed by its implementation. The effectiveness of DUBLA-PDM-PCK is then validated through comparison with existing studies. Discussions are conducted on topics related to slope seismic stability and uncertainties in parameters. Additionally, sensitivity analyses are performed to determine the importance of different parameters in the analysis.
2. Deterministic Seismic Analysis of the Slope Stability
The analysis focuses on the seismic stability of a non-homogeneous slope. This section aims to outline the fundamental principles and the optimization process for determining the safety factor.
2.1. Pseudo-Dynamic Method
The pseudo-static method simplifies seismic loadings by assuming uniform accelerations applied to structures, where both horizontal and vertical seismic accelerations remain constant. This approach overlooks the dynamic nature of earthquake motions. In contrast, the pseudo-dynamic approach accounts for amplitude and phase variations in seismic vibrations, as well as the period of ground shaking. This method offers a more realistic representation of dynamic effects compared to the pseudo-static method, while retaining computational simplicity relative to fully dynamic analyses [1,12].
The propagation of seismic waves in soils is influenced by wave velocities, specifically shear wave velocity and primary wave velocity . These velocities can be expressed as:
where , , and are the soil shear modulus, density, and Poisson’s ratio.
The vibrational effects are amplified as seismic waves propagate toward the ground surface. The PDM assumes the magnitudes of the horizontal and vertical seismic accelerations ( and ) increase linearly from the slope base to the ground surface with an amplification factor , and the seismic accelerations can be represented by and .
Additionally, a sinusoidal function is used to model the seismic wave, which simplifies analysis and enhances comprehension. Both horizontal and vertical shakings have the same period, denoted as T. The horizontal acceleration and vertical acceleration for any time t and depth h, can be determined by
where and are the horizontal and vertical seismic coefficients, respectively, and is the gravity acceleration. denotes the angular frequency of the seismic shaking and can be determined by for the sinusoidal wave [1,12,16].
2.2. Discretized Upper Bound Limit Analysis
Figure 1a illustrates the mechanism of the discretized upper bound limit analysis (DUBLA). H and β, respectively, represent the slope depth and angle. A coordinate system is established with the slope toe C as the origin point. The mechanism rotates around the rotational center O with an angular velocity ω. The mechanism is related to the determination of two parameters, including the (length of OC) and (the angle between x axis direction and line OC). The slip surface AC is discretized into a series of straight segments . It is important to note that each segment should form an angle with the velocity vector to satisfy the associated flow rule. Therefore, the generation process aims to define all the discretization points .
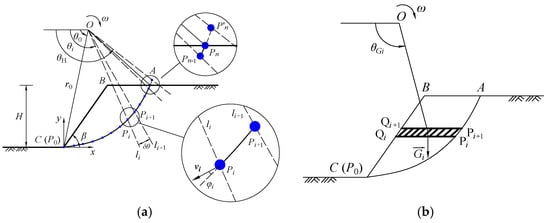
Figure 1.
DUBLA (a) discretized mechanism and (b) work rate calculation.
A “point-to-point” technique is implemented to determine along the critical slip surface, where each point is derived sequentially from the previous one. is also introduced to control the accuracy of the failure mechanism and it is often set as 0.1°, which is recommended as a great combination of accuracy and time cost [25]. The formulation of the generation can be expressed as
where and are point coordinates in horizontal and vertical directions, and the polar angle for line is . A linear interpolation method is subsequently implemented to adjust the last generated point on the slope crest (point A).
2.3. Stability Analysis
The kinematic approach uses the work rate balance equation [26], which states that the external work rate W is equal to the energy dissipation D, to evaluate the sliding event. Herein, the energy dissipation D occurred along the slip surface, which is governed by an associated flow rule and is calculated by summing the energy dissipation of discretized elements due to the sliding surface discretization:
where and denote the cohesion and friction angle at point , is the length of segment , and is the distance between point O and point .
The external work rate W is contributed to by the weight of the collapse block (WG) and the forces induced by earthquakes (WH and WV, respectively, for the horizontal and vertical directions), which can be defined as
where is the unit weight and is the area of the discretized element. An infinitesimal trapezoidal element as depicted in Figure 1b is utilized given that seismic accelerations are uniform at the same depth. represents the distance between the rotating center O and the centroid and is the angle between and the horizontal direction; h is the ordinate of .
Following the determination of work rates, the shear strength is implemented to calculate safety factor for a given slip surface. An optimization work is given with respect to three parameters, including , and t.
An optimization strategy utilizing both a bisection approach and genetic algorithm methods is employed to determine the critical value of . Further details can be found in Zhang et al. [12].
3. Probabilistic Analysis
This section provides a concise overview of the probabilistic methods utilized in this study, namely the metamodel PCK, MCS, and ANCOVA. Additionally, a procedural outline of the probabilistic analysis is presented.
3.1. Presentation of the Used Probabilistic Methods
3.1.1. Metamodel: PCK
The Polynomial Chaos Kriging (PCK) method integrates the strengths of Polynomial Chaos Expansion (PCE) and Kriging. It employs a sparse set of orthonormal polynomials to capture the global behavior of the computational model and utilizes Kriging to address local variability in model outputs [27]. This approach facilitates the development of an efficient and accurate metamodel compared to using PCE and Kriging separately [28]. The basic function can be expressed as
where x is a vector with input random variables, is the model output approximation using PCK, and A is the index set of polynomials. is the sum of orthonormal polynomials, which is used to capture the trend within the universal Kriging framework. To ensure practical feasibility, it is necessary to truncate this sum to a finite number of terms. Standard truncation methods can be inefficient, especially for high-dimensional problems. An improved hyperbolic truncation scheme proposed by Blatman and Sudret [29] is used in this study for more efficient model approximation.
The model construction involves determining a multivariate polynomial basis , which is the tensor product of univariate orthonormal polynomials, and the corresponding unknown coefficients , which are estimated by the least-square minimization method [30]. Various families of univariate orthonormal polynomials are considered, with Hermite polynomials corresponding to standard normal random variables used in this study. Additionally, Sparse Polynomial Chaos Expansion (SPCE) is implemented using the Least Angle Regression (LAR) algorithm to select important candidate polynomial bases. Insignificant PCE coefficients are then discarded to reduce the number of polynomials.
and denote, respectively, the variance and the zero mean. The unit variance stationary Gaussian process is defined by an autocorrelation function between two sample points , where is the hyper-parameter to be estimated. Several autocorrelation functions have been proposed, i.e., linear, exponential, Gaussian, and Matern functions. The Matern-5/2 model is adopted as the autocorrelation function in this study [31].
3.1.2. Reliability and Sensitivity Methods
The limit state function for the slope stability can be expressed as
where and are, respectively, the limiting safety factor and the calculated safety factor. The slope is considered a failure when exceeds .
The failure probability can then be determined directly based on the crude sampling method MCS [32], and can be expressed as
where is the size of the Monte Carlo population, and the indicator function is equal to 1 for G(x) < 0 and to 0 for G(x) ≥ 0. While the increased samples enhance accuracy, more computational effort is necessary. To balance computational accuracy and efficiency, the coefficient of variation for is introduced and can be expressed as
The value of should be below one specified threshold value, which is often determined as 0.05.
For sensitivity analysis, the Analysis of Covariance (ANCOVA)-based GSA, which can consider the dependence between the considered random variables, is implemented in this study to analyse the impacts of parameters on the model response. Three parts are considered for the sensitivity indices calculation, including , and , which denote the un-correlative index of , and the interactive and correlative index of , respectively. represents the independent contributions, while and denote the dependent contributions, which can be defined by
where denotes the univariate component function(s), and Y is the full PCE.
The sensitivity index can then be obtained by the sum of these three parts [33].
3.2. Automation of Probabilistic Analysis
The PCK metamodel-based probabilistic analysis is conducted to reduce computational burden, leveraging the efficiency of metamodel construction. Subsequent probabilistic methods (such as MCS and ANCOVA) are performed using the metamodel to derive probabilistic results. It is crucial to ensure the accuracy of the metamodel for reliable analysis. However, using a single set of experimental design (ED) may not suffice for constructing a highly accurate metamodel. Therefore, enriching the ED is necessary to enhance its representativeness and ability to capture the complexities of computationally expensive models. Detailed information about the proposed DUBLA-PDM-PCK procedure can be found in Figure 2 and is provided below for reference.
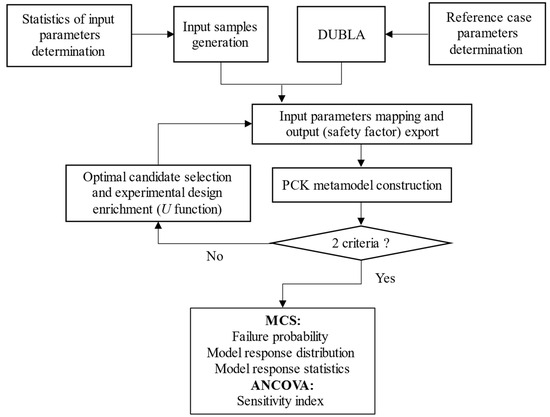
Figure 2.
Flow chart of the proposed DUBLA-PDM-PCK.
- Step 1: Preparation.
- Construct a deterministic model for slope seismic stability;
- Determine the statistical information of considered parameters (i.e., the distribution, mean value, coefficient of variation, and the cross-correlation coefficient);
- Step 2: Input–output sets’ determination.
- Generate an initial experimental design NED based on the given statistical information and a large number of samples SPf used for the failure probability Pf calculation. NED is set to be 2NRV [34], and NRV is the number of considered random variables.
- Compile the batch commands of MATLAB and map the generated samples on the deterministic models;
- Export the model response (i.e., the safety factor) based on the DUBLA and save the results automatically.
- Step 3: PCK model construction.
- Construct a PCK metamodel based on the input–output sets;
- Evaluate the Pf based on the metamodel PCK.
- Step 4: Accuracy control (two stopping criteria need to be satisfied).
- The first one is related to the leave-one-out (LOO) error of the PCK metamodel as presented by
The second one corresponds to the failure probability convergence, which can be determined by
where , and and are the Pf values for the (i − 1)th and ith iterations. i is in the range of , where is the enrichment samples number, and is the required comparative failure probabilities. is the threshold value for the failure probability error. Both threshold values (i.e., the and ) are set as 0.01 to ensure the metamodel’s accuracy.
Metamodel construction cannot be finished until the criteria are met. Conversely, the informative samples from the SPf need to be selected to enrich the ED for the metamodel’s construction. The learning function used in this study is U function and can be defined as
The newly added sample is chosen by [34,35].
- Step 5: Post-processing of MCS results.
- Perform MCS and ANCOVA based on the well-built PCK metamodel;
- Perform post-processing of the probabilistic results, including the failure probability, the statistical moments, the PDF/CDF of the model response, and the sensitivity indices.
4. Comparison and Validation
This section presents the probabilistic analysis of slope seismic stability based on the proposed DUBLA-PDM-PCK methodology to indicate its efficiency and accuracy. A slope exhibiting linear variation of shear strength parameters with depth is considered, followed by probabilistic analyses and comparison of results.
4.1. Problem Statement
A non-homogeneity case presented in Figure 3, which assumes that the soil friction angle and cohesion vary linearly with depth (referred to as the depth-dependent case), is discussed.

Figure 3.
Depth-dependent geometry.
and represent the friction angle and cohesion at h1. and denote the friction angle and cohesion at a depth of h2. In this context, h1 and h2 are set to 0 and H, which means that and are the friction angle (cohesion) at the slope crest and H below the slope crest, respectively. and are the dimensionless non-homogeneity coefficients and can be defined as
The slope soil is homogeneous when and .
In probabilistic analysis, the dimensionless coefficients of cohesion and friction angle, the cohesion and friction angle at slope crest, and the unit weight are considered as random variables. In addition, the uncertainties of the horizontal and vertical seismic coefficients, seismic period, and the amplification factor are accounted for. Table 1 summarizes the detailed parameter information for the reference case [1,36,37].

Table 1.
Parameters of the reference case.
4.2. Probabilistic Results for the Reference Case
In this subsection, a comprehensive probabilistic analysis for the reference case outlined in Section 4.1 is provided using the DUBLA-PDM-PCK procedure.
Initially, an ED comprising 18 samples is generated, which is followed by the initial metamodel PCK. Subsequently, an iterative process is initiated involving the enrichment of the ED and refinement of the PCK metamodel until specific criteria (the LOO and Pf convergence) are met. The iterative process, illustrated in Figure 4, demonstrates that the leave-one-out error is satisfied (as presented in Equation (14)) after the enrichment of five samples. The failure probability is converged from the 62nd sample and the following 10 satisfy the requirements of Equation (15). Therefore, a total of 90 evaluations, including 18 initial EDs and 72 enrichments, are employed to construct the PCK metamodel. Subsequently, the MCS and ANCOVA are conducted to derive probabilistic results.
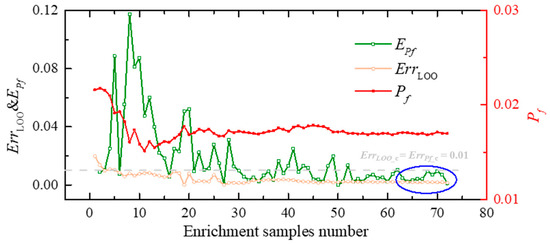
Figure 4.
Iterative procedure of the metamodel construction.
Following the MCS analysis, the failure probability, probability density functions (PDFs), and cumulative distribution functions (CDFs) of the calculated safety factors, and corresponding statistical moments, are determined. The results are illustrated in Figure 5. The analysis reveals a failure probability of 1.65 × 10⁻² with safety factors predominantly distributed around 1.4. The CDF provides a clear representation of the failure probability based on the safety factor distribution.
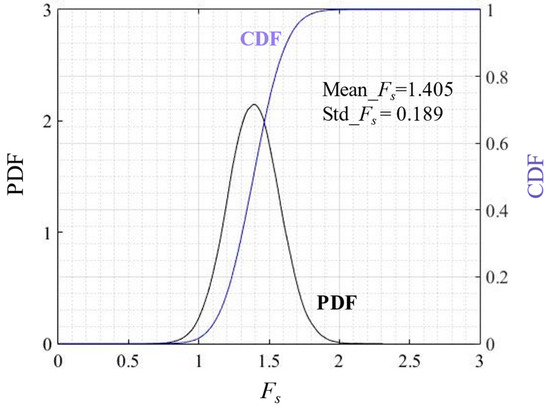
Figure 5.
PDF and CDF of the calculated safety factors.
The sensitivity analysis (as presented in Figure 6) reveals that the ANCOVA indices of the friction angle and its non-homogeneity coefficient, as well as the horizontal seismic coefficient, are relatively significant compared to the cohesion and its non-homogeneity coefficient. Additionally, for the seismic parameters, the amplification factor is identified as important, whereas the vertical seismic coefficient and seismic period exhibit minor influences on slope seismic stability. These findings underscore the importance of considering soil non-homogeneity and spatial variations in seismic loading for accurate slope stability analysis.
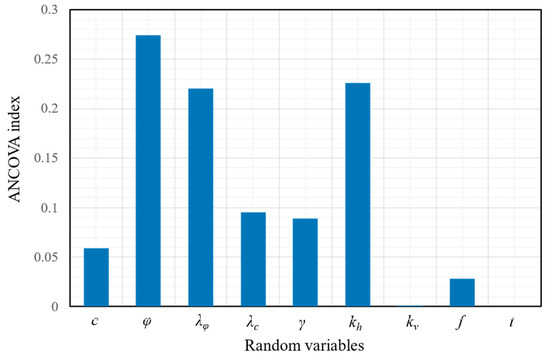
Figure 6.
ANCOVA index for the considered random variables.
4.3. Comparison and Validation
To validate the accuracy and precision of the developed DUBLA-PDM-PCK, some comparisons with the existing studies are carried out and can be found below.
4.3.1. With MCS
The accuracy of the metamodel is validated by comparing safety factors (from 1000 samples generated by LHS) evaluated using the PCK metamodel against those obtained from the analytical method DUBLA. The results are illustrated in Figure 7. The analysis reveals that nearly all scatter points fall within ±5% of the diagonal line, indicating a close correspondence between safety factors derived from the PCK metamodel and those from the DUBLA method. This validation confirms the accuracy of the PCK metamodel.
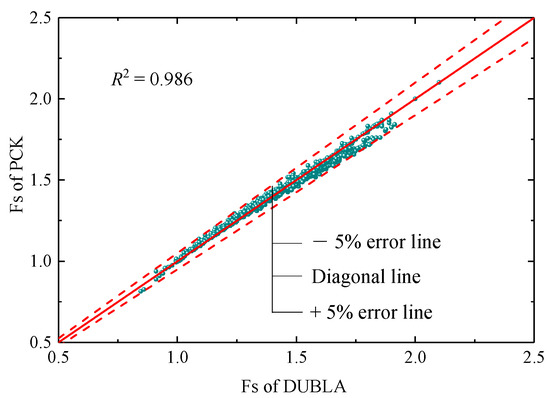
Figure 7.
Safety factors’ comparison evaluated by PCK and DUBLA models.
However, it should be noted that conducting MCS calculations requires at least 24,000 samples when the coefficient of variation of the failure probability COVPf is less than 5%, which can be time-consuming. Additionally, sensitivity analysis typically necessitates around 9000 deterministic simulations. In contrast, the proposed DUBLA-PDM-PCK procedure achieves probabilistic results using just 90 samples, significantly reducing computational effort.
4.3.2. With Kriging and SPCE
Metamodel-based probabilistic methods like Kriging and SPCE-based MCS are also employed in this study for slope seismic probabilistic analysis, aiming to assess the performance of the proposed DUBLA-PDM-PCK methodology. A detailed comparison is provided in Table 2 and illustrated in Figure 8 to elucidate the relative effectiveness of different approaches.

Table 2.
Comparison of the failure probability based on three methods.
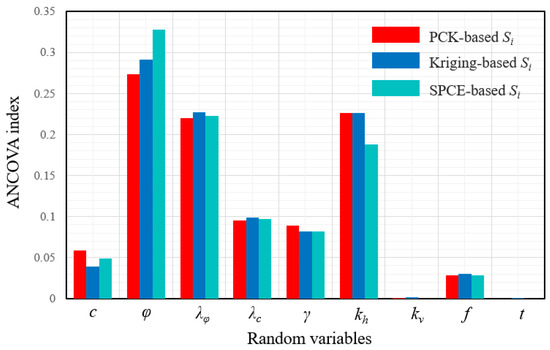
Figure 8.
ANCOVA indices for different metamodel-based sensitivity analyses.
These three methods demonstrate similar probabilistic results, including failure probability, mean, and standard deviation of the safety factor (as presented in Table 2), along with sensitivity indices (depicted in Figure 8). This consistency validates the accuracy of the DUBLA-PDM-PCK methodology. However, it is noteworthy that the PCK method only requires 90 simulations for metamodel construction, whereas the Kriging and SPCE methods necessitate more (110 and 113 simulations, respectively), indicating greater computational effort with the latter approaches.
Furthermore, the performance of metamodels in predicting safety factors is discussed and summarized using a graphical Taylor diagram (Figure 9), which considers standard deviation (represented by black circles), root mean square error (RMSE, indicated by green circles), and correlation coefficient (depicted by blue lines). Using 1000 samples, as mentioned in Figure 7, the Kriging and PCE metamodels predict the corresponding values for evaluation. The RMSE and correlation coefficient of observed values (DUBLA) are 0 and 1, respectively. The metamodel showing the highest similarity to the observed results is considered the most effective. The PCK method demonstrates superior performance, being closest to the observed point with corresponding indicator values (correlation coefficient, RMSE, standard deviation) of 0.986, 0.024, and 0.189, respectively.
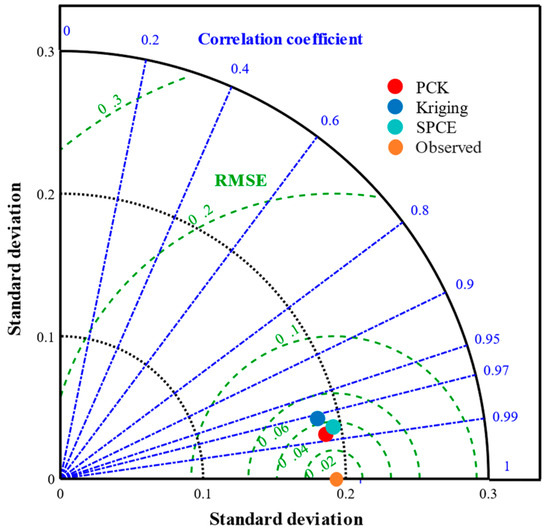
Figure 9.
Metamodels’ performance comparison.
In summary, the proposed DUBLA-PDM-PCK procedure offers cost-effective probabilistic analysis with accurate results, making it highly recommended for slope seismic stability assessments.
5. Discussion
This section delves into the effects of soil non-homogeneity, correlation coefficients, and seismic forces on slope seismic stability. Various results are presented for discussion, encompassing failure probability, distributions, statistical moments of system response, and sensitivity indices. Unless otherwise specified, parameters align with those detailed in the reference case outlined in Table 1. Further details are provided below.
5.1. Influence of the Soil Non-Homogeneity
The non-homogeneity coefficient is often assumed to be a fixed value, yet its actual variability due to spatial variations and soil sedimentation necessitates consideration. Therefore, it is crucial to explore the effects of uncertainty associated with the non-homogeneity coefficient. Different coefficients of variation of the non-homogeneity coefficient for the friction angle and the cohesion on the probabilistic results are discussed. Figure 10 illustrates these results, showing that as the COV values of the non-homogeneity coefficient increase, the failure probability also increases, with corresponding sensitivity indices exhibiting significant growth. For instance, the sensitivity index can reach up to 0.4 when the COV value is 0.25. Therefore the soil non-homogeneity cannot be ignored for the slope stability analysis, particularly given the substantial uncertainty associated with the non-homogeneity coefficient.
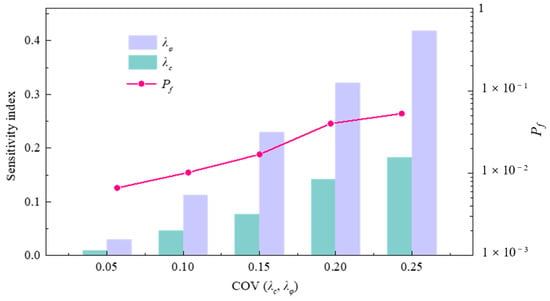
Figure 10.
Probabilistic results for different COV values of the non-homogeneity coefficients.
5.2. Influence of Cross-Correlation Coefficients
In this section, the correlation coefficient is examined to assess its impact on slope seismic stability; specifically, how the correlation between cohesion and the friction angle influences outcomes. The results are detailed in Figure 11. The analysis reveals that as the correlation coefficient increases, the failure probability also rises. This relationship is attributed to lower cohesion and higher friction angle combinations associated with smaller correlation coefficients. Conversely, larger correlation coefficients result in more extreme scenarios where cohesion and friction angle values are simultaneously low or high, leading to notably varied safety factors.
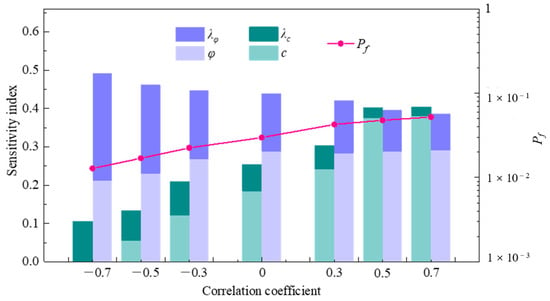
Figure 11.
Probabilistic results with different correlation coefficients.
This relationship is further illustrated in Figure 12, which shows the PDF of the safety factor under different correlation coefficients. The wider PDF curves observed with increasing correlation coefficients contribute to higher failure probabilities.
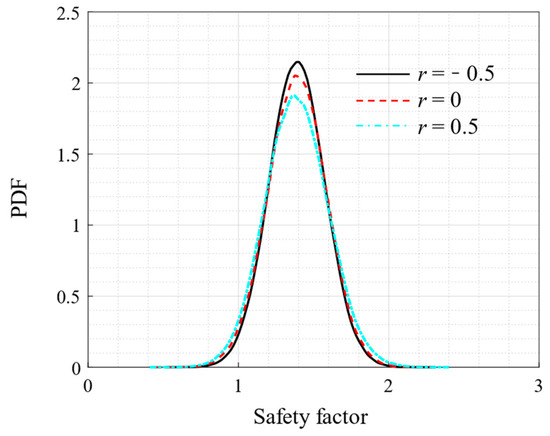
Figure 12.
The PDFs with different correlation coefficients.
Additionally, Figure 11 presents the sensitivity indices of strength-related parameters (cohesion and friction angle at the slope crest) and their corresponding non-homogeneity coefficients. Observations reveal that with an increase in the correlation coefficient, the sensitivity indices of cohesion-related parameters increase, while those related to the friction angle decrease. When the correlation coefficient exceeds 0.5, cohesion sensitivity indices can surpass those of friction angles. Therefore, the correlation coefficient plays a significant role in the slope probabilistic stability analysis and should be determined with attention. In addition, the sensitivity indices of the non-homogeneity coefficients are decreased with the increase in the correlation coefficient, while the strength parameters at the slope crest are more significant.
5.3. Influence of the Seismic Effects
The seismic coefficient represents earthquake intensity, and a range of [0.1, 0.3] with an interval of 0.05 is examined, as illustrated in Figure 13. There is no doubt that with the increase in the horizontal seismic coefficient, the failure probability increases significantly. The observed failure probabilities range from 3.71 × 10⁻⁴ to 1.31 × 10⁻¹, corresponding to “good” and “unsatisfactory” performance levels in practical terms. [38]. Therefore, determining the horizontal seismic coefficient is crucial for slope stability analysis, given its substantial impact on failure probability.
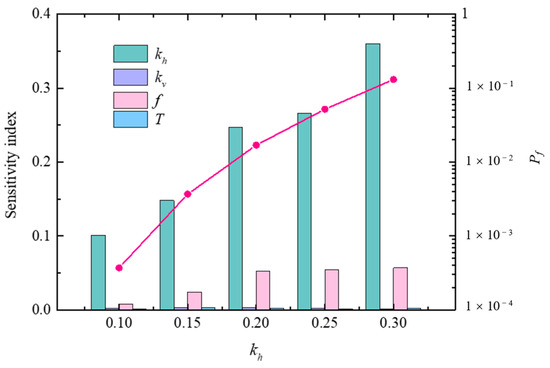
Figure 13.
Probabilistic results with different kh values.
Furthermore, Figure 13 presents the sensitivity indices of seismic-related parameters. The analysis reveals that the sensitivity index of the horizontal seismic coefficient increases with higher kh values. Conversely, the vertical seismic coefficient shows only a slight effect on slope stability. Notably, the amplification factor demonstrates greater significance compared to seismic duration, underscoring the importance of spatial variations in seismic loading for slope stability.
6. Conclusions
An efficient solution for probabilistic slope seismic stability analysis is provided in this study, and the main contributions and conclusion can be summarized as follows:
- (1)
- A comprehensive method, DUBLA-PDM-PCK, is proposed to investigate slope seismic stability by combining the DUBLA analytical method with PCK-metamodel-based MCS and ANCOVA (PCK-MA). This approach accounts for soil non-homogeneity, time and space variations in seismic loading, and uncertainties in parameters such as soil strength and seismic characteristics.
- (2)
- DUBLA-PDM-PCK enables affordable probabilistic analysis with high accuracy and fewer deterministic simulations compared to other methods like crude Monte Carlo Simulation, Kriging, and SPCE-based probabilistic approaches. Additionally, sensitivity indices are provided to assess the importance of considered random variables, offering valuable insights for designers.
- (3)
- The effects of soil non-homogeneity, cross-correlation coefficient, and seismic factors on slope probabilistic stability are discussed. The results highlight the importance of considering soil non-homogeneity and spatial variations in seismic loading for slope seismic stability analysis, which means that the parameters’ determination should be given attention.
- (4)
- As the cross-correlation coefficient of cohesion and friction angle increases, the slope stability decreases and the effects of the friction angle-related parameters on the safety factor decreases. Moreover, the effects of the non-homogeneity coefficient uncertainty decrease with the increase in the cross-correlation coefficient.
- (5)
- The horizontal seismic coefficient and amplification factor significantly impact results, with the former showing pronounced effects as it increases. In contrast, the vertical seismic coefficient and seismic period have less influence on outcomes.
This paper provides valuable insights into deterministic and probabilistic analyses of slope stability under seismic loads. However, certain limitations persist, including the treatment of shear strength parameters (cohesion and friction angle) as random variables for simplicity, despite their spatial variability in practice. The spatial variability will be addressed in future research endeavors.
Author Contributions
Conceptualization, T.Z. and D.D.; methodology, T.Z. and D.D.; software, T.Z.; validation, T.Z. and D.D.; formal analysis, T.Z. and D.D.; investigation, T.Z.; resources, T.Z. and D.D.; data curation, T.Z.; writing—original draft preparation, T.Z.; writing—review and editing, D.D.; visualization, D.D.; supervision, D.D.; project administration, D.D.; funding acquisition, T.Z. All authors have read and agreed to the published version of the manuscript.
Funding
This research was funded by the China Scholarship Council for providing a PhD Scholarship (CSC No. 201906690049).
Data Availability Statement
The data that support the findings of this study are available from the corresponding author upon reasonable request.
Acknowledgments
The authors thank gratefully the China Scholarship Council for providing a PhD Scholarship (CSC No. 201906690049). The financial support is greatly appreciated.
Conflicts of Interest
Author Daniel Dias was employed by the company Antea Group. The remaining authors declare that the research was conducted in the absence of any commercial or financial relationships that could be construed as a potential conflict of interest.
References
- Pan, Q.-J.; Qu, X.-R.; Wang, X. Probabilistic seismic stability of three-dimensional slopes by pseudo-dynamic approach. J. Central South Univ. 2019, 26, 1687–1695. [Google Scholar] [CrossRef]
- Xing, L.; Gong, W.; Li, B.; Zhao, C.; Tang, H.; Wang, L. Computers and Geotechnics Probabilistic Analysis of Earthquake-induced Failure and Runout Behaviors of Rock Slopes with Discrete Fracture Network. Comput. Geotech. 2023, 159, 105487. [Google Scholar] [CrossRef]
- Li, L.; Li, C.; Wen, J.; Yu, G.; Cheng, Y.; Xu, L. Computers and Geotechnics Probabilistic seismic slope stability analysis using swarm response surfaces and rotational Newmark sliding model with primary sliding direction. Comput. Geotech. 2023, 163, 105754. [Google Scholar] [CrossRef]
- Pisano, M.; Cardile, G. Probabilistic Analyses of Root-Reinforced Slopes Using Monte Carlo Simulation. Geosciences 2023, 13, 75. [Google Scholar] [CrossRef]
- Cabanzo, C.M.; Tinoco, J.; Sousa, H.S.; Coelho, M.; Matos, J.C. Computers and Geotechnics Adaptation of traditional risk-based methodology for slopes to probabilistic-based approach integrating surrogate models. Comput. Geotech. 2023, 161, 105577. [Google Scholar] [CrossRef]
- Burgess, J.; Fenton, G.A.; Griffiths, D. V Probabilistic seismic slope stability analysis and design. Can. Geotech. J. 2019, 56, 1979–1998. [Google Scholar] [CrossRef]
- Huang, H.W.; Wen, S.C.; Zhang, J.; Chen, F.Y.; Martin, J.R.; Wang, H. Reliability analysis of slope stability under seismic condition during a given exposure time. Landslides 2018, 15, 2303–2313. [Google Scholar] [CrossRef]
- Sanchez Lizarraga, H.; Lai, C.G. Effects of spatial variability of soil properties on the seismic response of an embankment dam. Soil Dyn. Earthq. Eng. 2014, 64, 113–128. [Google Scholar] [CrossRef]
- Zucca, M.; Valente, M. On the limitations of decoupled approach for the seismic behaviour evaluation of shallow multi-propped underground structures embedded in granular soils. Eng. Struct. 2020, 211, 110497. [Google Scholar] [CrossRef]
- Steedman, R.S.; Zeng, X. The influence of phase on the calculation of pseudo-static earth pressure on a retaining wall. Geotechnique 1990, 40, 103–112. [Google Scholar] [CrossRef]
- Choudhury, D.; Nimbalkar, S. Seismic rotational displacement of gravity walls by pseudo-dynamic method: Passive case. Soil Dyn. Earthq. Eng. 2007, 27, 242–249. [Google Scholar] [CrossRef]
- Zhang, T.; Guo, X.; Dias, D.; Sun, Z. Dynamic probabilistic analysis of non-homogeneous slopes based on a simplified deterministic model. Soil Dyn. Earthq. Eng. 2021, 142, 106563. [Google Scholar] [CrossRef]
- Zhang, B.; Jiang, J.; Zhang, D.B.; Liu, Z. Upper bound solution of collapse pressure and permanent displacement of 3D tunnel faces using the pseudo-dynamic method and the kinematic approach. Geomech. Eng. 2021, 25, 521. [Google Scholar]
- Ji, J.; Zhang, W.; Zhang, F.; Gao, Y.; Lü, Q. Reliability analysis on permanent displacement of earth slopes using the simplified bishop method. Comput. Geotech. 2020, 117, 103286. [Google Scholar] [CrossRef]
- Liu, X.; Li, D.Q.; Cao, Z.J.; Wang, Y. Adaptive Monte Carlo simulation method for system reliability analysis of slope stability based on limit equilibrium methods. Eng. Geol. 2020, 264, 105384. [Google Scholar] [CrossRef]
- Hou, C.; Zhang, T.; Sun, Z.; Dias, D.; Shang, M. Seismic analysis of nonhomogeneous slopes with cracks using a discretization kinematic approach. Int. J. Geomech. 2019, 19, 04019104. [Google Scholar] [CrossRef]
- Zhang, Z.L.; Yang, X.L. Unified solution of safety factors for three-dimensional compound slopes considering local and global instability. Comput. Geotech. 2023, 155, 105227. [Google Scholar] [CrossRef]
- Leshchinsky, B.; Ambauen, S. Limit Equilibrium and Limit Analysis: Comparison of Benchmark Slope Stability Problems. J. Geotech. Geoenvironmental Eng. 2015, 141, 04015043. [Google Scholar] [CrossRef]
- Du, D.; Zhuang, Y.; Sun, Q.; Yang, X.; Dias, D. Bearing capacity evaluation for shallow foundations on unsaturated soils using discretization technique. Comput. Geotech. 2021, 137, 104309. [Google Scholar] [CrossRef]
- Cho, S.E. First-order reliability analysis of slope considering multiple failure modes. Eng. Geol. 2013, 154, 98–105. [Google Scholar] [CrossRef]
- Marelli, S.; Sudret, B. UQLab: A framework for uncertainty quantification in Matlab. In Proceedings of the 2nd International Conference on Vulnerability and Risk Analysis and Management (ICVRAM 2014), Liverpool, UK, 13–16 July 2014; pp. 2554–2563. [Google Scholar]
- Pan, Q.; Leung, Y.; Hsu, S. Geoscience Frontiers Stochastic seismic slope stability assessment using polynomial chaos expansions combined with relevance vector machine. Geosci. Front. 2021, 12, 405–414. [Google Scholar] [CrossRef]
- Zhang, T.; Baroth, J.; Dias, D. Probabilistic basal heave stability analyses of supported circular shafts in non-homogeneous clayey soils. Comput. Geotech. 2021, 140, 104457. [Google Scholar] [CrossRef]
- Zhang, T.; Baroth, J.; Dias, D. Deterministic and probabilistic basal heave stability analysis of circular shafts against hydraulic uplift. Comput. Geotech. 2022, 150, 104922. [Google Scholar] [CrossRef]
- Sun, Z.; Li, J.; Pan, Q.; Dias, D.; Li, S.; Hou, C. Discrete kinematic mechanism for nonhomogeneous slopes and its application. Int. J. Geomech. 2018, 18, 04018171. [Google Scholar] [CrossRef]
- Man, J.; Huang, H.; Ai, Z.; Chen, J.; Wang, F. Stability of complex rock tunnel face under seepage flow conditions using a novel equivalent analytical model. Int. J. Rock Mech. Min. Sci. 2023, 170, 105427. [Google Scholar] [CrossRef]
- Schöbi, R.; Sudret, B.; Wiart, J. Polynomial-Chaos-based Kriging. Int. J. Uncertain. Quantif. 2015, 5, 171–193. [Google Scholar] [CrossRef]
- Schöbi, R.; Sudret, B.; Marelli, S. Rare Event Estimation Using Polynomial-Chaos Kriging. ASCE-ASME J. Risk Uncertain. Eng. Syst. Part A Civ. Eng. 2017, 3, D4016002. [Google Scholar] [CrossRef]
- Blatman, G.; Sudret, B. Adaptive sparse polynomial chaos expansion based on least angle regression. J. Comput. Phys. 2011, 230, 2345–2367. [Google Scholar] [CrossRef]
- Pan, Q.; Qu, X.; Liu, L.; Dias, D. A sequential sparse polynomial chaos expansion using Bayesian regression for geotechnical reliability estimations. Int. J. Numer. Anal. Methods Geomech. 2020, 44, 874–889. [Google Scholar] [CrossRef]
- Marelli, S.; Sudret, B. UQLab: A framework for Uncertainty Quantification in MATLAB. Vulnerability Uncertain. Risk Quantif. Mitig. Manag. 2014, 2554–2563. [Google Scholar] [CrossRef]
- Guo, X.; Dias, D. A Practical Framework for Probabilistic Analysis of Embankment Dams. In Dam Engineering—Recent Advances in Design and Analysis; Intechopen: London, UK, 2021. [Google Scholar] [CrossRef]
- Man, J.; Zhang, T.; Huang, H.; Dias, D. Probabilistic analysis of tunnel face seismic stability in layered rock masses using polynomial Chaos Kriging metamodel. J. Rock Mech. Geotech. Eng. 2023, in press. [CrossRef]
- Guo, X.; Du, D.; Dias, D. Reliability analysis of tunnel lining considering soil spatial variability. Eng. Struct. 2019, 196, 109332. [Google Scholar] [CrossRef]
- Zhou, S.; Guo, X.; Zhang, Q.; Dias, D.; Pan, Q. Influence of a weak layer on the tunnel face stability—Reliability and sensitivity analysis. Comput. Geotech. 2020, 122, 103507. [Google Scholar] [CrossRef]
- Li, D.Q.; Zheng, D.; Cao, Z.J.; Tang, X.S.; Phoon, K.K. Response surface methods for slope reliability analysis: Review and comparison. Eng. Geol. 2016, 203, 3–14. [Google Scholar] [CrossRef]
- Luo, Z.; Atamturktur, S.; Cai, Y.; Juang, C.H. Simplified approach for reliability-based design against basal-heave failure in braced excavations considering spatial effect. J. Geotech. Geoenviron. Eng. 2012, 138, 441–450. [Google Scholar] [CrossRef]
- Kamien, D.J. Engineering and design: Introduction to probability and reliability methods for use in geotechnical engineering. Eng. Tech. Lett. 1997. Technical Letter, No. ETL 1110-2-547. [Google Scholar]
Disclaimer/Publisher’s Note: The statements, opinions and data contained in all publications are solely those of the individual author(s) and contributor(s) and not of MDPI and/or the editor(s). MDPI and/or the editor(s) disclaim responsibility for any injury to people or property resulting from any ideas, methods, instructions or products referred to in the content. |
© 2024 by the authors. Licensee MDPI, Basel, Switzerland. This article is an open access article distributed under the terms and conditions of the Creative Commons Attribution (CC BY) license (https://creativecommons.org/licenses/by/4.0/).